
Optimization of Centrifugal Pump Impeller for Pumping Viscous Fluids Using Direct Design Optimization Technique


Abstract
:1. Introduction
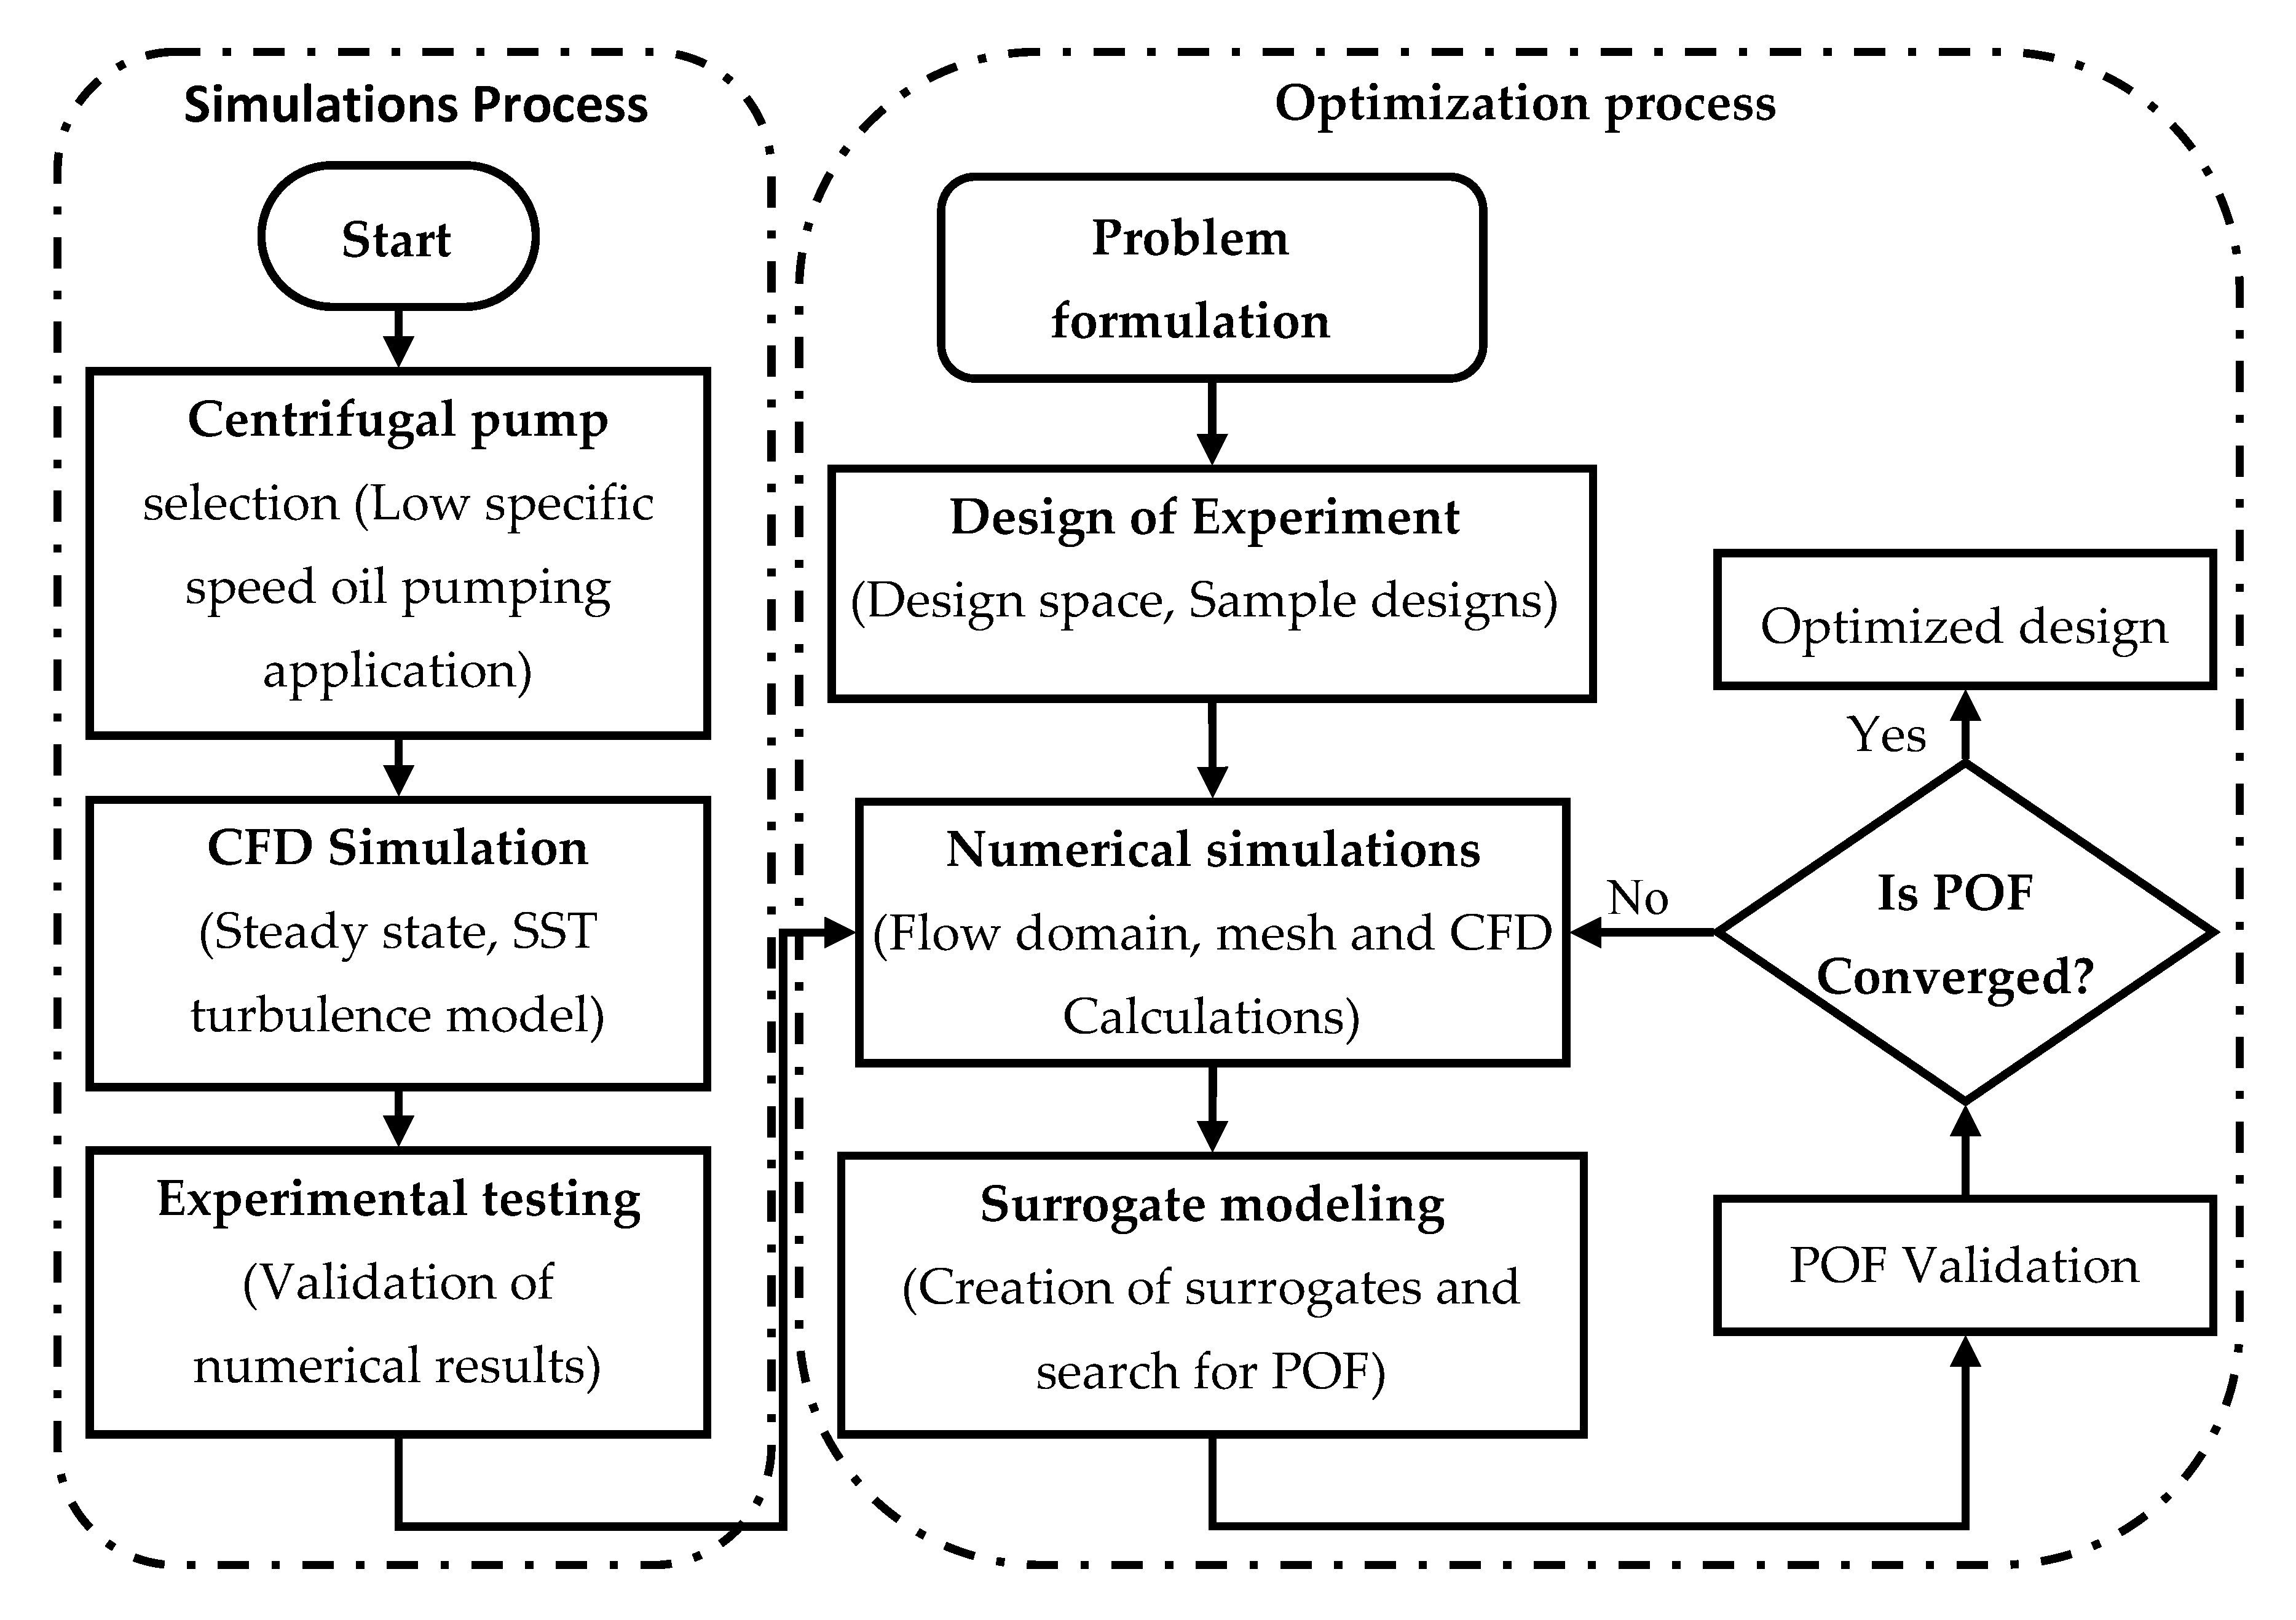
2. Geometric Model and Numerical Simulations
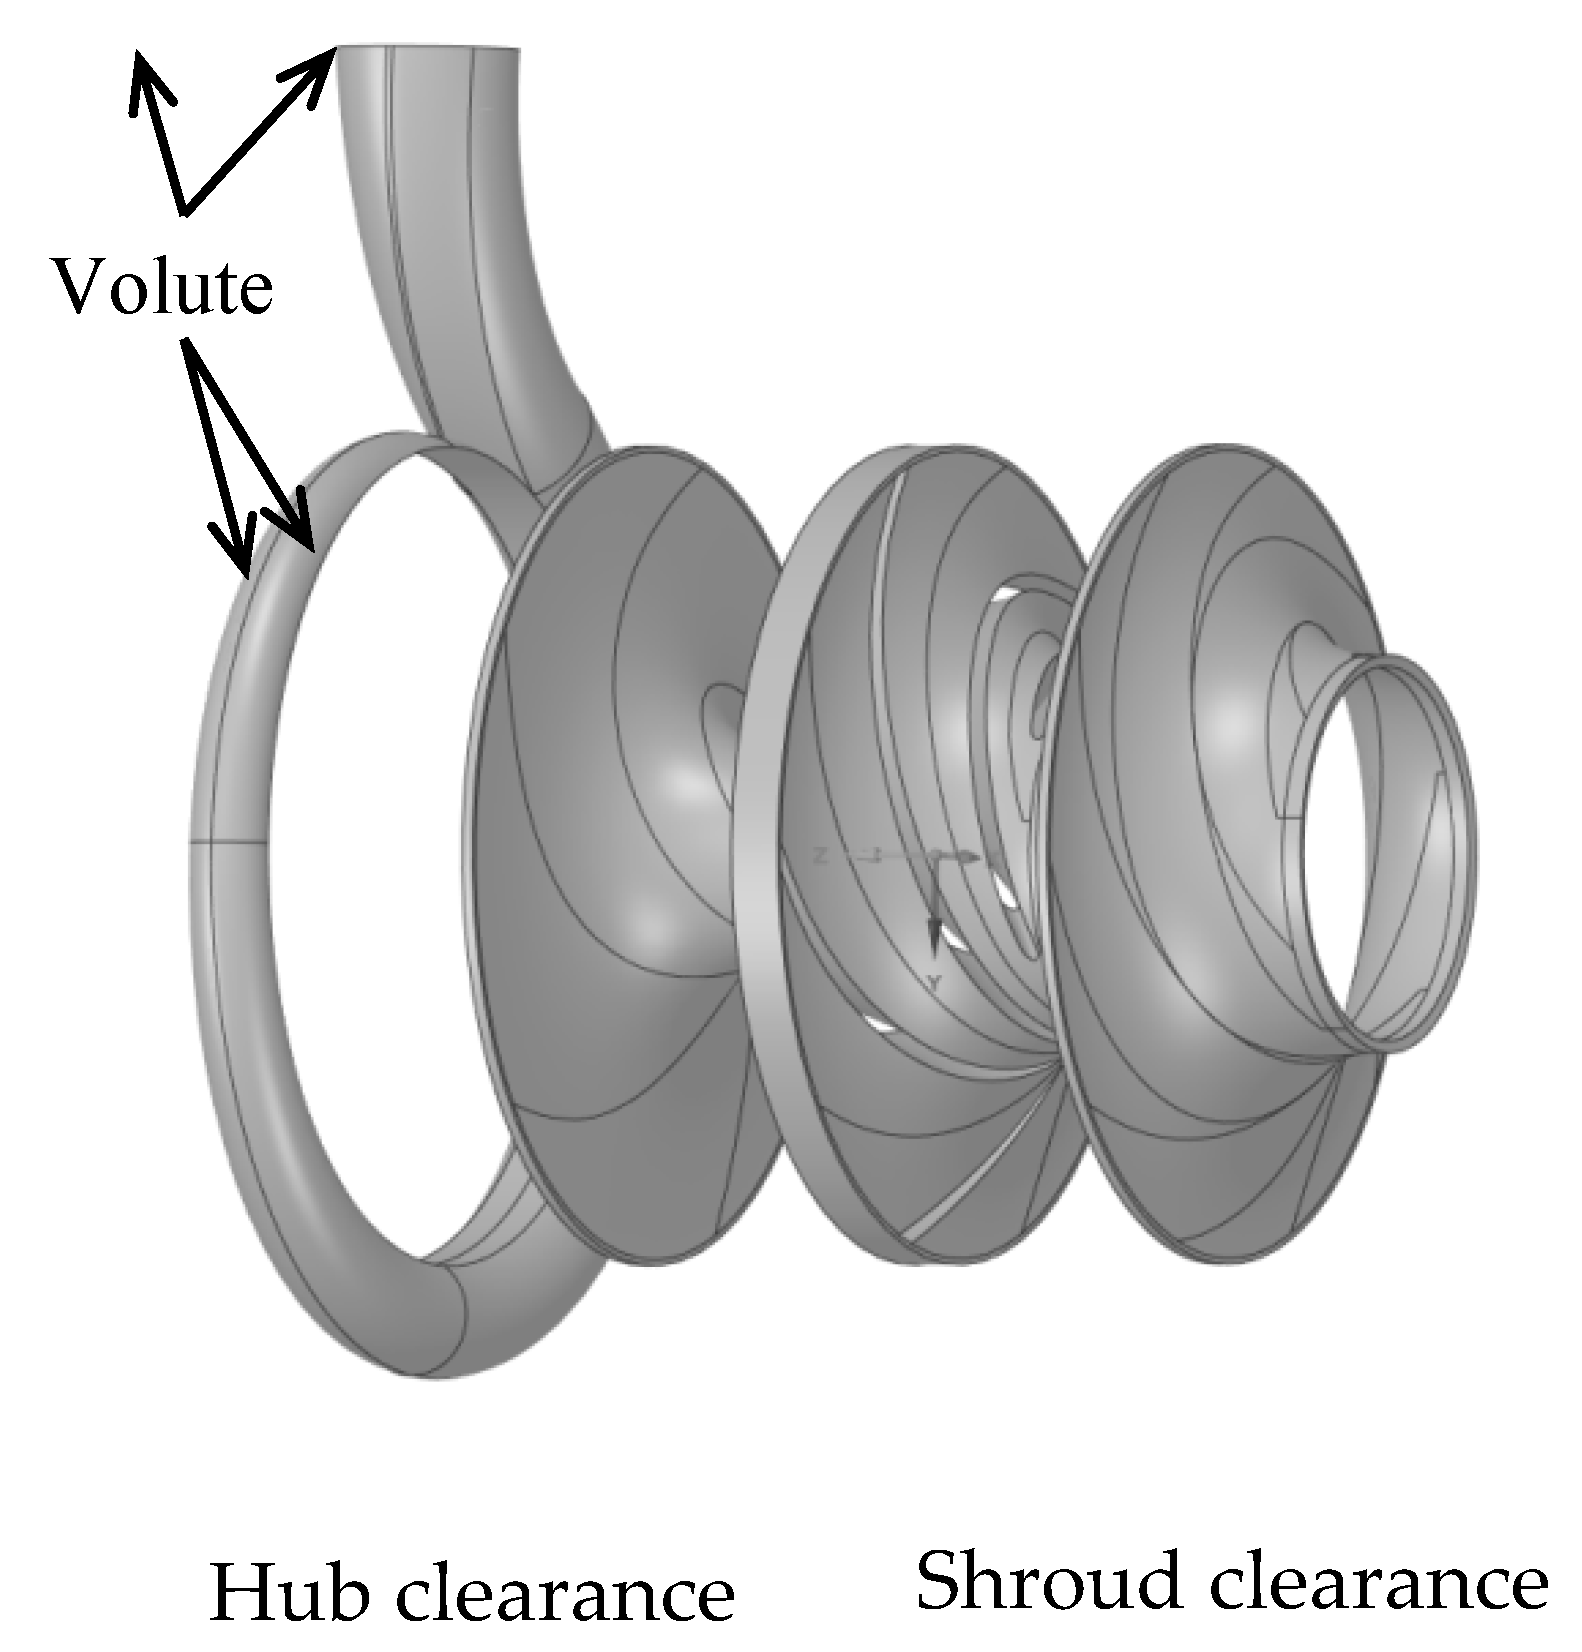
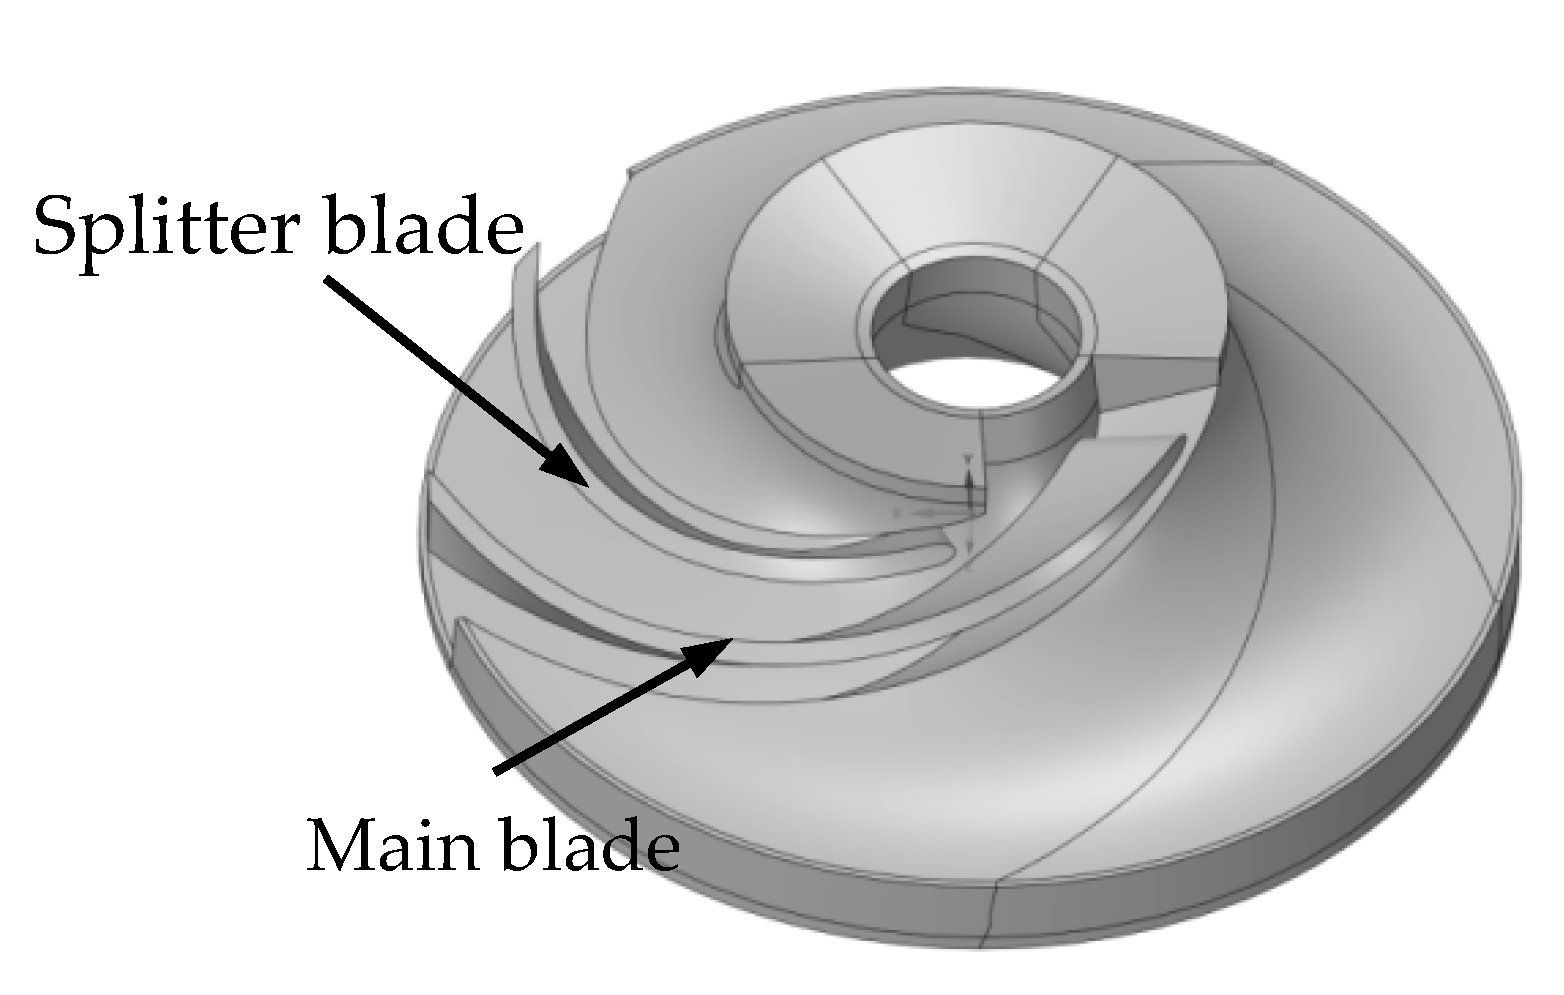
2.1. Geometric Model
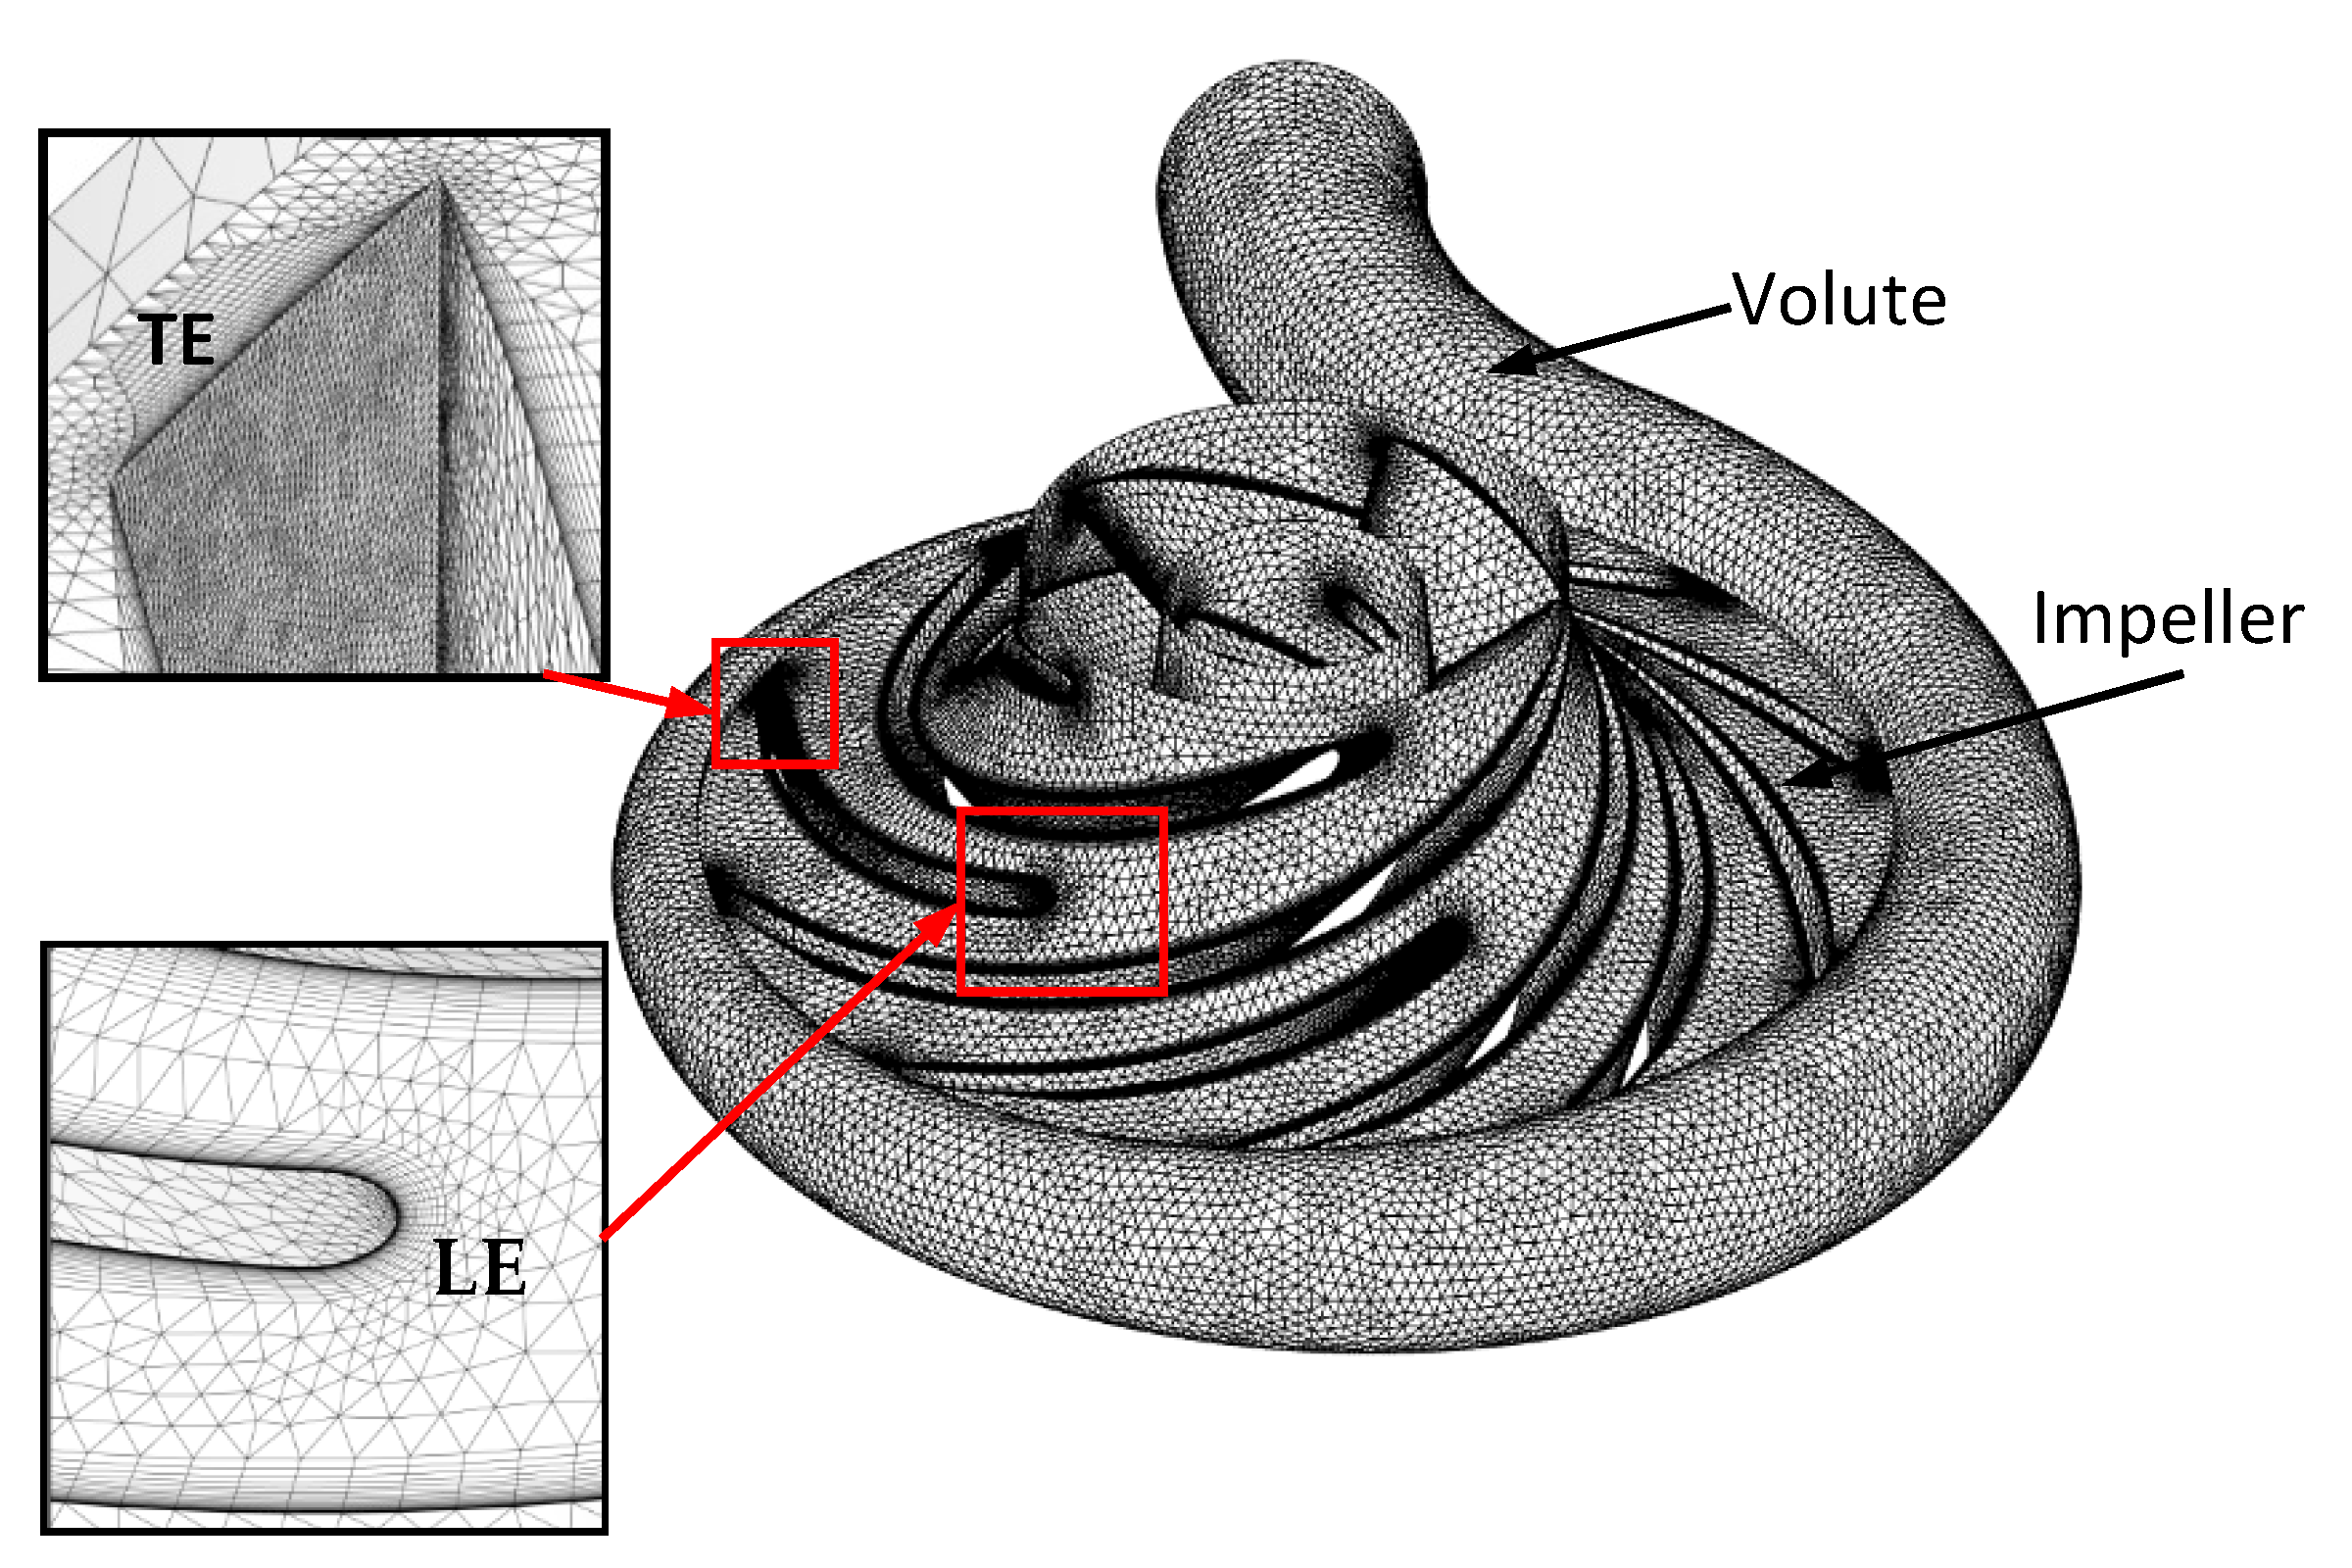
2.2. Grid Generation
2.3. Numerical Formulation
3. Experimental Testing
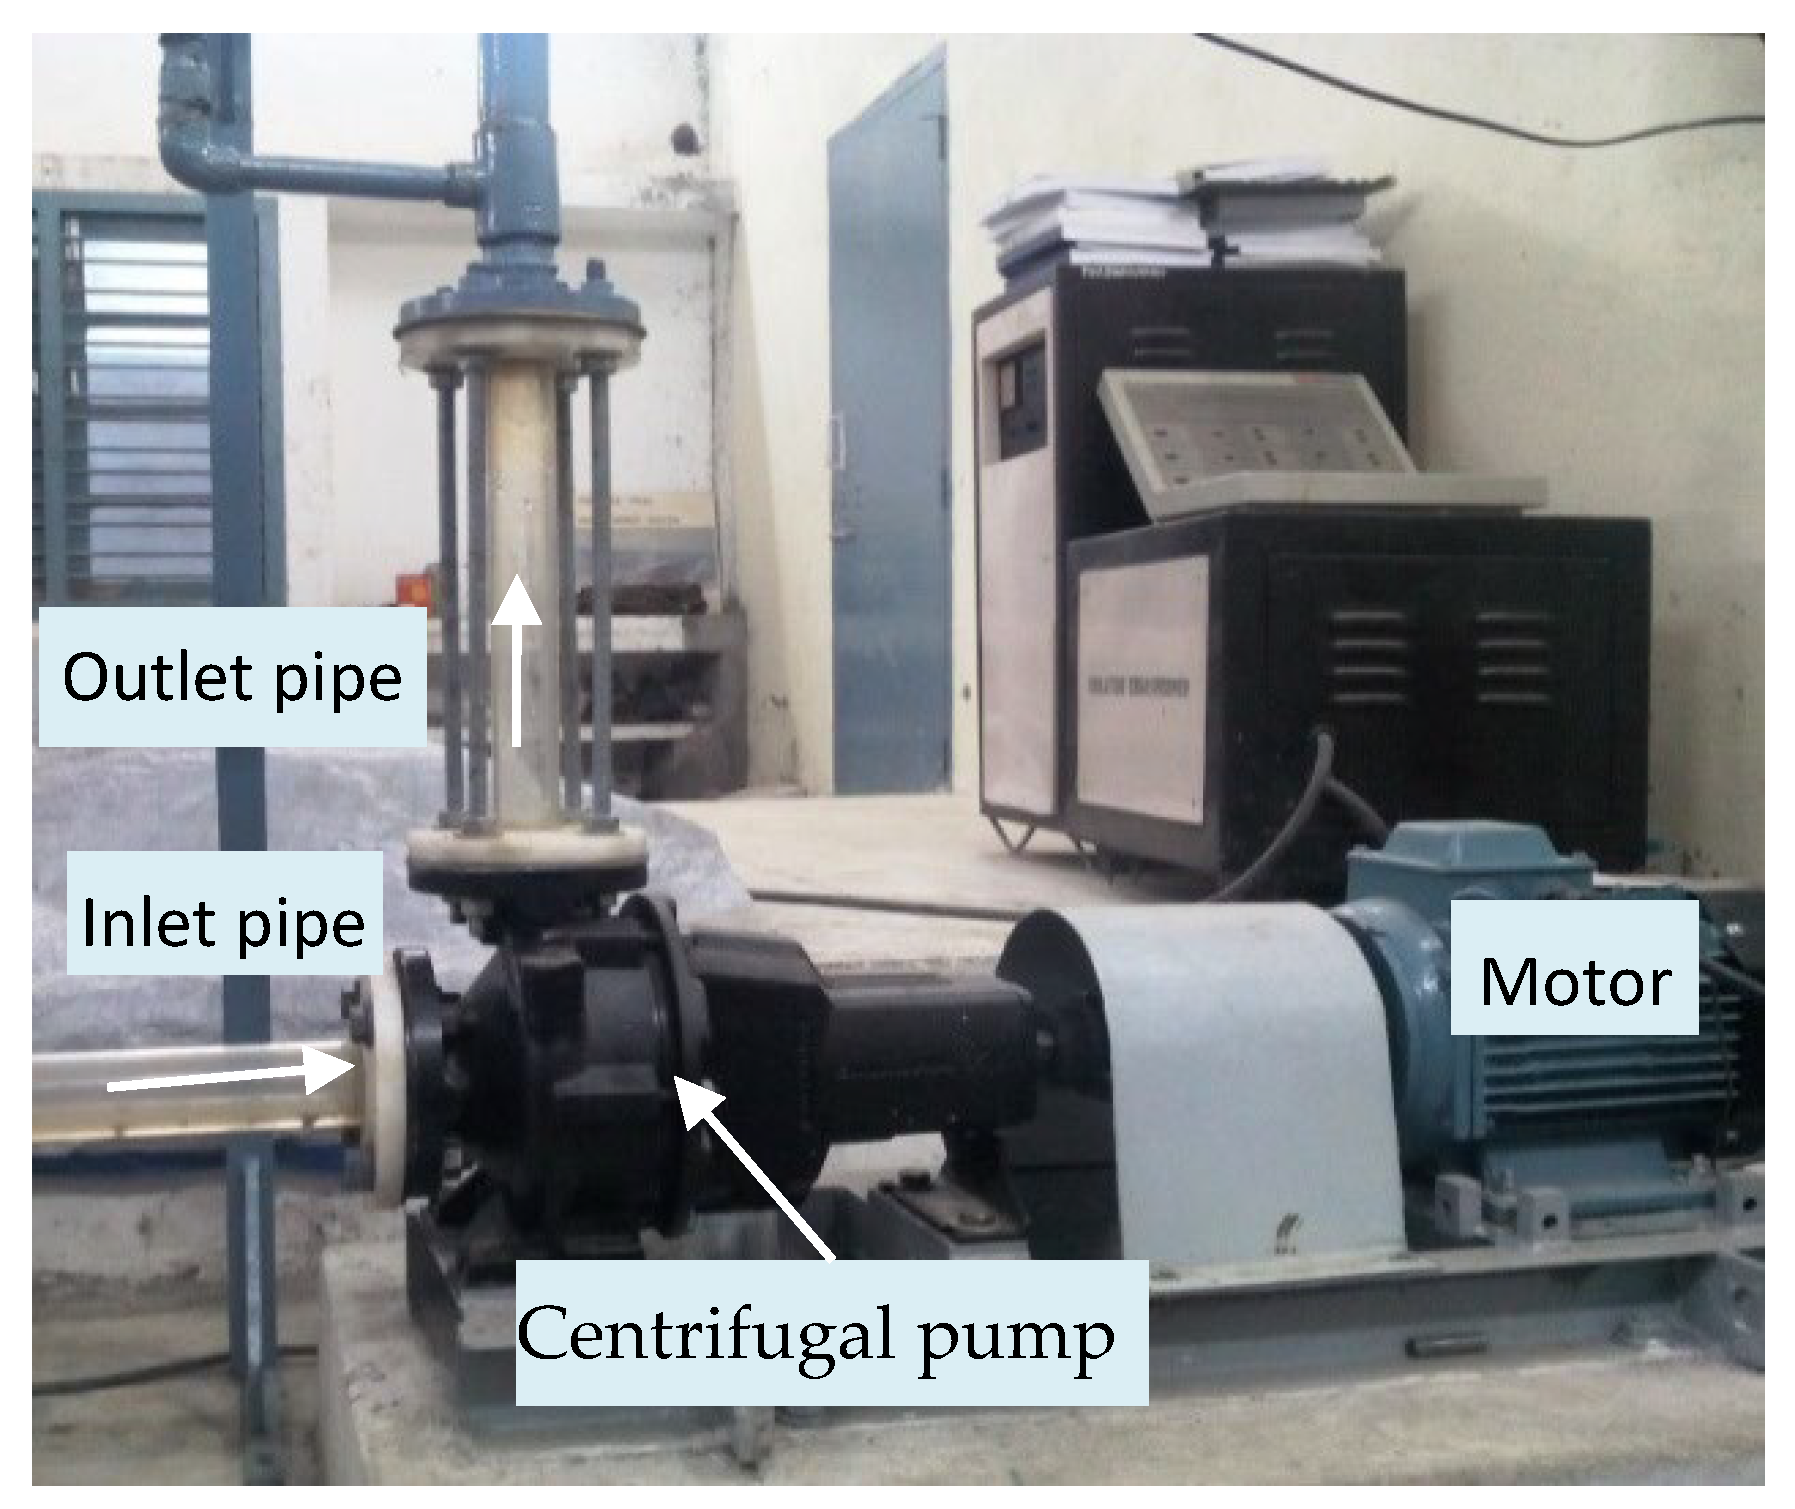
3.1. Setup Design
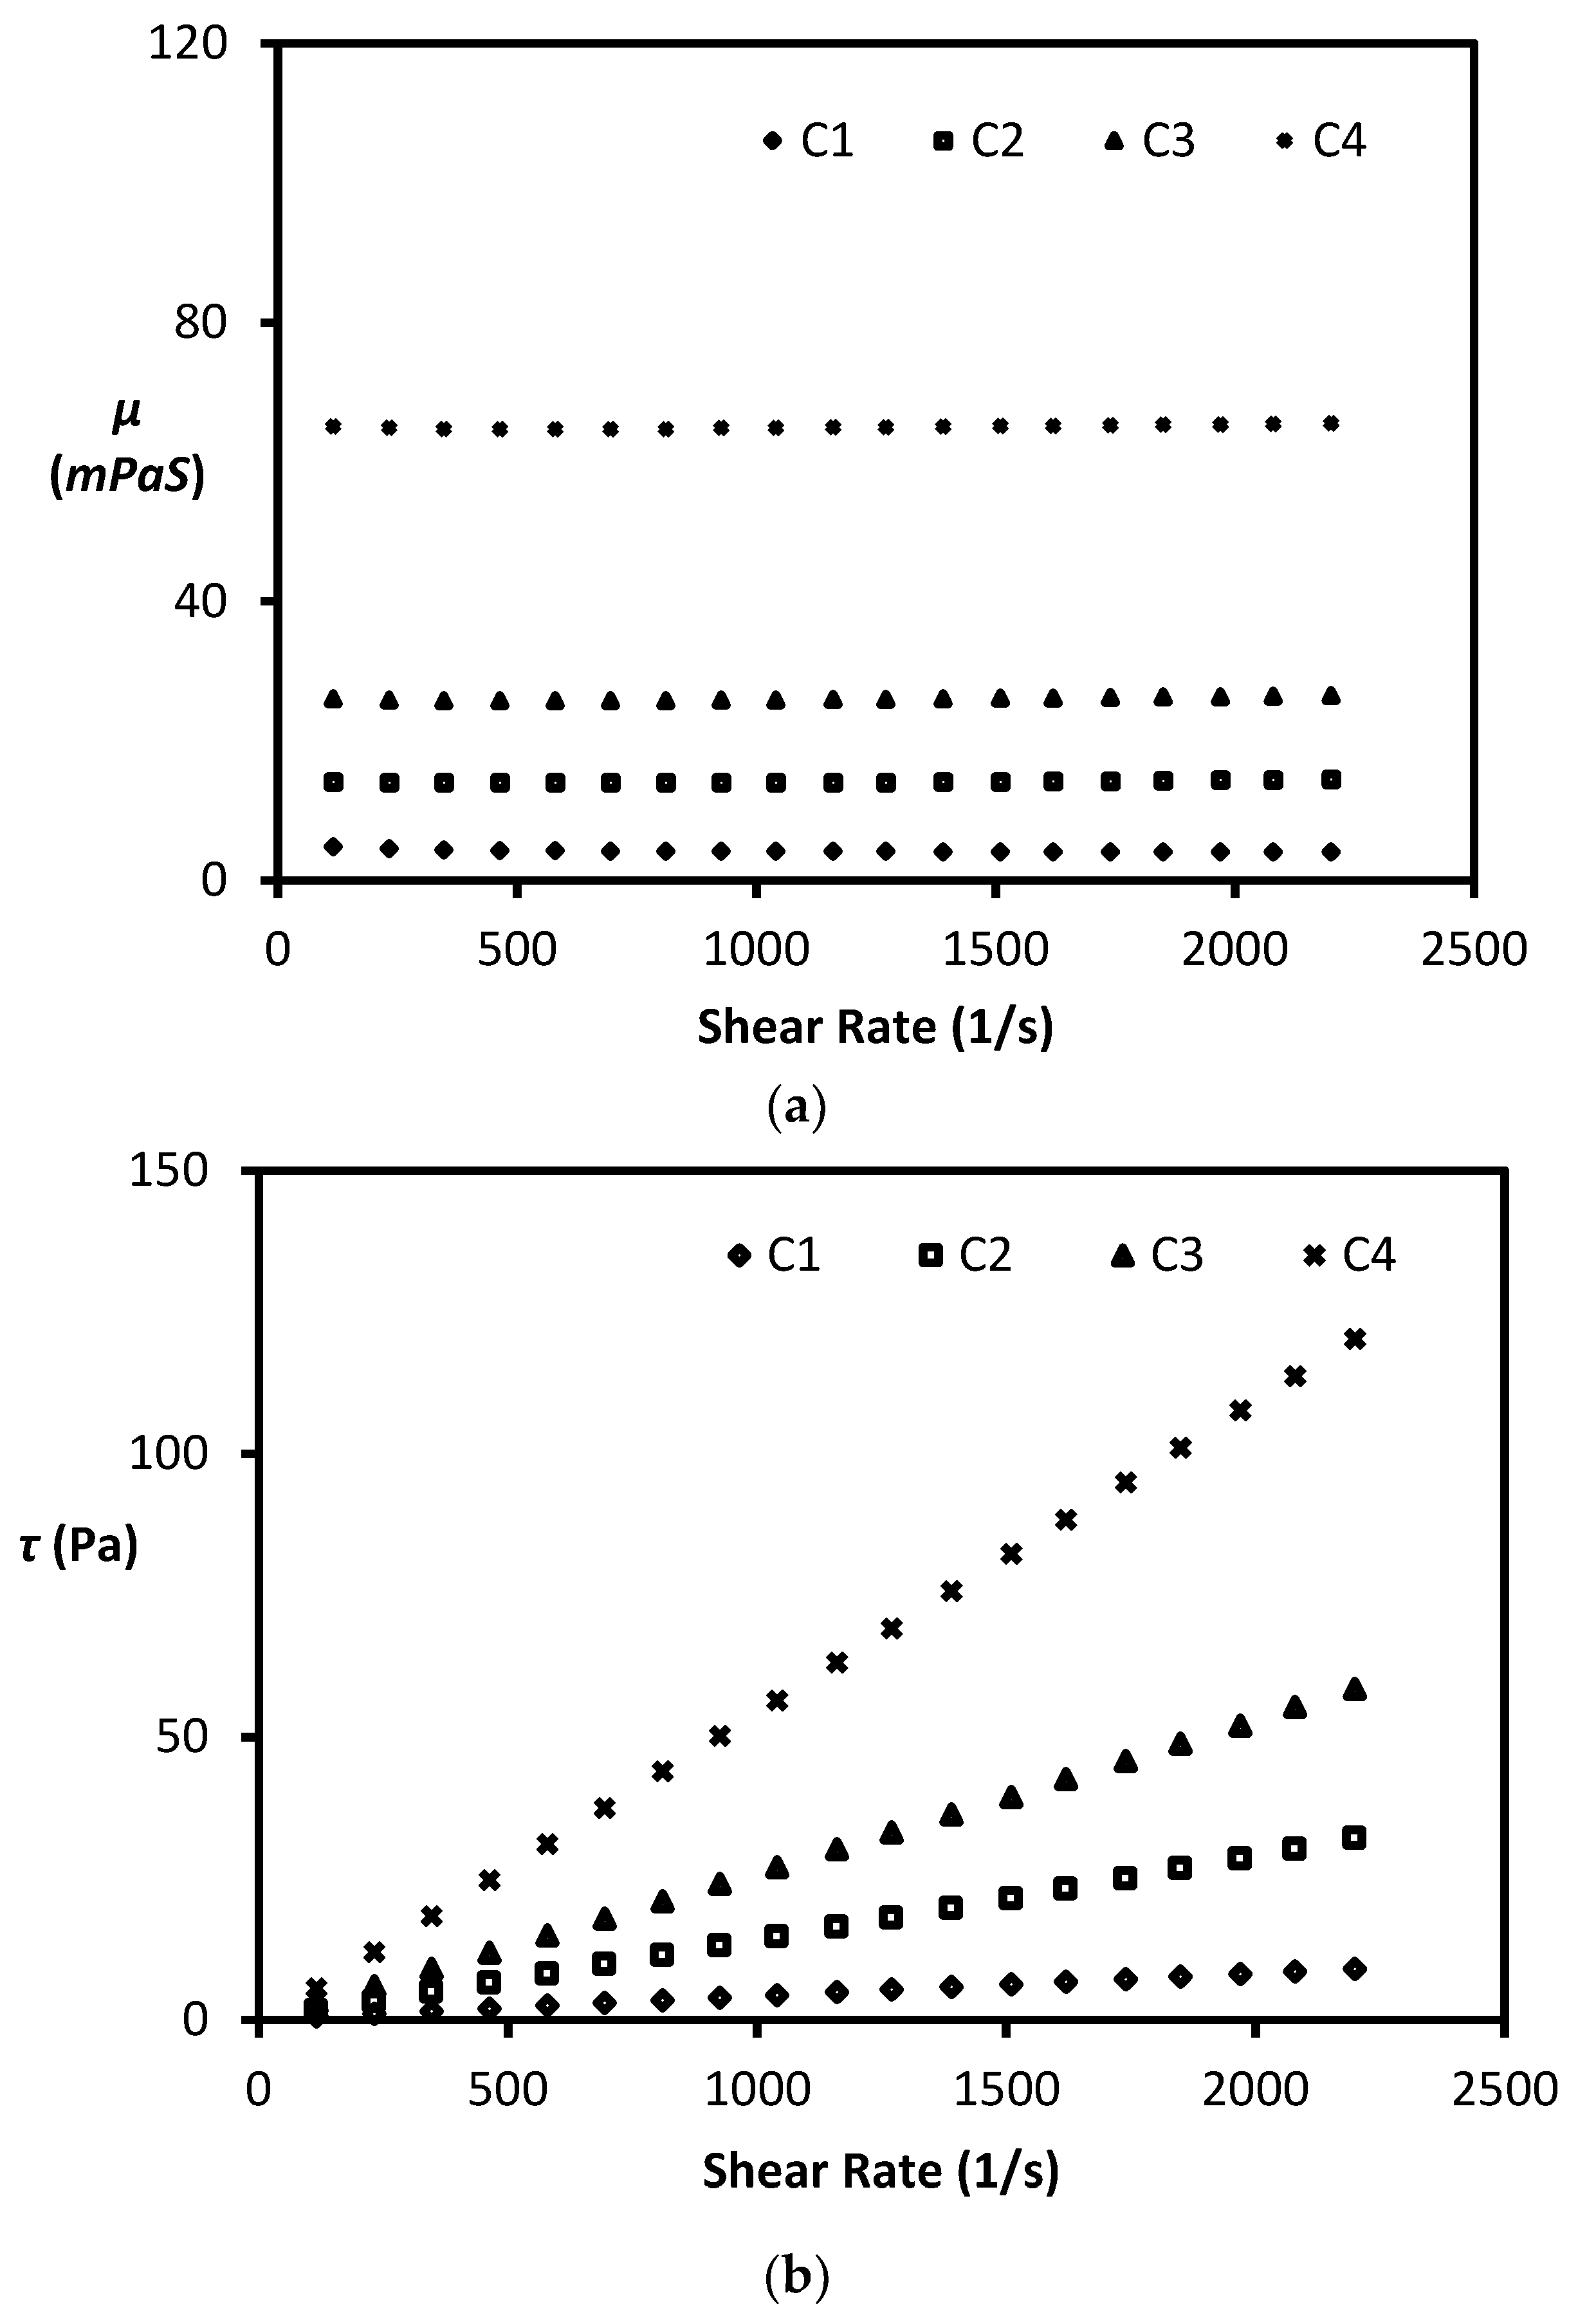
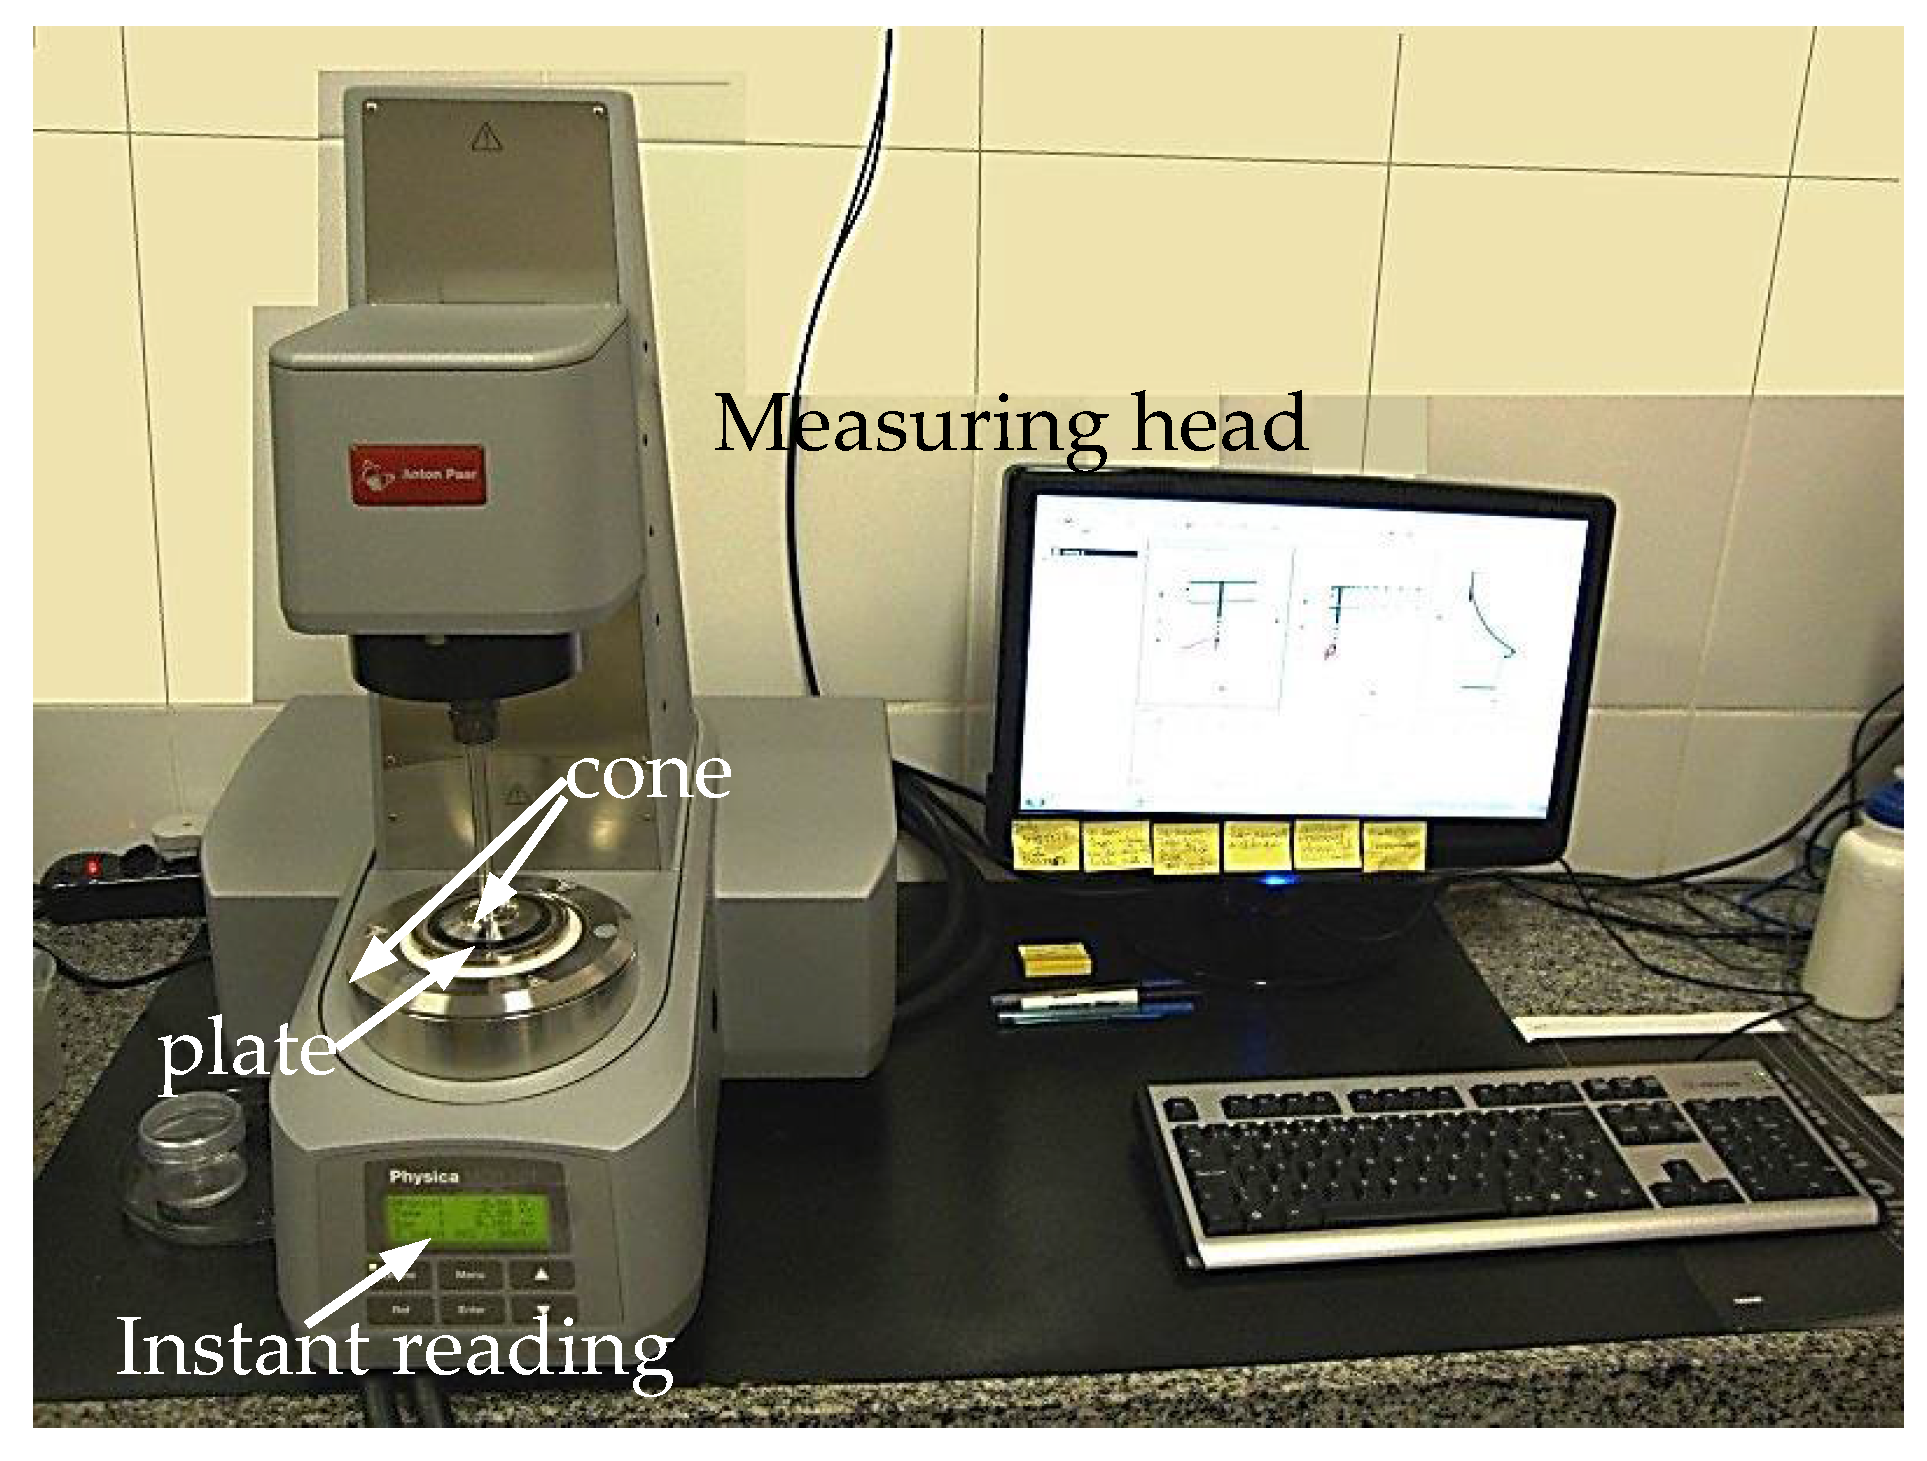
3.2. Rheological Properties of Fluids
4. Design Optimization
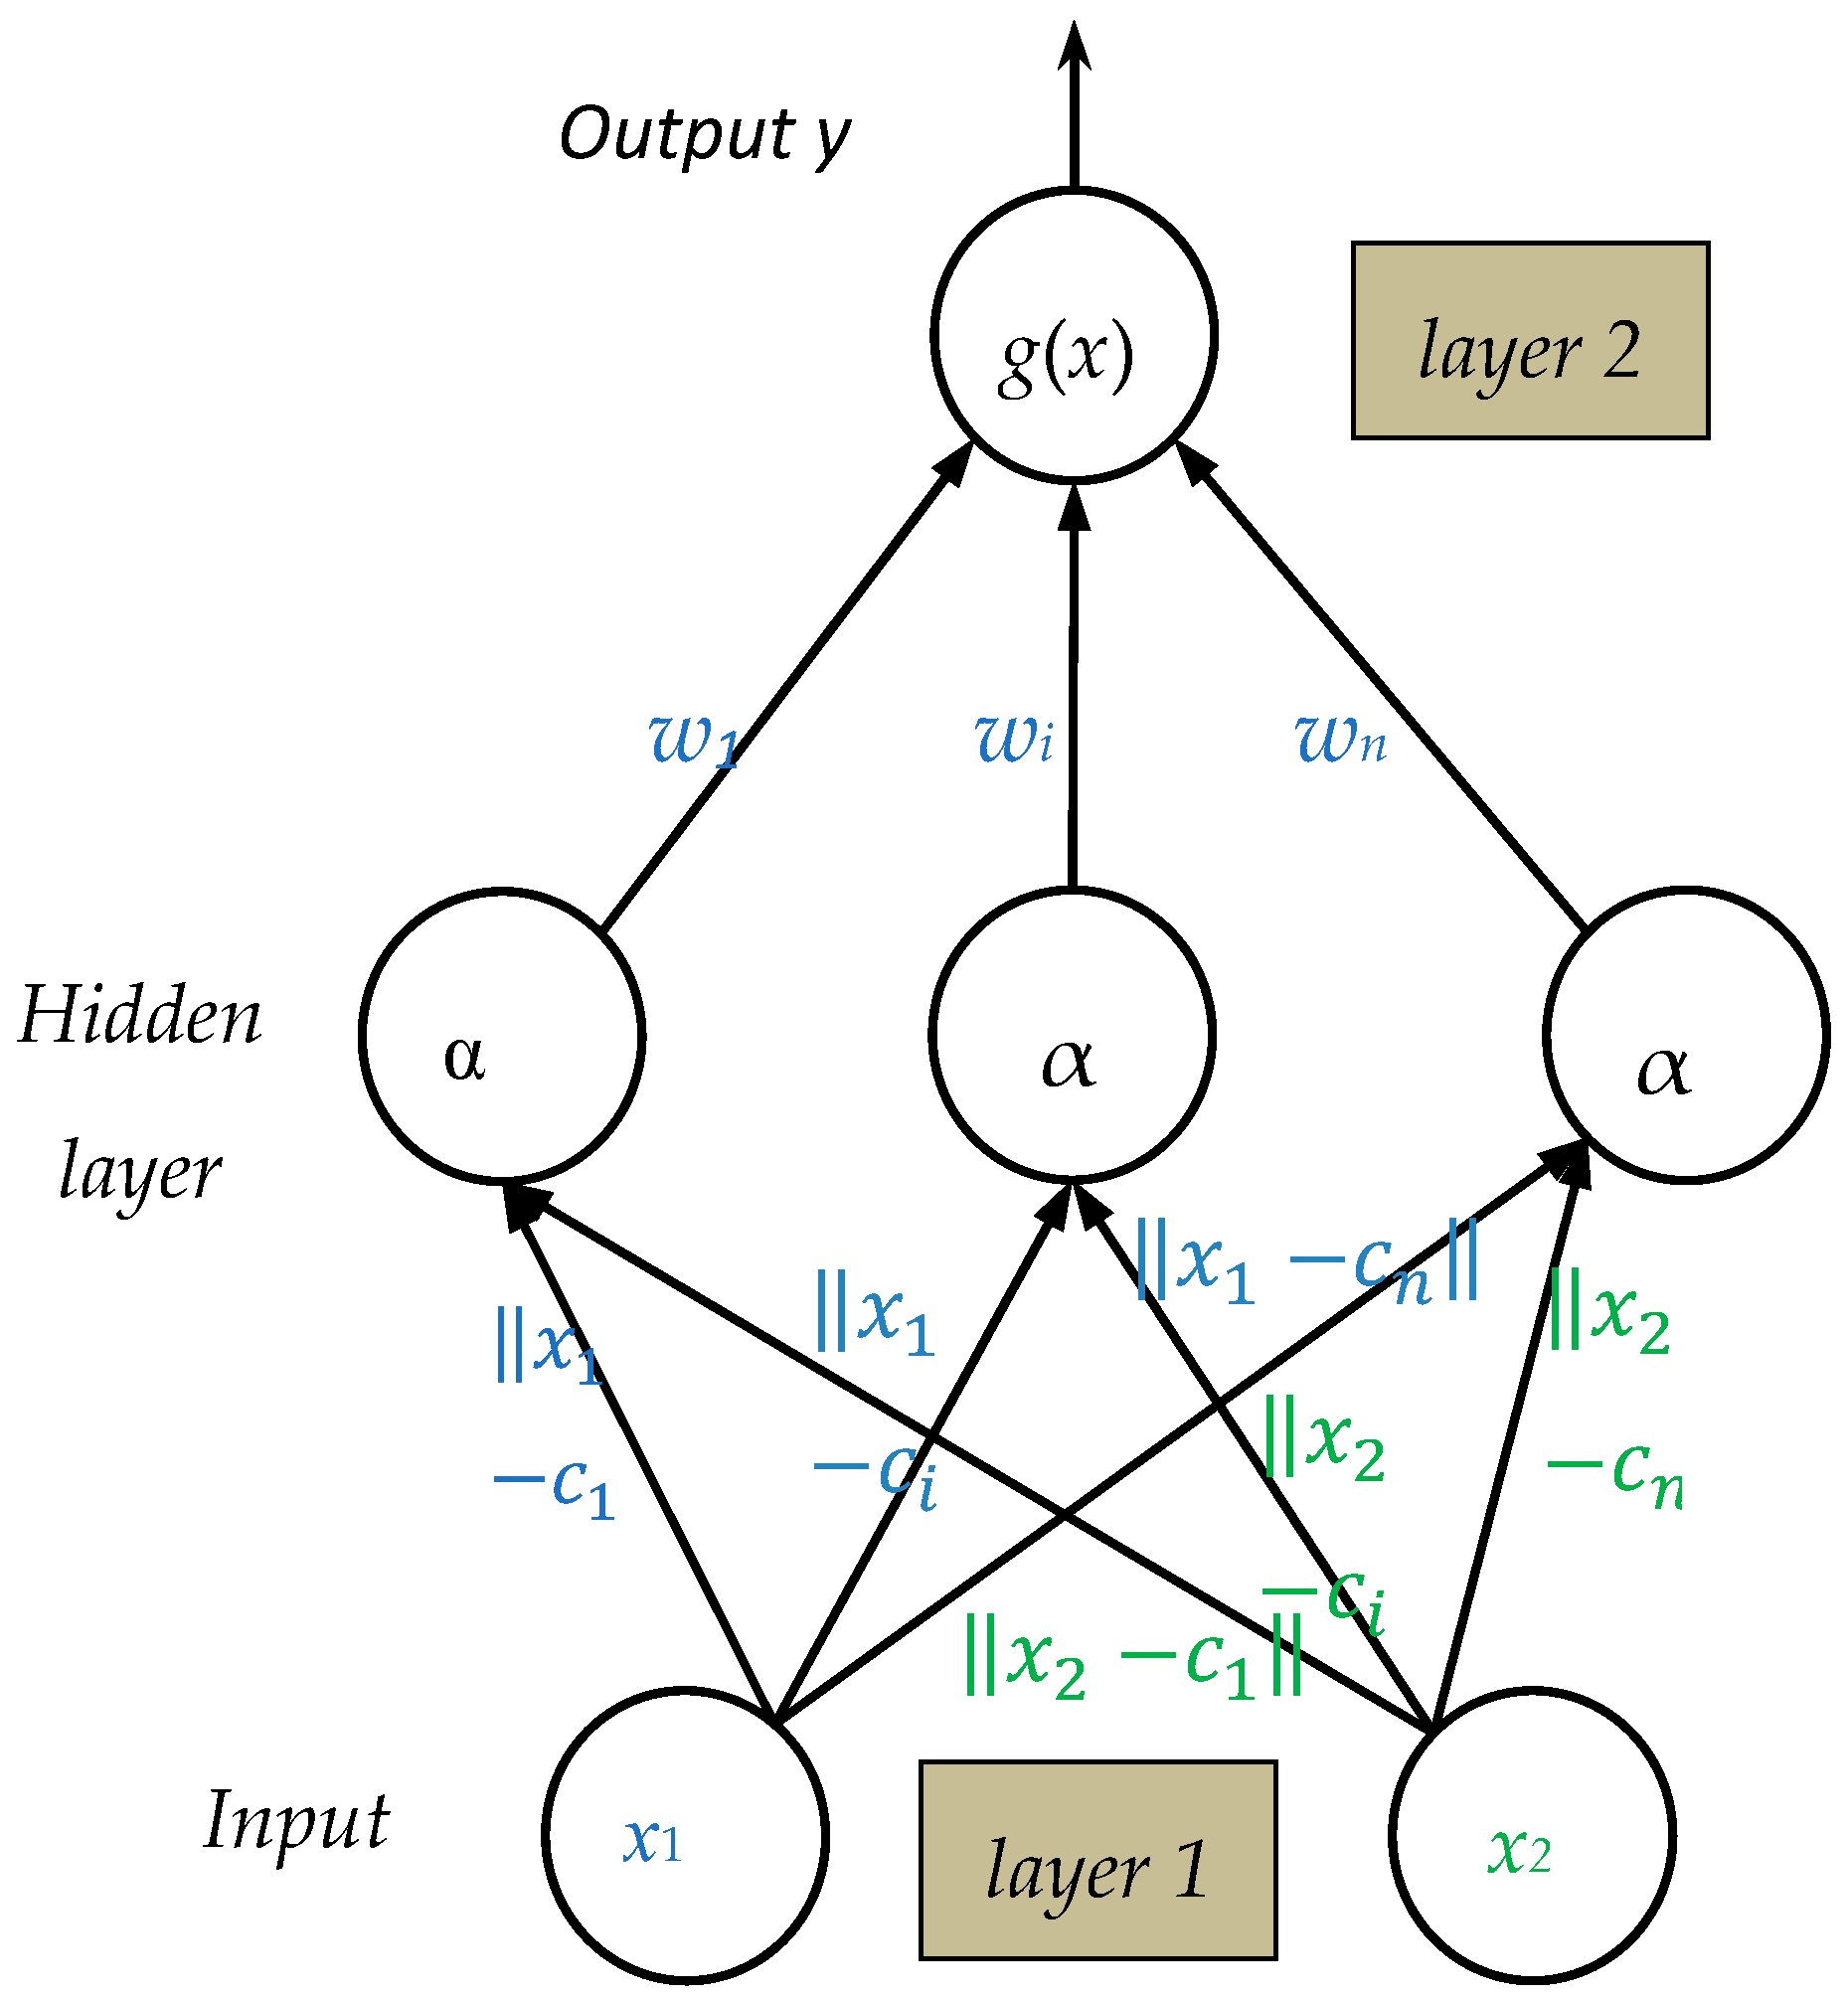
4.1. Artificial Neural Network
4.2. Multiobjective Optimization
5. Results and Discussion
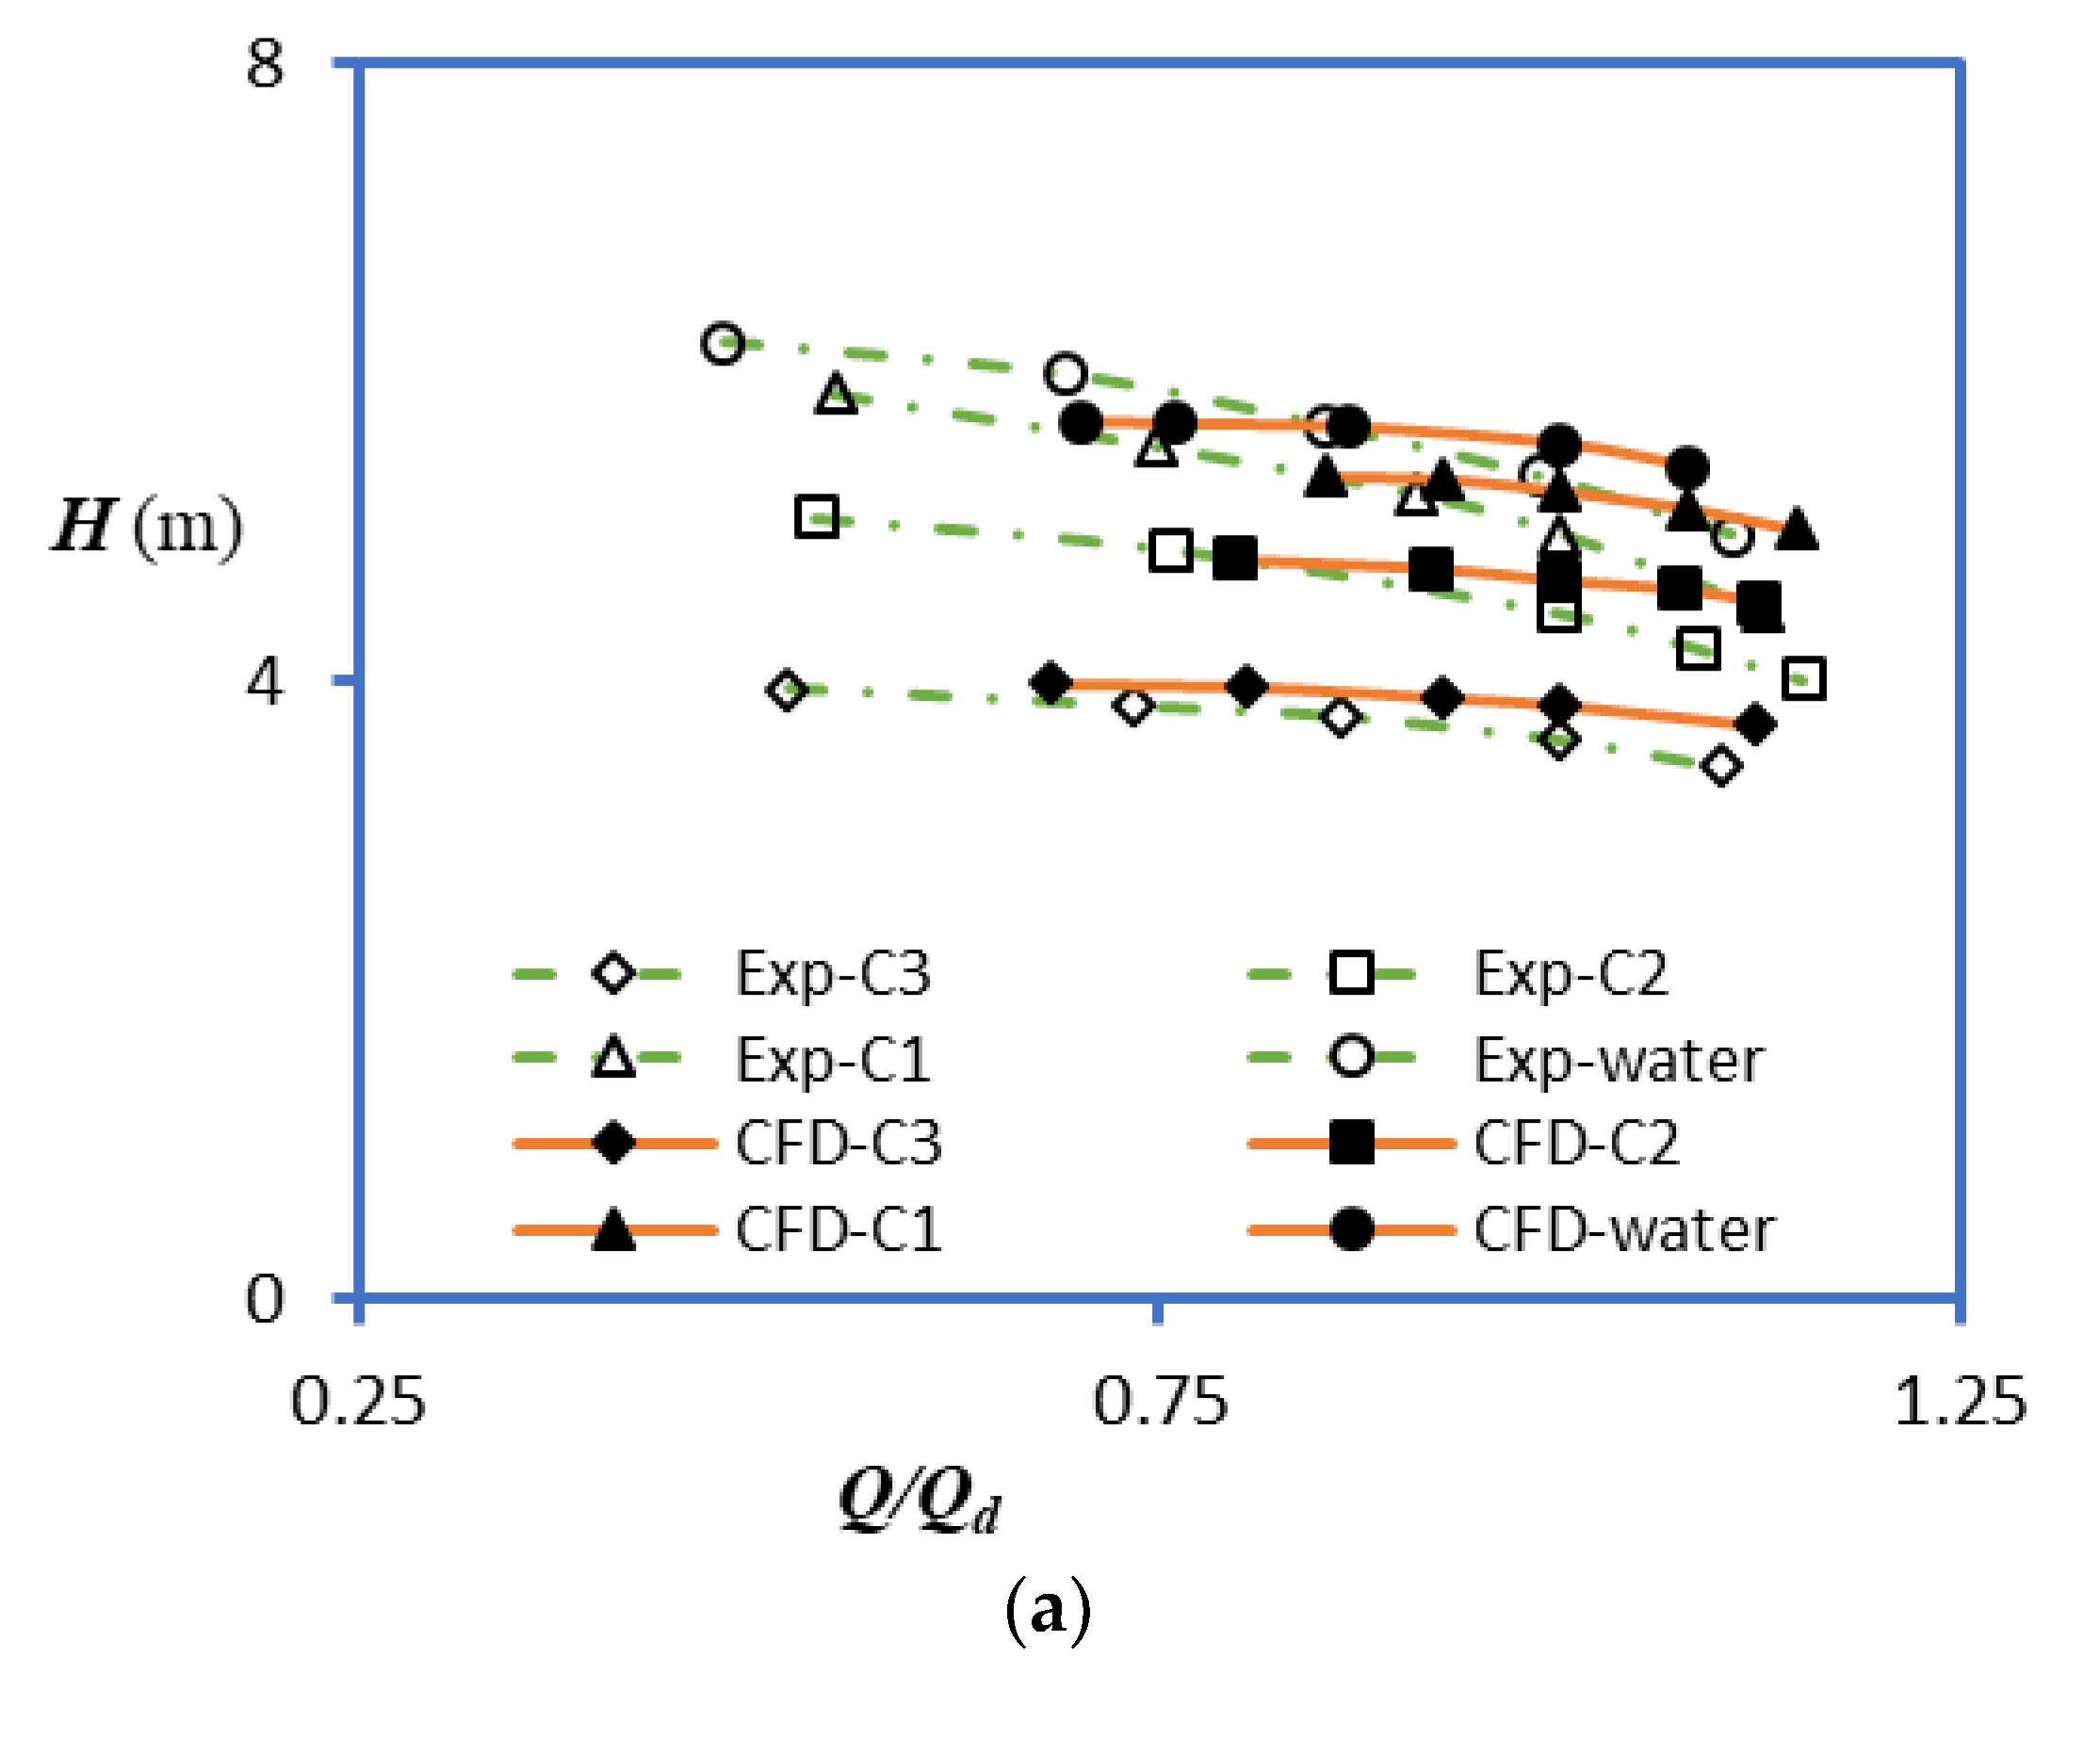
5.1. Validation
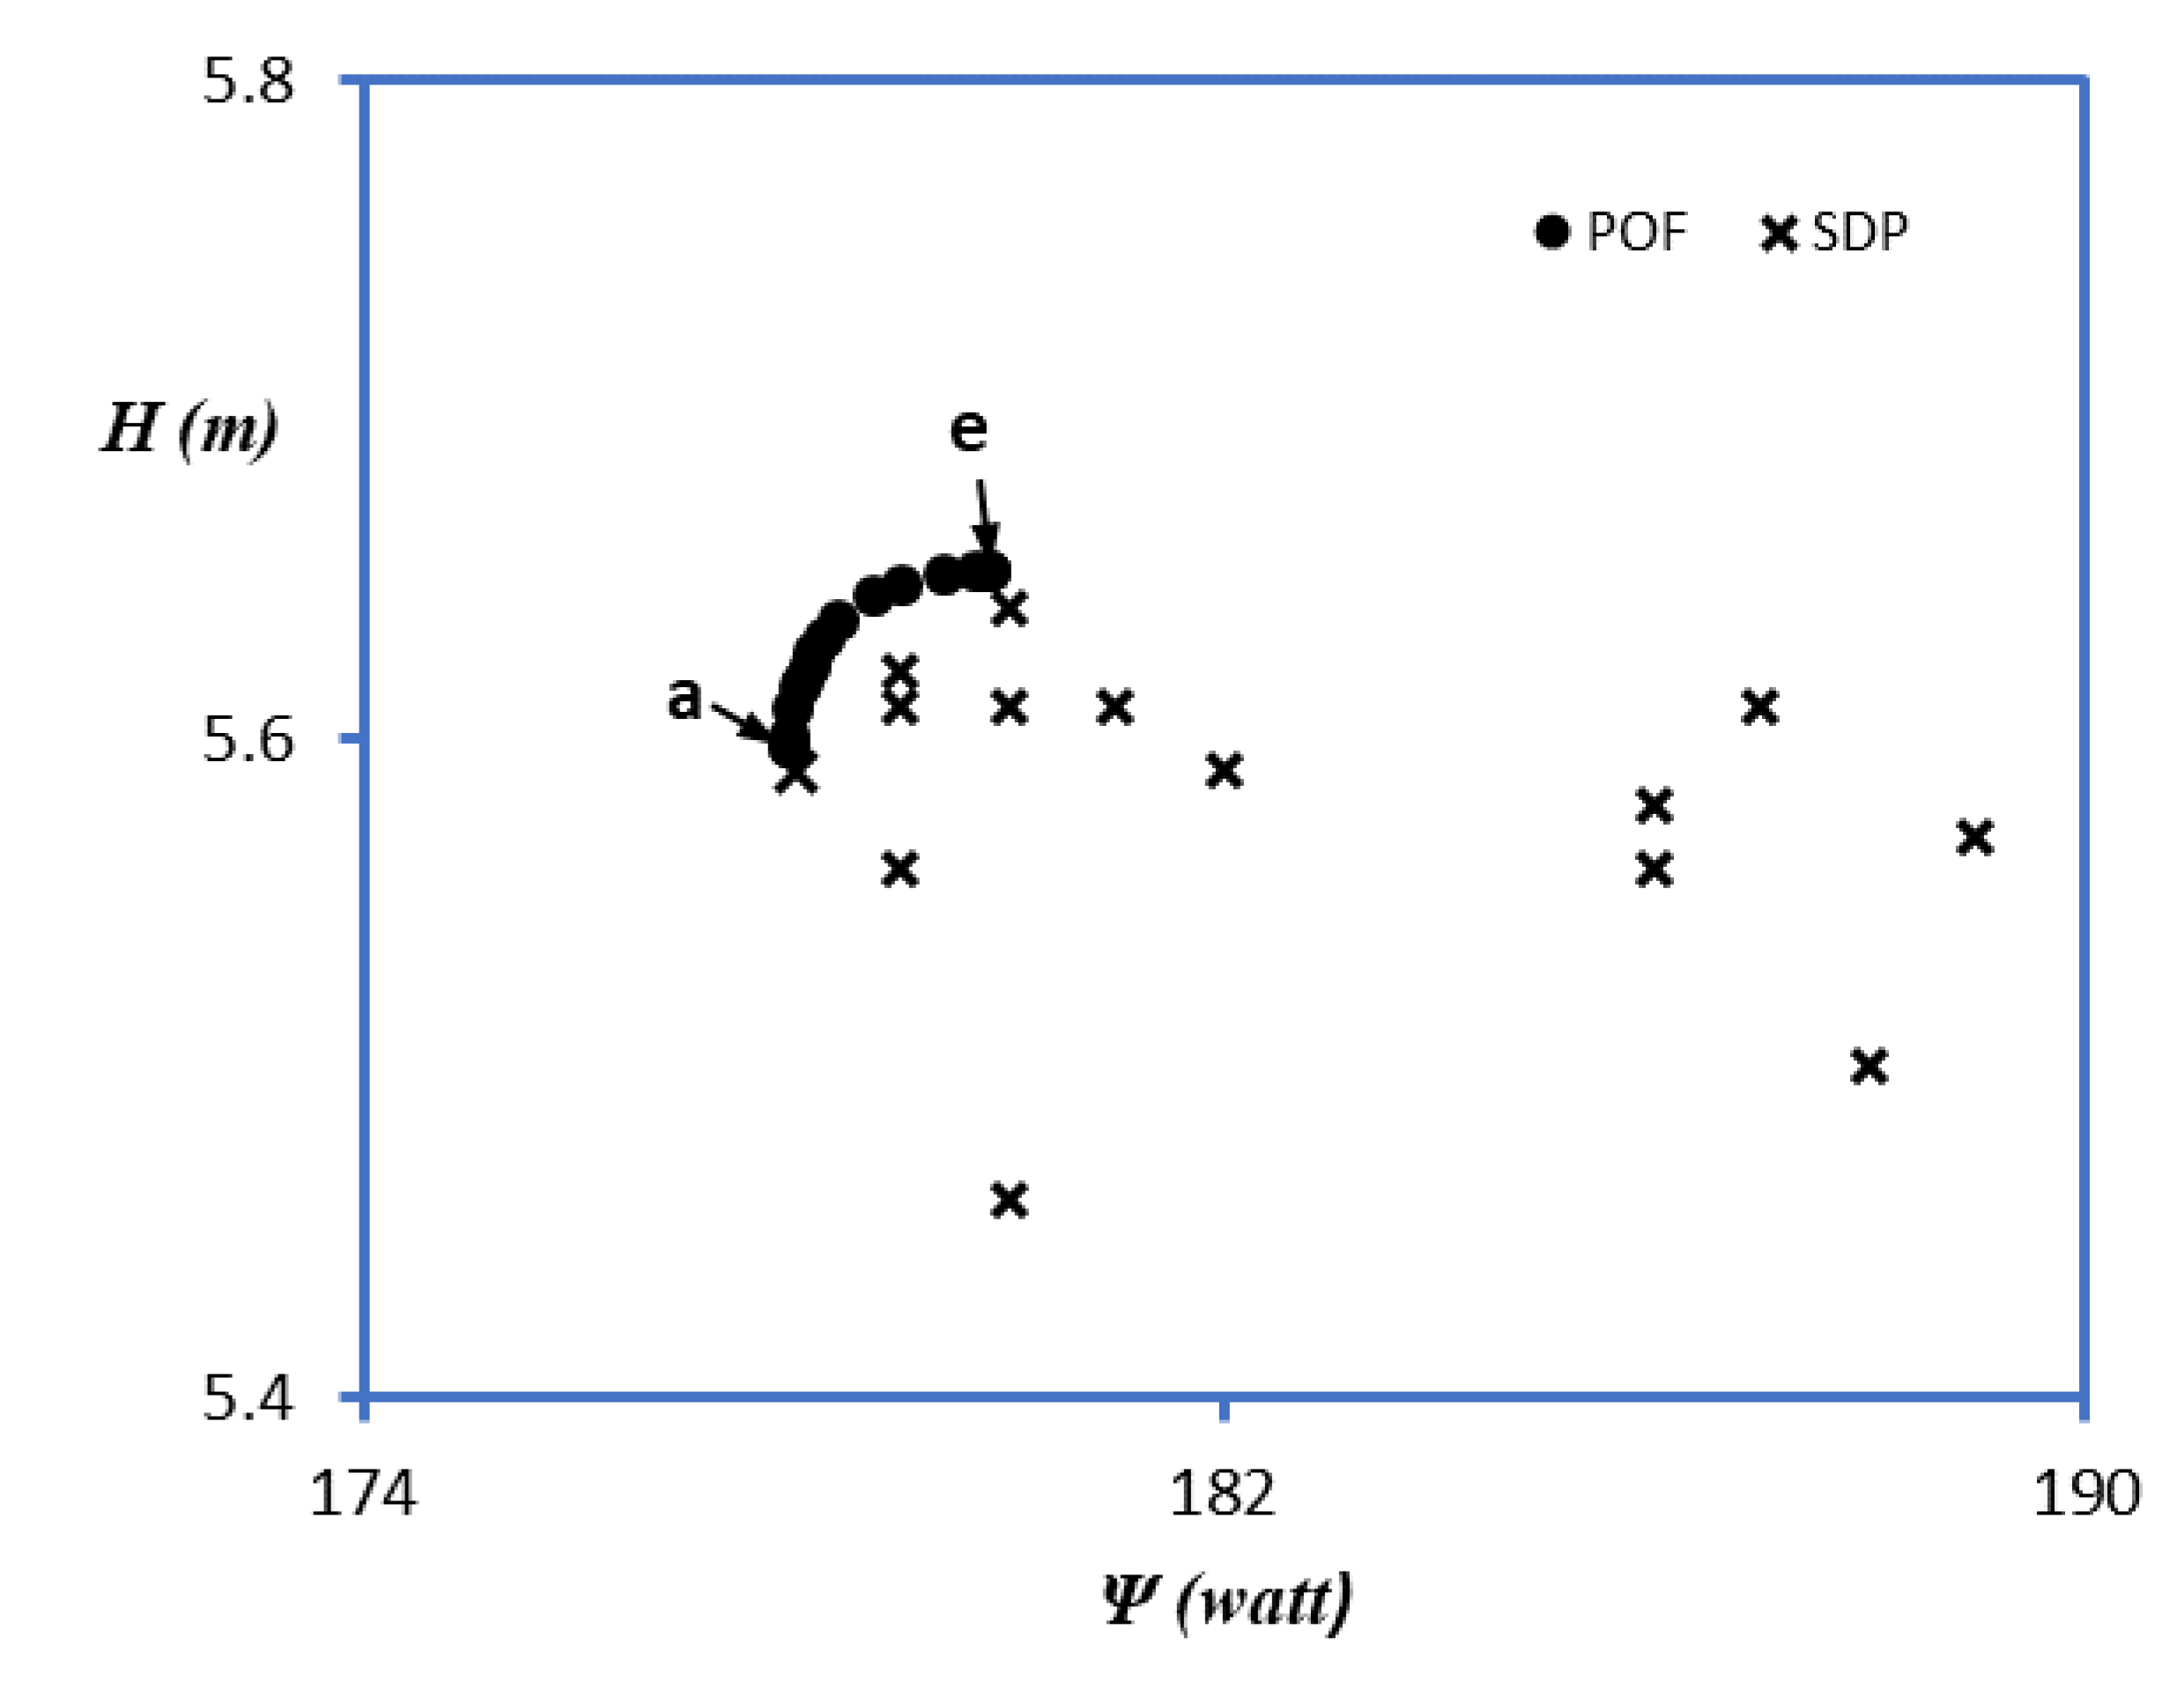
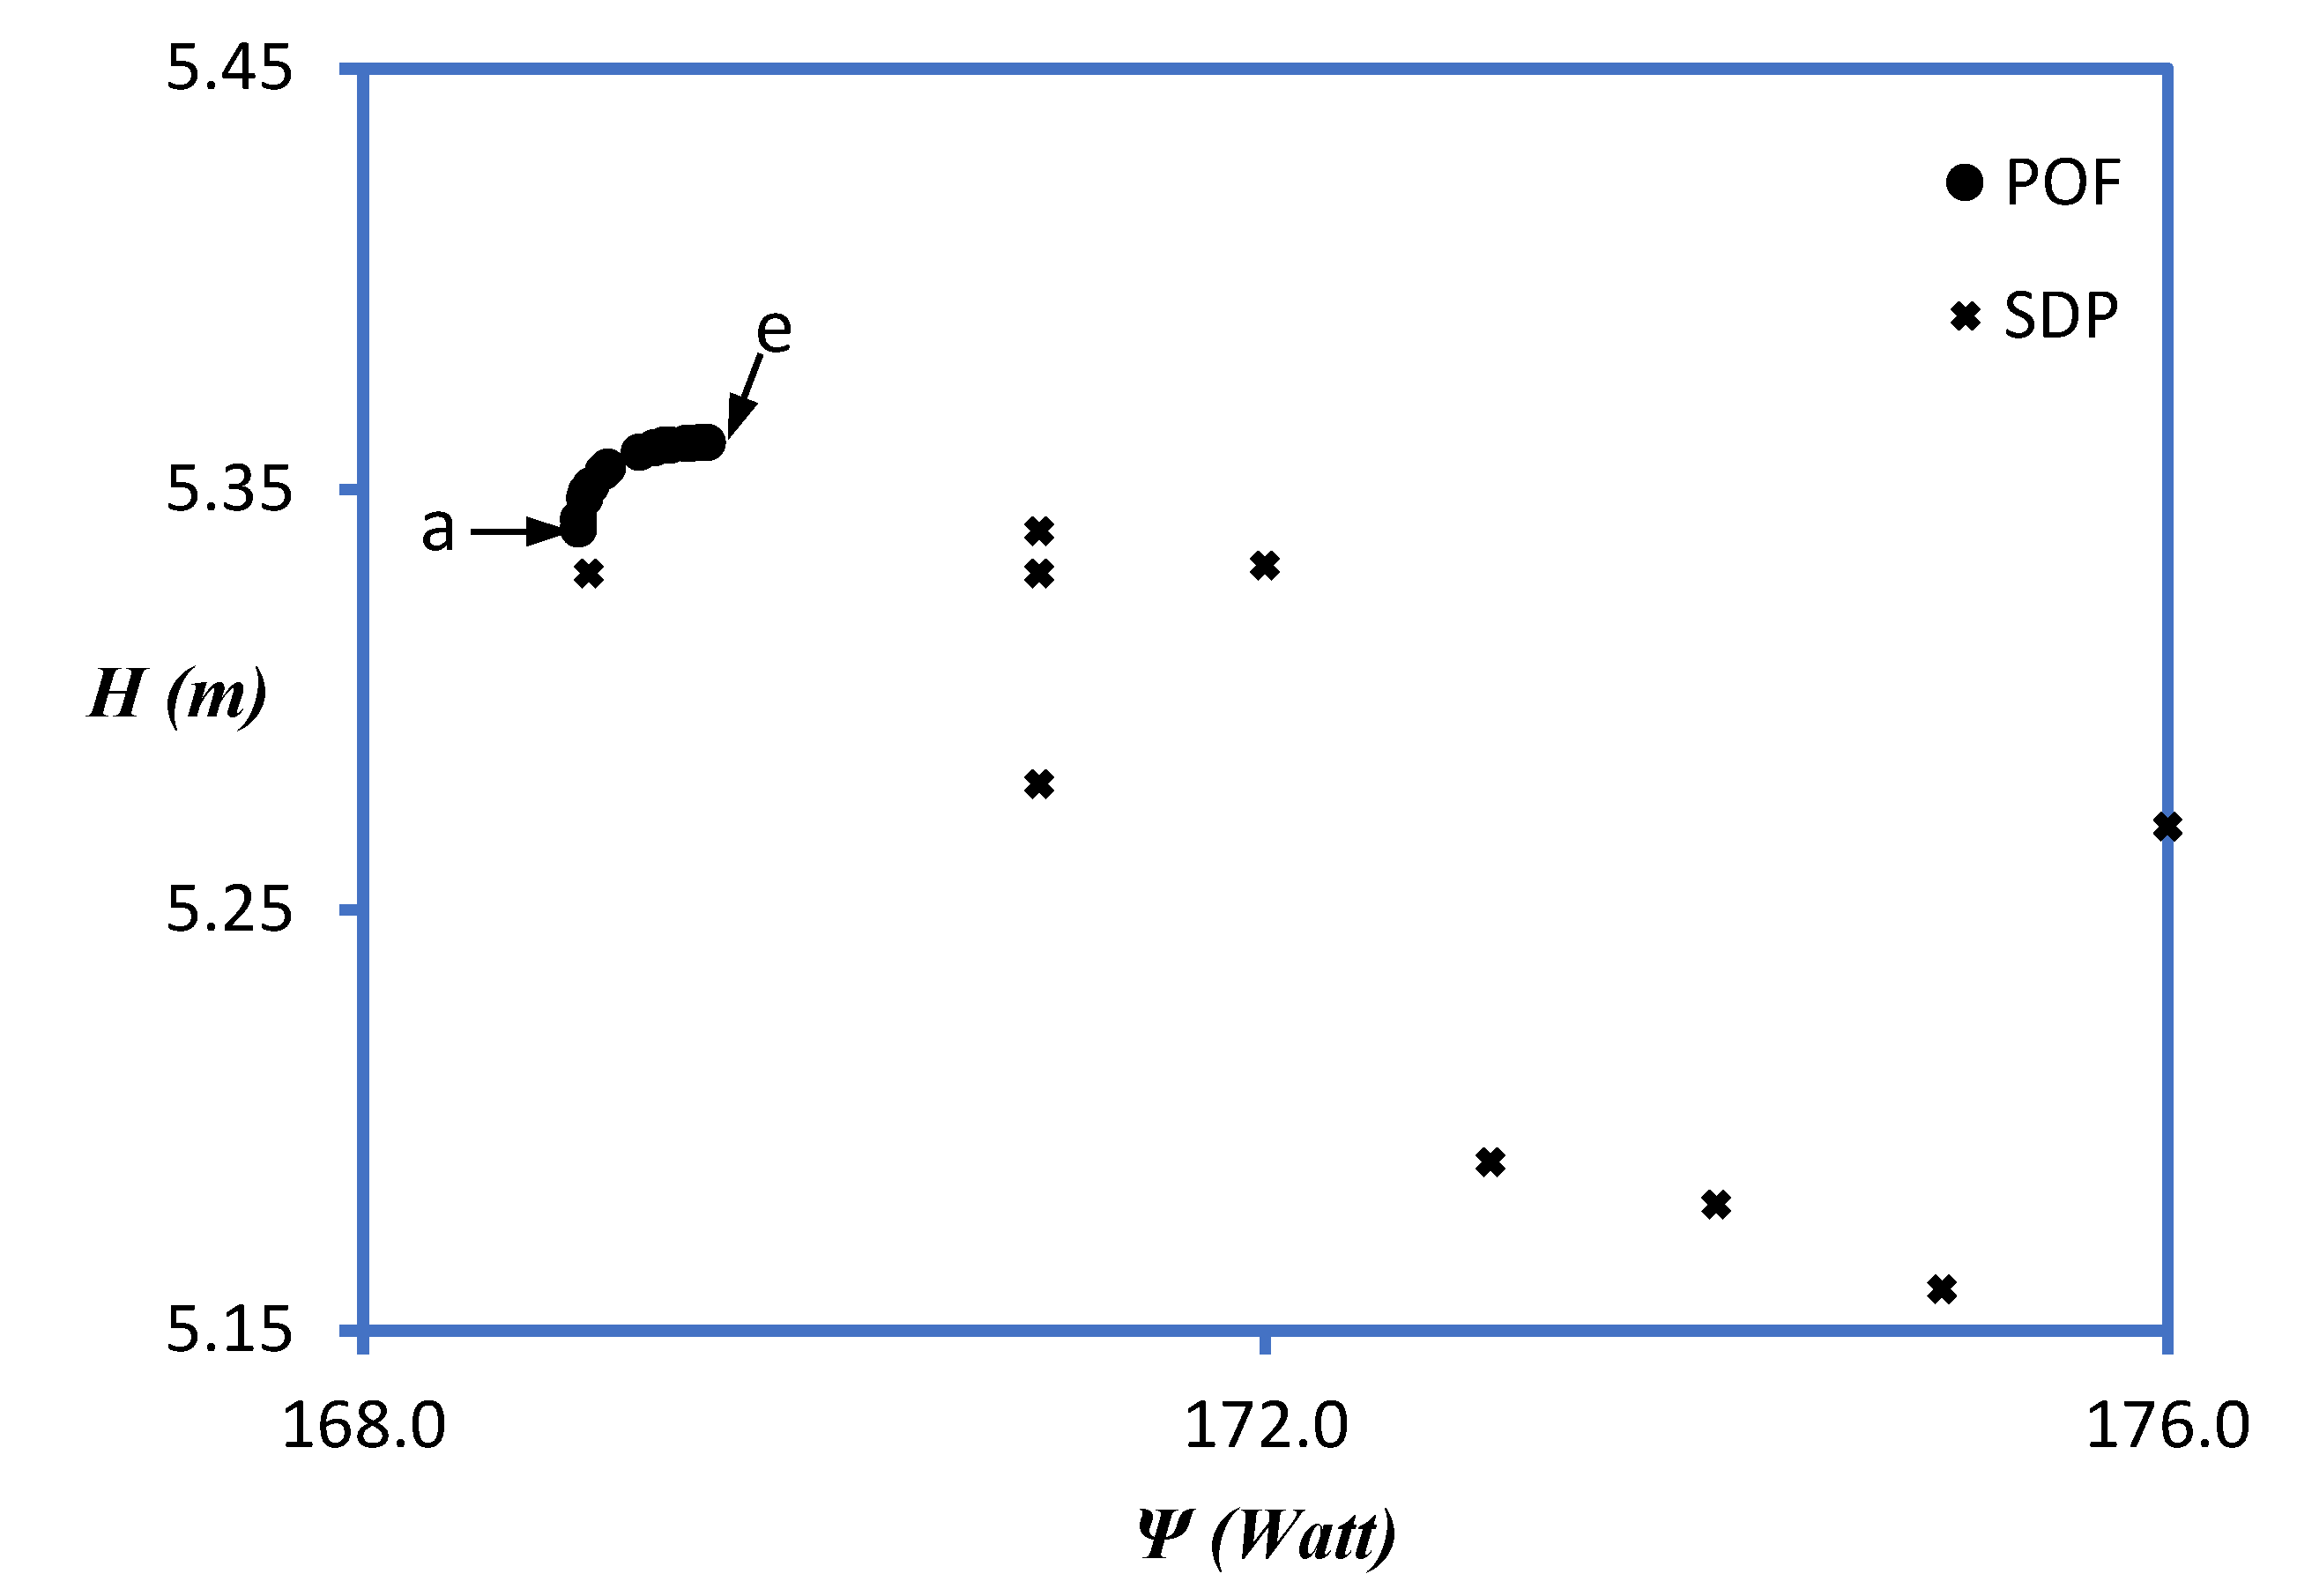
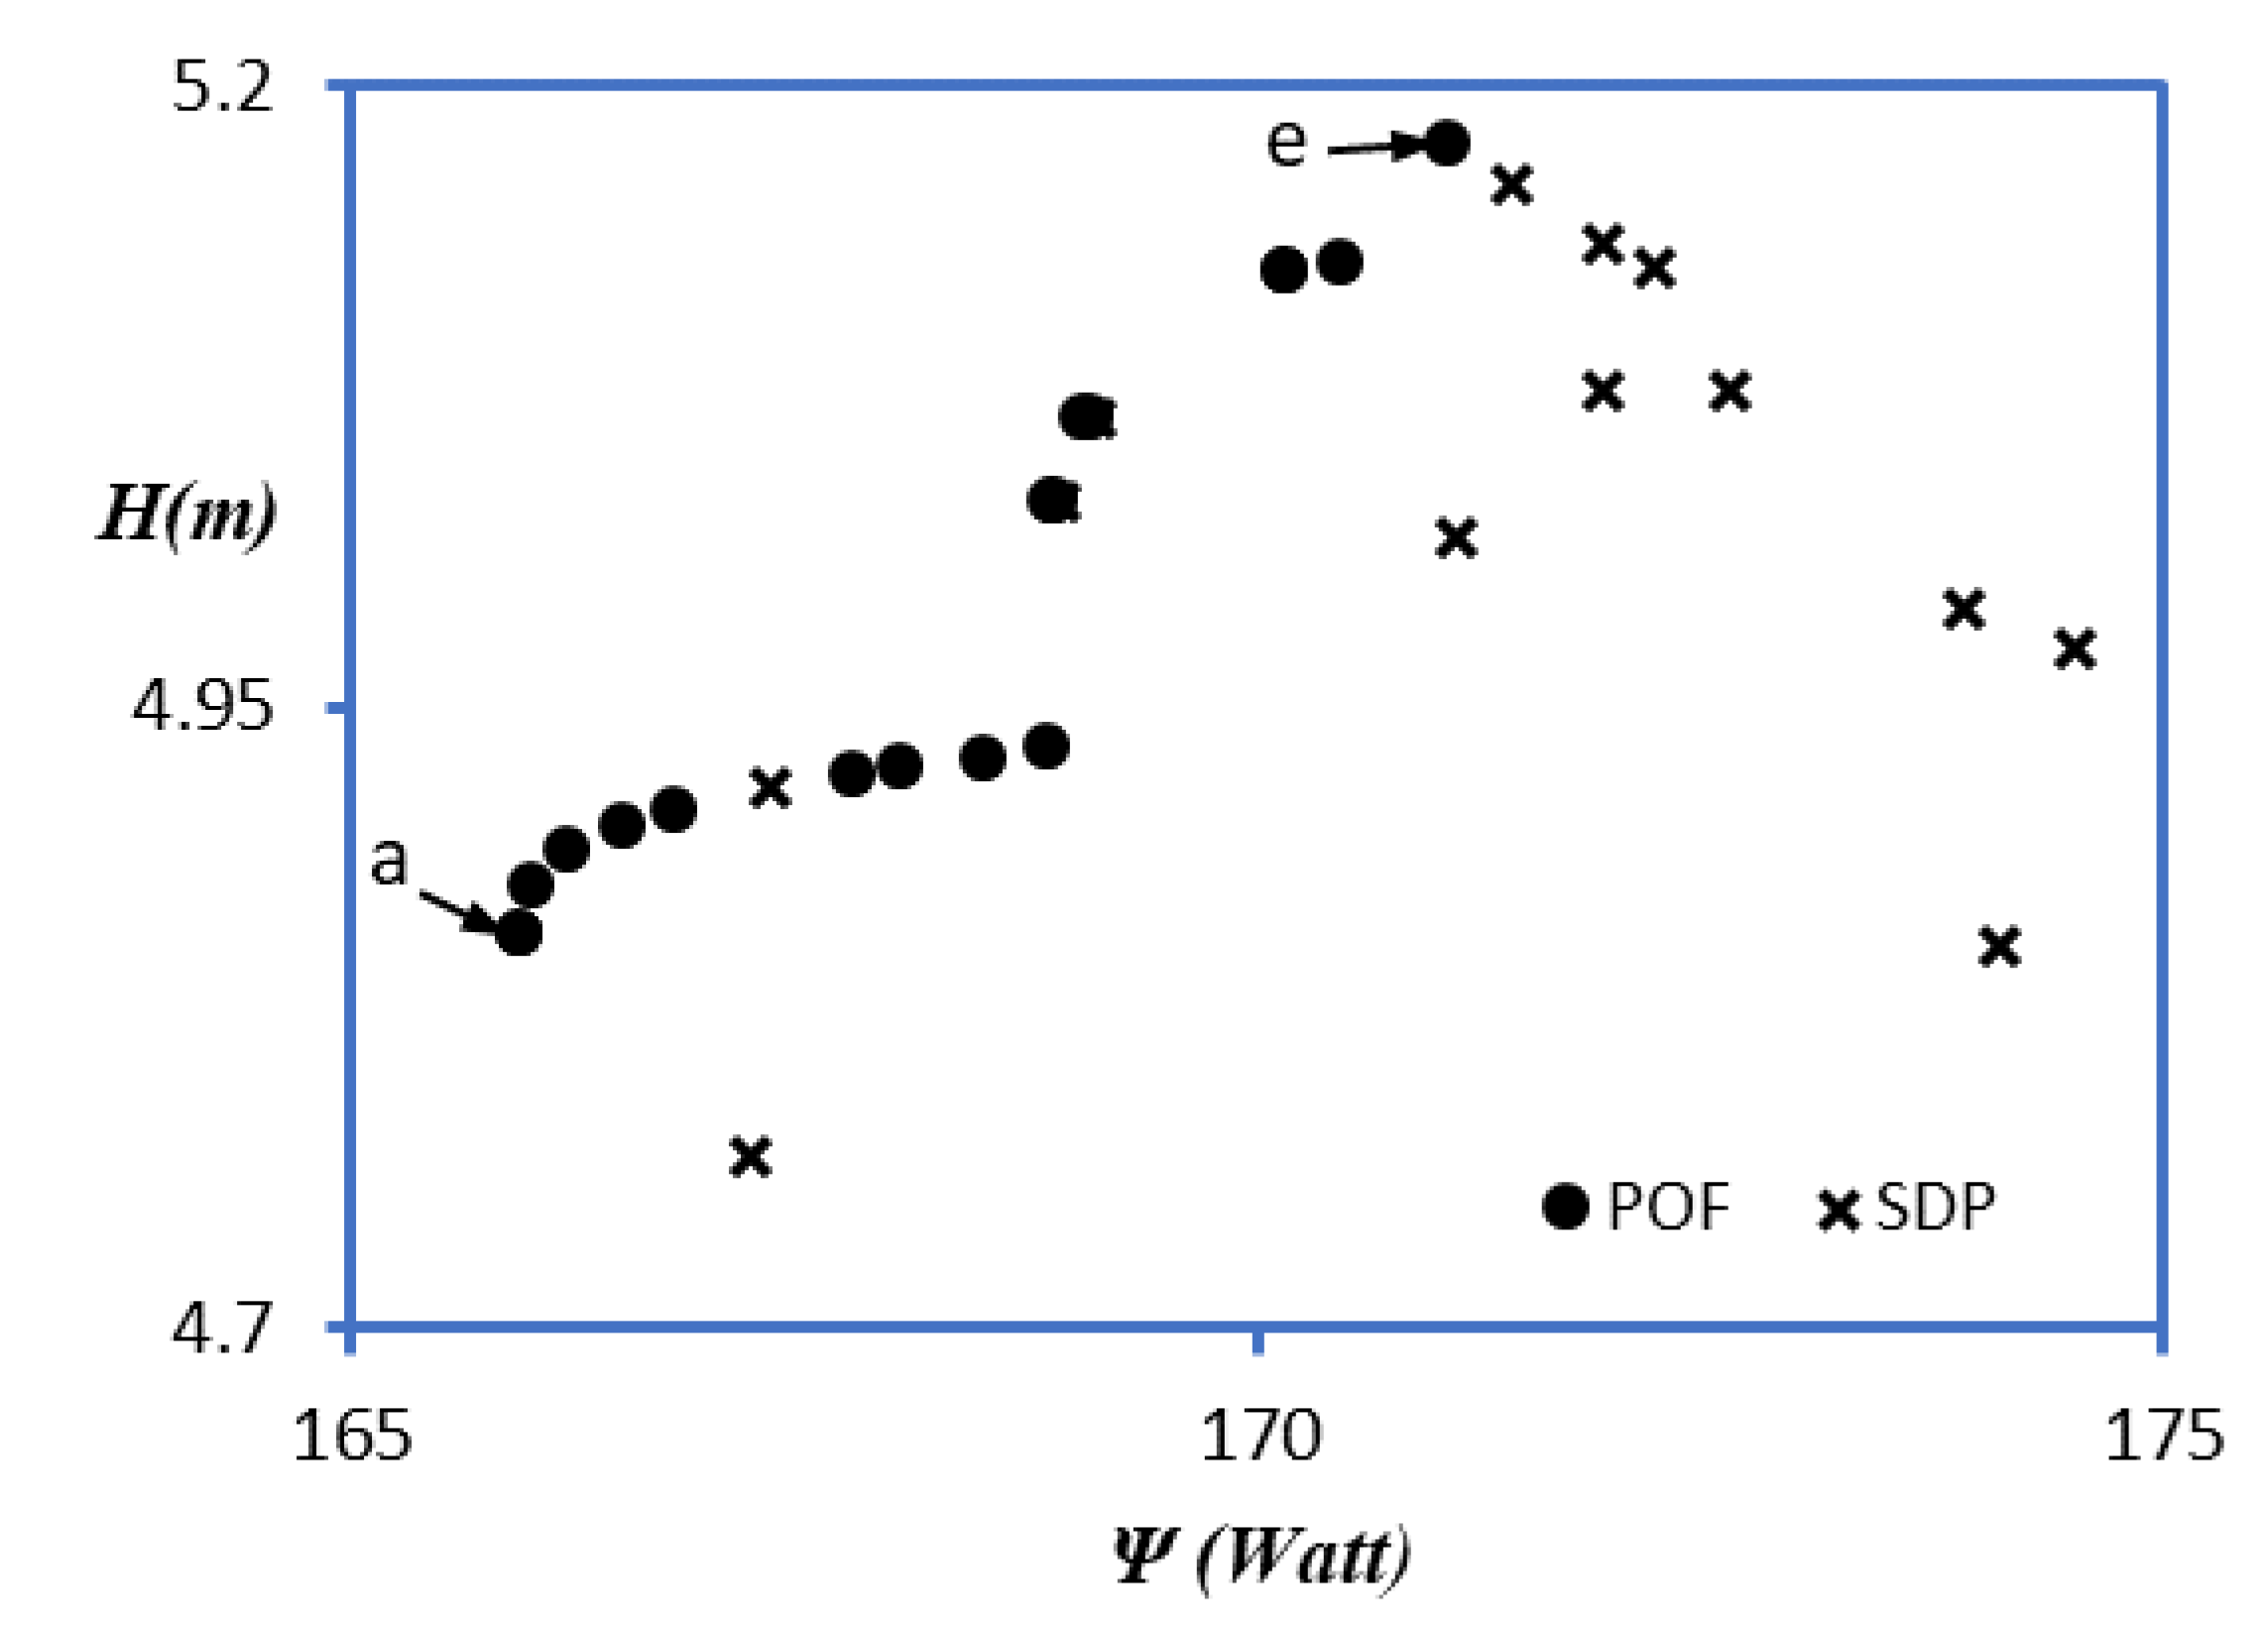
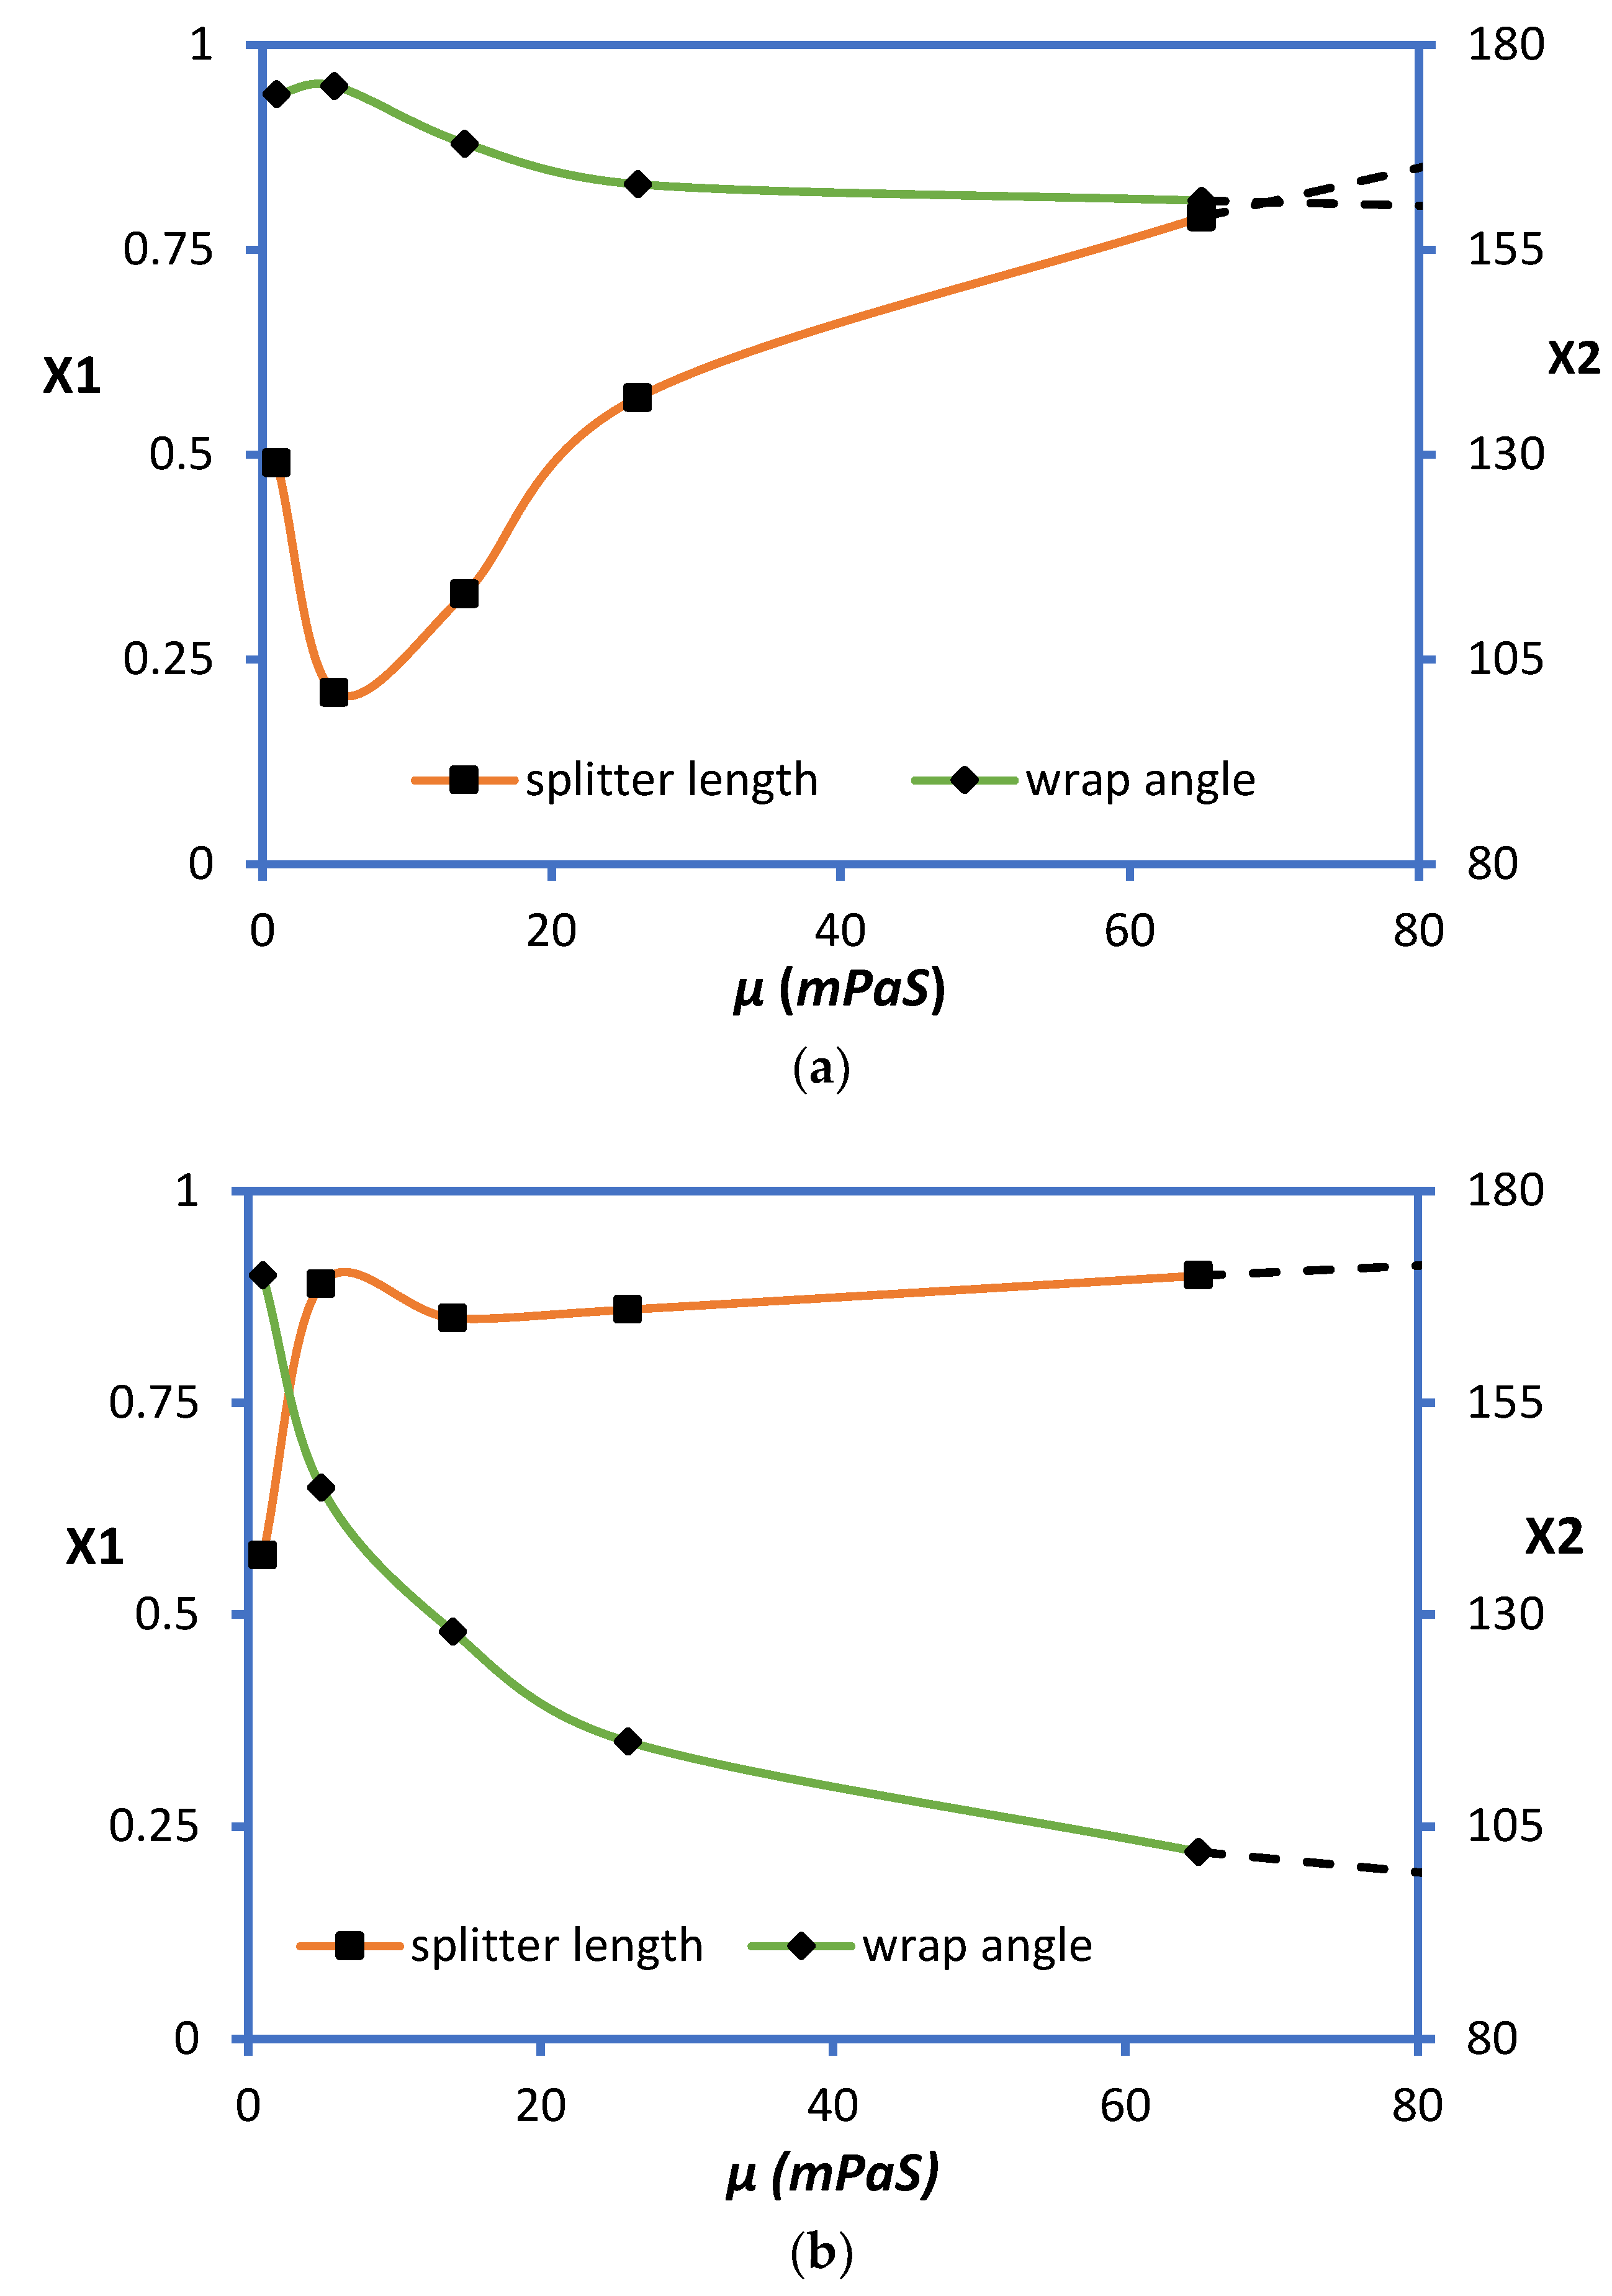
5.2. Optimizations
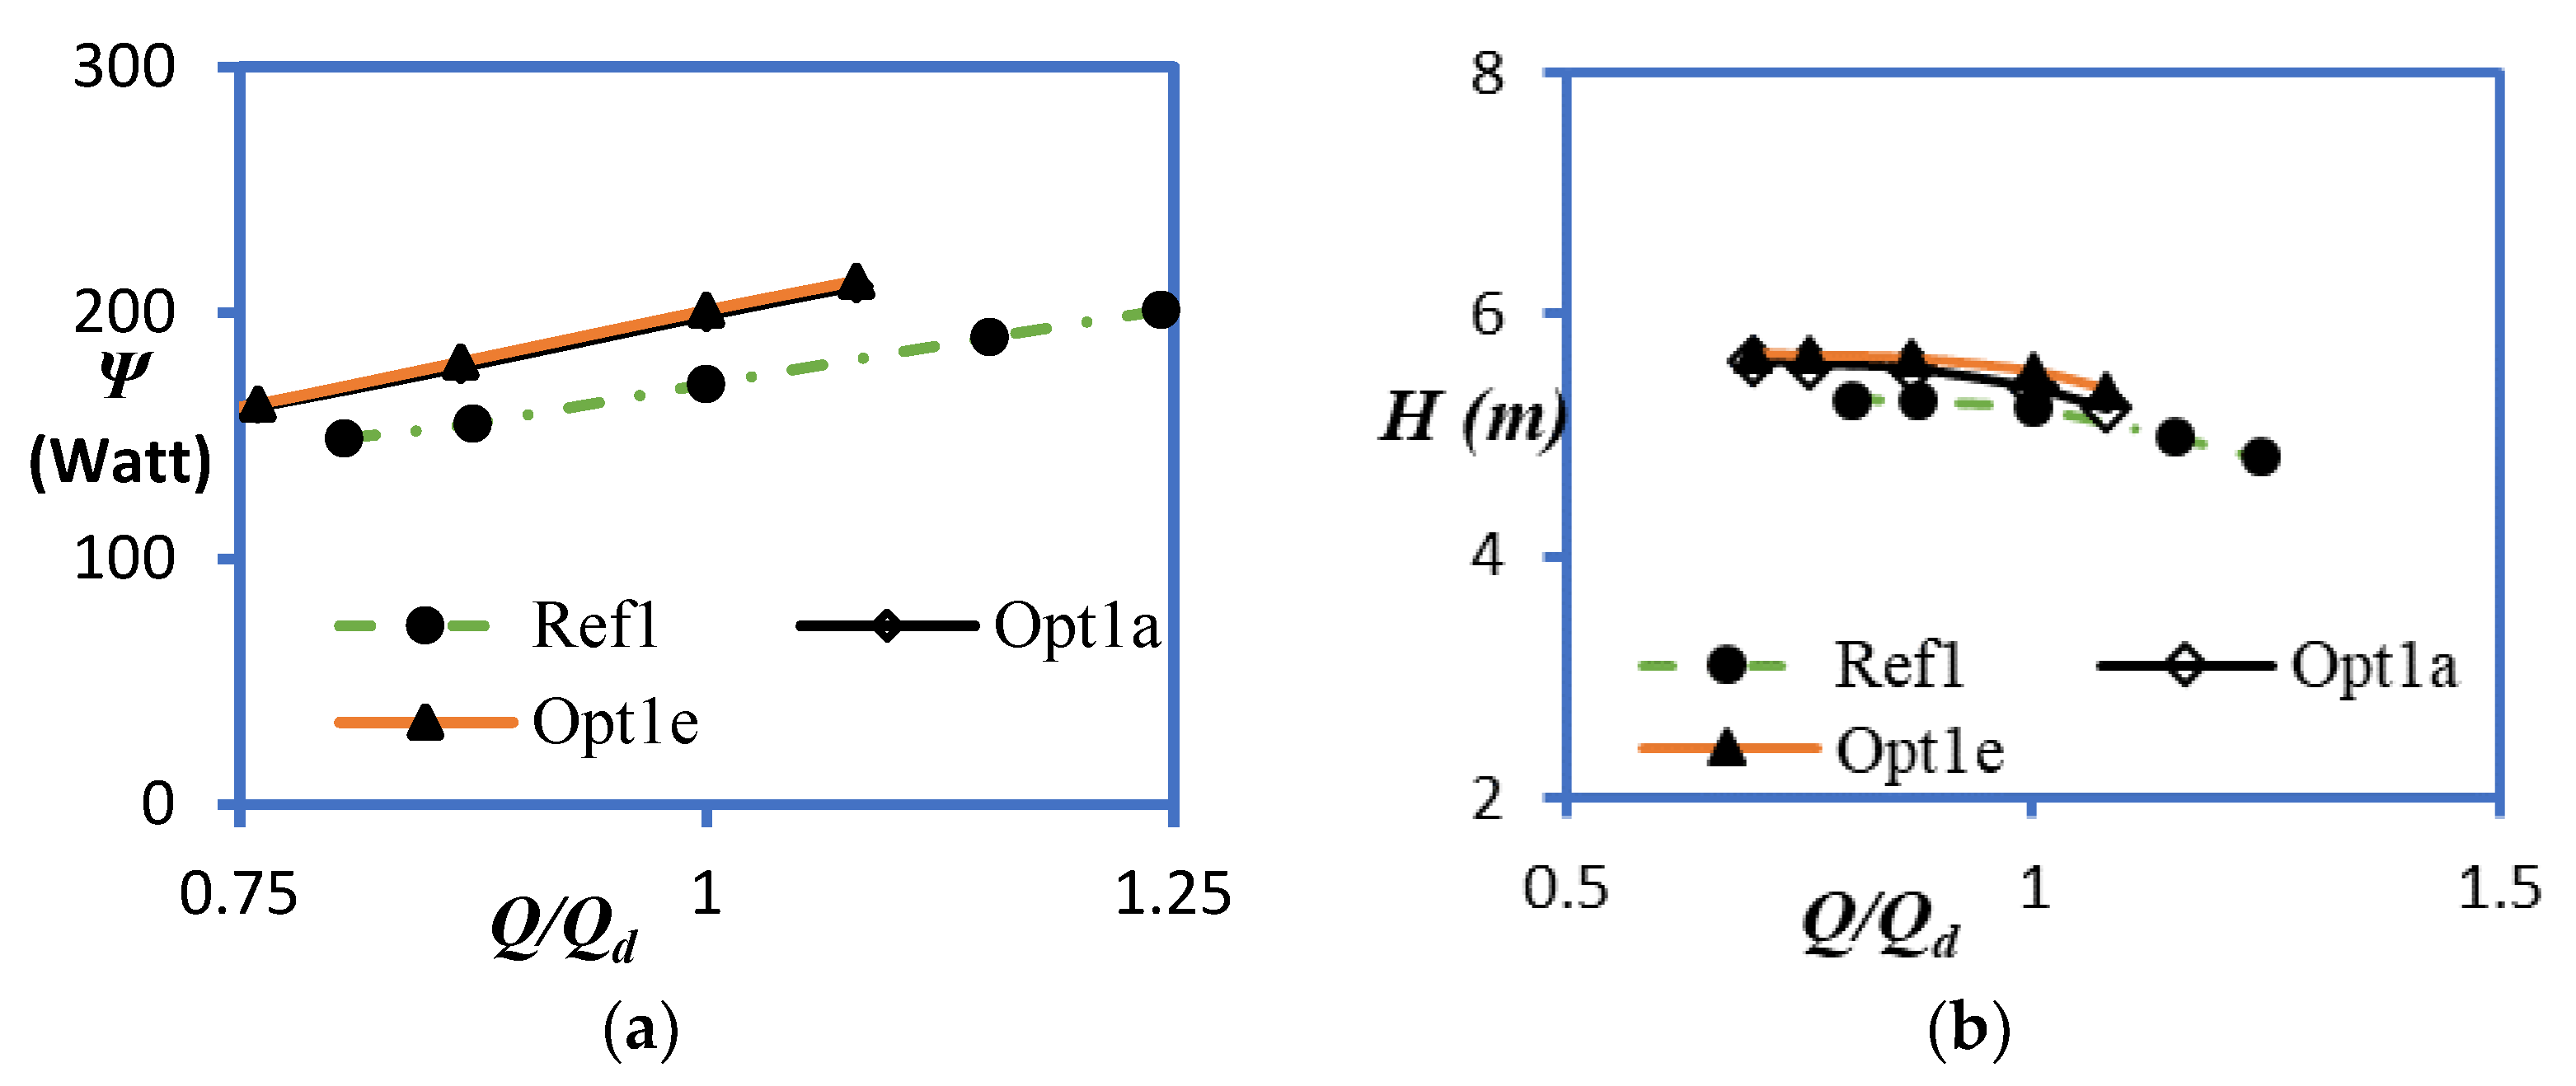
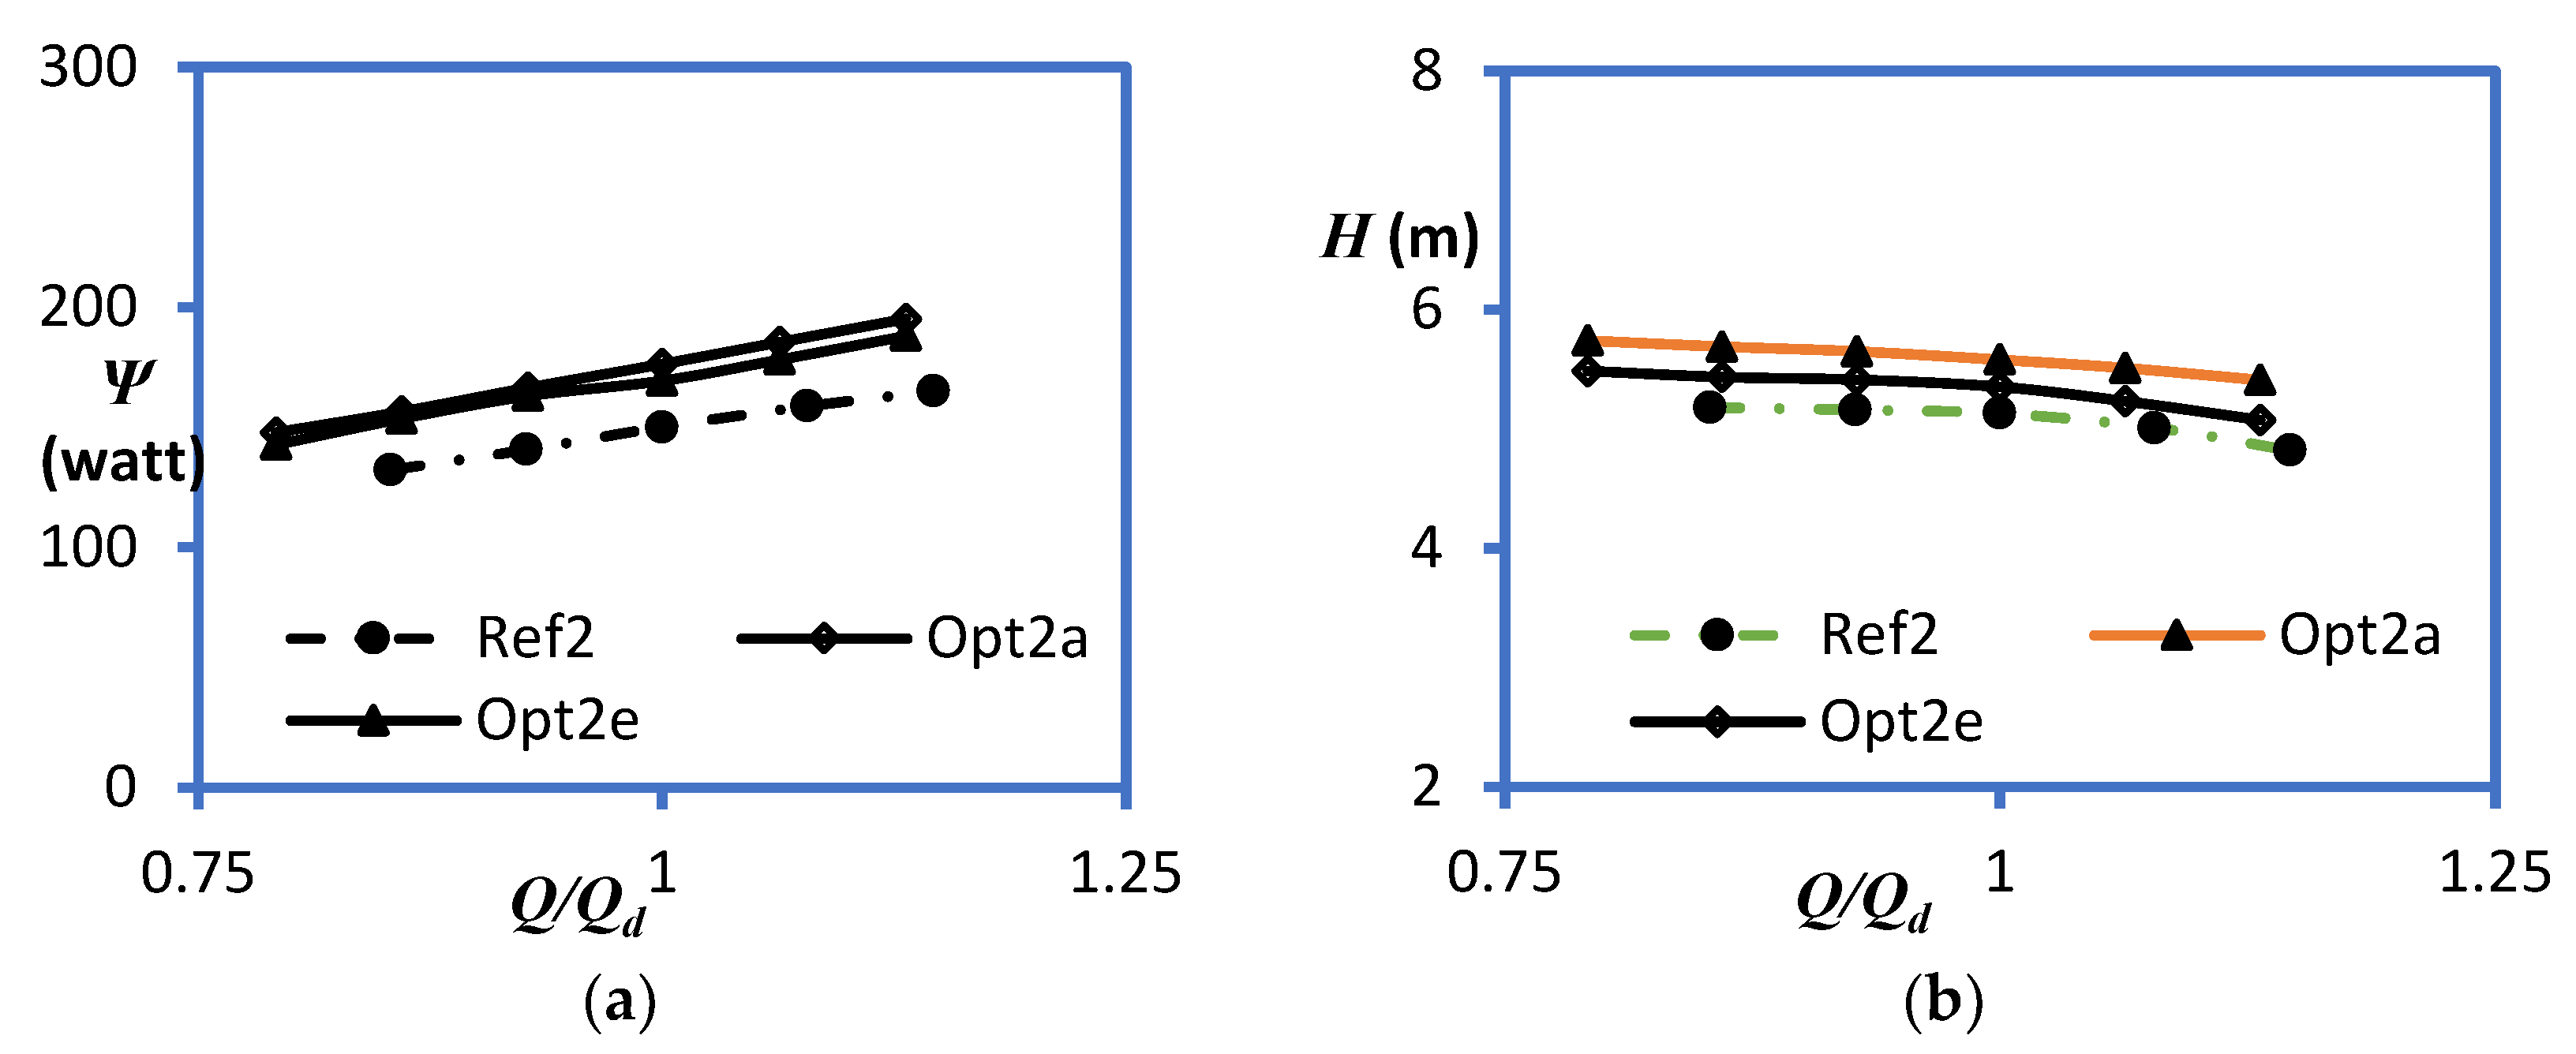
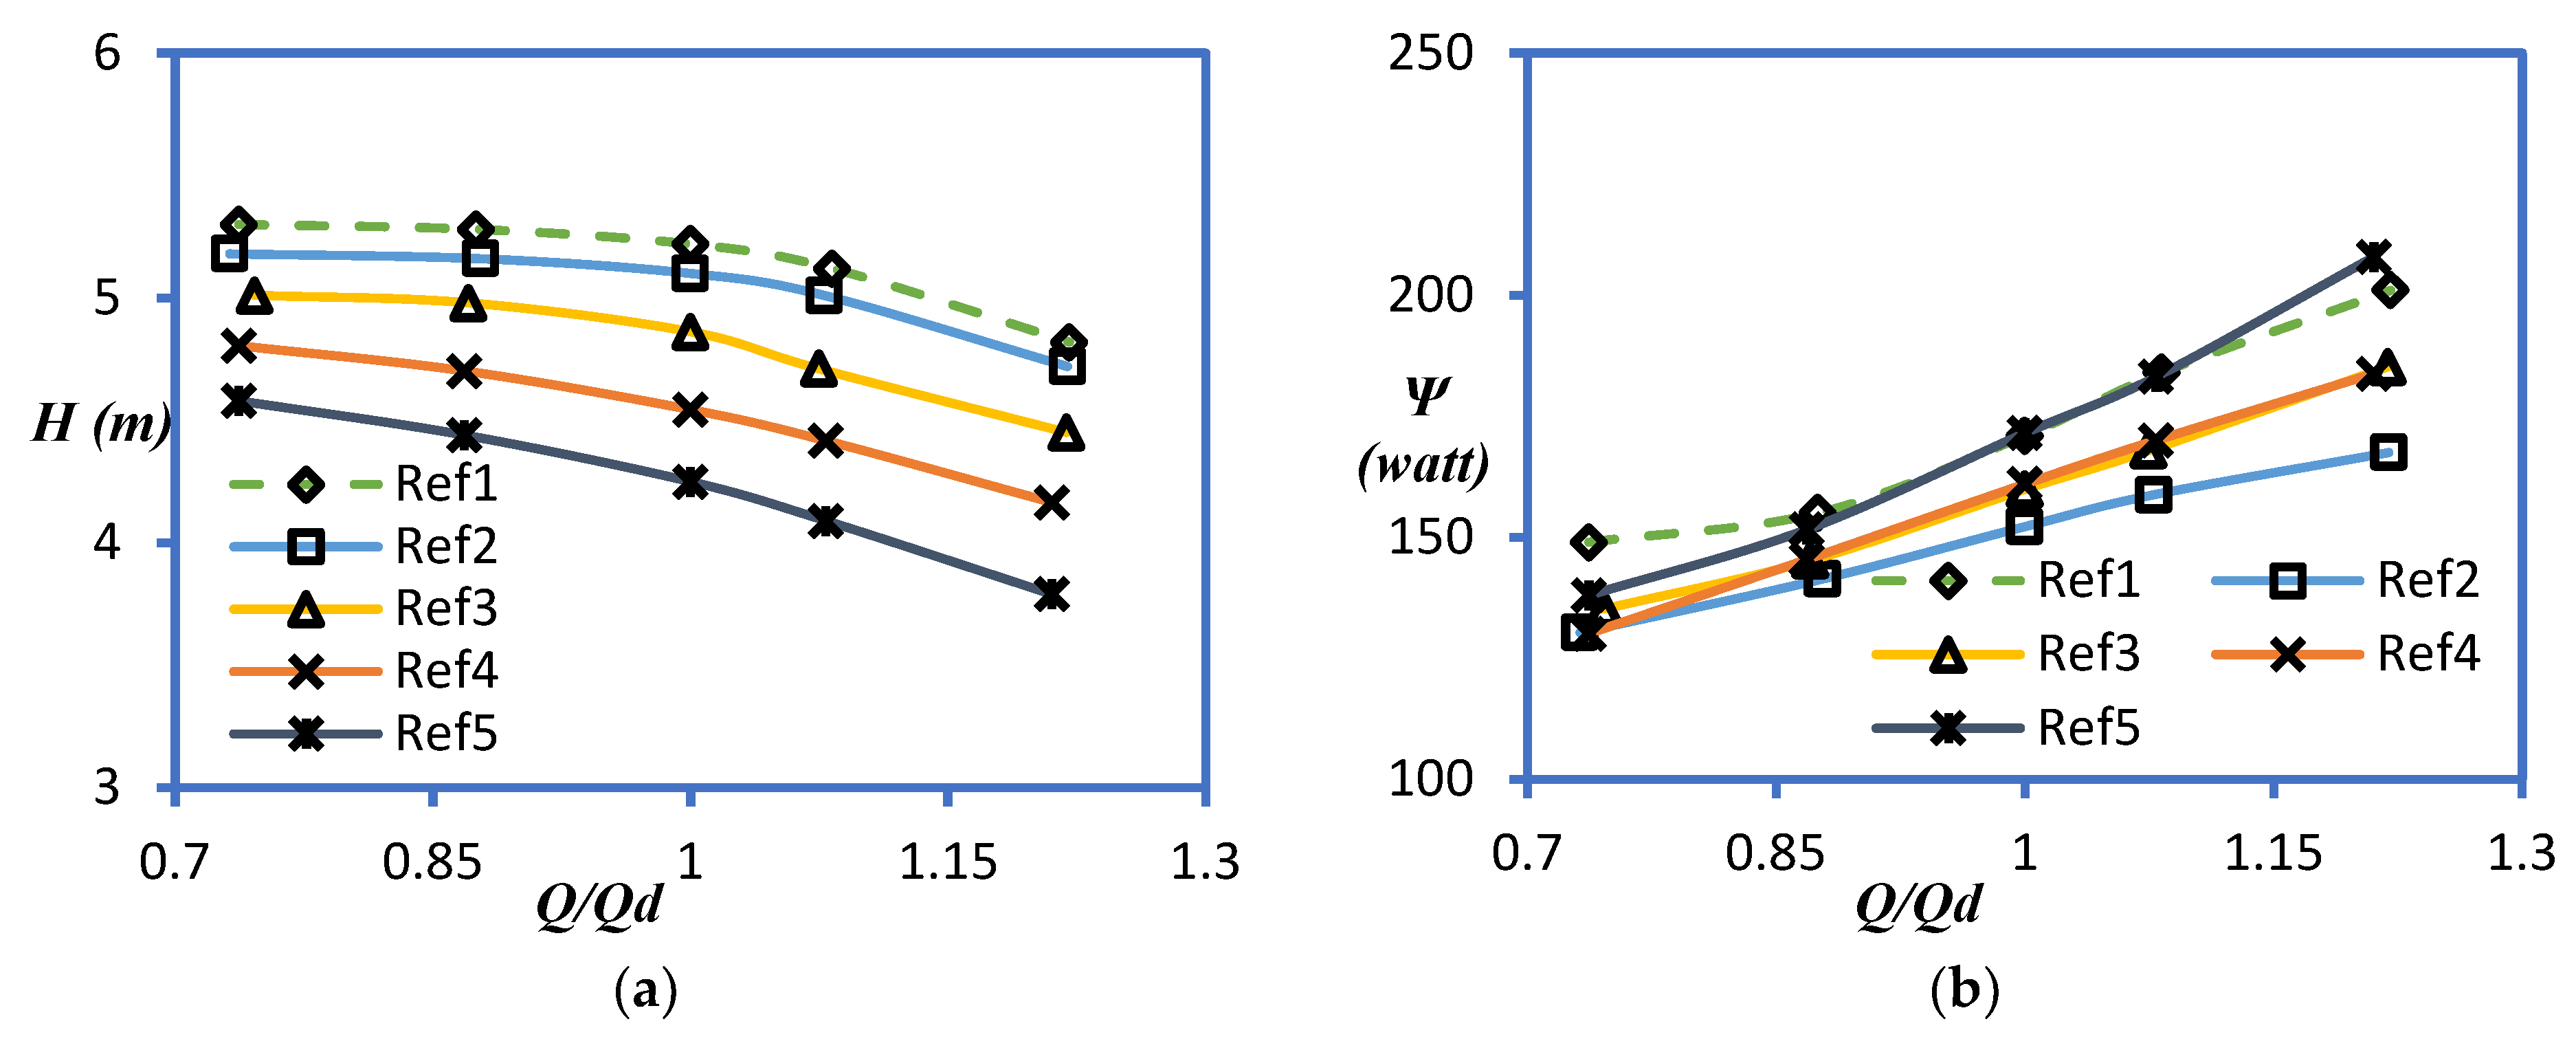
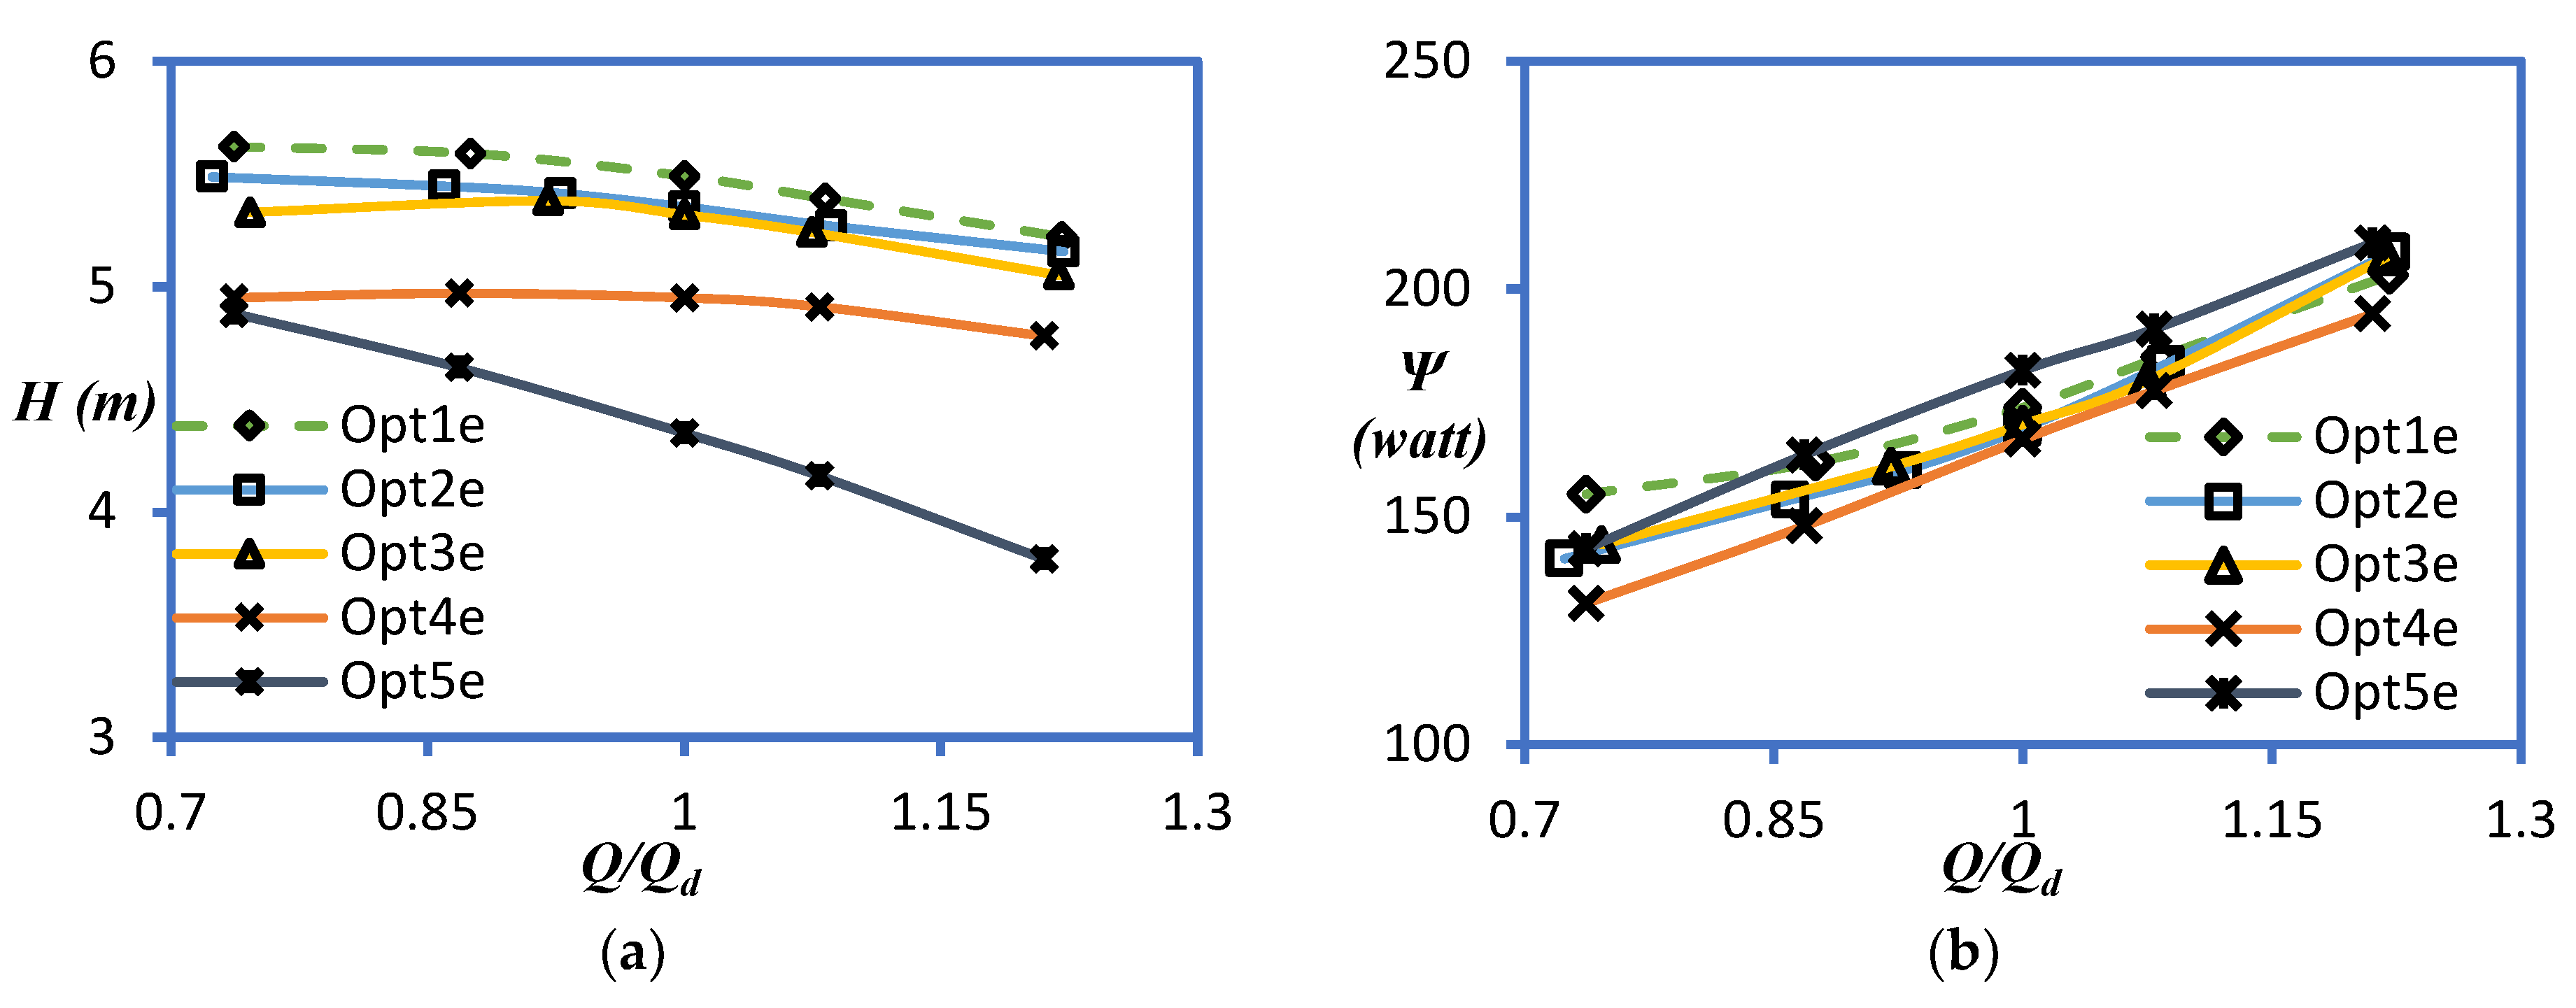
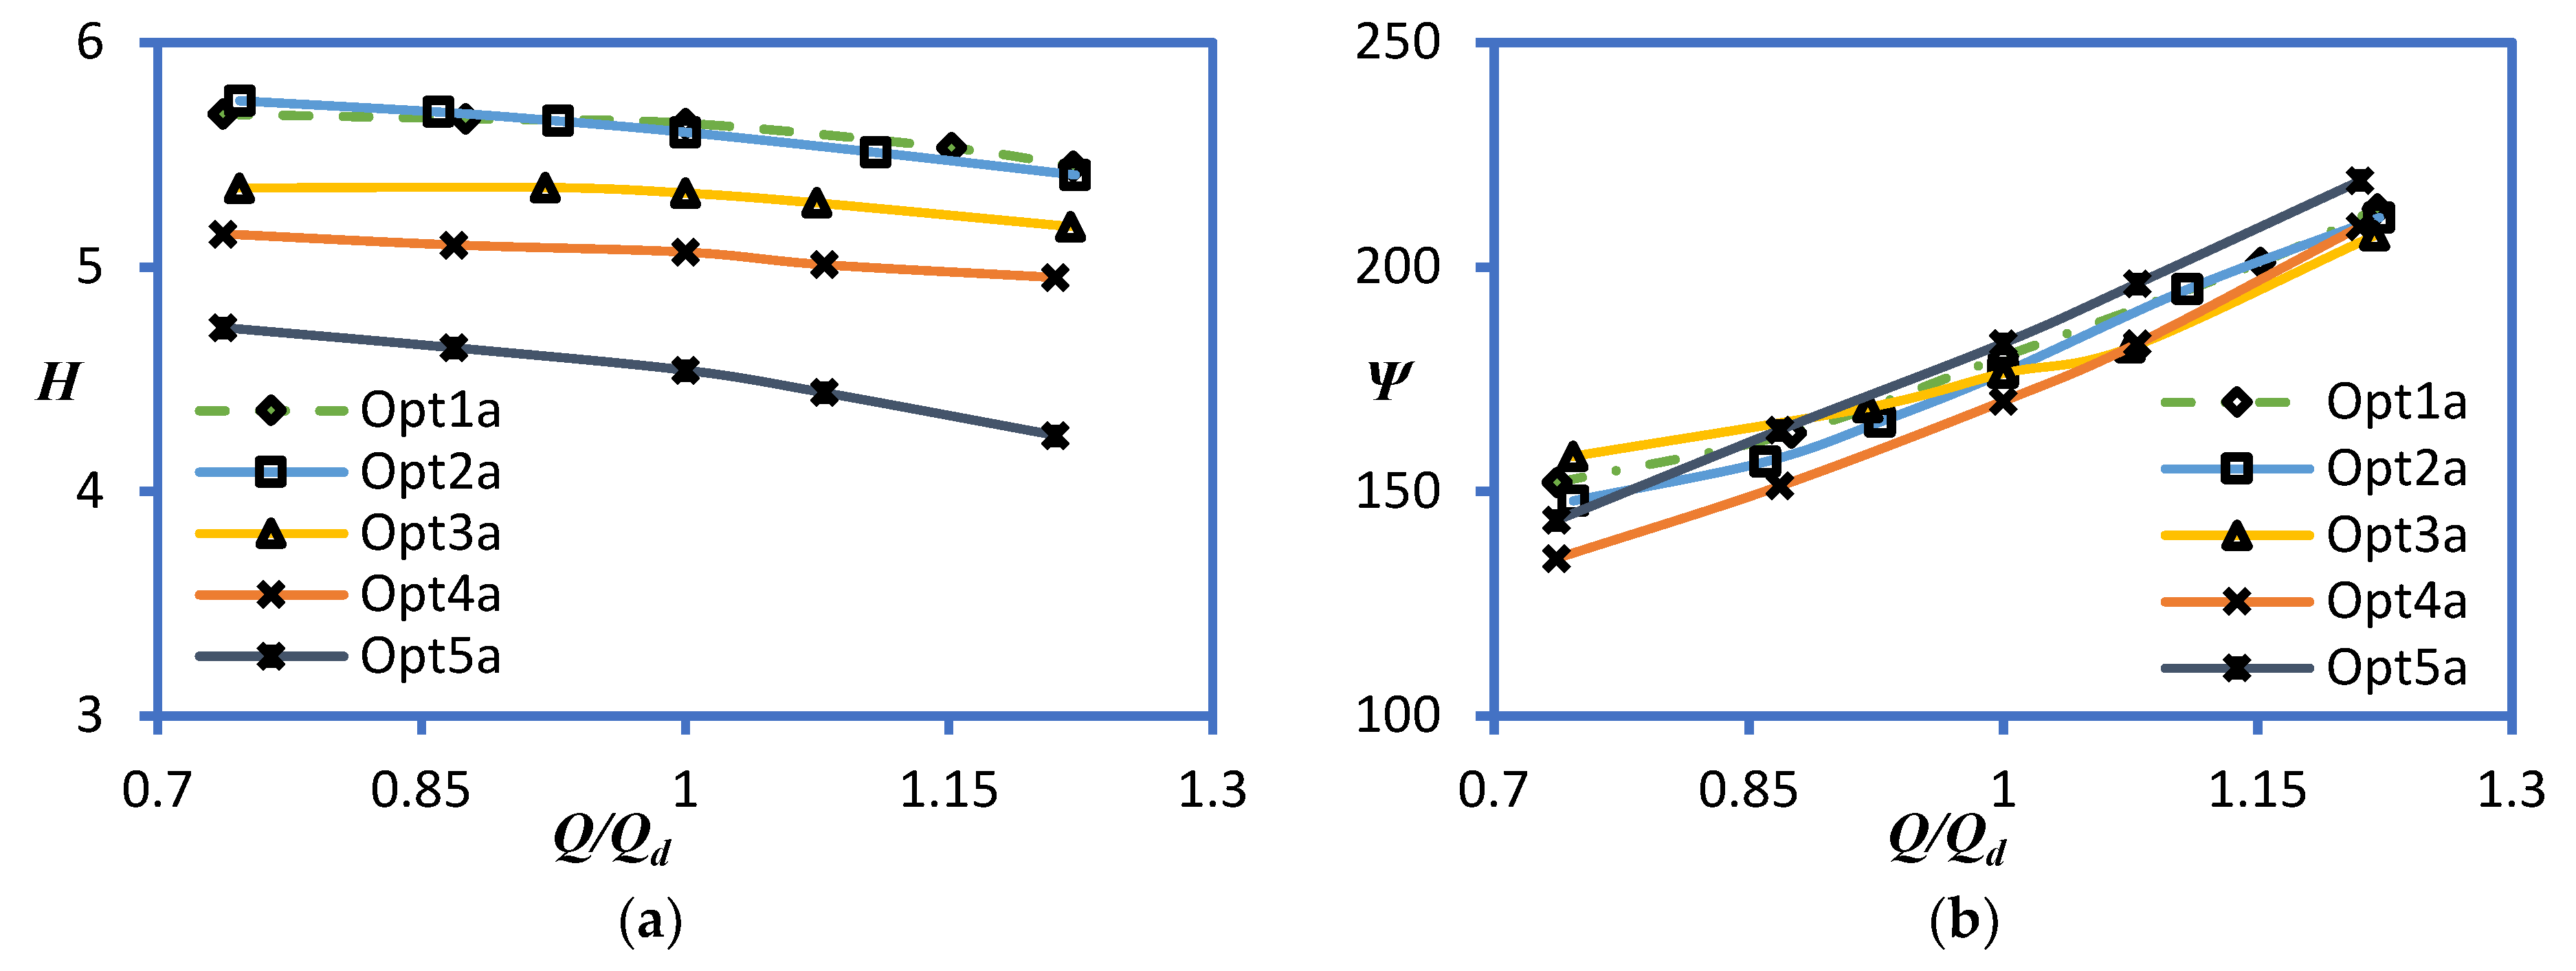
5.3. Performance Curves
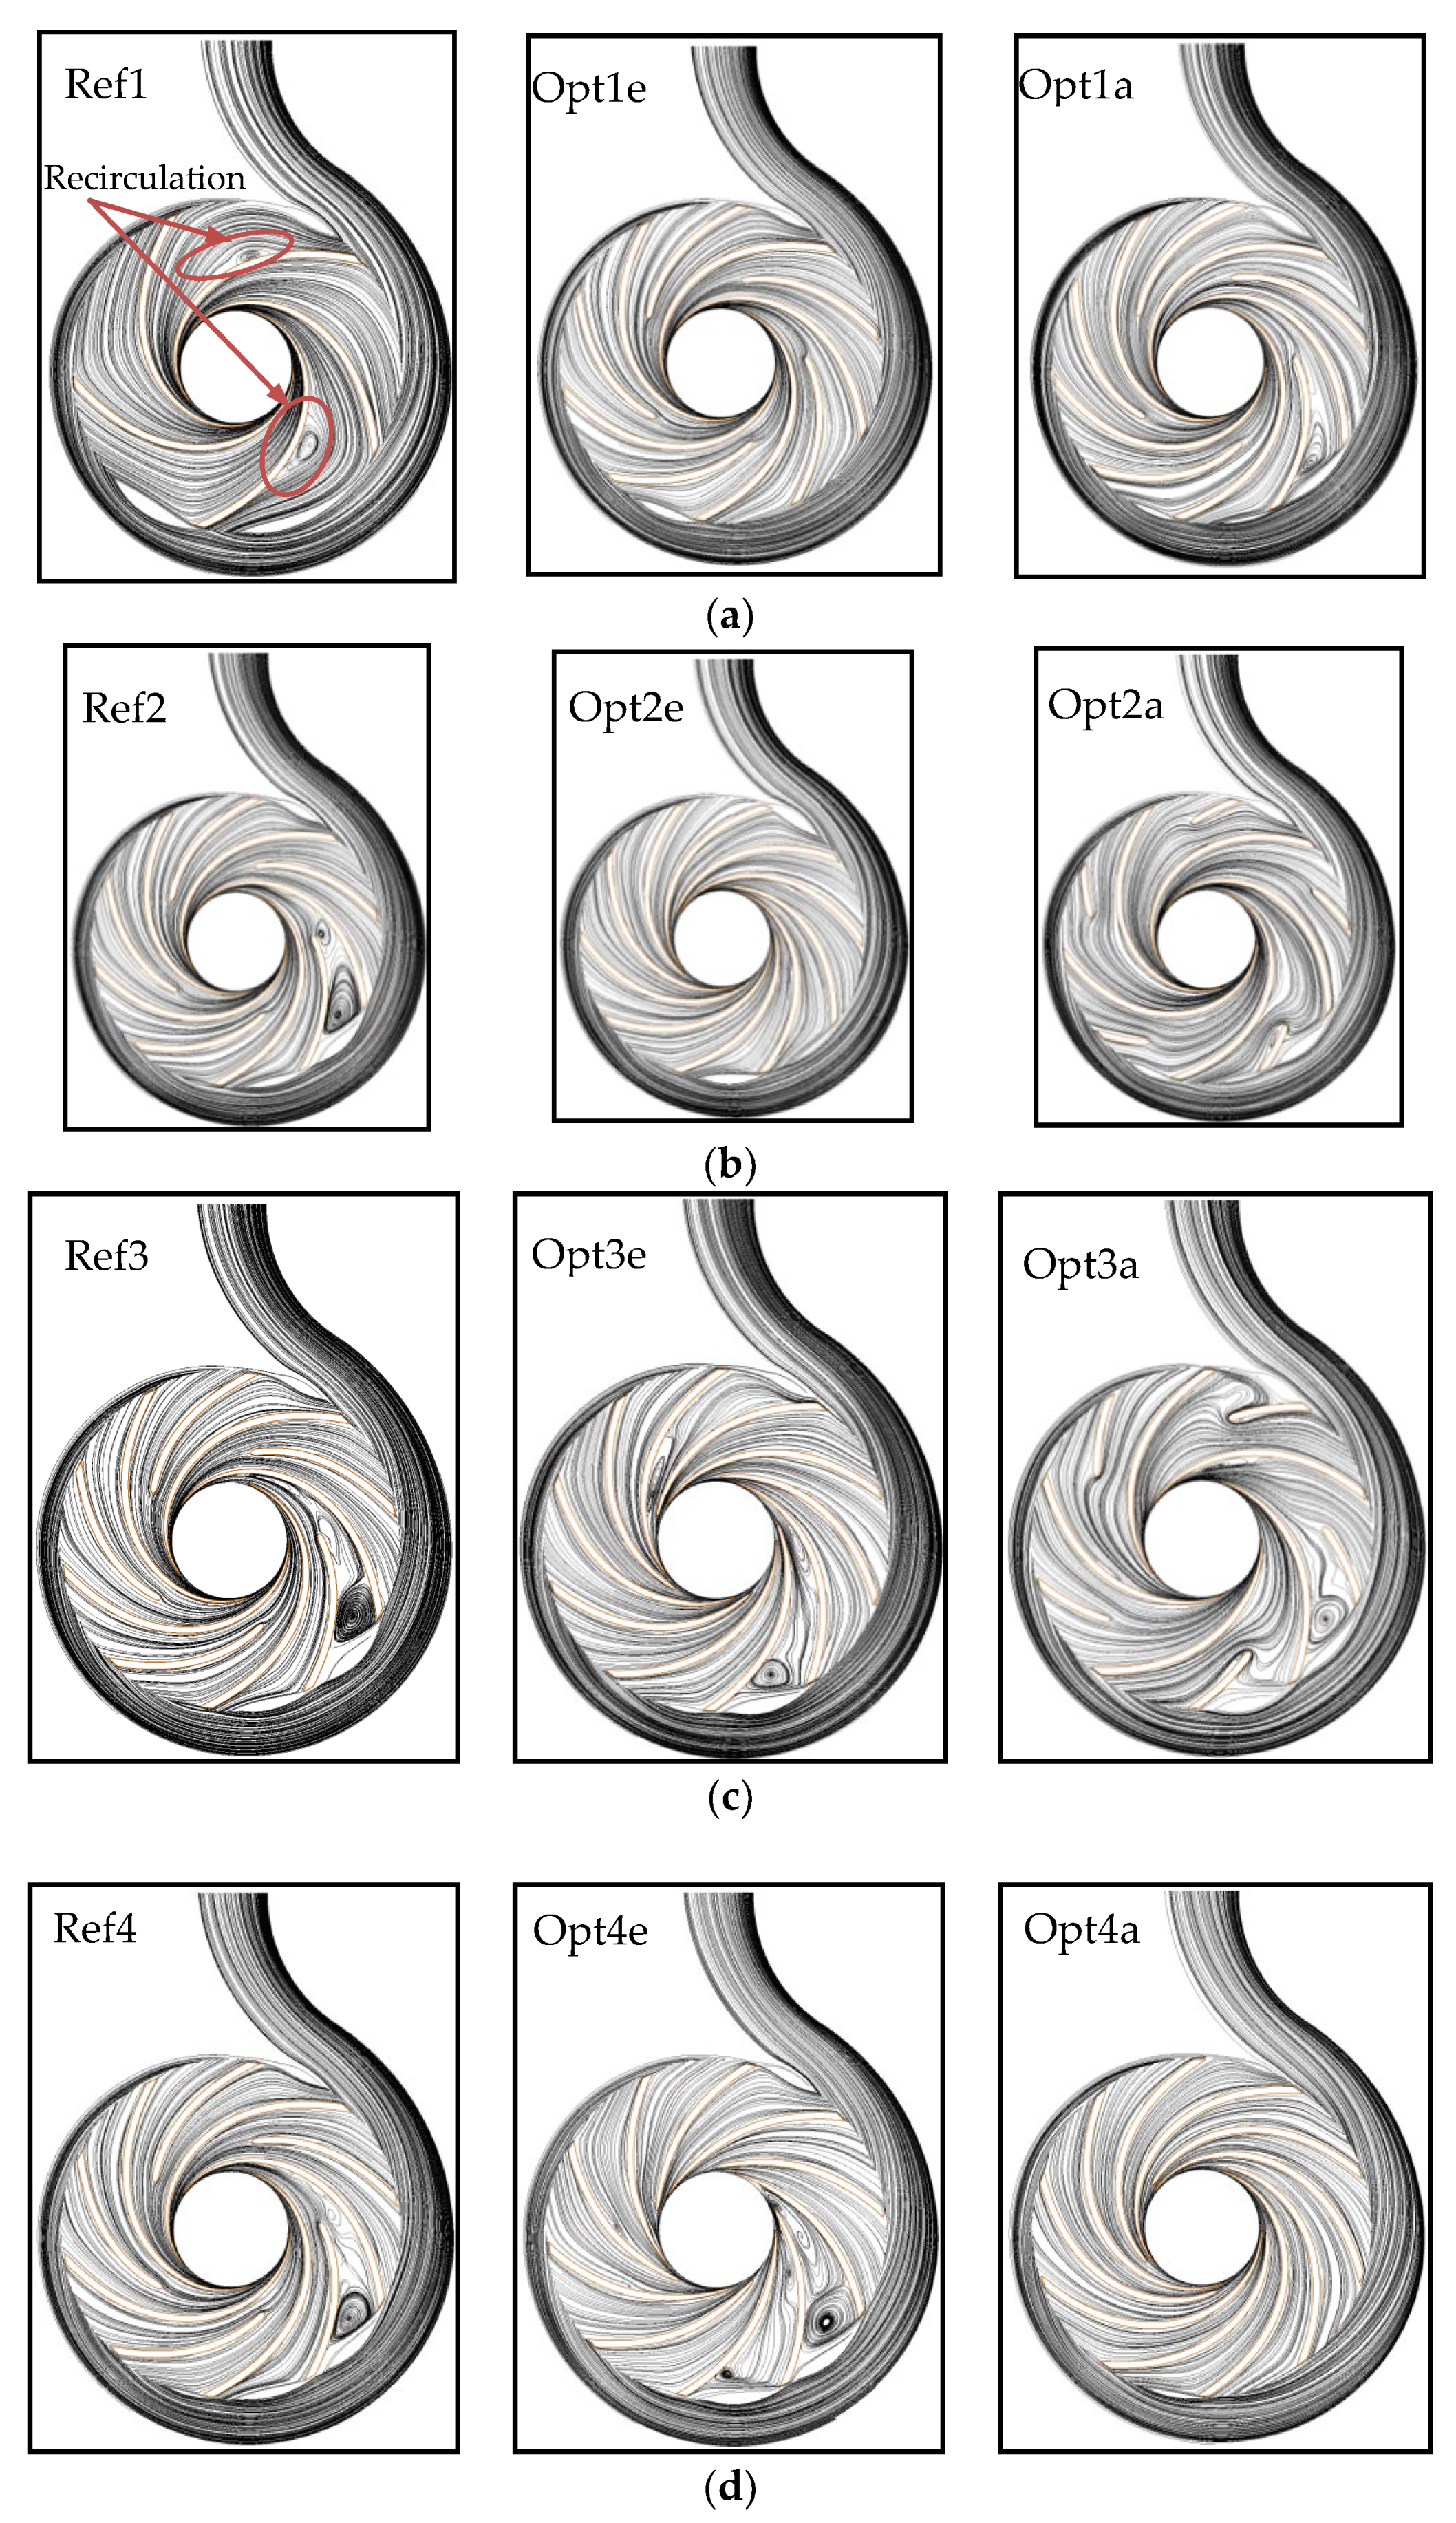
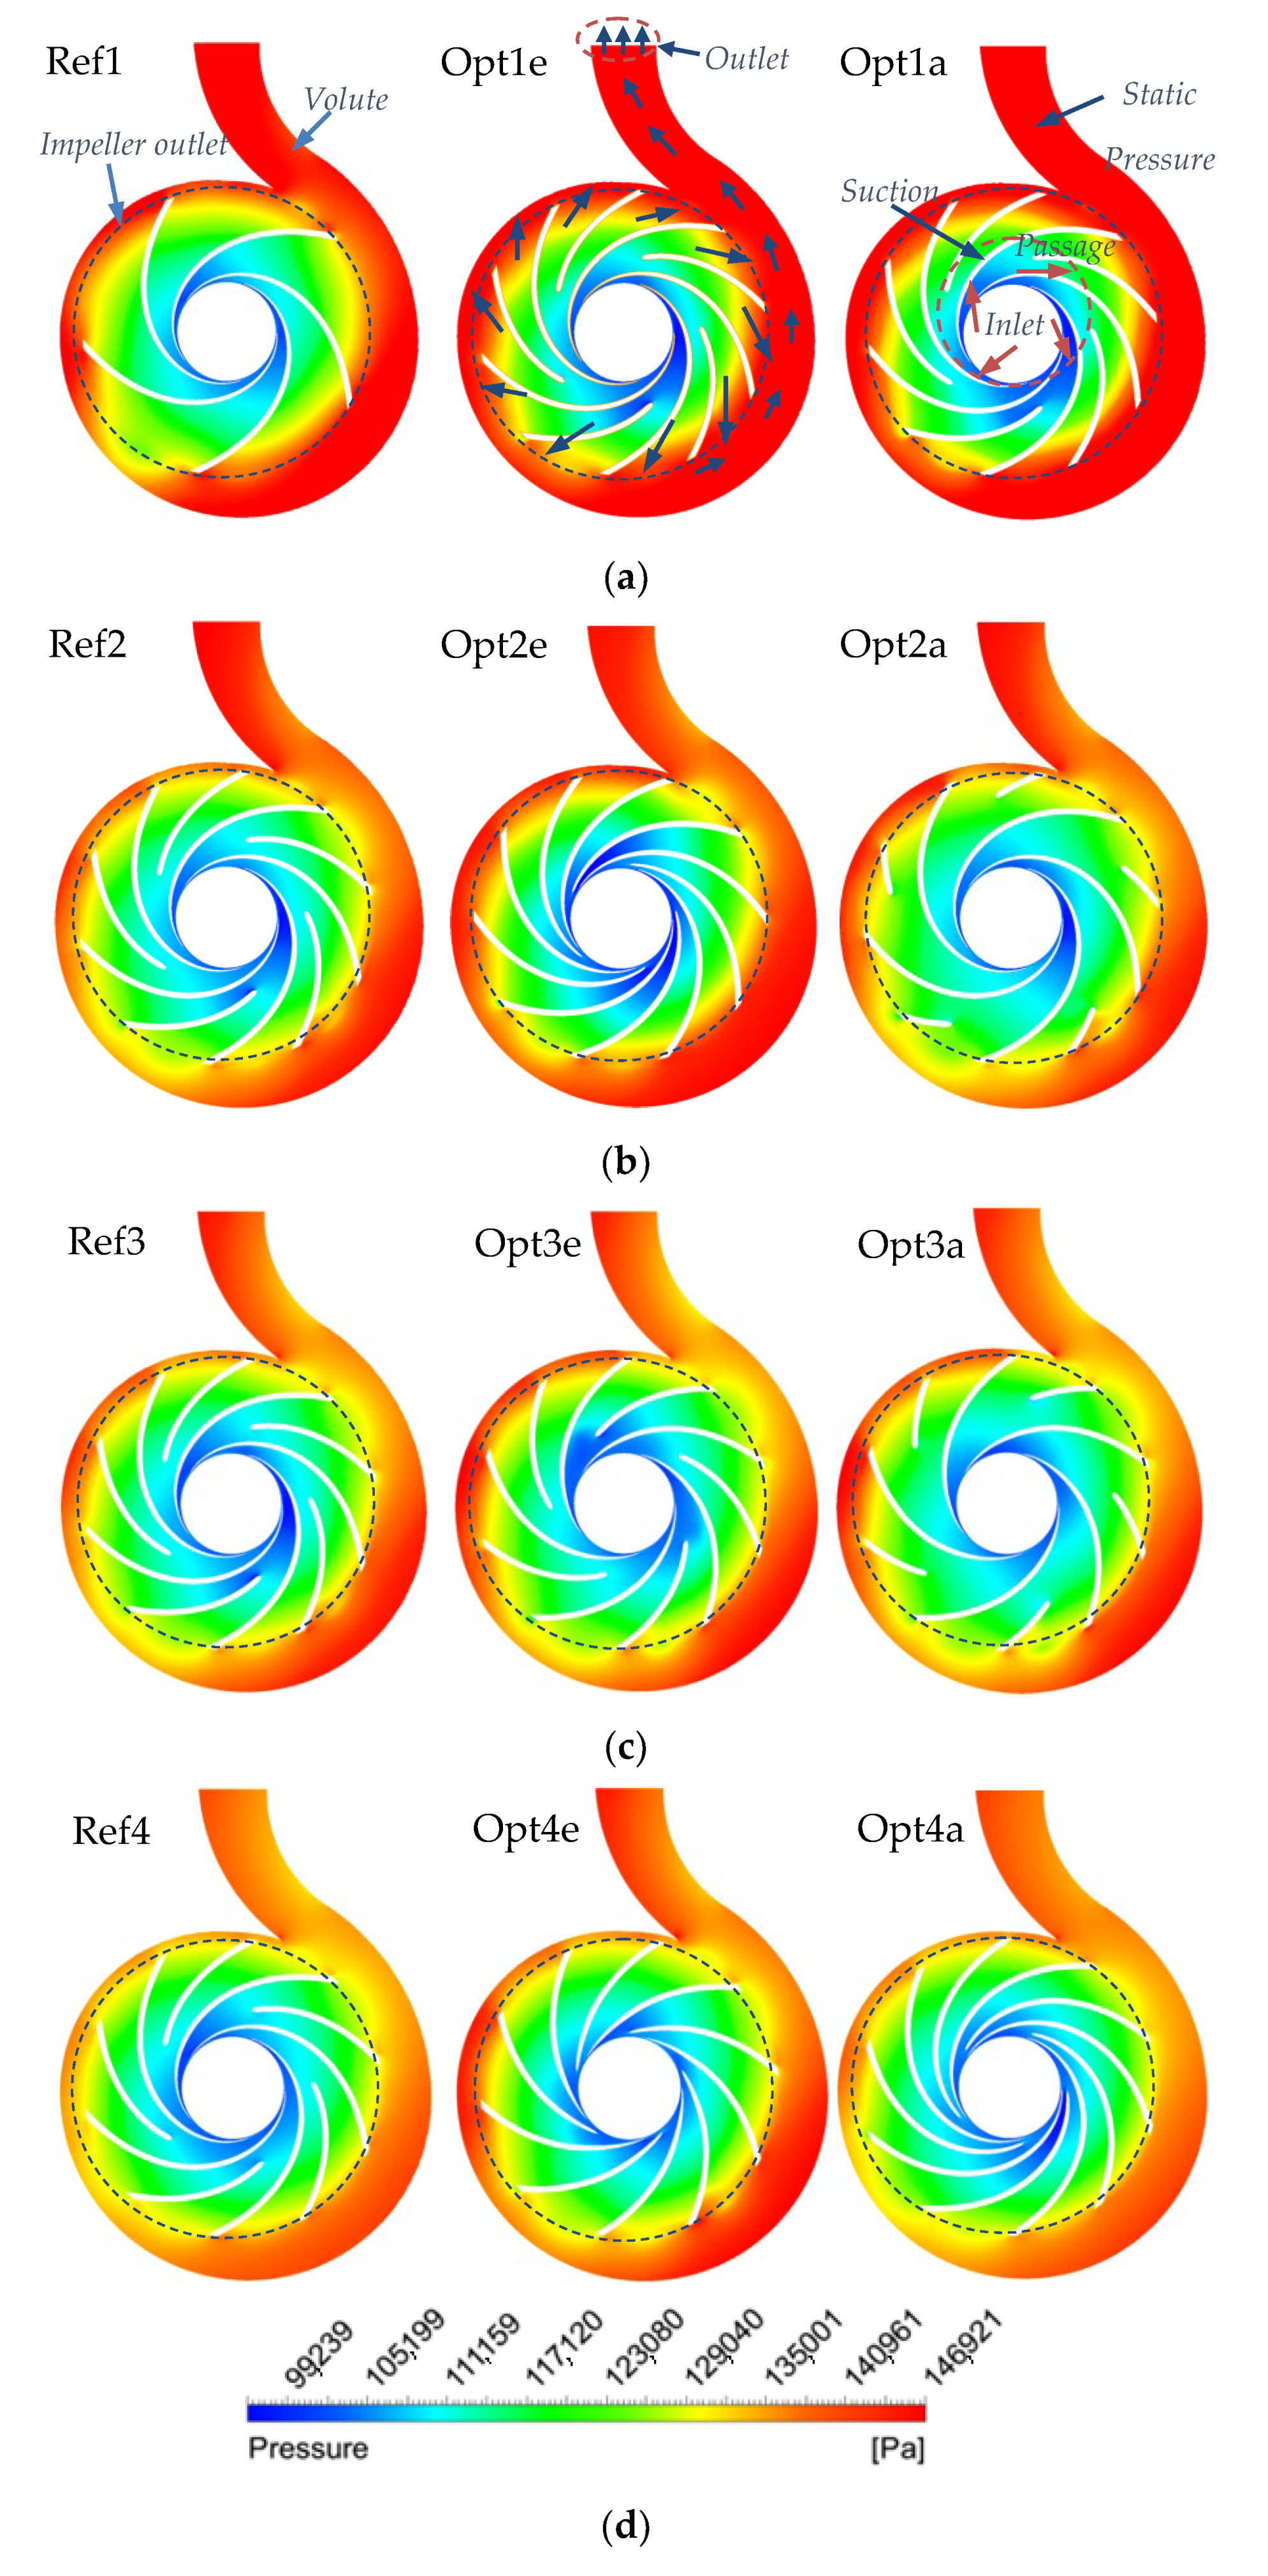
5.4. Flow Analysis
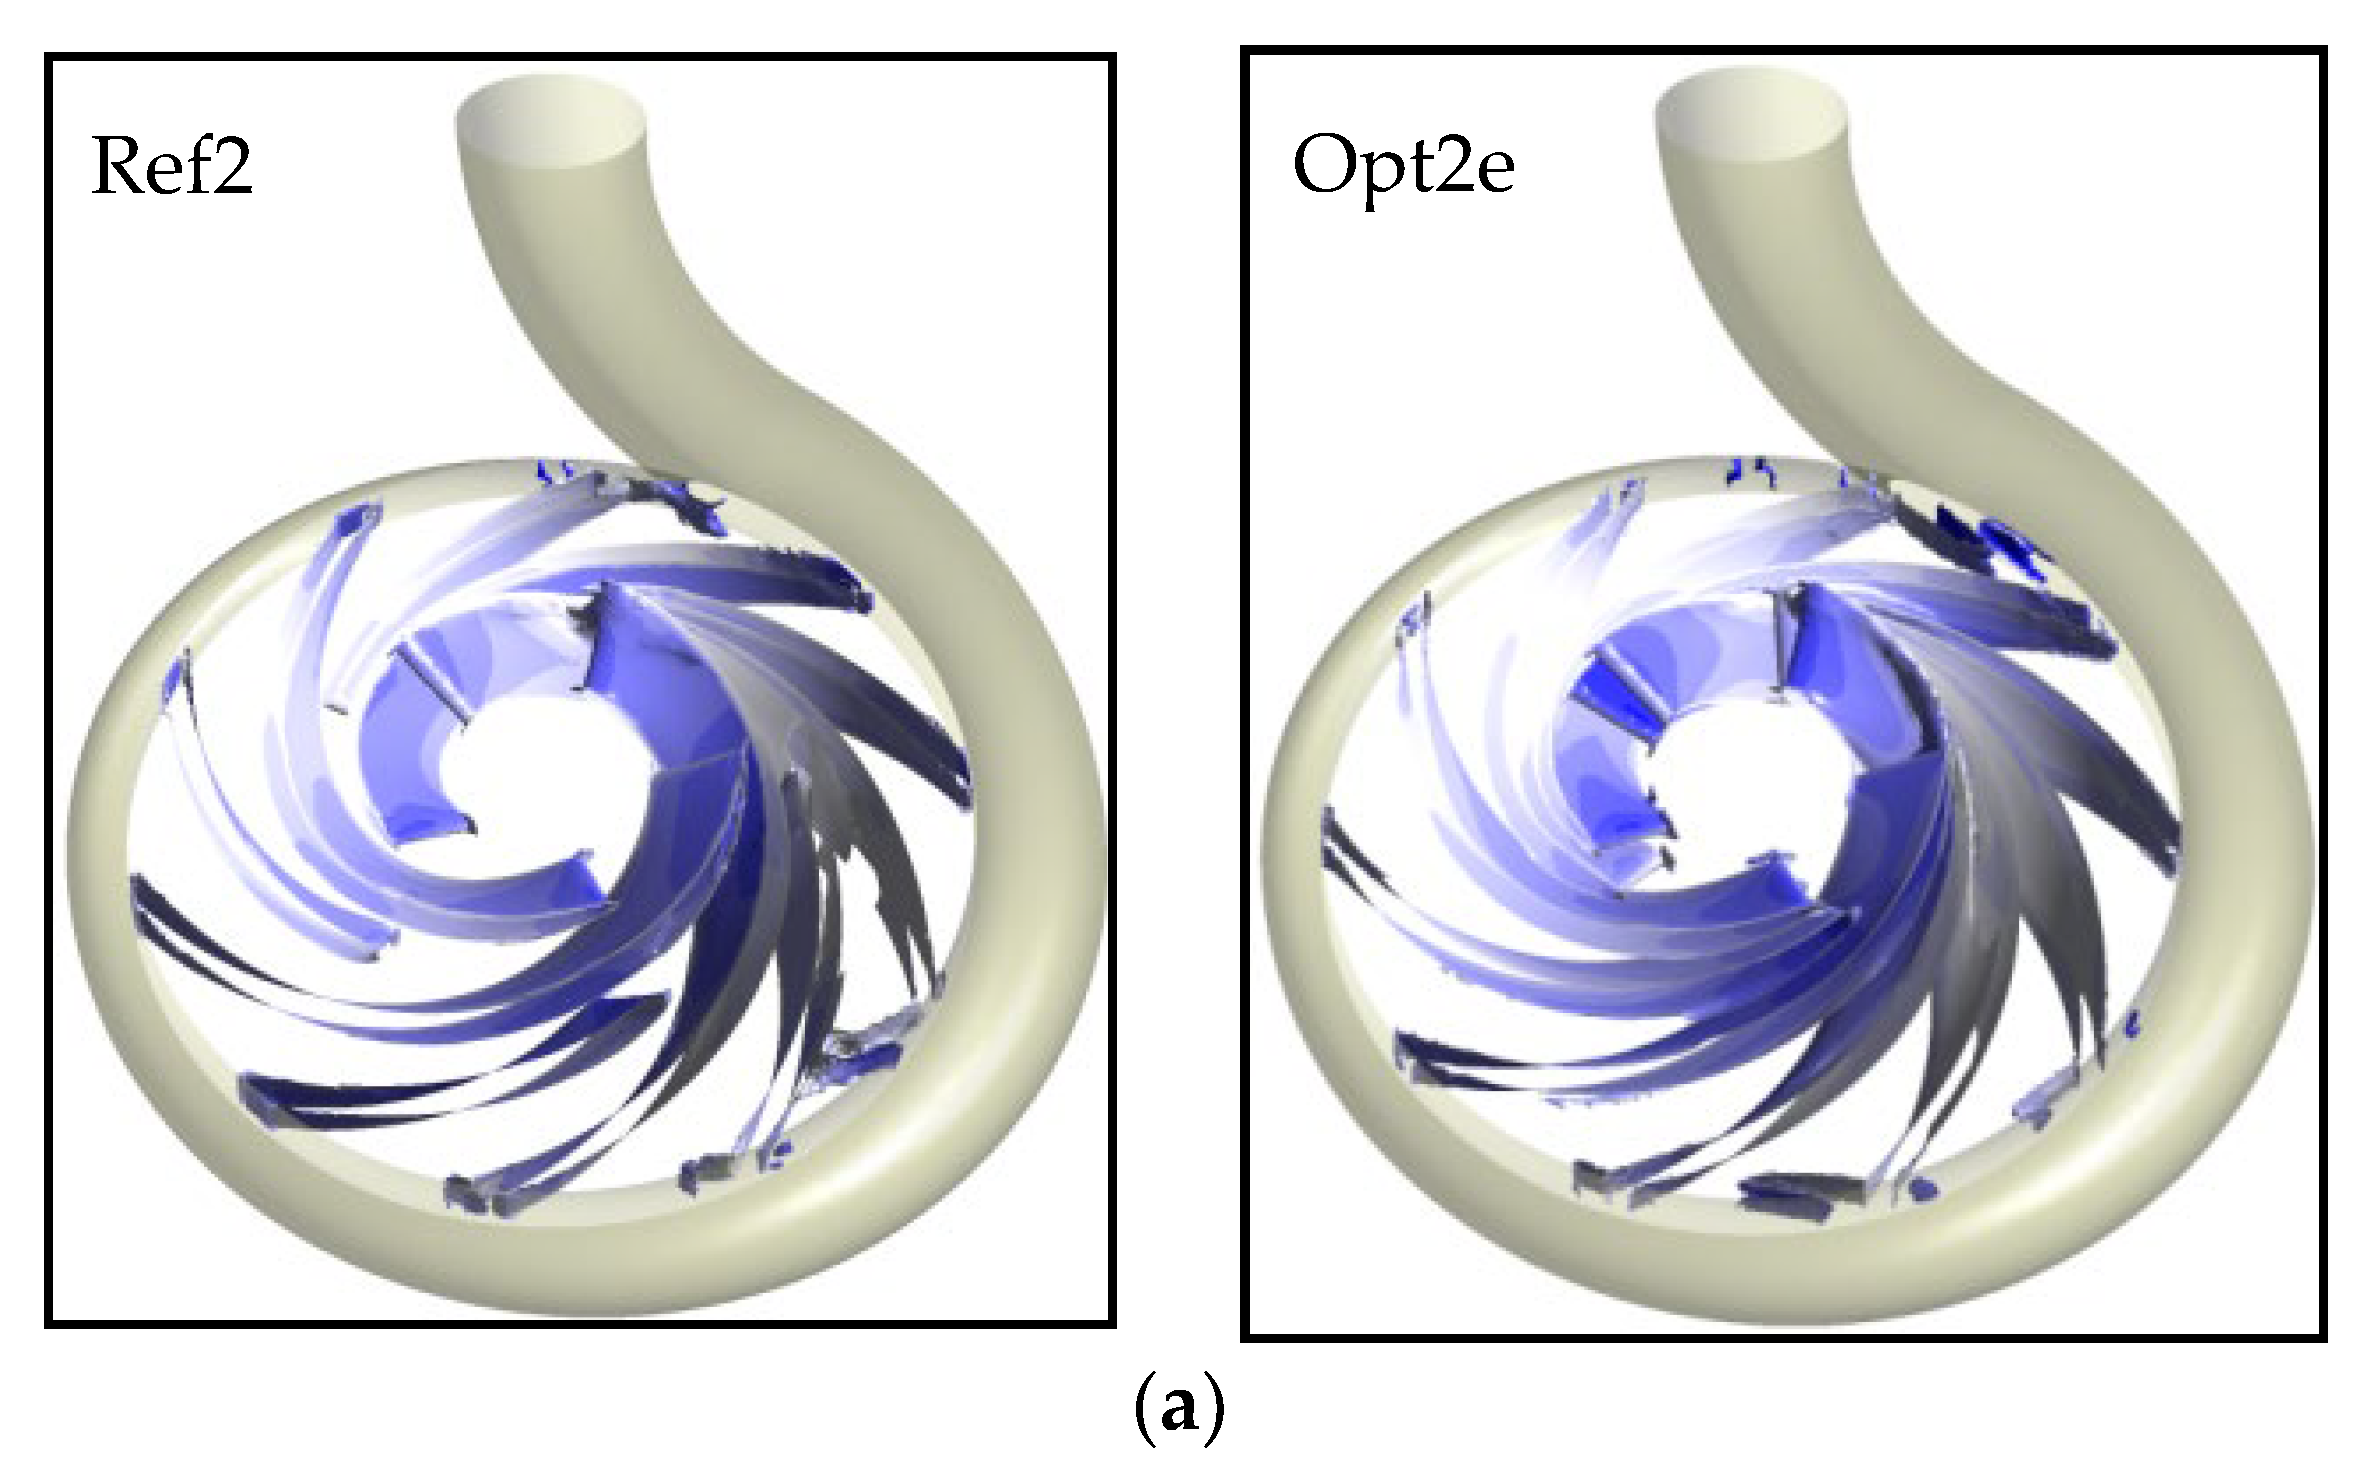
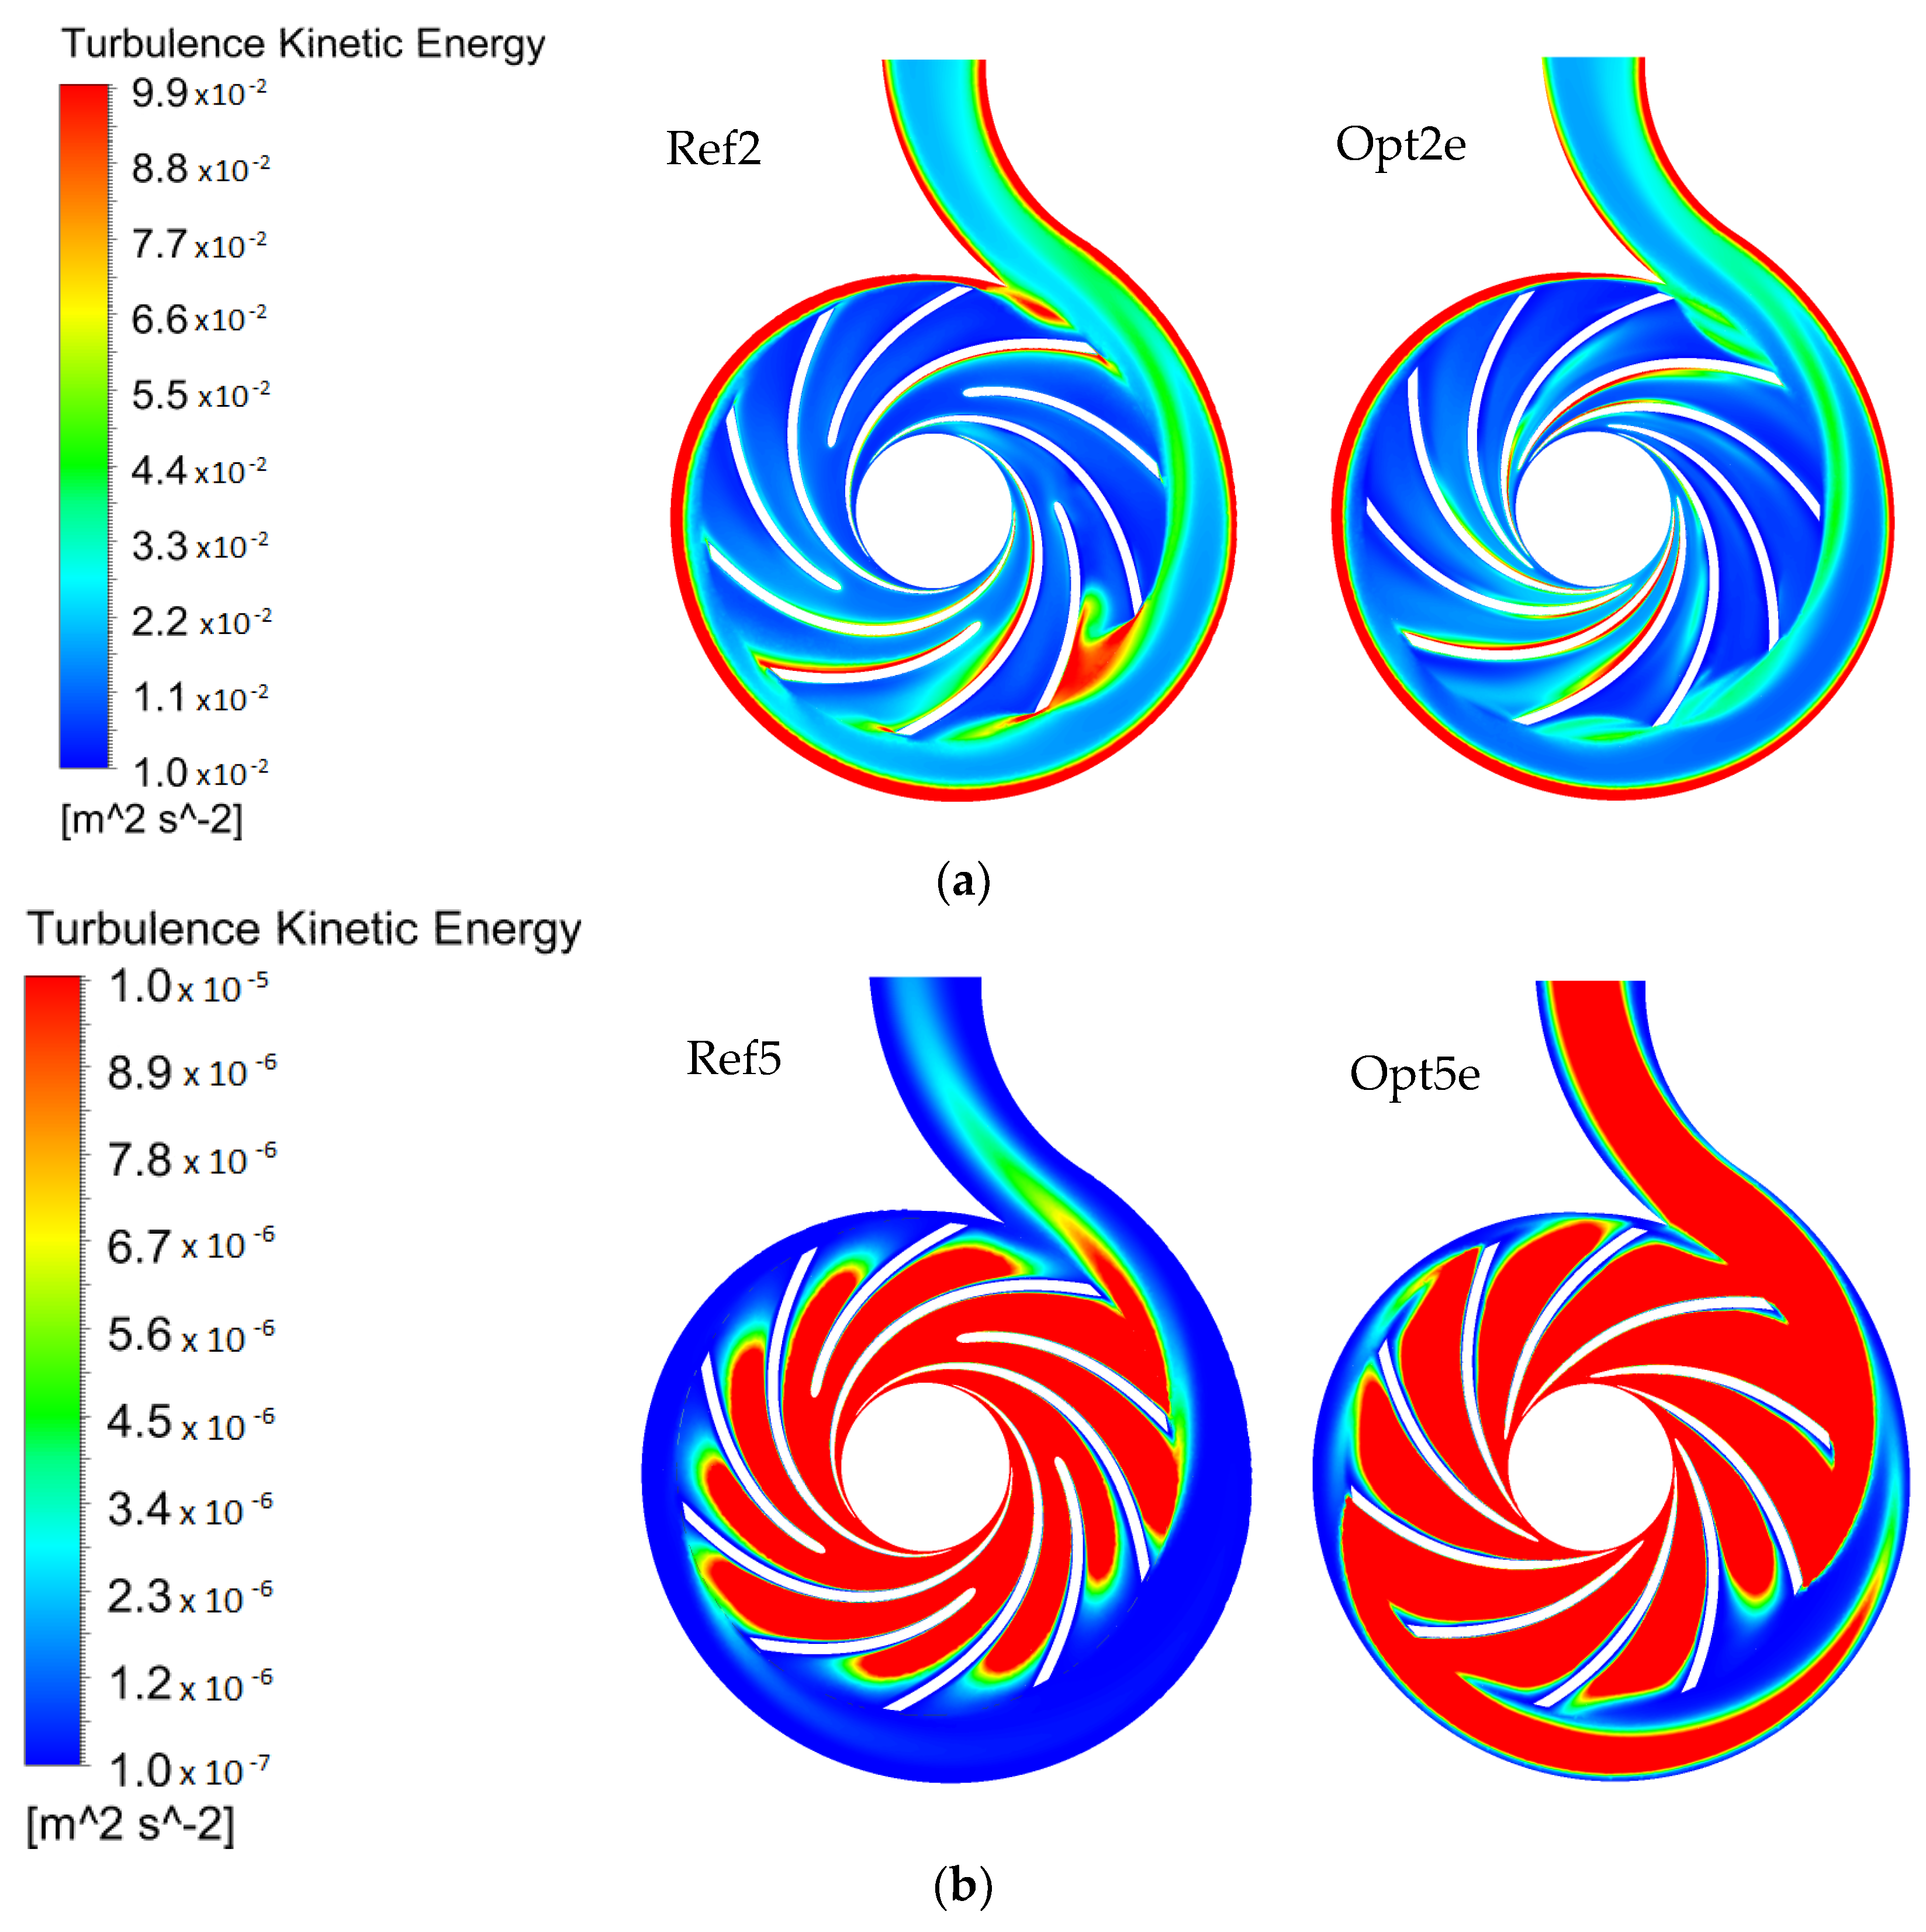
5.5. Turbulent Characteristics
5.6. Effect of Viscosity on Pump Performance
6. Conclusions
Author Contributions
Funding
Institutional Review Board Statement
Informed Consent Statement
Data Availability Statement
Conflicts of Interest
References
- Bellary, S.A.I.; Samad, A. Pumping crude oil by centrifugal impeller having different blade angles and surface roughness. J. Pet. Explor. Prod. Technol. 2015, 6, 117–127. [Google Scholar] [CrossRef]
- Gülich, J. Pumping highly viscous fluids with centrifugal pumps—Part 2. World Pumps 1999, 1999, 39–42. [Google Scholar] [CrossRef]
- Li, W.-G. Effects of viscosity of fluids on centrifugal pump performance and flow pattern in the impeller. Int. J. Heat Fluid Flow 2000, 21, 207–212. [Google Scholar] [CrossRef]
- Varley, F.A. Effects of Impeller Design and Surface Roughness on the Performance of Centrifugal Pumps. Proc. Inst. Mech. Eng. 1961, 175, 955–989. [Google Scholar] [CrossRef]
- Shao, C.; Zhao, Y. Numerical study of the dimensionless characteristics and modeling experiment of a molten salt pump that transports viscous fluids. Int. J. Numer. Methods Heat Fluid Flow 2017, 27, 2131–2153. [Google Scholar] [CrossRef]
- ANSI/HI 1.3-2013; Rotodynamic Centrifugal Pumps for Design and Application (Manual). Hydraulic Institute: Parisippany, NJ, USA, 2005.
- Ofuchi, E.; Cubas, J.; Stel, H.; Dunaiski, R.; Vieira, T.; Morales, R. A new model to predict the head degradation of centrifugal pumps handling highly viscous flows. J. Pet. Sci. Eng. 2020, 187, 106737. [Google Scholar] [CrossRef]
- Tan, L.; Zhu, B.; Cao, S.; Bing, H.; Wang, Y. Influence of blade wrap angle on centrifugal pump performance by numerical and experimental study. Chin. J. Mech. Eng. 2014, 27, 171–177. [Google Scholar] [CrossRef]
- Westra, R.W.; Broersma, L.; Van Andel, K.; Kruyt, N.P. PIV Measurements and CFD Computations of Secondary Flow in a Centrifugal Pump Impeller. J. Fluids Eng. 2010, 132, 061104. [Google Scholar] [CrossRef]
- Liu, J.; Li, Z.; Wang, L.; Jiao, L. Numerical Simulation of the Transient Flow in a Radial Flow Pump during Stopping Period. J. Fluids Eng. 2011, 133, 111101. [Google Scholar] [CrossRef]
- Stepanoff, A.J. Centrifugal and Axial Flow Pumps: Theory, Design and Application, 2nd ed.; Chapman and Hall: London, UK, 1957; Available online: https://cir.nii.ac.jp/crid/1573387449864191104 (accessed on 17 August 2022).
- Li, X.; Gao, P.; Zhu, Z.; Li, Y. Effect of the blade loading distribution on hydrodynamic performance of a centrifugal pump with cylindrical blades. J. Mech. Sci. Technol. 2018, 32, 1161–1170. [Google Scholar] [CrossRef]
- Peck, J. Investigations Concerning Flow Conditions in a Centrifugal Pump, and the Effect of Blade Loading on Head Slip. Proc. Inst. Mech. Eng. 1951, 164, 1–30. [Google Scholar] [CrossRef]
- Abramian, M.; Howard, J.H.G. Experimental Investigation of the Steady and Unsteady Relative Flow in a Model Centrifugal Impeller Passage. J. Turbomach. 1994, 116, 269–279. [Google Scholar] [CrossRef]
- Miyamoto, H.; Nakashima, Y.; Ohba, H. Effects of Splitter Blades on the Flows and Characteristics in Centrifugal Impellers. JSME Int. J. 1992, 35, 238–246. [Google Scholar] [CrossRef]
- Siddique, M.H.; Samad, A.; Hossain, S. Centrifugal pump performance enhancement: Effect of splitter blade and optimization. Proc. Inst. Mech. Eng. Part A J. Power Energy 2021, 236, 391–402. [Google Scholar] [CrossRef]
- Gölcü, M.; Usta, N.; Pancar, Y. Effects of Splitter Blades on Deep Well Pump Performance. J. Energy Resour. Technol. 2007, 129, 169–176. [Google Scholar] [CrossRef]
- Kergourlay, G.; Younsi, M.; Bakir, F.; Rey, R. Influence of Splitter Blades on the Flow Field of a Centrifugal Pump: Test-Analysis Comparison. Int. J. Rotating Mach. 2007, 2007, 85024. [Google Scholar] [CrossRef]
- Shigemitsu, T.; Fukutomi, J.; Kaji, K.; Wada, T. Performance and Internal Flow Condition of Mini Centrifugal Pump with Splitter Blades. Int. J. Fluid Mach. Syst. 2013, 6, 11–17. [Google Scholar] [CrossRef]
- Namazizadeh, M.; Gevari, M.T.; Mojaddam, M.; Vajdi, M. Optimization of the Splitter Blade Configuration and Geometry of a Centrifugal Pump Impeller using Design of Experiment. J. Appl. Fluid Mech. 2020, 13, 89–101. [Google Scholar] [CrossRef]
- Korkmaz, E.; Gölcü, M.; Kurbanoğlu, C. Effects of Blade Discharge Angle, Blade Number and Splitter Blade Length on Deep Well Pump Performance. J. Appl. Fluid Mech. 2017, 10, 529–540. [Google Scholar] [CrossRef]
- Xie, X.; Li, Z.; Zhu, B.; Wang, H.; Zhang, W. Multi-objective optimization design of a centrifugal impeller by positioning splitters using GMDH, NSGA-III and entropy weight-TOPSIS. J. Mech. Sci. Technol. 2021, 35, 2021–2034. [Google Scholar] [CrossRef]
- Kim, B.; Tse, K.; Chen, Z.; Park, H.S. Multi-objective optimization of a structural link for a linked tall building system. J. Build. Eng. 2020, 31, 101382. [Google Scholar] [CrossRef]
- Ezhilsabareesh, K.; Rhee, S.H.; Samad, A. Shape optimization of a bidirectional impulse turbine via surrogate models. Eng. Appl. Comput. Fluid Mech. 2017, 12, 1–12. [Google Scholar] [CrossRef]
- Trejo, A.; Martín, M.J.; Gómez-Quintana, A.; Cava, R.; García-Parra, J.J.; Ramírez, M.R. Effect of slicing of top quality (Montanera) Iberian dry-cured chorizo on the stability to high pressure treatment and storage. J. Food Sci. 2021, 86, 1963–1978. [Google Scholar] [CrossRef] [PubMed]
- Jaiswal, A.K.; Siddique, H.; Paul, A.R.; Samad, A. Surrogate-based design optimization of a centrifugal pump impeller. Eng. Optim. 2021, 54, 1395–1412. [Google Scholar] [CrossRef]
- Kim, B.-R.; Choi, S.-W. Selection of the Number and Location of Monitoring Sensors using Artificial Neural Network based on Building Structure-System Identification. J. Comput. Struct. Eng. Inst. Korea 2020, 33, 303–310. [Google Scholar] [CrossRef]
- Derakhshan, S.; Bashiri, M. Investigation of an efficient shape optimization procedure for centrifugal pump impeller using eagle strategy algorithm and ANN (case study: Slurry flow). Struct. Multidiscip. Optim. 2018, 58, 459–473. [Google Scholar] [CrossRef]
- Gileva, L.V.; Aksenov, A.A.; Kozhukhov, Y.V.; Petrov, A.Y. The study of Y+ influence on the results of ANSYS CFX flow simulation in the centrifugal compressor radial inlet. AIP Conf. Proc. 2020, 2285, 030038. [Google Scholar] [CrossRef]
- Al-Besharah, J.M.; Salman, O.A.; Akashah, S.A. Viscosity of crude oil blends. Ind. Eng. Chem. Res. 1987, 26, 2445–2449. [Google Scholar] [CrossRef]
- Deb, K.; Pratap, A.; Agarwal, S.; Meyarivan, T. A fast and elitist multiobjective genetic algorithm: NSGA-II. IEEE Trans. Evol. Comput. 2002, 6, 182–197. [Google Scholar] [CrossRef]
- Gulich, J.F. Centrifugal Pumps, 2nd ed.; Springer Publications: Berlin, Germany, 2010. [Google Scholar]
- Safikhani, H.; Khalkhali, A.; Farajpoor, M. Pareto Based Multi-Objective Optimization of Centrifugal Pumps Using CFD, Neural Networks and Genetic Algorithms. Eng. Appl. Comput. Fluid Mech. 2011, 5, 37–48. [Google Scholar] [CrossRef] [Green Version]
- Pourrahmani, H.; Siavashi, M.; Moghimi, M. Design optimization and thermal management of the PEMFC using artificial neural networks. Energy 2019, 182, 443–459. [Google Scholar] [CrossRef]
- Gülich, J.F. Disk friction losses of closed turbomachine impellers. Forsch. Im Ing./Eng. Res. 2003, 68, 87–95. [Google Scholar] [CrossRef]
- Cavazzini, G.; Pavesi, G.; Santolin, A.; Ardizzon, G.; Lorenzi, R. Using splitter blades to improve suction performance of centrifugal impeller pumps. Proc. Inst. Mech. Eng. Part A J. Power Energy 2014, 229, 309–323. [Google Scholar] [CrossRef]
- Zhang, Z.; Chen, H.; Yin, J.; Ma, Z.; Gu, Q.; Lu, J.; Liu, H. Unsteady flow characteristics in centrifugal pump based on proper orthogonal decomposition method. Phys. Fluids 2021, 33, 075122. [Google Scholar] [CrossRef]
- Wang, Y.; Yang, H.; Chen, B.; Gao, P.; Chen, H.; Zhu, Z. Analysis of vortices formed in flow passage of a five-bladed centrifugal water pump by means of PIV method. AIP Adv. 2019, 9, 075011. [Google Scholar] [CrossRef] [Green Version]


| Authors | Description | Outcome |
|---|---|---|
| Golcu et al., 2007 [16] | Experimental study for centrifugal pump for water application; modified number of blades and splitter length | Splitter blade improves pump performance for a small number of blades |
| Shigemitsu et al., 2013 [19] | Numerical and experimental investigation of mini semi-open impeller; addition of splitter blades at high outlet angle of impeller blades | Back-flow region suppressed, vortex loss at volute casing decreased |
| Cavazzini et al., 2015 [21] | Numerical and experimental testing of centrifugal pump for water; addition of splitter blades | Improved cavitation performance at high flowrate |
| An et al., 2016 [22] | Numerical simulation and optimization of centrifugal pump impeller; modified main blade and splitter profile using Bezier curves | Pump performance improved by reducing secondary flow |
| Korkmaz, et al., 2017 [23] | Experimental analysis of centrifugal pump impeller; modified of number of blades, outlet blade angle, and splitter length | Modifying outlet blade angle and at particular splitter length give high pump performance while pumping water |
| Namazizadeh et al., 2020 [20] | Numerical simulation and experimental testing of centrifugal pump for water; modified splitter length and position from main blade varied | Adding splitter blades improves pump head with negligible efficiency change |
| Xie et al., 2021 [24] | experimental testing of centrifugal pump impeller; optimization of splitter blade length | Optimized location of splitter blade, nonuniformity, maximum equivalent stress of the blade decreased |
| Siddique et al., 2021 [17] | Numerical and experimental testing of centrifugal pump for water; number of blades, splitter length, wrap angle modified | Through optimization shape and length of splitter blade presented, which improved pump performance |
| Parameters | Dimensions |
|---|---|
| Suction pipe diameter, ds | 50 mm |
| Delivery pipe diameter, dd | 32 mm |
| Shaft diameter, ds | 24 mm |
| Impeller outlet diameter, Do | 142 mm |
| Number of blades, z | 5 |
| Inlet blade angle at hub, β1sh | 40 |
| Inlet blade angle at shroud, β1h | 10 |
| Outlet blade angle, β2 | 36 |
| Blade thickness, t | 3 mm |
| Base circle diameter of volute casing, Db | 147 mm |
| Instruments | Range |
|---|---|
| Pressure gauge | 0.1–2.0 bar ± 0.5% |
| Flowmeter | 10–380 L/min ± 1% |
| Tachometer | 0–10,000 rpm ± 0.25% |
| Power meter | 0–1000 watt ± 0.25% |
| Pumping Fluids | Density (kg/m3) | ⁰API | Dynamic Viscosity (mPaS) |
|---|---|---|---|
| Water | 1000 | 10 | 1 |
| C1 | 805 | 44.3 | 4.5 |
| C2 | 814 | 42.3 | 14 |
| C3 | 827 | 39.6 | 26 |
| C4 | 855 | 33.8 | 65 |
| Cases | H-PRED | Ψ-PRED | H-CFD | Ψ-CFD | RMSD |
|---|---|---|---|---|---|
| Opt1a | 5.603 | 178.0 | 5.582 | 178.1 | 0.07 |
| Opt1e | 5.652 | 179.7 | 5.643 | 179.9 | 0.14 |
| Opt2a | 5.351 | 167.5 | 5.351 | 168.2 | 0.49 |
| Opt2e | 5.495 | 169.5 | 5.453 | 169.4 | 0.08 |
| Opt3a | 5.356 | 169.1 | 5.318 | 168.7 | 0.28 |
| Opt3e | 5.36 | 169.3 | 5.354 | 170.3 | 0.71 |
| Opt4a | 4.896 | 166.4 | 4.918 | 166.3 | 0.07 |
| Opt4e | 5.140 | 170.4 | 5.128 | 170.1 | 0.21 |
| Optimal Designs | X1 | X2 | H | Ψ |
|---|---|---|---|---|
| Ref1 | - | - | 5.22 | 171.4 |
| Opt1a | 0.57 | 170 | 5.58 | 178.1 |
| Opt1e | 0.49 | 174 | 5.64 | 179.9 |
| Ref2 | 0.57 | 170 | 5.13 | 150.2 |
| Opt2a | 0.21 | 175 | 5.35 | 169.4 |
| Opt2e | 0.89 | 145 | 5.57 | 176.4 |
| Ref3 | 0.57 | 170 | 4.86 | 159.9 |
| Opt3a | 0.33 | 168 | 5.32 | 168.7 |
| Opt3e | 0.85 | 128 | 5.35 | 170.3 |
| Ref4 | 0.57 | 170 | 4.54 | 161.1 |
| Opt4a | 0.89 | 161 | 4.90 | 166.3 |
| Opt4e | 0.90 | 102 | 5.13 | 170.1 |
Publisher’s Note: MDPI stays neutral with regard to jurisdictional claims in published maps and institutional affiliations. |
© 2022 by the authors. Licensee MDPI, Basel, Switzerland. This article is an open access article distributed under the terms and conditions of the Creative Commons Attribution (CC BY) license (https://creativecommons.org/licenses/by/4.0/).
Share and Cite
Kim, B.; Siddique, M.H.; Samad, A.; Hu, G.; Lee, D.-E. Optimization of Centrifugal Pump Impeller for Pumping Viscous Fluids Using Direct Design Optimization Technique. Machines 2022, 10, 774. https://doi.org/10.3390/machines10090774
Kim B, Siddique MH, Samad A, Hu G, Lee D-E. Optimization of Centrifugal Pump Impeller for Pumping Viscous Fluids Using Direct Design Optimization Technique. Machines. 2022; 10(9):774. https://doi.org/10.3390/machines10090774
Chicago/Turabian StyleKim, Bubryur, Mohammed Hamid Siddique, Abdus Samad, Gang Hu, and Dong-Eun Lee. 2022. "Optimization of Centrifugal Pump Impeller for Pumping Viscous Fluids Using Direct Design Optimization Technique" Machines 10, no. 9: 774. https://doi.org/10.3390/machines10090774
APA StyleKim, B., Siddique, M. H., Samad, A., Hu, G., & Lee, D.-E. (2022). Optimization of Centrifugal Pump Impeller for Pumping Viscous Fluids Using Direct Design Optimization Technique. Machines, 10(9), 774. https://doi.org/10.3390/machines10090774