Article

Analysis and Compensation Control of Engine Valve Response Delay Based on the Electro-Hydraulic Variable Valve Actuator

College of Power and Energy Engineering, Harbin Engineering University, Harbin 150001, China
*
Author to whom correspondence should be addressed.
Machines 2022, 10(8), 701; https://doi.org/10.3390/machines10080701
Submission received: 24 July 2022 / Revised: 14 August 2022 / Accepted: 16 August 2022 / Published: 17 August 2022
(This article belongs to the Section Electrical Machines and Drives)

Abstract

:
The time delay of variable valve actuators has a significant influence on engine valve lift tracking performance. For camless hydraulic valve actuators, engine valve response is affected by many factors, such as friction and control valve response. In this paper, engine valve response delay is investigated in depth. Experiment results show that engine valve motion delay can be divided into valve open delay and valve close delay. They are different even in the same engine cycle. Complicated delay characteristics make it difficult to build an accurate delay model. In this paper, a data-based delay observer is developed. To compensate the nonlinear valve delay, the virtual desired valve lift is designed. By synthesizing the virtual valve lift into the backstepping procedure, an engine valve lift tracking controller with delay compensation is developed. Compared with the P controller, the backstepping controller with delay compensation improved the engine valve lift tracking performance significantly. The experiment results show that the valve open error can be reduced by 18.33% and the valve close error can be reduced by 4% at least both at stable conditions and transient conditions. At stable conditions, the valve open error is not more than 0.39 °CA, and the valve close error is not more than 0.44 °CA.

1. Introduction

Engine variable valve timing technology (VVT) has come a long way over the past few decades. Many VVT actuators based on the camshaft were applied in engines [1,2]. However, there are also some deficiencies of camshaft-based VVT actuators. Generally, for camshaft-driven actuators, only engine valve timing is variable, and the variable range is very small [2,3]. With the development of sensors, microelectronics and manufacture, some camless variable valve actuators (CVVAs) were developed [4,5]. For CVVAs, engine valves are driven by independent actuators (electro-hydraulic [6], electro-pneumatic [7], electromagnetic [8], motor [9], etc.). Thus, the engine valve timing, velocity and valve lift are variable. With CVVAs, engine valve lifts are no longer limited by valve cams, and flexible valve lifts are tracked easily. Therefore, engine performance can be improved significantly [7,8,10].
For medium- and high-speed diesel engines, the valve spring stiffness and lifts are greater than those for gasoline engines. Therefore, hydraulic variable valve actuators (HVVAs) which can provide greater driven force and valve lift are the best solutions. Studies showed engine valve timing moment has a great influence on engine performance [11,12]. However, the engine valve response delay is caused by many factors, such as control valve delay, control valve dead-zone, actuator friction force and valve spring pre-tightening. Given the complex valve response delay of HVVAs, ensuring the accurate engine valve timing moment is one of the most important challenges [11,13]. This paper focuses on the engine valve response delay analysis and its compensation with HVVAs.
The time delay of hydraulic systems has a great effect on system control performance and stability [14]. To compensate system delay, some advanced strategies have been developed. The Smith predictor has been widely used in pure delay systems. In [15], a Smith predictor was used in a fluid temperature control system. In [16], a Smith predictor was used to compensate time delay of hardware-in-the-loop testing of an electro-hydraulic fuel control unit for a turbojet engine. In [17], an adaptive Smith-predictor controller was proposed to deal with variable process dynamics. The Smith predictor has improved system control performance for constant system delay. The IAE and IAC can be reduced by 24.3% and 57.38%, respectively. However, for complex nonlinear variable delay, the Smith predictor is not suitable. To solve complex delay, many delay observers have been developed. In [18], the delay estimation was applied to a pump-controlled electro-hydraulic actuator, and the tracking error could be reduced from ±1 mm to ±0.4 mm. In [19], a relatively large time delay for the VTOL aircraft in the outputs was tested in a numerical simulation, and the simulation results showed the effectiveness of the proposed observer. In [20], Sadath and Vyasarayani proposed a method of converting the delay integrodifferential equations into a system of ordinary differential equations. In [21], the framework of the Lyapunov–Krasovskii functional was extended to deal with the problem of exponential stabilization for a class of linear parabolic DPSs with time-varying delay and a spatiotemporal control input. Despite the progress of delay observers, model-based delay observers are generally difficult to accurately model for time-varying nonlinear delay systems, which prevents the realization of delay observers in complex nonlinear systems. To solve the time delay of time-varying nonlinear delay systems, this paper proposed a data-based delay observer, which is used in the repeat tracking events.
To compensate system delay, the delay observers are synthesized into many advanced controllers, such as sliding model control, adaptive control and backstepping control. In [22], the delay observer was synthesized into a sliding mode controller. In [23], Lu proposed a receding horizon control (RHC) algorithm for a class of time delay systems; it estimates system state delays online and produces the stabilizable control input for state-delay estimation errors. In [24], the unknown time delays which exist in each system state were compensated in the backstepping process with the novel Lyapunov–Krasovkii functional and appropriate control gain function. For a hydraulic system, in addition to system delay, there are many nonlinear factors to consider, such as actuator leakage, nonlinear friction and hydraulic valve dead-zone. Backstepping control, which can compensate most nonlinear factors during recursive steps, is one of the most popular solutions for dealing with nonlinear systems [25,26]. In [25], compared with the PD controller, the mean positioning accuracy (MPA), absolute positioning accuracy (APA), weighted position accuracy (WPA), saturation index (SAT), robustness index (RI) and composite index (CI) were all reduced.
The paper focuses on the engine valve lift tracking control based on the electro-hydraulic actuator. To compensate the engine valve response delay, a data-based delay observer is designed. In addition, the proportional valve dead-zone, system uncertainties and system friction force are synthesized into a backstepping controller.
For engine valve response delay compensation, the paper has the following technical novelties:
(1)
The engine valve response delay for camless hydraulic valve actuators is analyzed in detail, and a date-based delay observer is designed.
(2)
A delay compensation strategy which builds the virtual desired valve lift is proposed, and a backstepping controller with a virtual engine valve lift is designed. The virtual desired lift is used to calculate the input signal based on the system model, and the actual desired valve lift is used to calculate tracking errors.
The paper is organized as follows: The HVVA system and the engine valve response delay analysis are shown in Section 2. A delay compensation strategy is proposed in Section 3. The control-oriented system model is given in Section 3. A backstepping controller with delay compensation is developed in Section 4. Section 5 reveals experiment comparisons between the P controller and the controller proposed in this paper. Finally, some conclusions are given in Section 6.

2. HVVA Overview and Engine Valve Delay Analysis

2.1. HVVA System Overview

The HVVA schematic and prototype are shown in Figure 1. The engine valve is controlled by the proportional valve (Parker D1FP). The driven actuator is an asymmetric cylinder. When the proportional valve receives a positive signal, the engine valve is opened under the action of pressurized oil. When the proportional valve receives a negative signal, the engine valve is closed under the action of the engine valve spring force. The engine valve lift signal can be measured by a laser displacement sensor (micro-epsilon 2300). The proportional valve piston displacement can be obtained by the LVDT sensor integrated into the proportional valve body. All signals are sampled by differential strategy. HVVA parameters can be founded in Table 1. The main system parameters are shown in Table 2.

2.2. Engine Valve Response Delay Analysis

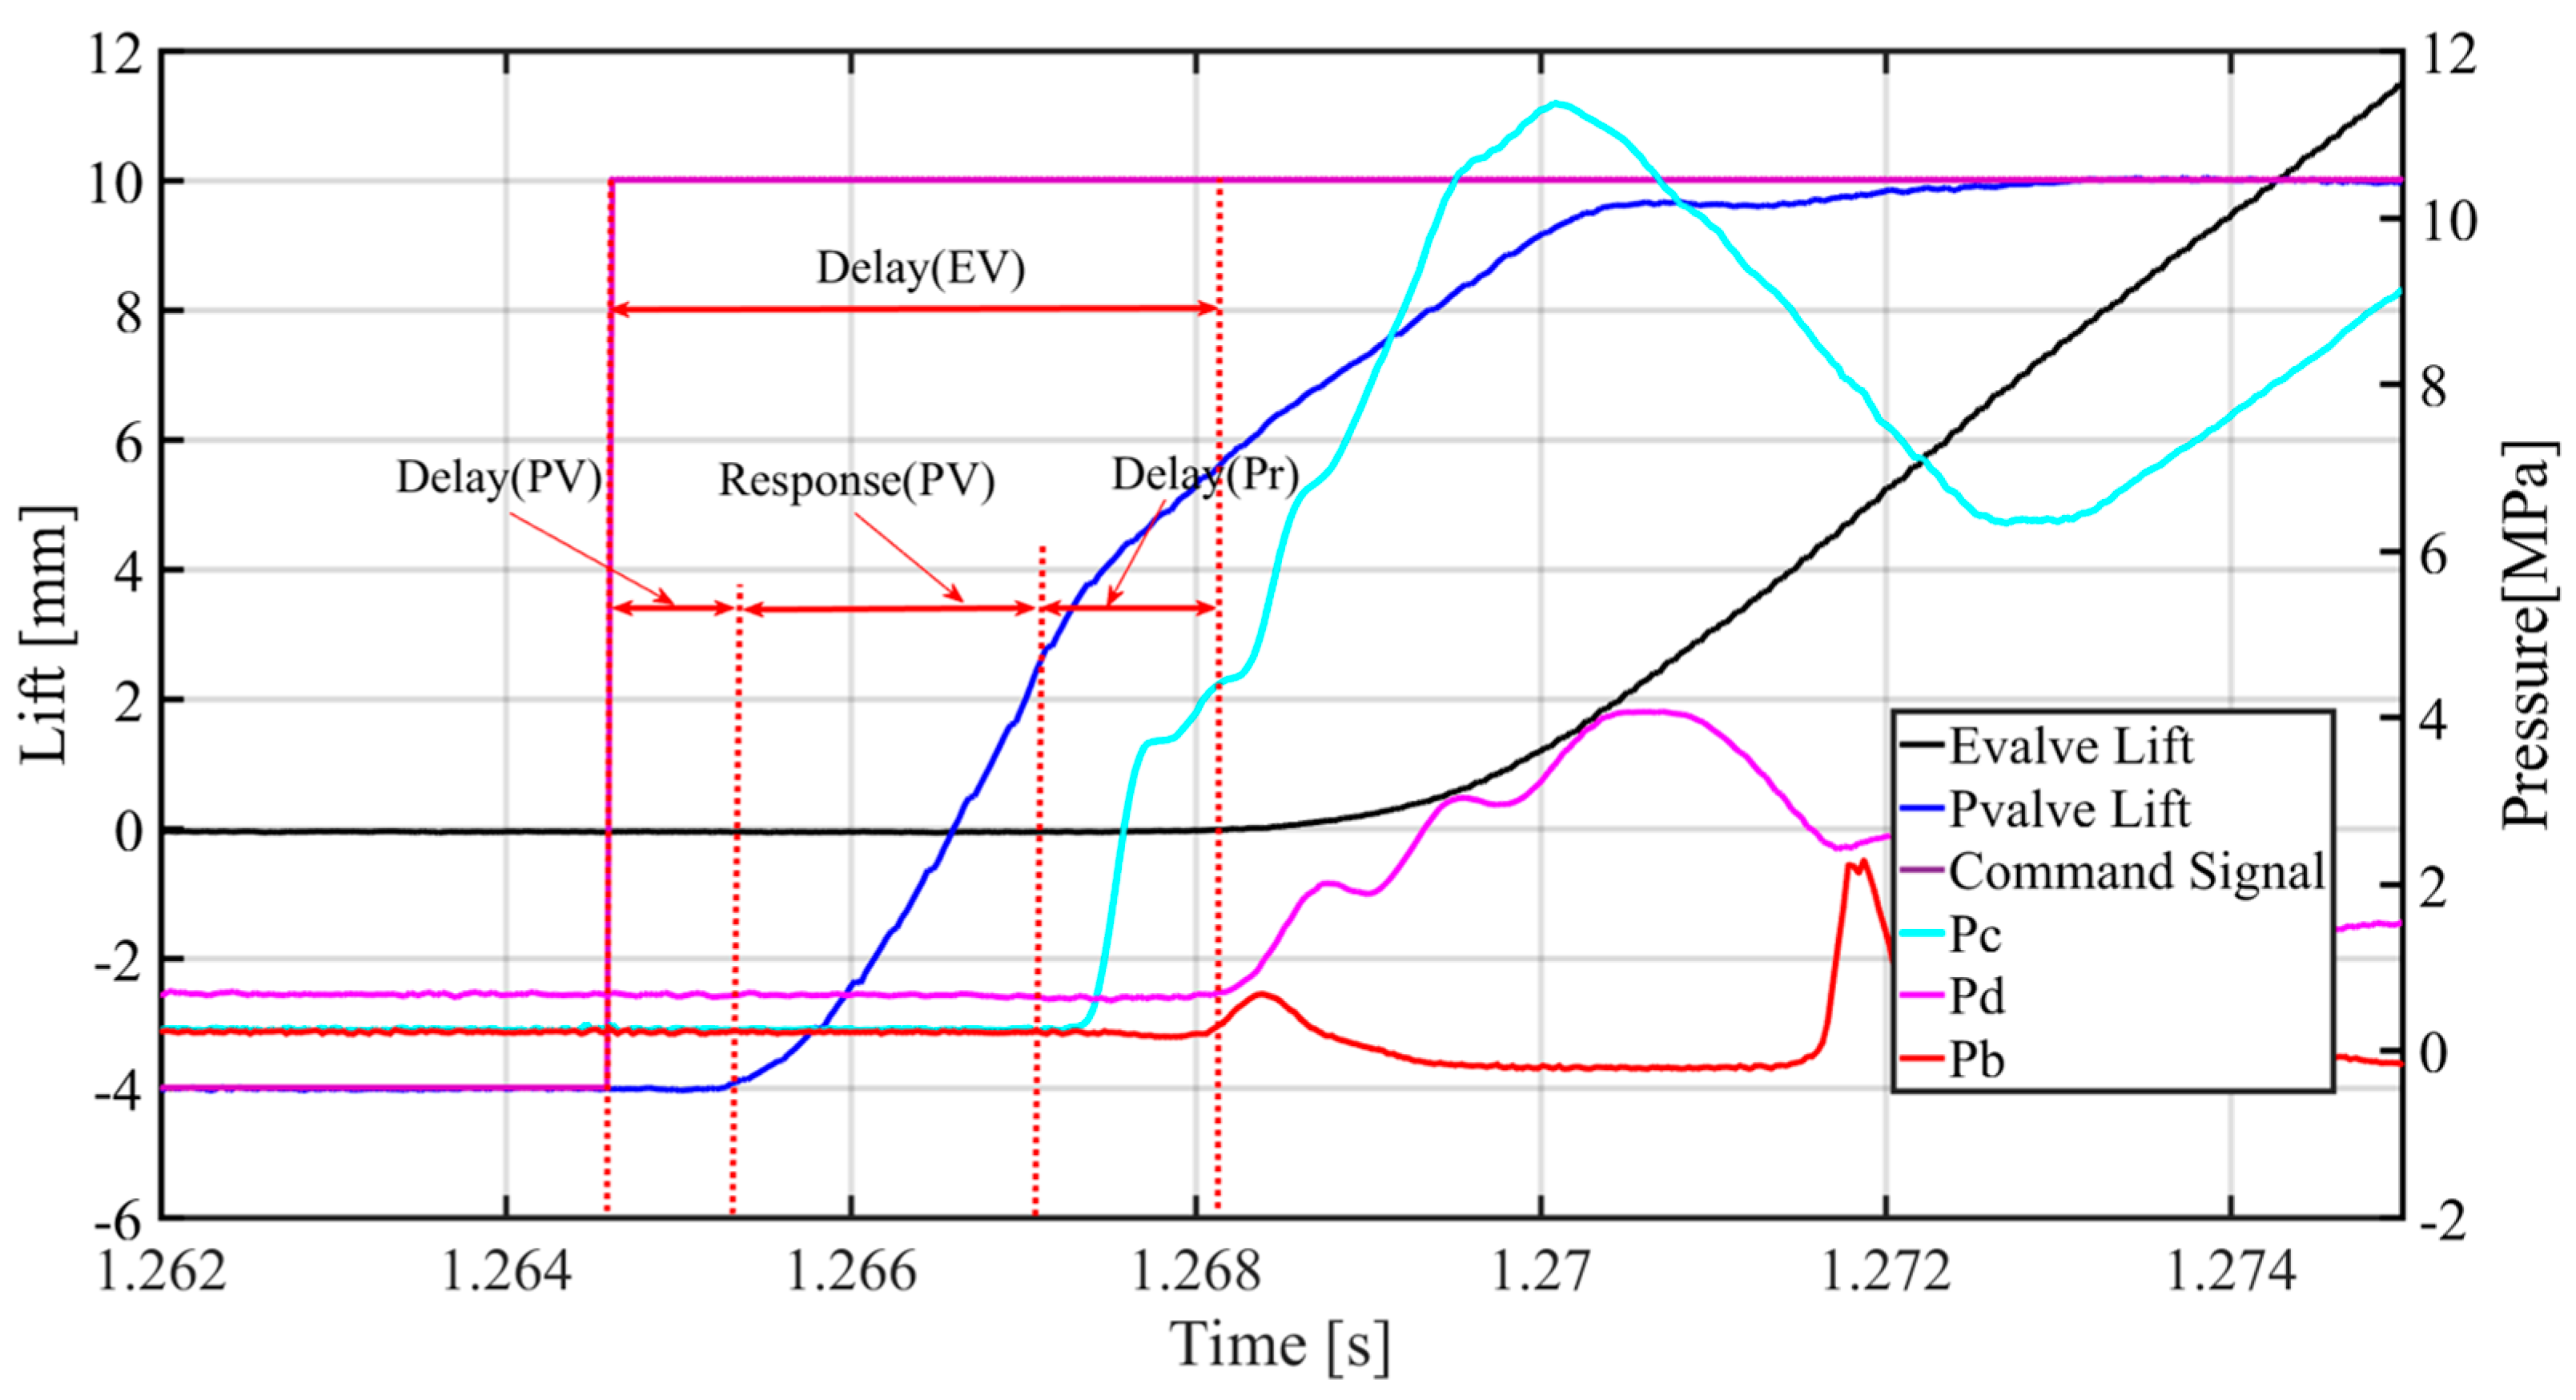
Engine valve response delay is caused by many factors. A typical engine valve response is shown in Figure 2.
The “Evalve lift” is engine valve lift; “Pvalve lift” is proportional valve spool displacement; “Pb”, “Pc” and “Pd” are oil pressures in Chamber B, Chamber C and Chamber D, respectively. The engine valve delay can be calculated by:
D e l a y   ( E V ) = D e l a y ( P V ) + R e s p o n s e   ( P V ) + D e l a y   ( P r )
where D e l a y   ( E V ) is the engine valve response delay; D e l a y ( P V ) is the proportional valve response delay; R e s p o n s e   ( P V ) is the time for the proportional valve spool to start moving until it reaches the dead zone; D e l a y   ( P r ) is the pressure building-up time, that is, from the moment when the high-pressure oil is injected into Chamber C (the moment when the proportional valve crosses the dead zone) to the moment when the hydraulic force is greater than the sum of the spring preload and the maximum static friction force.
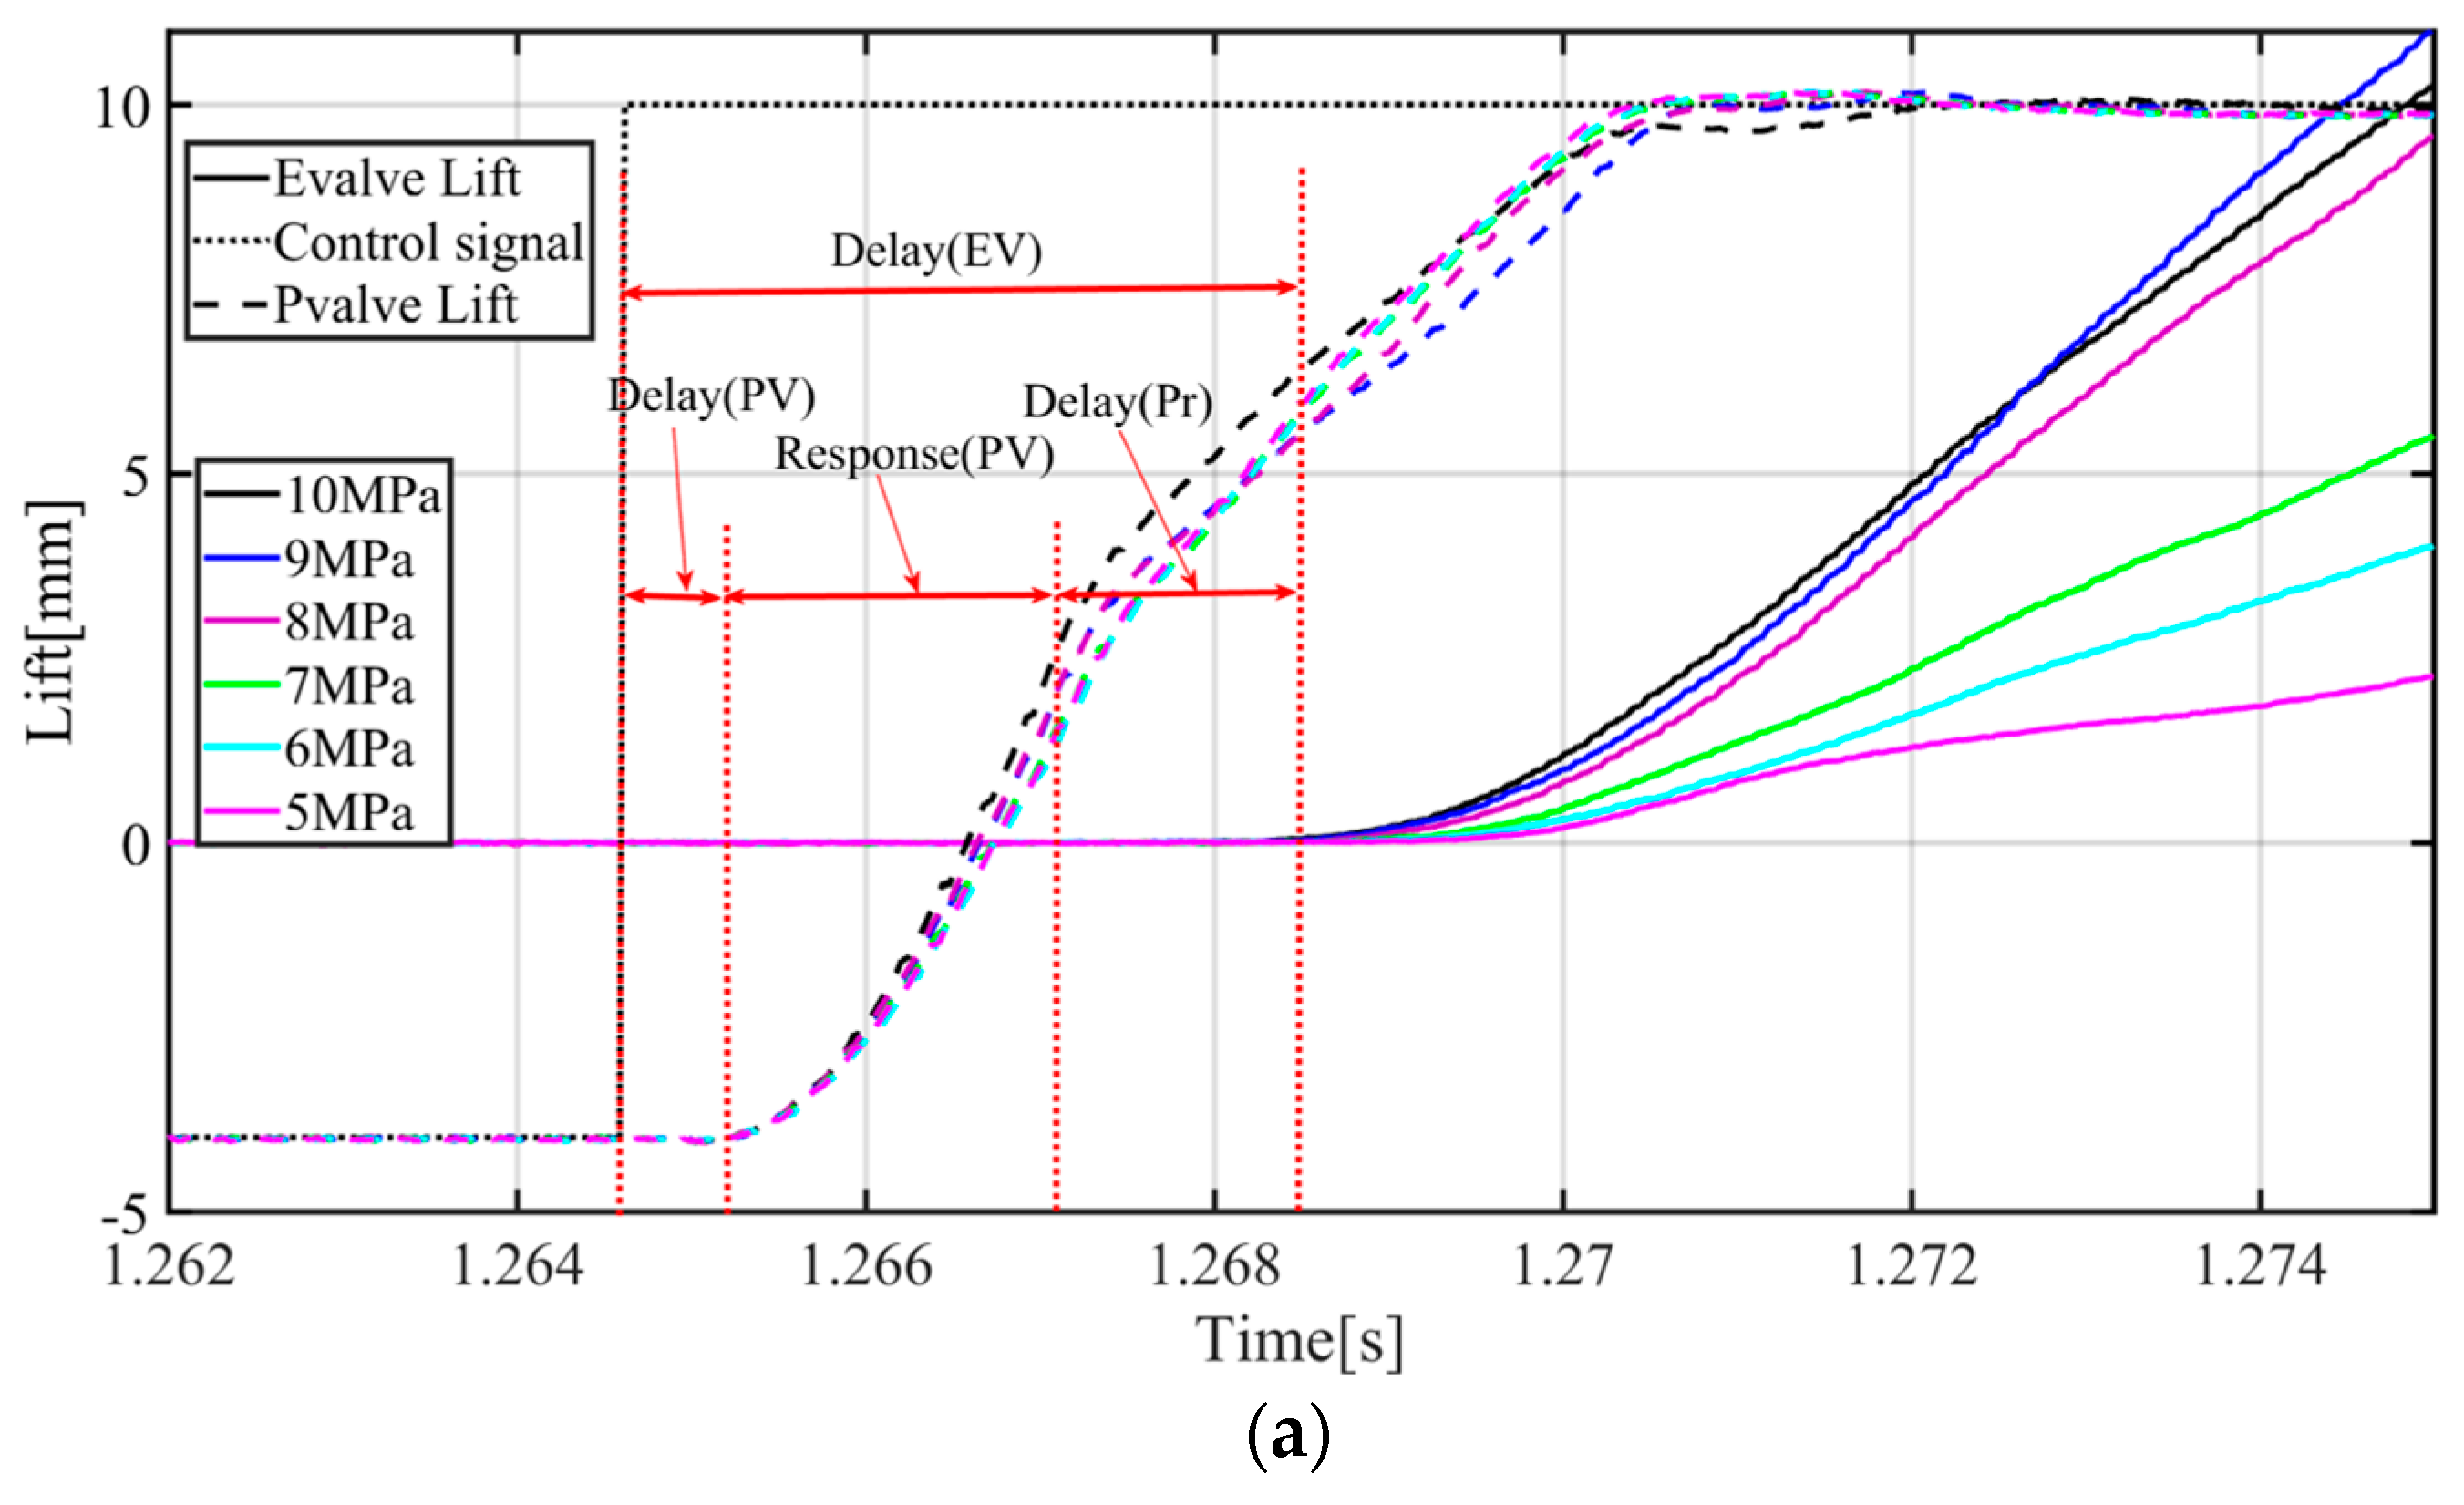
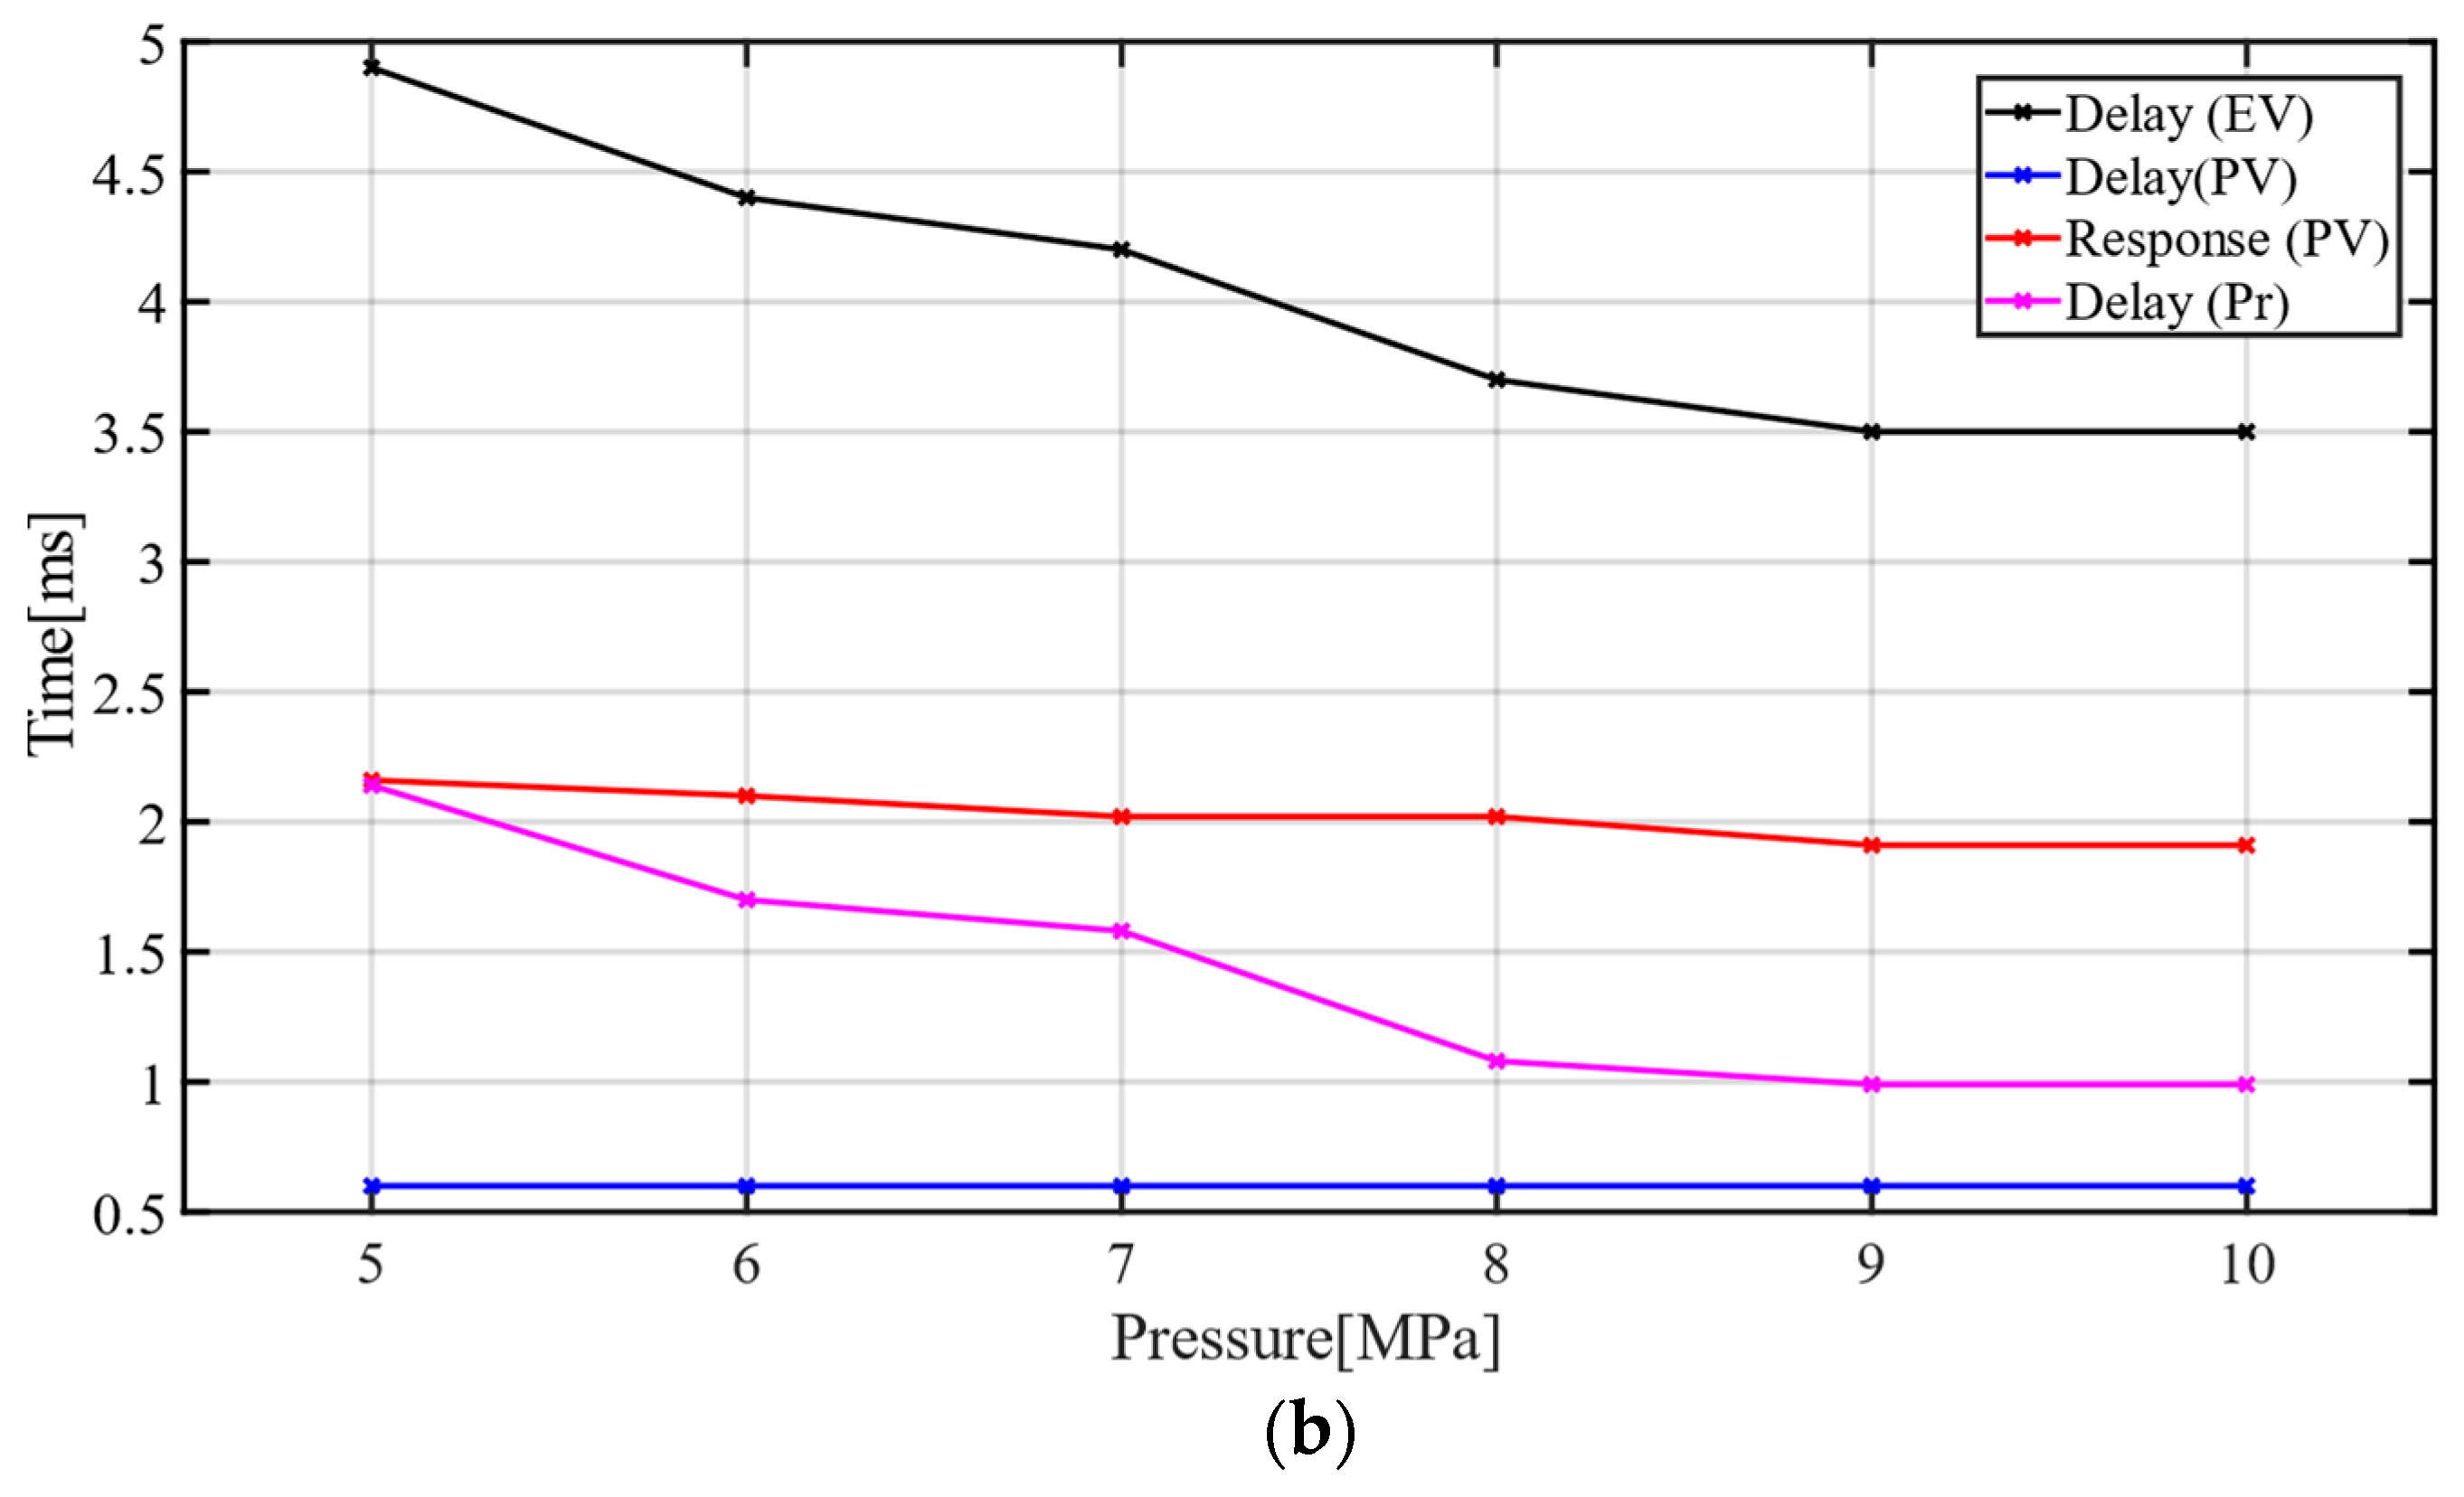
Figure 3 shows that the D e l a y ( P V ) is stable under different command signals. With different target command signals, the R e s p o n s e   ( P V ) is different regardless of whether the initial state is the same. As shown in Figure 4, under different oil supply pressure, the R e s p o n s e   ( P V ) is also different even if the command signal is the same. The R e s p o n s e   ( P V ) is strongly nonlinear and difficult to model accurately.
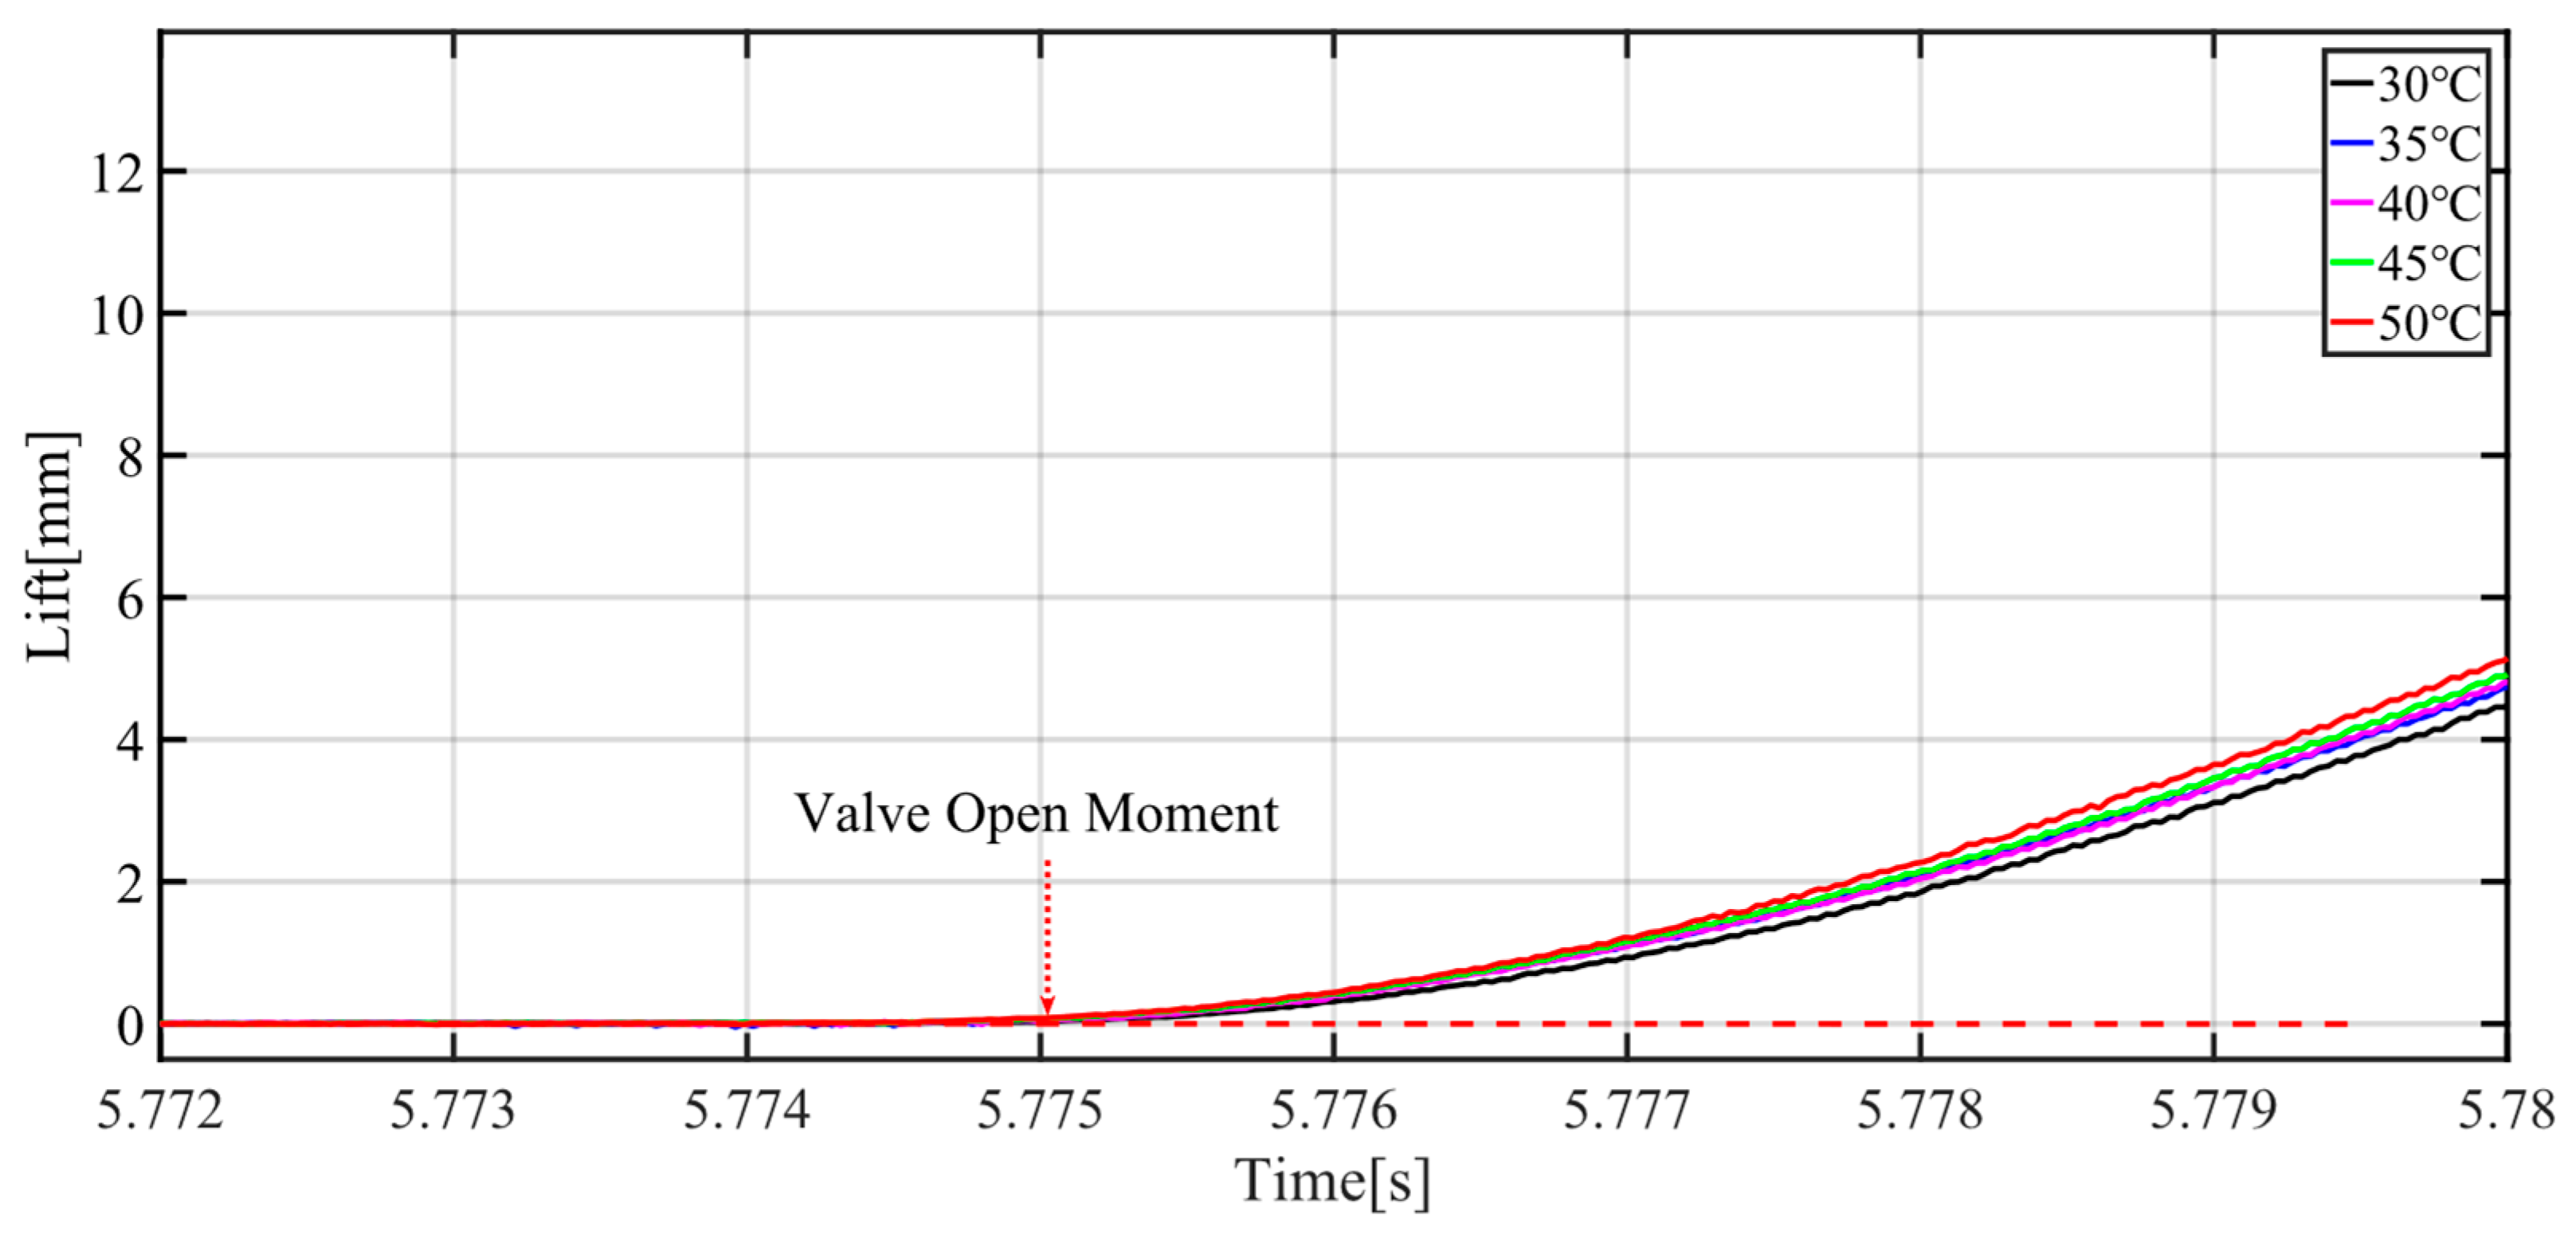
Compared with D e l a y ( P V ) and R e s p o n s e   ( P V ) , D e l a y   ( P r ) is more complex. The D e l a y   ( P r ) is determined by oil supply pressure, maximum static friction force, spring preload and oil pressure transfer rate. Some advanced friction models have been developed to improve controller performance [27,28]. However, the maximum friction force of the dynamic friction model has large errors when compared with experiment results [29]. When oil supply pressure changes, D e l a y ( P r ) also changes. As shown in Figure 4, when oil supply pressure is 10 MPa, D e l a y ( P r ) is 0.99 ms; when oil supply pressure is 5 MPa, D e l a y ( P r ) is 2.14 ms. Figure 5 shows the valve open delay experiments with the oil temperature from 30 °C to 50 °C. As shown in Figure 5, the oil temperature affects valve open velocity, but for valve open delay, it has little effect and can be ignored.
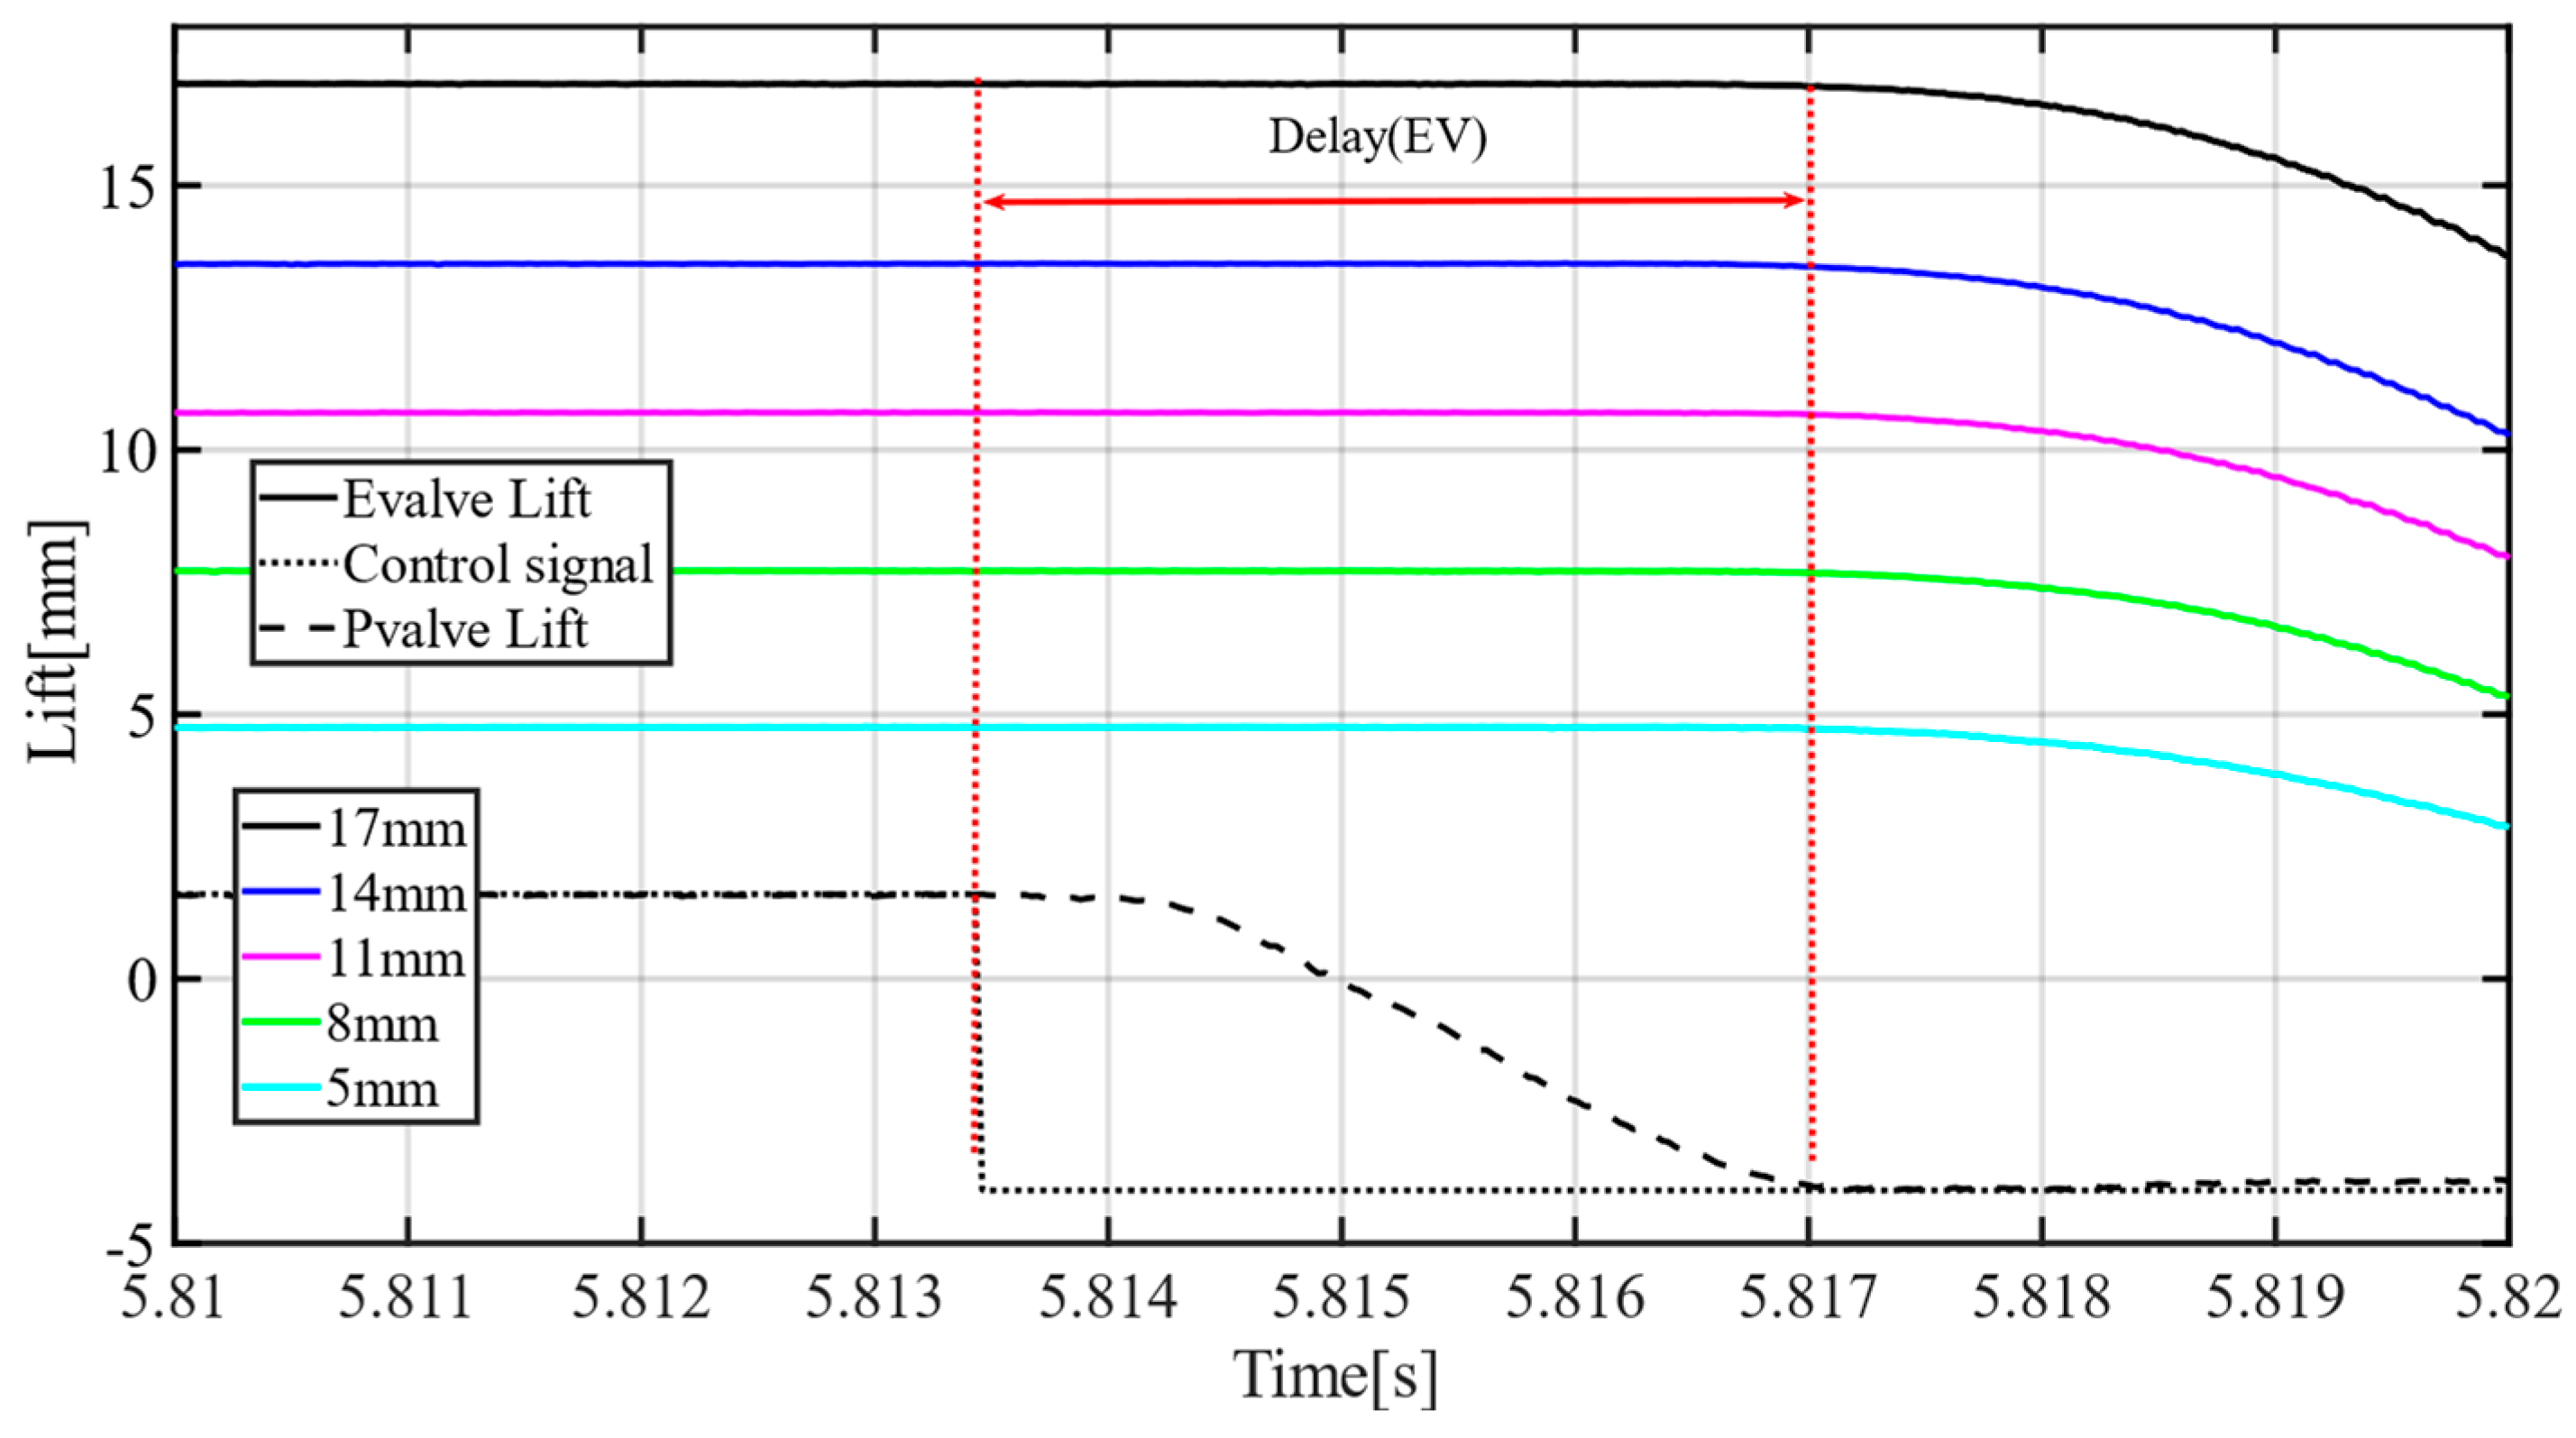
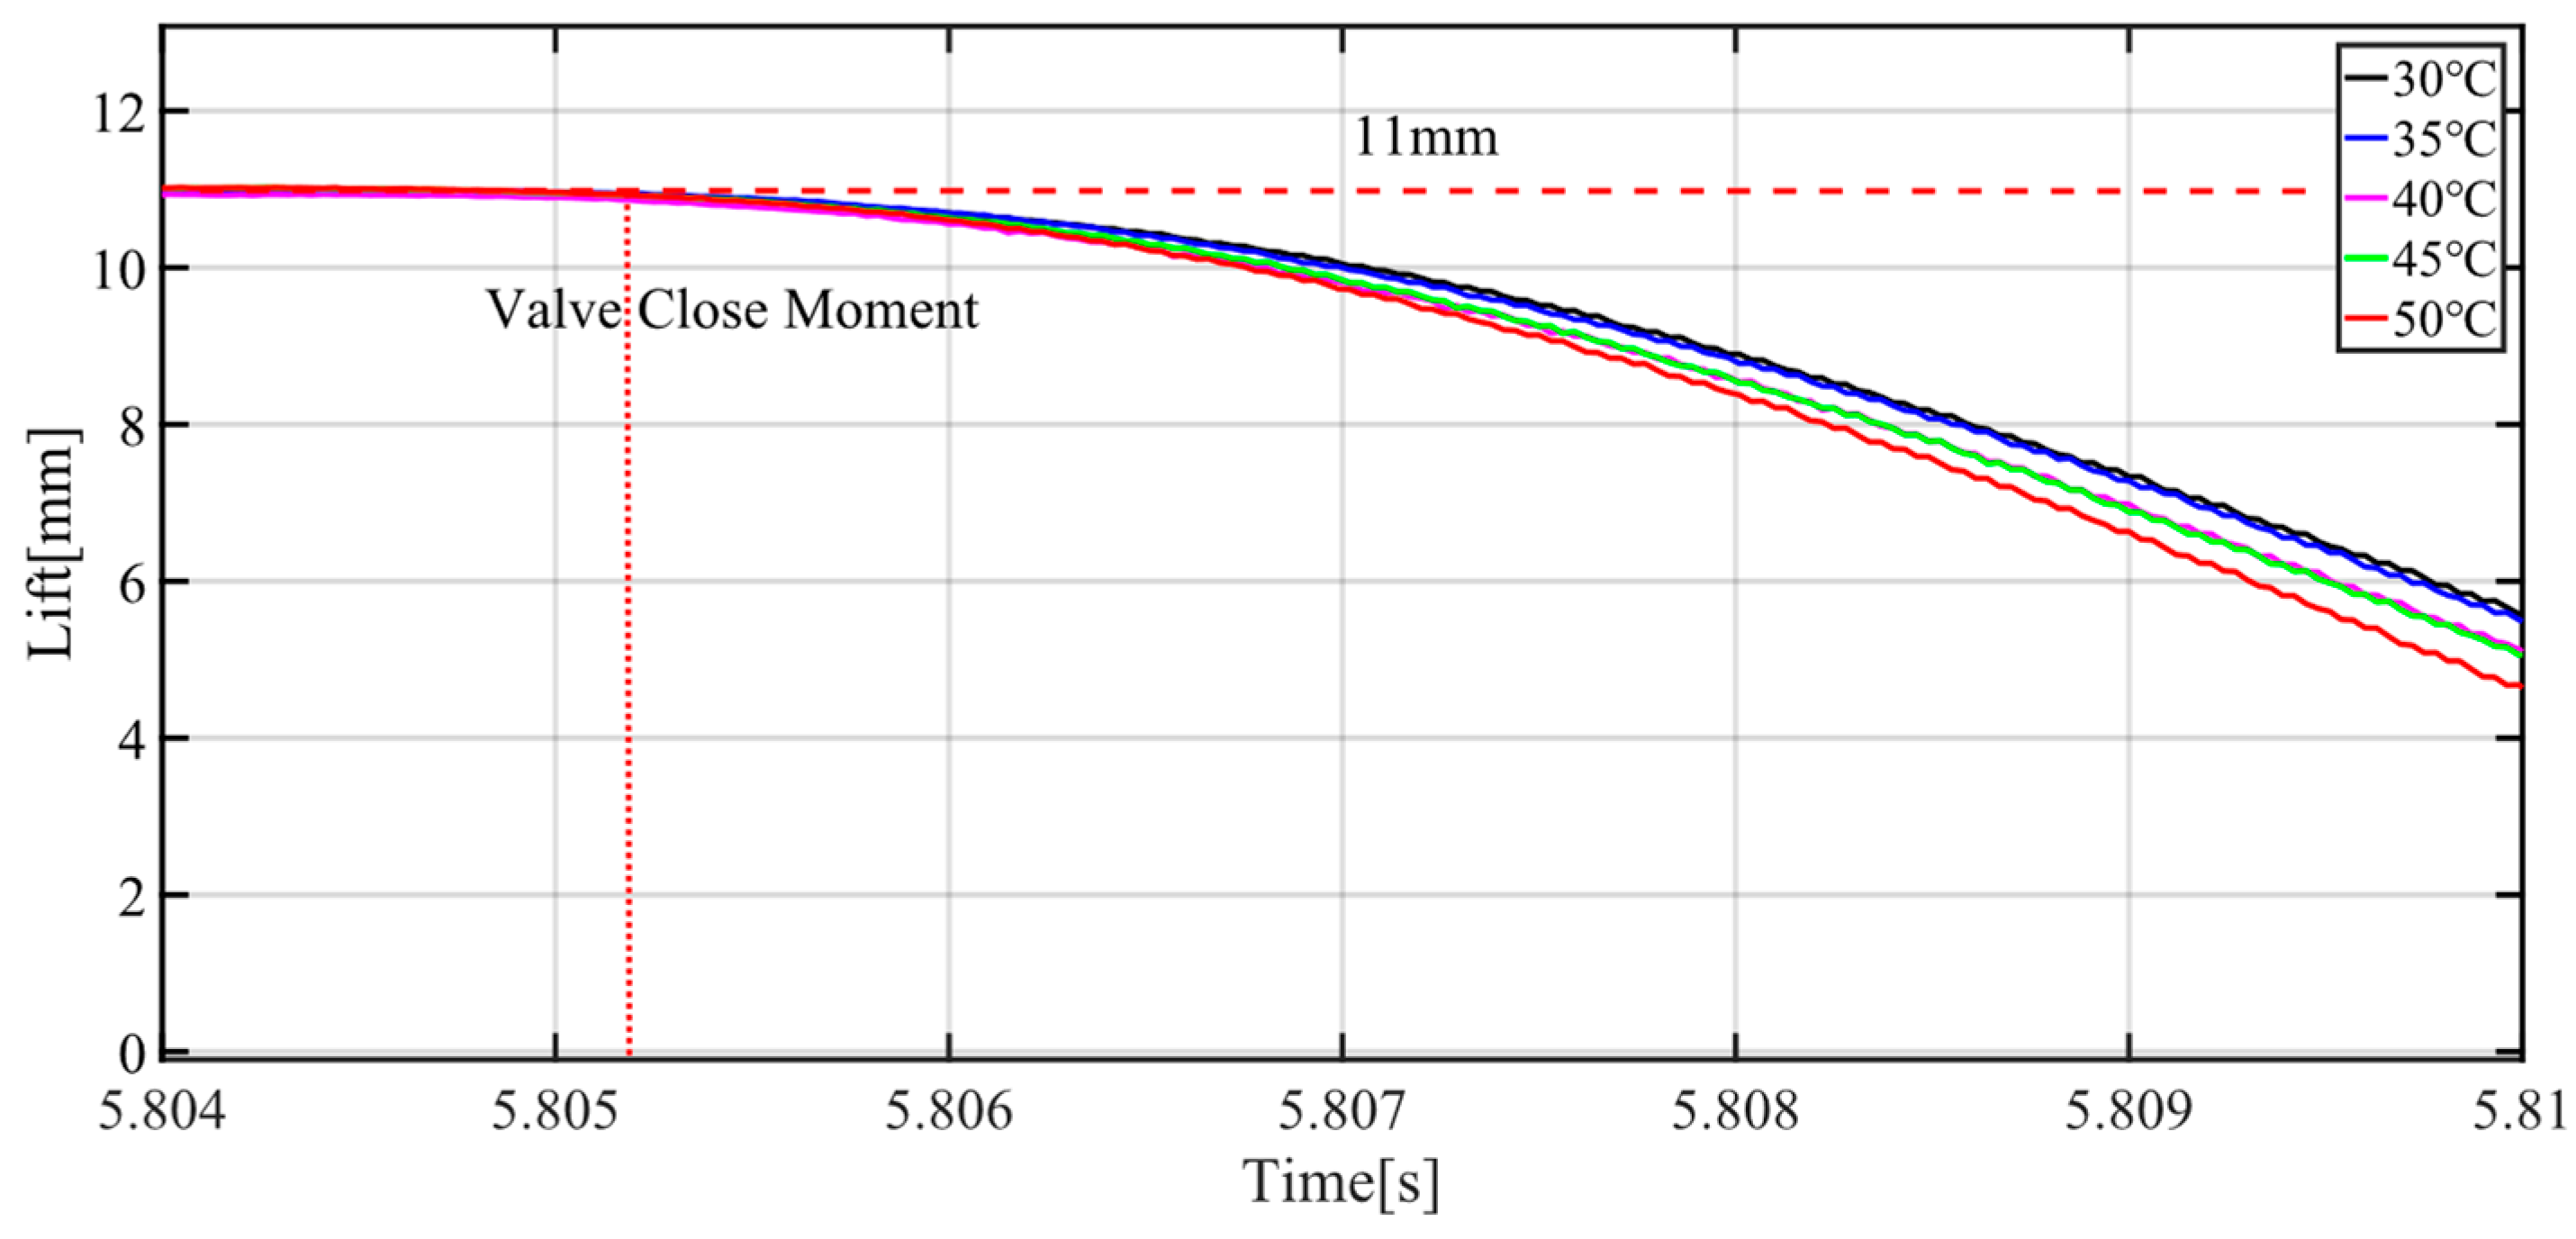
For the engine valve close event, the engine response delay is different from the valve open response delay. The engine valve is driven by a compressed valve spring. The engine valve close delay (engine valve starts to close) with different maximum valve lifts is shown in Figure 6. With different maximum valve lifts, the valve close delay is stable, and the delay time is 3.6 ms, which is smaller than that of the valve open delay. As shown in Figure 7, for different oil supply pressures, the valve close delay is also about 3.6 ms. Figure 8 shows the influence of oil temperature on engine valve close delay. Similar to valve open delay, the oil temperature affects valve close velocity, but for valve close delay, it has little effect. From Figure 6, Figure 7 and Figure 8, it can be seen that valve close delay is stable and smaller than valve open delay even with different maximum valve lifts, oil supply pressures and oil temperatures.
The delay experiment results show that engine valve response delay is strongly nonlinear and difficult to decouple although D e l a y ( P V ) is stable. In addition, the D e l a y   ( E V ) between engine valve open stage and engine close stage is different. Therefore, some traditional delay compensation strategies are no longer effective.

3. Delay Compensation Strategy and System Model

3.1. Delay Compensation Strategy

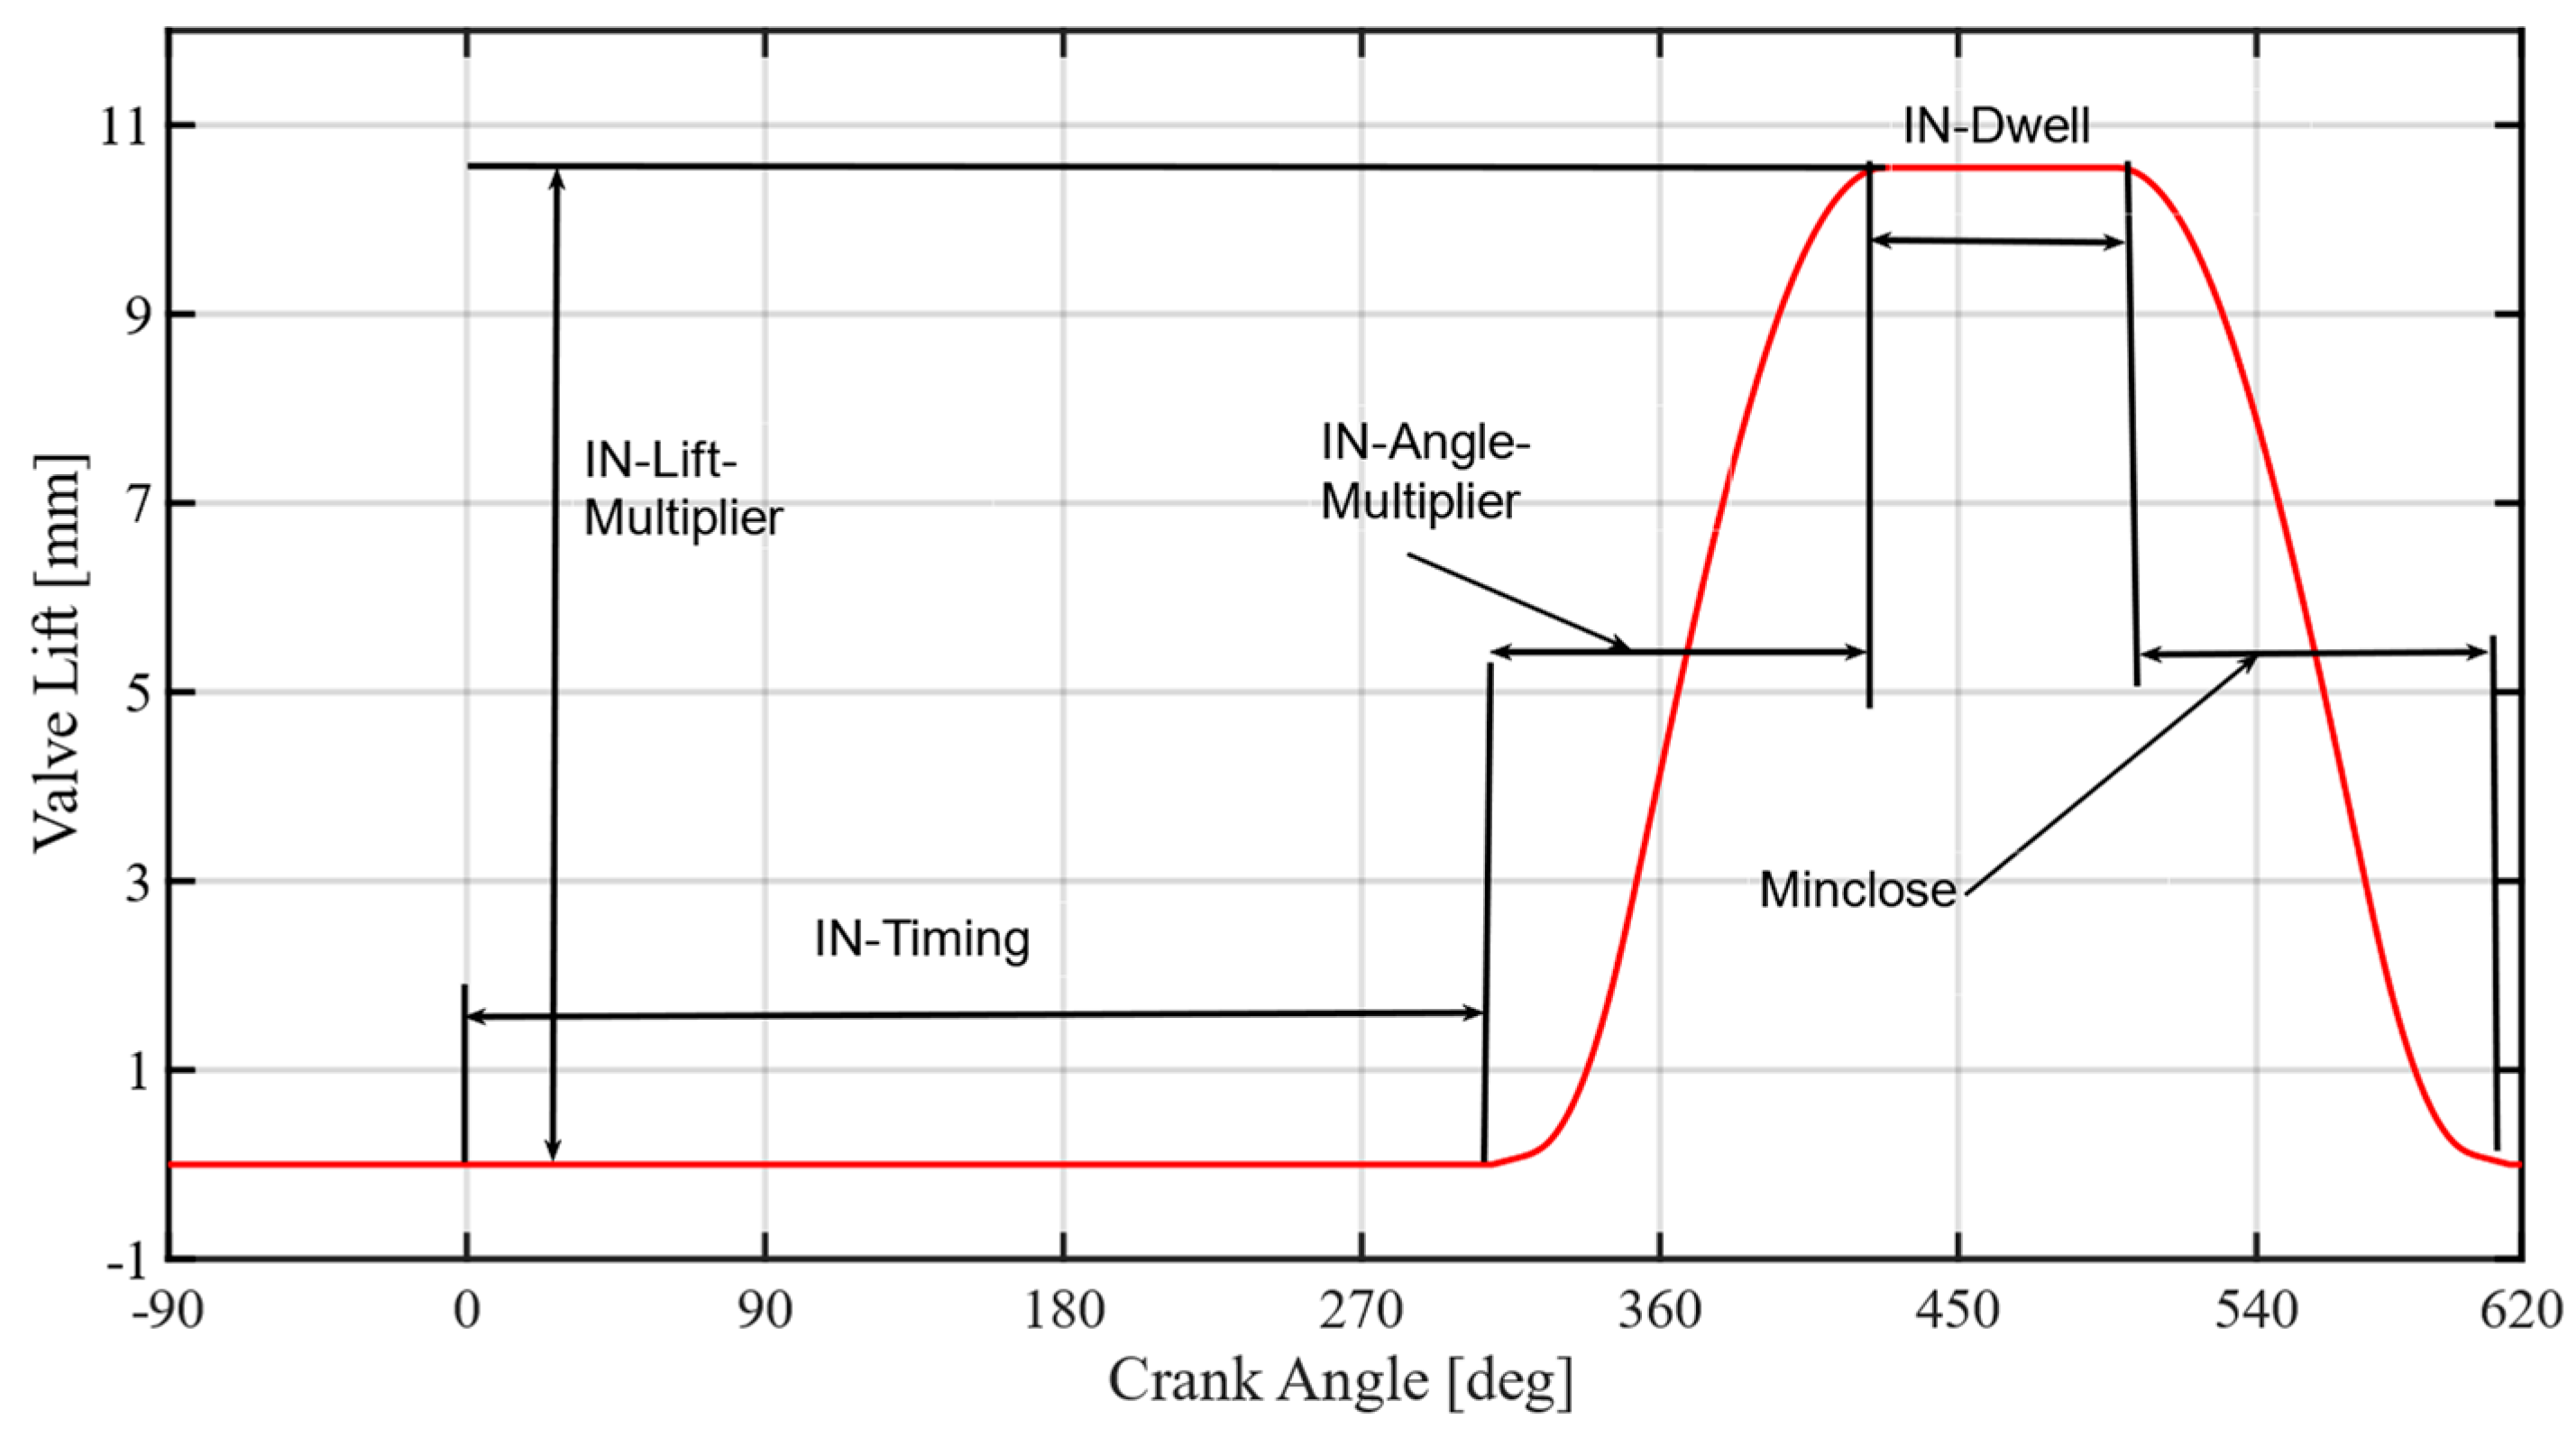
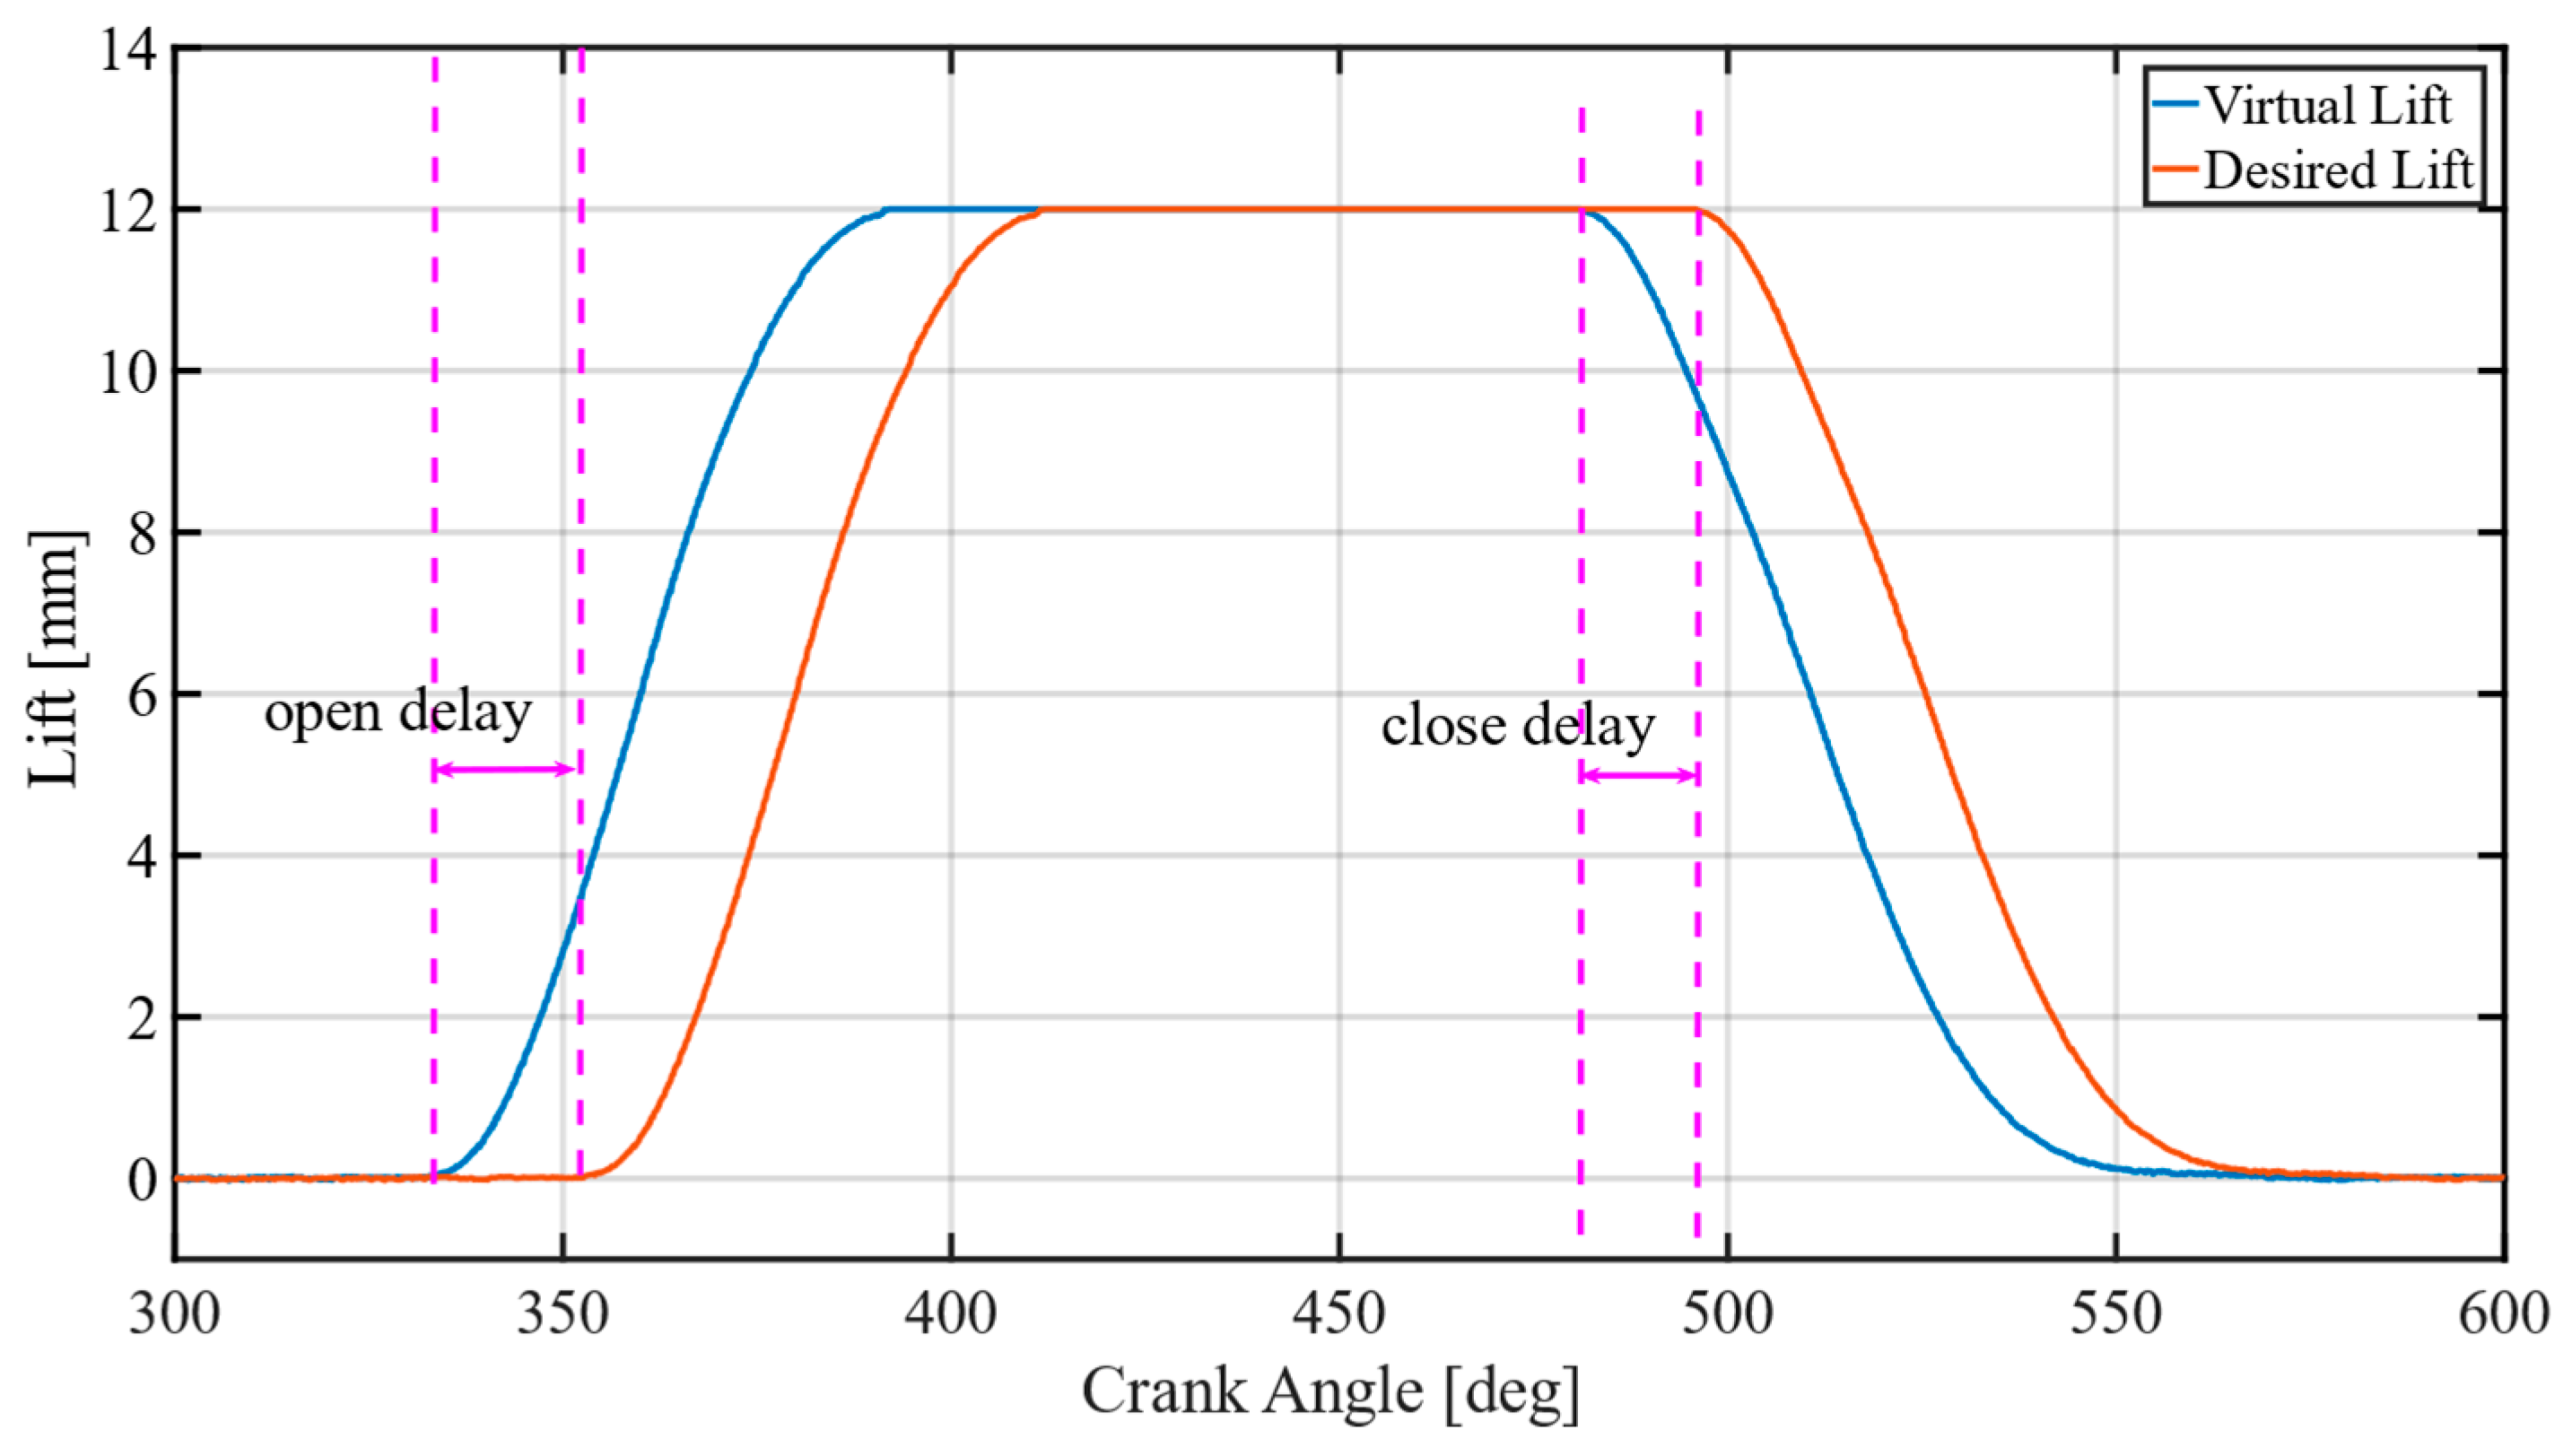
To compensate engine valve delay, a backstepping controller with a virtual desired engine valve lift is proposed. In traditional model-based controllers, the input signal and tracking error are calculated with the actual engine lifts. For the proposed compensation strategy, the virtual desired valve lift is used to calculate the input signal, and the real desired valve lift is used to calculate the tracking error. Under the same condition, the desired engine valve lift is pre-defined. Therefore, the engine valve delay can be compensated by designing virtual desired engine valve lifts. In [30], it is shown that desired engine valve lift can be parameterized by five parameters. As shown in Figure 9, engine valve open time is determined by IN-Timing, and the time at which the valve begins to close is determined by IN-Timing and IN-Dwell. To compensate valve delay, two parameters need to be adjusted. By adjusting IN-Timing, engine valve open delay can be compensated, and by adjusting IN-Dwell, engine valve close delay can be compensated.
To design the virtual desired lift, engine valve response delay is necessary. As shown in Section 2, the engine valve response delay is difficult to model. Therefore, a data-based delay observer is proposed. Under stable conditions, the desired valve lift is fixed. The delay is affected by oil supply pressure fluctuation and oil temperature, and the pressure fluctuation and oil temperature change slowly. The delay between a few engine cycles is almost equal.
Based on the engine cycles, the engine valve open delay and close delay can be calculated by:
o p e n D e l a y   ( E V ) k = 1 5 i = 1 5 o p e n D e l a y   ( E V ) k i + k p o Δ P  
c l o s e D e l a y   ( E V ) k = 1 5 i = 1 5 c l o s e D e l a y   ( E V ) k i
where o p e n D e l a y   ( E V ) k and c l o s e D e l a y   ( E V ) k are predicted valve open delay and close delay in the current engine cycle, respectively; o p e n D e l a y   ( E V ) k i and c l o s e D e l a y   ( E V ) k i are real valve open delay and close delay in the previous engine cycles, respectively; and Δ P is temperature and pressure fluctuations. k p o is the feedback gain to Δ P . Based on the experiment, the k p o and k p c can be calibrated. The k p o is 1.8.
The virtual IN-Timing and IN-Dwell can be calculated by:
I N T i m i n g v = ( I N T i m i n g ) o p e n D e l a y   ( E V ) k  
I N D w e l l k = ( I N D w e l l ) ( o p e n D e l a y   ( E V ) k c l o s e D e l a y   ( E V ) k )
where I N T i m i n g and I N D w e l l are desired engine valve lift parameters; I N T i m i n g v and I N D w e l l k are virtual parameters.
The virtual desired engine valve lift is shown in Figure 10.

3.2. System Model

The motion of the engine valve can be described by:
m a = P B A B + P C A C P D A D + m g F f F s
where m is the effective mass of the moving elements, including the engine valve and the piston of the hydraulic actuator; P B , P C and P D are hydraulic pressure of Chambers B, C and D; F f is the friction force and F s is the valve spring force.
P B , P C and P D can be described as:
P B ˙ = β e V B ( K B 2 ρ | P l P B | s g n ( P l P B ) + C l B ( P C P B ) A B v )
P C ˙ = β e V C ( K C x v [ s ( x v ) 2 ρ ( P h P C ) + s ( x v ) 2 ρ ( P C P l ) ] C l B ( P C P B ) C l D ( P C P D ) A C v )
P D ˙ = β e V D ( K D 2 ρ | P l P D | s g n ( P l P D ) + C l D ( P C P D ) + A D v )
s g n ( x ) = { 1 , i f   x 0 1 , i f   x < 0
s ( x v ) = { 1 , i f   x v 0 0 , i f   x v < 0
where β e is oil elasticity modulus; V B , V C and V D are effective volumes of Chambers B, C and D;   A B , A C and A D are effective action areas; C d B and C d D are flow coefficients of the oil port in Chambers B and D; K C is equivalent flow coefficient of the proportional valve; K B and K D are equivalent flow coefficients of the oil port; x v is the real valve openings of the proportional valve instead of the valve command signal; C l B and C l D are coefficients of leakage from Chamber C to Chambers B and D, respectively; P h is oil supply pressure and P l is the system back pressure.
To implement the controller, the proportional valve model is simplified as:
x v = { u 2.55 , i f   x v 0 u + 2.5 , i f   x v < 0
where u is the command signal; −2.55 and 2.5 are proportional valve dead-zone.
The friction force F f can be calculated by:
F f = μ d ( σ 0 z + σ 1 z ˙ + σ 2 x ˙ )
z ˙ = x ˙ | x ˙ | g ( x ˙ ) z
g ( x ˙ ) = α 0 + α 1 e ( x ˙ x ˙ s ) λ
μ d = { μ d + x ˙ 0 μ d x ˙ < 0
where σ 0 is the bristle stiffness, σ 1 is damping coefficient of the bristle, σ 2 is the viscous damping coefficient of the variable valve system, z is the deformation length of the bristle, z ˙ is the deformation velocity, x ˙ is the engine valve velocity, g ( x ˙ ) is used to calculate static friction force, α 0 is the Coulomb friction coefficient, α 1 is the static friction coefficient, x s ˙ is the system Stribeck velocity and μ d is the mean bristle direction coefficient.
The spring force F s can be calculated by:
F s = β 1 ( x + 0.0085 ) 2 + β 2 ( x + 0.0085 ) + β 3
The model parameters are shown in Table 3.

4. Controller Design and Stability Analysis

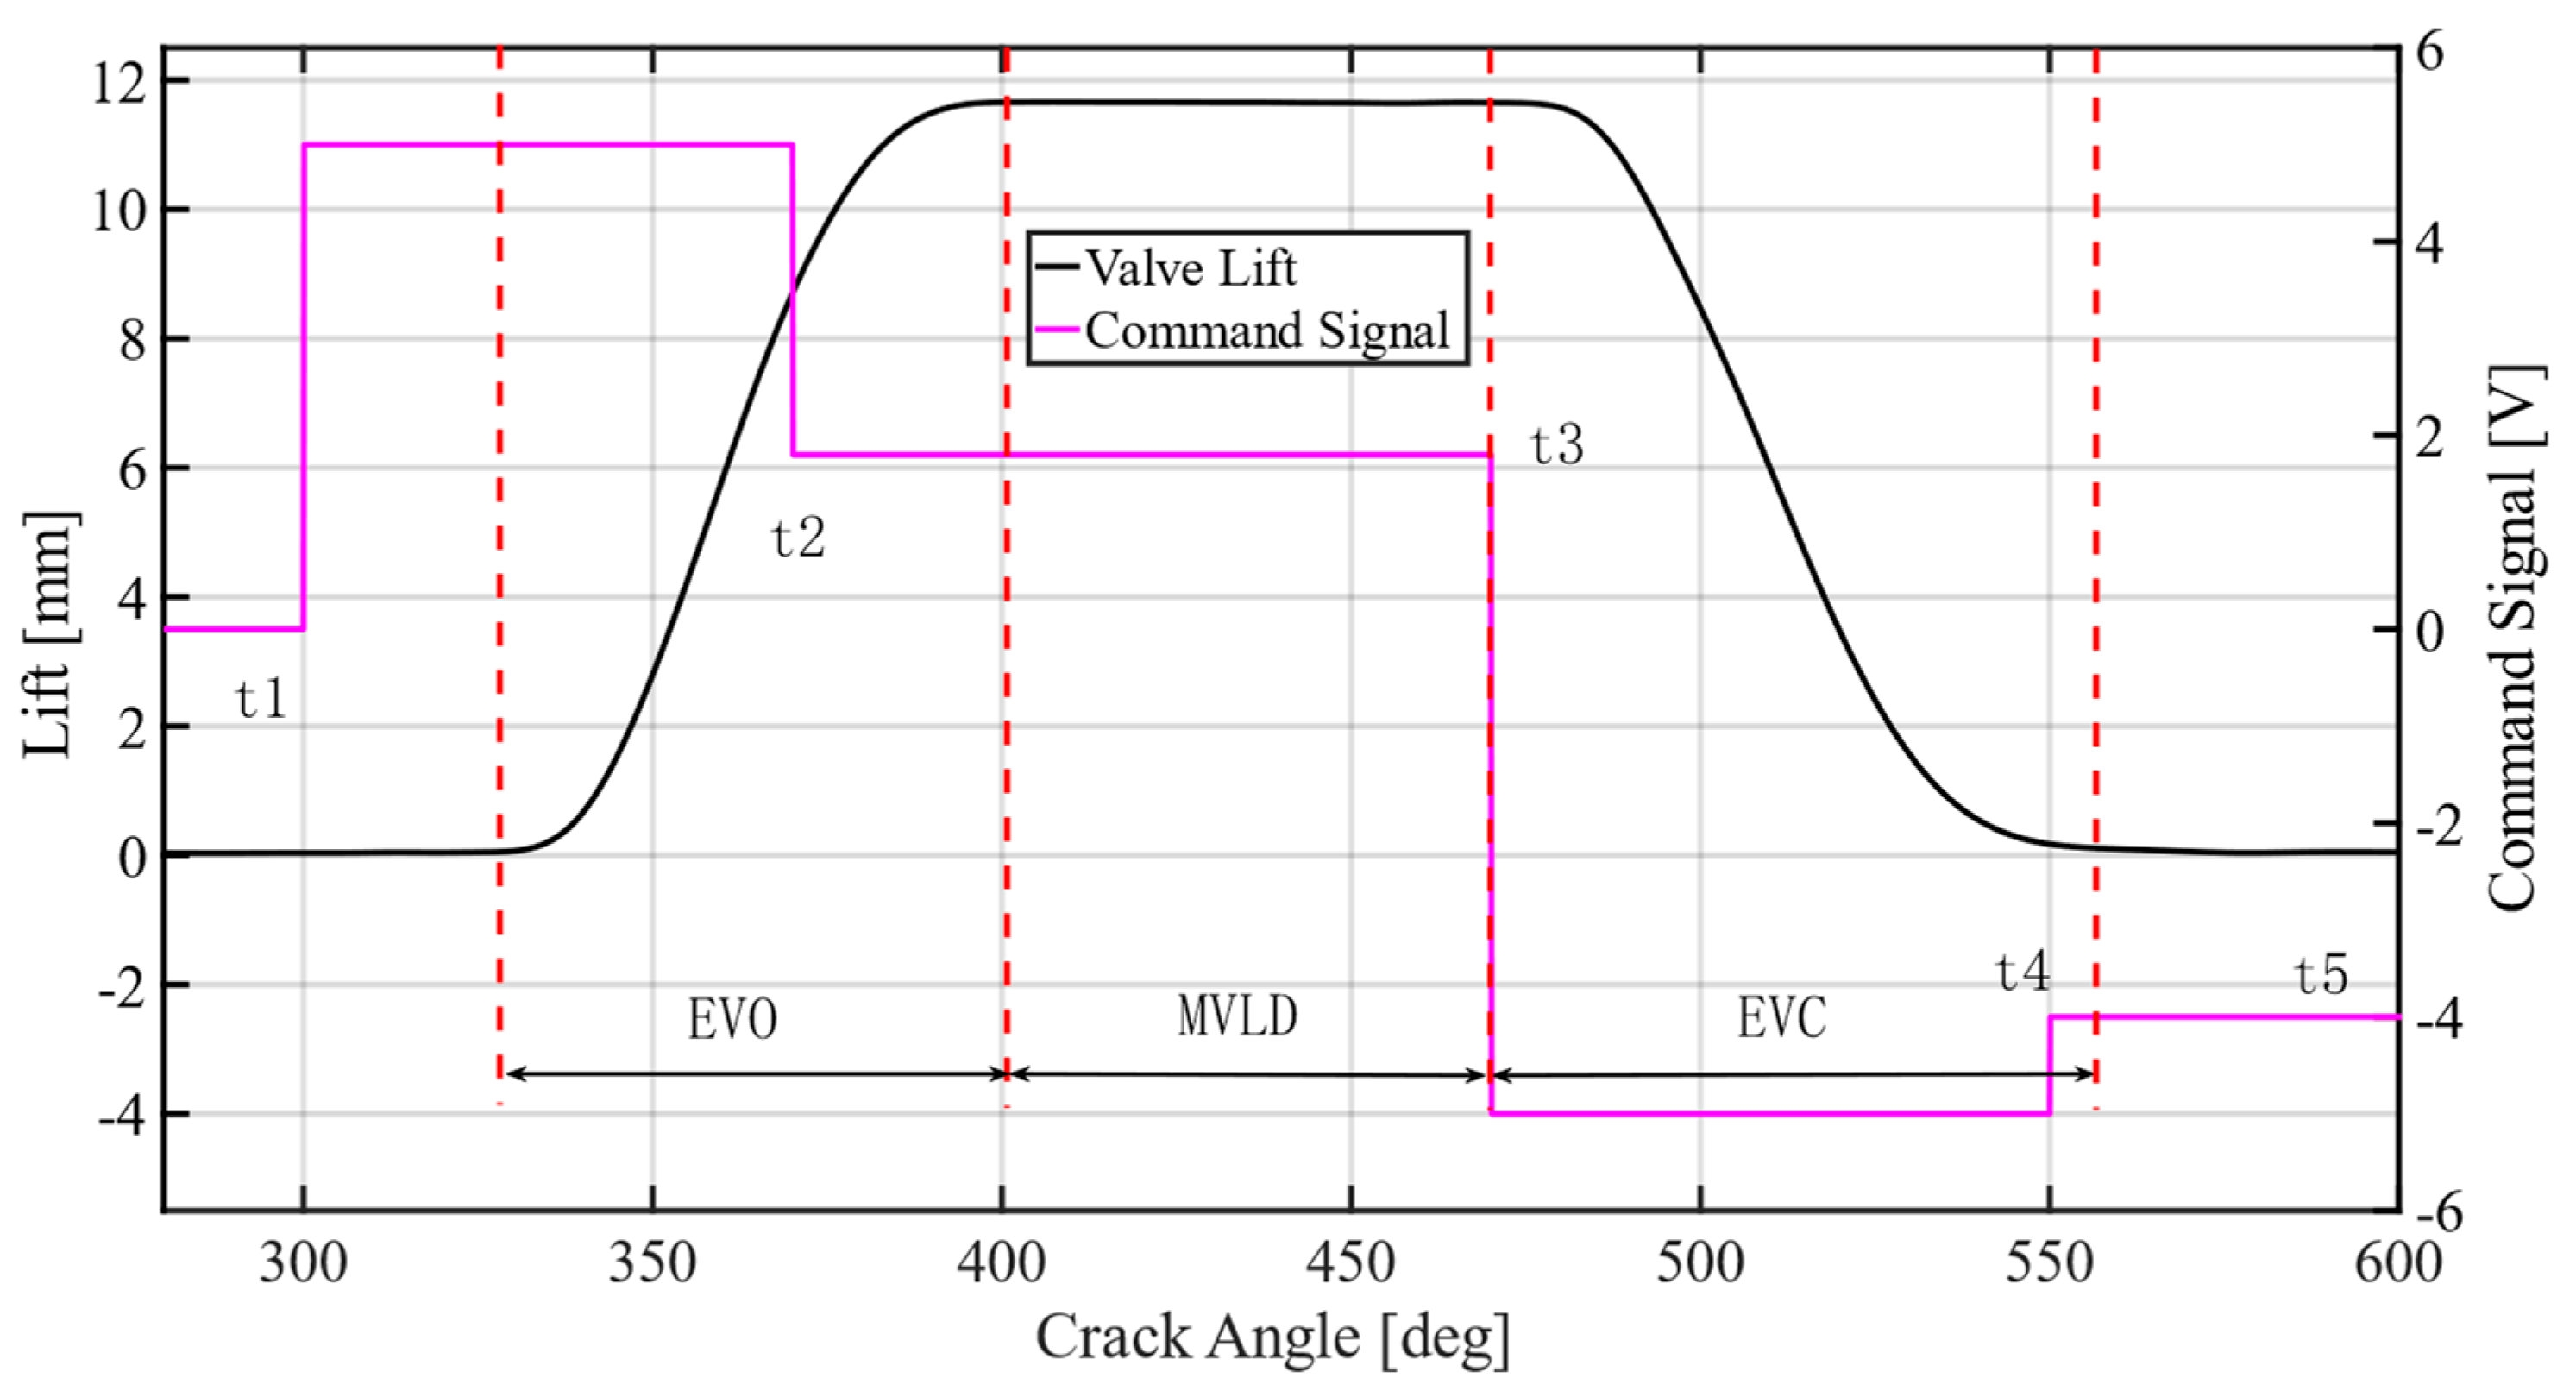
As shown in Figure 11, the motion of the engine valve can be decoupled into three stages: engine valve open stage (EVO), maximum valve lift dwell stage (MVLD) and engine valve close stage (EVC).
Based on (6)–(17), the system state variables are defined as:
x = [ x 1 , x 2 , x 3 , x 4 , x 5 , x 6 ] T = [ y , y ˙ , P B , P C , P D , z ] T
The system model (6)–(17) is converted to state-space form:
{ x 1 ˙ = x 2 x 2 ˙ = 1 m ( x 3 A B + x 4 A C x 5 A D ( μ d ( σ 0 x 6 + σ 1 ( x 2 | x 2 | α 0 + α 1 e ( x 2 0.2 ) 2 x 6 ) + σ 2 x 2 ) ) F s ) + d 2 ( t ) x 3 ˙ = β e V B ( Q B ( x 3 ) + C l B ( x 4 x 3 ) A B x 2 ) x 4 ˙ = β e V C ( Q C ( x 4 ) C l B ( x 4 x 3 ) C l D ( x 4 x 5 ) A C x 2 ) x 5 ˙ = β e V D ( Q B ( x 5 ) + C l D ( x 4 x 5 ) + A D x 2 ) x 6 ˙ = x 2 | x 2 | α 0 + α 1 e ( x 2 0.2 ) 2 x 6
For an engine valve application, only engine valve lift ( x 1 ) can be measured directly. Therefore, a state observer is necessary. To compensate system uncertainties, d 2 is extended to x 7 . The extended state observer can be designed:
{ x ^ ˙ 1 = x ^ 2 + σ 1 ε ( y y ^ ) x ^ ˙ 2 = 1 m ( x 3 A B + x 4 A C x 5 A D ( μ d ( σ 0 x 6 + σ 1 ( x 2 | x 2 | α 0 + α 1 e ( x 2 0.2 ) 2 x 6 ) + σ 2 x 2 ) ) F s ) + σ 2 ε 2 ( y y ^ ) x ^ ˙ 3 = β e V B ( Q B ( x 3 ) + C l B ( x 4 x 3 ) A B x 2 ) + σ 3 ε 3 ( y y ^ ) x ^ ˙ 4 = β e V C ( Q C ( x 4 ) C l B ( x 4 x 3 ) C l D ( x 4 x 5 ) A C x 2 ) + σ 4 ε 3 ( y y ^ ) x ^ ˙ 5 = β e V D ( Q B ( x 5 ) + C l D ( x 4 x 5 ) + A D x 2 ) + σ 5 ε 3 ( y y ^ ) x ^ ˙ 6 = x 2 | x 2 | α 0 + α 1 e ( x 2 0.2 ) 2 x 6 + σ 6 ε 3 ( y y ^ ) x ^ ˙ 7 = x 7 + σ 7 ε 4 ( y y ^ )
The following is defined:
L = [ l 1 , l 2 , l 3 , l 4 , l 5 , l 6 , l 7 ] T = [ σ 1 ε , σ 2 ε 2 , σ 3 ε 3 , σ 4 ε 3 , σ 5 ε 3 , σ 6 ε 3 , σ 7 ε 4 ] T = [ σ 1 ω 0 , σ 2 ω 0 2 , σ 3 ω 0 3 , σ 4 ω 0 3 , σ 5 ω 0 3 , σ 6 ω 0 3 , σ 7 ω 0 4 ] T
where L is the observer gain matrix. In this paper, [ σ 1 , σ 2 , σ 3 , σ 4 , σ 5 , σ 6 , σ 7 , σ 8 ] T = [ 1 , 10 , 2 , 2 , 2 , 2 , 0.0001 , 1 ] T . Observer error is x ˜ = x x ^ . It is easy to prove that the characteristic polynomial of the state observer satisfies the Hurwitz law. Thus, the observer is stable.

4.1. Controller Design

Based on the system model, a backstepping controller based on the delay compensation strategy can be designed.
Step 1: Define the engine valve lift tracking error and engine valve velocity tracking error:
z 1 = x 1 x 1 d
z 2 = z ˙ 1 + k 1 z 1 = x 2 x 2 e q
x 2 e q = x ˙ 1 d v k 1 z 1
where x 1 d is the desired valve lift, x 1 d v is the virtual desired engine valve lift, x 2 e q is the virtual valve velocity and k 1 is the positive feedback gain of z 1 .
For the engine valve lift tracking event, engine valve lift error z 1 will converge to zero if engine valve velocity error z 2 converges zero. Differentiating (7),
z ˙ 2 = x ˙ 2 x ˙ 2 e q = 1 m ( x 3 A B + x 4 A C x 5 A D F f F s + d 2 ) ( x ¨ 1 d k 1 z ˙ 1 )
Take x 4 as the virtual input of (25); the engine valve lift error converges to zero upon the design of a control function α 2 that converges to x 4 . Define z 3 = x 4 α 2 ; α 2 can be calculated by:
α 2 = α 2 a + α 2 s 1 + α 2 s 2
α 2 a = m ( x ¨ 1 d k 1 z ˙ 1 ) ( x ^ 3 A B x ^ 5 A D F ^ f ( x 1 , x 2 ) F s ( x 1 ) + x ^ 7 ) A C
α 2 s 1 = k 2 s 1 z 2
where α 2 a is a feedforward controller based on the system model and desired input, α 2 s 1 is linear feedback to z 2 , α 2 s 2 is used to compensate the unmatched uncertainty, k 2 s 1 and k 2 s 2 are positive feedback gain, F f m is the maximum estimation error of friction force and d 2 m is the maximum unmatched uncertainty.
Apply (26)–(28) to (25):
z ˙ 2 = 1 m ( x 3 A B + ( z 3 + α 2 a + α 2 s 1 + α 2 s 2 ) A C x 5 A D F f F s + d 2 ) ( x ¨ 1 d k 1 z ˙ 1 ) = 1 m ( x 3 A B + z 3 + m ( x ¨ 1 d k 1 z ˙ 1 ) x ^ 3 A B + x ^ 5 A D + F ^ f ( x 1 , x 2 ) + F s ( x 1 ) A C k 2 s 1 z 2 + A C α 2 s 2 x 5 A D F f F s + d 2 ) ( x ¨ 1 d k 1 z ˙ 1 ) = 1 m ( x ˜ 3 A B x ˜ 5 A D + z 3 A C k 2 s 1 z 2 + A C α 2 s 2 F ˜ f + x ˜ 7 )
In (26), α 2 s 2 is used to suppress the uncertainties, and it should satisfy:
z 2 ( x ˜ 3 A B x ˜ 5 A D + A C α 2 s 2 F ˜ f + x ˜ 7 ) ε 2
z 2 α 2 s 2 0
α 2 s 2 = def k 2 s 2 z 2 = h 2 2 A C ε 2 z 2
h 2 ( x ˜ 3 m A B ) 2 + ( x ˜ 5 m A D ) 2 + F ˜ f m 2 + x ˜ 7 m 2
Step 2: Similar to Step 1, if z 3 converges to zero, z 1 and z 2 will also converge to zero. The time difference of z 3 can be calculated by:
z ˙ 3 = β e V C ( K C x v ( s ( x v ) 2 ρ ( P h x 4 ) + s ( x v ) 2 ρ ( x 4 P l ) ) C l B ( x 4 x 3 ) C l D ( x 4 x 5 ) A C x 2 ) α ˙ 2
α ˙ 2 = α ˙ 2 c + α ˙ 2 u
Treat valve opening x v as virtual input of (34), and it can be calculated by:
x v = x v a + x v s 1 + x v s 2
x v a = V C β e ( α ˙ 2 c x ^ 7 ) + C l B ( x ^ 4 x ^ 3 ) + C l D ( x ^ 4 x ^ 5 ) + A C x ^ 2 K C ( s ( x v ) 2 ρ ( P h x ^ 4 ) + s ( x v ) 2 ρ ( x ^ 4 P l ) )
x v s 1 = k v s 1 z 3
Apply (36)–(38) to (34)
z ˙ 3 = α ˙ 2 u + β e V C ( C l B ( x ˜ 4 x ˜ 3 ) C l D ( x ˜ 4 x ˜ 5 ) A C x ˜ 2 K C k v s 1 z 3 + K C x v s 2 )
Similarly, in (36), x v s 2 is used to suppress the uncertainties, and it should satisfy:
z 3 ( α ˙ 2 u + β e V C ( C l B ( x ˜ 4 x ˜ 3 ) C l D ( x ˜ 4 x ˜ 5 ) A C x ˜ 2 + K C x v s 2 ) ) ε 3
z 3 x v s 2 0
x v s 2 = def k v s 2 z 3 = h 3 2 K C ε 3 z 3
h 3 ( α ˙ 2 u ) 2 + β e 2 V C 2 ( C l B 2 ( x ˜ 4 m x ˜ 3 m ) 2 + C l D 2 ( x ˜ 4 m x ˜ 5 m ) 2 + A C 2 x ˜ 2 m 2 )
Step 3: Dead-zone compensation.
For a proportional valve, the dead zone is not negligible. Based on the obtained valve opening in Step 2, the proportional valve command signal can be calculated by a smooth dead-zone inverse function shown in (44)–(46). The dead-zone inverse has been proposed in [31], and the experiments in [32] verified the effectiveness. The parameters of the dead-zone inverse shown in Table 4 were calibrated by experiments.
u ( x v ) = x v + m r b r m r Φ r ( x v ) + x v + m l b l m l Φ l ( x v )
Φ r ( x v ) = e x v / ϵ e x v / ϵ + e x v / ϵ
Φ l ( x v ) = e x v / ϵ e x v / ϵ + e x v / ϵ

4.2. Stability Analysis

Define a positive semi-definite V 3 function as
V 3 = 1 2 k 1 2 z 1 2 + 1 2 m z 2 2 + 1 2 z 3 2
The time derivative of V 3 is:
V 3 ˙ = k 1 2 z 1 z ˙ 1 + m z 2 z ˙ 2 + z 3 z ˙ 3 = k 1 3 z 1 2 A C k 2 s 1 z 2 2 + k 1 2 z 1 z 2 + A C z 2 z 3 + z 2 ( α 2 s 2 F f ˜ ) + z 3 ( α ˙ 2 u + β e V C ( C l B ( x ˜ 4 x ˜ 3 ) C l D ( x ˜ 4 x ˜ 5 ) A C x ˜ 2 K C k v s 1 z 3 + K C x v s 2 ) )
Apply (30) and (40) to (48); thus,
V ˙ 3 k 1 3 z 1 2 A C k 2 s 1 z 2 2 + k 1 2 z 1 z 2 + A C z 2 z 3 ω 1 β e V O C k v s 1 z 3 2 + ε 2 + ε 3
V 3 ˙ z T Λ 3 z + ε ε μ V 3
V 3 e μ t V 3 ( 0 ) + ε μ [ 1 e μ t ]
where Λ 3 = [ k 1 3 1 2 k 1 2 0 1 2 k 1 2 A C k 2 s 1 1 2 A C 0 1 2 A C β e V O C k v s 1 ] , μ = 2 λ m i n ( Λ 3 ) { 1 k 1 2 , 1 m , 1 } .
As shown in (52), the controller is stable.

5. Experiment Discussion

5.1. P Controller Design

To verify the effectiveness of the proposed controller, five P controllers which are cycle-based were designed. For the P controller, the typical command proportional valve signal is shown in Figure 11. The control signal of a proportional valve with P controllers can be defined as:
u = { v p t 1 < t t 2 1.8 t 2 < t t 3 v n t 3 < t t 4 4 t 4 < t t 5 0 e l s e
The engine valve open time, valve open velocity, maximum valve lift, valve close velocity and valve close time are calculated after the engine cycle is ended. For the HVVA prototype shown in Figure 1, although the signal is acquired through a differential strategy, the noise of the valve lift signal has a significant effect on the crank angle calculation when the engine valve is not moving. In this paper, when the engine valve is opening, take the time when the engine valve lift crosses 0.5 mm as valve open time. Take the time from 0.5 mm to 90% of the maximum lift as the valve open velocity. Similarly, take the time from 90% of the maximum lift to 0.5 mm as the engine valve close velocity. Take the time when the engine valve crosses 0.5 mm when the engine valve is closing as valve close time. The tracking errors of the last cycle are used to calculate the control input of the real cycle.
The P controllers are designed as:
t 1 , k = t 1 , k 1 K p 1 e o t
v p , k = v p , k 1 K p 2 e o v
t 2 , k = t 2 , k 1 K p 3 e m l
t 3 , k = t 3 , k 1 K p 4 e c s
v n , k = v n , k 1 K p 5 e c v
where e o t is engine valve open time error; e o v is valve open velocity error; e m l is valve maximum lift error; e c s is valve motion time error when the engine valve starts to close; e c v is valve close velocity error; e c t is valve close time error; K p 1 , K p 2 , K p 3 , K p 4 and K p 5 are error feedback gains. The feedback gains after tuning are shown in Table 5.

5.2. Proposed Controller Implementation

Similar to P controllers, in the backstepping controller, the valve open delay is defined as the time from the control valve receiving a positive signal to the time when valve lift crosses 0.5 mm. The time from when the control valve receives a negative signal to when the valve lift crosses 90% of the maximum valve lift is used as the valve close delay. The controller parameters after tuning are shown in Table 6.

5.3. Comparative Experiments

(1) 
Valve lift tracking at stable conditions (1200 RPM)
The desired engine valve lift can be obtained with the method shown in [30]. Figure 12 shows the engine valve tracking experiments at stable conditions. The oil supply pressure is 9 MPa, and the oil temperature is 40 ± 2 °C. As shown in Figure 12a,b, the tracking errors of the backstepping controller are smaller than those of the P controller significantly. Figure 12c–g show the tracking errors of 45 engine cycles. From Figure 12a,c,d, it can be seen that when the engine valve is reaching the maximum lift, the overshoot of the valve lift of the backstepping controller is smaller than that of the P controller, which can verify the advantages of the tracking controller. Figure 12e–g show the valve open error, valve close error and maximum valve error comparison, and Table 7 shows the detailed errors. Compared with the P controller, the valve open error and close error of the backstepping controller are reduced. However, for maximum valve lift error, there is little difference between the two controllers. The main advantage of the backstepping controller is reducing the tracking error when the engine valve is moving. With the proposed delay compensation strategy, the valve open error is not more than 0.39 °CA, and the valve close error is not more than 0.44 °CA.
(2) 
Valve lift tracking with transient maximum valve lift
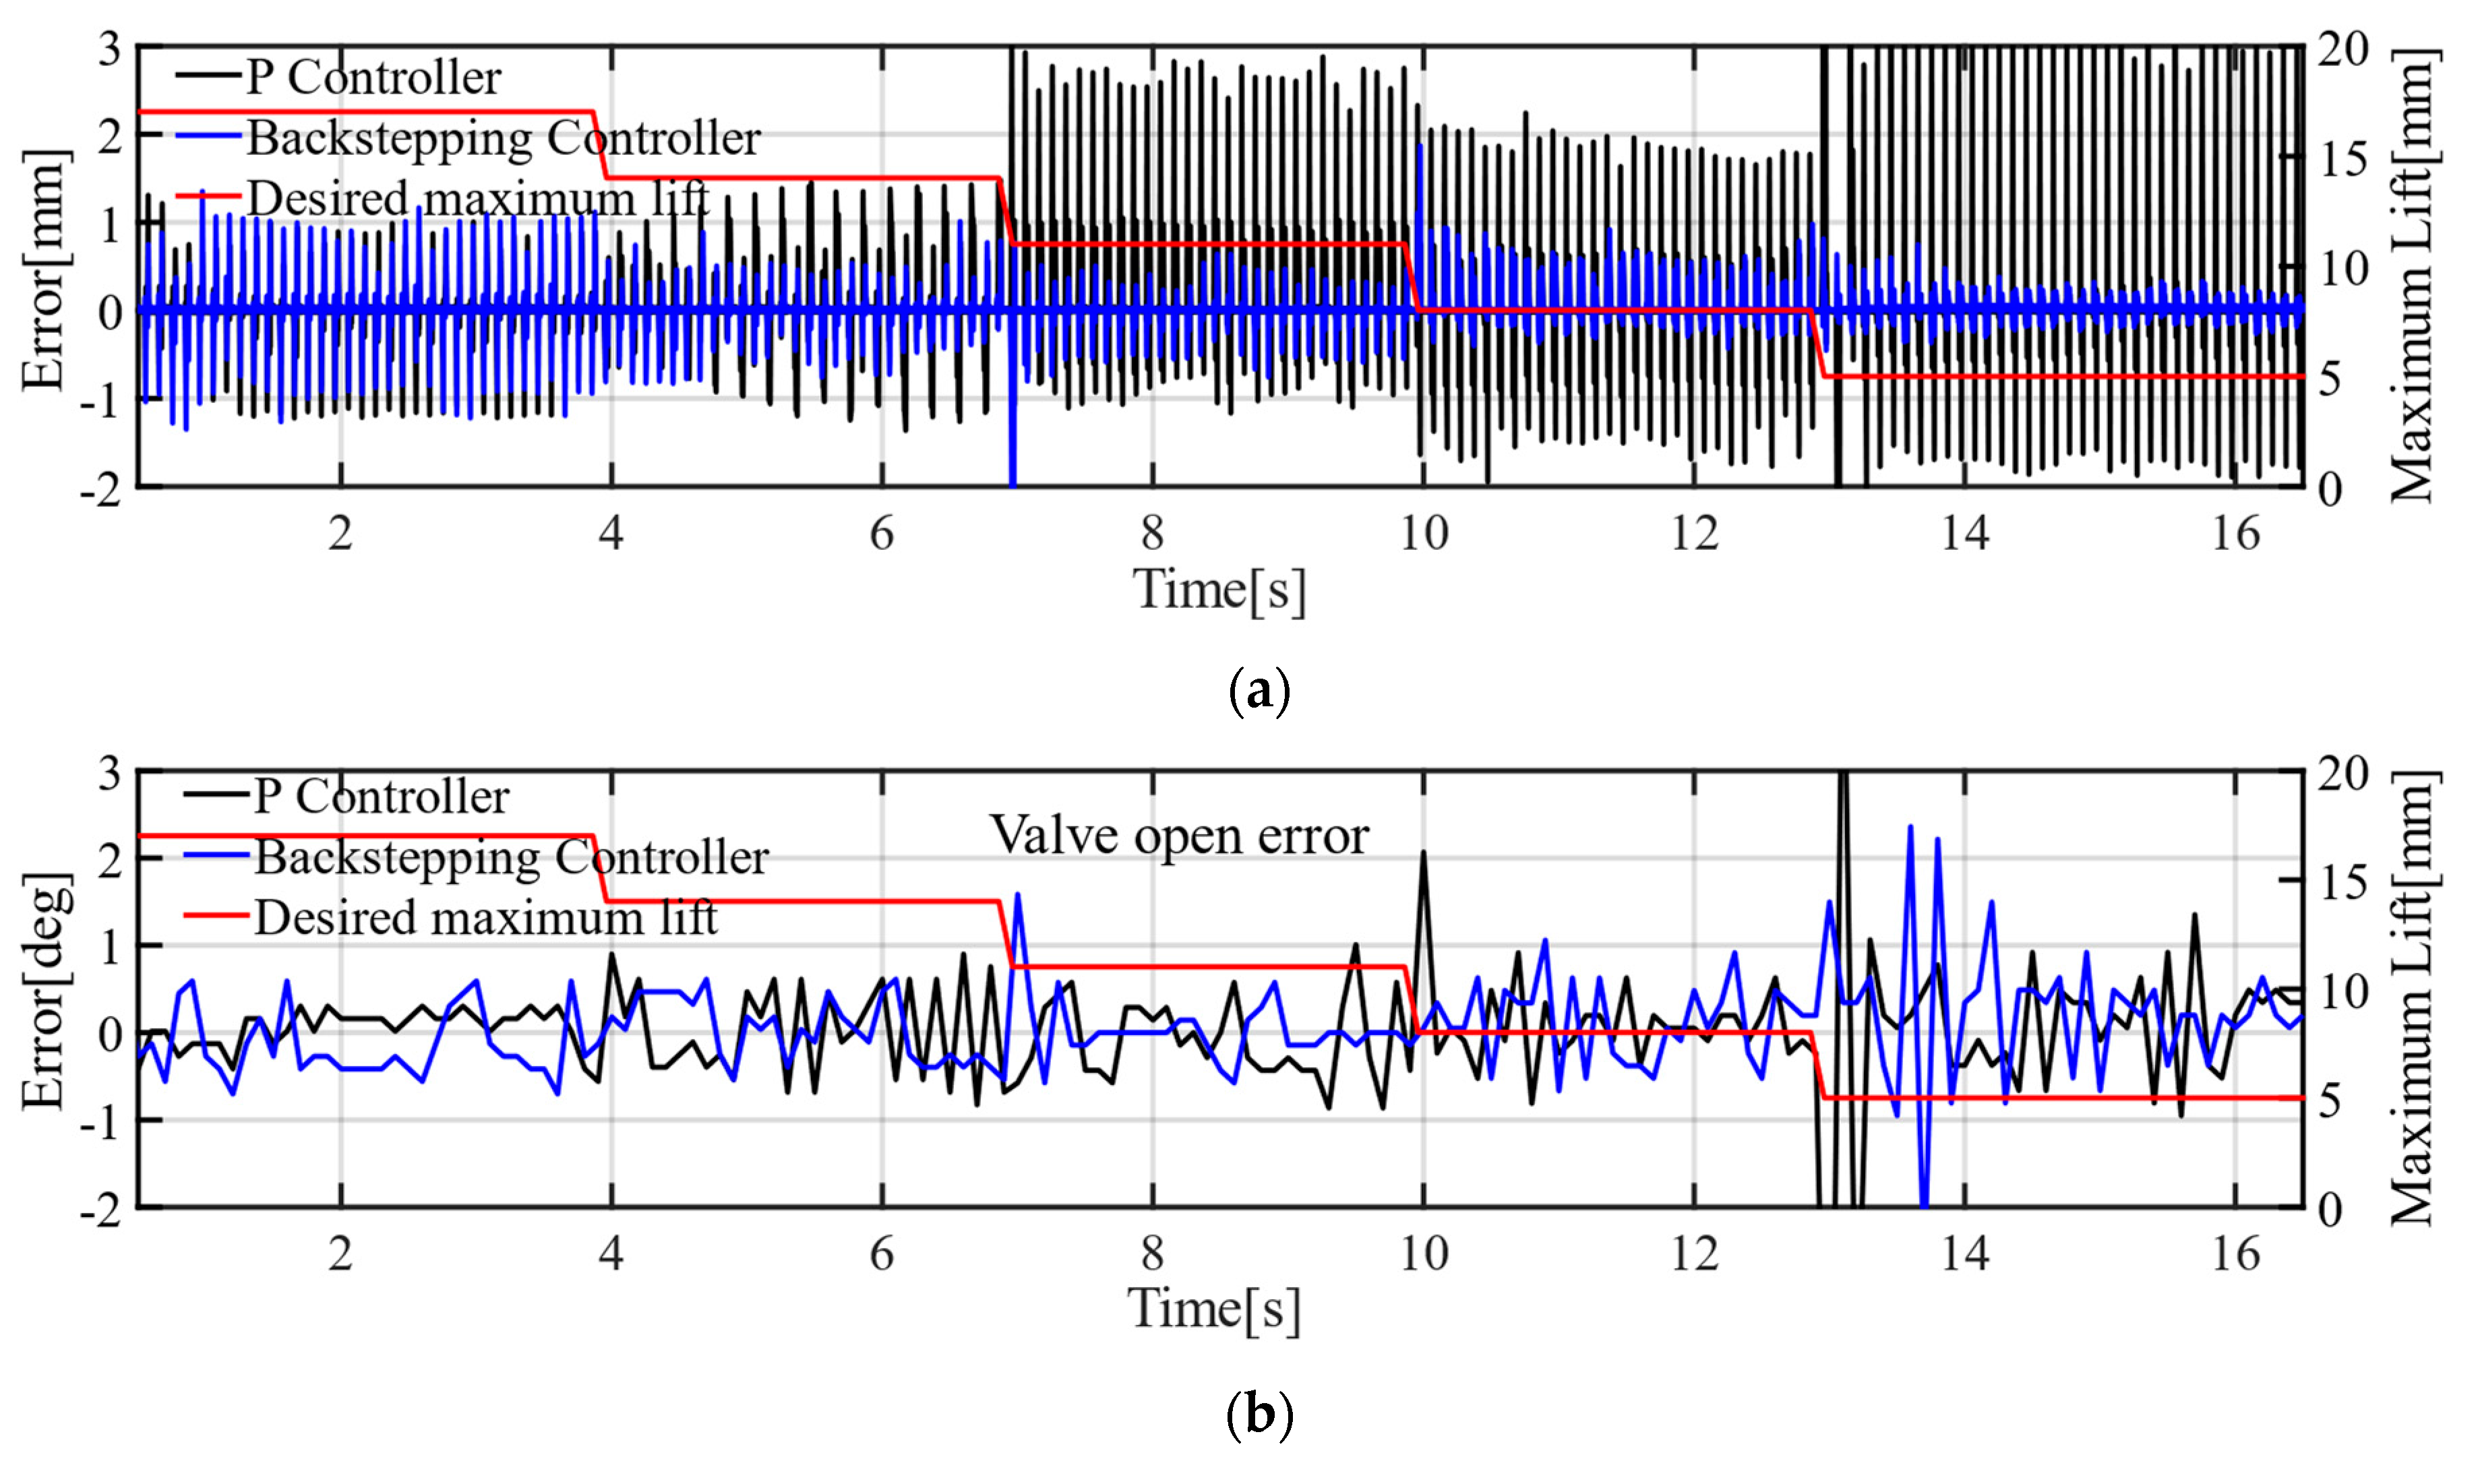
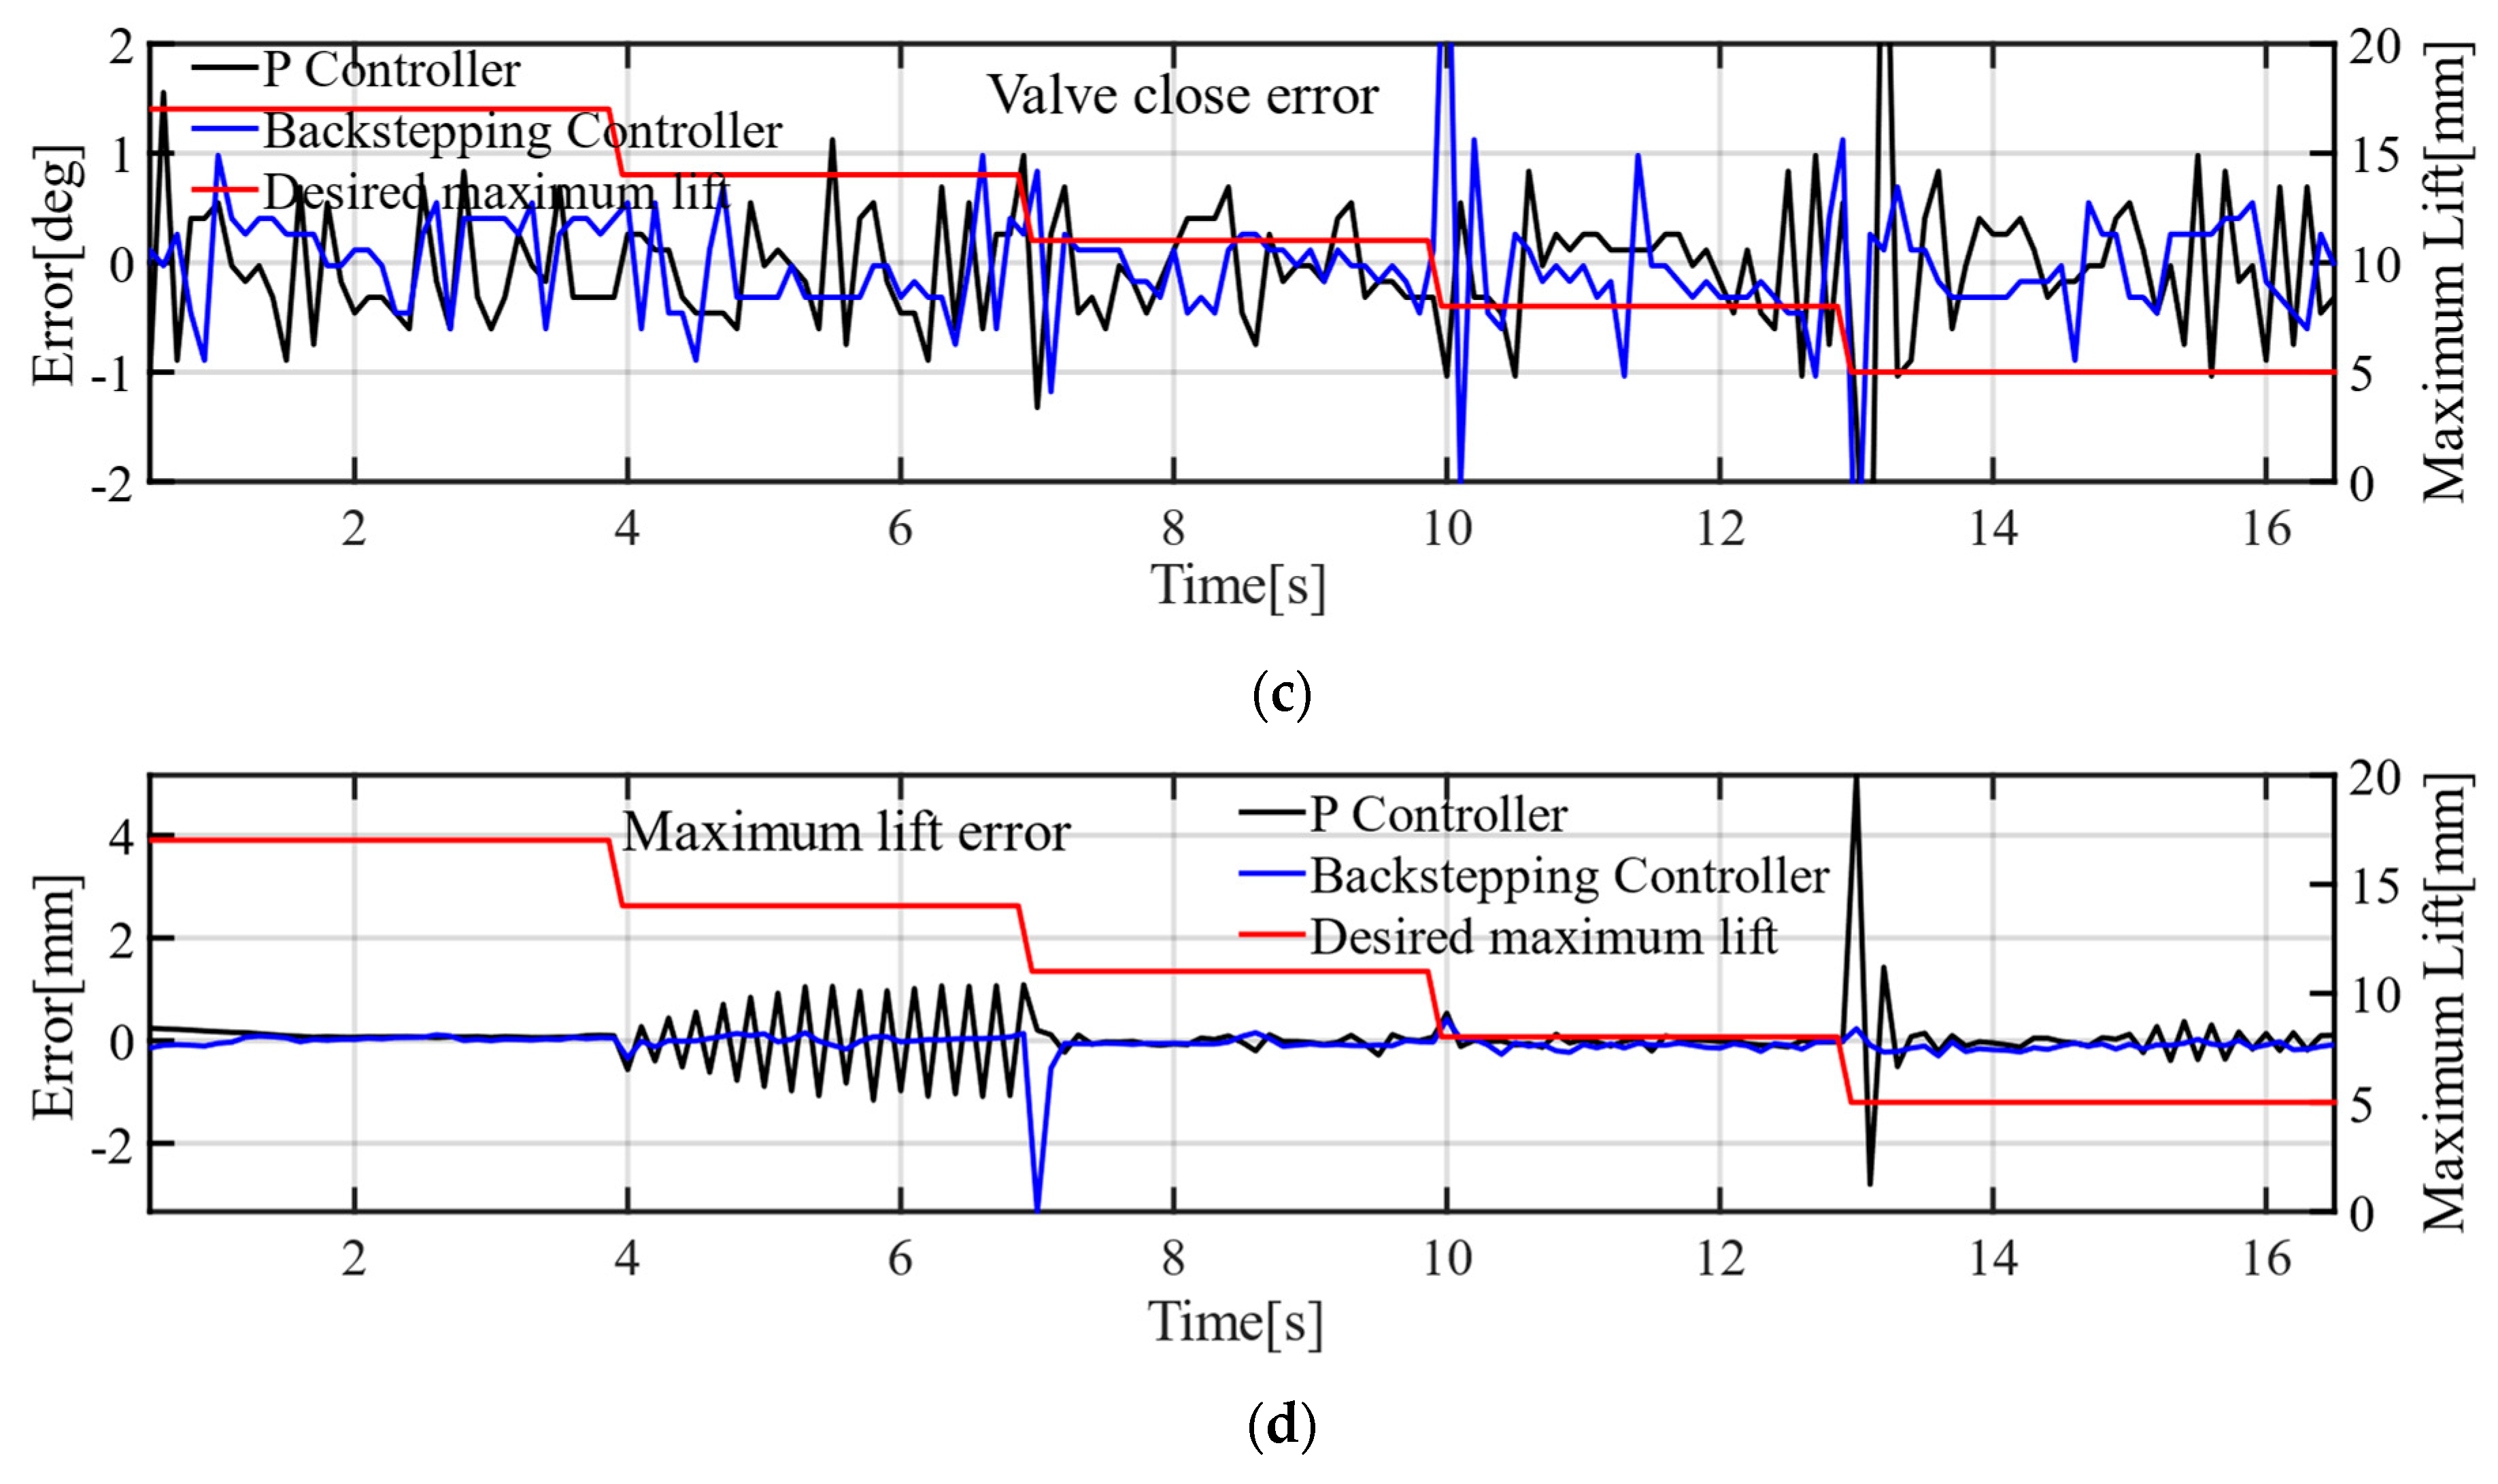
Figure 13 shows the engine valve tracking experiments with transient desired valve lift. Figure 13b–d show the engine valve open time, close time and maximum valve lift. The backstepping controller shows obvious advantages when the engine valve is moving. As shown in Figure 13a, the maximum tracking error of the backstepping controller is less than 1.5 mm, while the tracking error of the P controller is up to 3 mm. The comparison of average valve open time error, valve close time error and maximum valve lift error is shown in Table 8. The average open time error is reduced by 23.56%. The average close time error is reduced by 16.88%. The average maximum valve lift error is reduced by 65.67%. The experiment results verify the effectiveness of the delay compensation strategy.
(3) 
Valve lift tracking with transient oil supply pressure
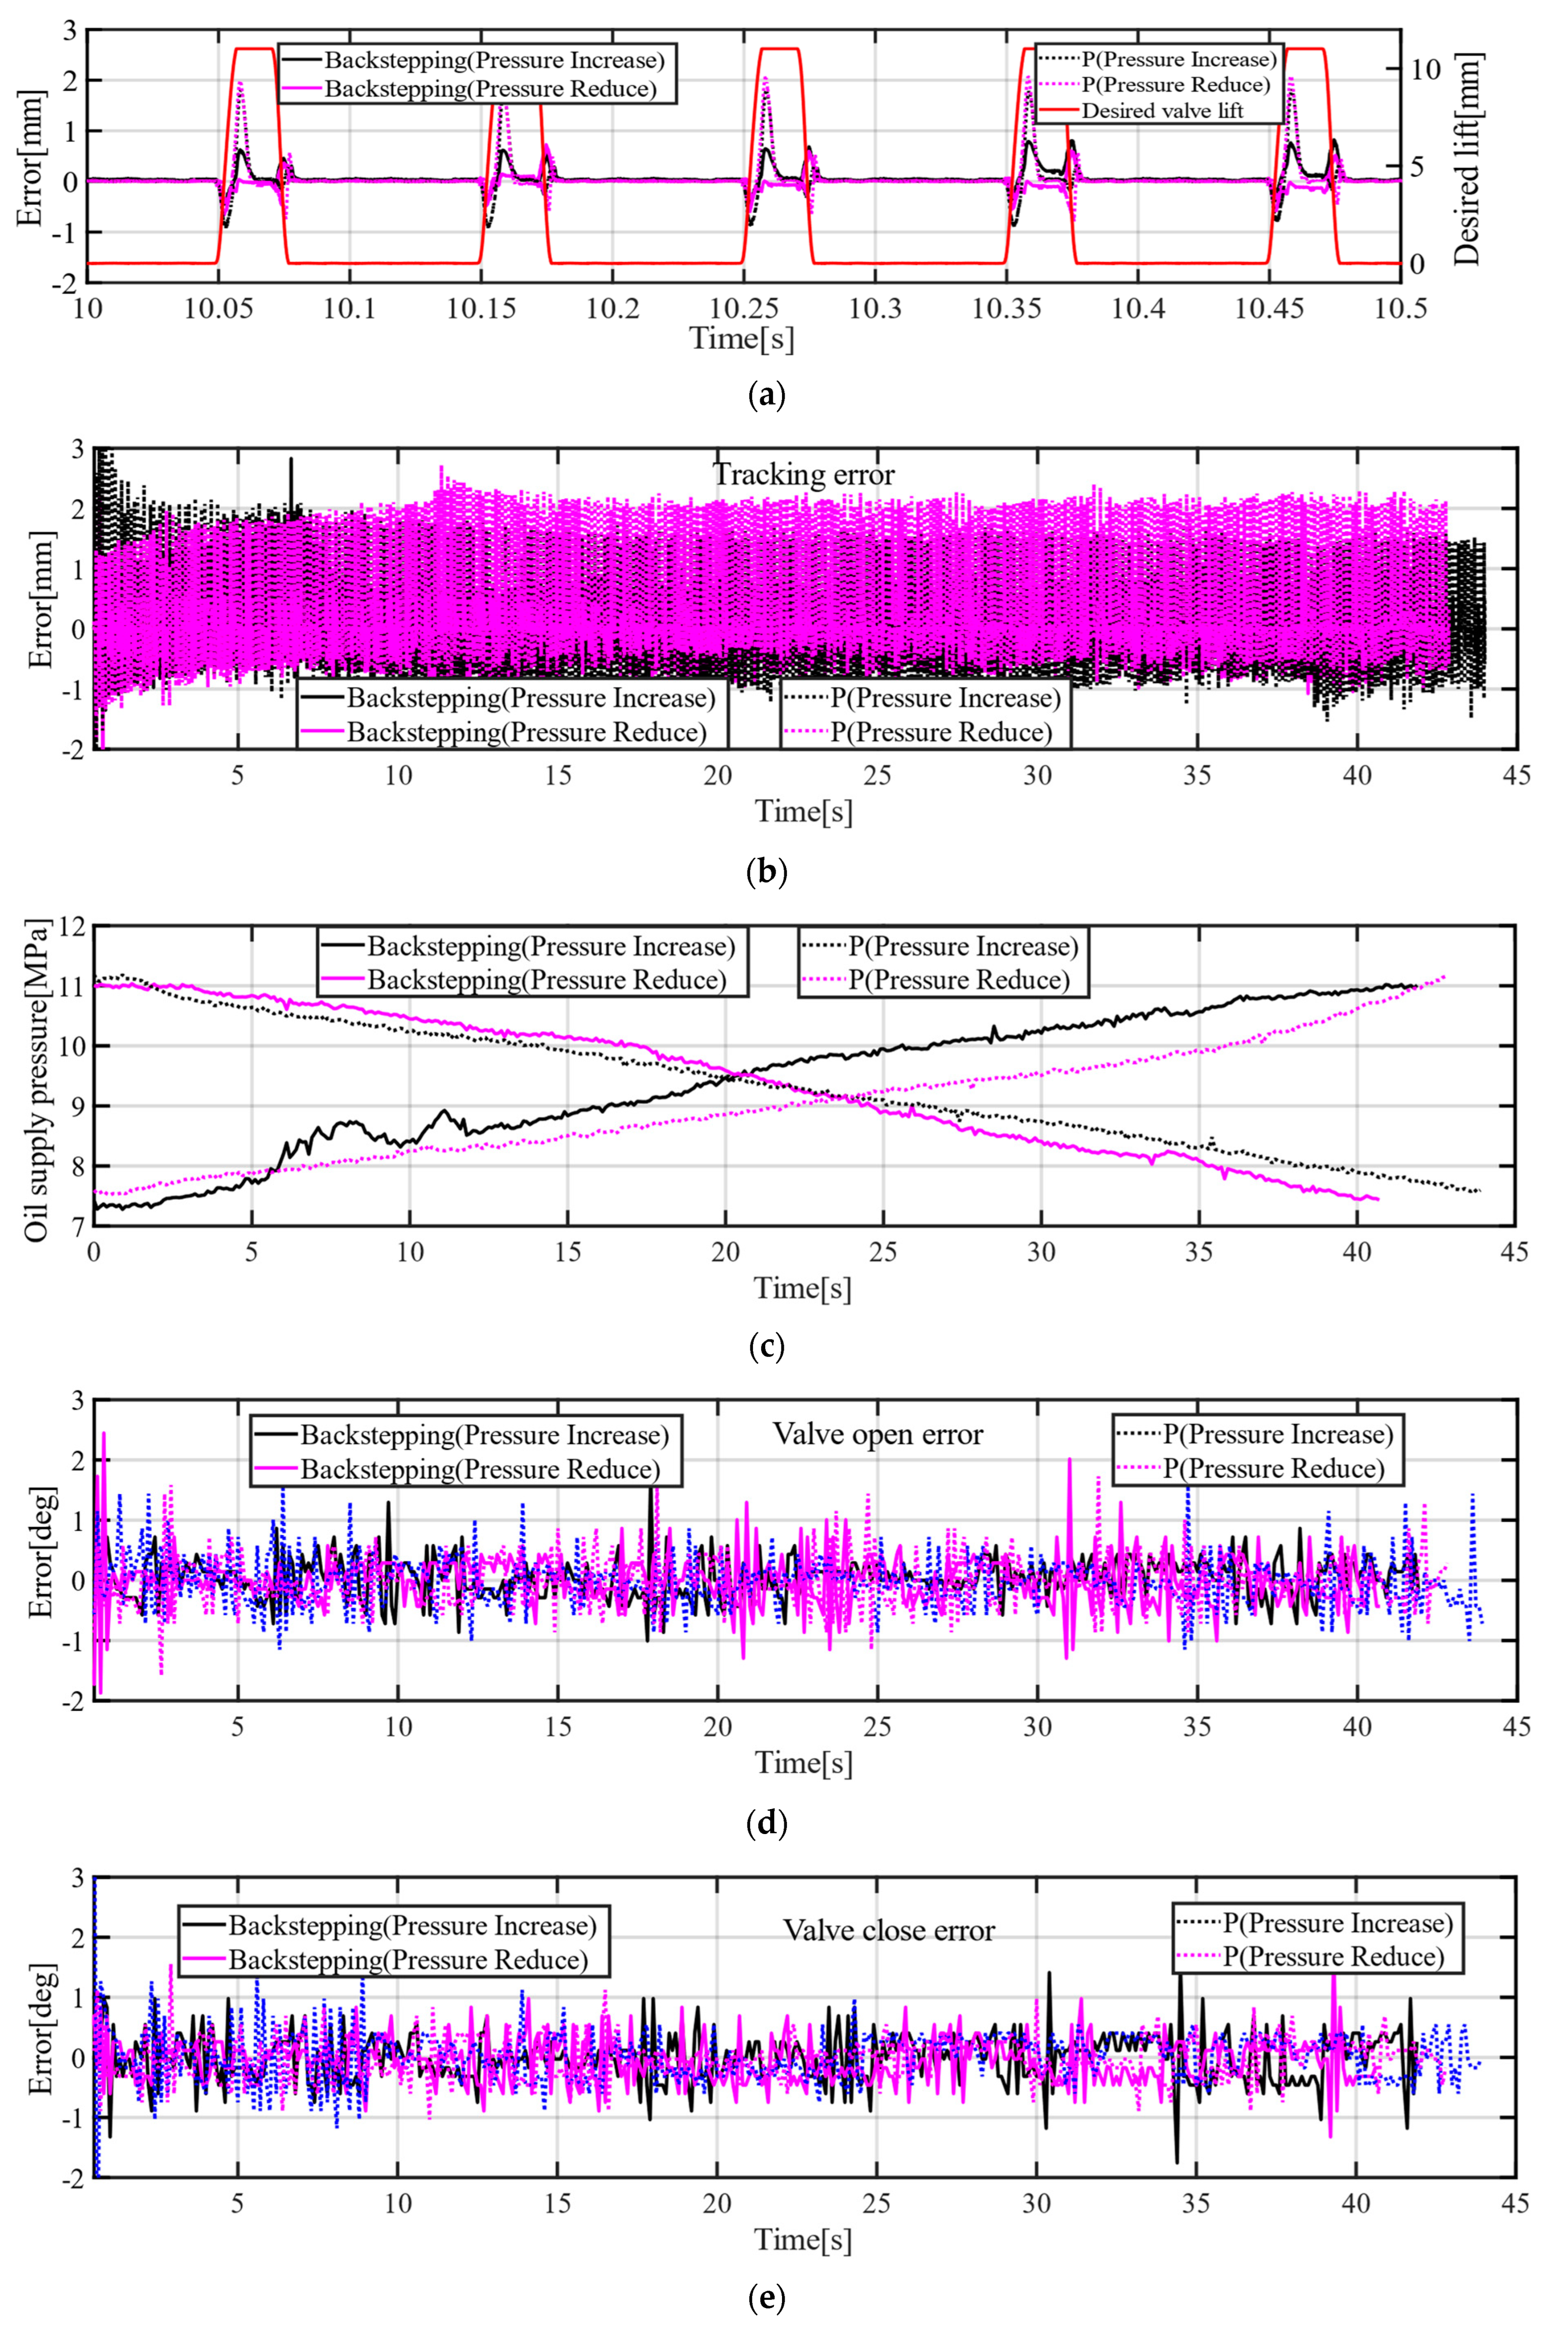
Figure 14 shows the engine valve tracking experiments with transient oil supply pressure. The maximum valve lift is 11 mm and the oil temperature is 40 ± 2 °C. The oil supply pressure can be found in Figure 14d. Figure 14a,b show the tracking error. From Figure 14a, it can be seen that with the backstepping controller, the overshoot of the valve lift can be restrained greatly. In all engine cycles, the maximum tracking error of the backstepping controller is less than that of the P controller, as shown in Figure 14b. Figure 14d–f show the valve open error, valve close error and maximum valve lift error. As shown in Table 9, with the backstepping controller, the valve open error and valve close error are not more than 0.3 °CA. The average valve open error can be reduced by 58.06%. The average valve close error can be reduced by 31.04%. The average maximum valve lift error can be reduced by 65.63%.
(4) 
Valve lift tracking with transient oil temperature
Figure 15 shows the engine valve tracking experiments with changing oil temperature. The maximum valve lift is 11 mm and the oil supply pressure is 9 MPa. With different temperature, the valve open error can be reduced by 18.33% and the valve close error can be reduced by 4%. As shown in Figure 5 and Figure 8, the oil temperature has an obvious influence on valve velocity. As shown in Table 10, the maximum valve lift error is reduced by 48.33%, which verifies the advantage of the backstepping controller in lift tracking events.

6. Conclusions

The paper focuses on the electro-hydraulic engine valve response delay analysis and compensation. The experiment results show that the engine valve response delay is affected by proportional valve response delay, proportional valve response time, maximum static friction force, etc. Complicated delay characteristics make it difficult to build a model-based delay observer. Therefore, the paper proposed a data-based delay observer to estimate engine valve response delay. The experiment results show that the oil supply pressure has an obvious influence on engine valve response delay. Therefore, the engine valve response delay is predicted by the previous five engine cycles and oil pressure fluctuations in this paper. Based on the engine valve delay observer, a delay compensation strategy which builds the virtual desired valve lift is proposed. Finally, a backstepping controller with a virtual engine valve lift is designed. The virtual desired lift is used to calculate the input signal based on the system model, and the actual desired valve lift is used to calculate tracking errors. In addition, the controller synthesizes the proportional dead-zone and uncertainties. The engine valve lift tracking experiments show that engine valve open error, valve close error and maximum valve lift can be reduced significantly both at stable conditions and transient conditions with the proposed controller. The experiment results show that the valve open error is not more than 0.39 °CA, and the valve close error is not more than 0.44 °CA at stable conditions. With transient maximum valve lift, the average open time error is reduced by 23.56%, the average close time error is reduced by 16.88% and the average maximum valve lift error is reduced by 65.67%. With transient oil supply pressure, the average valve close error can be reduced by 31.04% and the average maximum valve lift error can be reduced by 65.63%. With different temperature, the valve open error can be reduced by 18.33%, the valve close error can be reduced by 4% and the maximum valve lift error can be reduced by 48.33%. In this paper, system uncertainties are suppressed by the robust term of the controller. However, for actual engine tests, there are many uncertainties such as transient cylinder pressure and engine vibration. In the future, engine bench experiments are necessary to verify the effectiveness of the controller proposed in this paper.

Author Contributions

Conceptualization, J.L.; methodology, J.L. and Y.L.; software, F.H. and G.Z.; validation, J.L. and L.M.; formal analysis, L.M. and G.Z.; investigation, Y.L. and G.Z.; resources, F.H. and G.Z.; data curation, F.H. and G.Z.; writing—original draft preparation, J.L. and Y.L.; writing—review and editing, J.L.; visualization, Y.L. and L.M.; supervision, Y.L.; project administration, J.L. and Y.L.; funding acquisition, Y.L. and F.H. All authors have read and agreed to the published version of the manuscript.

Funding

This research was funded by the National Natural Science Foundation of China under Grants 51979059 and 51579050 and Fundamental Research Funds for the Central Universities under Grant 3072021CF0303.

Institutional Review Board Statement

Not applicable.

Informed Consent Statement

Not applicable.

Data Availability Statement

The data presented in this study are available on request from the corresponding author.

Conflicts of Interest

The authors declare no conflict of interest.

References

  1. Hong, H.; Parvate-Patil, G.B.; Gordon, B. Review and analysis of variable valve timing strategies—Eight ways to approach. Proc. Inst. Mech. Eng. Part D J. Automob. Eng. 2016, 218, 1179–1200. [Google Scholar] [CrossRef]
  2. Fontana, G.; Galloni, E. Variable valve timing for fuel economy improvement in a small spark-ignition engine. Appl. Energy 2009, 86, 96–105. [Google Scholar] [CrossRef]
  3. Gerlach, A.; Fritsch, M.; Benecke, S.; Rottengruber, H.; Leidhold, R. Variable Valve Timing With Only One Camshaft Actuator for a Single-Cylinder Engine. IEEE/ASME Trans. Mechatron. 2019, 24, 1839–1850. [Google Scholar] [CrossRef]
  4. Lou, Z.; Zhu, G. Review of Advancement in Variable Valve Actuation of Internal Combustion Engines. Appl. Sci. 2020, 10, 1216. [Google Scholar] [CrossRef]
  5. Fafa, L.; Hua, L.; Fengjun, G.; Yunkai, W.; Mangzhi, T.; Yingnan, G.; Yaping, P. A new electro-hydraulic variable valve-train system for I.C engine. In Proceedings of the 2010 2nd International Asia Conference on Informatics in Control, Automation and Robotics (CAR 2010), Wuhan, China, 6–7 March 2010; pp. 174–179. [Google Scholar]
  6. Li, Y.; Khajepour, A.; Devaud, C. Realization of variable Otto-Atkinson cycle using variable timing hydraulic actuated valve train for performance and efficiency improvements in unthrottled gasoline engines. Appl. Energy 2018, 222, 199–215. [Google Scholar] [CrossRef]
  7. Uysal, F.; Sagiroglu, S. The Effects of a Pneumatic-Driven Variable Valve Timing Mechanism on the Performance of an Otto Engine. Stroj. Vestn.—J. Mech. Eng. 2015, 61, 621–631. [Google Scholar] [CrossRef]
  8. Kim, J.; Chang, J. A New Electromagnetic Linear Actuator for Quick Latching. IEEE Trans. Magn. 2007, 43, 1849–1852. [Google Scholar] [CrossRef]
  9. Hattori, M.; Inoue, T.; Mashiki, Z.; Takenaka, A.; Urushihata, H.; Morino, S.; Inohara, T. Development of Variable Valve Timing System Controlled by Electric Motor. SAE Int. J. Engines 2008, 1, 985–990. [Google Scholar] [CrossRef]
  10. Yuan, Z.; Fu, J.; Liu, Q.; Ma, Y.; Zhan, Z. Quantitative study on influence factors of power performance of variable valve timing (VVT) engines and correction of its governing equation. Energy 2018, 157, 314–326. [Google Scholar] [CrossRef]
  11. Flierl, R.; Gollasch, D.; Knecht, A.; Hannibal, W. Improvements to a Four Cylinder Gasoline Engine through the Fully Variable Valve Lift and Timing System UniValve®; SAE Technical Paper Series; SAE International: Warrendale, PA, USA, 2006. [Google Scholar]
  12. Pan, J.; Khajepour, A.; Li, Y.; Yang, J.; Liu, W. Performance and power consumption optimization of a hydraulic variable valve actuation system. Mechatronics 2021, 73, 102479. [Google Scholar] [CrossRef]
  13. Sher, E.; Bar-Kohany, T. Optimization of variable valve timing for maximizing performance of an unthrottled SI engine—A theoretical study. Energy 2002, 27, 757–775. [Google Scholar] [CrossRef]
  14. Onyeka, A.E.; Yan, X.-G.; Mu, J. Sliding Mode Control of Time-Delay Systems with Delayed Nonlinear Uncertainties. IFAC-Pap. 2017, 50, 2696–2701. [Google Scholar] [CrossRef]
  15. Yao, R.H.; Xie, Y.F.; Jiang, Z.H. Design of Fuzzy-PI-Smith controller for time delay system. In Proceedings of the 2010 Chinese Control and Decision Conference, Xuzhou, China, 26–28 May 2010; pp. 371–375. [Google Scholar]
  16. Nasiri, M.; Montazeri-Gh, M. Time-delay compensation for actuator-based hardware-in-the-loop testing of a jet engine fuel control unit. Proc. Inst. Mech. Eng. Part I J. Syst. Control Eng. 2012, 226, 1371–1380. [Google Scholar] [CrossRef]
  17. Krata, D.; Ochman, M.; Panek, M.; Skoczen, M.; Spyra, K.; Kulas, Z.; Sroczynski, D.; Pawlowski, A. Adaptive Smith Predictor Control Scheme for a Nonlinear Hydraulic System. In Proceedings of the 2021 26th IEEE International Conference on Emerging Technologies and Factory Automation (ETFA), Vasteras, Sweden, 7–10 September 2021; pp. 1–6. [Google Scholar]
  18. Jin, M.; Kim, J.; Ba, D.X.; Park, H.G.; Ahn, K.K.; Yoon, J.I. Time delay control of a pump-controlled electro-hydraulic actuator. In Proceedings of the 2015 15th International Conference on Control, Automation and Systems (ICCAS), Busan, Korea, 13–16 October 2015; pp. 847–850. [Google Scholar]
  19. He, Q.; Liu, J. An observer for a velocity-sensorless VTOL aircraft with time-varying measurement delay. Int. J. Syst. Sci. 2014, 47, 652–661. [Google Scholar] [CrossRef]
  20. Sadath, A.; Vyasarayani, C.P. Galerkin Approximations for Stability of Delay Differential Equations with Distributed Delays. J. Comput. Nonlinear Dyn. 2015, 10, 061024. [Google Scholar] [CrossRef]
  21. Wang, J.-W.; Sun, C.-Y. Delay-Dependent Exponential Stabilization for Linear Distributed Parameter Systems with Time-Varying Delay. J. Dyn. Syst. Meas. Control 2018, 140, 051003. [Google Scholar] [CrossRef]
  22. Ghogare, M.G.; Musmade, B.B.; Patil, S.L.; Patre, B.M. Robust regulation of time-delay processes using sliding mode control. In Proceedings of the 2020 SICE International Symposium on Control Systems (SICE ISCS), Tokushima, Japan, 3–5 March 2020; pp. 55–60. [Google Scholar]
  23. Lu, M.-C. Adaptive receding horizon control for a class of linear time delay systems. In Proceedings of the 2011 24th Canadian Conference on Electrical and Computer Engineering (CCECE), Niagara Falls, ON, Canada, 8–11 May 2011; pp. 001406–001410. [Google Scholar]
  24. Li, W.; Zhang, Z. Controller Design for Nonlinear Uncertain Systems with Time Delays via Backstepping Method. IFAC-Pap. 2021, 54, 18–22. [Google Scholar] [CrossRef]
  25. Choux, M.; Hovland, G. Adaptive Backstepping Control of Nonlinear Hydraulic-Mechanical System Including Valve Dynamics. Modeling Identif. Control A Nor. Res. Bull. 2010, 31, 35–44. [Google Scholar] [CrossRef]
  26. Sirouspour, M.R.; Salcudean, S.E. Nonlinear control of hydraulic robots. IEEE Trans. Robot. Autom. 2001, 17, 173–182. [Google Scholar] [CrossRef]
  27. Marques, F.; Woliński, Ł.; Wojtyra, M.; Flores, P.; Lankarani, H.M. An investigation of a novel LuGre-based friction force model. Mech. Mach. Theory 2021, 166, 104493. [Google Scholar] [CrossRef]
  28. Lampaert, V.; Swevers, J.; Al-Bender, F. Modification of the Leuven integrated friction model structure. IEEE Trans. Autom. Control 2002, 47, 683–687. [Google Scholar] [CrossRef]
  29. Yin, Y.; Rakheja, S.; Boileau, P.-E.; Yang, F. Seal friction characteristics of a hydro-pneumatic suspension strut. In Proceedings of the 2017 International Conference on Advanced Mechatronic Systems (ICAMechS), Xiamen, China, 6–9 December 2017; pp. 495–500. [Google Scholar]
  30. Lu, Y.; Li, J.; He, F.; Miao, L. Global Synchronous Optimization Including Intake Valves and Exhaust Valves Based on MODM Strategy. IEEE Trans. Veh. Technol. 2020, 69, 14858–14868. [Google Scholar] [CrossRef]
  31. Deng, W.; Yao, J.; Ma, D. Robust adaptive precision motion control of hydraulic actuators with valve dead-zone compensation. ISA Trans. 2017, 70, 269–278. [Google Scholar] [CrossRef] [PubMed]
  32. Li, J.; Lu, Y.; He, F.; Miao, L. High-Frequency Position Servo Control of Hydraulic Actuator with Valve Dynamic Compensation. Actuators 2022, 11, 96. [Google Scholar] [CrossRef]
Figure 1. HVVA schematic and prototype. (a) HVVA schematic; (b) HVVA prototype.
Machines 10 00701 g001
Figure 2. Engine valve response delay analysis.
Machines 10 00701 g002
Figure 3. Proportional valve delay analysis with different command signals (40 ± 2 °C). (a) Proportional valve delay with different initial spool positions; (b) proportional valve delay when initial valve spool is at −4.
Machines 10 00701 g003
Figure 4. Engine valve open delay analysis under different oil supply pressures (40 ± 2 °C). (a) Engine valve open delay analysis; (b) pressure vs. delay.
Machines 10 00701 g004aMachines 10 00701 g004b
Figure 5. Engine valve open delay analysis with different oil temperatures.
Machines 10 00701 g005
Figure 6. Engine valve close delay analysis with different maximum valve lifts.
Machines 10 00701 g006
Figure 7. Engine valve close delay analysis with different oil supply pressures.
Machines 10 00701 g007
Figure 8. Engine valve close delay analysis with different oil temperatures.
Machines 10 00701 g008
Figure 9. The parameterized engine lift.
Machines 10 00701 g009
Figure 10. The virtual engine lift.
Machines 10 00701 g010
Figure 11. The decoupling strategy for the engine valve motion.
Machines 10 00701 g011
Figure 12. Engine valve lift tracking experiments at stable conditions (Temp = 40 ± 2 °C; P h = 9 MPa). (a) Engine valve lift tracking experiments; (b) engine valve lift tracking errors; (c) engine valve lift tracking errors (P); (d) engine valve lift tracking errors (backstepping); (e) comparison of engine valve open time error; (f) comparison of engine valve close time error; (g) comparison of maximum valve lift error.
Machines 10 00701 g012aMachines 10 00701 g012b
Figure 13. Engine valve lift tracking experiments with transient maximum valve lift (Temp = 40 ± 2 °C; P h = 9 MPa). (a) Engine valve lift tracking errors; (b) comparison of engine valve open time error; (c) comparison of engine valve close time error; (d) comparison of maximum valve lift error.
Machines 10 00701 g013aMachines 10 00701 g013b
Figure 14. Engine valve lift tracking experiments with different oil supply pressures (Temp = 40 ± 2 °C). (a) Engine valve lift tracking experiments; (b) engine valve tracking error; (c) oil supply pressure; (d) comparison of engine valve open time error; (e) comparison of engine valve close time error; (f) comparison of maximum valve lift error.
Machines 10 00701 g014aMachines 10 00701 g014b
Figure 15. Engine valve lift tracking experiments with transient oil temperature (Ph = 9 MPa). (a) Comparison of engine valve open time error; (b) comparison of engine valve close time error; (c) comparison of maximum valve lift error.
Machines 10 00701 g015aMachines 10 00701 g015b
Table 1. HVVA parameters.
Parameter (Unit)ExplanationValue
A B (m2)Effective area of Chamber B6.362 × 10−5
A C (m2)Effective area of Chamber C9.0321 × 10−5
A D (m2)Effective area of Chamber D1.0367 × 10−4
m (g)Mass of motion parts170
Table 2. System parameters.
ItemTypeParameters
DAQ boardNI PCI-6281Input: 16 channels (500 kS/s)
Output: 2 channels
Displacement sensormicro-epsilon 2300Range: 25 mm (50 kHz)
Pressure sensorMD-HF-25M-1-ARange: 25 MPa
Response frequency > 50 kHz
Power supply4NIC-X288-4L4 × 24 V/3 A
Table 3. Model parameters.
Parameter (Unit)ValueParameter (Unit)Value
β e   ( P a ) 1.7 × 10⁹ σ 2 (N/m/s)10
V B (m3)1.2 × 10⁻⁵ α 0 0.0002
V C (m3)1.3 × 10⁻⁴ α 1 0.00045
V D (m3)1.8 × 10⁻⁵ x ˙ s (m/s)0.2
K B 2 × 10⁻⁷ λ 2
K C 5 × 10⁻⁸ μ d + 1.05
K D 2 × 10⁻⁷ μ d 0.45
C l B 5 × 10⁻¹³ β 1 248
C l D 5 × 10⁻¹³ β 2 23660
σ 0 (N/m)400,000 β 3 26.69
σ 1 (N/m/s)300
Table 4. Parameters of dead-zone inverse.
ParameterValueParameterValue
m r 1 m l 1
b r 2.55 b l −2.5
ϵ 0.2
Table 5. P controller feedback gains.
ParameterValueParameterValue
K p 1 0.1 K p 4 0.02
K p 2 0.005 K p 5 0.005
K p 3 0.1
Table 6. Controller parameters.
ParameterValueParameterValue
k 1 100 k v s 1 10
k 2 s 1 20 k v s 2 10
k 2 s 2 20
Table 7. Comparison of valve lift tracking performance at stable conditions.
ControllerOpen Time ErrorClose Time ErrorMaximum Lift Error
P (17 mm)0.2672 (°CA)0.4228 (°CA)0.0988 (mm)
Backstepping (17 mm)0.1792 (°CA)0.4070 (°CA)0.1411 (mm)
Reduced32.93%3.74%−42.81%
P (14 mm)0.2052 (°CA)0.3712 (°CA)0.1059 (mm)
Backstepping (14 mm)0.1971 (°CA)0.3468 (°CA)0.1140 (mm)
Reduced3.95%6.52%−7.65%
P (11 mm)0.4214 (°CA)0.3662 (°CA)0.1896 (mm)
Backstepping (11 mm)0.3528 (°CA)0.2048 (°CA)0.1223 (mm)
Reduced16.28%44.07%35.50%
P (8 mm)0.3942 (°CA)0.4650 (°CA)0.2007 (mm)
Backstepping (8 mm)0.3376 (°CA)0.4366 (°CA)0.1504 (mm)
Reduced14.36%6.11%25.10%
P (5 mm)0.4224 (°CA)0.4500 (°CA)0.1987 (mm)
Backstepping (5 mm)0.3900 (°CA)0.4320 (°CA)0.0868 (mm)
Reduced7.67%4.00%56.32%
Table 8. Comparison of valve lift tracking performance with transient valve lifts.
ControllerOpen Time ErrorClose Time ErrorMaximum Lift Error
P0.5251 (°CA)0.4679 (°CA)0.3158 (mm)
Backstepping0.4014 (°CA)0.3889 (°CA)0.1084 (mm)
Reduced23.56%16.88%65.67%
Table 9. Comparison of valve lift tracking performance with different oil supply pressures.
ControllerOpen Time ErrorClose Time ErrorMaximum Lift Error
P (increasing pressure)0.4536 (°CA)0.3844 (°CA)0.2224 (mm)
Backstepping (increasing pressure)0.2484 (°CA)0.2822 (°CA)0.0810 (mm)
Reduced45.24%26.59%63.58%
P (reducing pressure)0.4572 (°CA)0.3438 (°CA)0.1507 (mm)
Backstepping (reducing pressure)0.1332 (°CA)0.2218 (°CA)0.0487 (mm)
Reduced70.87%35.49%67.68%
Table 10. Comparison of valve lift tracking performance with transient oil temperature.
ControllerOpen Time ErrorClose Time ErrorMaximum Lift Error
P0.3769 (°CA)0.3494 (°CA)0.1583 (mm)
Backstepping0.3078 (°CA)0.3354 (°CA)0.0818 (mm)
Reduced18.33%4.00%48.33%
Publisher’s Note: MDPI stays neutral with regard to jurisdictional claims in published maps and institutional affiliations.