Abstract
The variable hyperbolic circular arc tooth trace (VH-CATT) cylindrical gear is a new gear suitable for heavy loads and high speed. The special structure of the gear provides excellent mechanical properties but also increases the processing difficulty. The special machine tool for VH-CATT gear provides a prerequisite for mass production, but the machining accuracy remains to be improved. Therefore, this paper proposes a Kriging model based on the glowworm swarm optimization algorithm of scene understanding (SGSO) to study the relationship between input parameters and output precision. Then, the SGSO algorithm is used to optimize the parameters of the Gaussian mutation function in the Kriging model to improve its fitting accuracy. When solving four groups of tooth profile and tooth direction errors, the key precision index, R2, of SGSO-Kriging all exceed 0.95. Additionally, the feasibility of the model is verified by the residual diagram and the box diagram. The contour diagram and error results show that reducing the feeding velocity, vf, can improve accuracy most efficiently, and the increase of rotational speed, n, is more conducive to the accuracy of the tooth surface than the acceleration of the coolant, vQ. The above research provides an optimization strategy of gear machining accuracy and a theoretical basis for the promotion of the VH-CATT gear.
1. Introduction
The variable hyperbolic circular arc tooth trace (VH-CATT) cylindrical gear is a new type of gear which could be suitable for scenarios of heavy load and high precision [1]. Its tooth line is a spatial arc trace, and the tooth thickness gradually decreases from the middle to both sides. Compared with the spur or helical gear, the VH-CATT gear is insensitive to installation coaxiality error and has the advantages of low noise and stable performance, which can meet the transmission requirements of high speed and heavy load in aerospace and other fields [2,3,4,5].
The above literature has demonstrated the advantages of the gear, but due to the lack of efficient processing equipment, the VH-CATT gear has not been marketed. Therefore, a special machine tool of VH-CATT gear was proposed, which mass produced the gear according to the generating method [6,7,8]. The research on vibration and stability of the special machine tools has been completed in previous work. According to the research results, a series of kinetic parameters are selected, and gears with different modulus can be successfully machined. Based on controlling the dynamic error of the machine tool, the principle of reducing the error in the machining process is analyzed to guide the machining parameter setting.
The error caused by machining is a part of the overall gear error that can hardly be ignored. In the gear machining process, the process effect is often complicated. At present, the main solution to the machining error is in the form of compensation, commonly used in the spur gear and the helical gear [9]. However, for sphere and other space surfaces, the effect of compensation to reduce error is limited. The idea of this paper is to explore the formation law of machining error as far as possible from the manufacturing process and control the error generated by the manufacturing process through the control parameters.
In practical engineering, the relationship between uncertainties and design objectives is highly nonlinear, and it is often expressed by implicit functions [10]. This paper uses the surrogate model to explore the relationship between the machining setting and error. For instance, the surrogate model can approximate the relationship between the input conditions and output results, and it can establish the corresponding explicit expression. Dey et al. established the Kriging surrogate model for stochastic free vibration analysis of composite shallow doubly curved shells and analyzed the influence of random variation of input parameters on output natural frequency [11]. Li et al. proposed a new local approximation method using the most probable point (MPP) to find feasible constraints and accurately approximates feasible constraints which can significantly improve the optimization efficiency of reliability-based design optimization (RBDO) methods using the Kriging model [12]. Bruce et al. extended the basic theory of Kriging, such as the design and analysis of deterministic computer experiments, to random simulation settings [13]. Many scholars have studied Kriging and applied it to engineering. However, there is a common problem of the limited accuracy and convergence in the face of specific problems. Therefore, it is necessary to improve the performance of the surrogate model.
For the Kriging model, optimizing the parameters of the Gaussian mutation function could help to improve accuracy by several optimization algorithms. Swarm intelligence optimization algorithms can be used to solve and predict some key parameters of the Kriging model, including the glowworm swarm optimization algorithm (GSO) [14], the particle swarm algorithm (PSO), the whale optimization algorithm (WOA) [15], and other swarm intelligence optimization algorithms. Among many algorithms, the SGSO algorithm uses the golden section [16] ratio and chaos optimization [17] to improve the search ability of the population. In addition, the solution accuracy and efficiency of the algorithm is improved through the scene understanding mechanism. Therefore, it is suitable for improving the performance of the Kriging model.
In this paper, the influence of the main processing parameters of the VH-CATT cylindrical gear on the tooth surface error is discussed based on the surrogate model. First, according to the results of the experiment design, 64 groups of experiments were conducted to obtain the training set and test set. Then, the SGSO algorithm is introduced to improve the Kriging model and to optimize parameters of the Gaussian mutation function. The processing parameters include the cutter head speed and feeding speed as the independent variables and the tooth surface error of the gear as the state function. Finally, the effectiveness of the SGSO-Kriging model is verified by the residual graph and three convergence indexes. The effect of the three factors on error can be clearly judged by observing the contour map. The influence law of each factor is discussed, which provides a theoretical basis for reducing the machining error and a reference for the subsequent industrialization of the VH-CATT gears.
2. Special Machine Tool VH-CATT Cylindrical Gear
Duo to the special structure, the VH-CATT gear is expected to become the reduction box gear of the new generation of the China Railway Highspeed Electric Multiple Units (CRH-EMUs). Except that the tooth profile of the middle section is involute, the other sections are envelopes of a family of hyperbolas with uniform change [1], whose structure is shown in Figure 1. This structure obtains the ability of automatic alignment and does not produce axial force. Compared with the helical gear, the load of bearing is reduced.
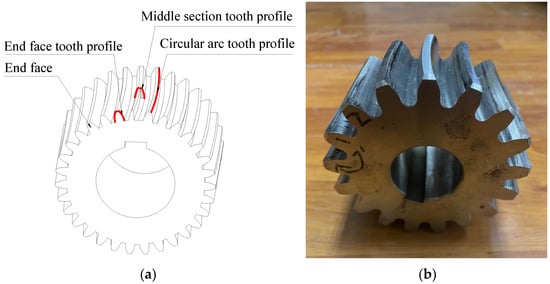
Figure 1.
Structure of VH-CATT gear: (a) digital model; (b) experimental prototype.
To promote the industrial application of this new gear, the author’s research group designed and built a special machine tool for the VH-CATT gear. According to the generating principle, the gear can be processed efficiently. The special machine tool consists of three translational axes and a gear grading mechanism. The cutter is fixed on the cutter head and rotates; the structure is shown in Figure 2 and Figure 3.
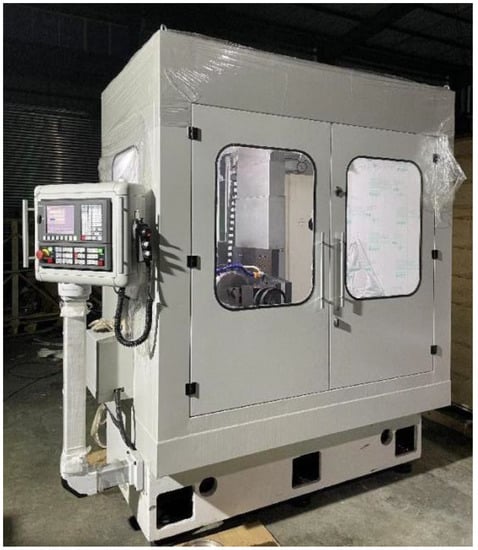
Figure 2.
The structure of VH-CATT gear machine tool.
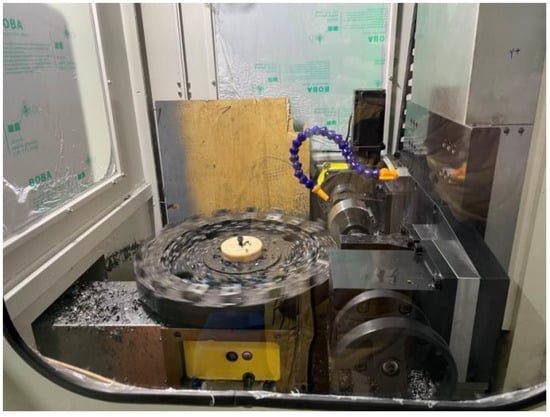
Figure 3.
The executive component structure.
3. Experimental Design
3.1. Experimental Process
The surrogate model establishes the relationship between the design parameter variables and the response parameters according to the input and output variables of the actual model. The process of the surrogate model is shown in Figure 4. Therefore, the establishment of the surrogate model can generally be summarized as the following steps:
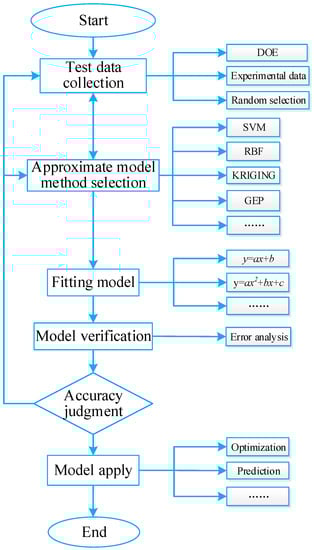
Figure 4.
Flow chart of surrogate model.
- (1)
- Determine the design variables and select the appropriate experimental design method to obtain the sample point input for establishing the surrogate model.
- (2)
- The corresponding value of each sample point is obtained by physical experiment, numerical simulation, or analytical calculation.
- (3)
- The input and output data obtained based on the above steps are fitted according to the different algorithms for establishing the surrogate model, the corresponding parameters are calculated, and the surrogate model is established.
- (4)
- For the established surrogate model, the accuracy of the surrogate model is tested according to the accuracy of practical application. The surrogate model that meets the test requirements can be used for prediction and optimization.
3.2. Machining Characteristic Value
Taking the gear of a new generation of high-speed railway transmission gear as the research object, this paper plans to use the VH-CATT cylindrical gear pair to replace the helical gear pair used in the current transmission case to eliminate the excessive axial force and prolong the service life of the bearing. To ensure the machining quality of the VH-CATT cylindrical gear, the machining parameters of the gear are optimized to reduce the machining error.
The data of processing is mainly composed of gear parameters, tool parameters, machine tool parameters, and processing energy consumption. The gear parameters mainly include the number of teeth, modulus, and pressure angle; the machining quality requirements mainly include the accuracy grade requirements and the tooth surface error requirements; the tool parameters mainly include tool quantity, modulus, accuracy grade, maximum spindle speed, tool material and hardness, tool internal and external diameter, pressure angle, number of processed teeth, and so on.
Since the original intention of the prototype proposed in this paper is to process high-quality VH-CATT gears, this research focus is mainly on revealing the influence of process parameters on the tooth surface error in the machining process. It is more practical to explore the tool life and machining energy consumption in the subsequent mass production stage. Because the machining method of large cutter head proposed in this paper has certain similarities with the machining methods of hobbing and milling, they both belong to the machining of tooth profile by the generation method. The cooling method is oil cooling, and the tooth blank material is 45 steel. According to the reference, the factors affecting gear machining include cutting speed, feeding speed, and the number of cutting tools. Therefore, the corresponding critical process parameters considered in the paper are the velocity of coolant, vQ, the velocity of cutter head, n, and the feed velocity, vf. The ranges of values for the parameters is shown in Table 1.

Table 1.
Critical process parameters and their ranges.
3.3. Variable Level Calculation
In the actual gear-processing process, the ranges of parameters could be too wide. If the complete change range is directly selected, all data can ensure the accuracy of the surrogate model and simulate the actual processing as much as possible. Once a long complete range is selected, it will lead to heavy calculation and analysis workload, and the experimental process will also consume expensive materials and time.
To make the best of the limited experimental samples, this paper combines the method in the reference [18] with the experience method in the actual processing to minimize the variation interval of each parameter and then uses the full factorials method to carry out the experimental design to improve the efficiency and accuracy of the surrogate model.
To obtain the response value of the above parameters, the machining test is carried out on the VH-CATT gear special machine tool. The gear blank is processed with different processing parameters and is marked.
After the machining test, the four key errors, including concave tooth profile error (Fal), convex tooth profile error (Far), concave tooth direction error (Fβl), and convex tooth direction error (Fβr) are measured, and the error response values of the training set and the test set are obtained. For example, the concave tooth profile error refers to the normal distance between the actual cross-section tooth profile curve and the theoretical tooth profile, and the concave tooth profile error is the normal distance between the actual tooth profile curve and the theoretical tooth profile. The distribution of the two curves is shown in Figure 5, and the detection site is shown in Figure 6.
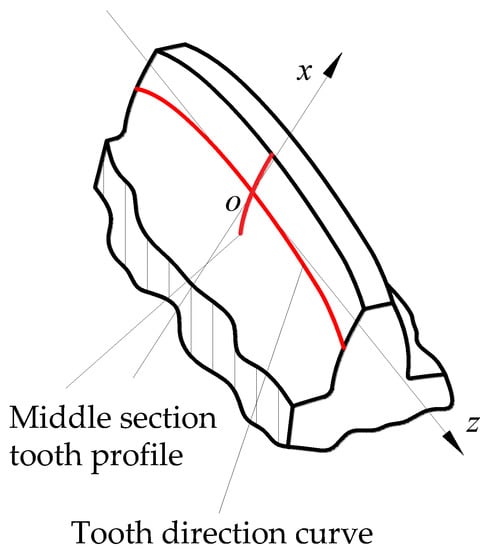
Figure 5.
Tooth profile and direction curve.
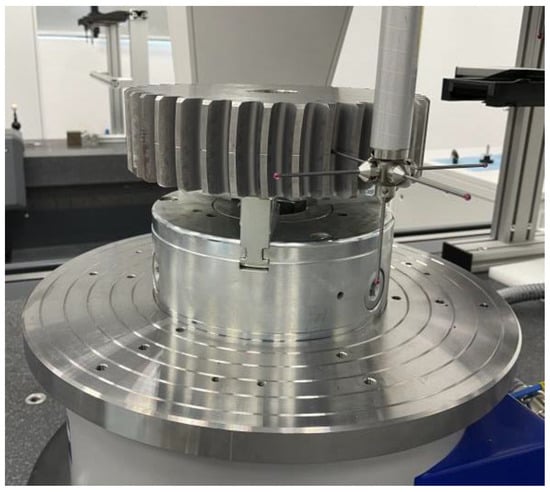
Figure 6.
Tooth surface error detection.
The experimental design results based on the full factorials experimental design method are shown in Table 2 and Table 3. A total of 64 groups of experimental schemes were obtained in which 48 groups were used to establish the surrogate model, and 16 groups were used to verify the model.
Table 2.
Critical process parameters and response value (training set).
Table 3.
Critical process parameters and response value (testing set).
4. Surrogate Model and Optimization
4.1. Common Surrogate Model
The most commonly utilized surrogate models include the response surface methodology (RSM), support vector regression (SVR), radial basis function (RBF), locally linear embedding (LLE), gene expression programming (GEP), and the Kriging (KRG) model. According to the characteristics of data and the advantages of the surrogate model, the Kriging model is selected to predict and optimize the error [18].
4.2. Kriging Model
The essence of the Kriging model is to approximate the result by random function according to the existing samples. Finally, the linear weighting of response values of the known sample functions is obtained as (1):
where, Ns is the given number of sample points. fj is the primary function, βj is the weight coefficient, Z(x) is a Gaussian static random process with mean value 0 and standard deviation . In addition, the covariance between the random variables corresponding to two different points in the design space is:
where R(xi, xj) is called the correlation function, which represents the correlation between random variables at different positions. The matrix, R, is defined as the correlation matrix composed of the correlation function between all sample points and is the correlation vector between the predicted point, rx, and the given sample point, which is expressed as:
In the Equations, is the correlation parameter to optimize the correlation between the different design points by adjusting the parameter. The model of variation function models commonly used in the Kriging model include the exponential model, exponential Gaussian model, Gaussian model, linear model, spherical model, cubic model, spline function model, and so on. The model of variation function with the Gaussian model can provide a relatively smooth and infinitely differentiable surface; thus, it is widely used in engineering applications as a variation function. The mathematical expression of the Gaussian function is as follows:
4.3. Model Precision Index
To ensure the validity and rationality of the model, some test samples are generally used to test the accuracy of the model. The surrogate model with test results meeting certain requirements can replace the actual model for approximate calculation. The representative evaluation methods include root mean square error (RMSE), R-Square (R2), and relative maximum absolute error (RMAE). The specific expressions are shown in Equations (7)–(9).
where n is the number of test sample points; fi is the true value of the actual model at the ith test sample point; and is the predicted value of the proxy model at the ith test sample point.
Reference [19] is the key to affect the accuracy of the Kriging model; thus, it was necessary to find the optimal value of θl in Equation (6) for obtaining higher prediction accuracy. Hence, an improve algorithm is proposed to solve the reasonable θl value.
5. Optimized Kriging Model Based on SGSO Algorithm
5.1. SGSO Algorithm
The glowworm swarm optimization (GSO) algorithm is a new bionic intelligent algorithm, and its basic principle is to simulate the living habit of the glowworm swarm. The basic principle of the GSO algorithm is as follows: N indiscriminate glowworm are defined in the active region with a random brightness, , and an individual perception radius, . Define the neighborhood set of all individuals whose fluorescein values are greater than their own as . The selection probability, , is calculated by the brightness of the glowworm individual in the field, and the optimal individual in the neighborhood set, , is moved and aggregated according to the obtained. Repeat the above process until the glowworm swarm moves near the optimal solution.
where is the radius of the search area of the glowworm; is the adjustment coefficient of the glowworm perception radius; nt is the critical threshold near the glowworm individual; is the neighborhood set of glowworm individuals; s is the step length of single movement of glowworm individuals; is the volatilization coefficient of fluorescein, usually constant and ; is the distance between individuals i and j; γ is a constant number of adjusting the position coefficient. The fitness function, , can be scaled according to the position after moving.
Some glowworms will deviate from the group and fail in the search process, and the solution accuracy of the GSO algorithm will be limited [14]. To enhance the glowworm search ability of a few invalid searches and further improve the solving efficiency of the glowworm population, this paper proposes the concept of natural enemy. The actual living environment of the glowworm is simulated, and the parameter darkness is defined to represent the effect of the dark environment on the glowworm eviction. Specific improvement measures are as follows:
The number of glowworm individuals in the neighborhood with natural enemies gradually approaches 0, and the darkness near the region reaches the maximum. The darkness drives the continuous glowworm until it moves to the position where the main group of glowworms can be searched. Parameter, , represents the set of natural enemies existing in the neighborhood of the glowworm swarm. It is necessary to set the upper limit for the darkness to prevent the individual perception radius from decreasing to zero and falling into local optimum. The optimized selection mechanism is shown in Equation (17) to replace Equation (12).
In addition, the chaos-mapping strategy and the golden section ratio are used to optimize the population. First, a D-dimension vector, X1 = [x11, x21, …, xD1], is chosen according to the need of the objective function. The initialization is realized by chaotic iteration according to Equation (18), and the vectors, X2, X3, …, XN, are obtained by multiple iterations as the initial population of the glowworm.
xn+1 = cos (n arccos xn)
According to the value of fluorescein obtained from Equation (14), k individuals with low fluorescein were screened out, and their attraction was hardly searched. The k individuals are quadratically optimized according to the golden ratio partition rule.
where, xmax and xmin represent the threshold of the glowworm individual search range. Compared with the traditional GSO algorithm, the improved algorithm adds a scenario-understanding mechanism; thus, it becomes the glowworm swarm optimization algorithm of scene understanding (SGSO). A complete iterative loop of the SGSO algorithm consists of the following steps:
xil = 0.618 i(xmax − xmin); i = 1, 2, …, k
- Step 1: Set the condition parameters and update of sensing radius as Equation (10). Then, complete the optimization based on the chaotic-mapping strategy.
- Step 2: k individuals with low fluorescein were selected and optimized according to Equation (18).
- Step 3: Calculate the next generation glowworm location and enemy neighborhood with Equations (11) and (16).
- Step 4: Determine the selection probability as Equation (17).
- Step 5: Update the fluorescein and darkness of the neighborhood set as Equations (14) and (16).
- Step 6: Determine the value of di(t) of individual i. If di > dmax, update rdi (t) to ensure that di < dmax is followed by the next step.
- Step 7: Judge whether the solution satisfies the condition or reaches the maximum iteration number. If it is, the output result is obtained. Otherwise, go to Step 3.
5.2. Algorithm Performance Test
To verify the influence of the optimization strategy on algorithm performance and carry out reasonable comparisons with similar intelligent algorithms, four standard test functions in Table 4 were selected for comparative simulation. The parameters involved in the algorithms were set according to reference [20], as shown in Table 5.
Table 4.
Test functions.
Table 5.
Initialization parameters of SGSO and GSO algorithms.
According to the above conditions, several independent repeated tests were conducted, and the corresponding results were recorded. The simulation results of the GSO and CGSO algorithms in the reference [20] are compared to the SGSO algorithm on accuracy and efficiency. The results of each algorithm are shown in Table 6.
Table 6.
Performance comparisons of SGSO, GSO. and CGSO.
As the data in Table 6, it is easy to see some specific advantages of SGSO. The maximum difference and average value of the four functions obtained by SGSO are better than both the GSO algorithm and the CGSO algorithm.
In terms of accuracy, the majority results for the four standard test functions obtained by the SGSO algorithm are basically optimal. The accuracy is improved by one and two orders of magnitude, compared with the GSO and SGSO algorithms. In terms of stability of the results, the standard deviation values of the SGSO algorithm are lower than those of the GSO algorithm and the SGSO algorithm, indicating that the SGSO algorithm proposed in this paper has higher stability and fewer single failure results, hence, the SGSO algorithm has stronger solving performance.
In terms of convergence efficiency, it can be seen from Figure 7 that the inflection point in the convergence curve of SGSO appeared earlier before 100 iterations, and the convergence speed was significantly faster than the GSO algorithm. In terms of population distribution, it can be seen from Figure 8 and Figure 9 that in test functions, the glowworm population in SGSO converges near the optimal solution, indicating that the improved scenario-understanding mode and selection mechanism improve the solution performance of the algorithm. In summary, the SGSO algorithm shows high accuracy, good stability, strong population distribution rationality, and fast convergence speed.
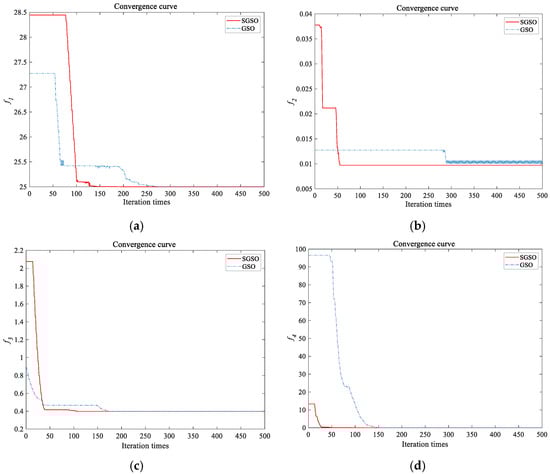
Figure 7.
Convergence comparison of test functions: (a) f1; (b) f2; (c) f3; (d) f4.
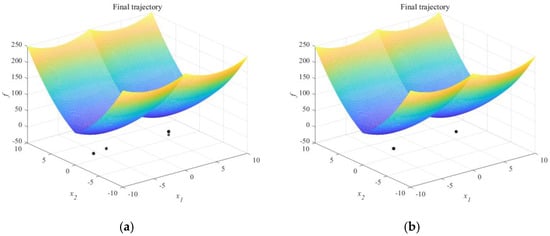
Figure 8.
Glowworm distribution for solving function f1: (a) GSO; (b) SGSO.
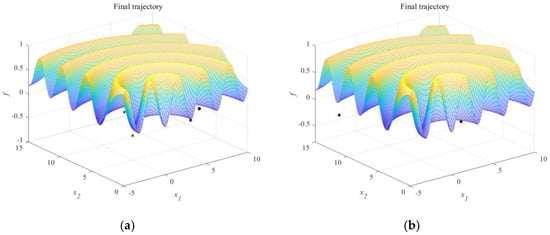
Figure 9.
Glowworm distribution for solving function f2: (a) GSO; (b) SGSO.
6. Results and Discussion
The accuracy evaluation of the surrogate model will comprehensively consider the above three evaluation criteria, and the indicators obtained in this paper are shown in Table 7. According to the data in the above table, the three precision indexes of SGSO-Kriging are more superior than Kriging when solving Fa and Fβ. The SGSO-Kriging obtains large R2 that are all over 0.95, and the majority of RMSE and RMAE are smaller, which shows more reliable solution accuracy.
Table 7.
Comparison of three evaluation criteria.
The SGSO-Kriging is used to establish the approximate model between the input parameters and the output error of the VH-CATT gear special machine tool, and the optimized residuals, prediction results. and box diagram are shown in Figure 10 and Figure 11.
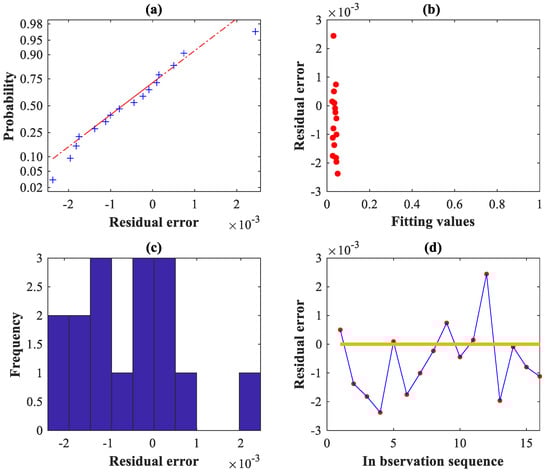
Figure 10.
Residual diagram based on the SGSO-Kriging surrogate model: (a) normal probability; (b) by values; (c) histogram; (d) in order.
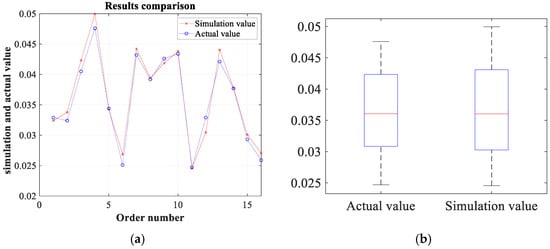
Figure 11.
Comparison of actual and simulation value: (a) prediction results; (b) box diagram.
The order of magnitude of the error is 10−3 mm. However, among the samples of its prediction set, only six samples can be well reproduced. Although 10 set samples cannot be fully reproduced, the maximum error is below 10−3 mm. By observing the box diagram, it can be found that the simulation value and the actual value share the same lower edge and Q2 line, but the Q1 line between the two is slightly different. It is worth noting that the Q3 line and upper edge of the simulation value are higher than the actual value, indicating that there is still a small difference in the distribution of the simulation value.
Figure 12a shows that the variation trend of the convex tooth profile error (Fal) changes with the rotational speed (n) and the coolant velocity (vQ) when the average feeding speed (vf) is taken. The increase of the n will lead to a significant decrease in the error. However, when the vQ increases, the Fal slightly decreases. It can be seen from Figure 12b,c that compared with the n and vQ, the vf is the most important factor affecting the tooth profile error of the convex tooth surface. It is obvious that when the vf increases, the corresponding error almost increases linearly.
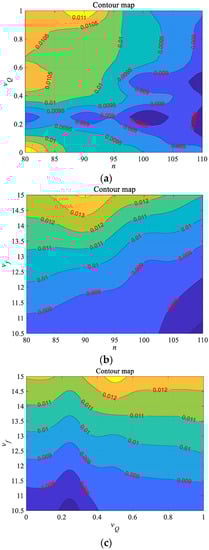
Figure 12.
Response surfaces contour map of Fal: (a) with n and vQ; (b) with n and vf; (c) with vQ and vf.
Similar to the analysis of Fal, vf is also the biggest factor affecting Far. The difference is that the action law of n and vQ is clearer at this time. By observing Figure 13a, it can be found that the higher vQ contributes more to the tooth surface accuracy when n increases from 80 to 95 r/min. However, when n exceeds 95 r/min, the error almost linearly decreases with n only. In Figure 13b,c, when n take the maximum value and vf takes the minimum value, Far has the optimal solution. By contrast, vQ has a minimal impact, and the contribution ratio of each factor to the error is basically consistent with Fal.
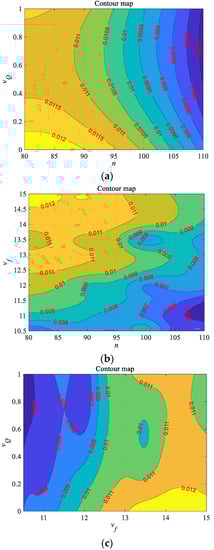
Figure 13.
Response surfaces contour map of Far: (a) with n and vQ; (b) with n and vf; (c) with vQ and vf.
Due to the influence trend of the three factors on the error being similar to Fal and Far in the previous analysis, it is not detailed for Fβl to avoid redundancy narration. On the whole, the variation trend of the two errors of Fβl and Fβr is simple and intuitive. They are mainly affected by vf, and the error is almost linear with vf. The only big difference is that n of Fβr is more effective than vQ, but vQ is slightly more effective with Fβl.
The variation trend of errors is carried out by comprehensively analyzing the influence of three key factors on the four types of errors. Among all the errors, the vf is the most important, and the effect of reducing the vf on improving the accuracy is significantly greater than the other two factors. When vf and vQ act on the convex tooth surface, their effect on the error is close. However, the increase of rotational speed is more conducive to the accuracy of the tooth surface than the acceleration of the coolant. Response surfaces contour map of Fβl and Fβr are showed in Figure 14 and Figure 15.
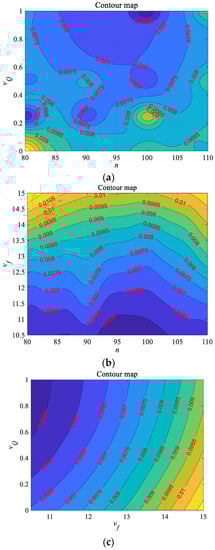
Figure 14.
Response surfaces contour map of Fβl: (a) with n and vQ; (b) with n and vf; (c) with vQ and vf.
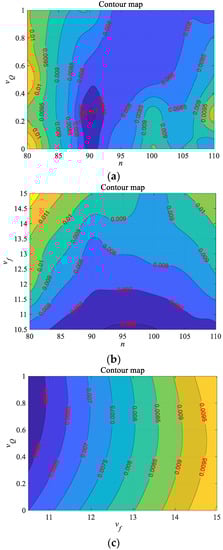
Figure 15.
Response surfaces contour map of Fβr: (a) with n and vQ; (b) with n and vf; (c) with vQ and vf.
7. Conclusions
To control the machining error, this paper explores the influence of important machining on the tooth surface accuracy of the VH-CATT gear. Through experiments of the special machine tool and the data measurements, 64 groups of samples with three key parameters, n, vf, and vQ, were selected. An improved Kriging surrogate model is established, whose convergence effect has been improved by using an improved SGSO algorithm. Based on the results of data and the diagram, the influence trend of the key parameters on the error is analyzed. The detail of results are as follows.
The VH-CATT gear machining experiment was carried out using the special machine tool proposed by the research group, and different parameters were selected for machining according to the machining experience. The tooth profile of the obtained gear sample was measured, and the data verified the correctness of the previous study, which also provided samples for subsequent analysis.
A Kriging model based on the SGSO algorithm optimization is proposed. The glowworm search ability is enhanced by the scenario-understanding mode, and the algorithm is used to solve the hyperparameter optimization of the surrogate model to improve the accuracy and iterative efficiency. The SGSO-Kriging surrogate model has been improved in R2, RMAE, and RMSE, and there is better performance in the residuals.
The influence of three factors on the error is carried out in the contour map. Among all the errors, reducing vf is the most effective way to reduce the error. Then, increasing vf and n within the corresponding threshold shows a similar effect on the convex tooth surface. However, the increase of the rotational speed is more conducive to the accuracy of the tooth surface than the acceleration of the coolant.
Author Contributions
Conceptualization, L.H. and Y.D.; methodology, Q.Z.; software, H.Z.; validation, S.L. and P.L.; formal analysis, S.L.; investigation, H.Z.; resources, L.H.; writing—original draft preparation, S.L.; writing—review and editing, S.L. and P.L.; supervision, Y.D.; project administration, L.H.; funding acquisition, L.H. and Y.D. All authors have read and agreed to the published version of the manuscript.
Funding
This research was funded by the National Natural Science Foundation of China, grant number 51875370, and Natural Science Foundation of Sichuan Province, grant number 2022NSFSC1975.
Institutional Review Board Statement
Not applicable.
Informed Consent Statement
Not applicable.
Data Availability Statement
Not applicable.
Conflicts of Interest
The authors declare no conflict of interest.
References
- Zhao, F.; Hou, L.; Duan, Y.; Chen, Z.; Chen, Y.; Sun, Z. Research on the Forming Theory Analysis and Digital Model of Circular Arc Gear Shaped by Rotary Cutter. J. Sichuan Univ. 2016, 48, 119–125. [Google Scholar]
- Wu, Y.; Hou, L.; Ma, D.; Wei, Y.; Luo, L. Milling Machine Error Modelling and Analysis in the Machining of Circular-Arc-Tooth-Trace Cylindrical Gears. Trans. FAMENA 2021, 44, 13–29. [Google Scholar] [CrossRef]
- Zhang, Q.; Wen, G.; Liang, S.; Tong, Q.; Hou, L.; Yang, G. Prediction Mathematic Model and Influencing Factors of Contact Stress of Cylindrical Gear with Arc Tooth. Complexity 2020, 2020, 8888407. [Google Scholar] [CrossRef]
- Luo, P.; Wu, Y.; Liang, S.; Hou, L.; Fan, Q.; Wei, Y. TEHL analysis of VH-CATT cylindrical gear transmission in elliptical contact considering time-varying parameters. Adv. Mech. Eng. 2022, 14, 1992379904. [Google Scholar] [CrossRef]
- Wu, Y.; Hou, L.; Luo, L.; Ma, D.; Wei, Y. Tooth Root Bending Stress Distribution Characteristics of Gear in Wind Turbine Gear Transmission System. J. Chin. Soc. Mech. Eng. 2020, 41, 311–324. [Google Scholar]
- Liang, S.; Hou, L.; Zhang, H.; Luo, L.; Wu, Y.; Luo, P. Bifurcation and chaos analysis of cutter head-spindle system of VH-CATT gear machine tool considering time-varying stiffness. Int. J. Adv. Manuf. Technol. 2022, SI, 1–14. [Google Scholar] [CrossRef]
- Zhang, H.; Hou, L.; Liang, S.; You, Y.; Liao, K.; Li, J. Design and evaluation of module configuration scheme for special machine tool of variable hyperbolic circular-arc-tooth-trace cylindrical gear. Adv. Mech. Eng. 2022, 14, 1–11. [Google Scholar] [CrossRef]
- Zhang, H.; Hou, L.; Liang, S.; Wu, Y.; Chen, Z. Modular configuration design of a special machine tool for variable hyperbolic circular-arc-tooth-trace cylindrical gears. Mech. Sci. 2022, 13, 55–65. [Google Scholar] [CrossRef]
- Ikua, B.W.; Tanaka, H.; Obata, F.; Sakamoto, S. Prediction of cutting forces and machining error in ball end milling of curved surfaces -I theoretical analysis. Precis. Eng. 2001, 25, 266–273. [Google Scholar] [CrossRef]
- Ding, H.; Tang, J.; Zhong, J. Accurate nonlinear modeling and computing of grinding machine settings modification considering spatial geometric errors for hypoid gears. Mech. Mach. Theory 2016, 99, 155–175. [Google Scholar] [CrossRef]
- Dey, S.; Mukhopadhyay, T.; Adhikari, S. Stochastic free vibration analyses of composite shallow doubly curved shells—A Kriging model approach. Compos. Part B Eng. 2015, 70, 99–112. [Google Scholar] [CrossRef]
- Li, X.; Qiu, H.; Chen, Z.; Gao, L.; Shao, X. A local Kriging approximation method using MPP for reliability-based design optimization. Comput. Struct. 2016, 162, 102–115. [Google Scholar] [CrossRef]
- Ankenman, B.; Nelson, B.L.; Staum, J. Stochastic Kriging for Simulation Metamodeling. Oper. Res. 2010, 58, 371–382. [Google Scholar] [CrossRef] [Green Version]
- Tianhong, L.; Shuang, L.; Hezeyin; Xia, Z. Path planning of robot based on glowworm swarm optimization algorithm of scene understanding. J. Comput. Appl. 2017, 37, 3608–3613. [Google Scholar]
- Kaur, G.; Arora, S. Chaotic whale optimization algorithm. J. Comput. Des. Eng. 2018, 5, 275–284. [Google Scholar] [CrossRef]
- Sen, S.K.; Agarwal, R.P. Golden ratio in science, as random sequence source, its computation and beyond. Comput. Math. Appl. 2008, 56, 469–498. [Google Scholar] [CrossRef] [Green Version]
- Dodson, M.; Parks, G.T. Robust Aerodynamic Design Optimization Using Polynomial Chaos. J. Aircr. 2009, 46, 635–646. [Google Scholar] [CrossRef]
- Qi, Z.; Guang, W.; Lan, L.; Rui, T. Contact Stress Prediction Model for Variable Hyperbolic Circular Arc Gear Based on the Optimized Kriging-Response Surface Model. Trans. FAMENA 2021, 44, 59–74. [Google Scholar] [CrossRef]
- Yi, Z.; Hou, L.; Zhang, Q.; Wang, Y.; You, Y. Geometry Optimization Of Air-Assisted Swirl Nozzle Based On Surrogate Models And Computational Fluid Dynamics. At. Sprays 2019, 7, 605–628. [Google Scholar] [CrossRef]
- Shuhao, Y.; Shoubao, S. Research and Application of Chaos Glowworm Swarm Optimization Algorithm. J. Front. Comput. Sci. Technol. 2014, 8, 352–358. [Google Scholar]
Publisher’s Note: MDPI stays neutral with regard to jurisdictional claims in published maps and institutional affiliations. |
© 2022 by the authors. Licensee MDPI, Basel, Switzerland. This article is an open access article distributed under the terms and conditions of the Creative Commons Attribution (CC BY) license (https://creativecommons.org/licenses/by/4.0/).