Article

Effect of the Gap Matching Relation on the Pressure Pulsation Characteristics at Blade’s Surface of the Multiphase Pump

1
Key Laboratory of Fluid Machinery and Engineering, Xihua University, Chengdu 610097, China
2
Key Laboratory of Fluid and Power Machinery, Xihua University, Ministry of Education, Chengdu 610039, China
*
Author to whom correspondence should be addressed.
Machines 2022, 10(6), 418; https://doi.org/10.3390/machines10060418
Submission received: 9 April 2022 / Revised: 19 May 2022 / Accepted: 20 May 2022 / Published: 26 May 2022
(This article belongs to the Section Turbomachinery)

Abstract

:
The pressure pulsation characteristics of the blade’s surface have an impact on the lifespan of the multiphase pump impeller. To explore the influence of the gap matching relation on the pressure pulsation characteristics at blade’s surface of the pump, the axial clearance coefficient (ACC) between the impeller and diffuser and the relative tip clearance of the impeller were defined. By combining of numerical simulation and experiment, the pressure pulsation characteristics at blade’s surface of the single pressurization unit of the pump were studied under different gap matching relations. The results show that the size of tip leakage flow and the strength of rotor-stator interaction caused by different relative tip clearances have a decisive influence on the pressure pulsation characteristics in the impeller. With the increase of tip clearance, the internal flow field distribution law was greatly changed, which had a great impact on the pressure pulsation peak-to-peak value and dominant frequency amplitude of the suction surface. In addition, the pressure pulsation characteristics of the diffuser were mainly affected by the strength of rotor-stator interaction. When the strength of rotor-stator interaction weakened, the amplitude of the dominant frequency pulsation was decreased by degrees. As the ACC increased, the variation of the pressure pulsation peak-to-peak value and the dominant frequency amplitude coefficient were gradually slowed down in the diffuser, and the dominant frequency amplitude of the monitoring points were most sensitive to change in the ACC. The research results can provide a theoretical reference for the optimal design of the multiphase pump blades.

1. Introduction

Due to the potential impact of marine oil resources in the oil and gas industry, the demand for exploration of marine oil resources around the world is imperative [1,2]. Therefore, the multiphase pump has become the mainstream direction of future oil and gas resources transportation development research because of its large flow rate, high efficiency, simple structure, convenient manufacturing, low cost, sand resistance and many other advantages. However, owing to the complexity of oil and gas transportation mediums, the stability of the pump is poor in the working process, which seriously affects the safe and reliable transportation.
At present, research on the pump mainly involves numerical simulation and experiments. In terms of numerical simulation, Yang et al. [3] conducted a study on the pump and found that when the inlet gas void fraction (IGVF) is less than 10%, the pump has a good pressurization performance. Shi et al. [4] established a numerical analysis method for multiphase flow characteristics to predict the performance and reliability assessment of the pump, and studied the effects of different turbulence models, wall roughness, bubble size and interphase resistance models on hydraulic performance. Li et al. [5] carried out the numerical simulation on the three-stage pump, and the results showed that under different IGVFs, the higher the IGVF, the more obvious the impact on the pressurization capacity and the pressure pulsation characteristics of the pump. Ma et al. [6] studied the internal flow and external characteristics of the pump and found that the degree of gas-liquid separation in the pump would gradually increase with the increase of rotating speed. Ming et al. [7] used a numerical method to optimize the pump under the condition of the IGVF of 10%. After optimization, the gas phase and pressure distribution in the optimized pump were more uniform, and the pressure rise was increased by 6.69%. Xiao et al. [8] discovered that the basic reason of the radial force generation of the pump was mainly caused by the uneven distribution of fluid in the flow channel. Moreno et al. [9] found that a larger inlet angle would lead to a larger volume of ‘air sac’ and more obvious flow separation under the same IGVF. Zhang et al. [10] used a numerical simulation on the pressurization unit of the axial pump. It was found that the average pressure at the junction of the impeller and the diffuser at all levels have decreased because of the blades number and the rotor-stator interaction.
In the aspect of experimental research, for example, Xu et al. [11] tested two kinds of pumps under single-phase and multi-phase conditions and found that the IGVF of the two pumps with the maximum stable operation was up to 50%. Saadawi et al. [12] investigated the performance of the pump and showed the pressurization capacity and the efficient operation range of the pump increased with the increase of rotating speed. Zhang et al. [13] found that the gas in the impeller channel was mainly gathered near the suction surface at the outlet of the impeller hub under different IGVFs, while the gas in the diffuser mainly gathered at the hub. Serena et al. [14,15] discovered that the bubbles in the pump would be broken by the sheer force at high speed. At the same time, the average diameter of bubbles would decrease accordingly, and the two-phase distribution in the pump was more uniform under a visual experimental study of the pump. Chang et al. [16] discussed the pressurization characteristics of the centrifugal pump under single-phase and two-phase conditions. The experimental results showed that the pressurization performance of the pump was related to the IGVF and rotating speed, but not to the liquid flow rate in the range of 10~26 m3/h. Yu et al. [17] performed an order of magnitude analysis of the interphase force in the pump under different IGVFs, bubble diameter and rotating speed. The research showed that the resistance dominated and the turbulent dispersion force could be ignored. Meanwhile, the increase of rotating speed would increase the interphase force. Shi et al. [18,19,20] studied the internal flow law and the working ability of the pump under different working conditions, and pointed out that in the front half of the blades, the closer to the shroud, the stronger the pressurization performance of the impeller. Zhang et al. [21] investigated the effect of the IGVF on the energy performance and the pressure pulsation of the pump. It was found that the tip leakage flow induced the vortex formation near the leading edge of the suction side of blades, which affected the pressure fluctuation in the impeller. Liu [22] studied the coupling mechanism between the tip leakage vortex (TLV) and the pressure pulsation of the pump. Then, it was discovered that the presence of gas phase would make the maximum pressure pulsation intensity in the tip clearance closer to the tip leakage flow outlet at the beginning of the formation of the TLV. Kong et al. [23] found that the pressurization of the pump was no longer linearly increased with the series, but a quadratic function relation by considering the compressibility of gas.
To sum up, although different scholars have undertaken plenty of research on the multiphase pump, there are relatively few studies on the effect of the gap matching relation on the pressure pulsation characteristics at blade’s surface of the pressurization unit of the multiphase pump. However, different matching relations have a great influence on the stable operation of the pump, especially the unstable pressure pulsation on the blade’s surface greatly affected the lifespan of the pump impeller. Therefore, it is very important to study the pressure pulsation characteristics at blade’s surface of the pump under different matching relations between the axial clearance and the blade’s tip clearance. Then, it verifies the reliability of the numerical simulation results through experimental research, and discusses the influence of the gap matching relationship on the hydraulic performance of the pump, so as to provide a reference for the optimization design of the multiphase pump.

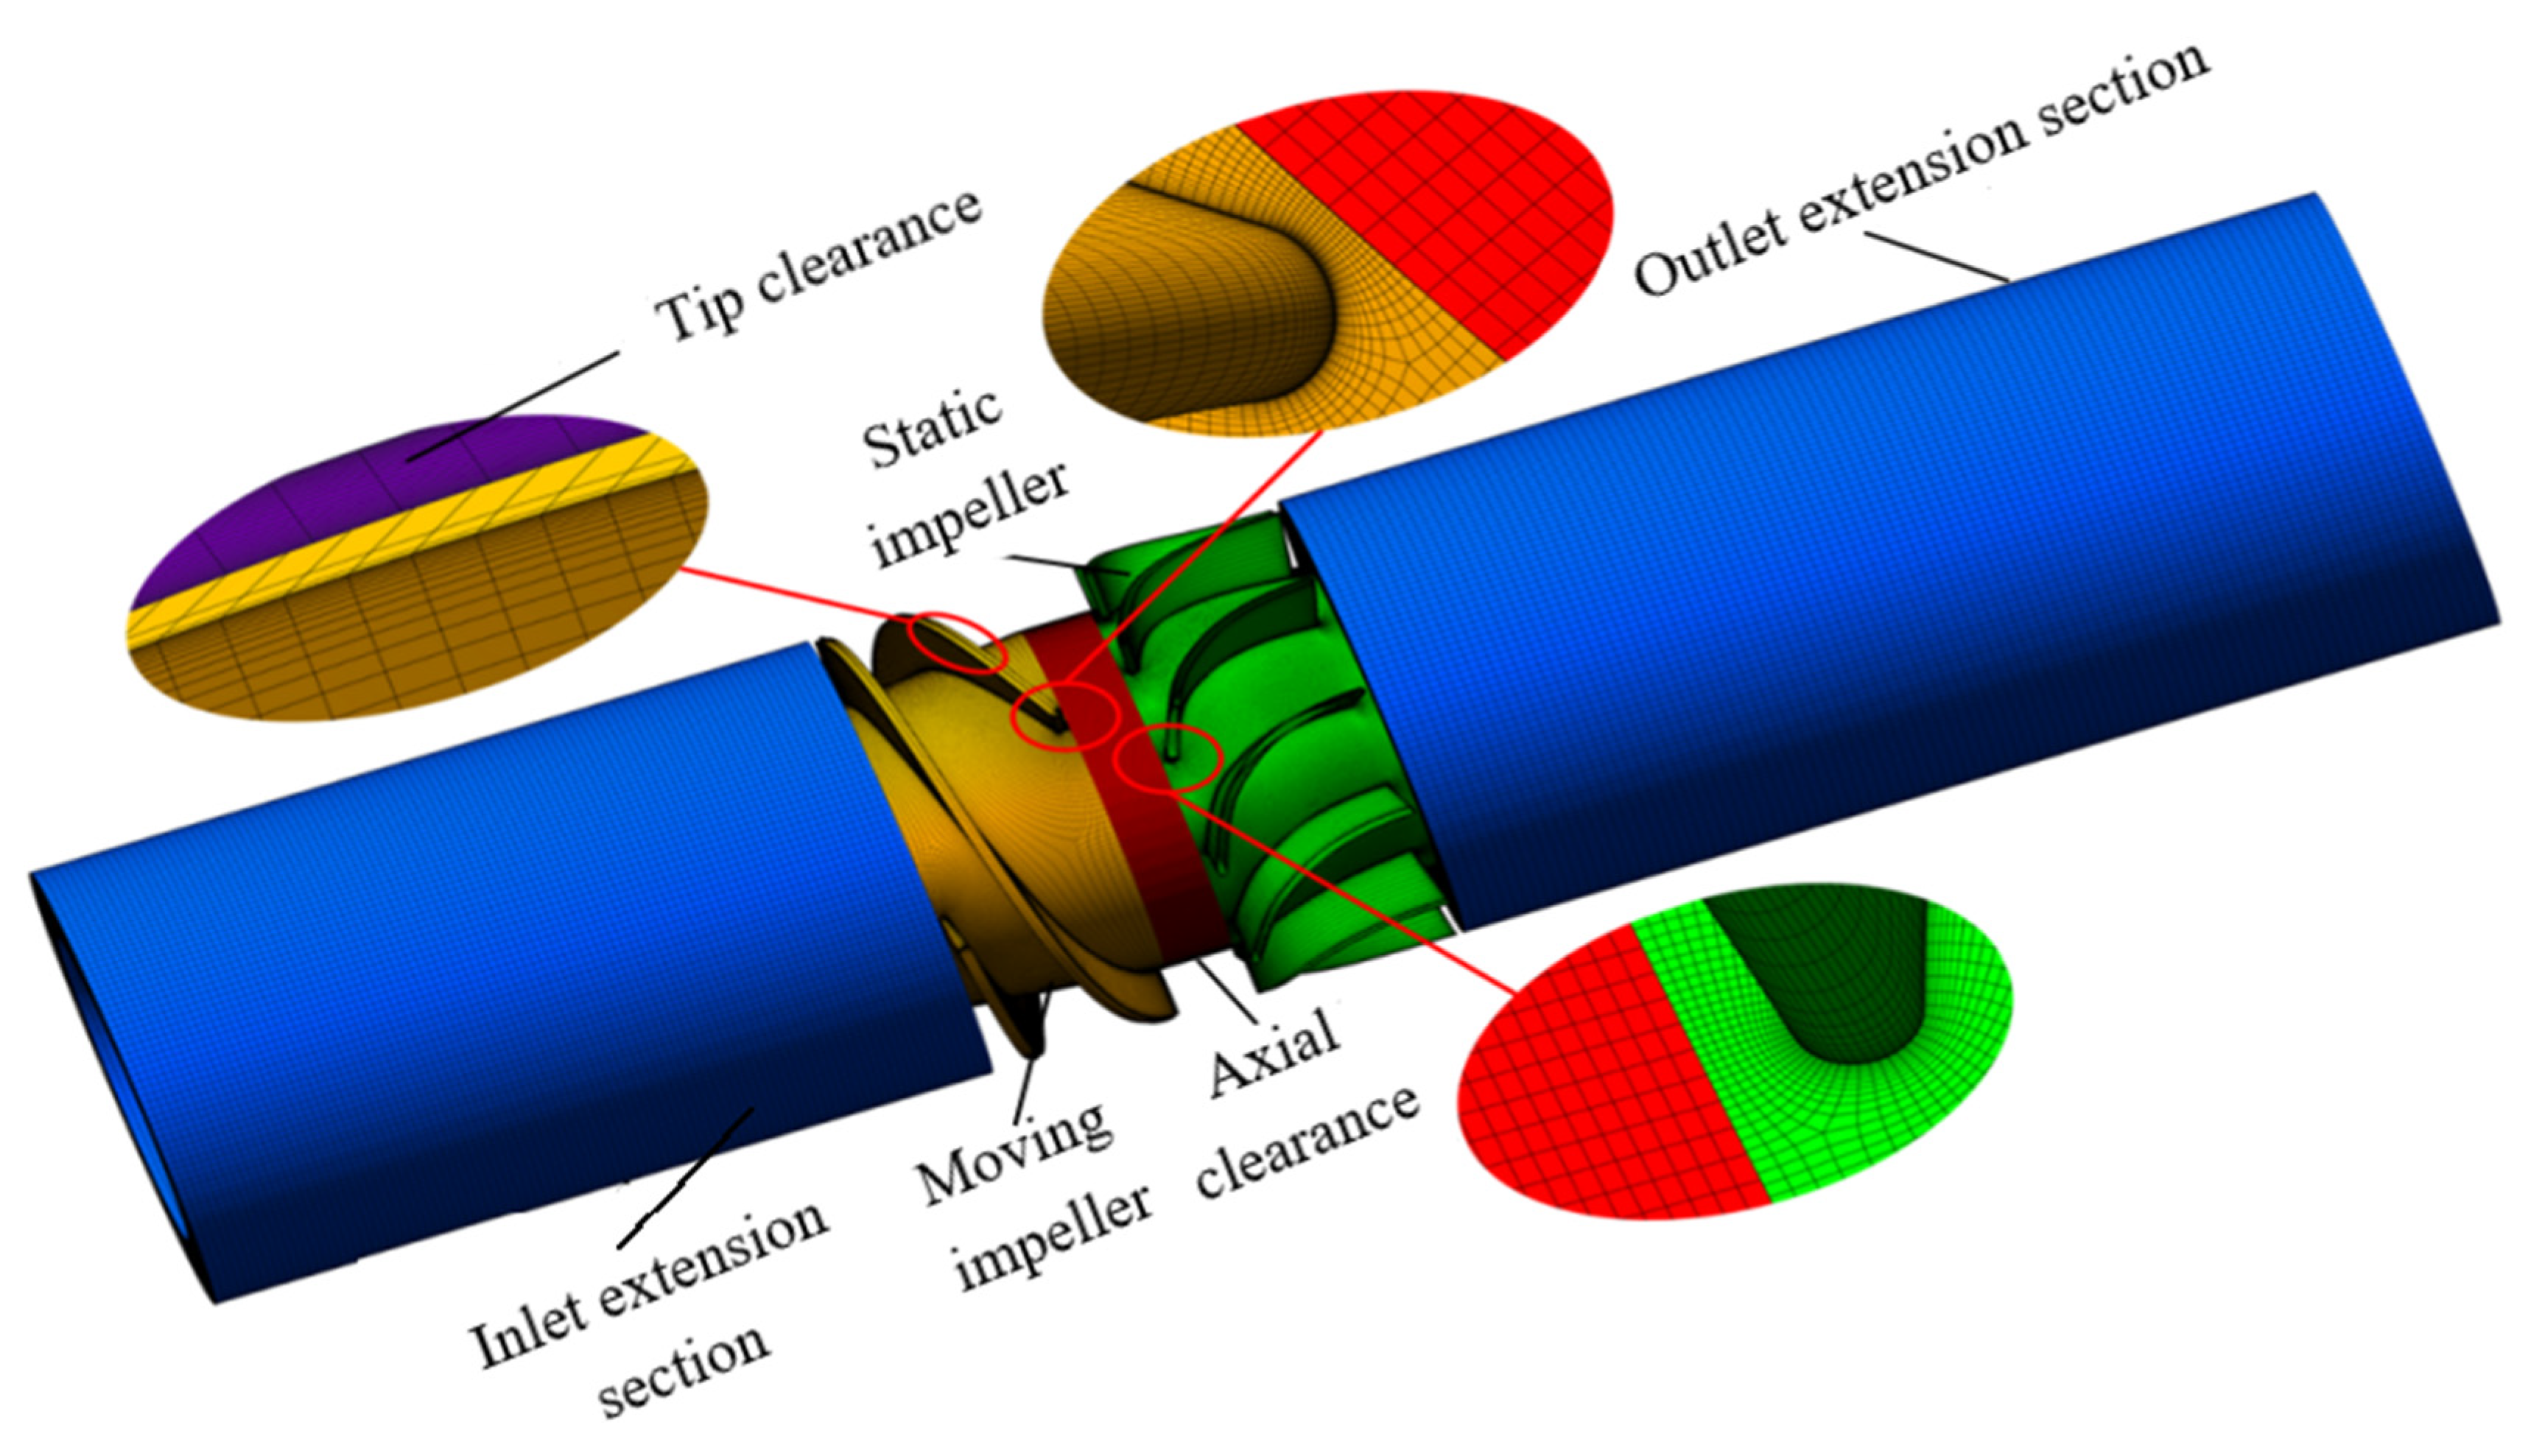
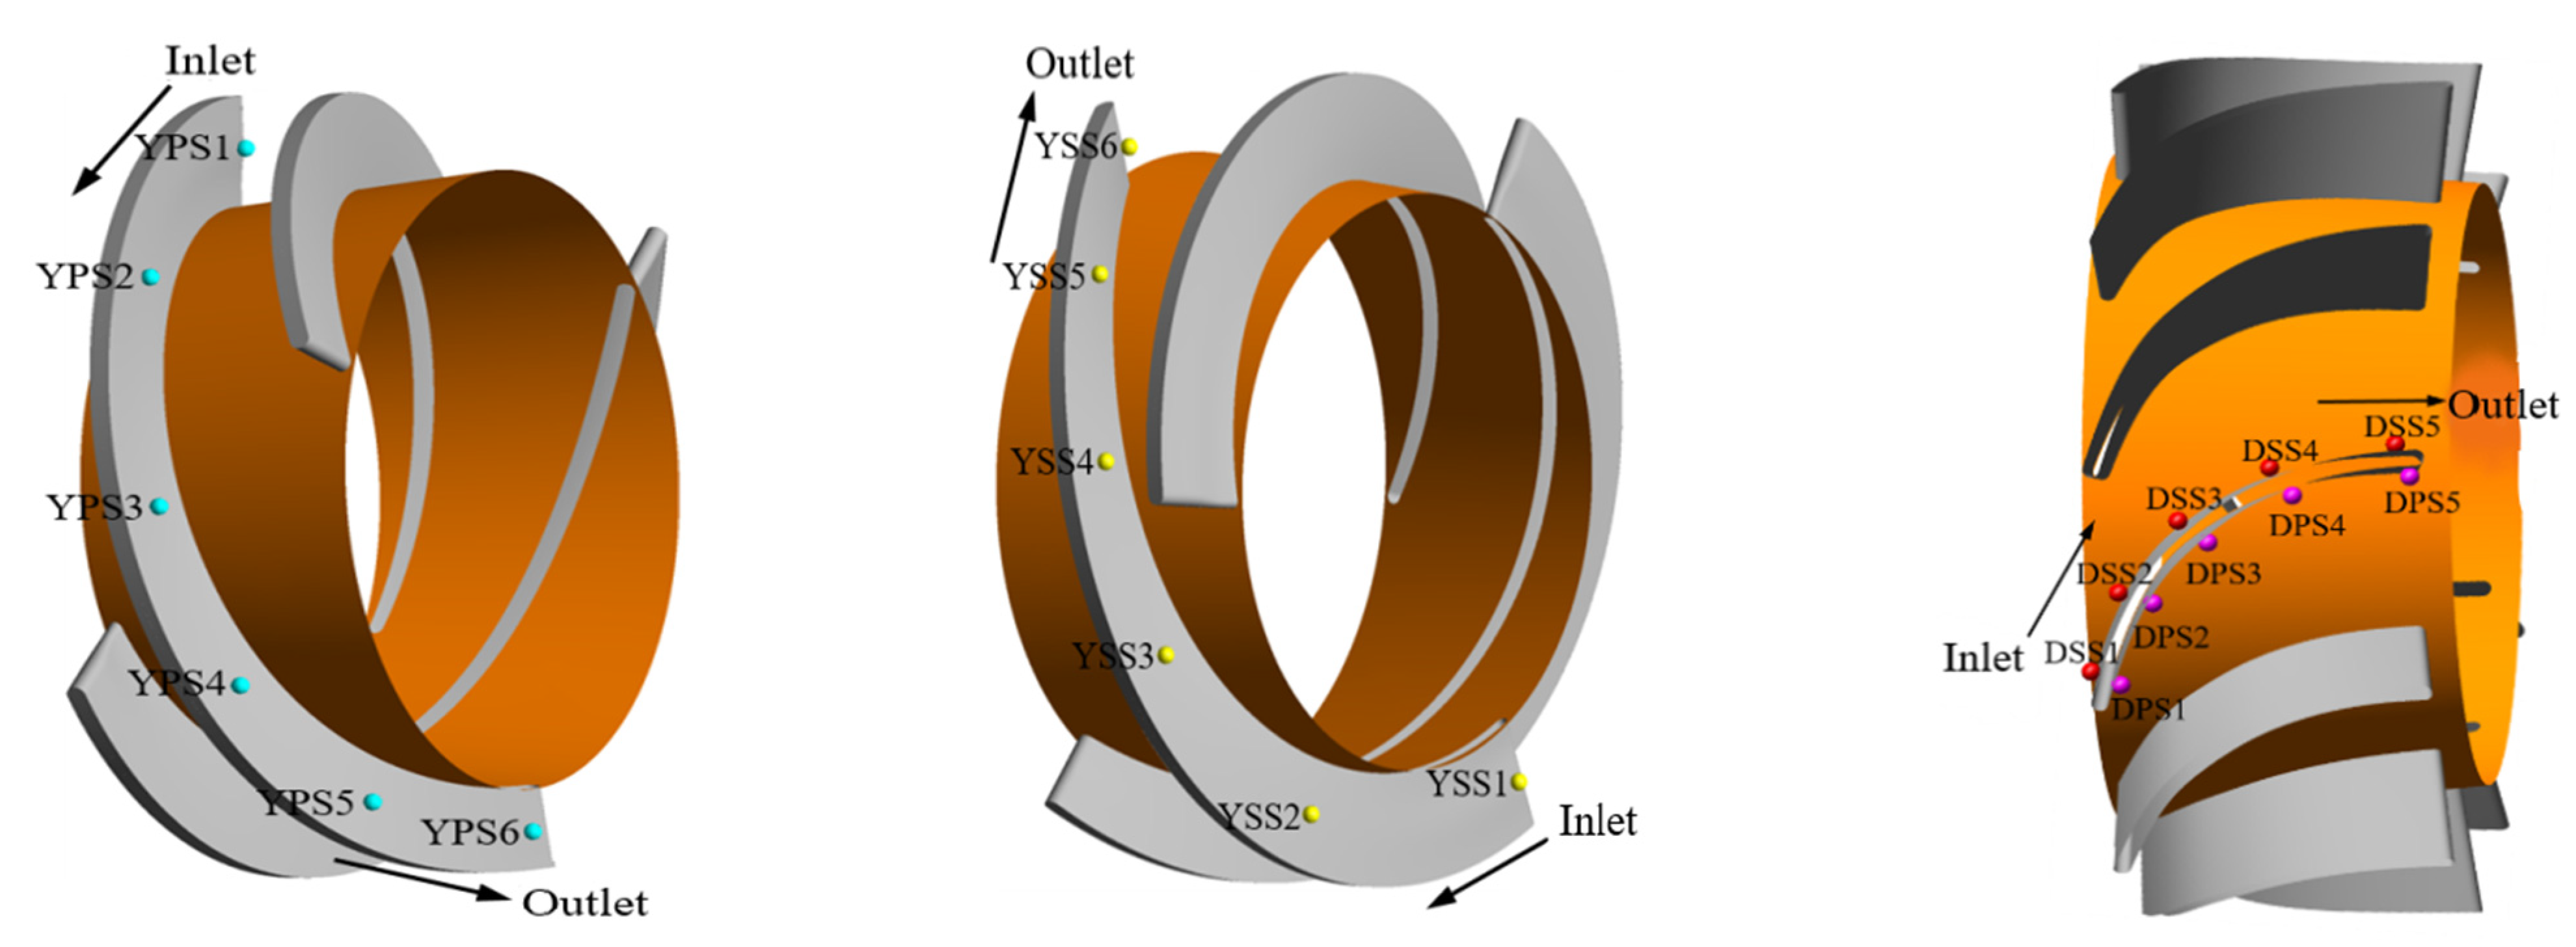
2. Computational Model

In the present work, the single pressurization unit of the multiphase pump is chosen for analysis. To reduce the effect of boundary conditions on the calculation accuracy, the inlet and outlet are appropriately extended. Thus, the calculation domain includes inlet extension section, outlet extension section, axial clearance, impeller, and diffuser.
Based on the outer diameter of the impeller, the ACC between the impeller and the diffuser is defined as δ A ; and the impeller relative tip clearance is defined as δ T , which can be calculated by Formulas (1) and (2), respectively. Additionally, the computation model of the pump is shown in Figure 1, the basic parameters are listed in Table 1, and the main structural parameters of the impeller and diffuser are listed in Table 2.
δ A = l D i .
δ T = h D i .
where l is the axial clearance between the impeller and diffuser; h is the tip clearance; and D i is the outer diameter of the impeller. In the present work, the research range of the ACC is from 0 to 0.17; the relative tip clearance is from 0‰ to 9‰, which the specific values are δ A = 0, 0.05, 0.09, 0.13, 0.17; and δ T = 0‰, 3‰, 6‰, 9‰.

3. Numerical Simulation Method and Boundary Conditions

3.1. Turbulence Model

Under the gas-liquid two-phase condition, the influence of gap matching relation on the unsteady flow characteristics of the pump is studied. The internal flow state of the pump is extremely complex and accompanied by flow separation, and the SST k-ω turbulence model considers the transportation of turbulent shear stress, which can accurately predict the start of flow and the separation of fluid under a negative pressure gradient condition [24]. Therefore, the SST k-ω turbulence model is selected for calculation.
The SST k-ω turbulence model can be defined as follows:
( ρ k ) t + · ( ρ U k ) = [ ( μ + μ t σ k 1 ) k ] + P k β ρ k ω .  
( ρ ω ) t + · ( ρ U ω ) = [ ( μ + μ t σ ω 1 ) ω ] + α 1 ω k P k β 1 ρ ω 2 .  
μ t = ρ k ω .  
where ρ, μ t , μ , k and ω represent the density, the turbulent viscosity, the dynamic viscosity, the turbulent kinetic energy and the turbulent frequency, respectively; the constant values are β = 0.09 ; α 1 = 5 / 9 ; β 1 = 0.075 ; σ k 1 = 2 ; σ ω 1 = 2 ; β 2 = 0.0828 ; and P k is the turbulence generation rate.

3.2. Grid Division and Boundary Conditions

ICEM CFD was used for the meshing grid of the inlet and outlet extension section and the axial clearance; TurboGrid was used for the meshing grid of the impeller and the diffuser, and the mesh refinement of the moving impeller and static impeller channel passage using O topology, as shown in Figure 2. In addition, it can be seen in the local amplification figure that the grid density between the impeller and the diffuser was almost uniformly arranged. Moreover, considering the convergence of numerical simulation and other factors, this performed the mesh independence verification. Finally, 4.26 million grids were used for calculation.
On the one hand, the inlet boundary condition was set as the velocity inlet, and the IGVF was 5%, meanwhile, the outlet boundary condition was set as the static pressure outlet, and the value is 7 atm. On the other hand, the automatic wall treatment model based on the k-ω equation was used, so that the wall function was automatically adapted to the low Reynolds number wall equation in the near-wall area. The convection term and the turbulent kinetic energy phase were solved by the second-order upwind scheme, and the convergence criterion was set to 1 × 10⁻⁴.
In the unsteady numerical simulation, the result of steady simulation was used as the initial value of unsteady simulation, so as to accelerate the convergence speed and prevent the divergence of calculation results. On the side, the specific setting parameters were as follows: the design rotating speed n = 3600 rpm; when the impeller rotates 2 degrees, a time step is formed, and the time step Δt = 9.26 × 10⁻⁵ s; and the total time is set to 0.5 s to complete 30 calculation cycles. Finally, the pressure pulsation data in the last three cycles were extracted for analysis after the unsteady calculation results were stable.
To accurately obtain the transient pressure variation in the simplified pump under different gap matching relations, it is necessary to set pressure monitoring points in the impeller and diffuser. At 0.5 span of the pressure and suction surface of the impeller blades, 12 pressure monitoring points are set from the inlet to the outlet, which are named YPS1~YPS6 and YSS1~YSS6, respectively. Similarly, 10 pressure monitoring points are set on the diffuser, named DPS1~DPS5 and DSS1~DSS5, as shown in Figure 3.

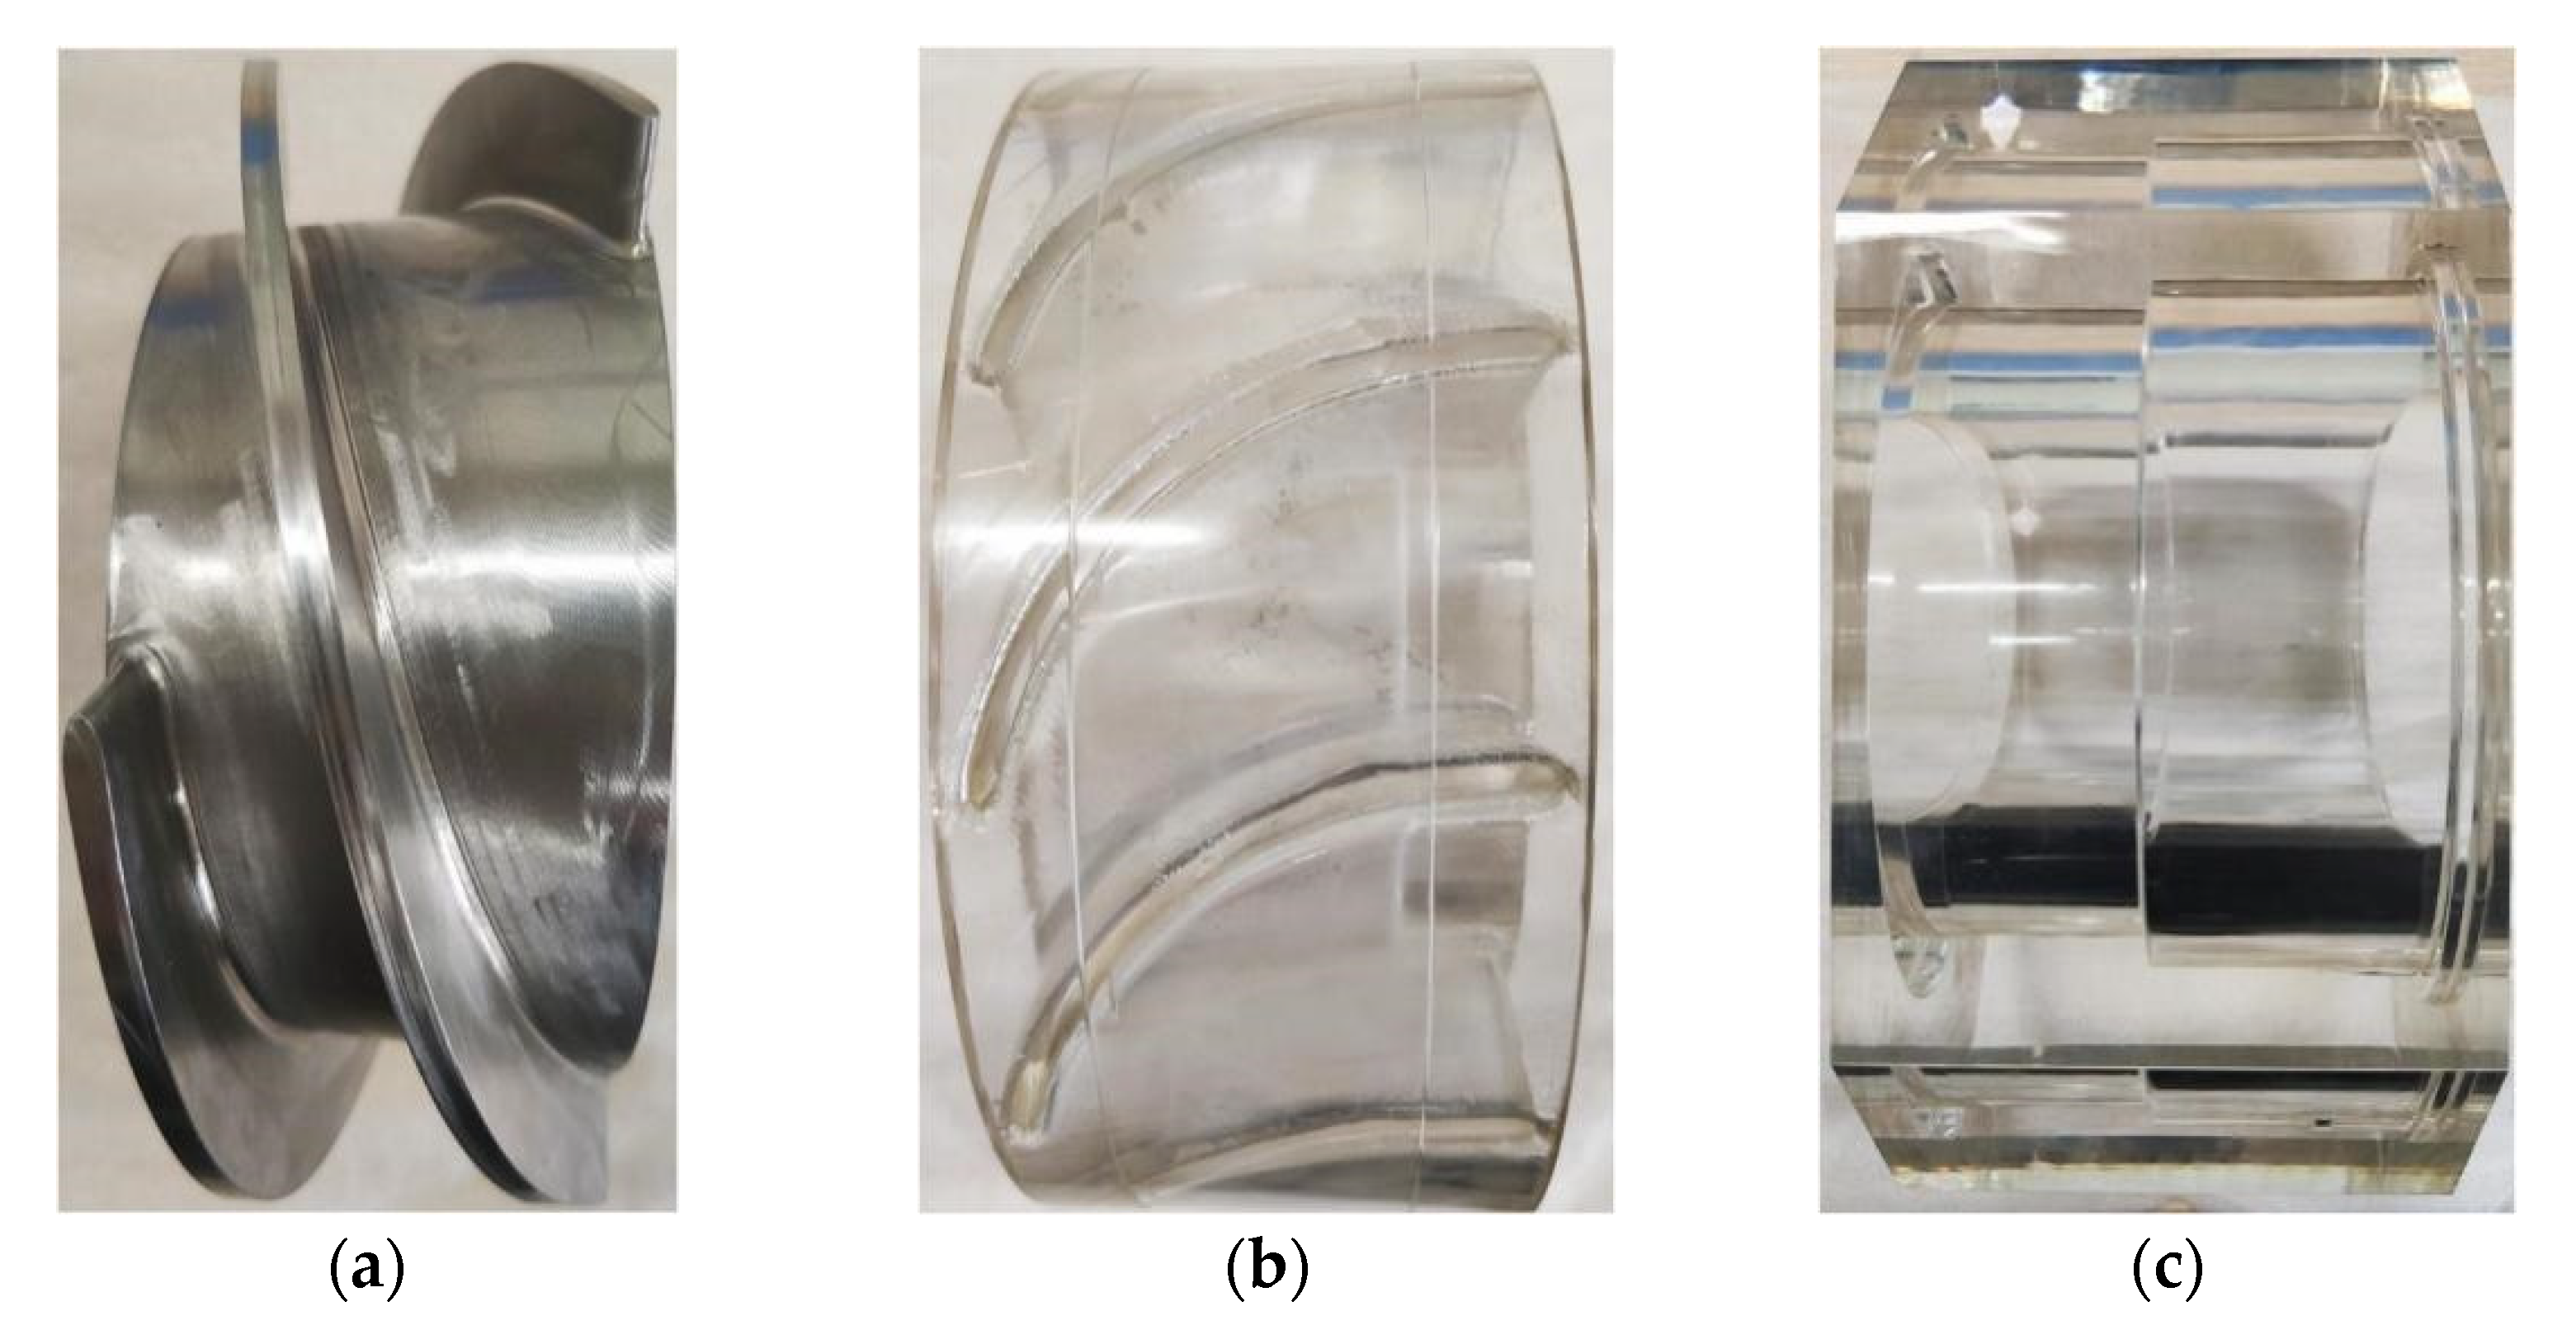
3.3. Experimental Study

This experimental system platform can test the hydraulic performance of the multiphase pump and gas-liquid two-phase transportation experiments. In this study, the external characteristics test of a single pressurization unit of a pump is mainly carried out. In order to more easily capture the flow state in the impeller during the test, the diffuser and the pump body are made of transparent plexiglass, as shown in Figure 4.
The experiment of the multiphase pump experimental platform are frequency converter, torquemeter, inlet and outlet throttle valve, inlet and outlet pressure sensor and electromagnetic flow meter, and so on, as shown in Figure 5. The precision of main equipment and the parameters of the high-speed camera are shown in Table 3 and Table 4, respectively. The accuracy of the above experiment equipment is reliable, and at the same time, the head and efficiency obtained in this way are also real and credible.

3.4. Experimental Verification

The accuracy of numerical results can be verified by experiment. The experimental results are compared with the numerical simulation results, as shown in Figure 6, where the test values of head, efficiency, and power of the pump with 3000 rpm rotating speed and 1.0 mm tip clearance in water condition. The power and efficiency can be defined as Equations (6) and (7), respectively.
P e = ρ g Q H .
η = P e P .
where ρ is the medium density, g is the gravity acceleration, Q is the rate of flow, H is the head, and P is the input power.
According to the figure, the relative error between the test and the simulation values are all less than 5% in the test flow range of 60~120 m3/h, which means the simulation values are in good agreement with the experimental values. The main reasons for the deviation between the test and the simulation values is that the calculation model is simplified in the numerical simulation, and the leakage loss of the impeller inlet is ignored. At the same time, the wall roughness is not considered, so the simulation values are often higher than the test values. Therefore, the numerical simulation method used in this study has high reliability, and the calculation results can accurately predict the transport performance of the multiphase pump.

4. Result Analysis

4.1. Method of the Pressure Pulsation Analysis

4.1.1. Pressure Pulsation Coefficient

To facilitate the analysis and comparison of the pressure pulsation characteristics, the pressure pulsation coefficient is used to characterize the pressure pulsation amplitude, Cp is calculated according to Equation (8) [25].
C p = p p _ 1 2 ρ U t i p 2 .
where p , p ¯ , ρ and U t i p stand for the instantaneous pressure, the mean pressure, the density of water, and the circumferential velocity of the blade’s tip, respectively.

4.1.2. Fast Fourier Transform

Fast Fourier Transform (FFT) is one of the most common frequency domain analysis methods by simplifying Discrete Fourier Transform.
Let X ( n Δ t ) be a long sequence with finite length, the length was M ; and the spectrum was X ( f ) , which formed a corresponding relation with the discrete value X m (where m = 0, 1, 2, …, M 1 ), as shown in Equation (8).
X m = X ( m Δ f ) = 1 M n = 0 M 1 x ( n Δ t ) exp ( j 2 π n m M ) .
where Δ f is the frequency resolution; M is the number of sampling points; and Δ t is the sample interval.

4.2. Effect of the Gap Matching Relation on the Pressure Pulsation Characteristics at Blade’s Surface of the Multiphase Pump

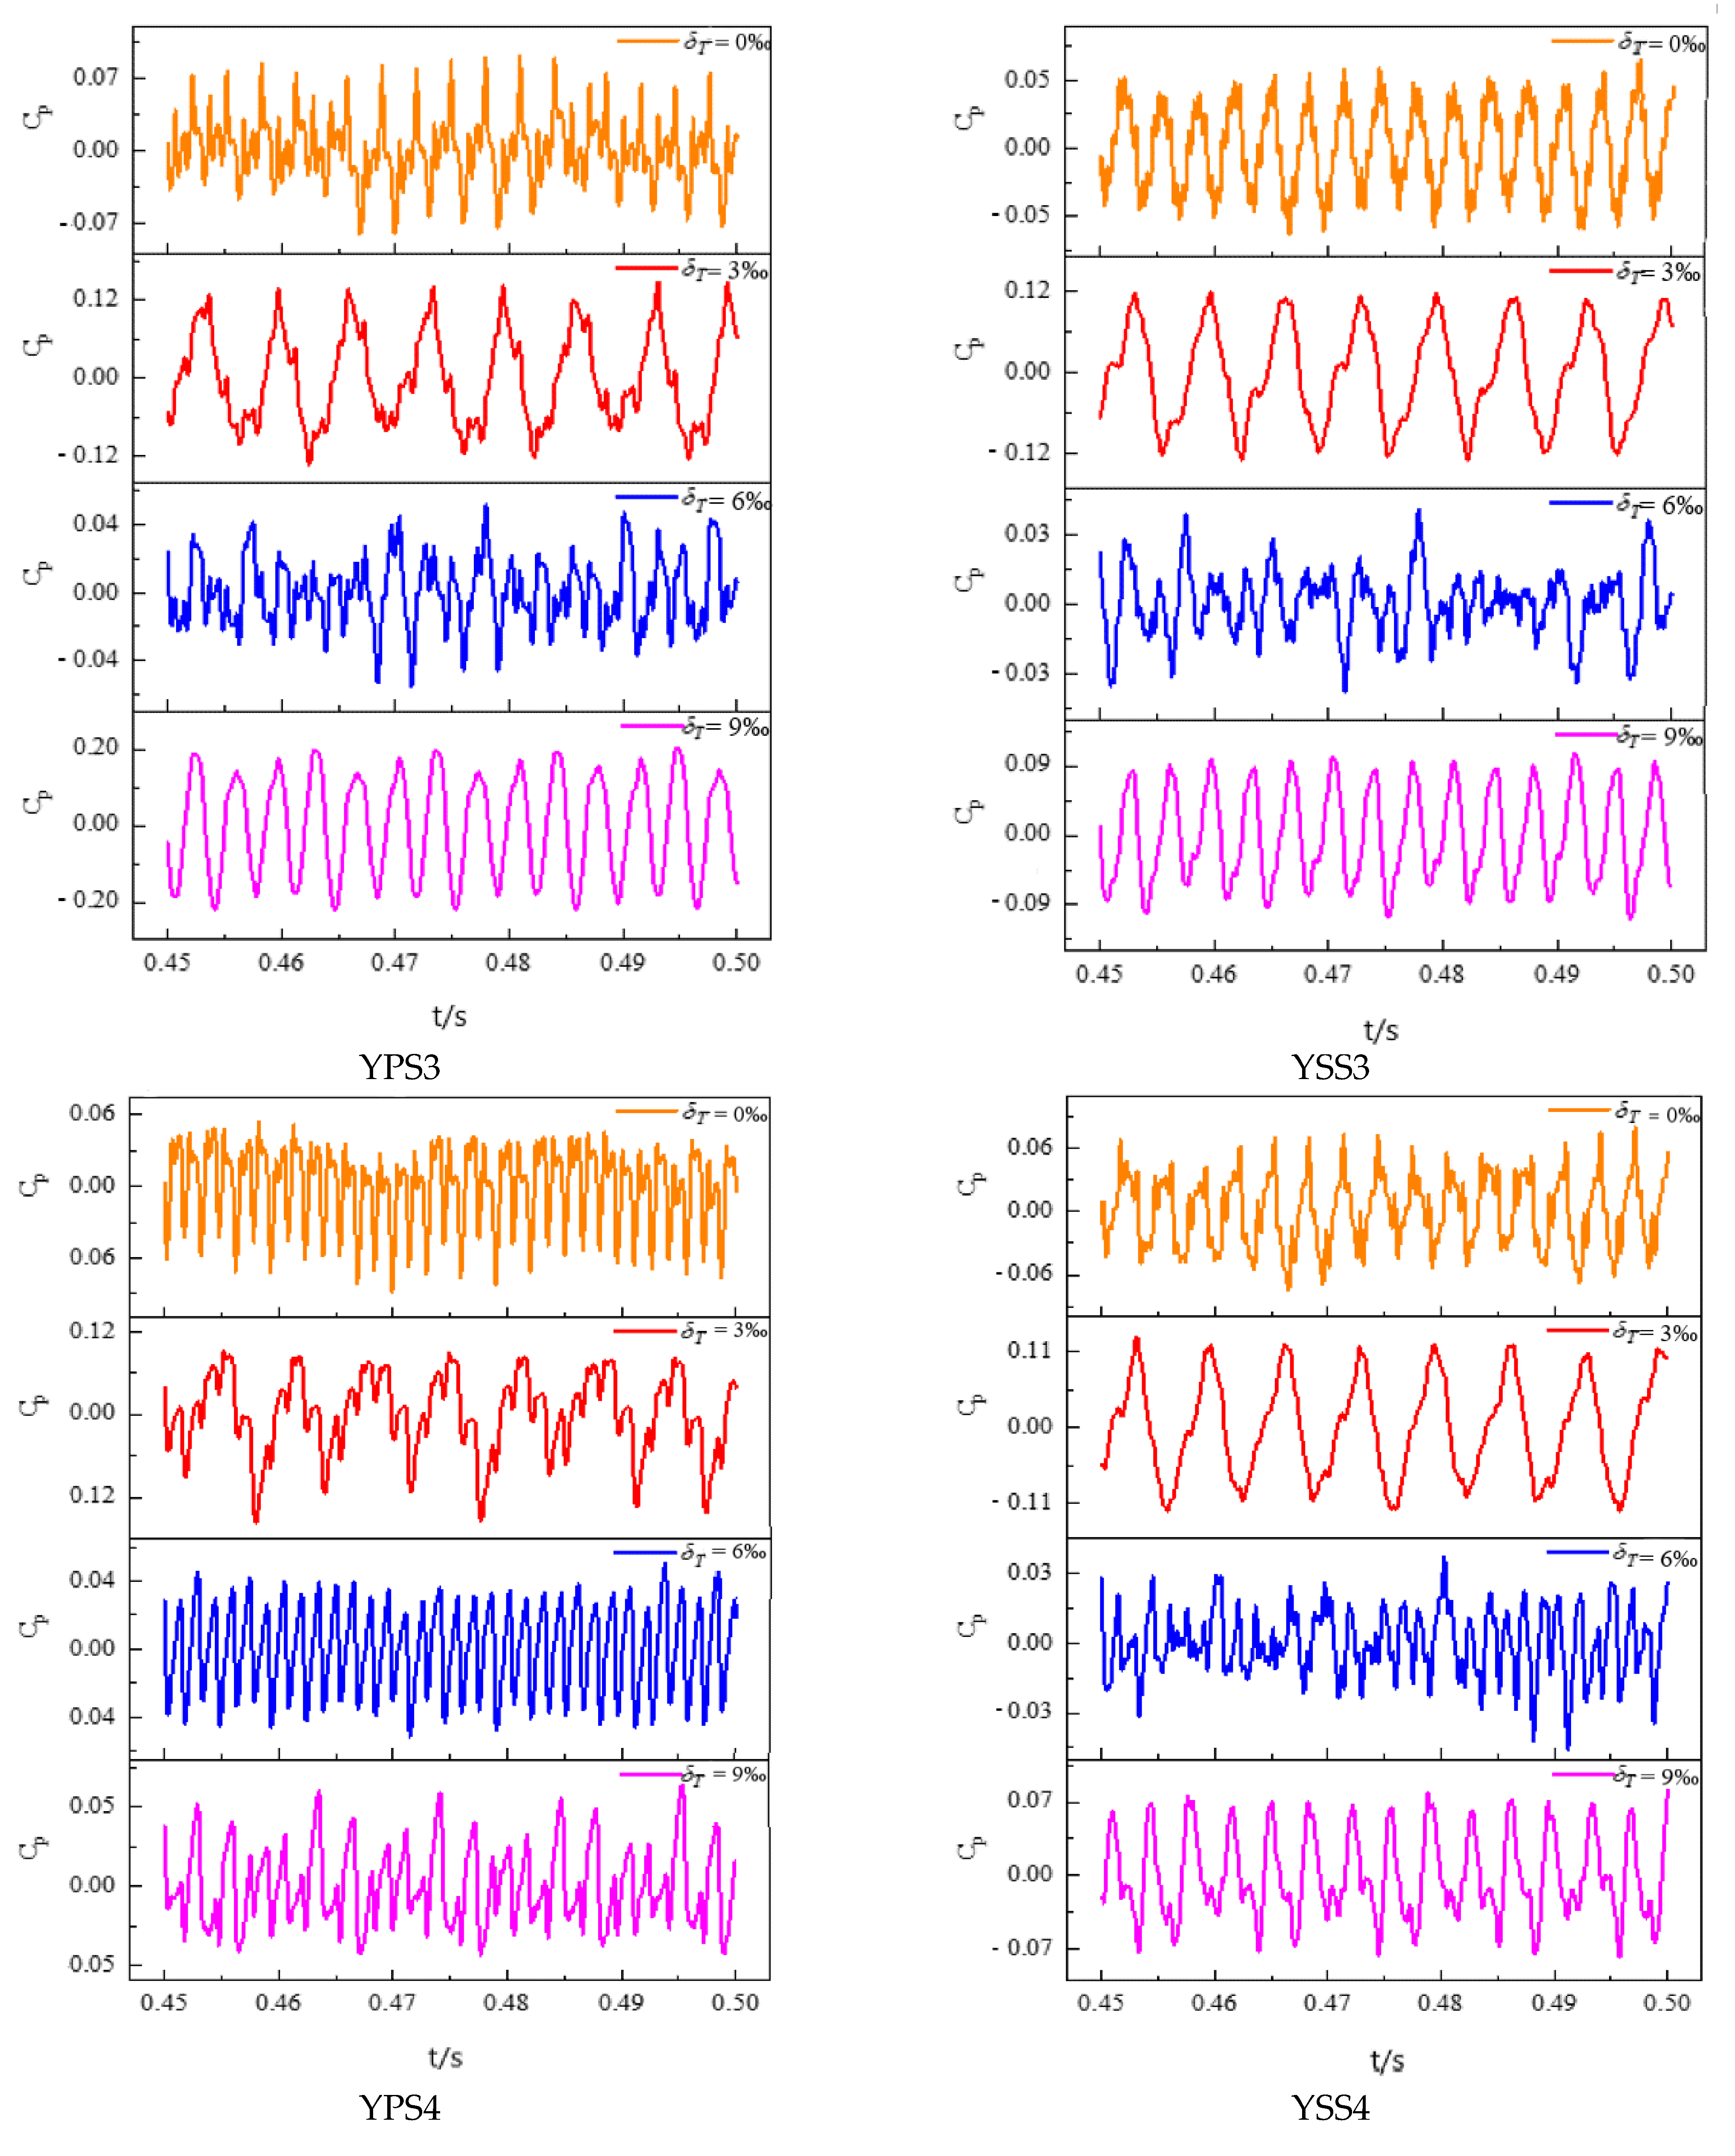
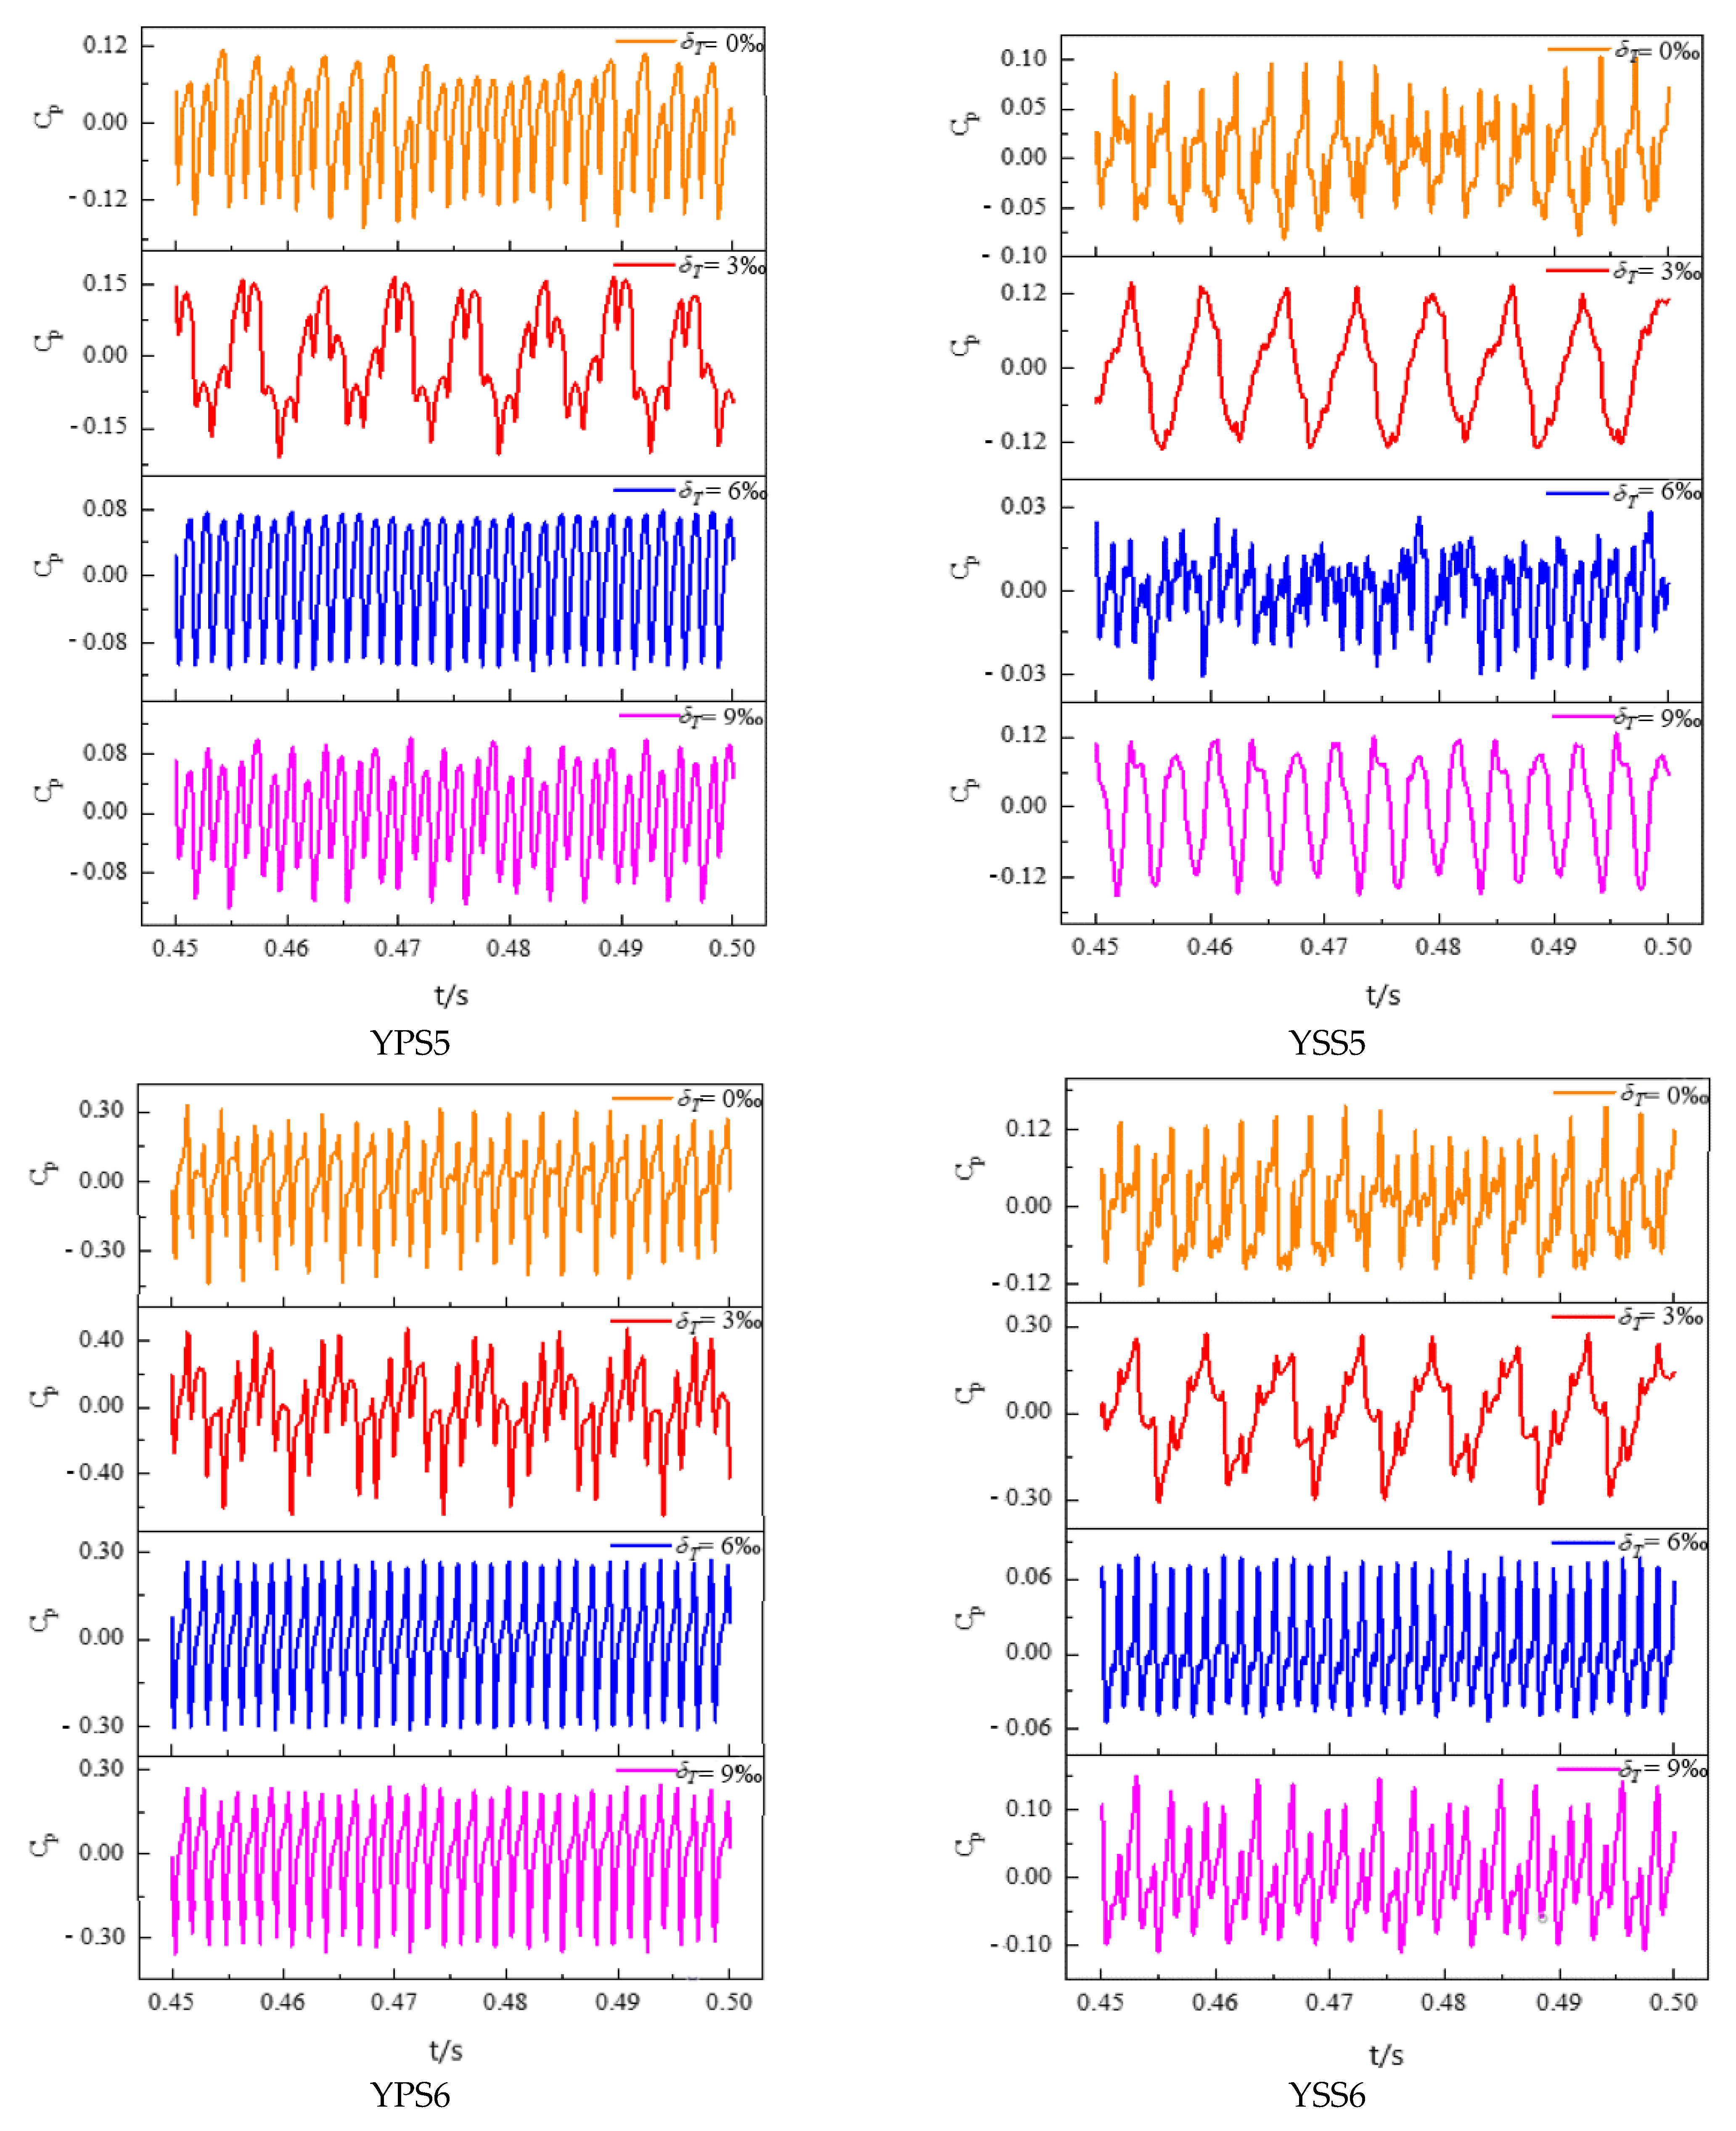
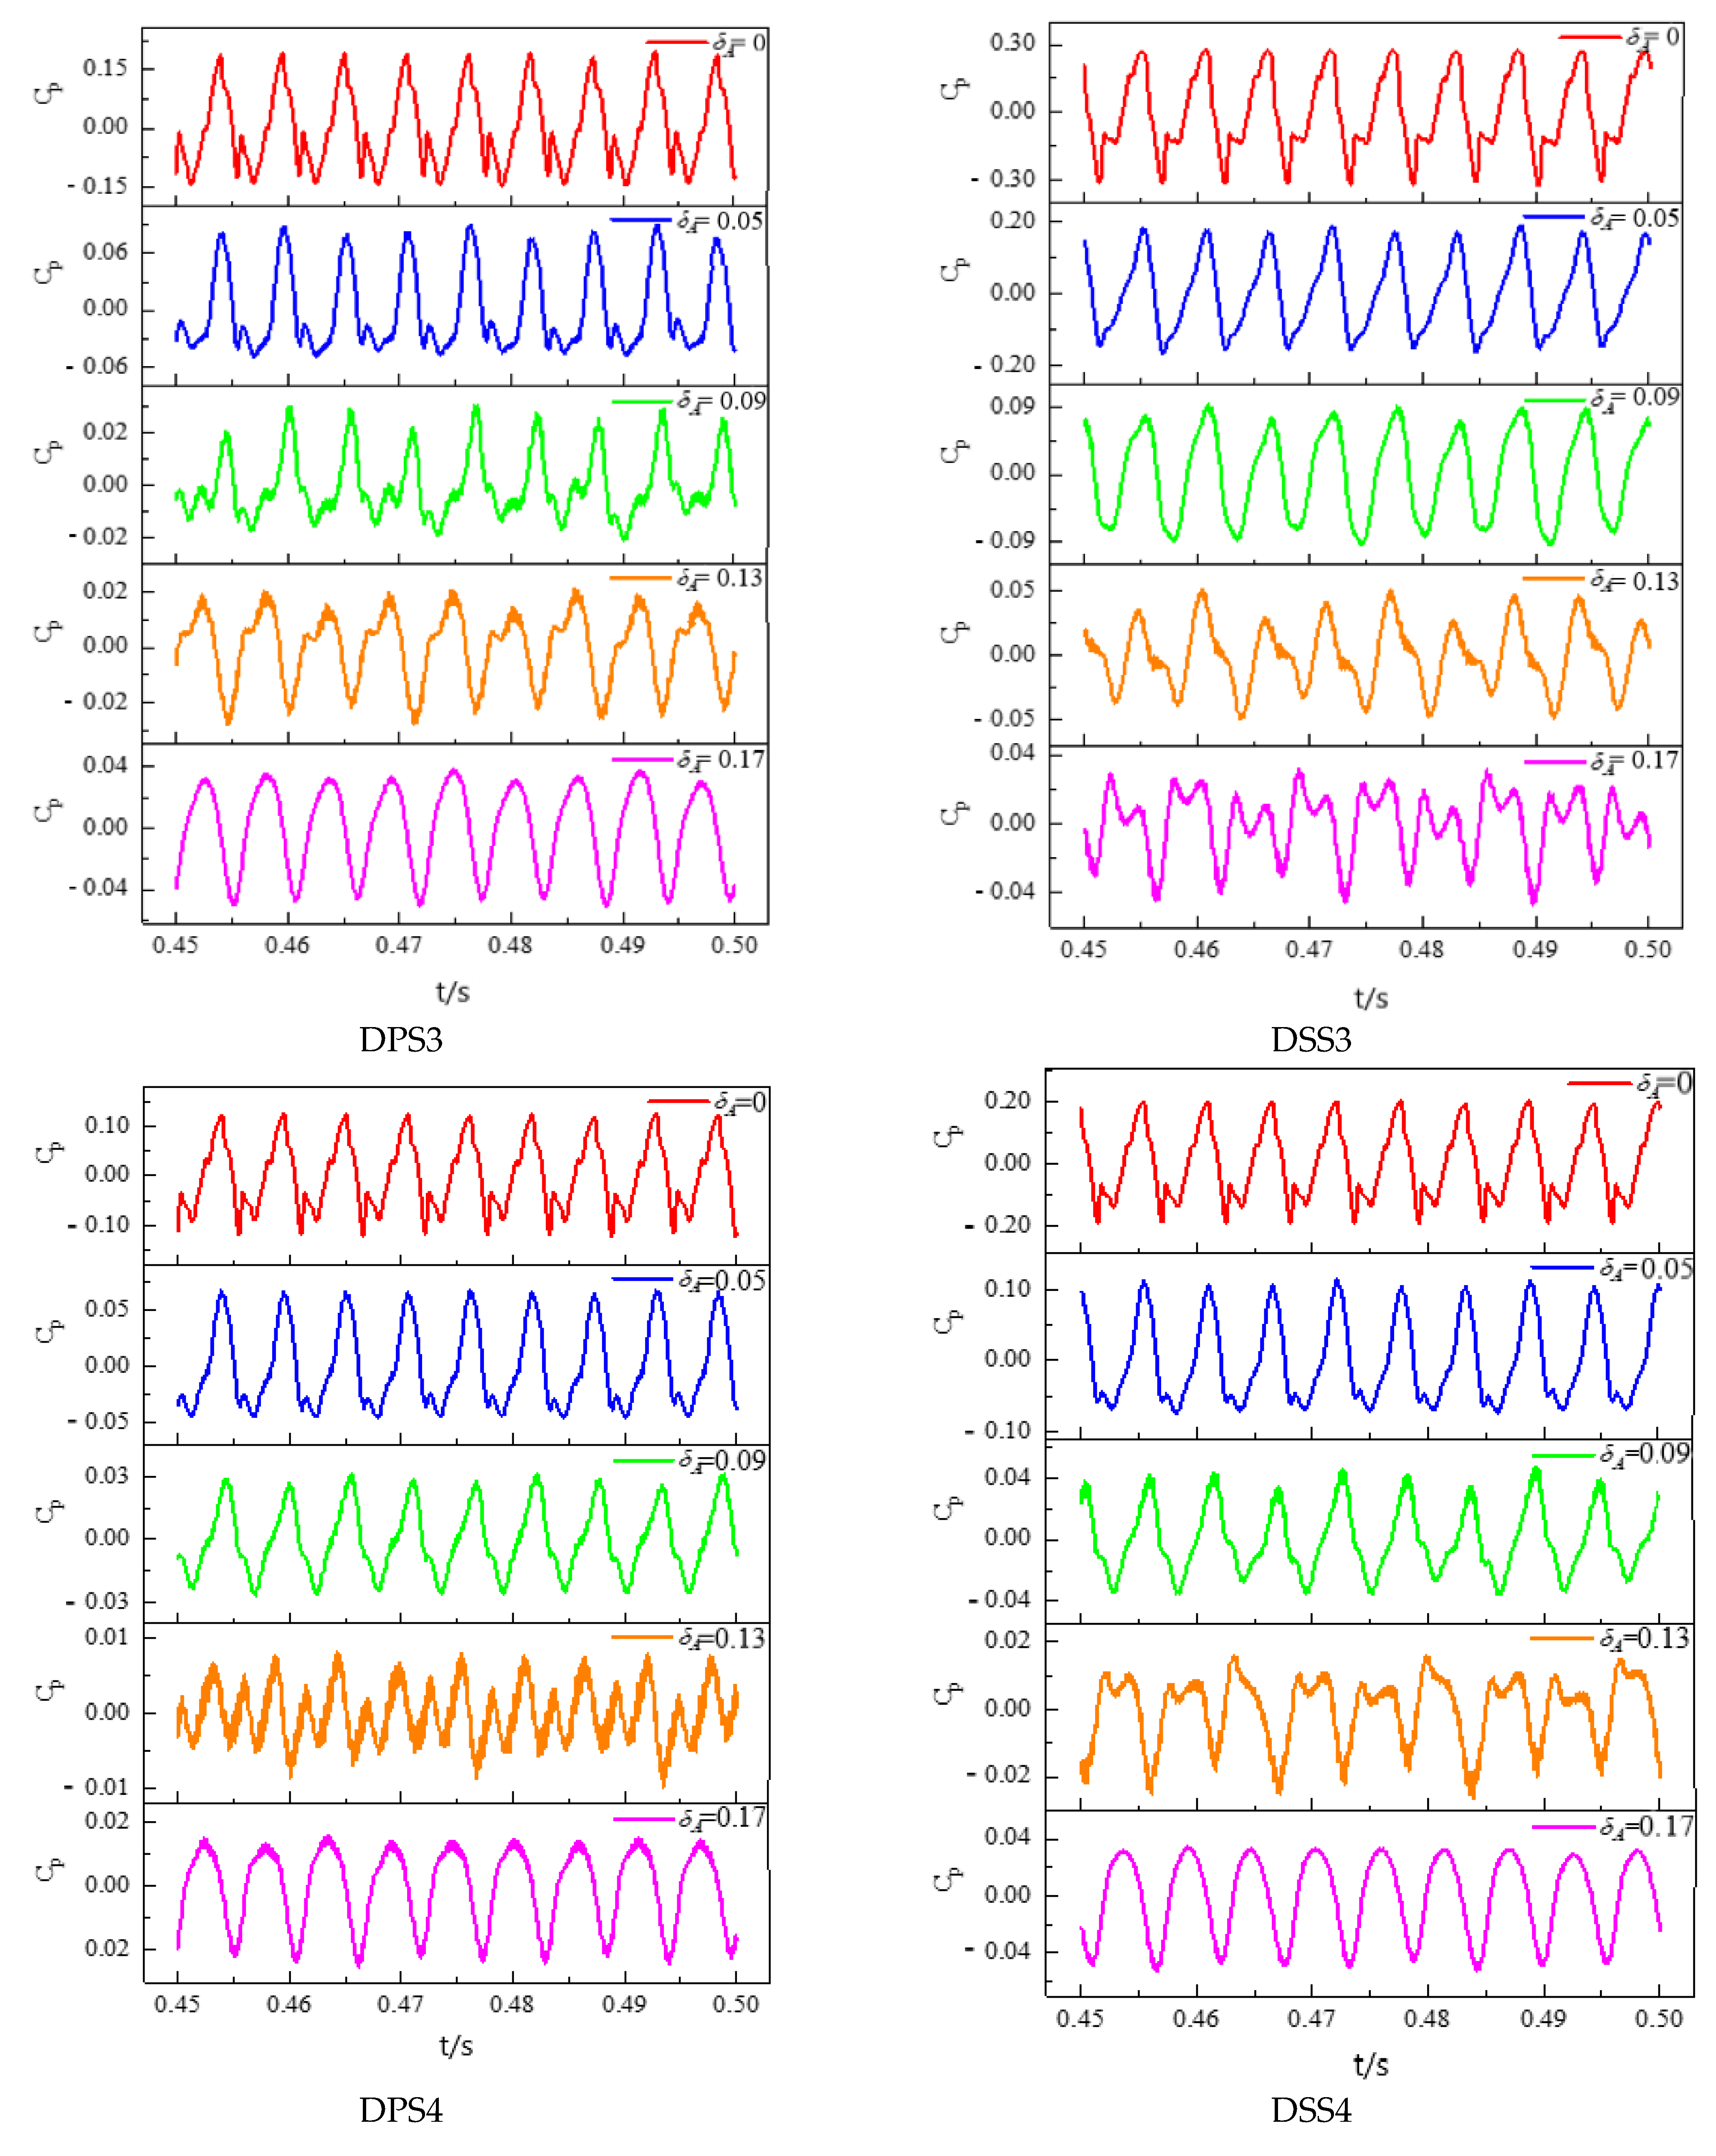
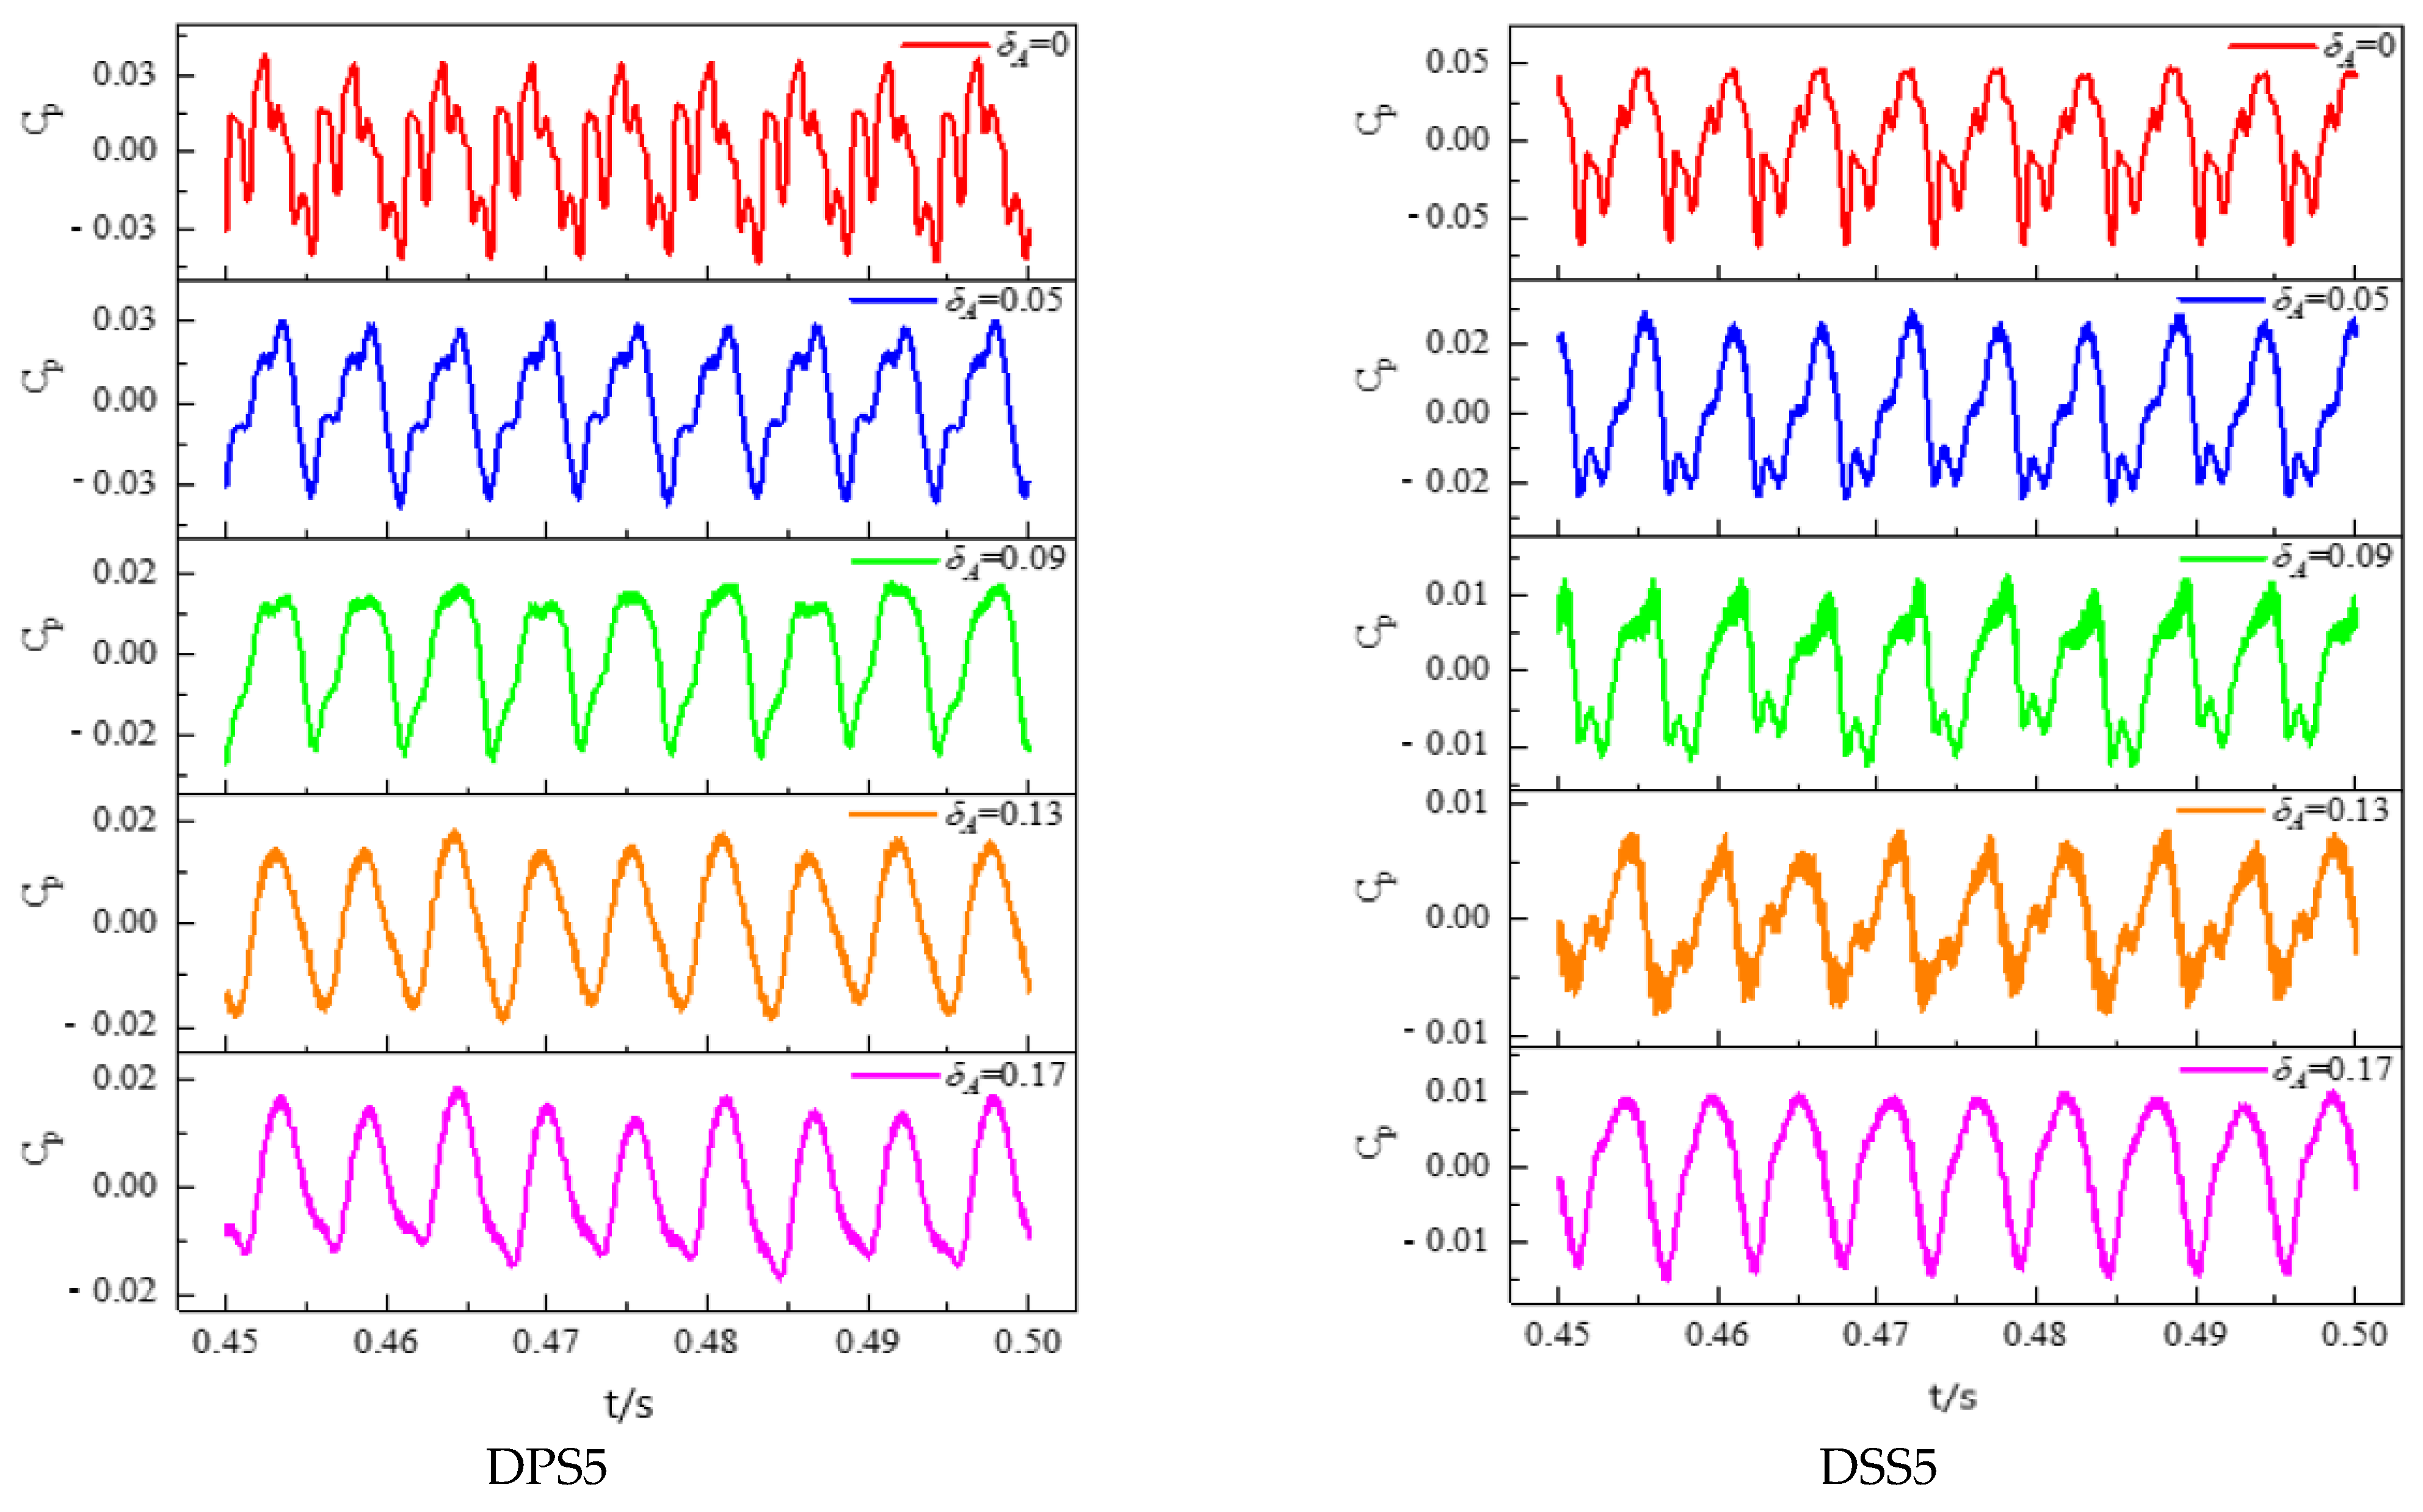
4.2.1. Time Domain Characteristics Analysis

The unsteady static pressure data of each monitoring point on the impeller blade’s pressure and suction surface is extracted and processed, and the instantaneous pressure variation with time is characterized by the pressure pulsation coefficient C p . Figure 7 shows the time domain diagram of 0.5 span with pressure pulsation on the impeller blade’s surface, where the abscissa represents the time used for three cycles of the impeller, and is represented by t, and the ordinate represents the pressure pulsation coefficient.
It can be seen from Figure 7 that in the first half of the impeller blades, the monitoring points are YPS1, YPS2, YPS3, YPS4 on the pressure surface and YSS1, YSS2, YSS3, YSS4 on the suction surface. Because the monitoring points are far from the diffuser at this time, the time domain diagram shows a poor regularity. As the monitoring points move to the impeller outlet, the closer to the diffuser, the stronger the rotor-stator interaction is. Therefore, when the monitoring points are YPS5, YPS6, YSS5 and YSS6, there are obvious and regular periodic fluctuations in the three calculation cycles. Furthermore, it can also be found that the monitoring points YPS5 and YPS6 near the outlet of the blade’s pressure surface, in addition to the working condition of δT = 3‰, the performance law of the other working conditions is that 11 similar peaks and troughs appear in a rotating cycle, corresponding to 11 diffusers. At this time, the monitoring points are obviously interfered by the diffuser.
In addition, by comparing the time domain diagram of the pressure and suction surface, it can be seen that the regularity of the monitoring points in the front half of the suction surface is greater than that of the pressure surface, while it is opposite from the middle to the outlet of the blades. After analysis, this is mainly because the greater influence of the tip leakage flow on the mainstream area near the second half of the blades, resulting in the deterioration of the regularity of the time domain diagram of the monitoring points on the suction surface. Then, comparing the time domain diagrams of different relative tip clearances at the same monitoring point, it can be found that when δT = 3‰, the regularity of the blade’s surface pressure pulsation is generally poor. The reason for the above situation may be that the influence of different tip clearances on the tip leakage flow is not the same, so the distribution of the pressure pulsation characteristics is also different. Thus, the size of tip leakage flow and the strength of rotor-stator interaction caused by different relative tip clearances have a decisive influence on the pressure pulsation characteristics in the impeller. In summary, the existence of tip clearance changes the periodic characteristics of the pressure pulsation in the impeller.

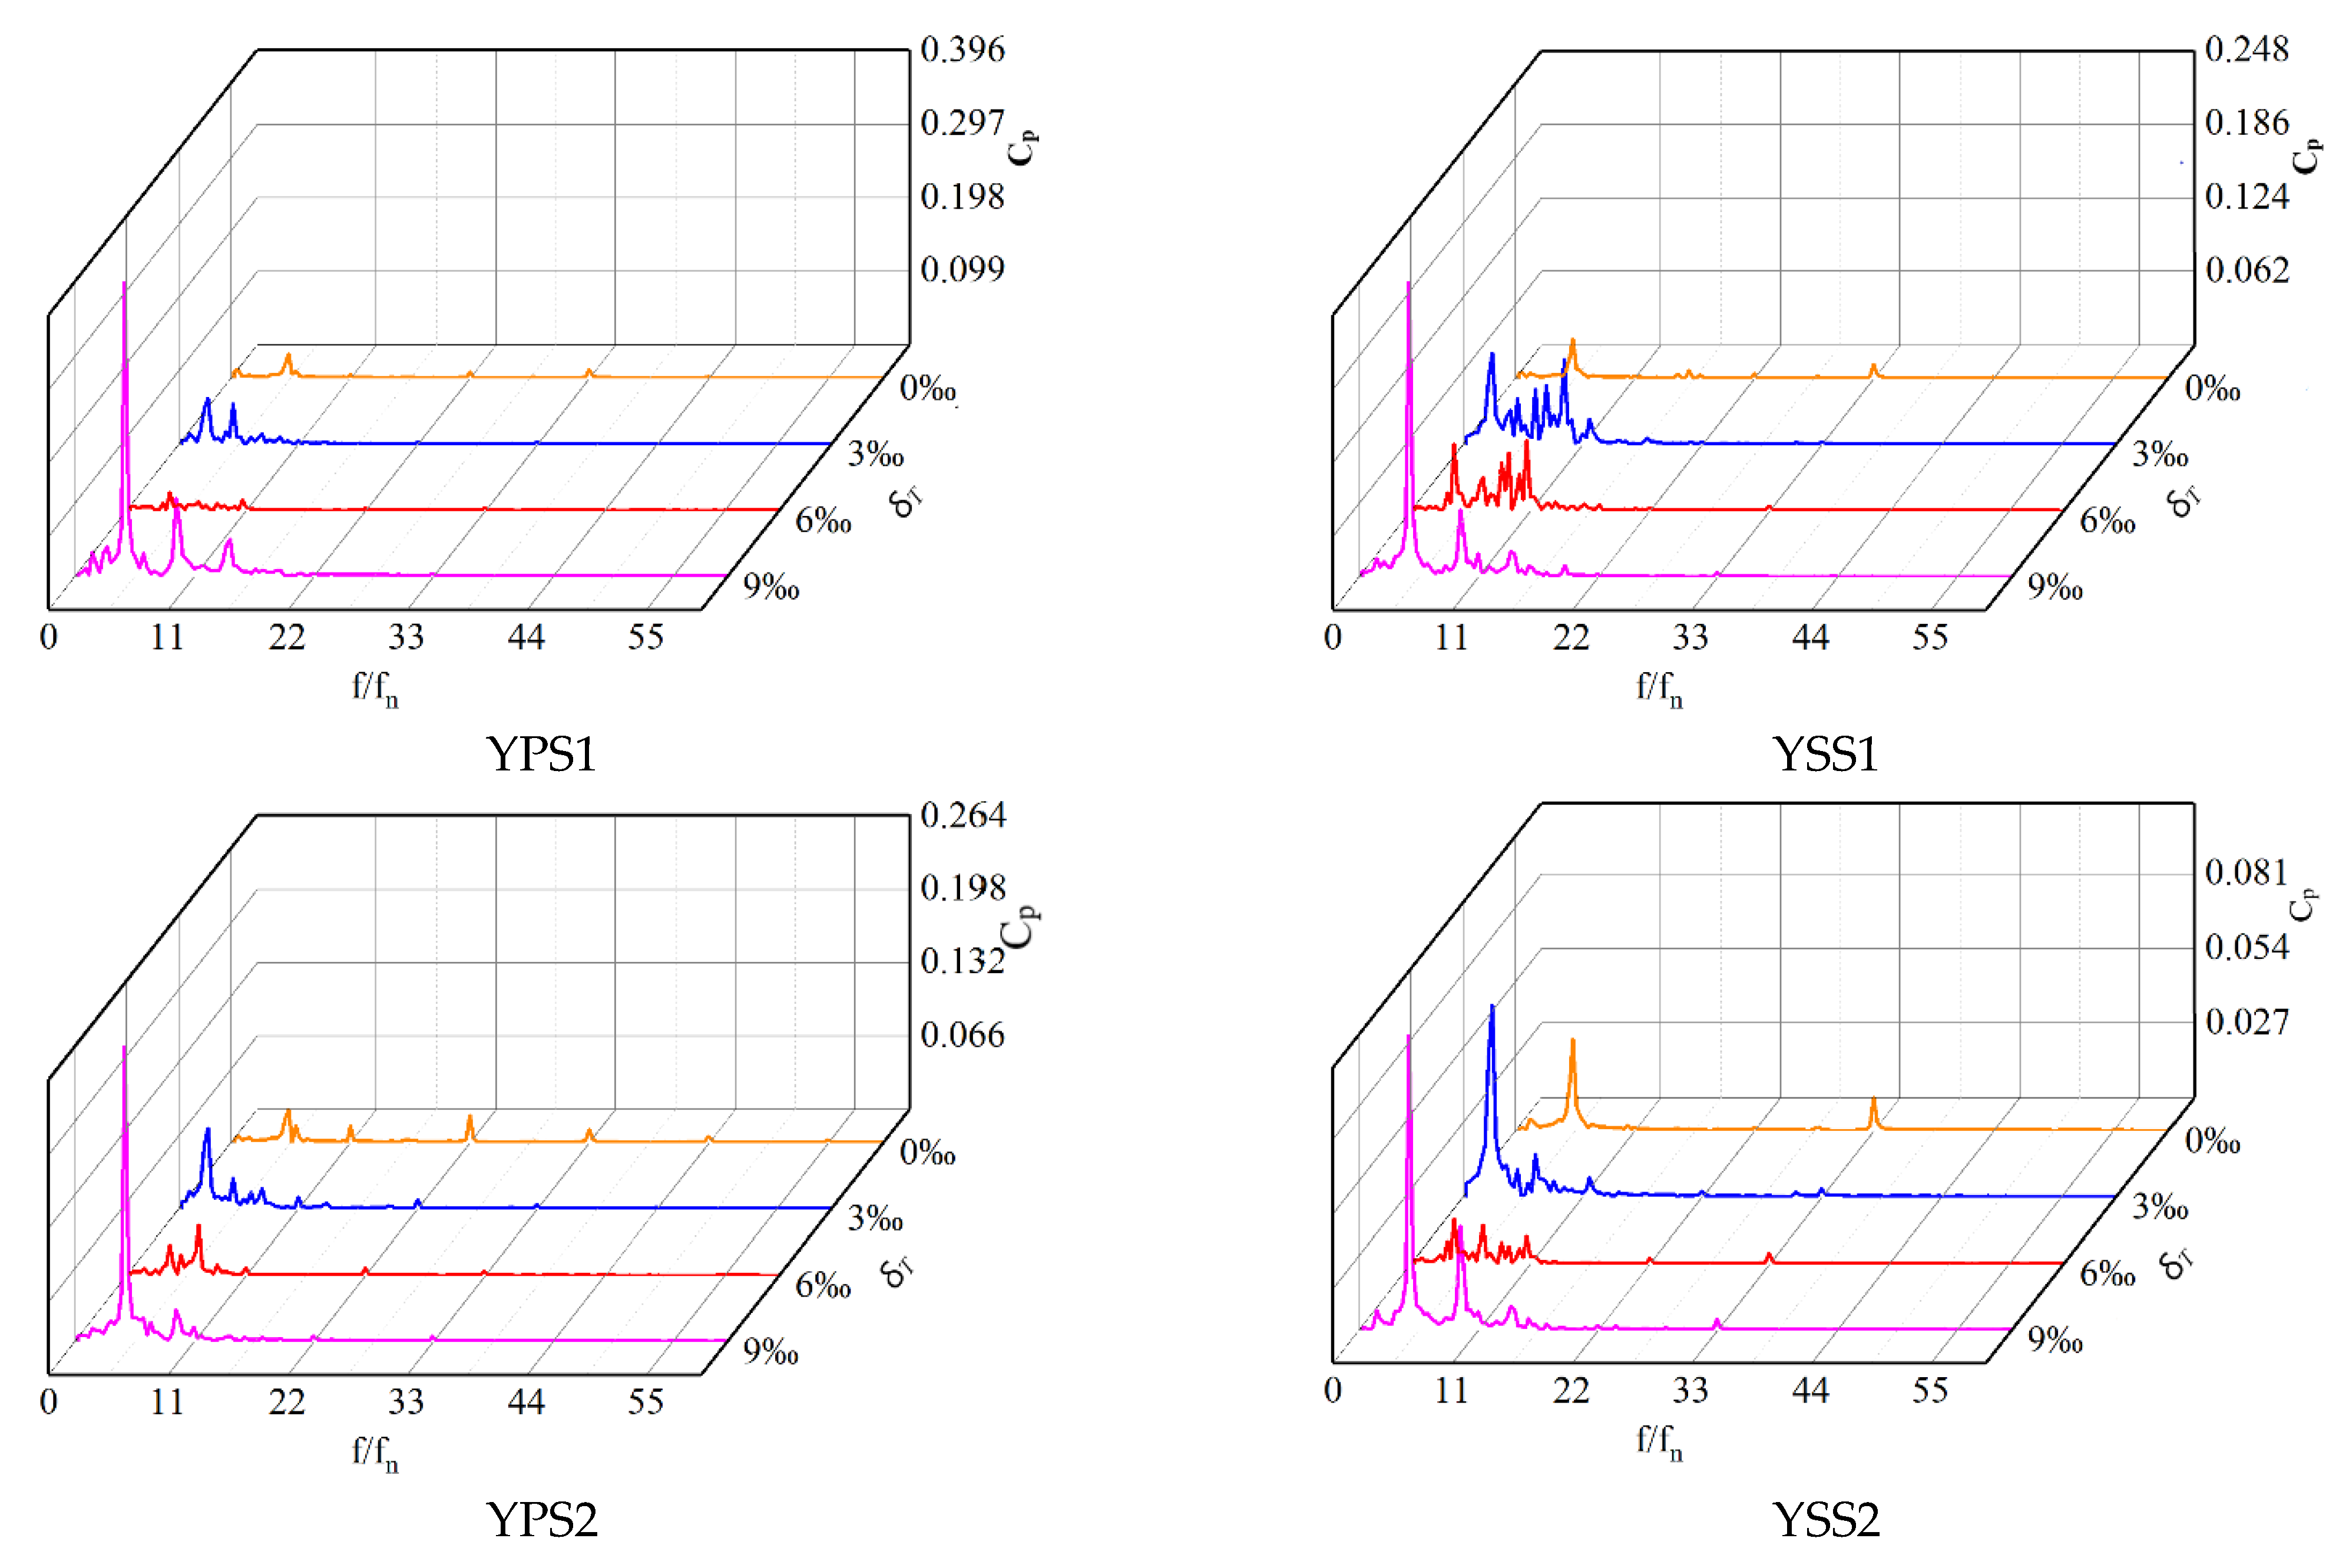
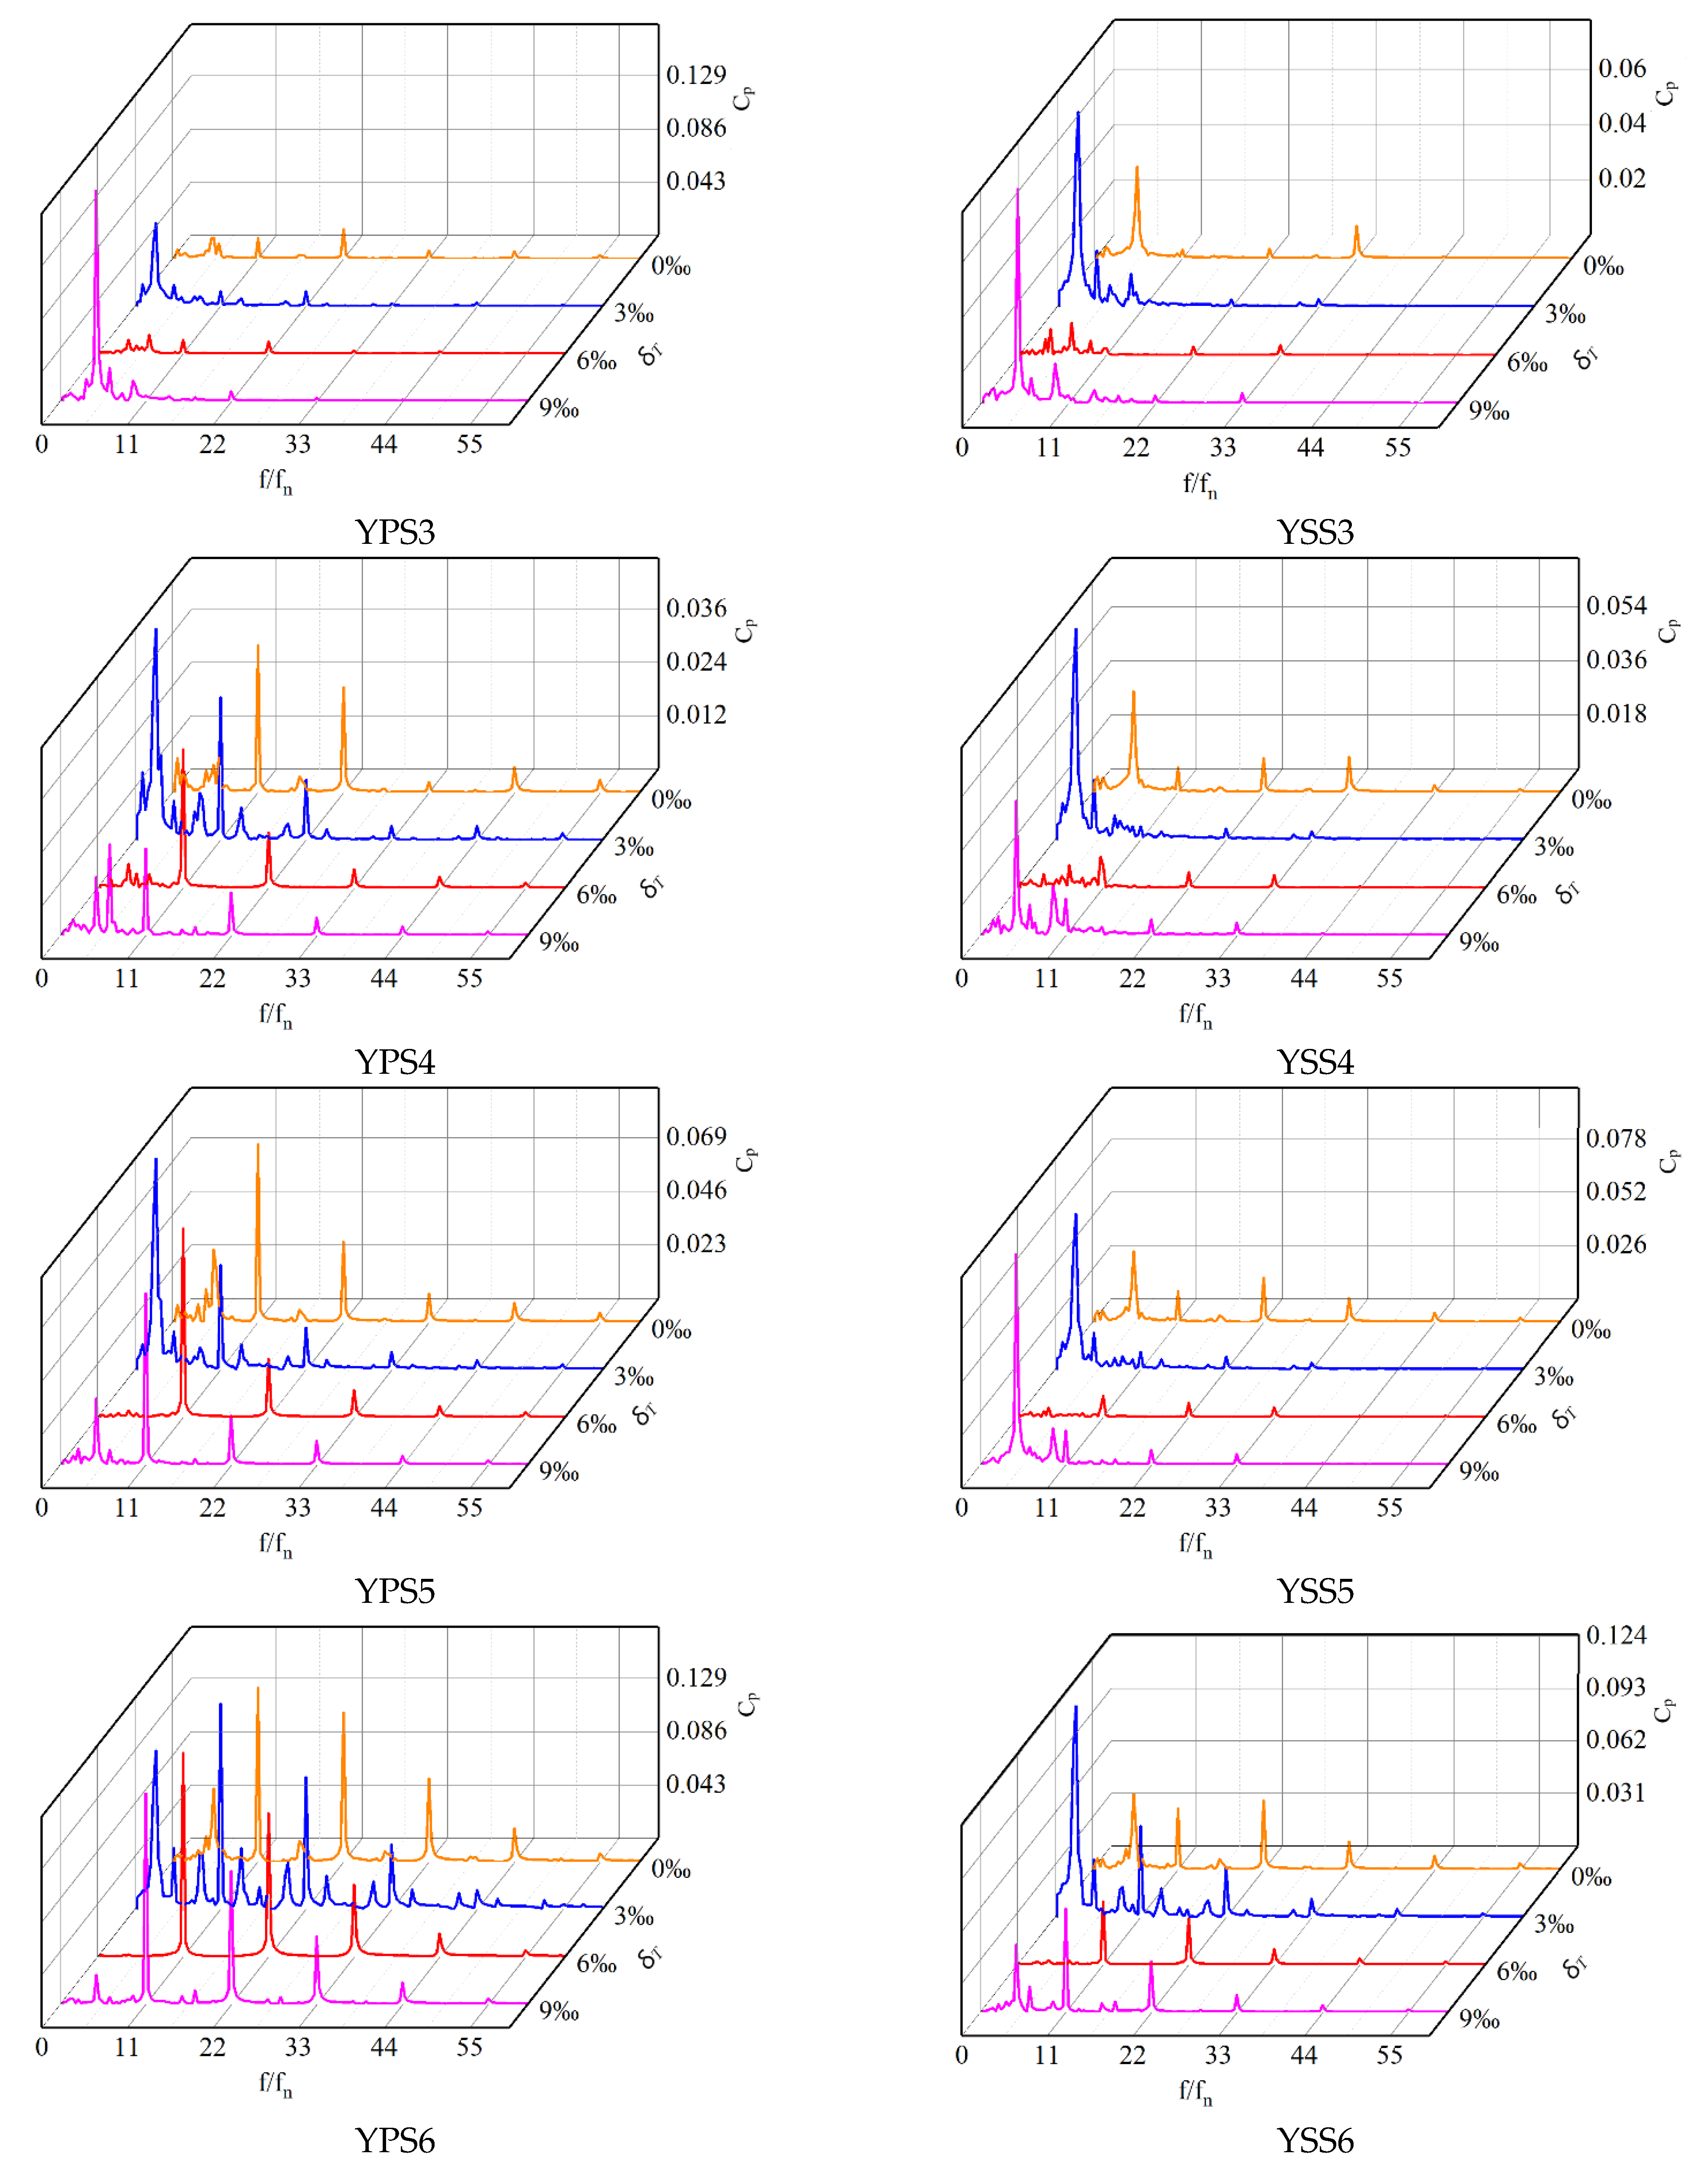
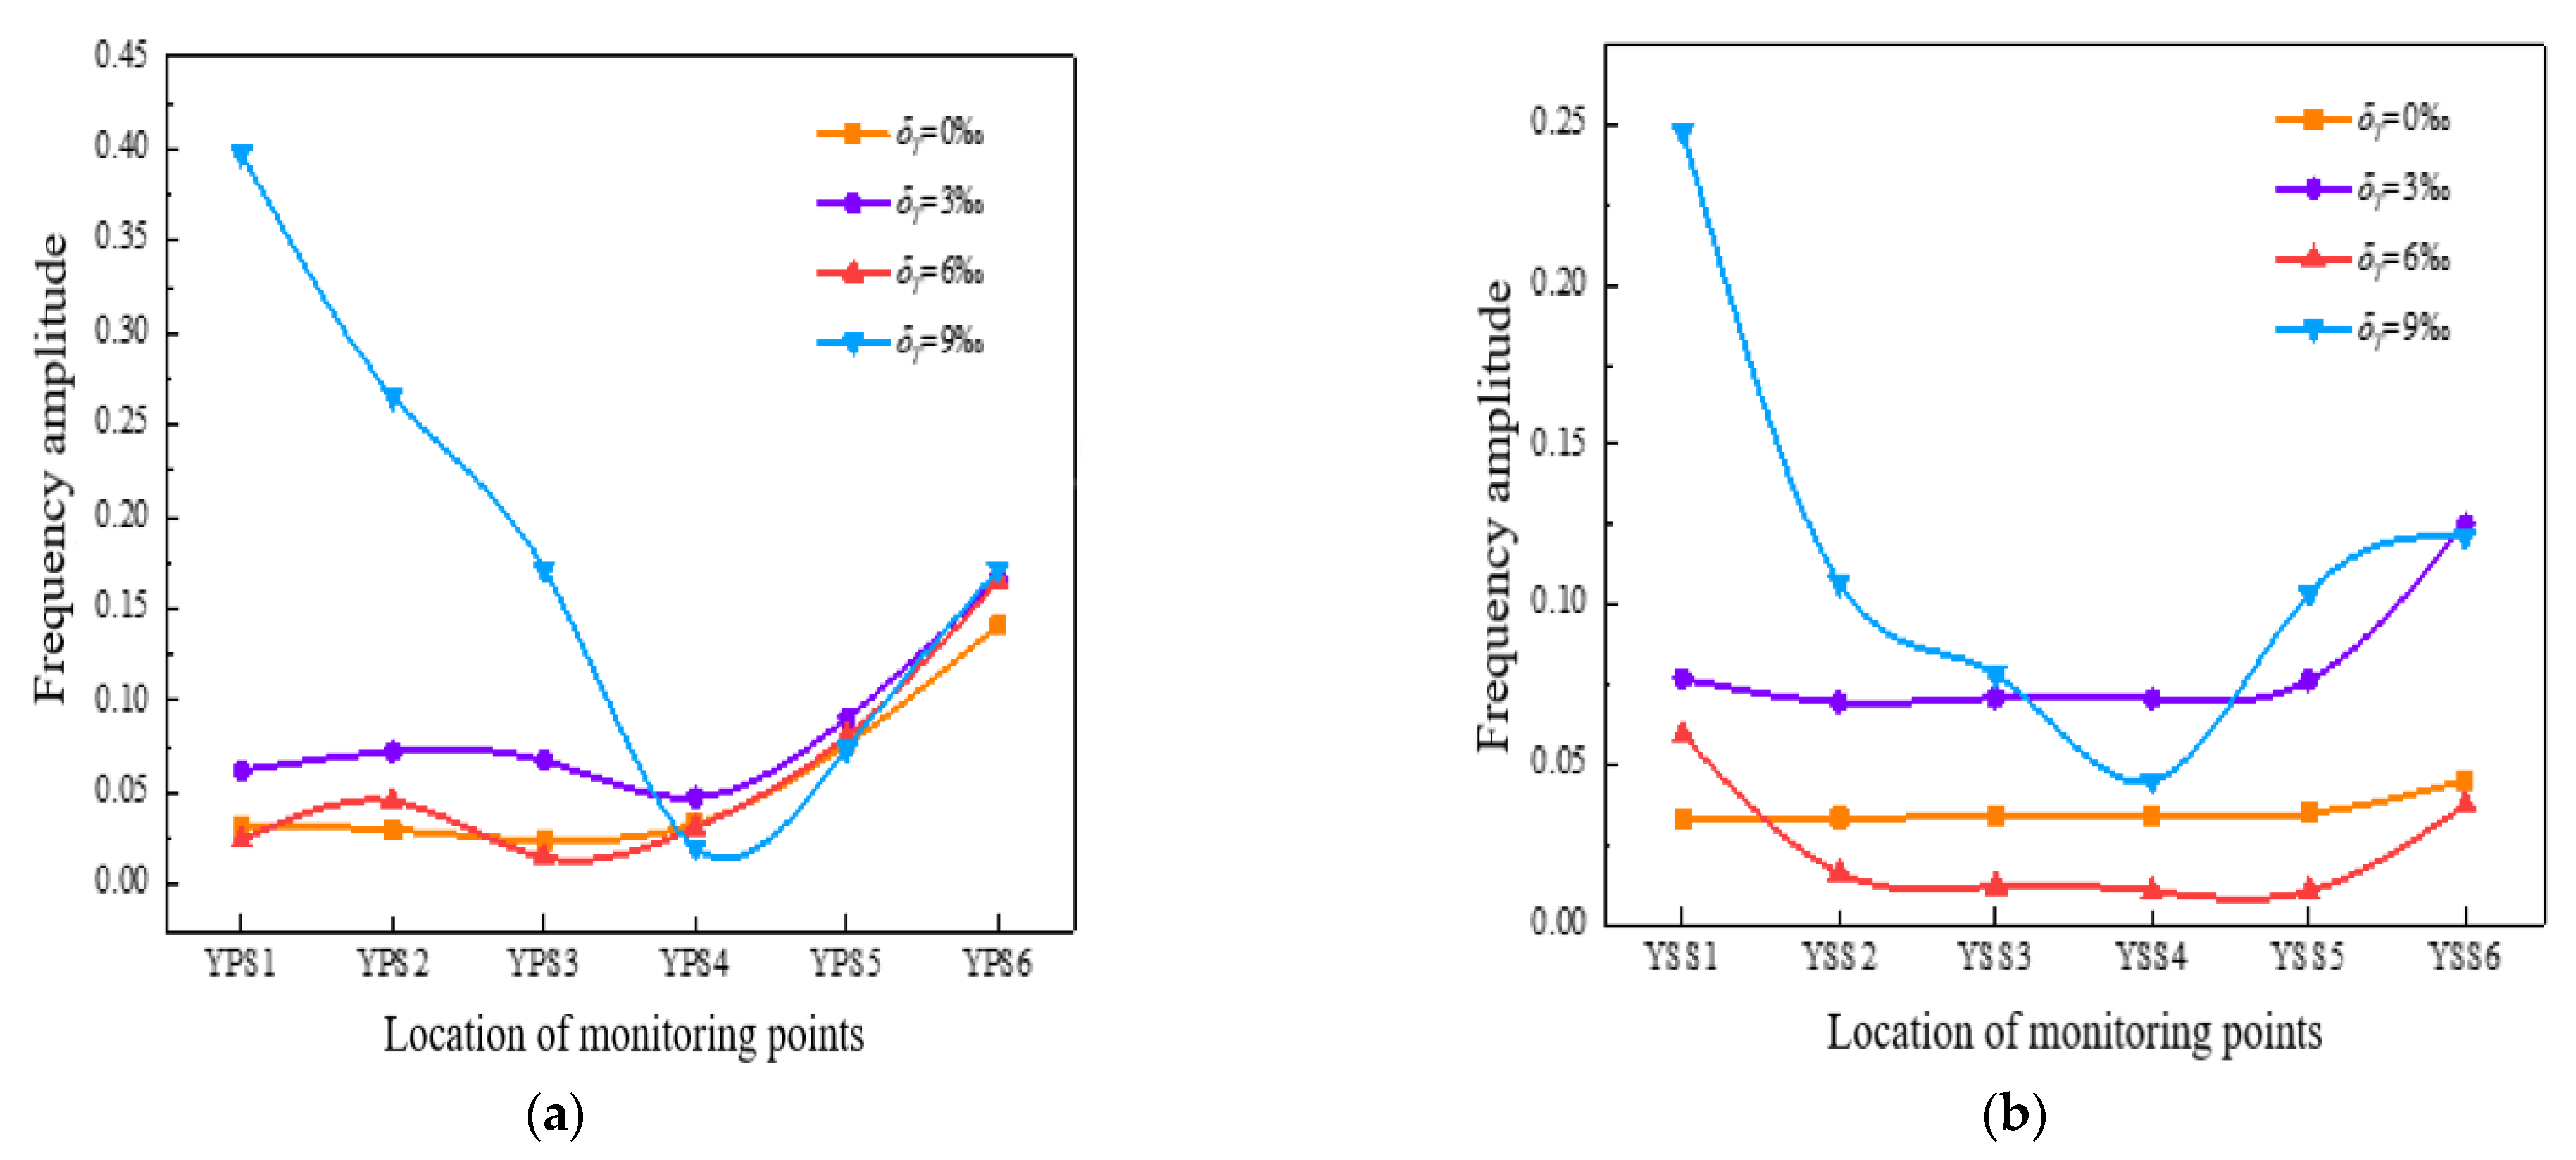
4.2.2. Frequency Domain Analysis

To explore the influence of different gap matching relations on the frequency domain characteristics of the pressure pulsation in the impeller of the pump, and the time domain pressure of each monitoring point is transformed by FFT. Then, the pressure pulsation amplitude of the transformed frequency spectrogram is dimensionless. Additionally, the impeller rotating frequency is f n = n / 60 = 60   Hz , so the impeller blade frequency is 3 f n , and the diffuser frequency is 11 f n .
As can be seen from Figure 8, the low frequency components of suction surface at each monitoring point are more than those of pressure surface, and the low frequency dispersion with large amplitude is produced. This may be caused as the tip leakage flow near the blade’s suction surface is greater than that on the pressure surface. On the one side, from the inlet to the middle position of the blades, the dominant frequency amplitude of the pressure pulsation at each monitoring point is mainly concentrated in low frequency, and the dominant frequency amplitude is large. The phenomenon of low frequency and high amplitude is related to the jet effect of the tip clearance. On the other side, for the same monitoring point, with the increase of the relative tip clearance, the overall trend of the dominant frequency amplitude is upward. Besides, it can still be concluded that in the second half of the blade’s pressure surface and at the monitoring point YSS6, the overall pulsation regularity of each monitoring point is better, because the closer the monitoring points are to the diffuser, the stronger the interference effect is. At this time, the dominant frequency amplitude of the pressure pulsation is 11 f n , which is equal to the diffuser frequency.

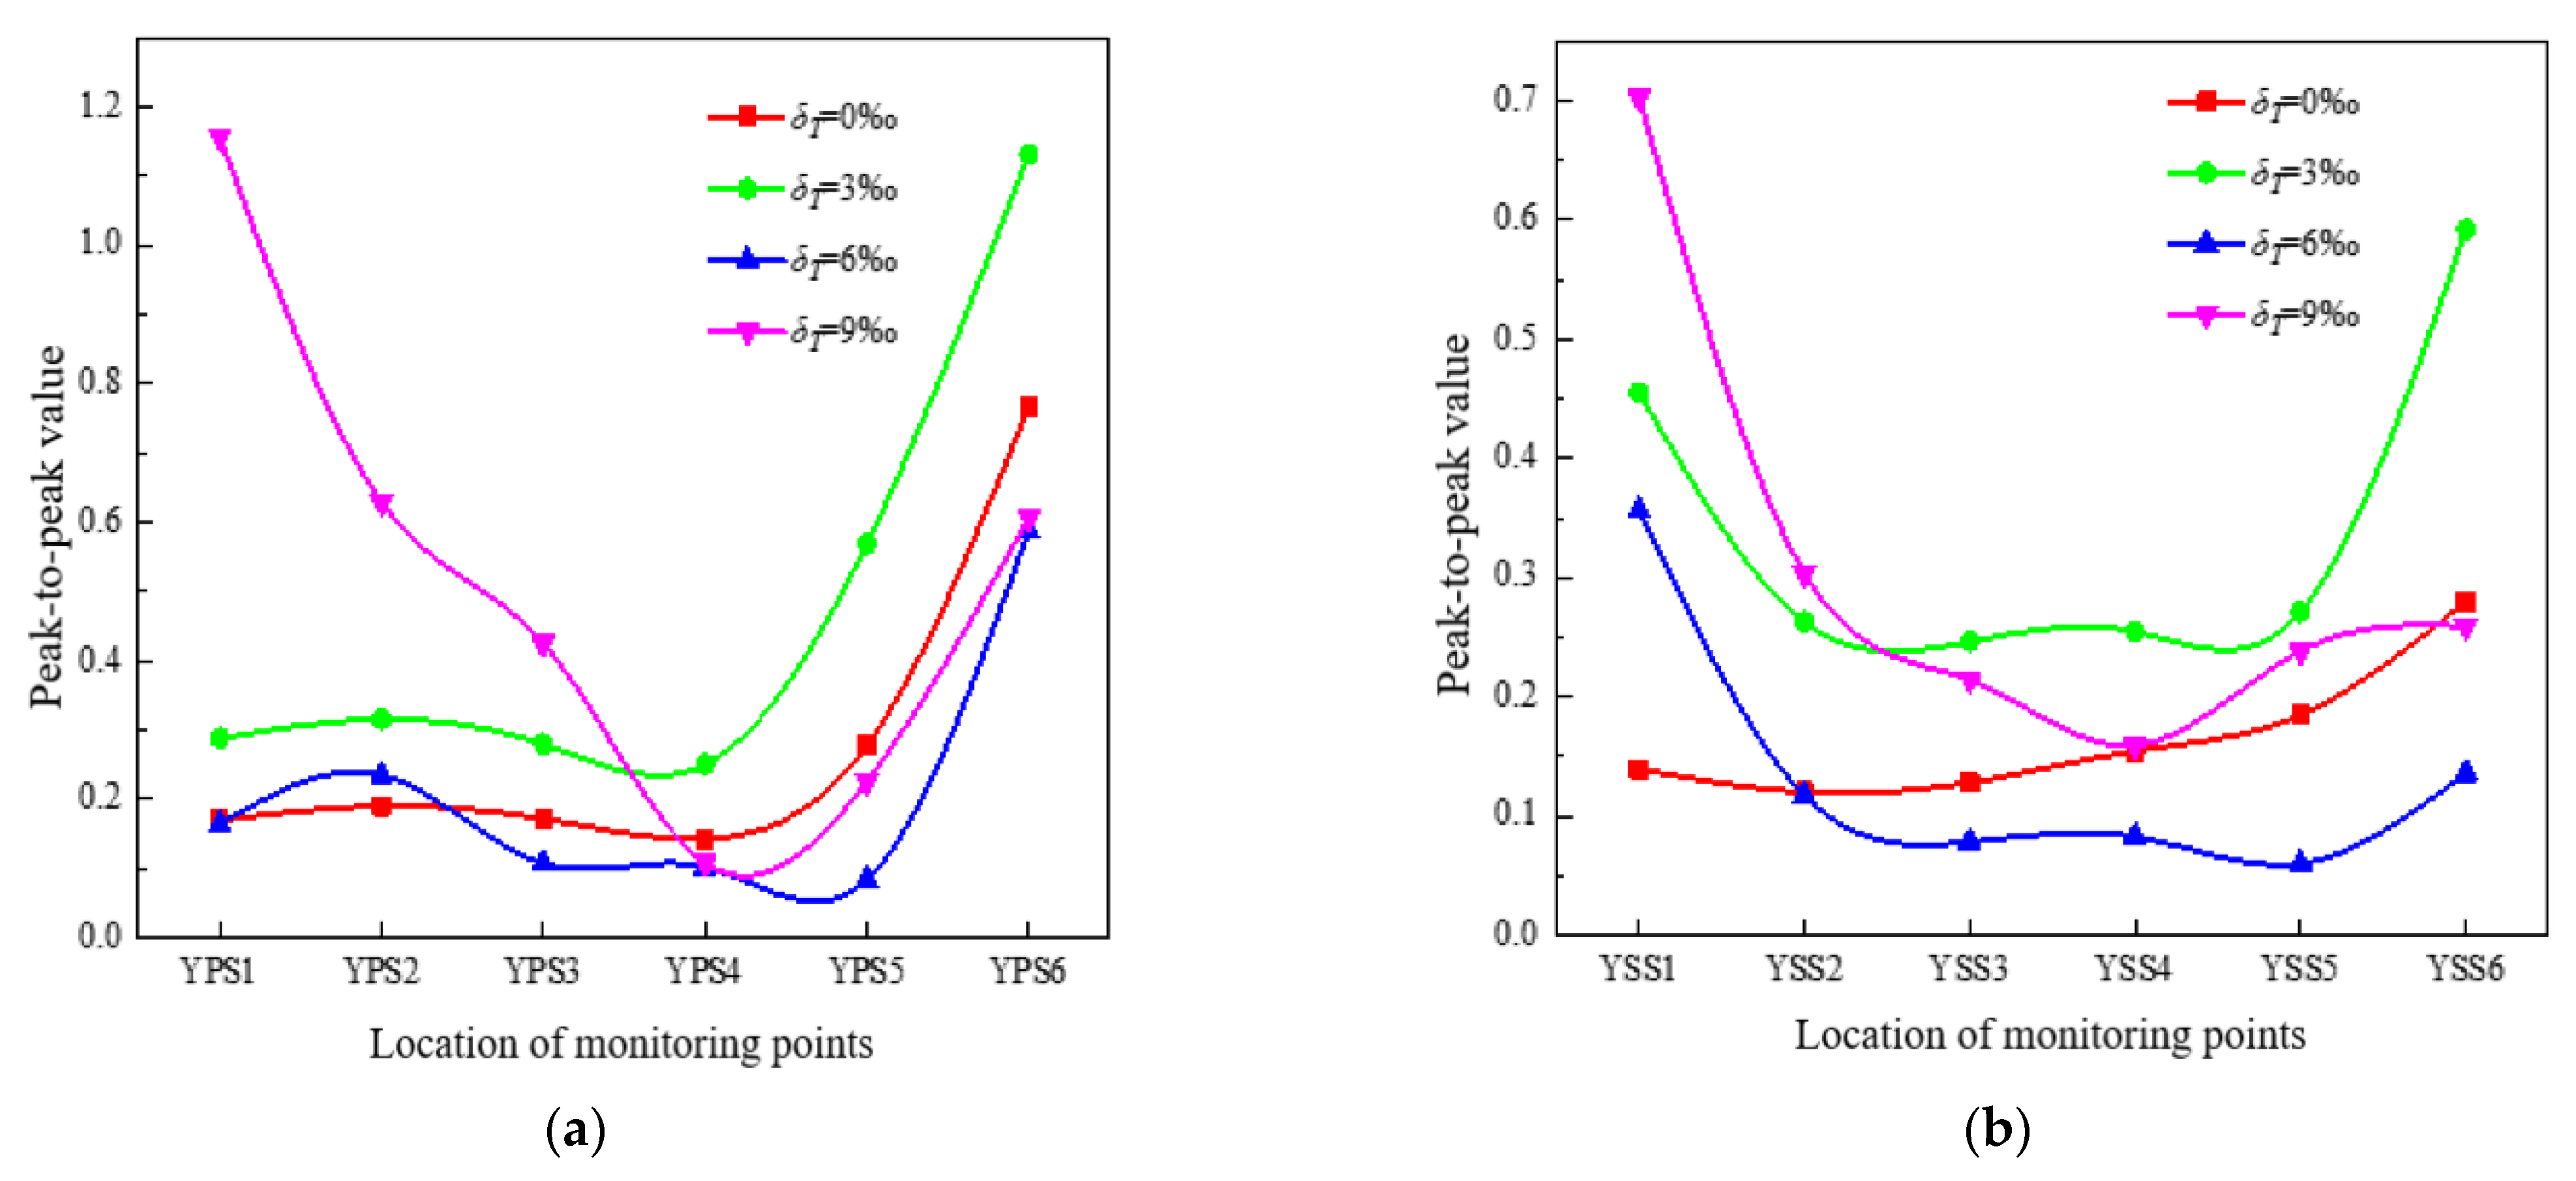
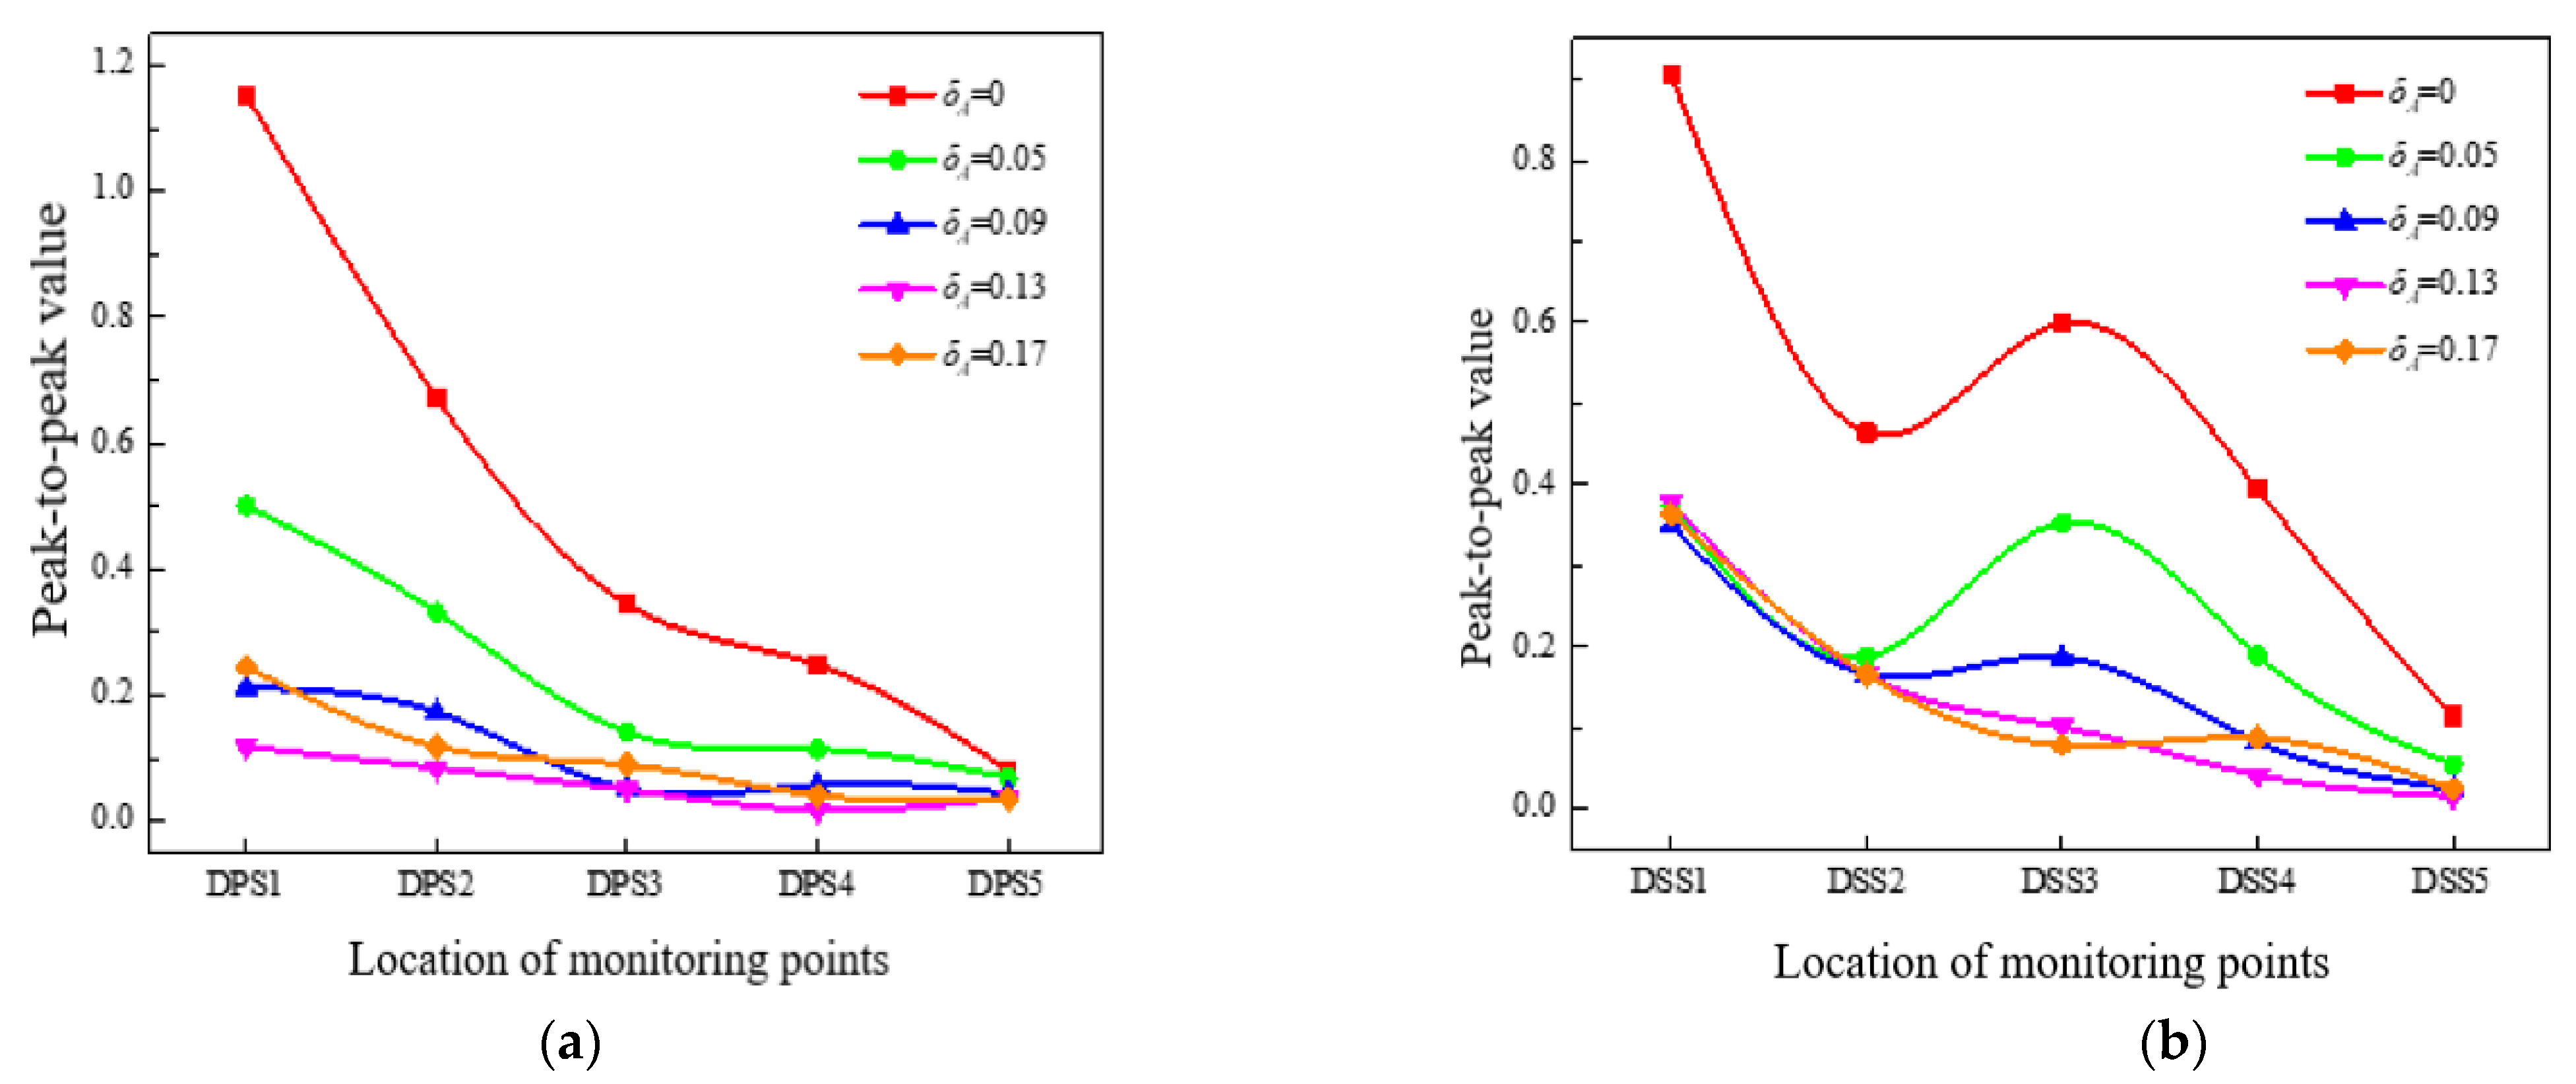
4.2.3. Analysis of the Pressure Pulsation Peak-to-Peak Value and the Dominant Frequency Amplitude Coefficient

Under different relative tip clearances, the peak-to-peak value of the pressure pulsation in the time domain and the amplitude coefficient of the dominant frequency pressure pulsation in the frequency spectrogram of impeller blade’s surface monitoring points are extracted, and the results are shown in Figure 9 and Figure 10.
It can be seen from the figures that the distribution laws of the peak-to-peak value and the dominant frequency amplitude coefficient are similar, and the size of the value and coefficient and their variation range along the flow direction are greater than those of the suction surface. In addition, the average peak-to-peak value and the dominant frequency amplitude coefficient of the pressure surface are 54.98% and 48.61% higher than those of the suction surface, respectively. Moreover, the vibration amplitude in the middle of the impeller blades is the smallest, which is mainly because of the full mixing of gas and liquid, so that the flow pattern distribution at this position is more uniform.
At δT = 0‰, 3‰, 6‰, from the inlet to the outlet of the pressure surface blades, the peak-to-peak value and the amplitude coefficient change slowly at first, and then increase rapidly at the outlet. This is on account of the increase of the rotor-stator interaction when the monitoring points are close to the outlet of the impeller.
When δT = 9‰, the peak-to-peak value of the pressure pulsation on the blade’s surface and the amplitude coefficient of the dominant frequency decrease first and then rise. This may be owing to the further increase of the clearance, which greatly changes the distribution law of the internal flow field in the pump, so that the range of the pressure coefficient increases sharply.
Meanwhile, it can also be found that when δT = 0‰, the monitoring points at different positions have the smallest influence on the peak-to-peak value and the dominant frequency amplitude on the suction surface. Because without the existence of tip clearance, there is no leakage flow and jet effect. In consequence, the flow state of the impeller suction surface of the multiphase pump is better than that with tip clearance.

4.3. Effect of the Gap Matching Relation on the Pressure Pulsation Characteristics of the Diffuser

4.3.1. Time Domain Characteristics Analysis

By comparing the different axial clearance coefficients, it can be seen that with the increase of the ACC, the pressure pulsation amplitude coefficient of monitoring points decreases gradually. At the same time, through horizontal comparison (pressure and suction surfaces), it is concluded that the pressure coefficient of the pressure surface is greater than that of the suction surface, as shown in Figure 11.
In addition, the pressure pulsation of monitoring points at different positions is regular under different working conditions. According to the observation waveform, the pressure pulsation law can be divided into two categories: ① It presents sinusoidal periodic fluctuations, such as monitoring points DPS1, DSS1, DPS2 and DSS2 at δA = 0.17; ② When δA = 0, the waveforms of DPS1, DPS2, DPS3 and DPS4 are periodically, but not the standard sine curve. However, no matter the sine curve or the periodic fluctuation, there are three main peaks and troughs in a rotating cycle, which are equal to the number of impeller blades. The above analysis indicates that the pressure pulsation characteristics in the diffuser are mainly affected by the rotor-stator interaction. It is found that there are obvious secondary peaks and troughs in type ② waveform, and the pressure pulsation regularity of the suction surface is poor. Because of the large twist on the suction surface profile of the diffuser blades, the gas-liquid separation occurs easilyunder the effect of inertia, which leads to the deterioration of the flow pattern and the pressure pulsation regularity of the suction surface.

4.3.2. Frequency Domain Analysis

To further study the pressure pulsation on the diffuser blade’s surface, the frequency spectrum analysis of pressure pulsation in three calculation cycles of each monitoring point under different axial clearance coefficients is carried out. The frequency spectrograms of DPS1~DPS5 and DPS1~DSS5 are shown in Figure 10. The f/fn in the figure indicates the pump rotating frequency, where the x axis is the frequency ratio, the y axis is the pressure pulsation amplitude coefficient, and the z axis is the relative ACC. As can be seen from Figure 12, the low frequency pulsation does not appear in the frequency spectrogram of each monitoring point, and the dominant frequency is 3fn. Meanwhile, there are obvious pulsation peaks at 6fn, 9fn and 12fn, etc.
When δA = 0, it is indicated that the amplitude of the dominant frequency pulsation at each monitoring point is greater than that of other ACCs. There are multiple secondary frequency pulsations which decrease with the increase of frequency. As the coefficient increases, the amplitude of the dominant frequency pulsation is gradually smaller. This is because the increase of the axial clearance makes the monitoring points keep away from the rotor-stator interface, which weakens the rotor-stator interaction. For the same axial clearance, from the diffuser inlet to the outlet, the dominant frequency amplitude also presents similar variation.

4.3.3. Analysis of the Pressure Pulsation Peak-to-Peak Value and the Dominant Frequency Amplitude Coefficient

The peak-to-peak value of the pressure pulsation can intuitively reflect the maximum pressure of the monitoring points in the diffuser in a rotating cycle. By comparing the peak-to-peak value of the pressure pulsation at each monitoring point in the diffuser under different ACCs. It can be seen that the variation trend of the peak-to-peak value of the pressure pulsation at different clearance coefficients are similar. With the increase of the clearance coefficient, the peak-to-peak value of monitoring points decreases accordingly. For monitoring point DPS1, the value of the pressure pulsation at δA = 0 is 4.69 times that of δA = 0.17, as shown in Figure 13.
The peak-to-peak value of the pressure surface monitoring points along the flow channel also shows a decreasing trend, and the value of DPS1 at the diffuser inlet is 14.2 times that of DPS5 at the outlet, because the monitoring points are constantly far away from the rotor-stator interaction surface.
To observe the pressure pulsation characteristics of the diffuser suction surface, it is found that the pressure pulsation law at the monitoring points DSS3 and DSS4 is abnormal. The reason is that the curvature of the diffuser profile is the smallest, and gas-liquid separation is easy to occur, which results in a large amount of gas gathering here, and causing the blockage of the flow channel. As a result, the monitoring points become abnormal, and the smaller the ACC, the more the fluctuation of the peak-to-peak value.
The dominant frequency amplitude of the pressure pulsation in the diffuser cannot only clearly reflect the dominant frequency amplitude of each monitoring point under different gap coefficients, but also reflect the change of the pressure pulsation amplitude coefficient of different monitoring points with the ACC.
As can be seen from Figure 14, the dominant frequency amplitude distribution of each monitoring point under different ACCs is similar to the peak-to-peak value. At the inlet of the diffuser pressure surface, the dominant frequency amplitudes of the monitoring points are most sensitive to the change of the ACC. When δA = 0, the dominant frequency amplitude of the pressure pulsation is 3.87 times that of δA = 0.17, and the dominant frequency amplitude at the inlet of the diffuser is 7.82 times that at the outlet. Furthermore, it is found that the ACC has little effect on the dominant frequency amplitude of the pressure pulsation at the inlet and outlet of the suction surface and the outlet of the pressure surface.

5. Conclusions

(1)
The pressure pulsation regularity of the monitoring points in the first half of the impeller blade’s suction surface was better than the pressure surface, while the pressure pulsation regularity was opposite from the middle to the outlet of the blades. This may be due to the larger influence of the tip leakage flow on the mainstream area near the second half of the blades. As the monitoring points moved towards the outlet of the impeller, the closer to the diffuser, the stronger the rotor-stator interaction. Therefore, the regularity of the pressure pulsation at the monitoring points was better, and 11 similar peaks and troughs appeared in a rotating cycle at the impeller outlet monitoring points, corresponding to 11 diffusers.
(2)
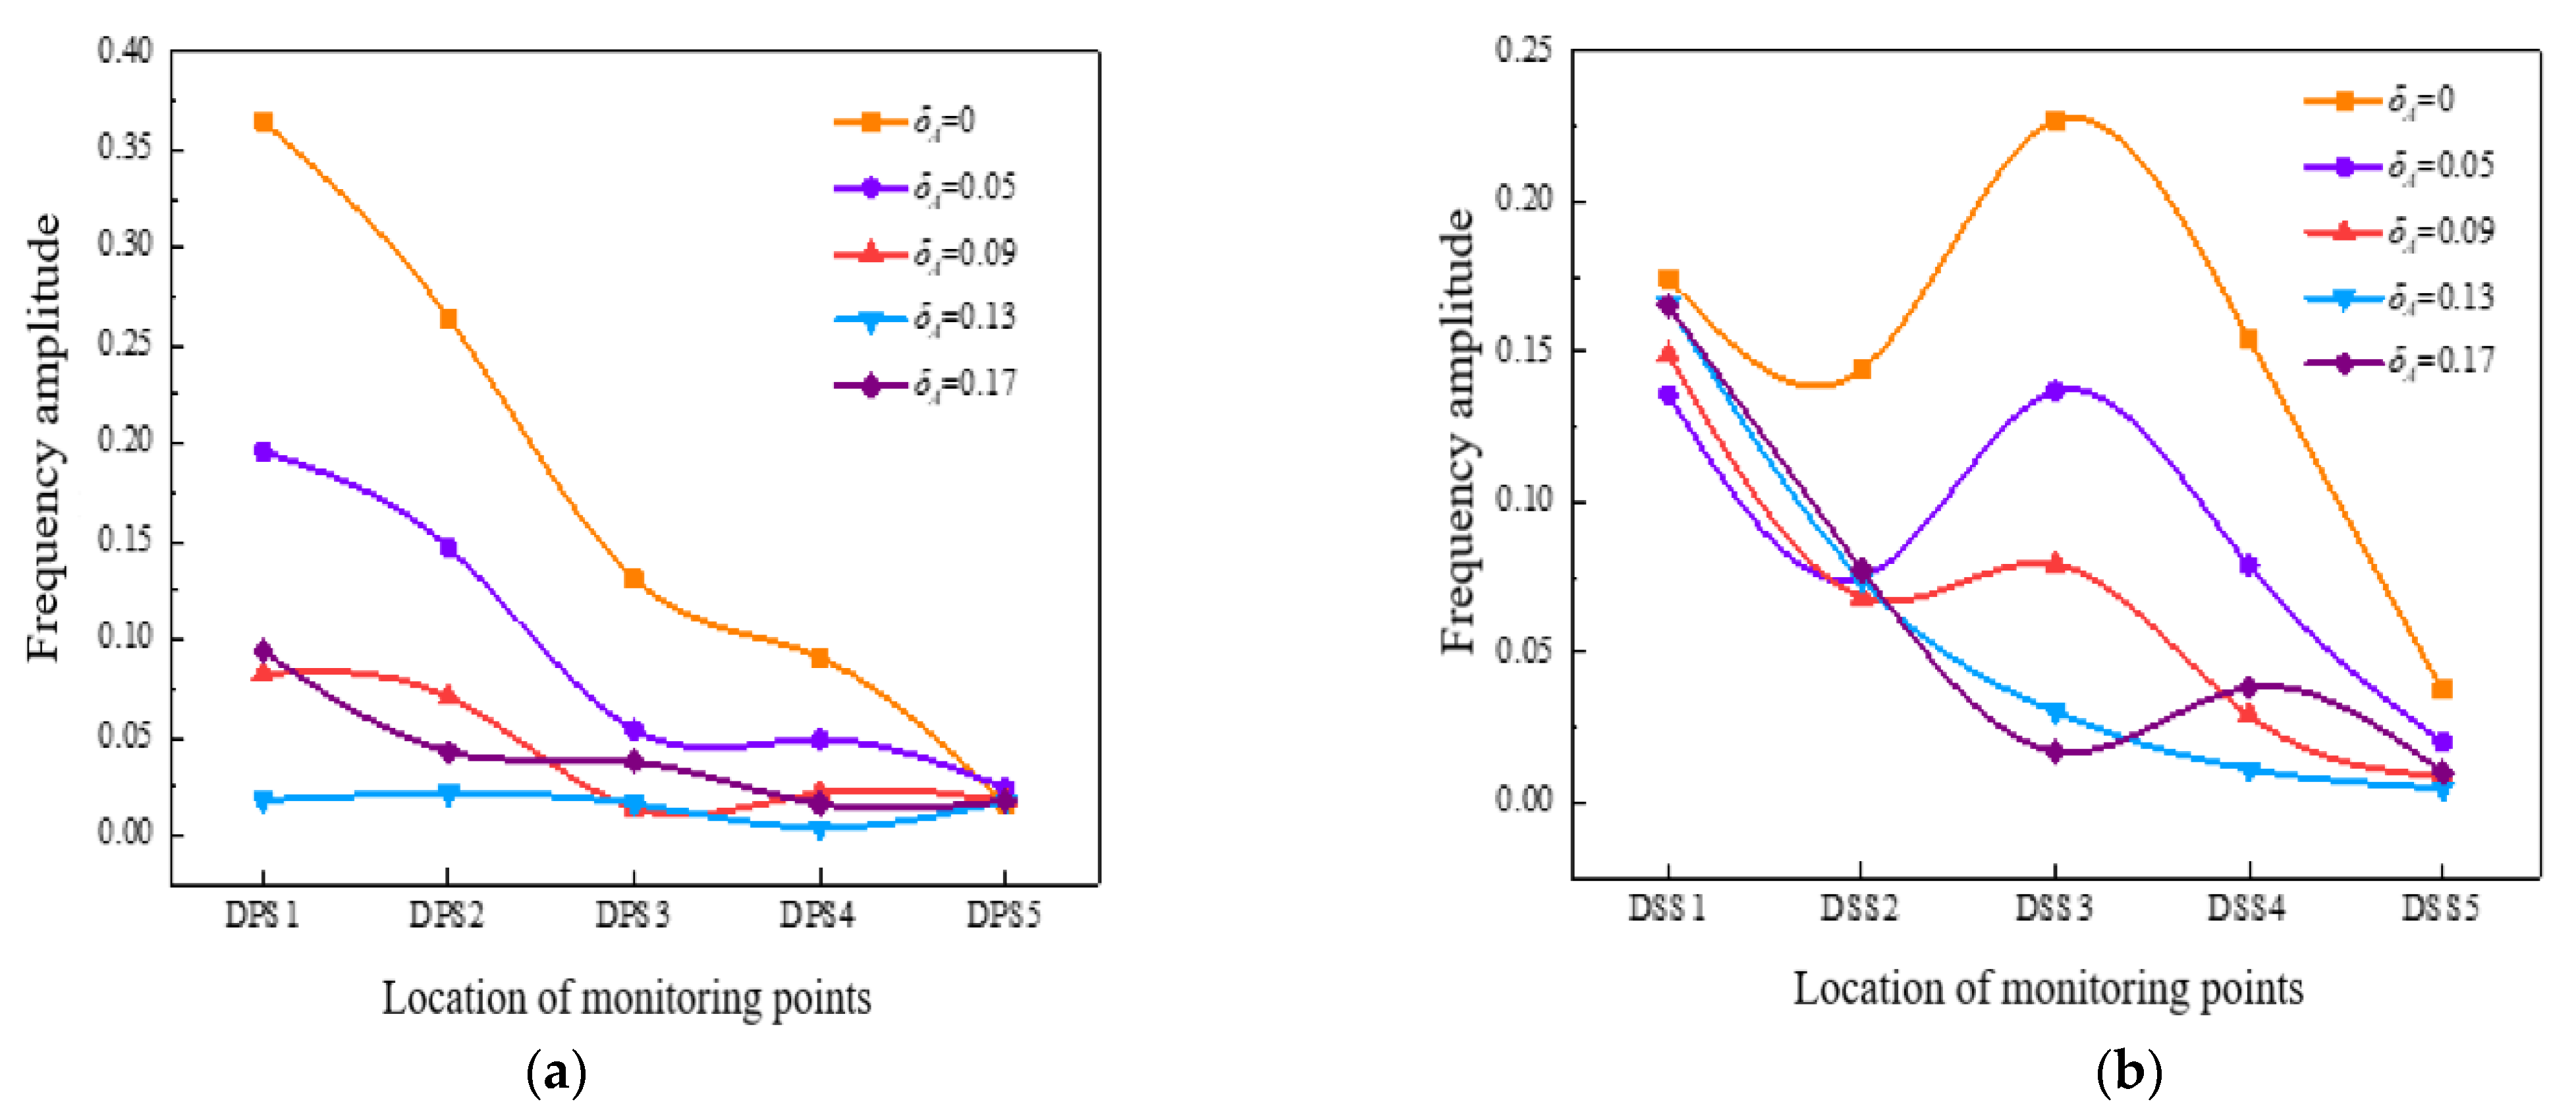
On the pressure surface of the impeller, the size of peak-to-peak value and the dominant frequency amplitude coefficient and their variation range along the flow direction were greater than those on the suction surface. What’s more, the vibration amplitude in the middle of the impeller blades was the smallest. On the whole, the existence of tip clearance greatly changed the pressure pulsation in the impeller. In the diffuser, the variation of the pressure pulsation peak-to-peak value and the dominant frequency amplitude coefficient with different axial clearance coefficients were similar. Additionally, the peak-to-peak value decreased with the increase of the ACC, and the dominant frequency amplitude of the monitoring points was most sensitive to the change of the ACC at the inlet of the diffuser pressure surface.
(3)
The pressure pulsation in the diffuser fluctuated periodically, and the fluctuation period was the same as the number of impeller blades, which indicated that the main reason for the pressure pulsation inside the diffuser was the interference of the impeller rotation. As the increase of the ACC, the pressure pulsation amplitude coefficient of the monitoring points gradually decreased. What’s more, for the same working condition monitoring points, the pressure coefficient of the pressure surface was greater than the suction surface. With the increase of the ACC and the direction from the diffuser inlet to the outlet, the amplitude of the dominant frequency pulsation was gradually smaller.

Author Contributions

G.S., Z.Z. and B.W. proposed the simulation method and designed the experiment; H.W. performed the experiment; Z.Z. completed the numerical simulations; Z.Z. and G.S. analyzed the data and wrote the paper. All authors have read and agreed to the published version of the manuscript.

Funding

Supported by the Central Leading Place Scientific and Technological Development Funds for Surface Project (2021ZYD0038); Open Research Fund Program of State key Laboratory of Hydroscience and Engineering (sklhse-2021-E-03). The National Key Research and Development Program (2018YFB0905200). The Key scientific research fund of Xihua University of China (Grant No. Z1510417).

Institutional Review Board Statement

Not applicable.

Informed Consent Statement

Not applicable.

Data Availability Statement

Not applicable.

Conflicts of Interest

The authors declare no conflict of interest.

References

  1. Williams, A.; Althaus, F.; MacIntosh, H.; Loo, M.; Gowlett-Holmes, K.; Tanner, J.E.; Sorokin, S.J.; Green, M. Characterising the invertebrate megafaunal assemblages of a deep-sea (200–3000 m) frontier region for oil and gas exploration: The Great Australian Bight, Australia. Deep-Sea Res. Part II 2018, 157–158, 78–91. [Google Scholar] [CrossRef]
  2. Falcimaigne, J.; Brac, J.; Charron, Y.; Pagnier, P.; Vilaginès, R. Multiphase pumping: Achievements and perspectives. Oil Gas Sci. Technol. 2017, 57, 99–107. [Google Scholar] [CrossRef] [Green Version]
  3. Yang, C.; Xu, Q.; Chang, L. Numerical study on the effect of gas void fraction on the performance of deep-sea multiphase pump. J. Eng. Thermophys. 2021, 42, 1479–1485. [Google Scholar]
  4. Shi, Y.; Zhu, H.; Zhang, J.; Zhang, J.; Zhao, J. Experiment and numerical study of a new generation three-stage multiphase pump. J. Pet. Sci. Eng. 2018, 169, 471–484. [Google Scholar] [CrossRef]
  5. Li, C.; Luo, X.; Feng, J.; Sun, H.; Zhu, G.J.; Xue, G. Investigation on the influence of inlet gas volume fraction on the performance of deep-sea multiphase pump. Chin. J. Hydrodyn. 2020, 35, 248–257. [Google Scholar]
  6. Ma, X.; Ni, P.; Jia, W. Influence of rotating speed on performance of helico-axial oil-gas multiphase pump. J. Gansu Sci. 2015, 27, 128–130. [Google Scholar]
  7. Liu, M.; Tan, L.; Cao, S. Analysis on the influence of rotating speed on the performance of helic-axial multiphase pump. Energies 2018, 11, 1048. [Google Scholar] [CrossRef] [Green Version]
  8. Xiao, W.Y.; Tan, L. Correlation between radial force and flow patterns in rotodynamic multiphase pump. J. Hydroelectr. Eng. 2019, 38, 90–101. [Google Scholar]
  9. Tremante, A.; Moreno, N.; Rey, R.; Noguera, R. Numerical turbulent simulation of the two-phase flow (liquid/gas) through a cascade of an axial pump. J. Fluids Eng. Trans. ASME 2002, 124, 371–376. [Google Scholar] [CrossRef]
  10. Zhang, J.; Cai, S.; Zhu, H.; Yang, K.; Qiang, R. Numerical investigation of compessible flow in a three-stage helico-axial multiphase pump. Thansaction Chin. Soc. Agric. Mach. 2014, 45, 89–95. [Google Scholar]
  11. Xu, Y.; Cao, S.L.; Reclari, M.; Wakai, T.; Sano, T. Multiphase performance and internal flow pattern of helico-axial pumps. IOP Conf. Ser. Earth Environ. Sci. 2019, 240, 32029. [Google Scholar] [CrossRef]
  12. Saadawi, H.N. Operating multiphase helicoaxial pumps in series to develop a satellite oil field in a remote desert location. SPE Proj. Facil. Constr. 2008, 3, 1–6. [Google Scholar] [CrossRef]
  13. Zhang, W.; Yu, Z.; Li, Y.; Cheng, X. Flow characteristics analysis for the whole flow passage of a multiphase rotodynamic pump. J. Mech. Eng. 2019, 55, 168–174. [Google Scholar] [CrossRef] [Green Version]
  14. Serena, A.; Bakken, L.E. Design of a multiphase pump test laboratory allowing to perform flow visualization and instability analysis. In Proceedings of the 2015 American Society of Mechanical Engineers (ASME), San Diego, CA, USA, 28 June–2 July 2015. [Google Scholar]
  15. Serena, A.; Bakken, L.E. Flow visualization of unsteady and transient phenomena in a mixed-flow multiphase pump. In Proceedings of the 2016, American Society of Mechanical Engineers (ASME), Seoul, Korea, 13–17 June 2016. [Google Scholar]
  16. Chang, L.; Yang, C.; Zhang, X. Experimental study on pressurization property of three-stage centrifugal multiphase pump on gas-liquid two-phase flow conditions. J. Eng. Thermophys. 2021, 42, 1233–1237. [Google Scholar]
  17. Yu, Z.; Zhu, B.; Cao, S. Interphase force analysis for air-water bubbly flow in a multiphase rotodynamic pump. Eng. Comput. 2015, 32, 2166–2180. [Google Scholar] [CrossRef] [Green Version]
  18. Guangtai, S.; Zhiwen, W.; Kun, L. Analysis of turbulent flow intensity and dissipation characteristics of an oil-gas multiphase pump in its compression stages. J. Eng. Therm. Energy Power 2018, 36, 115–121. [Google Scholar]
  19. Shi, G.T.; Luo, K.; Wang, Z.W.; Liu, Y. Study on load distribution characteristics of axial flow multiphase pump. Water Resour. Power 2018, 36, 175–178. [Google Scholar]
  20. Guangtai, S.; Zhiwen, W. Pressurization performance of multiphase pump impeller in different regions. J. Drain. Irragation Mach. Eng. 2019, 37, 13–17. [Google Scholar]
  21. Zhang, Y.; Zhang, J.; Zhu, H.; Cai, S. 3D Blade hydraulic design method of the rotodynamic multiphase pump impeller and performance research. Adv. Mech. Eng. 2014, 6, 803972. [Google Scholar] [CrossRef]
  22. Zhongku, L. Characteristics of Vortex and Pressure Fluctuation in Tip Clearance of a Multiphase Pump. Master’s Thesis, Xihua University, Chengdu, China, 2020. [Google Scholar]
  23. Kong, X.; Lv, Y.; Gao, J. Research on multi-stage compressible simulation of helico-axial multiphase pump. China Pet. Mach. 2016, 44, 77–81. [Google Scholar]
  24. Pang, J.; Liu, X.; Zeng, Y. Restraining effect of bearing structure on oil mist escaping of hydrogenerator unit. J. Drain. Irragation Mach. Eng. 2021, 39, 1020–1026. [Google Scholar]
  25. Zhang, D.; Wang, H.; Shi, W.; Pan, D.; Shao, P. Experimental investigation of pressure fluctuation with multiple flow rates in scaled axial flow pump. Thansaction Chin. Soc. Agric. Mach. 2014, 45, 139–145. [Google Scholar]
Figure 1. Computational model.
Machines 10 00418 g001
Figure 2. Computational domain grid.
Machines 10 00418 g002
Figure 3. Monitoring points in the impeller and diffuser.
Machines 10 00418 g003
Figure 4. Physical model of the multiphase pump. (a) impeller; (b) diffuser; (c) bump body.
Machines 10 00418 g004
Figure 5. Partial system configuration. (a) torquemeter; (b) high-speed camera; (c) experimental data acquisition system.
Machines 10 00418 g005
Figure 6. Comparison of numerical simulation and experimental results.
Machines 10 00418 g006
Figure 7. Time domain diagram of 0.5 span with pressure pulsation on impeller blade surface.
Machines 10 00418 g007aMachines 10 00418 g007bMachines 10 00418 g007c
Figure 8. Frequency spectrogram of 0.5 span with pressure pulsation on impeller blade surface.
Machines 10 00418 g008aMachines 10 00418 g008b
Figure 9. Peak-to-peak value of 0.5 span with pressure pulsation on impeller blade surface. (a) pressure surface; (b) suction surface.
Machines 10 00418 g009
Figure 10. Frequency amplitude of 0.5 span with pressure pulsation on impeller blade surface. (a) pressure surface; (b) suction surface.
Machines 10 00418 g010
Figure 11. Time domain diagram of 0.5 span with pressure pulsation on diffuser blade surface.
Machines 10 00418 g011aMachines 10 00418 g011bMachines 10 00418 g011c
Figure 12. Frequency spectrogram of 0.5 span with pressure pulsation on diffuser blade surface.
Machines 10 00418 g012aMachines 10 00418 g012b
Figure 13. Peak-to-peak value of 0.5 span with pressure pulsation on diffuser blade surface. (a) pressure surface; (b) suction surface.
Machines 10 00418 g013
Figure 14. Frequency amplitude of 0.5 span with pressure pulsation on diffuser blade surface. (a) pressure surface; (b) suction surface.
Machines 10 00418 g014
Table 1. Main performance parameters of the multiphase pump.
ParametersSymbolUnitValue
Design flow rateQm3/h90
Design rotating speednrpm3600
Number of impeller bladesZi(–)3
Number of diffuser bladesZd(–)11
Outer diameterDimm161
Table 2. Main structural parameters of the impeller and diffuser.
ParametersImpellerDiffuser
Number of impeller blades311
Outer diameter (mm)161161
Inlet hub ratio0.70.78
Blade inlet angle(hub/shroud) (o)9.05/60/0
Blade outlet angle(hub/shroud) (o)27.05/2435/35
Axial length (mm)6066
Table 3. The precision of main equipment.
InstrumentRangePrecisionUnit
Inlet pressure gauge0–0.80.3 classMpa
Outlet pressure gauge0–1±0.2%Mpa
Water flow meter0–140±0.5%m3/h
Air flow meter0–601.5 classm3/h
Torquemeter0–500.2 classN·m
Table 4. Main parameters of high-speed camera.
ParametersValueUnit
Camera speed4000fps
Shutter speed1/80,000s
Resolution1240 × 1240ppi
Sensitivity40,000(–)
Memory8GB
Publisher’s Note: MDPI stays neutral with regard to jurisdictional claims in published maps and institutional affiliations.

