Article

Multipoint Feeding Strategy of Aluminum Reduction Cell Based on Distributed Subspace Predictive Control

1
School of Automation and Electrical Engineering, University of Science and Technology Beijing, Beijing 100083, China
2
Guiyang Aluminum Magnesium Design and Research Institute Co., Ltd., Guiyang 550081, China
3
School of Information Engineering, Jingdezhen University, Jingdezhen 333000, China
4
Chinalco Intelligent Technology Development Co., Ltd., Hangzhou 311199, China
*
Author to whom correspondence should be addressed.
Machines 2022, 10(3), 220; https://doi.org/10.3390/machines10030220
Submission received: 23 February 2022 / Revised: 11 March 2022 / Accepted: 17 March 2022 / Published: 21 March 2022
(This article belongs to the Special Issue Deep Learning-Based Machinery Fault Diagnostics)

Abstract

:
With the continuous development of large-scale aluminum reduction cells, the problem of the uniform distribution of alumina concentration in the cell has become more and more serious for the reduction process. In order to achieve the uniform distribution of the alumina concentration, a data-driven distributed subspace predictive control feeding strategy is proposed in this paper. Firstly, the aluminum reduction cell is divided into multiple sub-systems that affect each other according to the position of the feeding port. Based on the subspace method, the prediction model of the whole cell is identified, and the prediction output expression of each sub-system is deduced by decomposition. Secondly, the feeding controller is designed for each aluminum reduction cell subsystem, and the input and output information can be exchanged between each controller through the network. Thirdly, under consideration of the influence of other subsystems, each subsystem solves the Nash-optimal control feeding quantity, so that each subsystem realizes distributed feeding. Finally, the simulation results show that, compared with the traditional control method, the proposed distributed feeding control strategy can significantly improve the problem of the uniform distribution of alumina concentration and improve the current efficiency of the aluminum reduction cell.

1. Introduction

In order to improve labor productivity and reduce investment costs, large-capacity pre-baked reduction cells are currently used in various enterprises. Due to their high efficiency and low energy consumption, pre-baked cells of 400–600 kA have gradually become the mainstream cell type in China’s aluminum electrolytic industry [1]. The capacity of the reduction cell is continuously increasing, while the auxiliary facilities and the intelligent control technology of aluminum electrolytic are relatively backward. Thus, the problems of the local anode effect and local precipitation in the large reduction cell have increasingly become the main factors of instability in the production process [2], which has caused serious economic losses and some casualties. The main cause of these problems is the uneven distribution of alumina concentration in the anode bottom surface of the large aluminum reduction cell [3]. Through some studies and experiments, it is known that the concentration of alumina is generally controlled between 1.5% and 3.5%. Currently, the change of groove resistance and the concentration of alumina is basically linear and easy to identify, and the current efficiency is also the highest [4]. If the concentration of alumina is excessively high, there will be problems such as increased energy consumption, fluctuation of aluminum liquid layer, etc., and even induced precipitation at the bottom of the cell and crusting on the cell side which reduce the service life of the reduction cell [5]. An excessively low concentration of alumina will lead to frequent anode effects in the reduction cell. Once the anode effect occurs, the cell voltage rises sharply. Meanwhile, Moxnes et al. [6] found that when the alumina concentration distribution is more uniform, the current efficiency of the reduction cell is higher, and the probability of abnormal cell conditions such as the anode effect is lower. Therefore, adjusting the feeding interval of each feeder of the large-scale aluminum reduction cell and accurately controlling the amount of alumina feeding to make the alumina concentration evenly distributed has become a general concern and urgent issue that has extremely important practical significance for the further development of large and super large aluminum electrolytic technology [5].
The uniform distribution of alumina concentration plays a vital role in the stable operation and efficient production of large aluminum electrolysis. In order to achieve this goal, many scholars have carried out in-depth research on alumina. In [7], a method combining fuzzy control theory and expert experience was proposed to control the alumina concentration by changing the feeding interval. In [4], by improving the crust breaking and feeding device and control system of the reduction cell, the feeding interval was set separately for each feeding point, and the single-point precise feeding control is achieved. However, for large aluminum reduction cells with multiple feeders, single-point feeding control method cannot effectively control the uniform distribution of the alumina concentration. With the development of soft measurement technology [8,9] and distributed data measurement technology, more and more scholars have begun to try to apply soft-sensing the aluminum electrolysis industry. The least squares support vector machine method for the alumina concentration soft measurement model is established in [10]. In [11], in order to obtain more accurate results, a soft-sensor model of alumina concentration was proposed that introduces time series to optimize the input parameters of a deep belief network (DBN). In [12], a KPI was developed through a probabilistic soft sensing based on maximizing the coefficient of determination to estimate the alumina concentration. An improved Kalman filter for the soft sensing of alumina concentration is presented in [13]. Therefore, intelligent control methods based on the soft measurement model of the alumina concentration emerge endlessly. The generalized regression neural network (GRNN) was adopted to identify the alumina concentration model and a fuzzy cerebellar model neural network (FCMAC) controller was proposed for the feeding equipment to control the alumina concentration in [14]. A data-driven intelligent control system based on the least squares support vector machine alumina concentration soft sensing model was proposed in [15]. An extended Kalman filter (EKF) was used to estimate the local alumina concentration to design a multivariable blanking control strategy in [16]. However, these control methods ignore the influence of each feeding port on the alumina concentration near other feeding ports due to the flow of electrolytes during the aluminum reduction process, and only consider the overall parameters such as cell voltage and cell resistance, and do not fully utilize important distribution parameters. In order to fully understand the distribution of an alumina concentration in aluminum reduction cells, the dissolution and diffusion of alumina were studied in [17,18,19,20]. In [21], a multi-coupling distributed alumina simulation model was constructed by ANSYS, and the uniform distribution of alumina concentration was achieved through the simulation model. However, it is still very difficult to establish an accurate model through mechanism analysis. Some scholars have studied the production process using a large amount of data. At present, the most advanced technology was that the relationship between the distributed current and the feeding rate was established using random forest, and the stability of the aluminum reduction cell was maintained by controlling the distributed current to be consistent in [22]. However, the final simulation results did not verify the uniform distribution of alumina concentration.
In order to solve the problem of the uneven distribution of alumina concentration and adapt to the aluminum electrolysis process with difficulty in mechanism modeling, a distributed subspace predictive control data-driven method is applied to large aluminum reduction cells, and the subsystem model is established by fully using distributed data. The distributed control algorithm is used to realize the distributed feeding of multiple feeders in large electrolytic cell considering the influence of each feeder, and the simulation is carried out in MATLAB. The simulation results show that the application of this method in a large aluminum reduction cell is feasible, and it has important guiding significance for realizing the uniform distribution of alumina concentration in a large aluminum reduction cell in industrial processes.
Compared with the existing research on alumina concentration control strategy, the contributions of this paper are as follows:
(1)
The large aluminum reduction cell is divided into several subsystems according to the position of the feeder. Compared with the work in [14,15], the difference is that this paper considers the influence of each feeding port caused by the flow of the electrolyte between subsystems on the alumina concentration near other feeding ports.
(2)
Inspired by the work of [22], this paper designs the controller by establishing a prediction model between the feed rate and alumina concentration in each subsystem, and the input and output information can be exchanged between each subsystem through the network.
(3)
Compared with the traditional timing grouping feeding strategy, a new distributed control feeding strategy is designed in this paper, so that each feeding device is controlled by an independent controller. Each feeder works in coordination with the influence of other subsystems’ feeding, realizing on-demand distributed feeding, and improving the control performance of each subsystem [23].
The rest of this paper is organized as follows. In Section 2, a distributed feeding control strategy for aluminum electrolysis is proposed. Section 3 introduces the distributed subspace predictive control algorithm and discusses the implementation of the proposed algorithm in aluminum electrolysis in detail. In Section 4, the feasibility of the algorithm is verified by MATLAB simulation. In Section 5, relevant conclusions are given.

2. Design of Distributed Feeding Control Scheme for Aluminum Electrolysis

The top view of a 400 kA large aluminum reduction cell in an aluminum plant is shown in Figure 1. FD1, FD2, FD3, FD4, FD5, and FD6 are the six feed ports of the cell. Twenty-four anode guides are on the B side. Due to the flow of electrolytes caused by carbon dioxide and carbon monoxide gas produced by anode, electromagnetic field, temperature and concentration difference, when feeding at any feeding port, the alumina concentration in other regions will be affected to some extent. Taking the six feeding ports as centers, the aluminum reduction cell is divided into six subsystems. For aluminum electrolysis, which is a complex large system composed of multiple mutually influencing subsystems, distributed control cannot only better consider the impact of feeding between subsystems but the computation complexity is greatly reduced compared to centralized control. As predictive control has been widely used in engineering applications and has high control accuracy, distributed model predictive control has received more attention from scholars.
The main idea of the distributed predictive control algorithm is to transform a large-scale online optimization problem into a small-scale distributed optimization of each subsystem, and at the same time, each subsystem communicates and shares information through the network, thereby improving the control performance of the system. For the general distributed model predictive control method, the design of the controller must be based on accurate modeling. Due to the complexity of the aluminum reduction process, there are many difficulties in the research on the multi-point distributed feeding control of the aluminum electrolysis process. Firstly, the aluminum reduction process is a dynamic system with complex physical and chemical reactions, multi-coupling and large delay [24]. Secondly, it is difficult to establish a precise distributed multi-point feeding mechanism model due to the extremely complex environment such as high temperature and strong corrosion in industrial aluminum reduction cells. Finally, it is difficult to obtain the coupling relationship between each subsystem. The subspace identification method is not limited to the prior structure information and mechanism model of the system but directly uses the historical input and output data to solve the prediction model [25,26], and can obtain the prediction model of each subsystem through parameter decomposition. This method is more suitable for complex large systems composed of multiple subsystems and it is difficult to establish an accurate mechanism model [27,28]. Therefore, the data-driven subspace identification method and predictive control are designed in a control system design framework, which is applied to the aluminum electrolysis system with model uncertainty and has better control performance [29,30,31].
For large aluminum reduction cells, since the distributed alumina concentration data cannot be obtained in real-time, the development of distributed current measurement technology provides the basis for its soft measurement. According to the relevant mechanism of an aluminum reduction cell, there is a close relationship between the distributed alumina concentration and distributed current. This research group has also conducted in-depth research on the soft measurement of distributed alumina concentration [32,33]. Therefore, the distributed alumina concentration data required in this paper can be obtained by using the soft sensing model, to carry out the follow-up work.
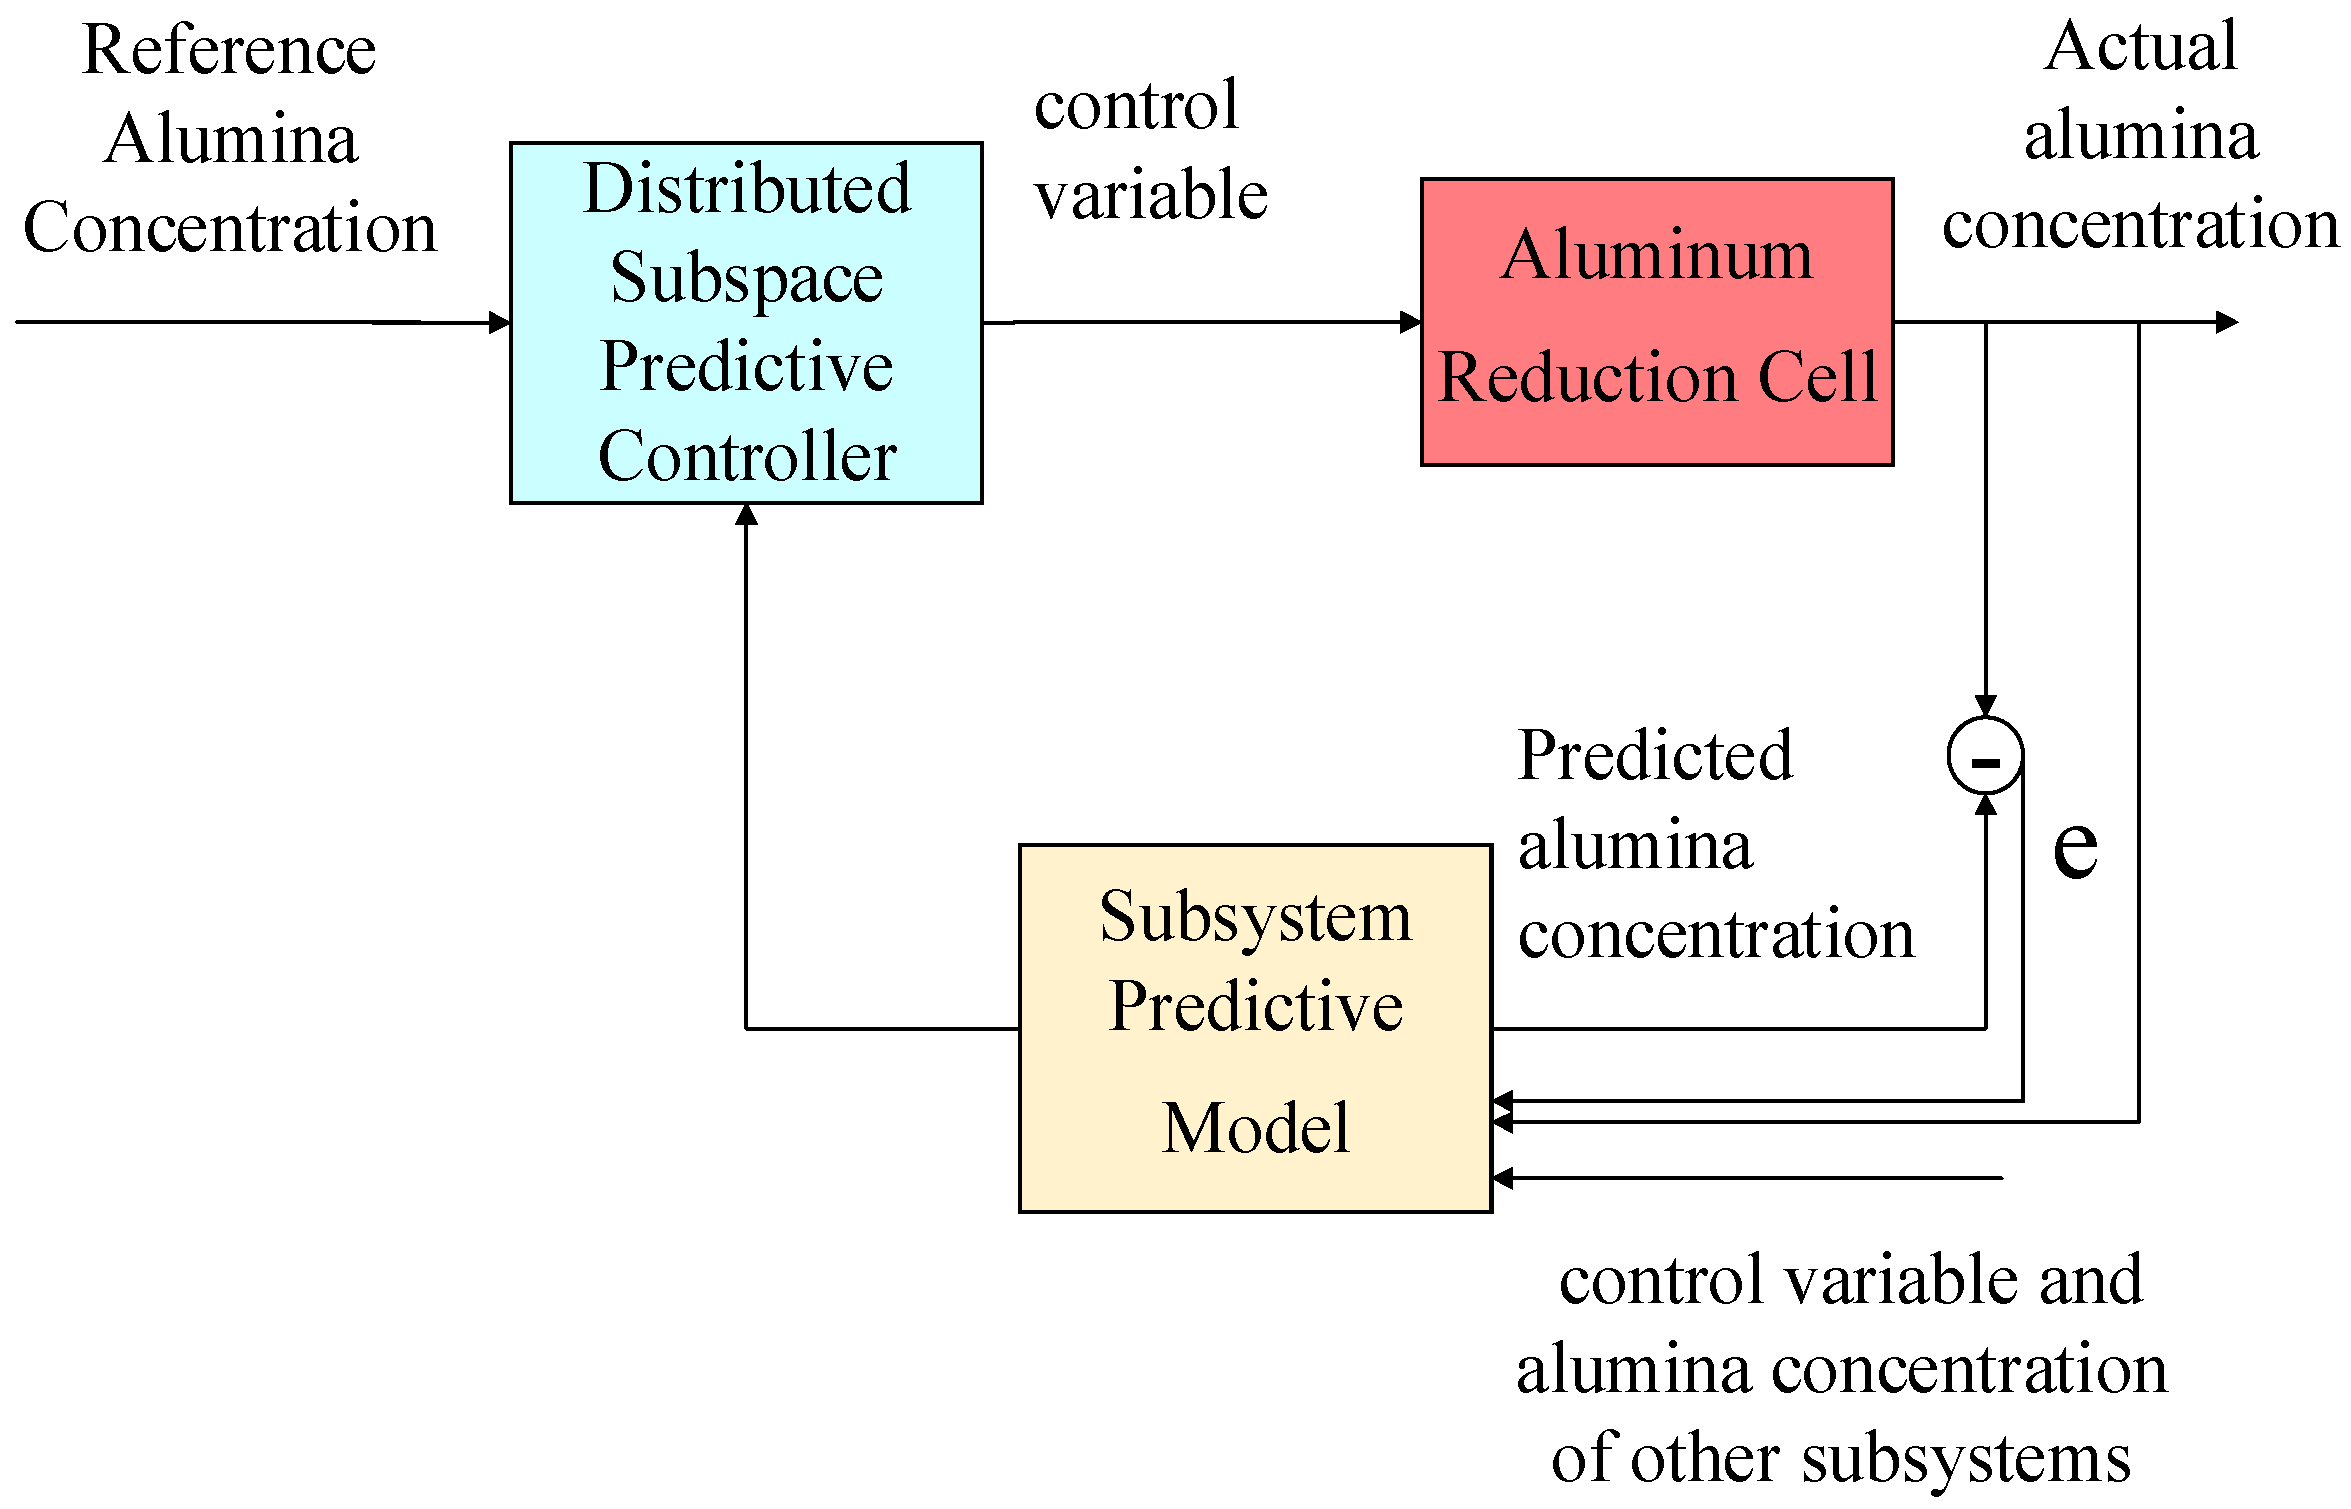
For the 400 kA aluminum reduction cell, the structure of the predictive control principle of one of the subsystems is shown in Figure 2. It is mainly composed of a subspace prediction model and distributed controller.
The subspace prediction model is a model of the entire system identified by the input and output data. After parameter decomposition, the prediction model of the subsystem can be obtained. The prediction model of each subsystem includes the influence of other subsystems on itself. The aluminum electrolysis system shown in Figure 1 can be described as due to the flow of electrolyte, whilst other subsystems cause changes in alumina concentration to a subsystem. Each subsystem has a separate controller to control the feeder responsible for supplying the alumina powder, and a distributed control algorithm is designed under the condition that the subsystems can communicate with each other. At each moment, each subsystem solves the optimal control signal of its system when the optimal control signals of other subsystems are known, and the global optimality is also guaranteed in the case of achieving local optimality. For the aluminum electrolysis system, the advantage of this method is that the six feeding ports can change the original group feeding or timing feeding strategy so that the six feeding ports can consider the influence of other feeding ports. The purpose of distributed feeding is to make the alumina concentration distribution more uniform, reduce the occurrence of local precipitation and local anode effect, ensure the stable and efficient operation of the entire cell, and improve the production efficiency of the aluminum plant.

3. Distributed Subspace Predictive Control

The basic idea of the data-driven distributed subspace predictive controller design is to first obtain the input and output data of length n, then use these data to solve the distributed prediction model, and finally use the obtained distributed prediction model to design the controller [24]. According to the actual data collection situation on-site, the input variable u 1 , u 2 , , u m ( m = 6 ) is determined as the alumina feeding amount of the six subsystems, and the output variable y 1 , y 2 , , y m ( m = 6 ) is determined as the alumina concentration for the six subsystems. Among them, the alumina feeding amount data are obtained by combining the dissolution and consumption mechanism of alumina and the feeding interval. According to the relevant mechanism of an aluminum reduction cell, there is a close relationship between the distributed alumina concentration and distributed current [22]. The soft sensor model of the distributed current and distributed alumina concentration is established by using the current data of a single anode guide rod and the alumina concentration data of different areas collected by field test. The alumina concentration data and alumina discharge data of six subsystems with n = 1000 can be obtained.

3.1. Data-Driven Distributed Prediction Model

For an aluminum reduction cell with six subsystems, the output prediction model can be described as: at time k, the relationship between the output prediction vector y ^ t ( k ) = [ y ^ f 1 ( k ) T , , y ^ f m ( k ) T ] T composed of the alumina concentration prediction values of each subsystem and the input and output data is [30]:
y ^ f ( k ) = L w · w p ( k ) + L u · u f ( k )
where L w R m N × 2 m N and L u R m N × m N are the unknown parameter matrix, which is obtained by subspace identification, N is the length of the prediction window, u f ( k ) is the input vector composed of the future alumina feeding amount of each subsystem, and w p ( k ) is the vector composed of the past input and output data, respectively, defined as follows:
w p ( k ) = Δ [ w p 1 ( k ) w p m ( k ) ] ; u f ( k ) = Δ [ u f 1 ( k ) u f m ( k ) ] ; w p i ( k ) = Δ [ u p i ( k ) T y p i ( k ) T ] T ; u p i ( k ) = Δ [ u i ( k N ) u i ( k 1 ) ] ; y ^ p i ( k ) = Δ [ y i ( k N ) y i ( k 1 ) ] ; u f i ( k ) = Δ [ u i ( k ) u i ( k + N 1 ) ] ; y ^ f i ( k ) = Δ [ y ^ i ( k ) y ^ i ( k + N 1 ) ] .
where i = 1 , 2 , , 6 , the subscripts “p” and “f” represent the past and the future, respectively.
In order to realize distributed feeding control, a distributed prediction model needs to be established. Equation (1) is decomposed into the following form:
( y ^ 1 ( k ) y ^ 2 ( k ) y ^ m ( k ) ) = [ L w ( 1 ) L w ( 2 ) L w ( m ) ] · w p ( k ) + [ L u ( 1 , 1 ) L u ( 1 , 2 ) L u ( 1 , m ) L u ( 2 , 1 ) L u ( 2 , 2 ) L u ( 2 , m ) L u ( m , 1 ) L u ( m , 2 ) L u ( m , m ) ] · ( u 1 ( k ) u 2 ( k ) u m ( k ) )
Based on this decomposition, the alumina concentration prediction model of each subsystem can be obtained:
y ^ i ( k ) = L u ( i , i ) u i ( k ) + j = 1 , j i m L u ( i , j ) u j ( k ) E f f e c t s   o f   o t h e r   s u b s y s t e m s , i = 1 , 2 , , 6 + L w ( i ) · w p ( k )
Each prediction model includes the influence of the feeding number of other subsystems on itself.

3.2. Design of Distributed Predictive Controller for Aluminum Reduction Cell System

The control target of the distributed aluminum reduction cell system is to control the alumina concentration to track the reference value. After certain research and experiments, the reference alumina concentration value of each subsystem can be obtained:
R r e f = [ r 1 r 2 r m ] T
The control strategy of the distributed aluminum reduction cell system is shown in Figure 2. According to Equation (3), predicting the output of any subsystem requires knowing the input and output data of all subsystems at the previous time [28]. Therefore, the controller of each subsystem must have a communication function to transmit its information to other subsystems. The difference between distributed control and centralized control is that the global performance index can be expressed as the sum of the performance indexes of all subsystems [34]:
J = i = 1 m J i
then the performance index of the ith subsystem can be expressed as
min u f i ( k ) J i = [ y f i ^ ( k ) r i ( k ) ] T Q i [ y f i ^ ( k ) r i ( k ) ] + u f i ( k ) T R i u f i ( k )
where r i ( k ) is the reference input signal vector of the subsystem; and Q i and R i are the positive definite weighting matrixes. Substituting Equation (3) into Equation (6), we can obtain:
J i = [ L w ( i ) w p r i ( k ) + j = 1 m L u ( i , j ) · u j ( k ) ] T Q i [ L w ( i ) w p r i ( k ) + j = 1 m L u ( i , j ) · u j ( k ) ] + u f i ( k ) T R i u f i ( k )
Differentiate the objective function to find the extremum:
J i u f i ( k ) = 0
The controller for each subsystem can be obtained:
u f i ( k ) = [ R i + L u ( i , i ) T Q i L u ( i , i ) ] 1 L u ( i , i ) T Q i [ L w ( i ) w p ( k ) r i ( k ) + j = 1 , j i m L u ( i , j ) · u f j ( k ) ]
In actual control, we only put u f i the first component of the controlled input into the future input data matrix and pass this matrix to other subsystems. When performing predictive control iteration and rolling optimization in the above steps, the optimal control quantity is always calculated. Therefore, the actual output alumina concentration of each subsystem of aluminum electrolysis can be synchronized with the reference alumina concentration to achieve the control target.

3.3. Determination of Parameters of Aluminum Reduction Cell Prediction Model and Design of Data-Driven Distributed Predictive Control Algorithm

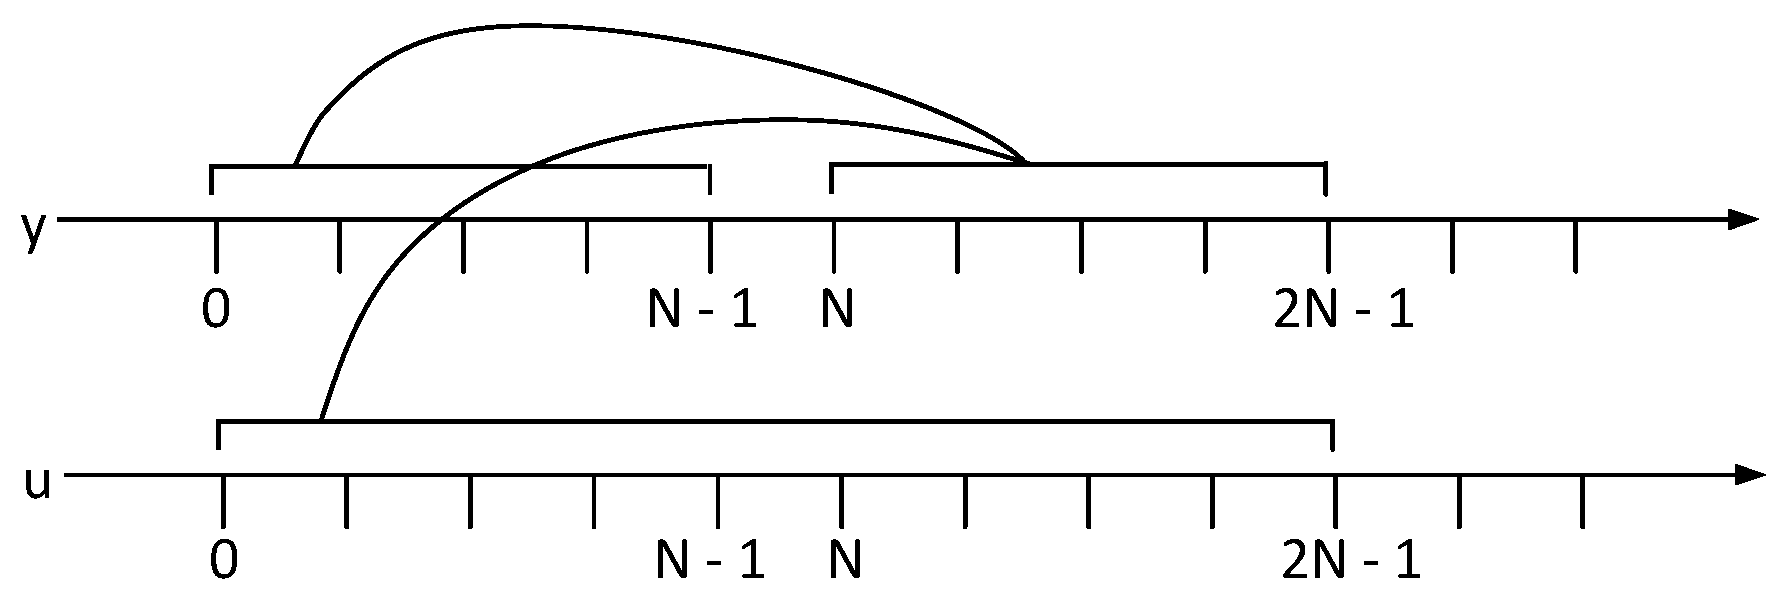
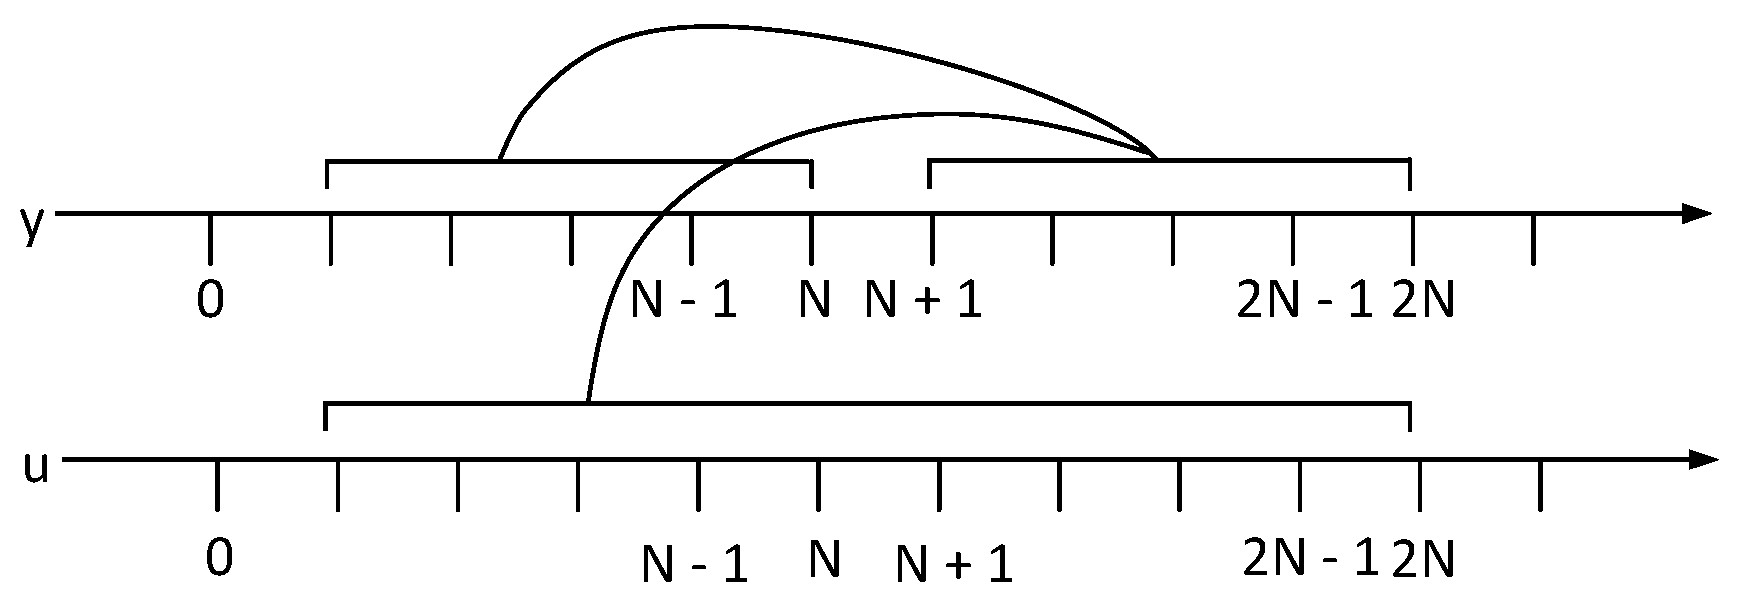
In order to obtain the prediction model of Equation (3), the above input and output data of n = 1000 are used to solve the parameter matrix L w and L u in Equation (1). The prediction step N is set to 5. Input data at time ( 0 , 1 , , N 1 ) and output data at time ( 0 , 1 , , 2 N 1 ) are used to predict the output at time ( N , N + 1 , , 2 N 1 ) according to Equation (1), as shown in Figure 3. After that, we move the time window and the input data at time ( 1 , 2 , , 2 N ) and output data at time ( 1 , 2 , , N ) are used to predict the output at time ( N + 1 , N + 2 , , 2 N ) according to Equation (1), as shown in Figure 4.
In order to solve the parameter matrix L w and L u , Equation (1) is rewritten into the Hankel matrix:
Y f = L w · W p + L u · U f = [ L w L u ] [ W p U f ]
where Y f , W p and U f are the Hankel matrix composed of input and output data, defined as follows:
Y ^ f = [ Y ^ f i Y ^ f m ] ; U f = [ U f i U f m ] ; Y p = [ Y p i Y p m ] ; U p = [ U p i U p m ] ; W p = [ W p i W p m ]
W p i = Δ [ U p i T Y p i T ] T R 2 N × M U p i = Δ [ u i ( 0 ) u i ( 1 ) u i ( M 1 ) u i ( 1 ) u i ( 2 ) u i ( M ) u i ( N 1 ) u i ( N ) u i ( N + M 2 ) ] ; U f i = Δ [ u i ( N ) u i ( N + 1 ) u i ( N + M 1 ) u i ( N + 1 ) u i ( N + 2 ) u i ( N + M ) u i ( 2 N 1 ) u i ( 2 N ) u i ( 2 N + M 2 ) ] ; Y p i = Δ [ y i ( 0 ) y i ( 1 ) y i ( M 1 ) y i ( 1 ) y i ( 2 ) y i ( M ) y i ( N 1 ) y i ( N ) y i ( N + M 2 ) ] ; Y ^ f i = Δ [ y ^ i ( N ) y ^ i ( N + 1 ) y ^ i ( N + M 1 ) y ^ i ( N + 1 ) y ^ i ( N + 2 ) y ^ i ( N + M ) y ^ i ( 2 N 1 ) y ^ i ( 2 N ) y ^ i ( 2 N + M 2 ) ]
The problem is solved by least squares method:
min L w , L u Y f [ L w L u ] [ W p U f ] F 2
This problem can be solved by orthogonal projection. According to the subspace projection theorem, Y f projects to the column space of W p and U f :
Y ^ f = Y f / [ W p U f ] = Y f [ W p U f ] T ( [ W p U f ] [ W p U f ] T ) + [ W p U f ]
where the symbol “+” stands for pseudo-inverse; “/” stands for data space projection, then:
[ L w L u ] = Y f [ W p U f ] T ( [ W p U f ] [ W p U f ] T )
substituting Equation (13) into Equation (2), we obtain:
Y ^ f = Y f [ W p U f ] [ W p U f ]
QR decomposition of matrix [ W p U f Y f ] is shown as
[ W p U f Y f ] = R T Q T = [ R 11 0 0 R 21 R 22 0 R 31 R 32 R 33 ] Q T
then, Equation (12) can be rewritten as
Y ^ f = [ R 31 R 32 R 33 ] Q T [ [ R 11 0 0 R 21 R 22 0 ] Q T ] · [ W p U f ] = [ R 31 R 32 R 33 ] Q T Q T + [ R 11 0 0 R 21 R 22 0 ] · [ W p U f ] = [ R 31 R 32 ] [ R 11 0 R 21 R 22 ] + [ W p U f ]
comparing Equations (2) and (16), we obtain the solution of L w and L u :
[ L w L u ] = [ R 31 R 32 ] [ R 11 0 R 21 R 22 ] +
furthermore, we obtain:
L w = [ L w ( 1 ) L w ( 2 ) L w ( m ) ] ; L u = [ L u ( 1 , 1 ) L u ( 1 , 2 ) L u ( 1 , m ) L u ( z , 1 ) L u ( 2 , z ) L u ( z , m ) L u ( m , 1 ) L u ( m , 2 ) L u ( m , m ) ]
where L w is a 30 × 60 matrix, L u is a 30 × 30 matrix, then after decomposition, we obtain L w ( i ) and L u ( i , j ) :
L w ( i ) = L w ( i : m : m N m + i , : )
L u ( i j ) = L u ( i : m : m N m + i , j : m : m N m + j )
where i = 1 , 2 , , m , j = 1 , 2 , , m , m = 6, N = 5. The prediction model of six subsystems of an aluminum reduction cell is further obtained.
The Nash optimal method is used to design the distributed control algorithm. The definition of Nash optimal is as follows.
For a complex large system with m subsystems, if there is a vector solution that u N = ( u 1 N , , u i N , , u m N ) satisfies the following inequalities for all subsystems u i ( i = 1 , 2 , , m ) [35]:
J i ( u 1 N , , u i N , , u m N ) J i ( u i N , , u i 1 N , u i , u i + 1 N , , u m N )
then, the vector is u N = ( u 1 N , , u i N , , u m N ) called the optimal Nash solution of the system. This solution optimizes the control performance of the entire large system, and all subsystems will not change this control decision.
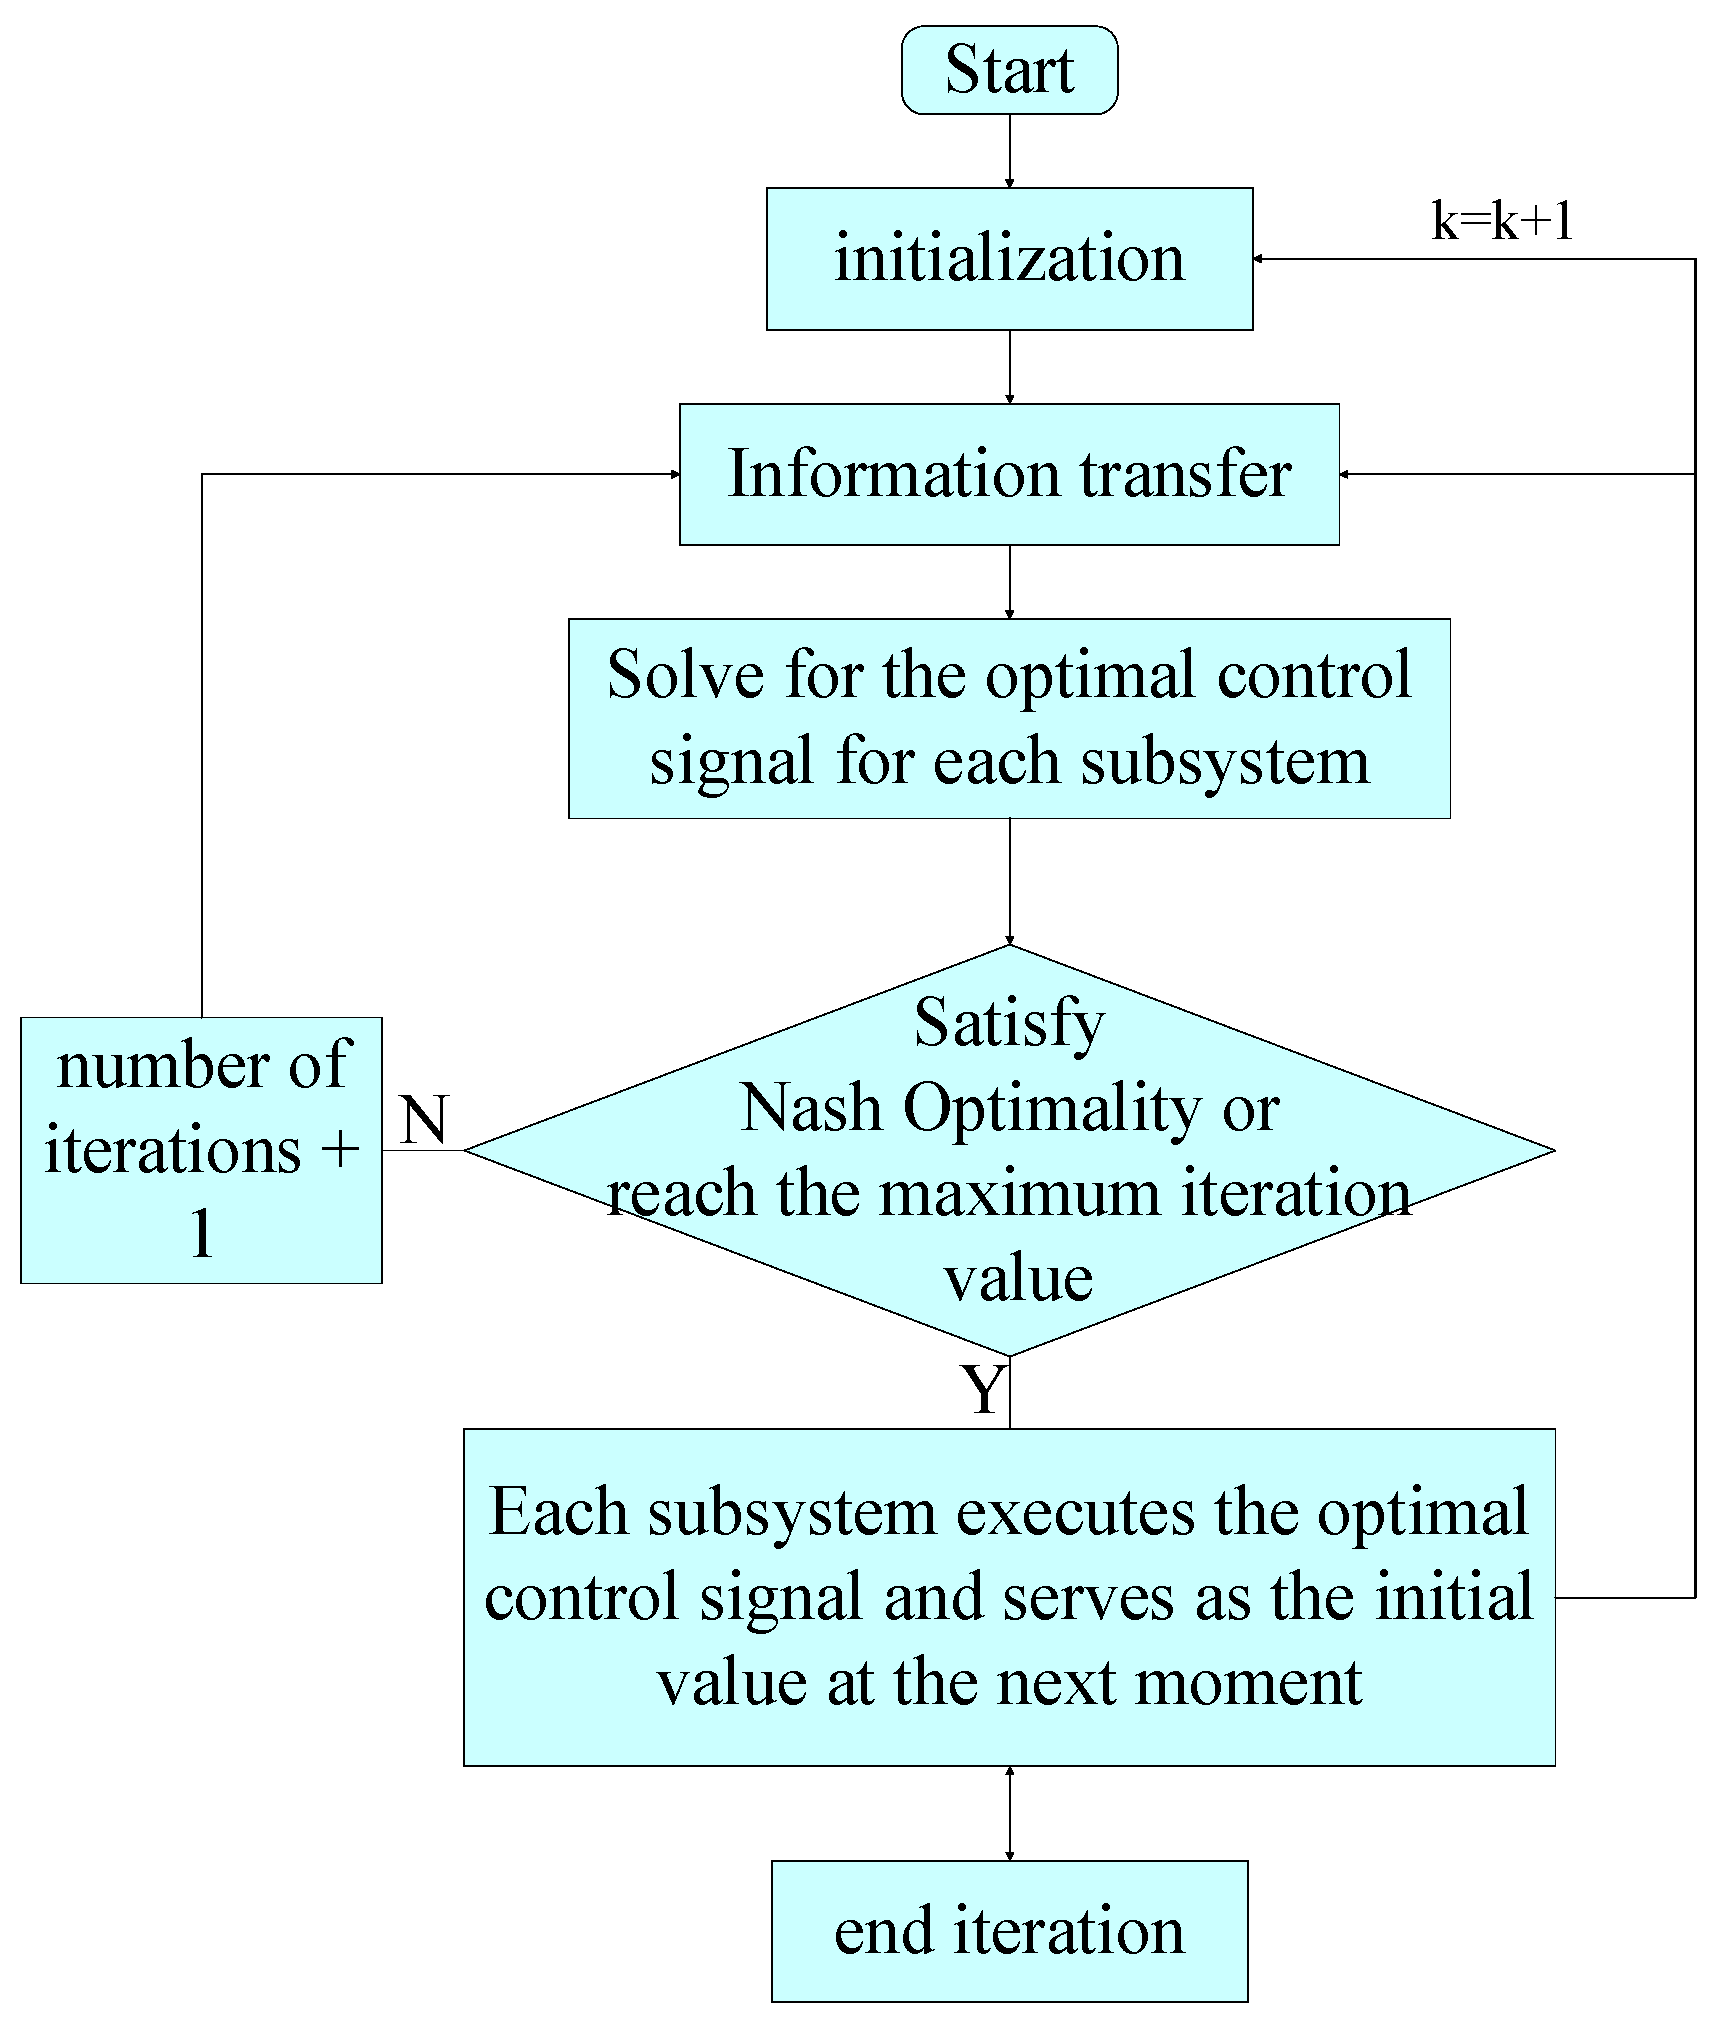
As mentioned in the algorithm introduction above, in distributed predictive control, each subsystem must know the optimal control signal of other subsystems before solving its own optimal control signal, but each controller solves the optimal control signal at every moment simultaneously. In order to make all subsystems optimal at the same time, the iterative method is usually adopted. At each sampling moment, an iterative calculation is carried out to obtain the optimal control input signal of each subsystem at the sampling moment and determine whether it satisfies the Nash optimal solution. At the same time, the control signal is transmitted to other subsystems. When the iterative values of all subsystems meet the conditions, the iteration ends, so the global optimization of a complex large system is realized. The detailed steps of the iterative algorithm are as follows:
  • Step 1 At the k sampling time, take the initial value of the control input variable of each subsystem ( u 1 0 , u 2 0 , , u m 0 ) and pass the initial value to other subsystems, so that the iteration ordinal l = 0;
  • Step 2 Use the last iteration value { u 1 ( k ) l , u 2 ( k ) l , , u m ( k ) l } calculate the value of iteration u i ( k ) l + 1  l + 1 for the ith subsystem;
  • Step 3 Pass the calculation result u i ( k ) l + 1 to other subsystems through the network;
  • Step 4 If the Nash optimality is satisfied for all subsystems u i ( k ) l + 1 u i ( k ) l ε i or the maximum number of iterations is reached, the iteration is ended, otherwise, return to the second step;
  • Step 5 Each subsystem executes the optimal control signal { u 1 N , u 2 N , , u m N } and uses it as the initial value at the next moment;
  • Step 6 End the calculation of this sampling time, and wait for the next sampling time k + 1.
Flowchart is shown in Figure 5:

4. Simulation Experiments

Based on the actual data of an aluminum plant, this section compares the control effect of the traditional feeding control method and the distributed subspace predictive control method through simulation results. The simulation includes the control effect under the condition of no interference and inaccurate feed quantity.

4.1. Data Acquisition

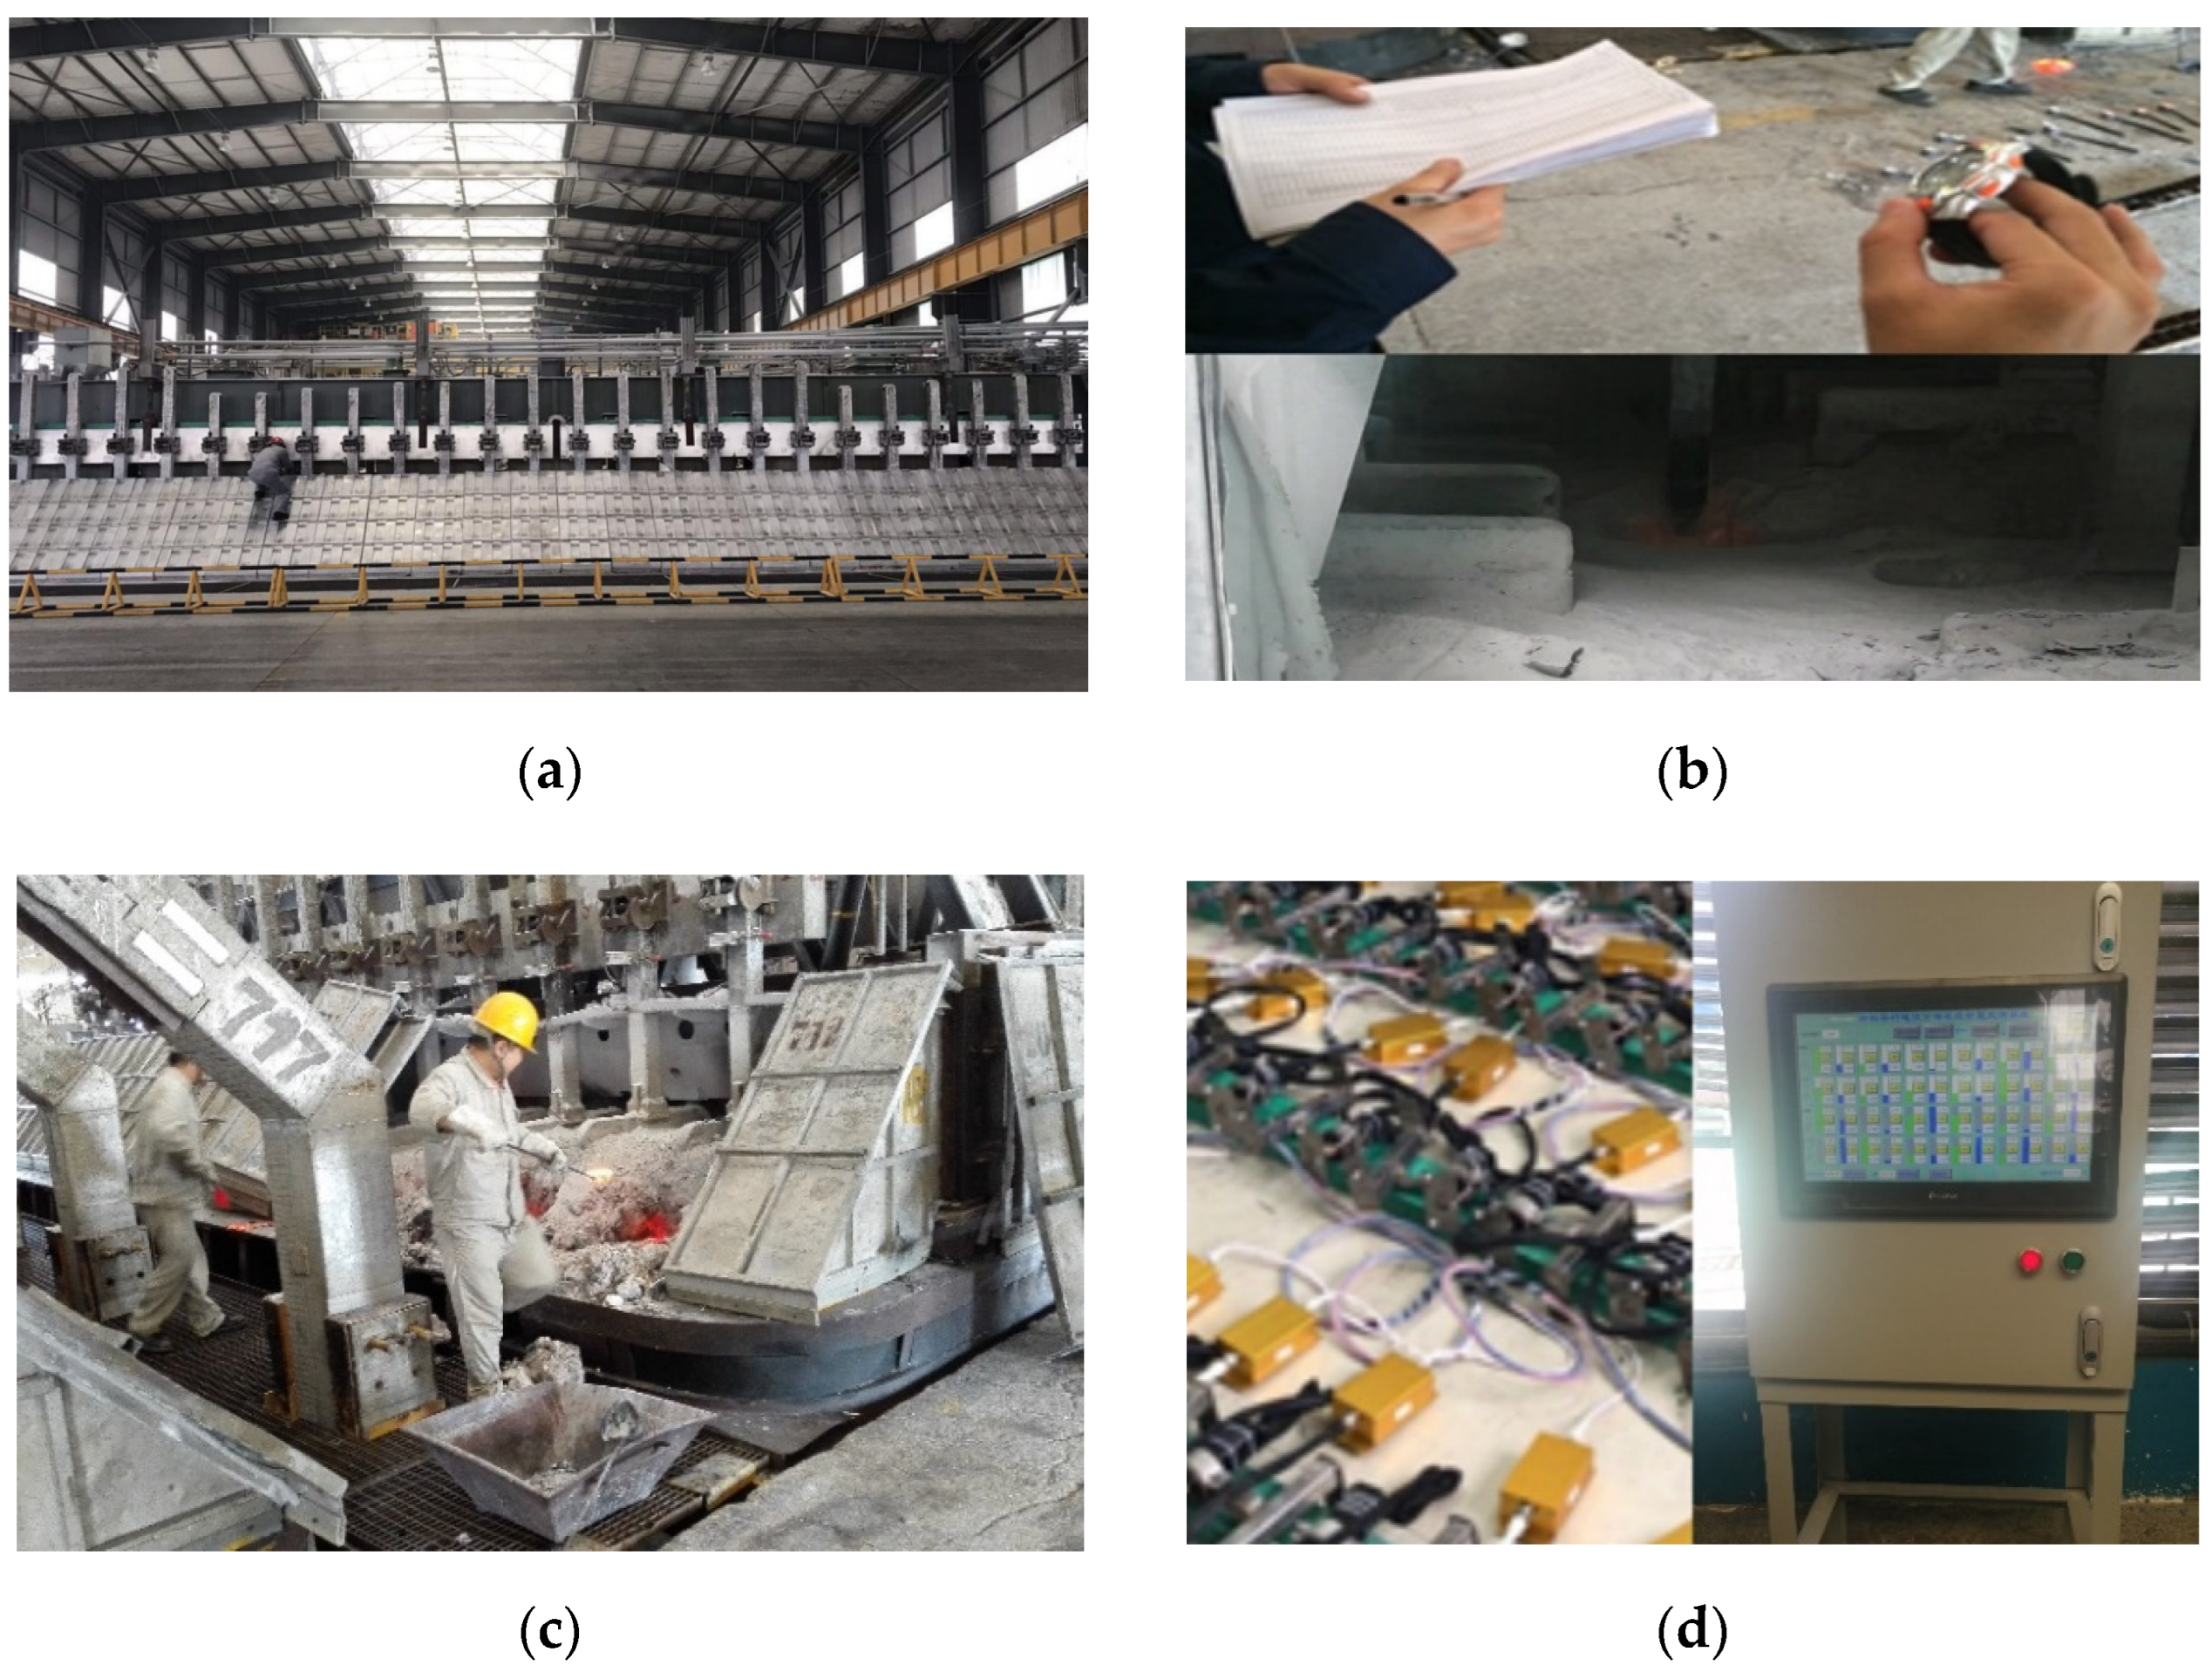
The on-site collection situation of an aluminum plant is shown in Figure 6. The actual working area of modern aluminum electrolysis is shown in Figure 6a. The data collected in the field include a feeding interval, distributed alumina concentration and distributed current. In Figure 6b, the data of the feeding interval were obtained using a stopwatch recording each feeding time. In Figure 6c, the distributed alumina concentration is scooped out by the field workers, cooled, bagged, and sent to the laboratory for analysis. The distributed current was obtained by a data collector installed on the anode guide rod, as shown in Figure 6d. Using the data collected in the field, 1000 sets of data for simulation mentioned in Section 2 can be obtained. The simulation parameters are: the input constraints of the six subsystems U = [0 0.1], and the error accuracy ε = 0.05, and each subsystem expects an output setpoint r ( k ) of 2.5.

4.2. Control Effect without Any Interference

Under the premise that there is no model mismatch and external interference in the aluminum reduction cell, as shown in Figure 7, the first 1000 s is the control effect of the traditional control strategy, and the control effect of the control strategy in this paper is after 1000 s. The traditional control strategy is based on the relationship between the cell resistance and the concentration to drive the six feeding devices’ group timing feeding: FD1, FD3, FD5 are a group of simultaneous feeding, FD2, FD4, and FD6 are a group of simultaneous feeding, and each group of feeding is staggered by half the feeding cycle.
In the first 1000 s of Figure 7, the concentration of the six subsystems is distributed very unevenly, although it is roughly in the appropriate range after feeding for a period using the traditional control strategy. After 1000 s, the distributed subspace predictive control method proposed in this paper is used to control the aluminum reduction cell. Each feeder is distributed as needed under the influence of other feeders, so that the variation of the alumina concentration is greatly reduced in space and time, and the concentration of the six areas is well controlled near the set value, the alumina concentration distribution in the entire cell is more uniform. The continuous feeding amount of each feeder in Figure 8. Since alumina is dumped in discrete 1.8 kg batches each time during the actual operation on site, the actual feeding interval is calculated according to the theoretical consumption rate of alumina in Figure 9. It can be seen from Figure 9 that the control method proposed in this paper can make the six feeders of the aluminum electrolysis cell distribute according to the demand, considering the influence of other feeders. The distribution of alumina concentration throughout the cell is more uniform and can be effectively controlled within the set value.

4.3. The Control Effect when the Feeding Amount of the Feeder Is Inconsistent with the Actual Set Value

In practice, the feeder may be blocked or overloaded. Therefore, the disturbance of inaccurate feed quantity is introduced to test the stability of the proposed control method. As shown in Figure 10, after the second 500 s, the inaccurate feeding amount was simulated for the feeding ports of subsystem 2 and subsystem 6, and the control effects were increased by 15% and decreased by 15%, respectively.
As can be seen from Figure 10, after the simulation of a 15% increase and 15% decrease in feeding port 2 and feeding port 6, the concentration of subsystem 2 will increase for a short time, and the alumina concentration of subsystem 6 will decrease for a short time. Due to the flow of electrolyte in the reduction cell, the alumina concentration of other subsystems will also be affected, but the controller can quickly stabilize the alumina concentration of each subsystem, indicating that the controller designed in this paper has a good stability. The continuous feeding amount of each feeder is shown in Figure 11. Since 1.8 kg alumina is discretely dumped each time during the actual operation on site, the actual feeding interval is calculated according to the theoretical consumption rate of alumina in Figure 12.
It can be seen from Table 1 that the control method in this paper can still maintain a small error in the presence of interference. The main reason is that the method proposed in this paper considers the influence of adjacent subsystems on itself so that each feeder can act independently to control the local alumina concentration to maintain the setpoint while making the concentration of the entire cell uniformly distributed, which is conducive to the stable operation of the cell.

5. Conclusions

This paper proposes a multi-point feeding strategy for aluminum reduction cell based on distributed subspace predictive control. This method combines the subspace method with the idea of distributed model predictive control using process data and designs a distributed controller through the input and output data. Therefore, it overcomes the shortcomings of centralized control and decentralized control and achieves the performance optimization of the entire complex large system at a lower cost. Compared with traditional methods, the proposed control strategy has the following advantages:
(1)
Each feeding device is controlled by an independent controller, and the distributed control method which combines the advantages of centralized and decentralized control is adopted, overcoming their shortcomings.
(2)
The mutual influence between the various subsystems and the influence of sudden interference are considered. For example, when the feeding amount is inaccurate, the controller can also control the concentration of alumina well to ensure the stability of the reduction cell.
Compared with traditional control strategies, the method developed in this paper can control the uniform distribution of alumina concentration more effectively, improve the production efficiency of aluminum plants and save production costs. However, in the actual production process, with the passage of time, the change of aluminum reduction cell health status will affect the accuracy of the prediction model and further affect the control accuracy. Therefore, combining the distributed subspace predictive control with the adaptive idea and improving the adaptability of the method by updating the parameters of the predictive model are the key avenues of research future.

Author Contributions

Conceptualization, J.C. and Q.L.; methodology, P.W. and X.L.; software, P.W.; validation, R.H. and H.L.; formal analysis, J.C.; investigation, P.W.; resources, Q.L. and B.C.; data curation, J.C.; writing—original draft preparation, P.W.; writing—review and editing, J.C. and X.L.; visualization, P.W. and J.C.; supervision, Q.L. and R.H.; project administration, H.L. and B.C.; funding acquisition, J.C. All authors have read and agreed to the published version of the manuscript.

Funding

This research was funded by the China Postdoctoral Science Foundation, grant number 2021M690798; Guizhou Province Science and Technology Plan Project, grant number [2021] General 085; National Natural Science Foundation of China, grant number 61603034; The Fundamental Research Funds for the Central Universities, grant number FRF-DF-20-14.

Institutional Review Board Statement

Not applicable.

Informed Consent Statement

Not applicable.

Data Availability Statement

Not applicable.

Conflicts of Interest

The authors declare no conflict of interest.

References

  1. Li, Z.Y.; Yang, S.; Zou, Z.; Li, J. Research progress of on-line detection for spatial distribution information in large-amperage aluminum reduction cells. Light Met. 2019, 9, 22–30. [Google Scholar]
  2. Bai, W.B. Discussion on the control of alumina concentration during aluminum electrolysis under complex electrolyte system. Sci. Technol. Innov. 2018, 36, 53–54. [Google Scholar]
  3. Wang, Z.W.; Gao, B.L.; Hu, X.W.; Lu, Y.; Li, Y.; Shi, Z.N.; Yu, J.Y. Some Issues in Scale Aluminum Electrolysis Cell. In Proceedings of the 15th session of the 15th China Association for Science and Technology Annual Conference: National Seminar on Aluminum Metallurgy Technology Proceedings of the Conference, Guiyang, China, 25–27 May 2013. [Google Scholar]
  4. Wu, Z.W.; Ouyang, X.Y. Production practice of accuracy feeding control for aluminum reduction pots. Light Met. 2017, 8, 26–29. [Google Scholar]
  5. Li, X.; Liu, M.Z. Effect of adjusting feeding Interval on technical parameters of aluminum electrolysis. Light Met. 2011, S1, 228–230. [Google Scholar]
  6. Lv, Z.M. Basic characteristics and control requirements of stable production mode of large aluminum reduction cell. Alum. Magnes. Commun. 2012, 3, 24–26. [Google Scholar]
  7. Zeng, S.P.; Zhang, Q.P.; Zhao, G.X. Fuzzy control for the alumina concentration in aluminum cells. Metall. Autom. 2001, 5, 9–11. [Google Scholar]
  8. Kong, J.Y.; Li, G.F.; Xiong, H.G.; Jiang, G.Z.; Yang, J.T.; Wang, X.D.; Hou, Y. Research on Soft-sensing Modeling Methods and its Application in Industrial Production. Mach. Tool Hydraul. 2007, 6, 149–151. [Google Scholar]
  9. Yin, H.M.; Wang, M.L.; Fan, J.J. High Speed Milling Cutting Temperature Soft Measurement Modeling and Algorithm Implementation Based on PSO Algorithm. Mach. Des. Res. 2016, 32, 128–131. [Google Scholar]
  10. Cui, J.R.; Li, W.H.; Su, G.C.; Cao, B.; Huang, R.Y.; Yang, X.; Li, Q. Research progress of distributed all-element model of large-amperage aluminum pots for intelligent manufacturing. Light Met. 2021, 11, 30–38. [Google Scholar]
  11. Cui, J.R.; Zhang, N.; Yang, X. Soft sensing of alumina concentration in aluminum electrolysis industry based on deep belief network. In Proceedings of the 2020 Chinese Automation Congress (CAC), Shanghai, China, 6–8 November 2020. [Google Scholar]
  12. Zhang, Y.; Yang, X.; Shardt, Y.A.W.; Cui, J.; Tong, C. A KPI-based probabilistic soft sensor development approach that maximizes the coefficient of determination. Sensors 2018, 18, 3058. [Google Scholar] [CrossRef] [Green Version]
  13. Yang, X.; Zhang, Y.; Shardt, Y.A.W.; Li, X.; Cui, J.; Tong, C. A KPI-based soft sensor development approach incorporating infrequent, variable time delayed measurements. IEEE Trans. Control Syst. Technol. 2019, 28, 2523–2531. [Google Scholar]
  14. Li, J.J.; Feng, D.D. Intelligent feeding control strategy based on aluminum concentration identification in aluminum electrolysis. Light Met. 2019, 2, 31–36. [Google Scholar]
  15. Huang, H.; Wei, Y. Research on Intelligent Control of aluminum reduction cell Based on Data Drive. Electron. Manuf. 2015, 1, 32. [Google Scholar]
  16. Shi, J.; Yao, Y.; Skyllas-Kazacos, M.; Welch, B.J. Multivariable Feeding Control of Aluminum Reduction Process Using Individual Anode Current Measurement. IFAC Pap. Online 2020, 53, 11907–11912. [Google Scholar] [CrossRef]
  17. Kaszás, C.; Kiss, L.; Poncsák, S.; Guérard, S.; Bilodeau, J.-F. Spreading of Alumina and Raft Formation on the Surface of Cryolitic Bath. In Proceedings of the 146th TMS Annual Meeting and Exhibition/Conference on Light Metals, San Diego, CA, USA, 26 February–2 March 2017. [Google Scholar]
  18. Zhan, S.Q.; Li, M.; Zhou, J.-M.; Yang, J.-H.; Zhou, Y.-W. CFD simulation of effect of anode configuration on gas-liquid flow and alumina transport process in an aluminum reduction cell. J. Cent. South Univ. 2015, 22, 2482–2492. [Google Scholar] [CrossRef]
  19. Kovács, A.; Breward, C.; Einarsrud, K.; Halvorsen, S.A.; Nordgård-Hansen, E.; Manger, E.; Münch, A.; Oliver, J.M. A heat and mass transfer problem for the dissolution of an alumina particle in a cryolite bath. Int. J. Heat Mass Transf. 2020, 162, 120232. [Google Scholar] [CrossRef]
  20. Gylver, S.E.; Omdahl, N.H.; Prytz, A.K.; Meyer, A.J.; Lossius, L.P.; Einarsrud, K.E. Alumina feeding and raft formation: Raft collection and process parameters. In Proceedings of the Light Metals Symposium at the 148th TMS Annual Meeting, San Antonio, TX, USA, 10–12 March 2019. [Google Scholar]
  21. Einarsrud, K.E.; Eick, I.; Wei, B.; Feng, Y.; Hua, J.; Witt, P.J. Towards a coupled multi-scale, multi-physics simulation framework for aluminium electrolysis. Appl. Math. Model. 2015, 44, 3–24. [Google Scholar] [CrossRef] [Green Version]
  22. Wang, R.G.; Bao, J.; Yao, Y.C. A data-centric predictive control approach for nonlinear chemical processes. Chem. Eng. Res. Des. 2018, 142, 154–164. [Google Scholar] [CrossRef]
  23. Xi, L.; Sun, M.M.; Chen, S.S.; Zhu, J.Z.; Sun, Q.Y.; Liu, Z.J. Multi-region cooperative control method for distributed grid. Electr. Mach. Control 2021, 25, 75–86. [Google Scholar]
  24. Wang, Z.B.; Li, C.M.; He, W.Y. Control of alumina concentration in aluminum electrolysis production. Des. Nonferrous Met. 2018, 45, 101–103. [Google Scholar]
  25. Yang, X.; Gao, J.J.; Huang, B. Data-driven design of fault detection and isolation method for distributed homogeneous systems. J. Frankl. Inst. 2021, 358, 4929–4949. [Google Scholar] [CrossRef]
  26. Yang, X.; Gao, J.J.; Li, L.L.; Luo, H.; Ding, S.X.; Peng, K.X. Data-driven design of fault-tolerant control systems based on recursive stable image representation. Automatica 2020, 122, 109246. [Google Scholar] [CrossRef]
  27. Han, P.; Liu, M.; Jia, H. Data Driven Pre Tuning Adaptive Subspace Model Predictive Control. J. Syst. Simul. 2018, 30, 332–340. [Google Scholar]
  28. Wu, X.; Shen, J. Subspace identification and predictive control of boiler-turbine coordination system. J. Southeast Univ. Nat. Sci. Ed. 2012, 42, 281–286. [Google Scholar]
  29. Dong, T.T.; Li, L.J.; Xiong, L.; Xu, O.G. Distributed Predictive Control Based on Associated Subsystems. Control Eng. 2015, 22, 1201–1206. [Google Scholar]
  30. Chen, J.M.; Yang, F.W. Communication-Based Data-Driven Distributed Predictive Control. J. East China Univ. Sci. Technol. Nat. Sci. Ed. 2014, 40, 113–119. [Google Scholar]
  31. Chen, Q.; Li, S.Y.; Xi, Y.G. Distributed Predictive Control Based on Plant-Wide Optimality. J. Shanghai Jiao Tong Univ. 2005, 03, 349–352. [Google Scholar]
  32. Yao, Y.; Cheung, C.-Y.; Bao, J.; Skyllas-Kazacos, M.; Welch, B.J.; Akhmetov, S. Estimation of spatial alumina concentration in an aluminum reduction cell using a multilevel state observer. AIChE J. 2017, 63, 2806–2818. [Google Scholar] [CrossRef]
  33. Yao, Y.; Cheung, C.Y.; Bao, J.; Skyllas-Kazacos, M. Monitoring Local Alumina Dissolution in Aluminum Reduction Cells Using State Estimation. Light Met. 2015, 2015, 577–581. [Google Scholar]
  34. Wahab, N.A.; Katebi, R.; Balderud, J.; Rahmat, M.F. Data-driven adaptive model-based predictive control with application in wastewater systems. IET Control Theory Appl. 2011, 5, 803–812. [Google Scholar] [CrossRef] [Green Version]
  35. Alexander, M.K. Why are enzymes less active in organic solvents than in water? Trends Biotechnol. 1997, 15, 97–101. [Google Scholar]
Figure 1. Top view of 400 kA large aluminum reduction cell.
Machines 10 00220 g001
Figure 2. Predictive control diagram of aluminum electrolysis subsystem.
Machines 10 00220 g002
Figure 3. Output predictions (N = 5).
Machines 10 00220 g003
Figure 4. Step 2: Output prediction.
Machines 10 00220 g004
Figure 5. Flow chart of distributed predictive control algorithm.
Machines 10 00220 g005
Figure 6. Field collection diagram: (a) actual working area of modern aluminum electrolysis; (b) data acquisition diagram of feeding interval; (c) scoop out the electrolyte diagram; and (d) distributed current acquisition diagram.
Machines 10 00220 g006
Figure 7. Variation of alumina concentration: (a) subsystems 1–3; and (b) subsystems 4–6.
Machines 10 00220 g007
Figure 8. Distributed feeding quantity control: (a) subsystems 1–3; (b) subsystems 4–6.
Machines 10 00220 g008
Figure 9. Distributed feeding interval control: (a) subsystems 1–3; (b) subsystems 4–6.
Machines 10 00220 g009
Figure 10. Variation of the alumina concentration: (a) subsystems 1–3; and (b) subsystems 4–6.
Machines 10 00220 g010
Figure 11. Distributed feeding quantity control: (a) subsystems 1–3; (b) subsystems 4–6.
Machines 10 00220 g011
Figure 12. Distributed feeding interval control: (a) subsystems 1–3; (b) subsystems 4–6.
Machines 10 00220 g012
Table 1. Mean squared error (MSE) of the actual concentration and set concentration when disturbance occurs.
SubsystemMSE without InterferenceMSE with Interference
Subsystem 10.03090.0387
Subsystem 20.03060.0667
Subsystem 30.01400.0203
Subsystem 40.01560.0161
Subsystem 50.04140.0475
Subsystem 60.04210.0633
Subsystem 10.03090.0387
Average0.02910.0421
Publisher’s Note: MDPI stays neutral with regard to jurisdictional claims in published maps and institutional affiliations.