Abstract
In this study, static and dynamic analyses of a spur gear pair with linear tip relief and longitudinal crowning were performed. Dynamic experiments were conducted to compare and verify the dynamic analysis results. On the basis of the theory of gearing, the mathematical model of a modified spur gear pair was established. In addition, a finite element mesh generation program was developed according to the mathematical model. Finite element analysis was applied to calculate the contact stress, contact patterns, and mesh stiffness of the gear pair. Moreover, a dynamic analysis was performed to predict the dynamic transmission error (DTE) at various speeds and loads. Dynamic experiments were performed on the spur gear pair by using a gear dynamic tester. Accelerometers were mounted on the gear pair to record the vibrations during gear meshing. The experimental DTE was calculated and compared with the simulated DTE to verify the prediction of the vibration performance of the spur gear pair under different rotational conditions.
1. Introduction
Gear pairs are widely used in transmission systems. The load capacity and operating life of the gear meshing in transmission systems are crucial considerations, and gear vibration during high-speed operations is also a vital concern. With the development of precision machinery applications, the requirements related to the alleviation of vibration and noise generated by gear meshing are becoming increasingly stringent. Gear pair transmission errors are directly related to vibration and noise [1]. Many factors contribute to transmission errors, such as assembly errors, manufacturing errors, thermal deformation, and tooth surface deviations. Gear vibration and noise can be reduced through appropriate tooth surface modifications [2]. How to design tooth surface modifications to retain gear transmission capacity and resolve vibration and noise problems has become an important research topic.
An involute cylindrical gear pair without modifications is insensitive to center distance errors and yields high transmission efficiency. However, such a gear pair is highly sensitive to axial assembly errors, which cause edge contact and markedly high contact stress on the tooth surface. In practice, the tooth surface should be modified (e.g., through tooth profile modification, lead crowning modification, tip relief modification, or end-relief modification) to avoid edge contact or tooth tip interference [3,4,5]. Edge contact and tooth tip interference cause discontinuous transmission errors and a rapid increase in local contact stress, leading to gear vibration, noise, scratches, damage to the tooth surface, gear cracks, and reduced service life. Therefore, on the basis of the theory of gearing [6,7], mathematical models were established for various tooth surface modifications to perform tooth contact analysis (TCA). Moreover, gear–tooth contact behavior was analyzed [8,9].
To analyze the dynamic response of a gear pair, a gear dynamic model was developed to simulate the dynamic characteristics of a gear pair. Parker et al. [10] employed a finite element/contact mechanics approach with a single-degree-of-freedom dynamic model to analyze the dynamic behavior of gear pairs. Tamminana et al. [11] developed a dynamic model for gear systems with time-varying mesh stiffness and transmission errors to explore the dynamic transmission error (DTE) of different gear parameters, and they verified the applicability of their model through experiments. Faggioni et al. [12] proposed using the finite element method to calculate mesh stiffness, substituting mesh stiffness into the dynamic equation of the gear system, and employed a self-written optimization algorithm to determine the optimum parameters for gear design with the smallest DTE value.
Many researchers have investigated the dynamic behavior of gear systems. Umezawa et al. [13] discussed the relationship between the contact ratio of gear pairs and the dynamic characteristics of gear systems. Ogawa et al. [14] studied the relationship between different lead modifications of spur gear pairs and their dynamic characteristics and proved that parabolic lead modification can reduce gear pair vibration during transmission. Using synchronous averaging, Houjoh et al. [15] studied dynamic signals, performed tooth surface measurements, and verified the correlation between tooth surface geometry and gear meshing vibrations. Du et al. [16] studied the dynamic characteristics of the high-speed gear transmission system of battery electric vehicles. The parabolic profile modification and parabolic axial modification were optimized to suppress the vibration acceleration at full working conditions. Masoumi et al. [17] analyzed the dynamic behaviors of planetary gears using a lumped-mass model, which considered the time-varying stiffness and backlash of the gear system. They found that the bearing stiffness compliance affects the natural frequency combinations of the gear system. The chaotic regions may be enlarged, and the system was prone to dynamic imbalance. Gelman et al. [18] used the wavelet spectral kurtosis technique and its variants for early gear–tooth fault diagnosis. A three-stage decision-making technique based on a weighted majority rule was used for the final diagnosis decision. An experiment was also carried out to verify the feasibility of the proposed method. Ambarisha et al. [19] studied the nonlinear dynamic behaviors of planetary gears based on a lumped-parameter model and a finite element model. Qualitative and quantitative comparisons of the dynamic responses of the two models were successfully carried out. Bahk et al. [20] studied the nonlinear behavior of a planetary gear with equally spaced planet gears. The obtained analytical results compared well with numerical integration, finite element, and harmonic balance methods. Amabili et al. [21] proposed a single-degree-of-freedom dynamic model, considering the time-varying stiffness and viscous damping. The influences of stiffness, contact ratio, and damping ratio on the transition curves separating stable and unstable regions were discussed.
Kahraman et al. [22] established a dynamic model by considering the time-varying mesh stiffness and bearing stiffness of a gear transmission system and observed the dynamic characteristics of the gear system through spectrum analysis. Kahraman et al. [23] built a dynamic test machine and studied the influence of different tip relief modification parameters on the dynamic characteristics of a gear system. They performed dynamic experiments at various speeds and loads and plotted the RMS of DTE curves to investigate the influence of tip relief modifications on vibration at different speeds and loads. They concluded that each set of tooth tip relief parameters corresponded to the torque associated with its most suitable operation wherein the DTE (i.e., the amount of vibration) was the lowest. In addition, Hotait et al. [24] used a dynamic tester to simultaneously conduct vibration and strain experiments in order to study the correlation between DTE and the dynamic factor (DF); they found that DTE and DF were linearly related. Inalpolat et al. [25] discussed the influence of indexing errors on the dynamic behavior of spur gears. They measured long-period quasi-static transmission errors (quasi-STEs) to predict the dynamic behavior of spur gears. Benatar et al. [26] presented STE and DTE data for helical gears with different profiles and lead modifications under various loads and speeds. They revealed that the amplitudes of DTEs were almost proportional to STEs. Bruyere et al. [27] combined different tooth profiles and lead modification parameters and determined the optimal design parameters of narrow-faced helical gears with minimum transmission error. Villalba et al. [28] reviewed the research related to the vibration of gear transmission systems in the past twenty years. Mesh stiffness and STE are considered principal variables for gear design considering vibration reduction. Furthermore, in a previous study [29], a helical gear set with linear tip relief was studied to improve its static and dynamic characteristics. A simulation method for dynamic analysis was established, and static and dynamic characteristics were improved by altering the tip relief modification parameters. However, only simulations were conducted; no experimental verification was performed.
According to the reviewed literature, there were few studies that analyzed the dynamic characteristics from the mathematical model of gears based on rack-cutter design and the generating mechanism. The finite element models and mesh generation were rarely built by considering the contact position calculated by TCA. Therefore, in this study, a mesh generation program was developed based on the derived mathematical model of modified spur gears as well as the contact points during gear meshing from the TCA results. In addition, in terms of experiments, there were few studies that performed the dynamic experiments with accelerometers mounted on the gears to measure the torsional vibration during gear meshing. Therefore, the signal–noise ratio of the acquired vibrational signals in our experiments were relatively higher than other signals acquired from bearing seats. Moreover, a frequency-domain integration with several band-pass filters in the frequency domain was proposed to convert acceleration signals into displacement signals. Only the components related to the meshing frequencies of the gear pair was retained and compared. Consequently, the experimental dynamic characteristics of the gears were transformed and expressed in the time domain, which demonstrated and validated the correctness of the simulation results.
The present study aimed to develop an analysis method for predicting the static and dynamic performance of a spur gear pair with tip relief and longitudinal crowning modification. Dynamic experiments were conducted to verify the dynamic simulations. According to the reviewed references, the gear model construction for the dynamic analysis based on the theory of gearing and practical manufacturing has rarely been considered and investigated. First, a mathematical model of a modified spur gear pair was established according to the rack-cutter geometry and the theory of gearing. Based on the derived mathematical model, the TCA program was developed to calculate the STE and contact points under various rotational angles with no load [6,7,8]. Then, a self-developed mesh generation program was established to build the finite element model according to the contact points under different rotational angles from the results of TCA. Loaded tooth contact analysis (LTCA) was performed to determine the contact stress and mesh stiffness based on finite element analysis (FEA) and the self-developed mesh generation program. Subsequently, the simulated DTE under various rotational speeds and loads was determined based on the established spur gear dynamic model. In addition, a gear dynamic tester was built to perform dynamic experiments under various operating conditions. Adequate signal processing was applied to the measured vibrations to calculate the experimental DTE. Simulated and experimental DTEs were consistent, verifying the proposed dynamic analysis method for a modified spur gear pair.
2. Simulations of the Modified Spur Gear Pair
2.1. Mathematical Model
On the basis of differential geometry and the theory of gearing, a modified spur gear with linear tip relief and longitudinal crowning modifications was developed [29]. Figure 1 shows the linear tip relief, longitudinal crowning modifications, as well as the corresponding parameters. Ca and La denote the amount and length of tip relief modification, respectively. E and W denote the amount of longitudinal crowning and the face width, respectively. The parameters of the spur gear set used in this study are listed in Table 1.

Figure 1.
Gear modification parameters.

Table 1.
Design parameters of the spur gear set.
2.2. LTCA
Based on the derived mathematical model of the modified spur gear, TCA was conducted to compute the STEs and contact points under various rotational angles. The STEs and contact points were subsequently used in the dynamic model and mesh generation program, respectively. For the LTCA, a finite element mesh generation program was developed based on the contact points from the TCA results. The mesh was fixed, and the nodes were located at the instantaneous contact points of each rotational angle on the pinion and gear–tooth surfaces. Then, FEA was performed to predict the contact stress, contact pattern, and time-varying mesh stiffness of the modified spur gear set under various loads, i.e., from 10 to 100 N-m at an increment of 10 N-m. Figure 2 illustrates the analysis process including TCA, LTCA, and dynamic analysis.
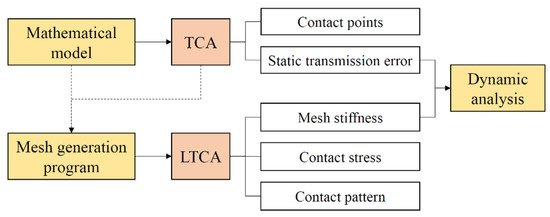
Figure 2.
Flowchart of the analysis process.
2.2.1. Contact Stress and Contact Pattern
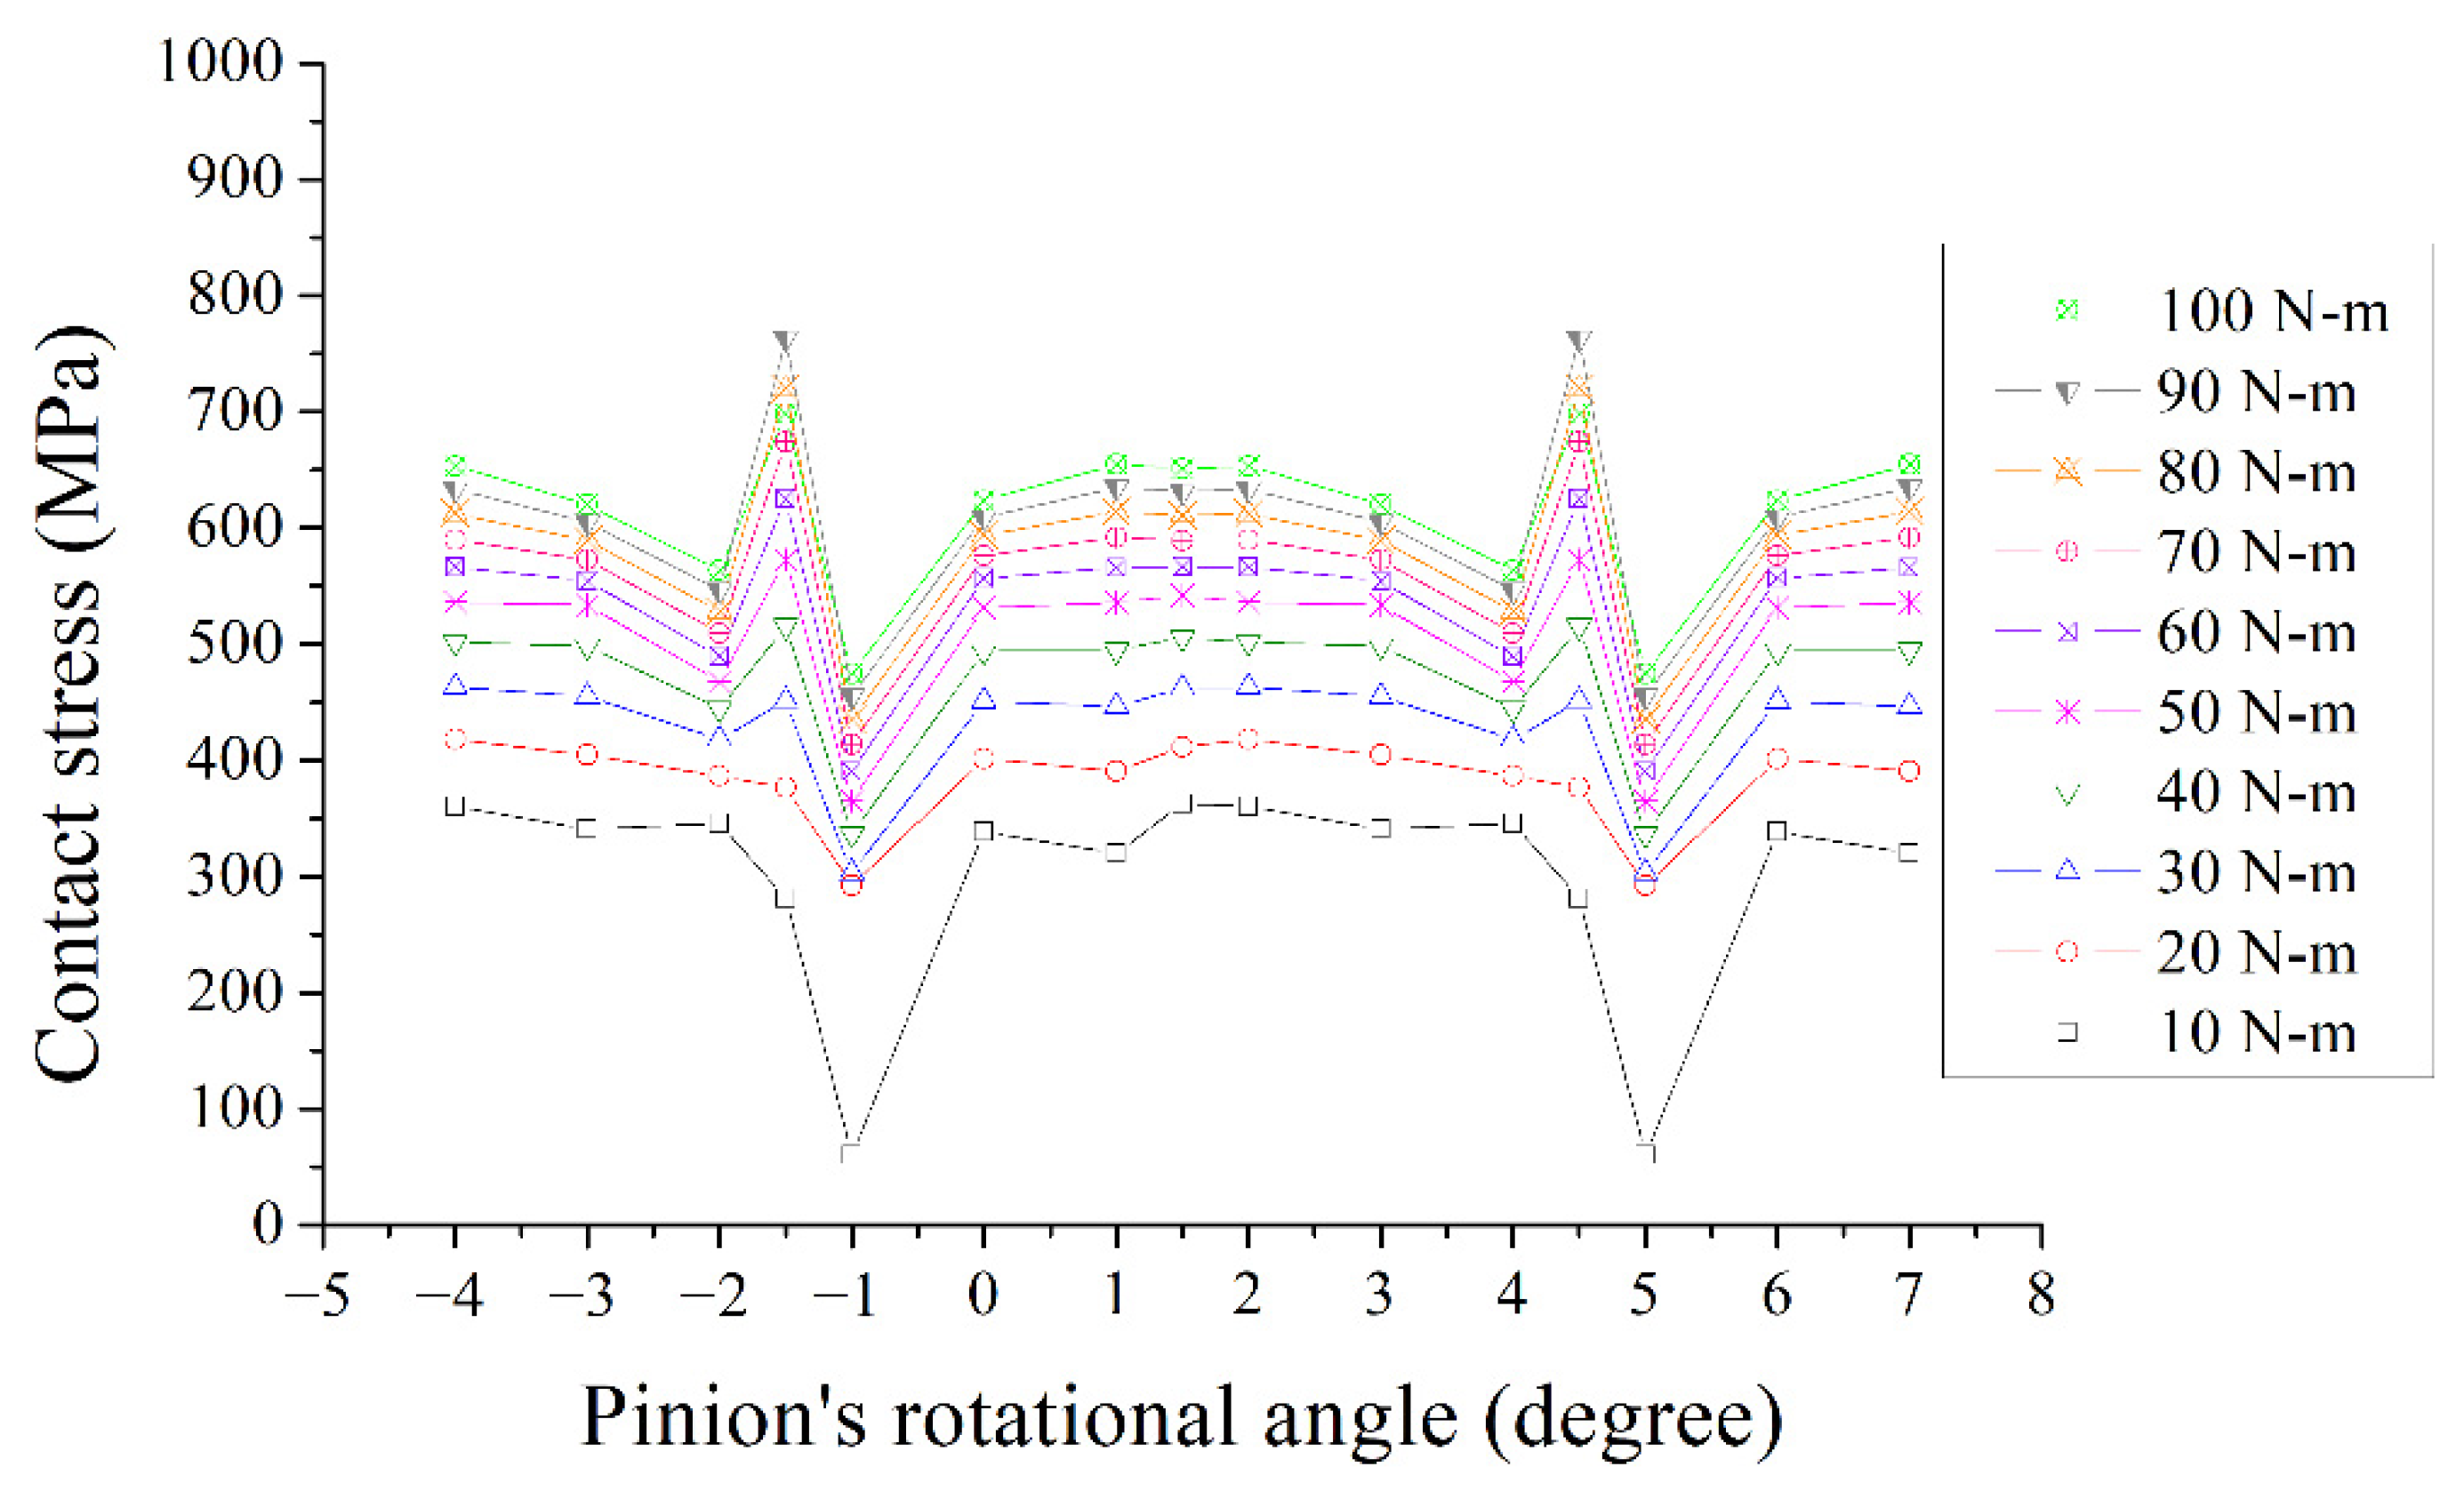
The maximum contact stress on the pinion under various loads during meshing is plotted in Figure 3. The contact stress fluctuated near the starting point of the tip relief, and a higher load induced higher contact stress. The maximum contact stress at 100 N-m was approximately 762 MPa, which is acceptable.
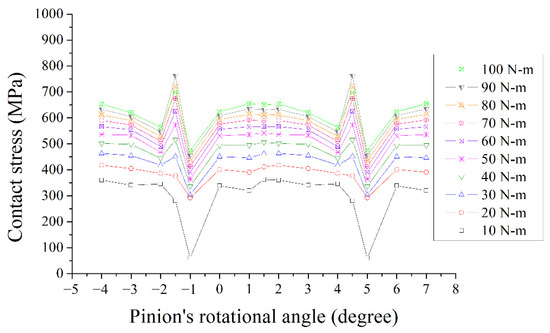
Figure 3.
Contact stress under various loads.
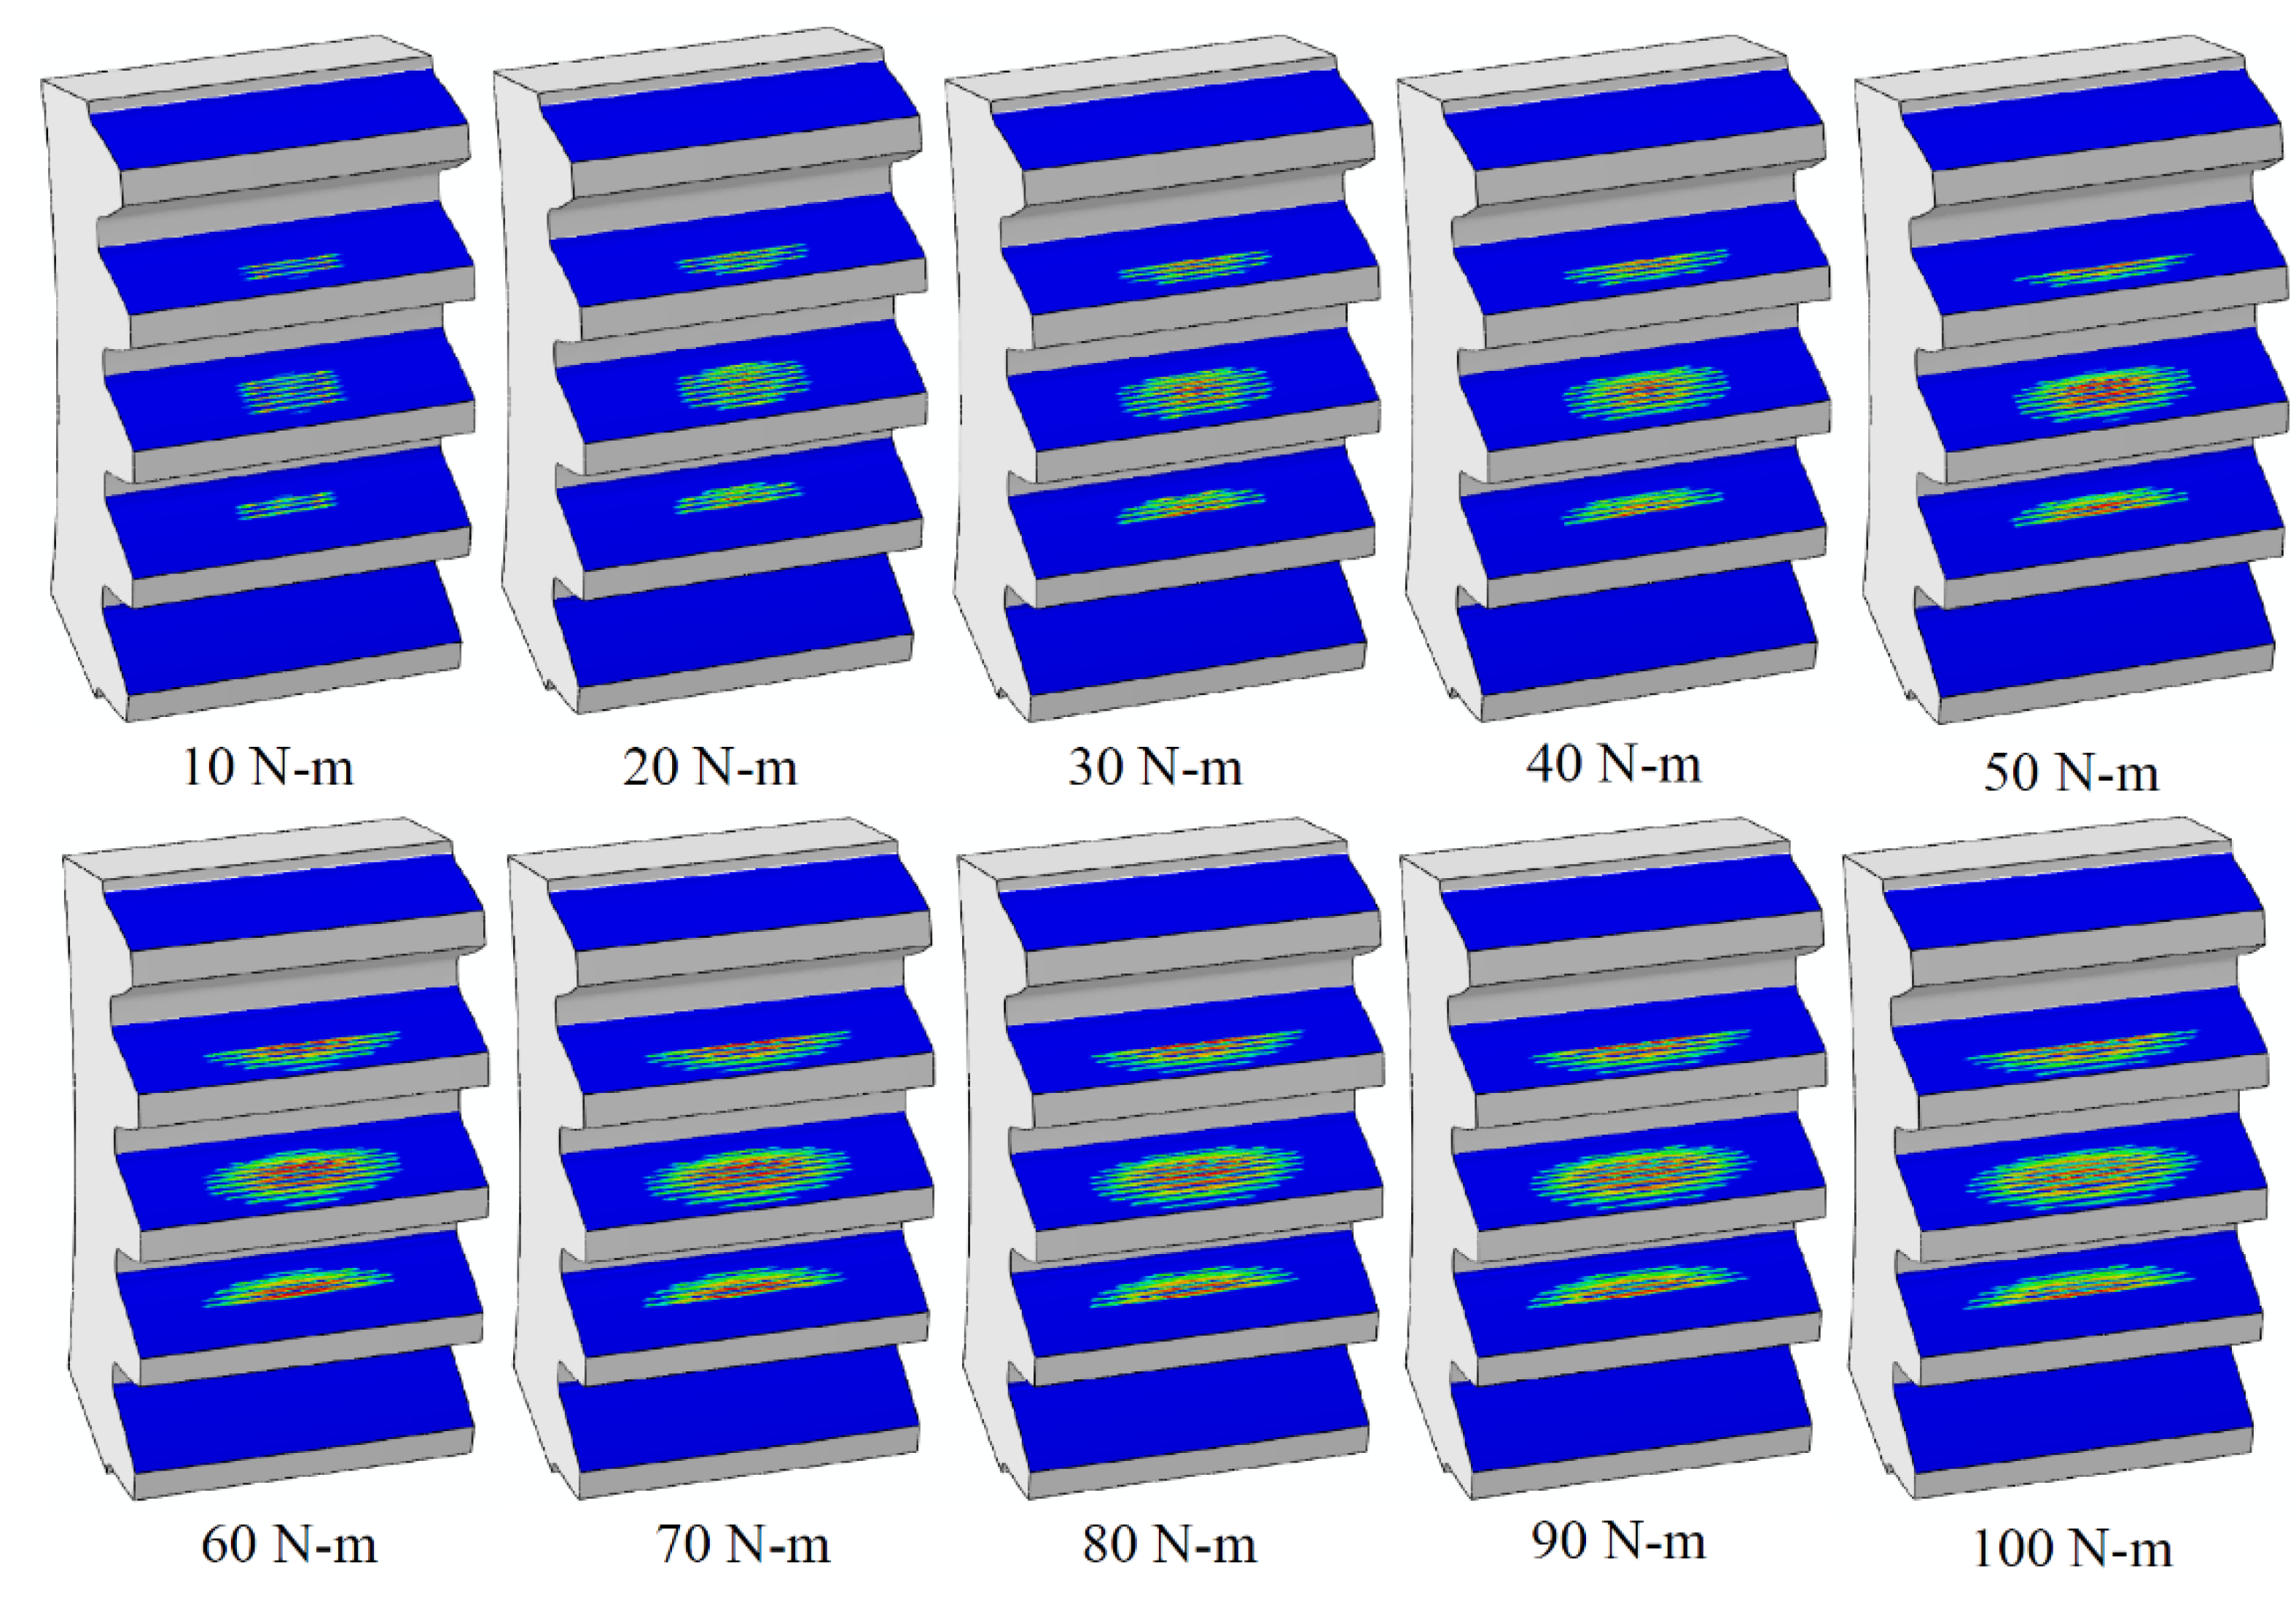
The simulated contact patterns under different loads during a complete meshing through one gear–tooth flank were predicted using LTCA; these patterns are displayed in Figure 4. The contact patterns in Figure 4 were obtained by superimposing the stress distribution at every one-degree rotation of the pinion based on the post-processing subroutine of the finite element package Abaqus. Hence, the contact patterns may appear irregular in Figure 4. Even when the load was 100 N-m, the length of contact patterns only accounted for approximately two-thirds of the tooth width, which is acceptable in common practice.
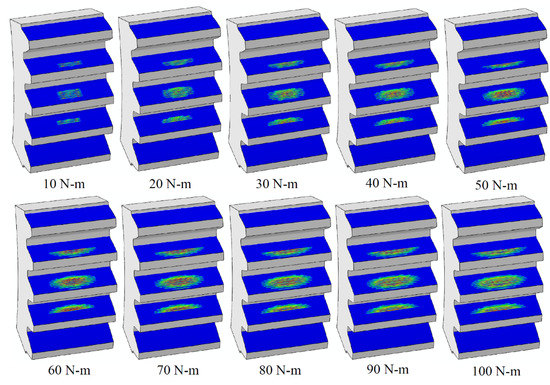
Figure 4.
Simulated contact patterns under various loads.
2.2.2. Mesh Stiffness
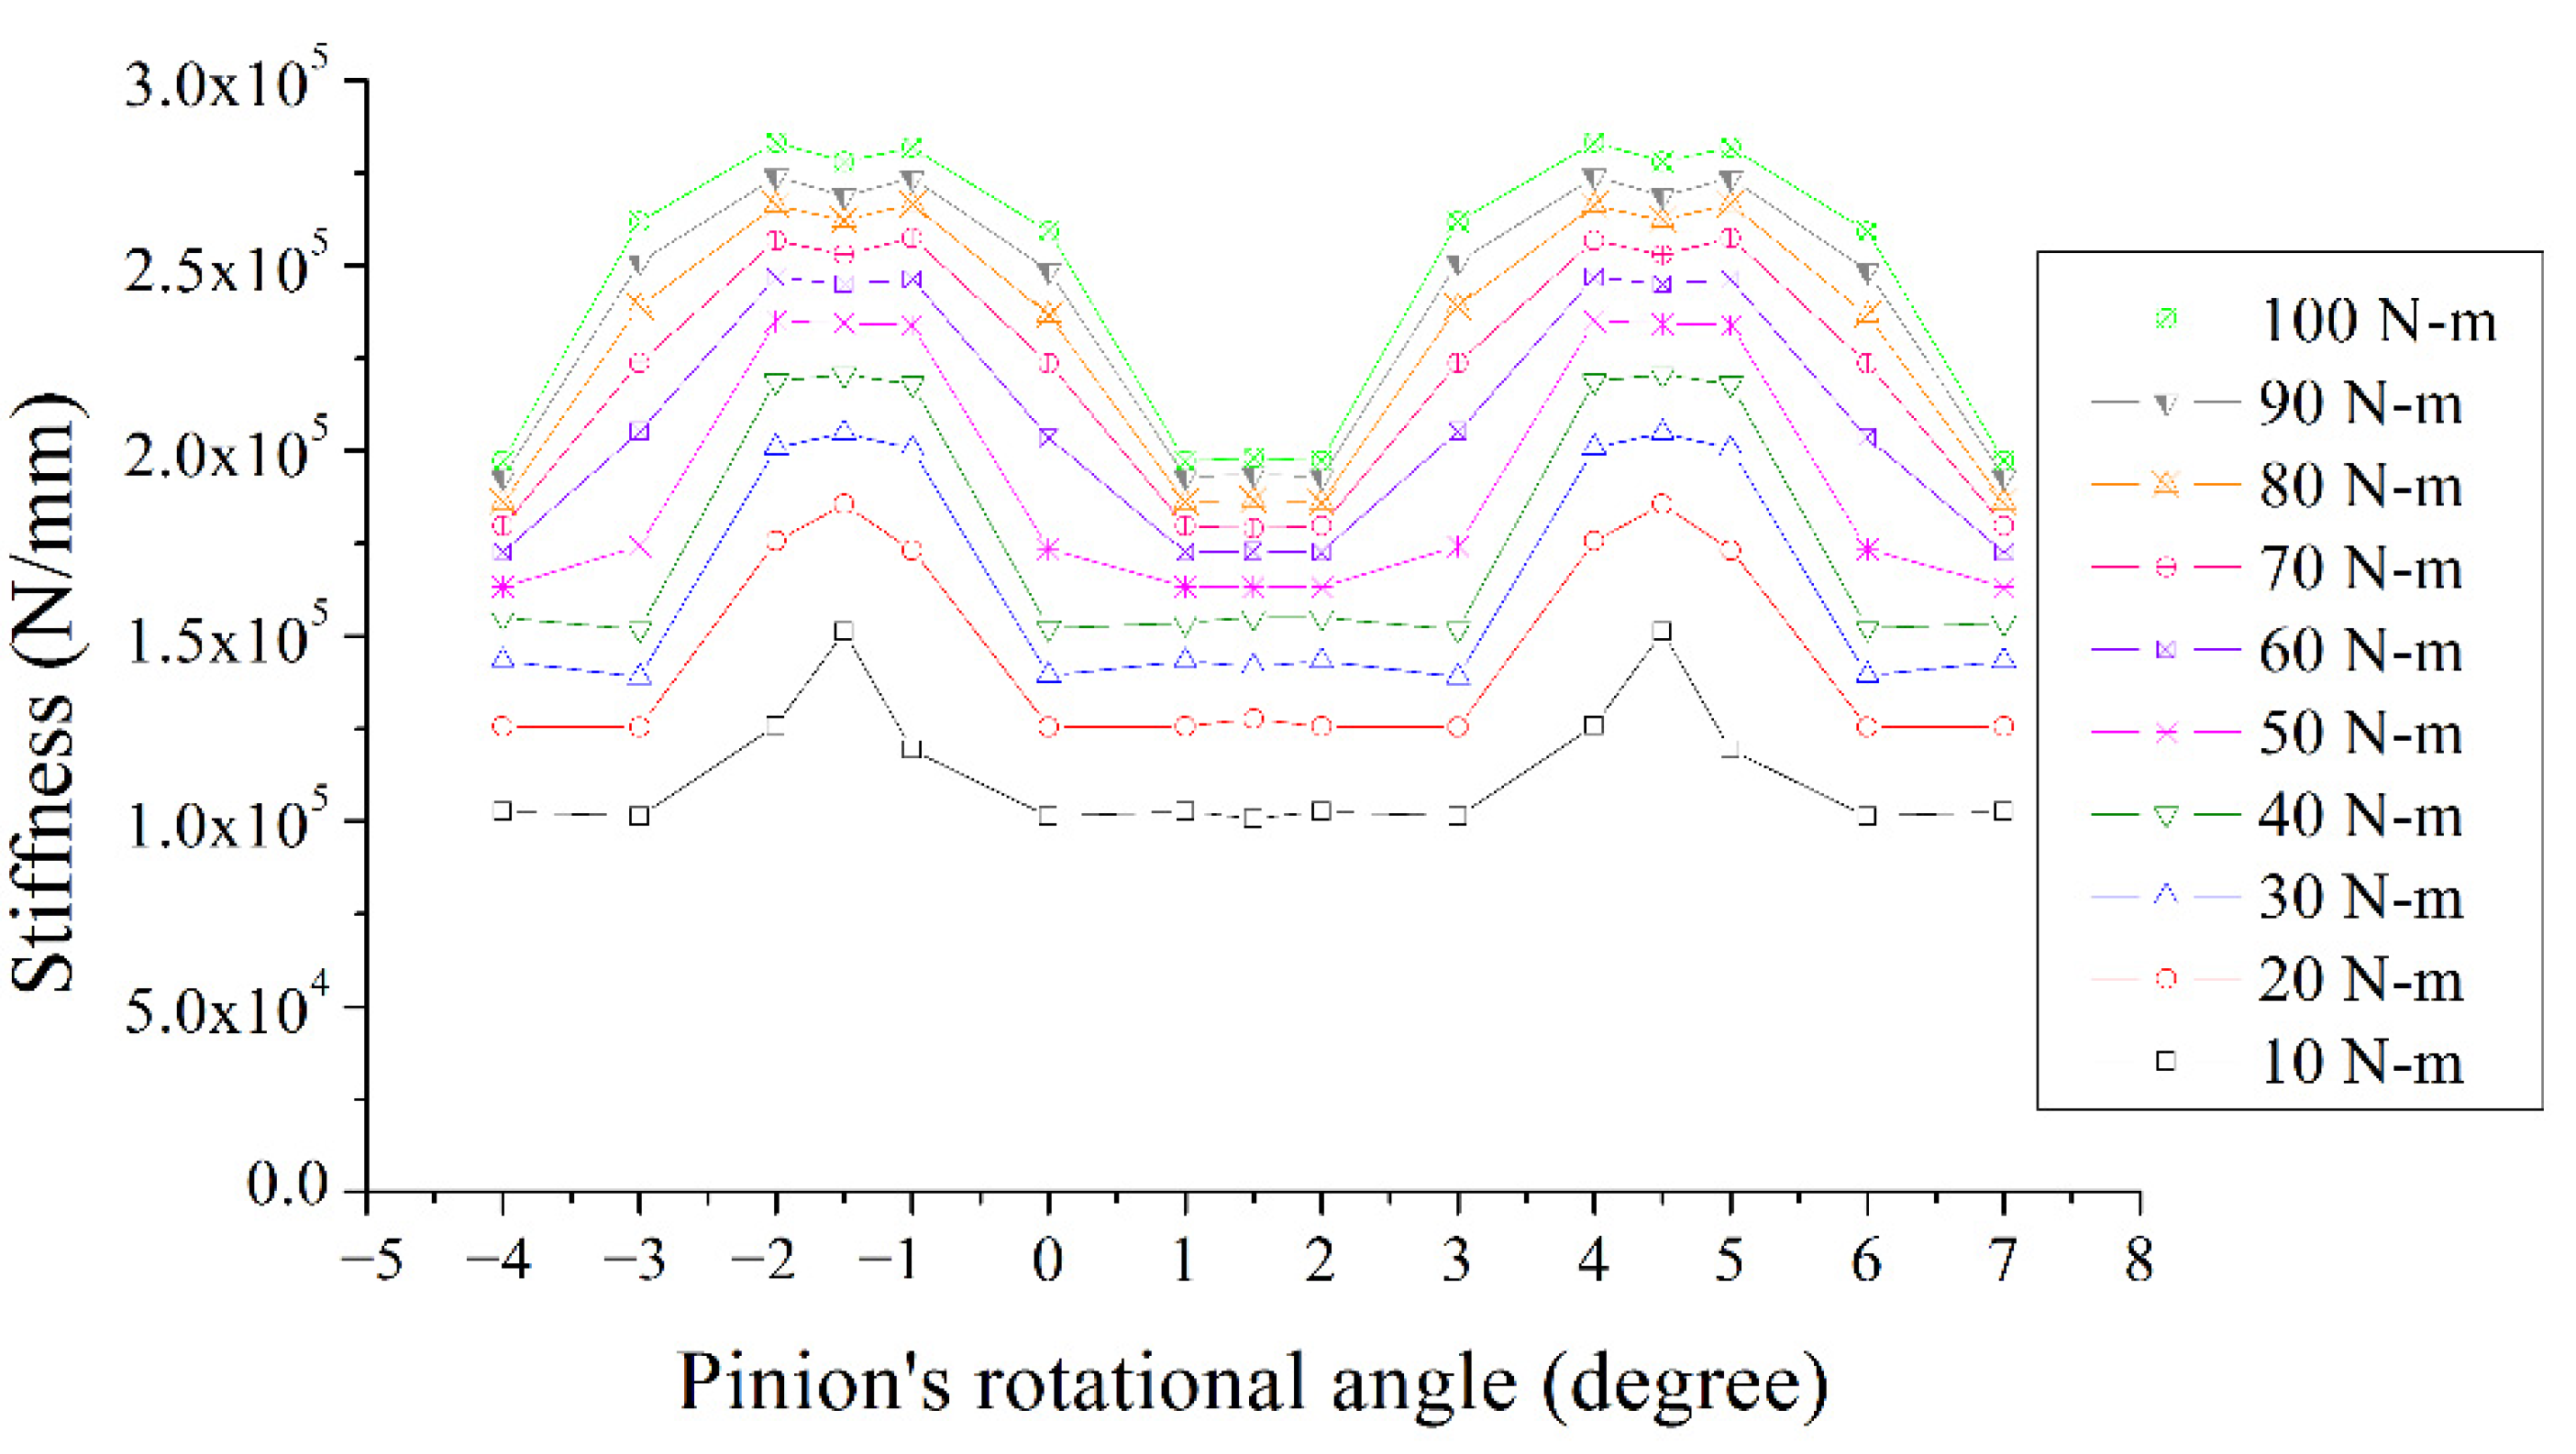
The normal contact force on the tooth surface and the elastic deformation at the contact points under different loads were determined using LTCA, enabling us to determine the mesh stiffness, as shown in Figure 5.
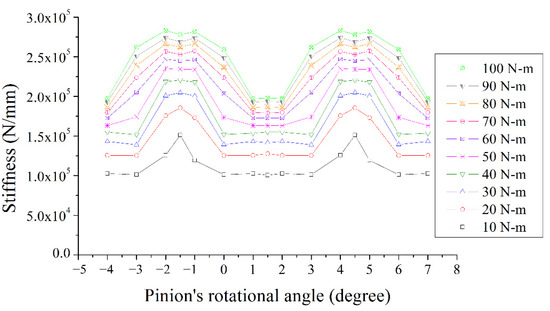
Figure 5.
Mesh stiffness under different loads.
Mesh stiffness is an important parameter for determining the dynamic characteristics of gear systems. Mesh stiffness curves show the variations in the meshing tooth pairs and load sharing of gear teeth during meshing. Fluctuations in mesh stiffness curves correspond to single- and double-tooth contact regions during meshing. In the single-tooth contact region, only one pair of gear teeth bears the entire load, leading to higher contact stress and elastic deformation than in double-tooth contact regions. Therefore, mesh stiffness in double-tooth contact regions is higher than that in single-tooth contact regions.
2.3. Dynamic Analysis
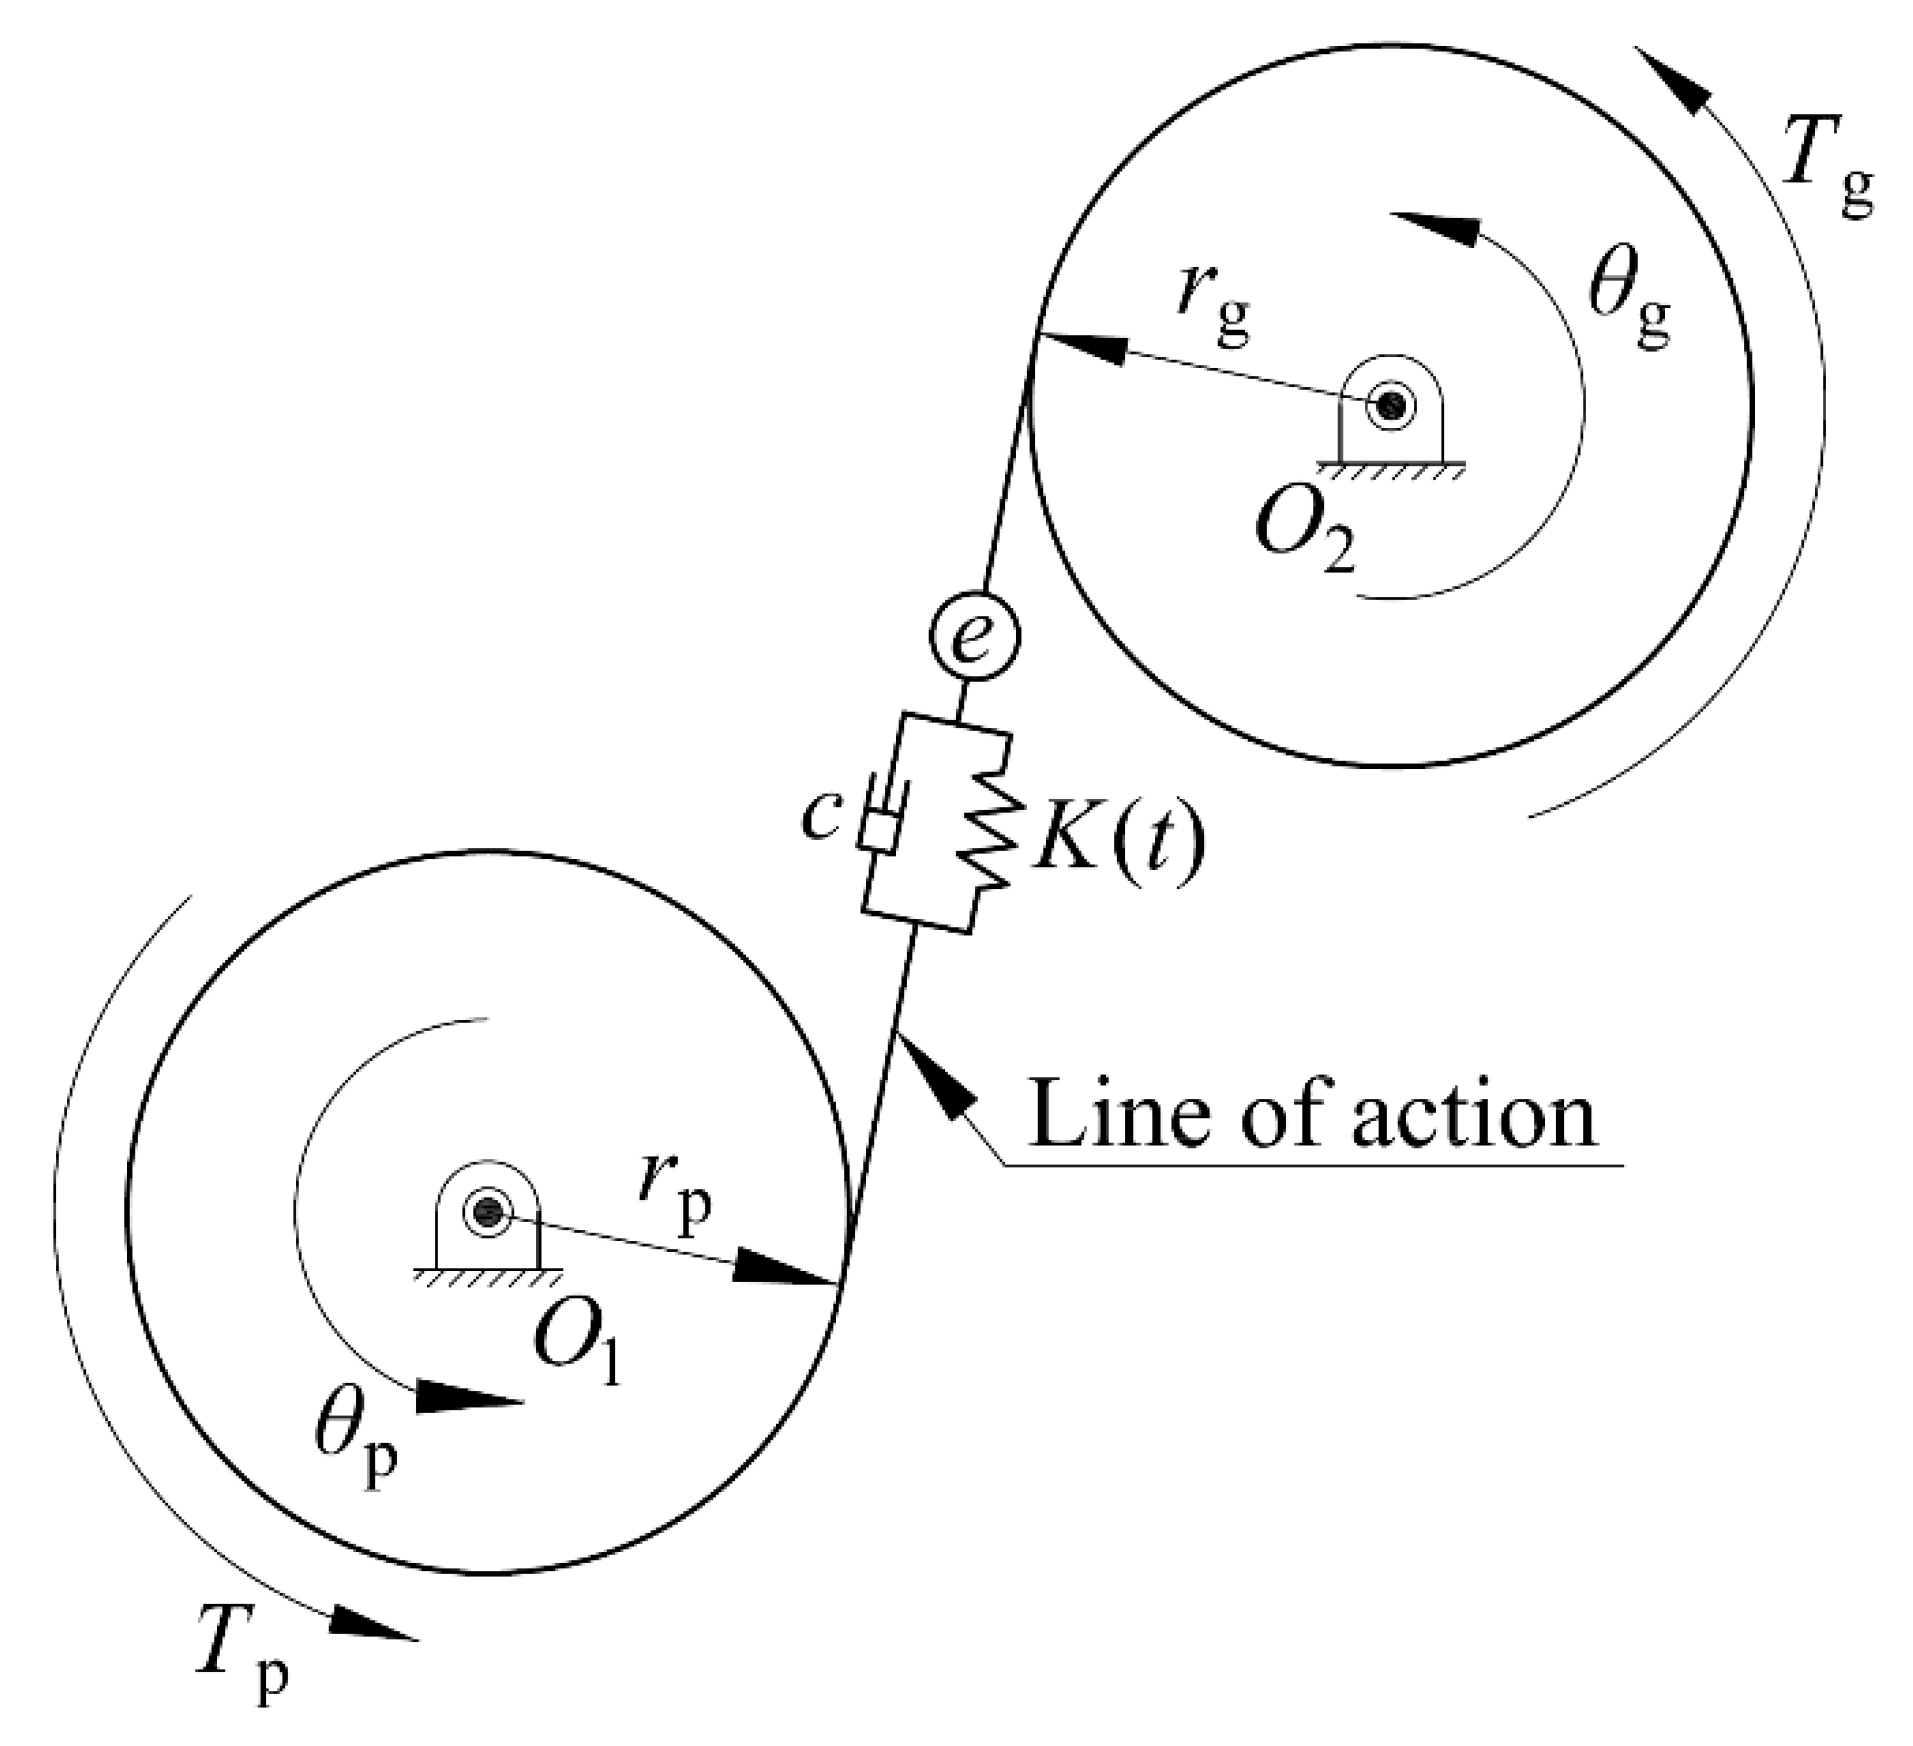
A dynamic model of a spur gear pair was developed for dynamic analysis. This model was established based on the following assumptions: (1) The gear pair was assumed to have ideal lubrication during operation; thus, the effect of friction was ignored. (2) The axial and radial components were not included in this dynamic model. Figure 6 shows the schematic of the dynamic model; Tp and Tg represent the torque acting on the pinion and the gear, respectively. rp and rg represent the base circle radii of the pinion and the gear, respectively; θp and θg are the rotational angles of these gears. K(t) and c represent the equivalent mesh stiffness and equivalent damping of the system during meshing, respectively. According to the literature [30], the damping ratio used in this study was set as a constant, 0.06. e is the STE of the gear pair. The mesh stiffness and the STE can be calculated using our TCA and LTCA simulations.
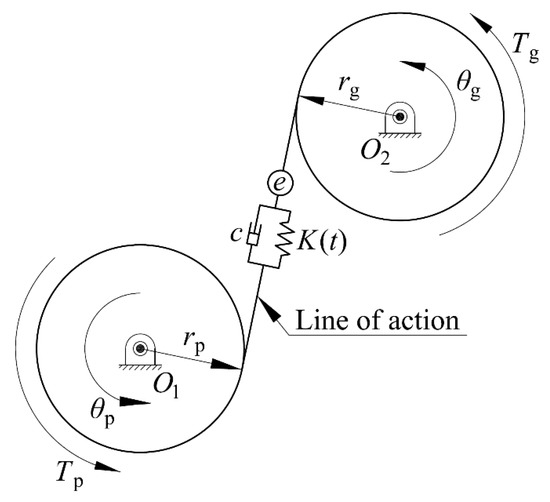
Figure 6.
Dynamic model of a spur gear pair.
Consequently, the dynamic equation of the gear pair can be written as:
where meq and F represent the system equivalent mass and equivalent loading, respectively. The displacement x(t) along the line of action can be represented by Equation (2), and the DTE is determined using Equation (3).
The dynamic equations were solved to obtain the DTE using Runge–Kutta fourth-order method with MATLAB codes; then, the RMS value xRMS of the DTE was calculated as follows:
where xi and n represent the calculated DTE and the time duration, respectively.
3. Dynamic Experiments
3.1. Experimental Framework
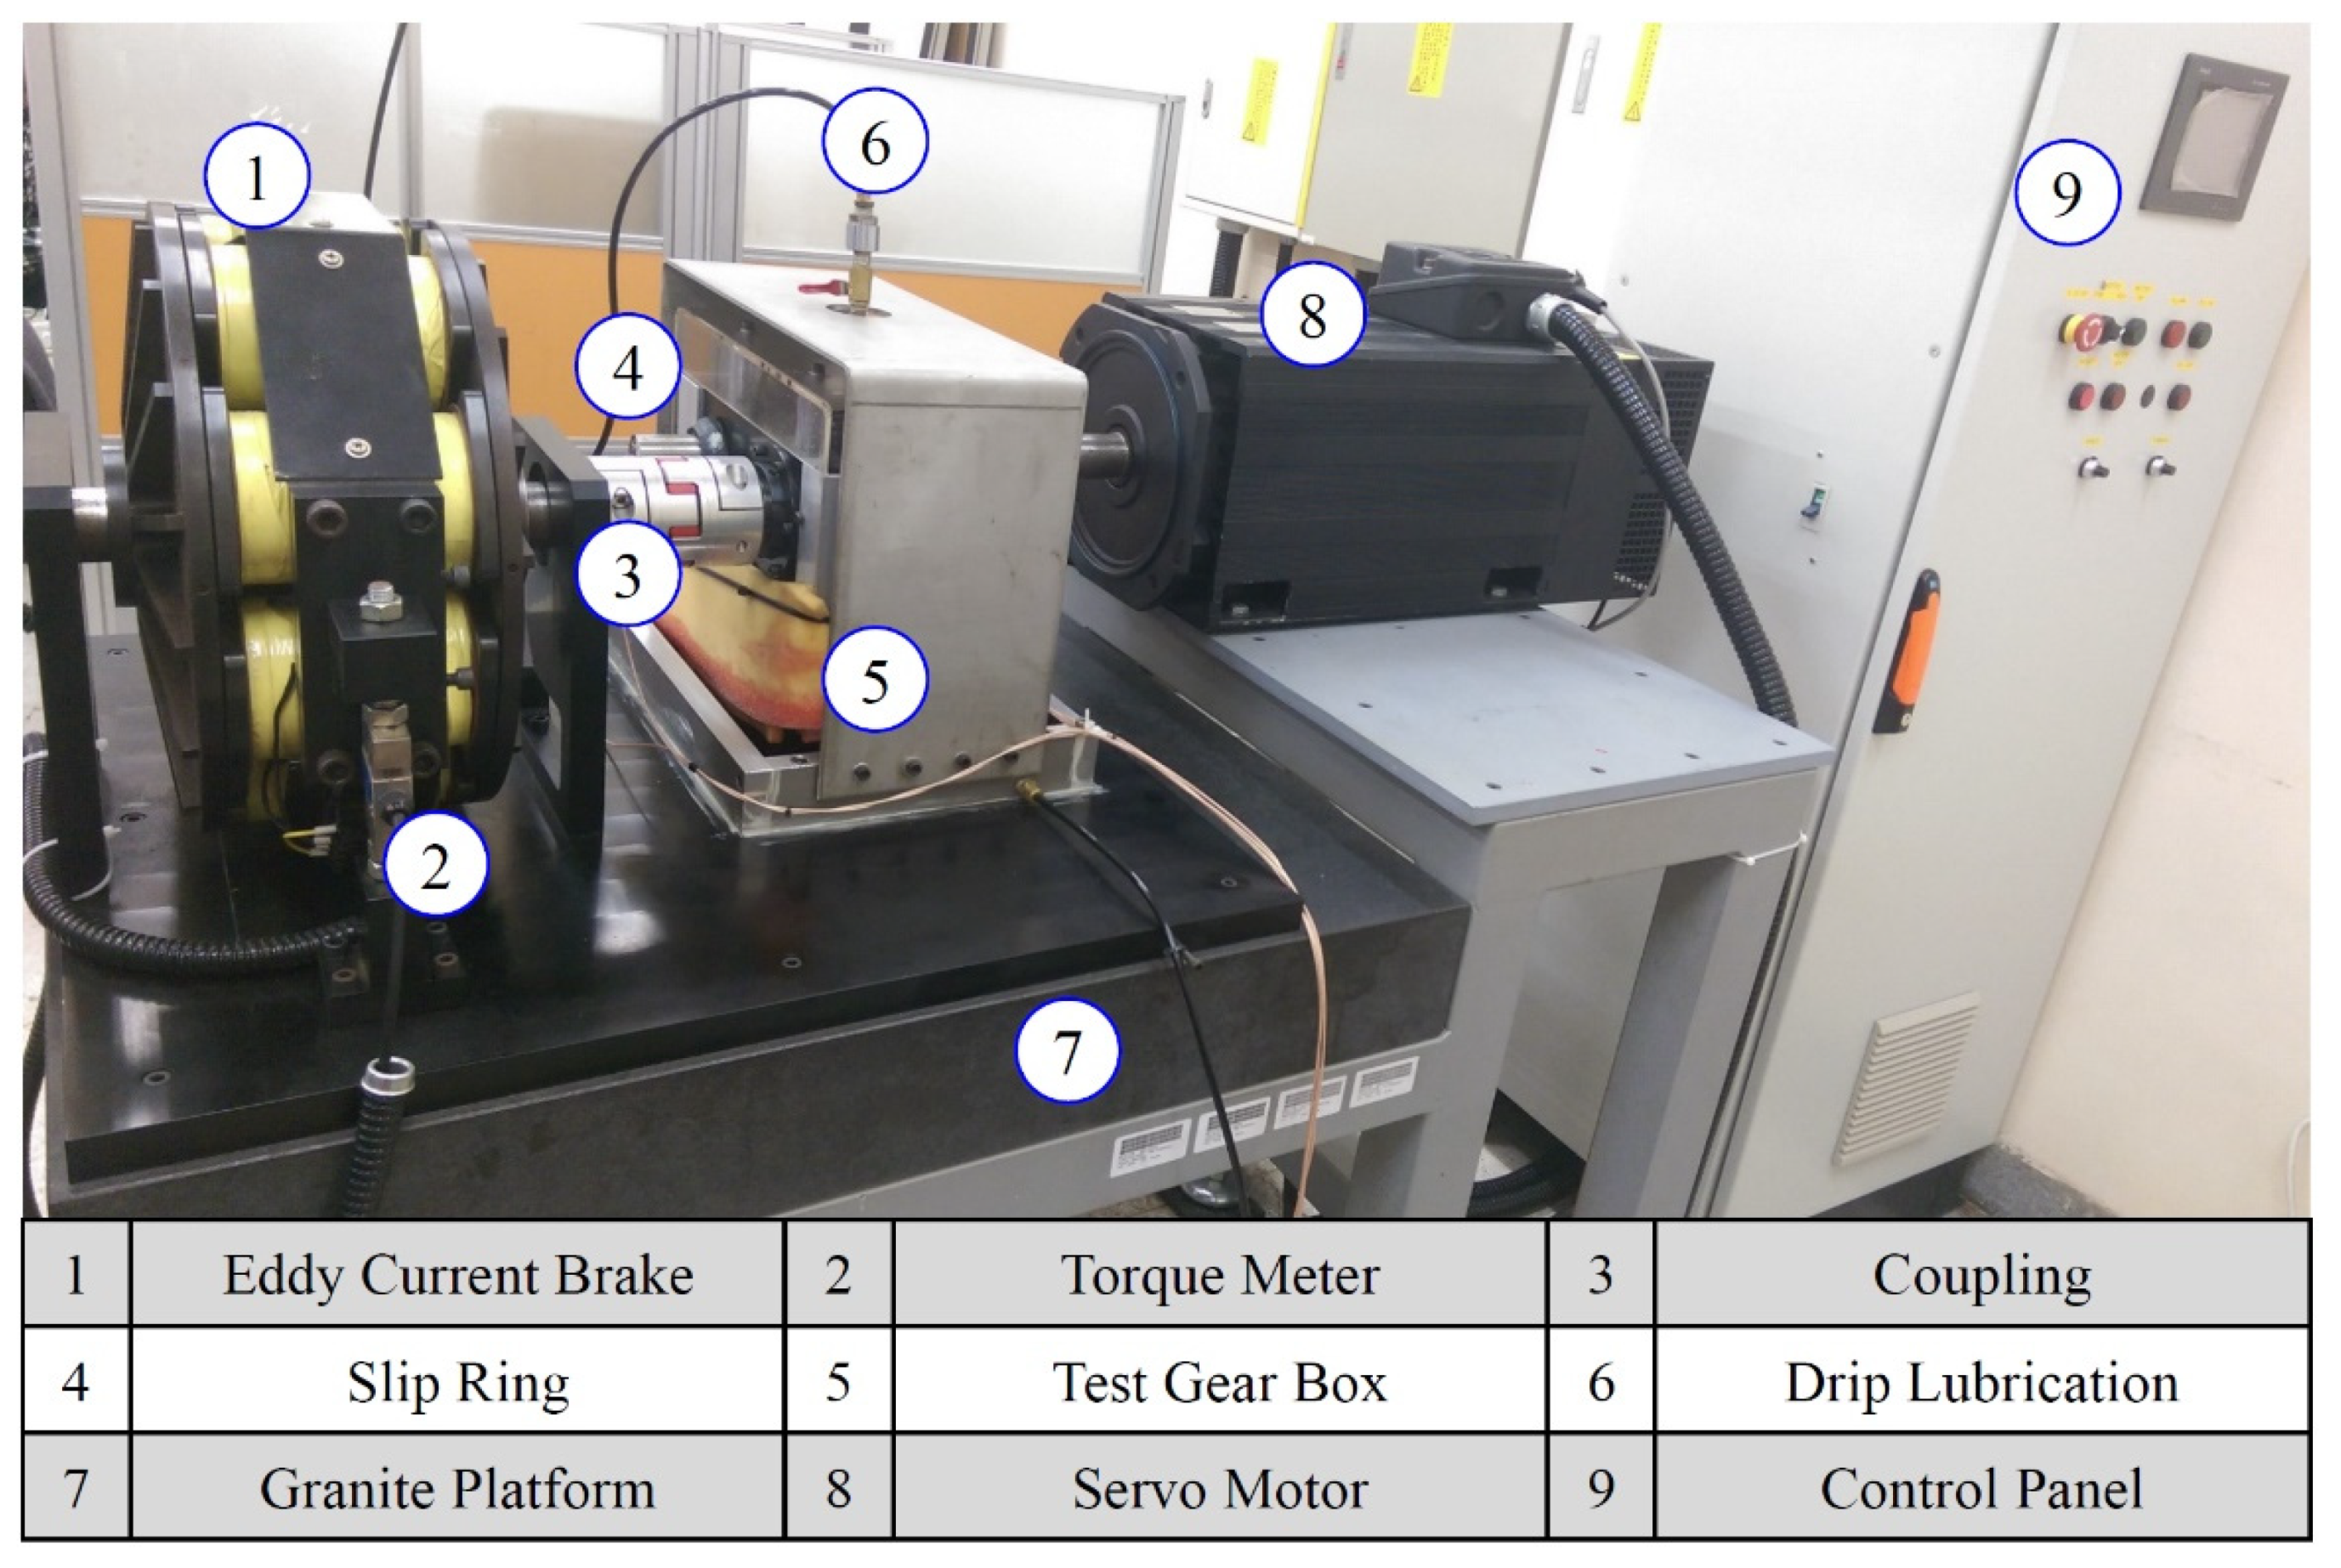
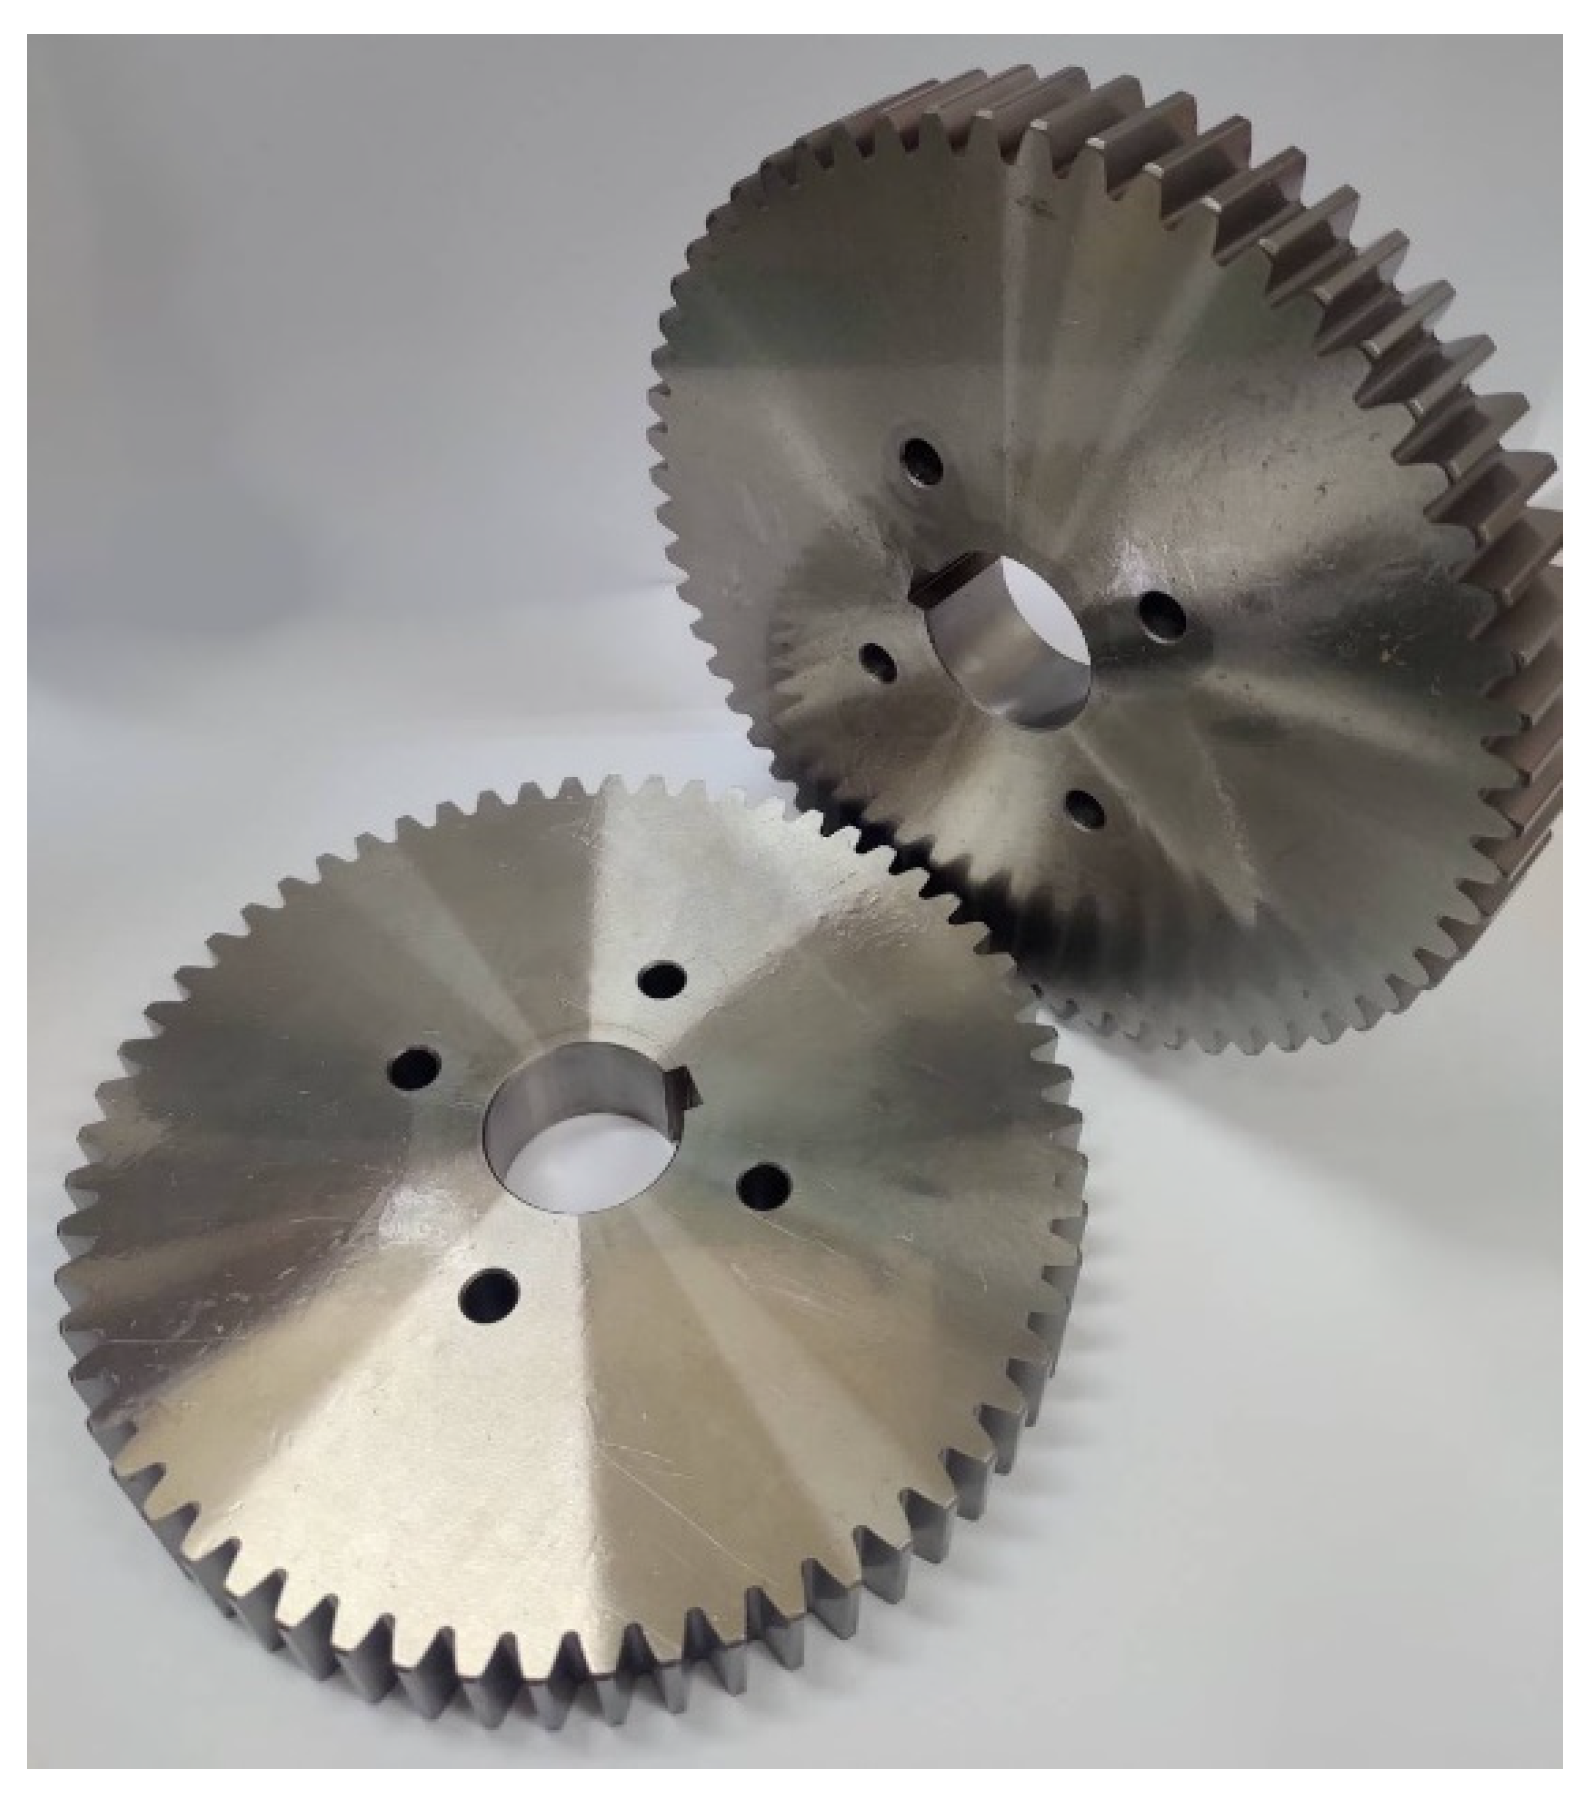
A dynamic gear tester was built for the dynamic experiments, as shown in Figure 7. Powered by a servo motor, the rotational speed can reach up to 4000 rpm, and the load is provided by an eddy current brake. In addition, two accelerometers were mounted on the driving and driven gears, respectively, and a pair of slip rings enabled us to transmit the acceleration signals from the accelerometers to the data acquisition system and PC. A granite platform was used as the base of the dynamic tester. Figure 8 shows the test gear set manufactured according to the parameters listed in Table 1.

Figure 7.
Gear dynamic tester.
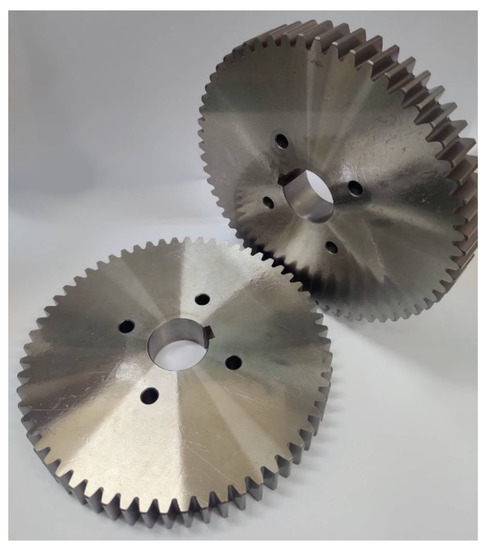
Figure 8.
Test gear pair.
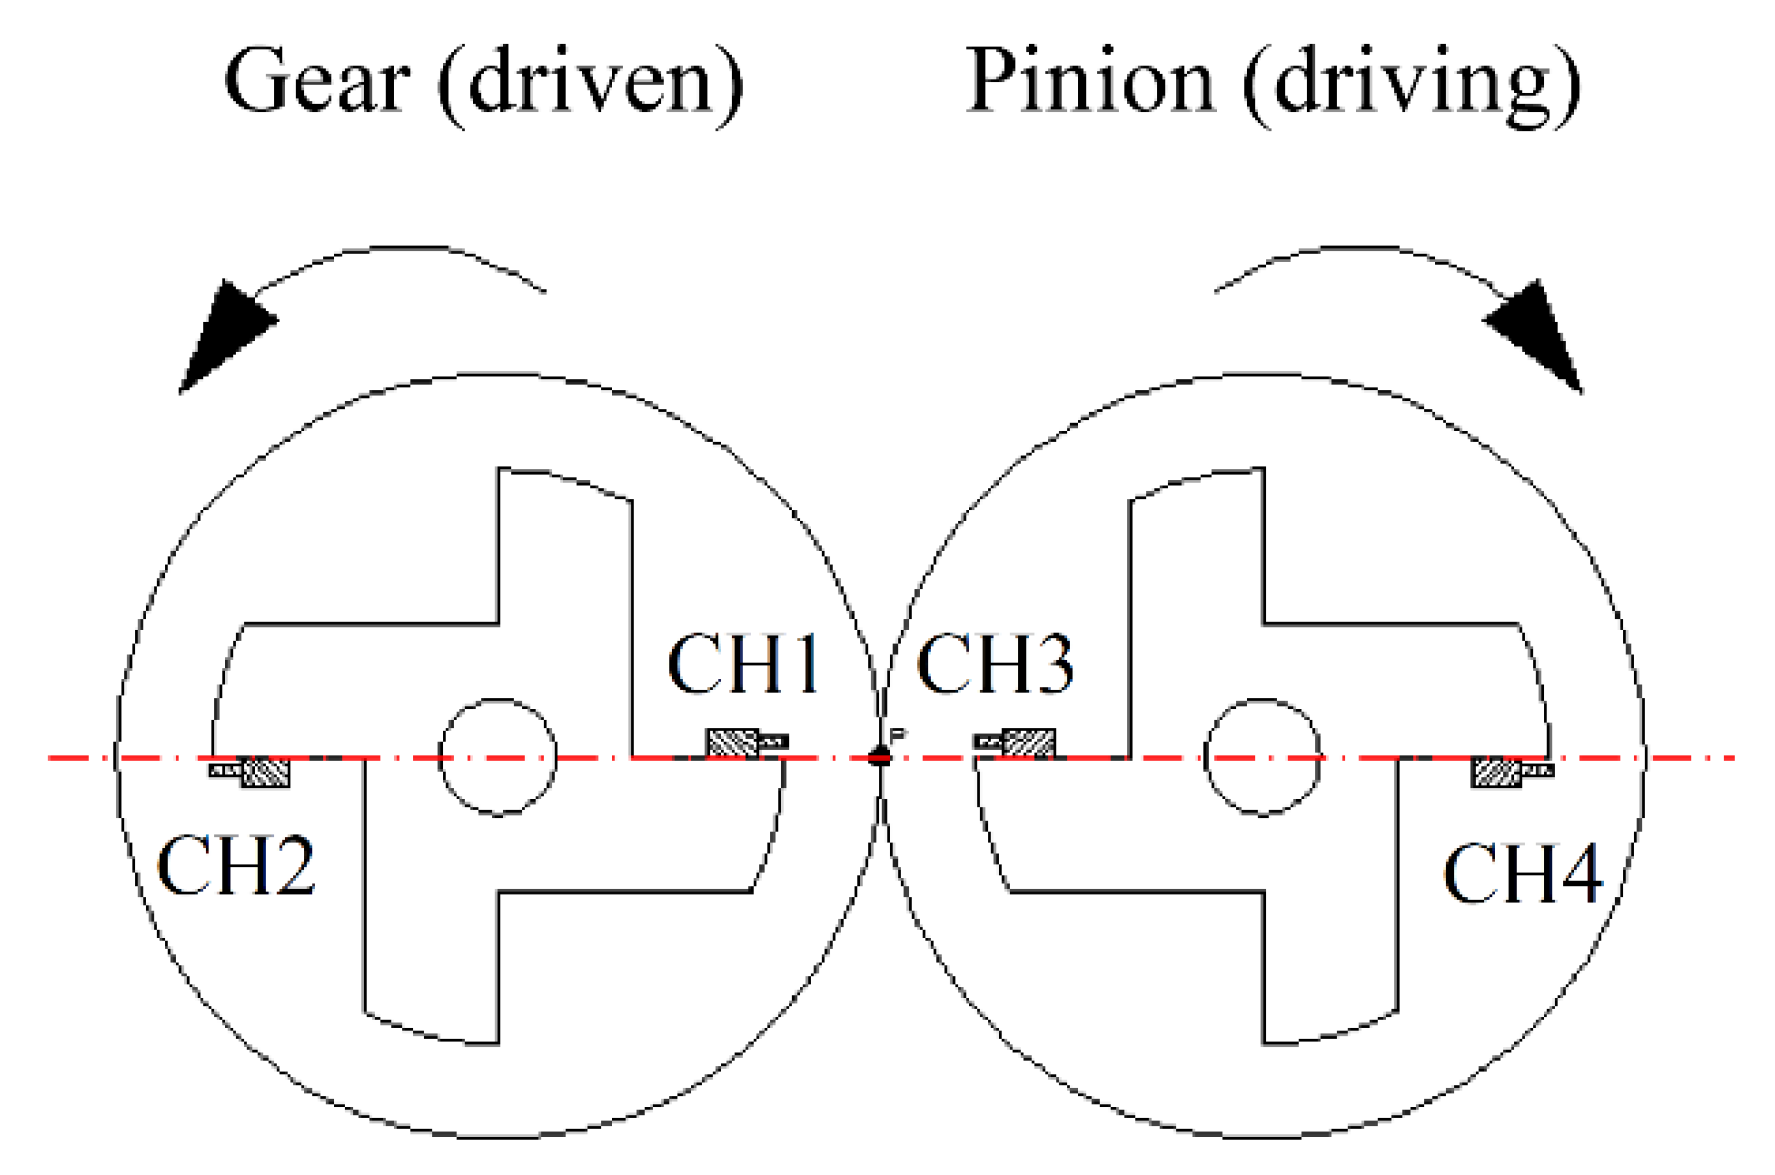
Figure 9 illustrates the arrangement of four accelerometers mounted on the adapter attached to the gear pair. The acceleration along the line of action during meshing can be calculated using the following equations:
where ρ is the mounting radius of the paired accelerometers; a1(t)–a4(t) denote the measured acceleration signals from the four accelerometers; and represent the angular acceleration of the pinion and the gear, respectively; and denotes the acceleration of the transmission error between two gears along the line of action. The acceleration was numerically integrated twice to determine the displacement in order to obtain the experimental DTE signals. A series of experiments were performed to obtain the experimental DTE under various loads and rotational speeds.
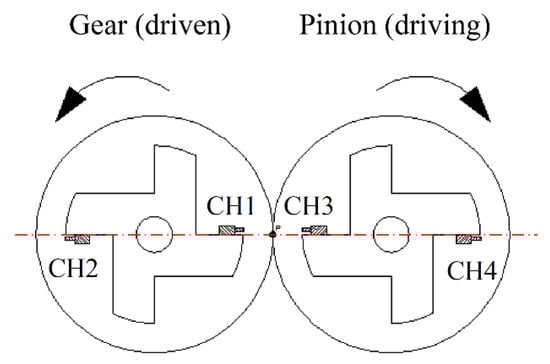
Figure 9.
Illustration of the four mounted accelerometers.
3.2. Experimental DTE
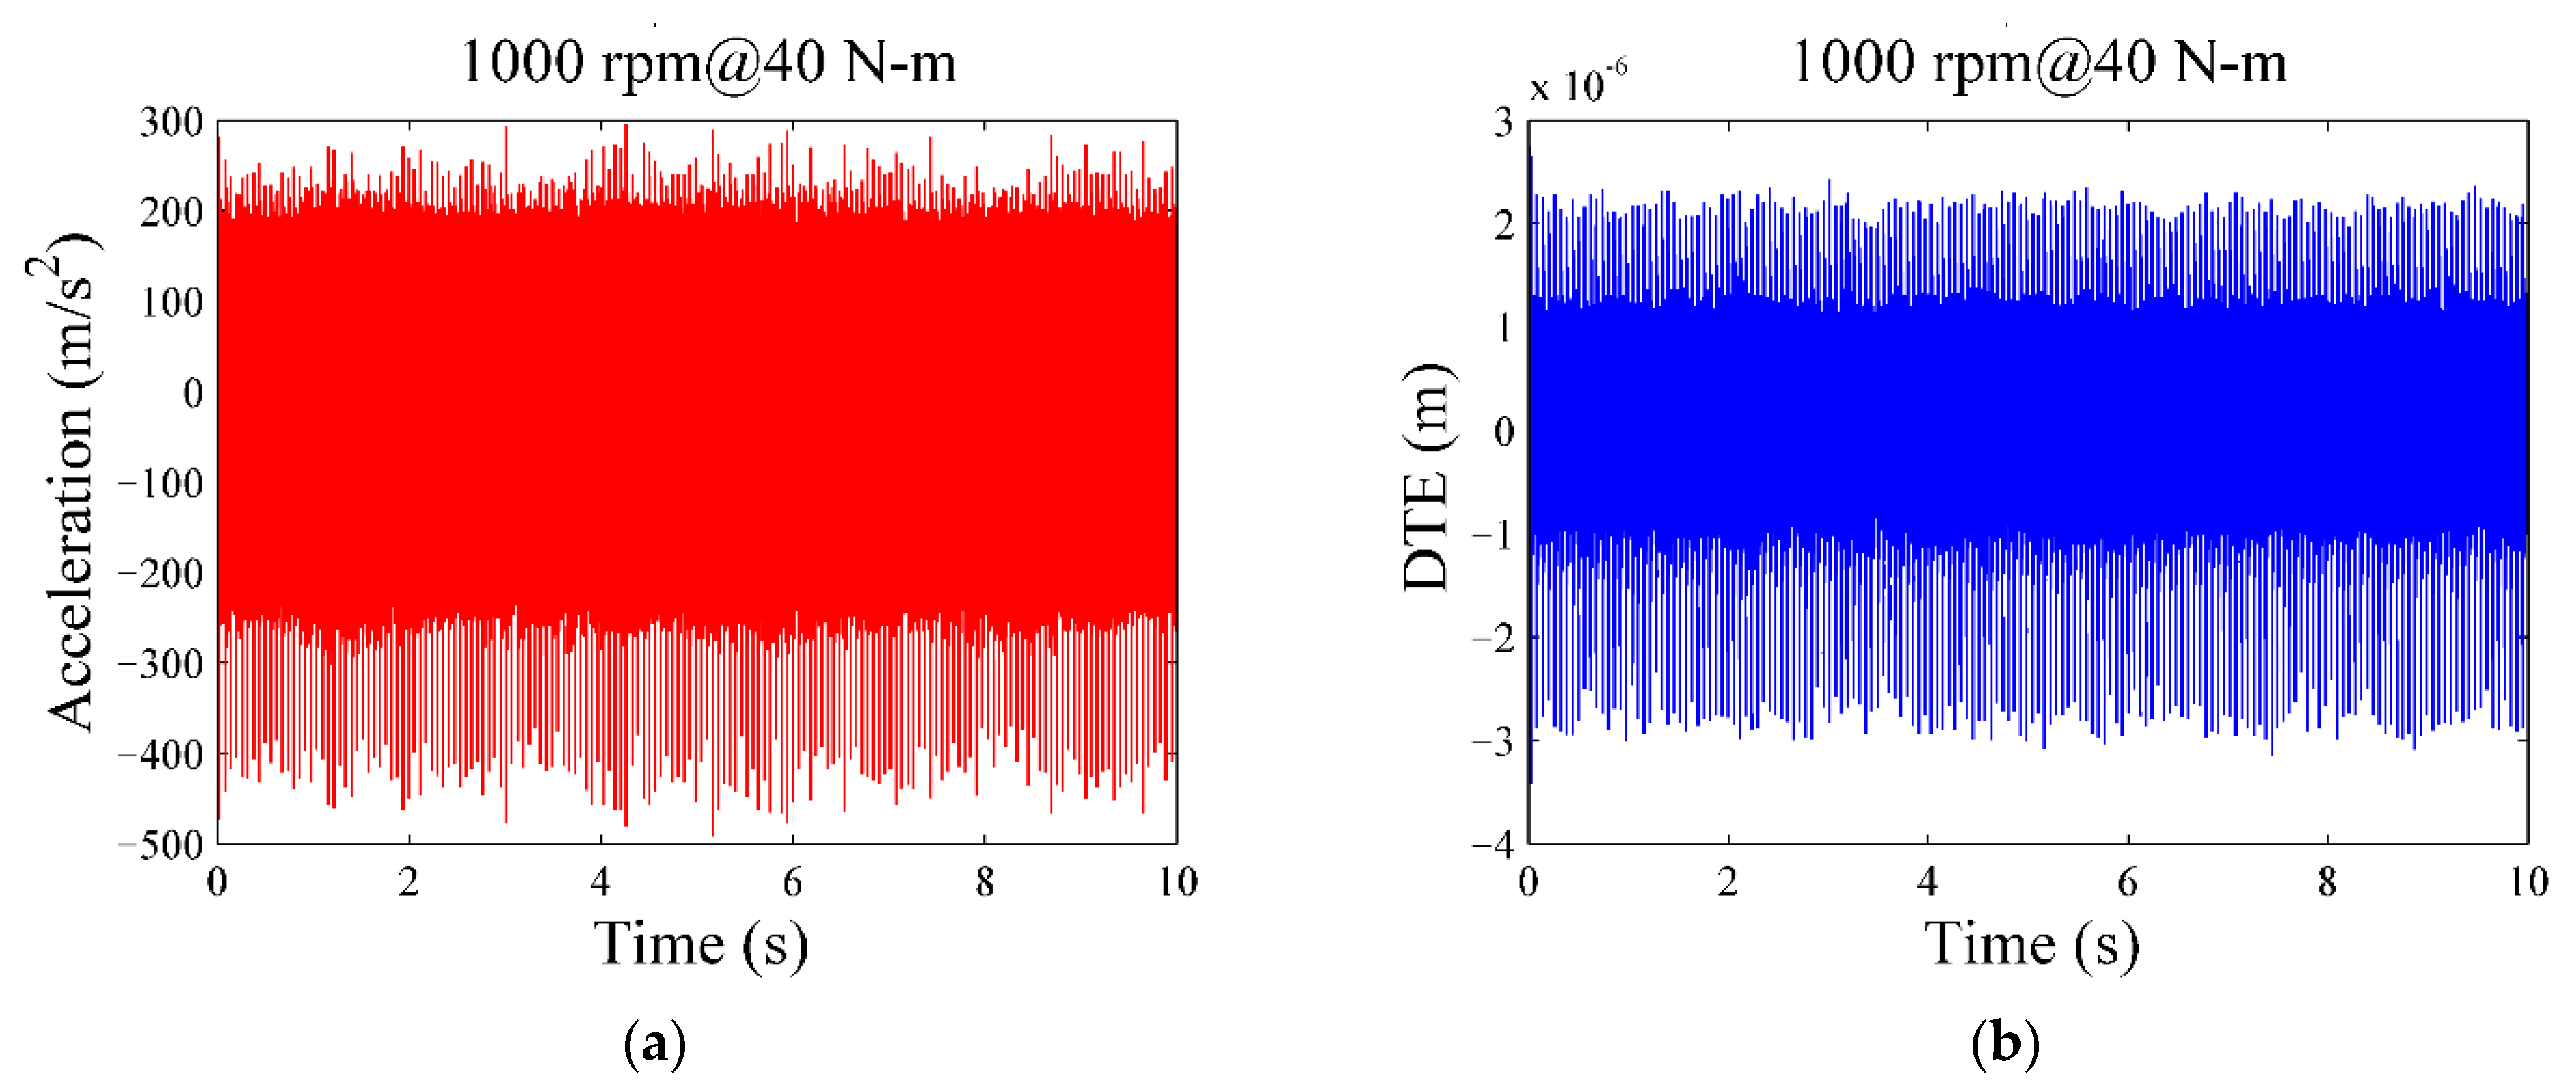
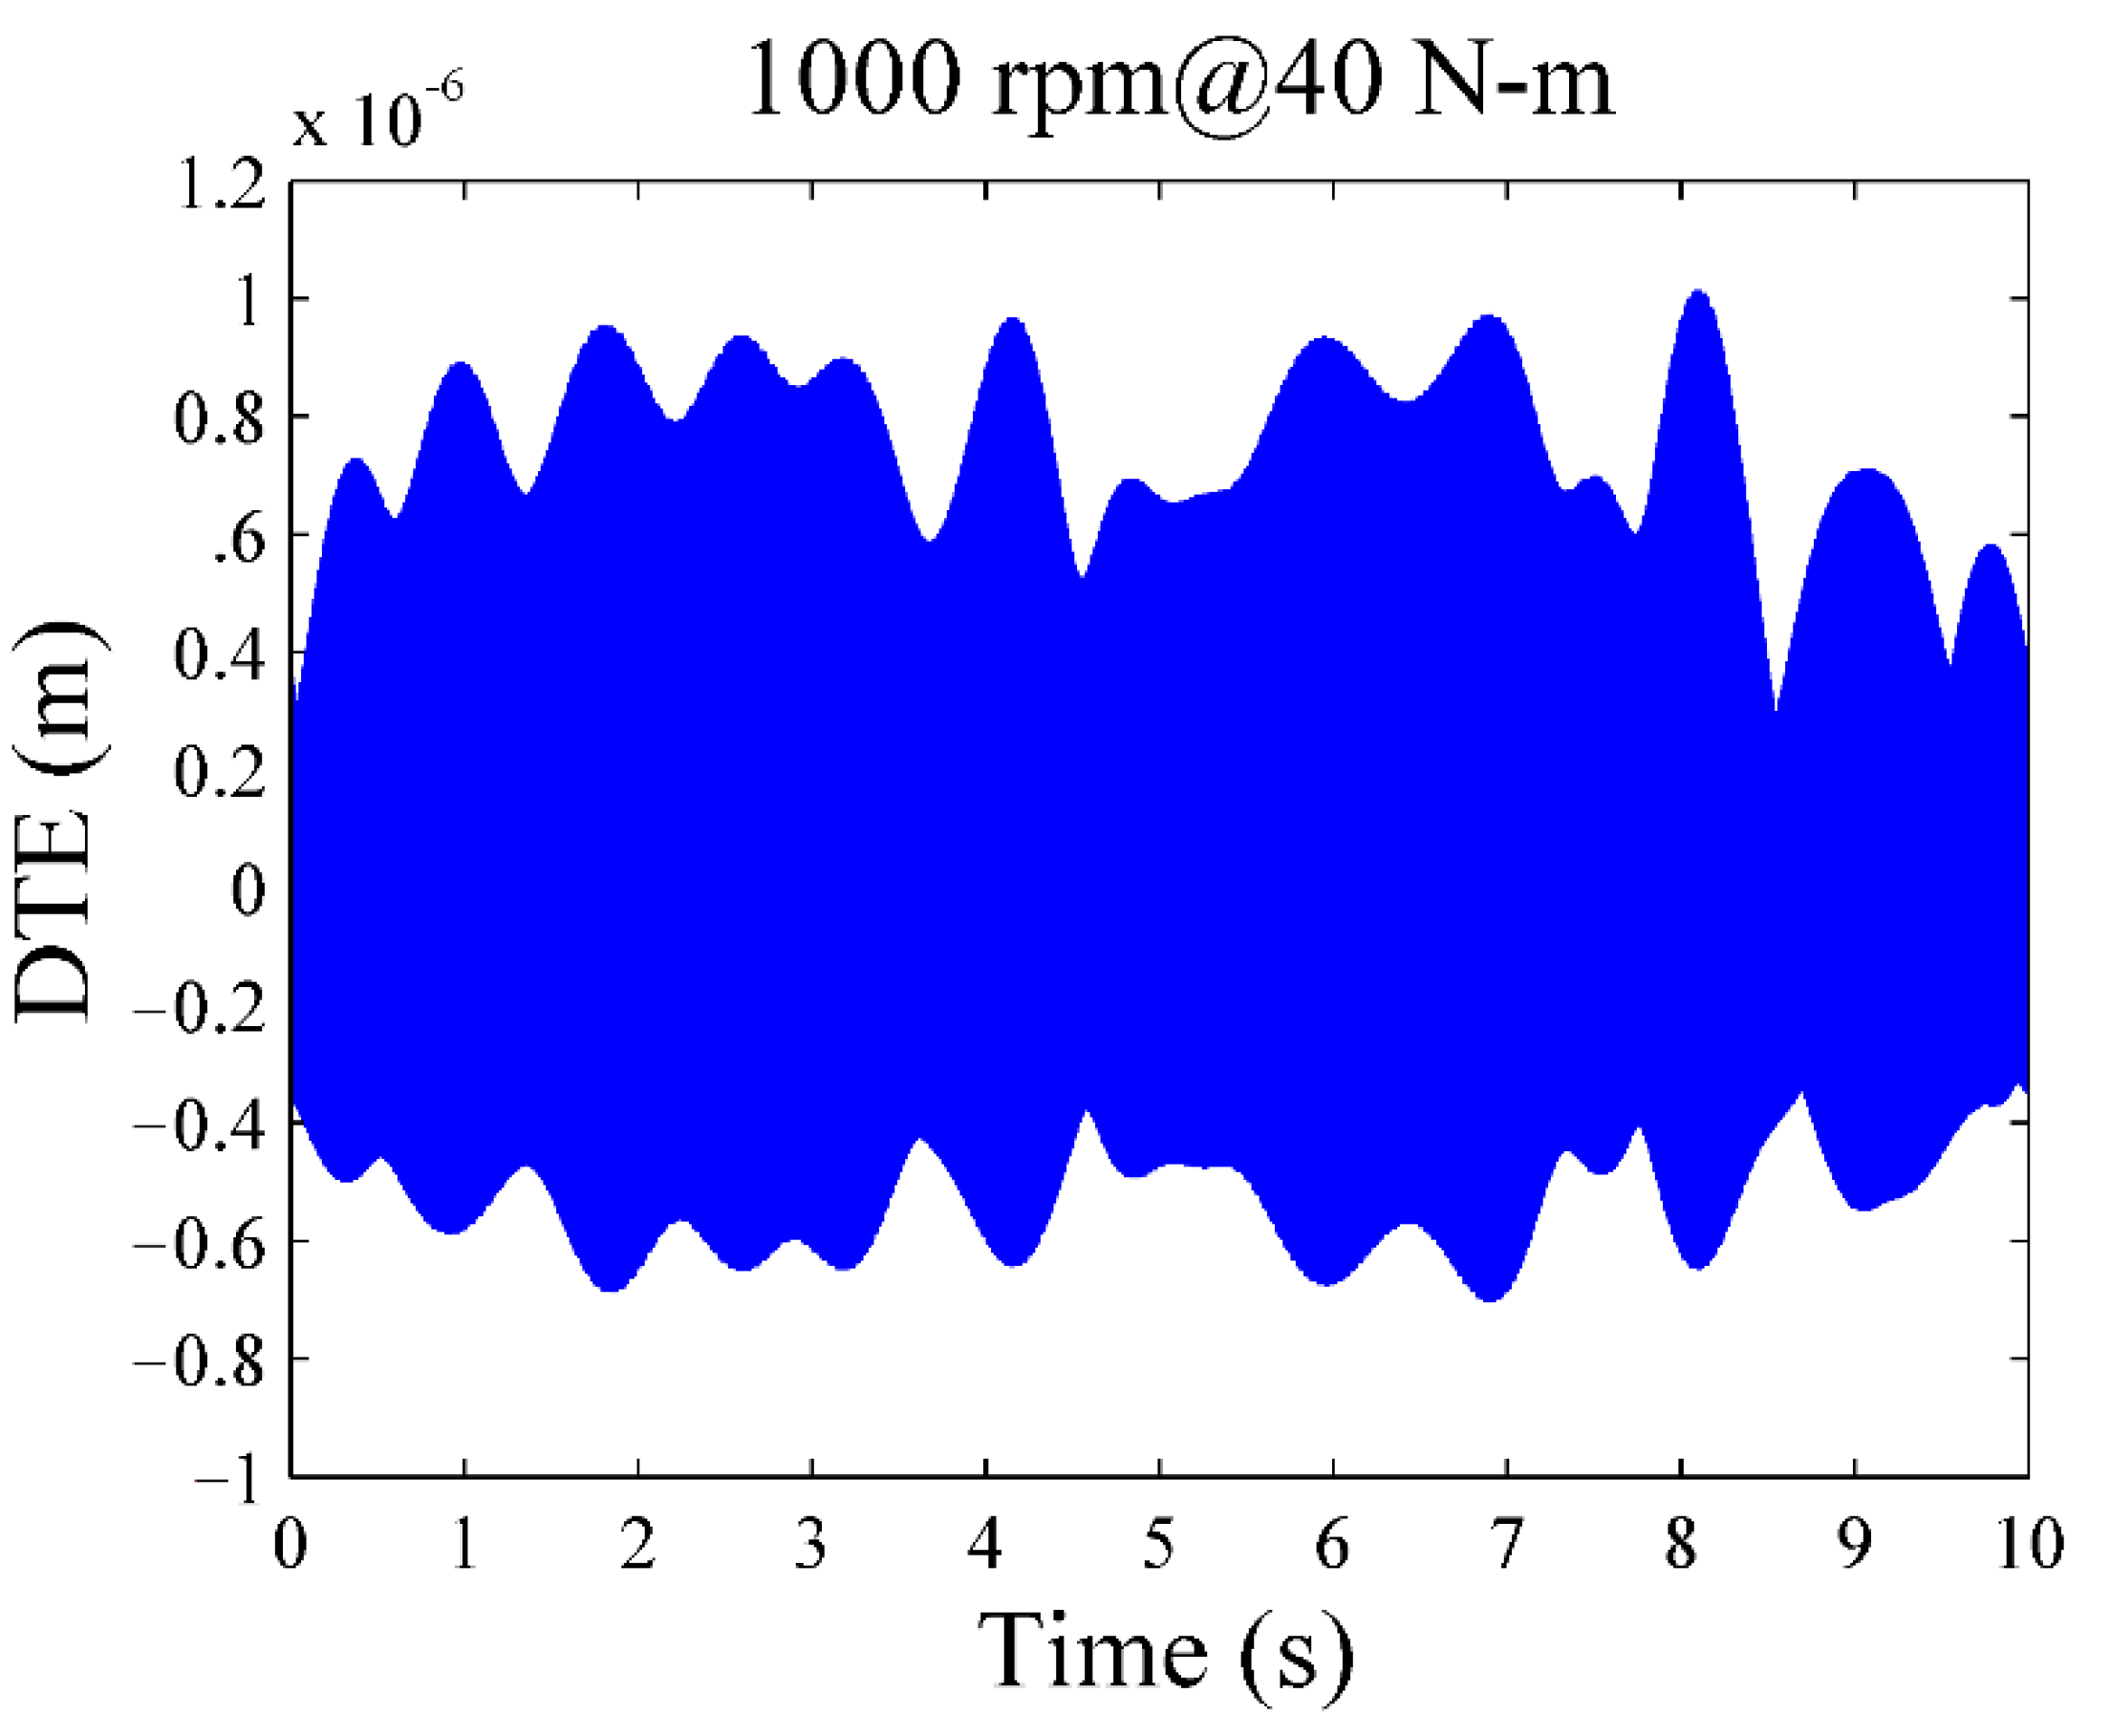
Herein, the acceleration signal measured under 1000 rpm and 40 N-m is used as an example to explain the subsequent signal processing of the experimental accelerations. The acquired acceleration signal in the time domain is shown in Figure 10a. The DTE in the time domain was calculated by numerically integrating the acceleration twice, as shown in Figure 10b.
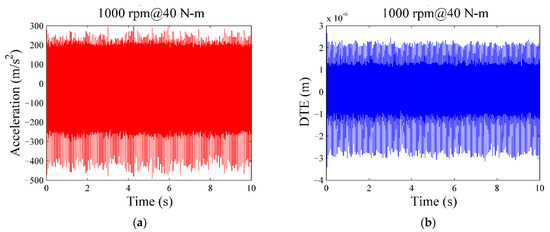
Figure 10.
Experimental signal in the time domain: (a) acceleration; (b) DTE.
Furthermore, a fast Fourier transform (FFT) was applied to obtain the spectrum of acceleration, as shown in Figure 11. For the gear pair, the meshing frequency at 1000 rpm was 1000 Hz. The three major spikes seen in Figure 11 correspond to the meshing frequency of 1000 Hz and its multiples, 2000 and 3000 Hz. The experimental spike that appears at 1003 Hz, instead of the theoretical meshing frequency of 1000 Hz, results from the deviation of the motor speed variation during the experiment.
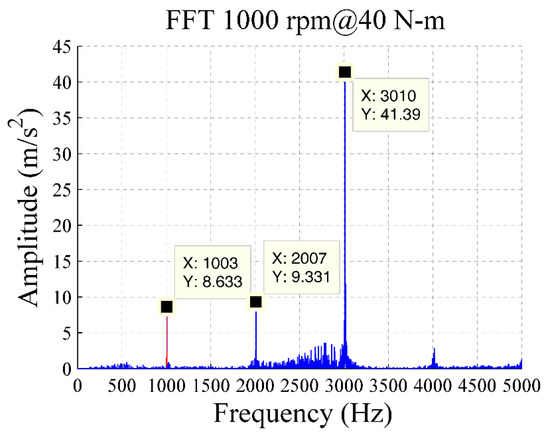
Figure 11.
Spectrum of original acceleration in the frequency domain.
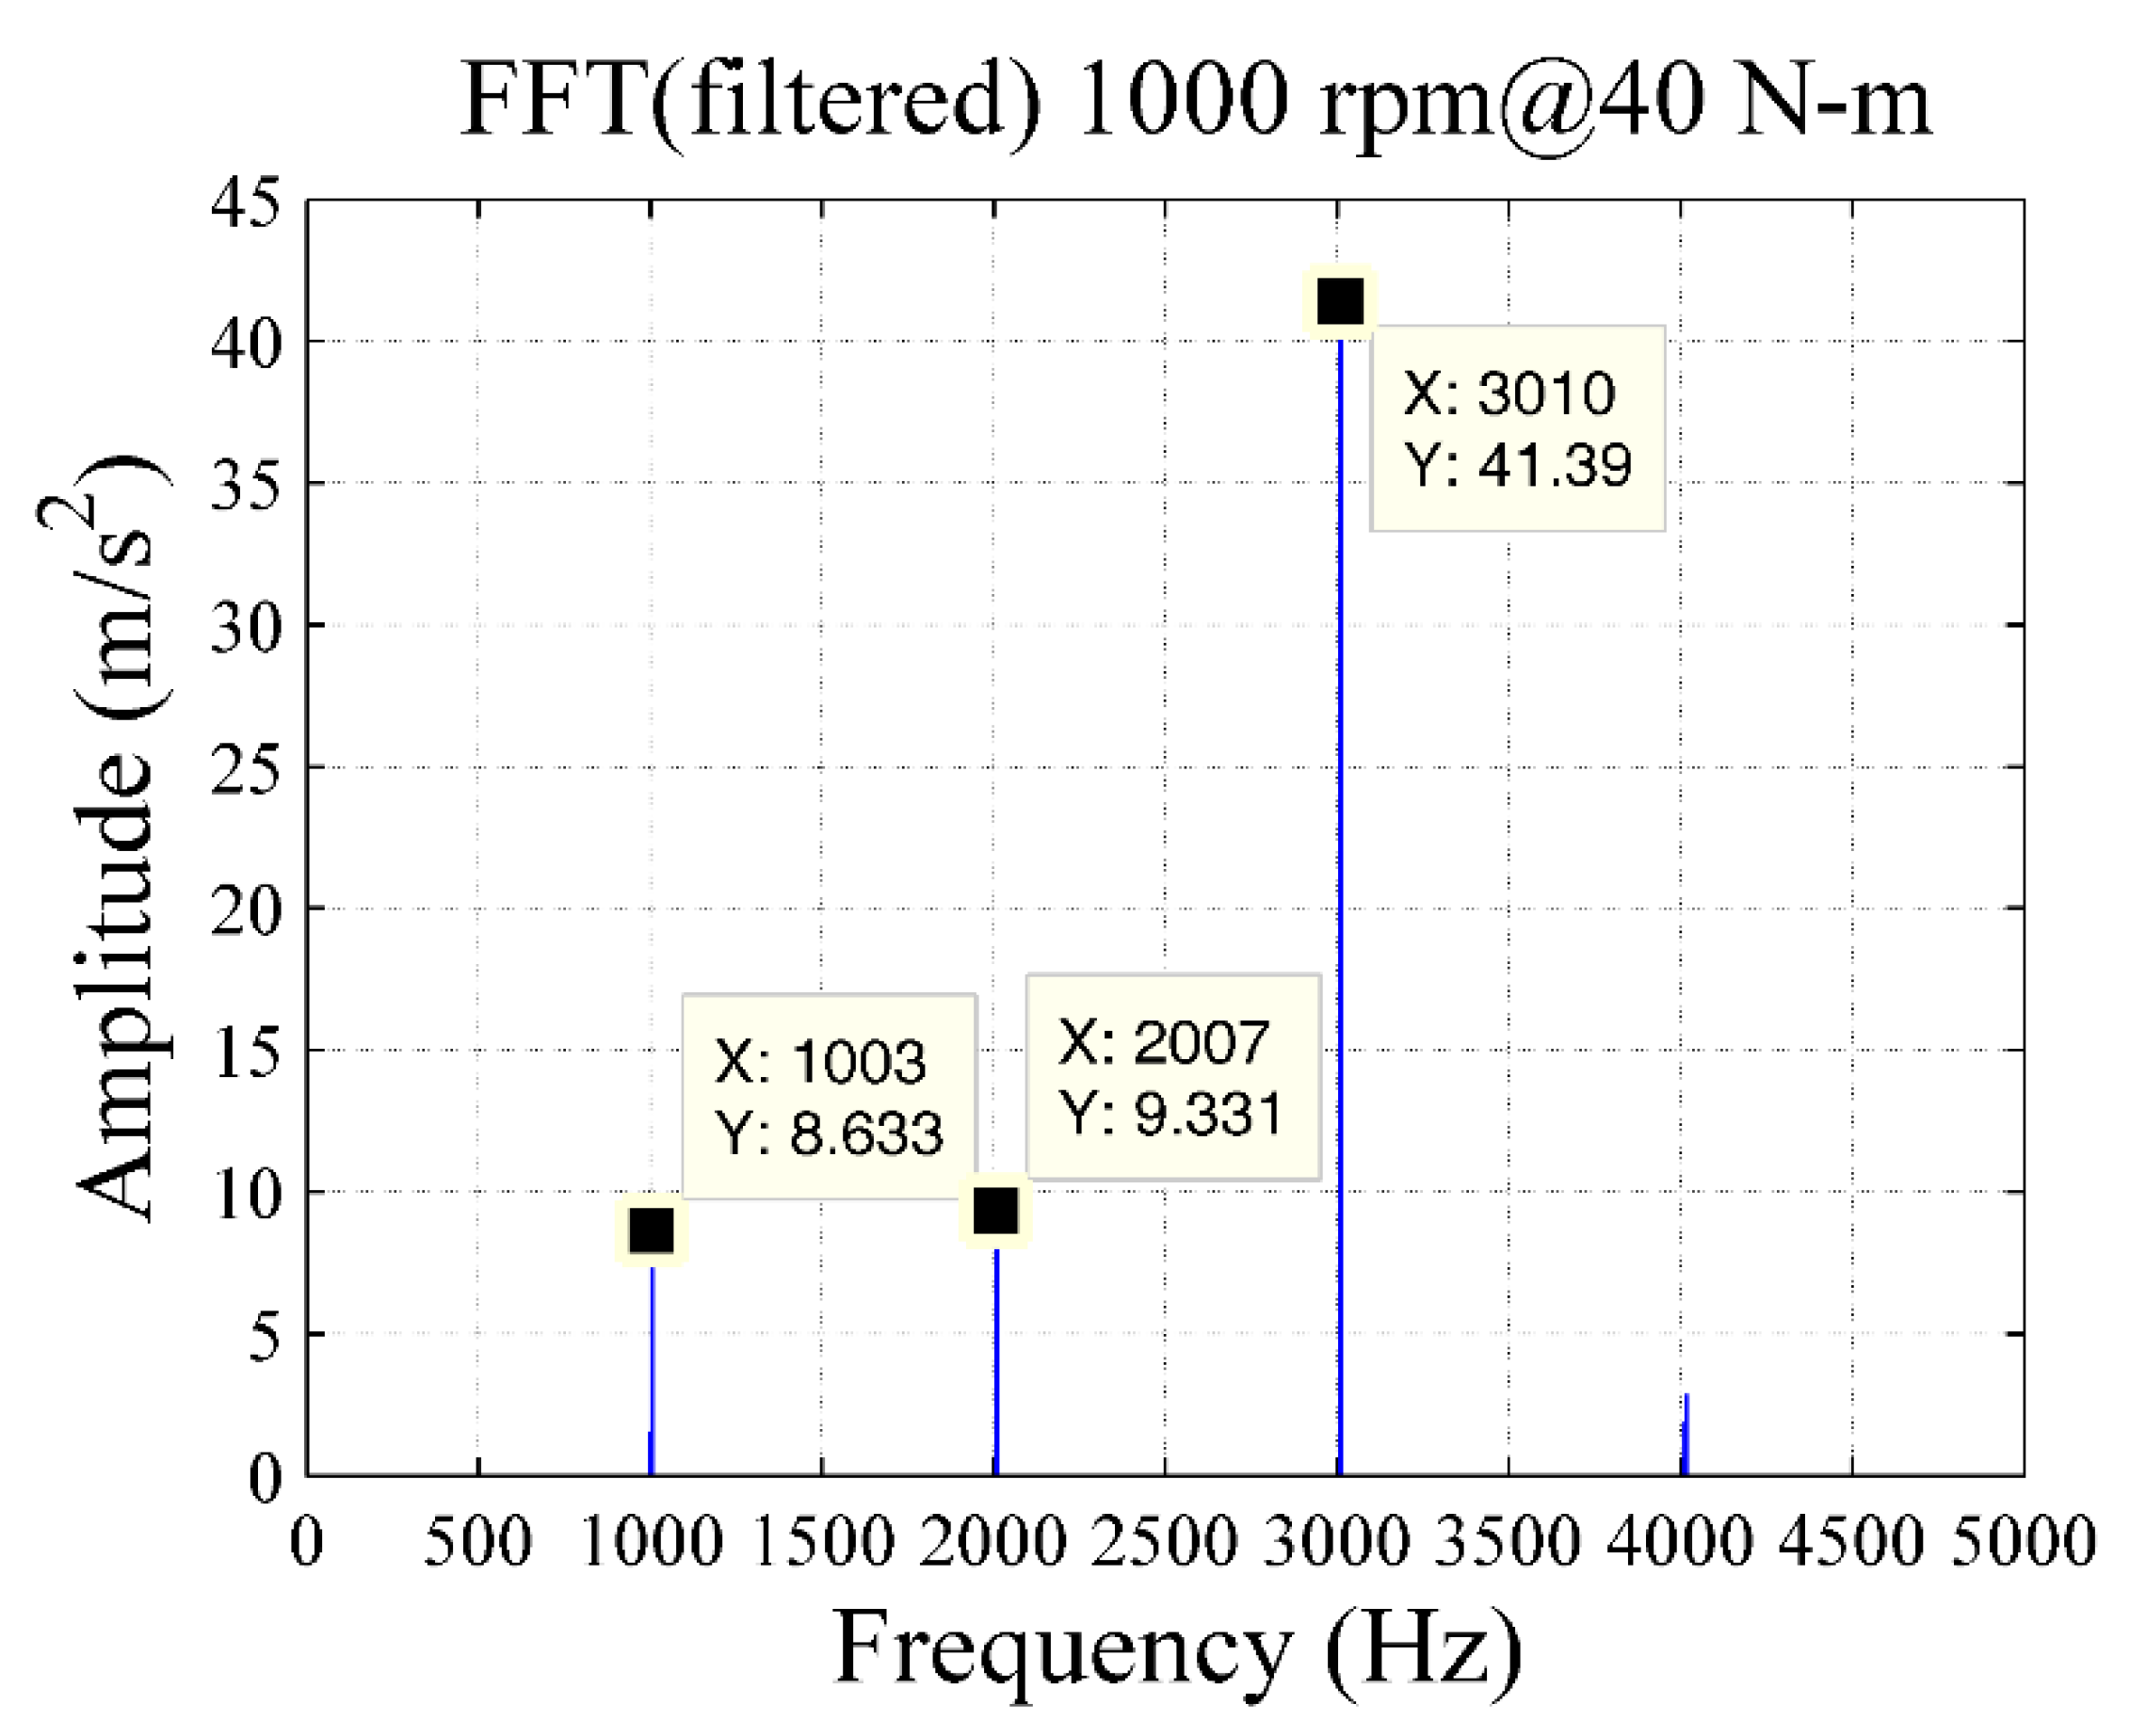
Various noise sources are present at these main characteristic frequencies, which affect the subsequent calculation of dynamic characteristics. Therefore, filtering was applied to remove unnecessary noise. First, in the time domain, a band-pass Butterworth filter with a lower cutoff frequency of 100 Hz and a higher cutoff frequency of 5000 Hz was applied to filter out the noise of the original acceleration signals. Then, the time-domain signal was converted into frequency-domain by using FFT. In addition, the gear meshing frequencies under every rotational speed were calculated. Various band-pass filters were designed with different center frequencies of one to ten times the meshing frequency and with a bandwidth of 2 Hz. Then, the spectrum of filtered acceleration signals in the frequency domain was obtained; it is shown in Figure 12.
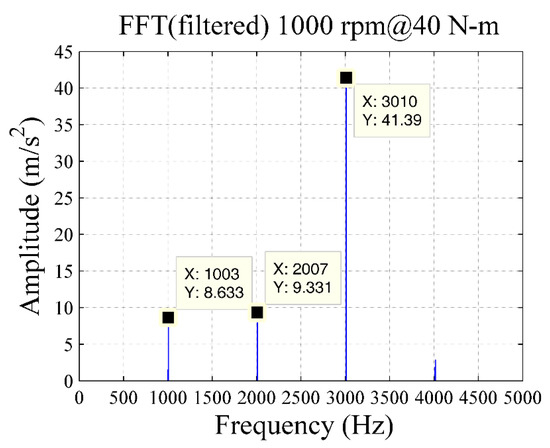
Figure 12.
Spectrum of filtered acceleration in the frequency domain.
A frequency-domain integration with various band-pass filters was used to convert acceleration signals into displacement signals by inverse FFT. Figure 13 shows the obtained filtered DTE in the time domain. Finally, on the basis of Equation (4), the experimental RMS of the DTE in the time domain was calculated. In this numerical example, the RMS of the DTE was calculated as 0.358 μm at 1000 rpm and with a loading of 40 N-m. Then, the value of DTE was used as a criterion to judge the level of gear pair vibration at a specific meshing condition.

Figure 13.
Filtered DTE signal in the time domain.
4. Model Verification and Discussion
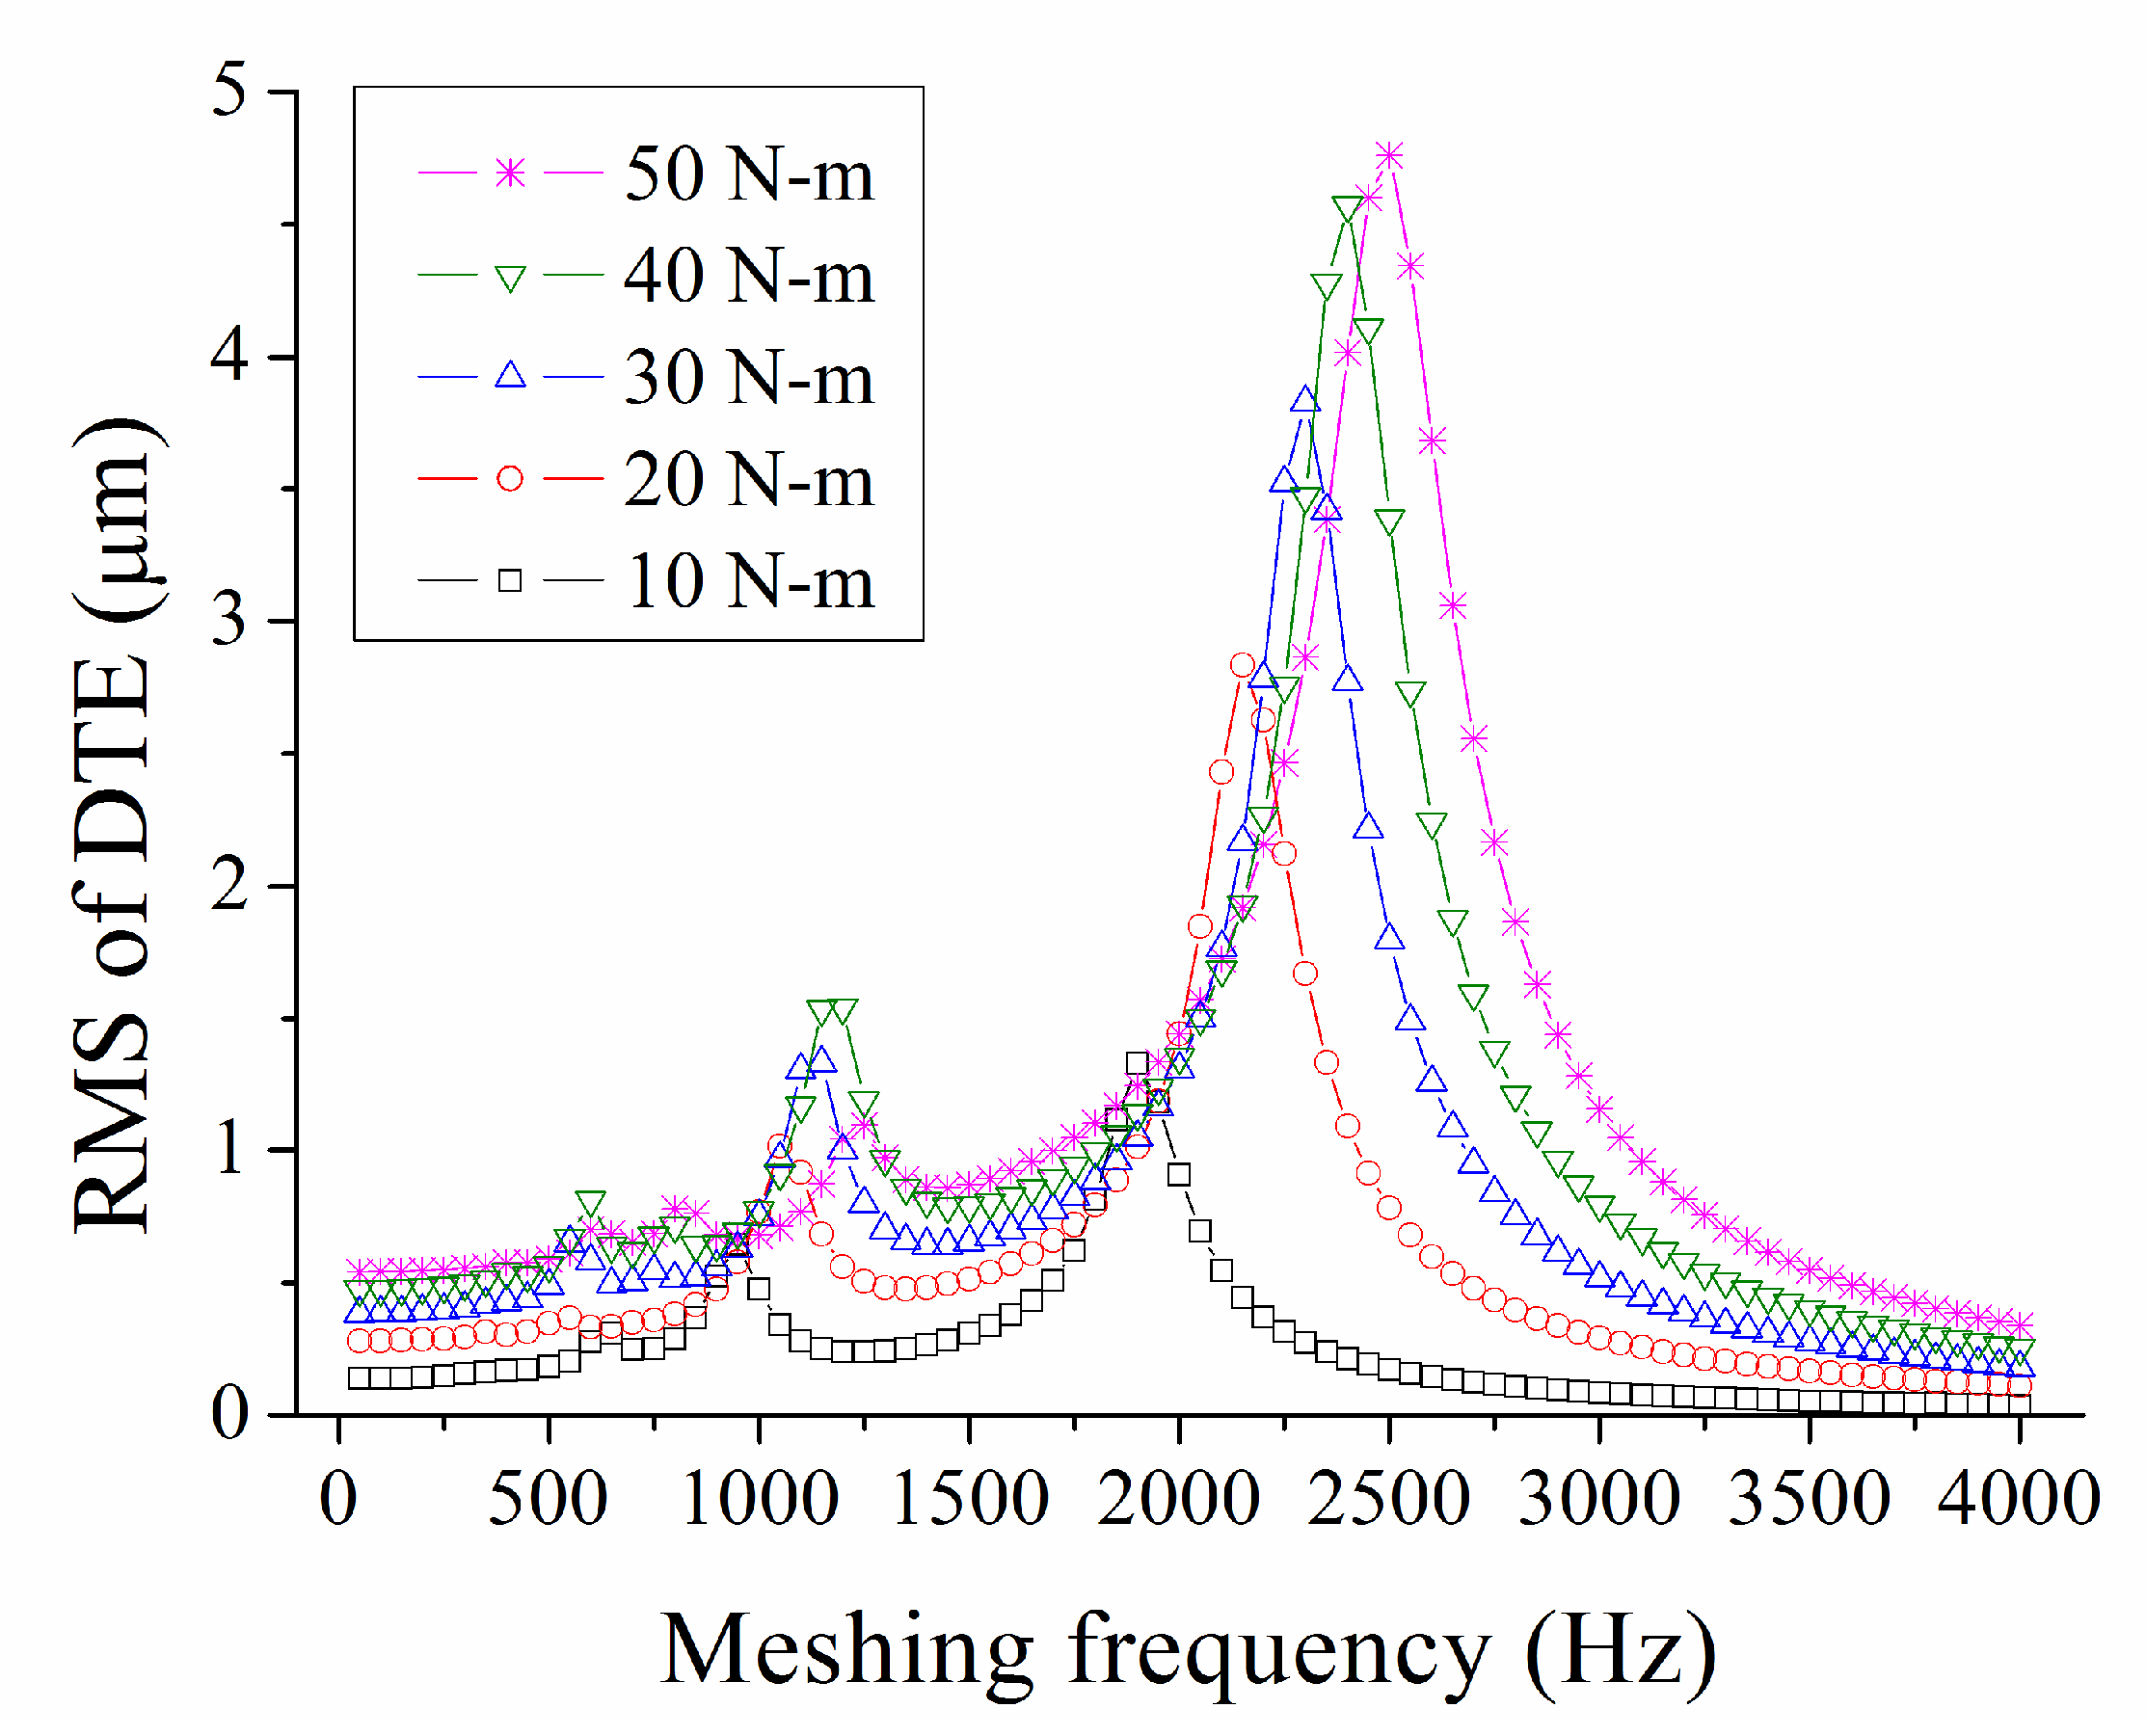
Figure 14 shows the RMS curves of the simulated DTE under loads ranging from 10 to 50 N-m and speeds ranging from 50 to 4000 rpm. The abscissa is the meshing frequency (the same value as the rotational speed of the gear pair), and the ordinate is the RMS of the DTE. Figure 14 reveals that the maximum value of each curve (fixed load) occurred at approximately 2000–3000 Hz, which is the natural frequency range of the gear pair under each operating condition. The peak magnitudes of simulated DTEs at the natural frequencies for each curve increased as the load was increased from 10 to 50 N-m, indicating that gear pair vibration increases with load.

Figure 14.
Simulated RMS of DTEs.
Figure 15 shows the RMS curves of the experimental DTE under various speeds and loads. Owing to the power limitation of the driving servo motor, the limit of the operating condition of our gear tester was 2700 rpm and 50 N-m. Therefore, experiments for rotational speeds exceeding 2700 rpm at 50 N-m could not be conducted. Figure 15 shows the spikes near the natural frequencies for the five experimental DTE curves (10–50 N-m).
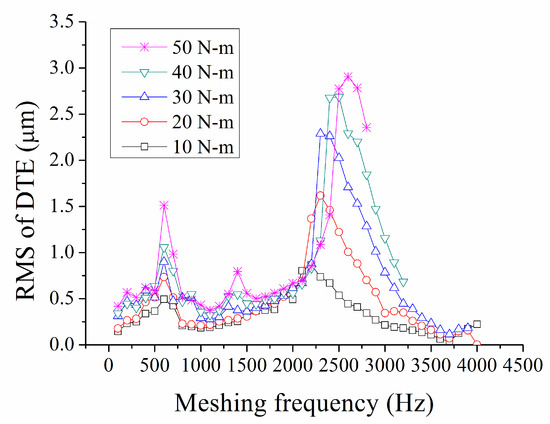
Figure 15.
Experimental RMS of DTEs.
Our experimental DTE results for the spur gear pair were highly consistent with the simulation results, as confirmed by a comparison of the results shown in Figure 14 and Figure 15. Because the influence of backlash was not considered in the dynamic model, the obtained dynamic responses of simulation results are almost linear, as shown in Figure 14. In addition, the experimental results shown in Figure 15 also revealed a nearly linear dynamic response, similar to the simulation results. The simulation results were in good agreement with the experimental results. Moreover, the simulation and experiments indicated a general tendency of increased gear vibration with an increase in load from 10 to 50 N-m. The overall natural frequencies of the gear pair in the simulation results were slightly lower than those in the experimental results. For example, the experimental natural frequency under a load of 50 N-m was 2600 Hz, whereas the simulated natural frequency was approximately 2500 Hz, with a deviation of 6.1%. The differences between the experimental and simulated natural frequencies from 10 N-m to 50 N-m were in the range of 2–13%. Table 2 summarizes all simulation and experimental results.
Table 2.
Dynamic analysis and experimental results.
The maximum value at the natural frequency represents the extent of gear pair vibration. Table 2 lists the simulation and experimental results related to dynamic characteristics. The natural frequencies from the simulation and experiments in Table 2 are taken from the frequencies where the maximum occurs for each DTE curve in Figure 14 and Figure 15. The results show that although the simulation values were higher than the experimental values, the difference under the five loading conditions was approximately 35–43%, and the difference in each condition was stable. The reason for the difference is that the simulation results were obtained directly from the DTE between the gear pairs, whereas the experimental results were obtained from the acceleration signals measured by the four accelerometers mounted on the adapter. As such, some energy may have been lost during measurement, resulting in differences between the simulated and experimental values. However, because the numerical differences between the two results were stable, the tendencies of the two results can be regarded as consistent.
The simulation methodology proposed in this study can be used to predict the dynamic characteristics of the spur gear pair, enabling us to accurately determine the dynamic behavior in the design stage. Therefore, a reliable and efficient design simulation method for predicting the static and dynamic behavior of a modified spur gear pair is proposed in this study.
5. Conclusions
In this study, a simulation methodology was proposed for a modified spur gear pair with linear tip relief and longitudinal crowning. Simulations for a gear mathematical model, TCA, finite element mesh generation program, LTCA, mesh stiffness, and DTE were performed, and the numerical results were presented. In addition, a gear dynamic tester was constructed, and a series of gear dynamic experiments were performed. The simulated and experimental results were compared, including the RMS of DTEs and the natural frequency of the spur gear pair, under five loading conditions and various rotational speeds. The following conclusions can be drawn:
- On the basis of the mathematical model developed in this study, mesh generation codes, FEA, and static LTCA of a modified spur gear pair were performed to predict the contact stress, contact patterns, and time-varying mesh stiffness under various loads.
- A dynamic model for a spur gear pair was presented to solve DTEs under various speeds and loads.
- For experimental determination of the dynamic characteristics, a parallel-axis gear dynamic tester was constructed and used for the modified spur gear pair with various speeds and loads. After signal processing, the experimental DTE signals were calculated; the experimental RMS of the DTE was also calculated and plotted. The text continues here.
- A comparison of the simulation and experimental results revealed that the predicted natural frequencies were similar to those determined in the experiments. In addition, the patterns of the simulated and experimental RMS curves were consistent. As the load was increased, the DTE at the natural frequency gradually increased. In general, the difference in the natural frequencies between simulation and experimental results was approximately 2–13%.
- The simulation methodology presented in this study can predict the dynamic characteristics of the modified spur gear pair under various operational conditions. Therefore, a reliable and efficient design simulation method for predicting the static and dynamic behaviors of a modified spur gear pair is proposed in this study. Further integration of the proposed simulation program with optimization will be performed in future studies.
Author Contributions
Conceptualization, Z.-G.W., C.-C.L. and Y.-C.C.; methodology, Z.-G.W. and C.-C.L.; software, Z.-G.W. and C.-C.L.; validation, Z.-G.W., C.-C.L. and Y.-C.C.; formal analysis, Z.-G.W.; investigation, Z.-G.W. and Y.-C.C.; resources, Z.-G.W. and Y.-C.C.; data curation, Z.-G.W. and C.-C.L.; writing—original draft preparation, Z.-G.W. and Y.-C.C.; writing—review and editing, Z.-G.W., C.-C.L. and Y.-C.C.; supervision, Y.-C.C.; project administration, Y.-C.C. All authors have read and agreed to the published version of the manuscript.
Funding
This research was funded by the Ministry of Science and Technology (MOST) of Taiwan, grant number MOST 110-2221-E-008-080 and MOST-108-2623-E-008-003-D.
Data Availability Statement
Not applicable.
Acknowledgments
The authors would like to thank the Ministry of Science and Technology (MOST) of Taiwan for their financial support in this research.
Conflicts of Interest
The authors declare no conflict of interest.
References
- Smith, J.D. Gear Noise and Vibration, 2nd ed.; Marcel Dekker: New York, NY, USA, 2003. [Google Scholar]
- Smith, R.E. Solving Gear Noise and Vibration Problems; American Gear Manufacturers Association: Alexandria, VA, USA, 1985. [Google Scholar]
- BS 436-2; Spur and Helical Gears Part 2: Basic Rack Form, Modules and Accuracy (1 to 50 Metric Module). British Standards Institution (BSI): London, UK, 1970.
- ISO 6336-1; Calculation of Load Capacity of Spur and Helical Gears—Part 1: Basic Principles, Introduction and General Influence Factors. International Standard Organization (ISO): Geneva, Switzerland, 2006.
- AGMA 109.16; Profile and Longitudinal Corrections on Involute Gears. American Gear Manufacturers Association (AGMA): Chicago, IL, USA, 1965.
- Litvin, F.L. Theory of Gearing; National Aeronautics and Space Administration, Scientific and Technical Information Division: Washington, DC, USA, 1989. [Google Scholar]
- Litvin, F.L.; Fuentes, A. Gear Geometry and Applied Theory, 2nd ed.; Cambridge University Press: New York, NY, USA, 2004. [Google Scholar]
- Tsay, C.B. Helical Gears with Involute Shaped Teeth: Geometry, Computer Simulation, Tooth Contact Analysis, and Stress Analysis. J. Mech. Trans. Automation. 1988, 110, 482–491. [Google Scholar] [CrossRef]
- Chen, Y.C.; Tsay, C.B. Stress Analysis of a Helical Gear Set with Localized Bearing Contact. Finite Elem. Anal. Des. 2002, 38, 707–723. [Google Scholar] [CrossRef]
- Parker, R.; Vijayakar, S.; Imajo, T. Non-linear Dynamic Response of a Spur Gear Pair: Modelling and Experimental Comparisons. J. Sound Vib. 2000, 237, 435–455. [Google Scholar] [CrossRef] [Green Version]
- Tamminana, V.K.; Kahraman, A.; Vijayakar, S. A Study of the Relationship between the Dynamic Factors and the Dynamic Transmission Error of Spur Gear Pairs. J. Mech. Des. 2007, 129, 75–84. [Google Scholar] [CrossRef]
- Faggioni, M.; Samani, F.S.; Bertacchi, G.; Pellicano, F. Dynamic Optimization of Spur Gears. Mech. Mach. Theory 2011, 46, 544–557. [Google Scholar] [CrossRef]
- Umezawa, K.; Suzuki, T.; Houjoh, H.; Sato, T. Vibration of Power Transmission Helical Gear—The Effect of Contact Ratio on the Vibration. Bull. JSME 1985, 28, 694–700. [Google Scholar] [CrossRef]
- Ogawa, Y.; Matsumura, S.; Houjoh, H.; Sato, T. Rotational Vibration of a Spur Gear Pair Having Tooth Helix Deviation (Effect of Lead Modifications). In Proceedings of the 2003 ASME Design Engineering Technical Conferences and Computers and Information in Engineering Conference, Chicago, IL, USA, 2–6 September 2003; pp. 433–440. [Google Scholar]
- Houjoh, H.; Ratanasumawong, C.; Matsumura, S. Utilization of Synchronous Averaging for Inspection of Tooth Surface Undulations on Gears (Localization of Nonmesh Harmonic Components to Individual Gear). J. Appl. Mech. 2007, 74, 269. [Google Scholar] [CrossRef]
- Du, J.; Hu, L.; Mao, J.; Zhang, Y. Optimal Vibration Suppression Modification Method for High-Speed Helical Gear Transmission of Battery Electric Vehicles under Full Working Conditions. Machines 2021, 9, 226. [Google Scholar] [CrossRef]
- Masoumi, A.; Pellicano, F.; Samani, F.S.; Barbieri, M. Symmetry breaking and chaos induced imbalance in planetary gears. Nonlinear Dyn. 2015, 80, 561–582. [Google Scholar] [CrossRef]
- Gelman, L.; Chandra, N.H.; Kurosz, R.; Pellicano, F.; Barbieri, M.; Zippo, A. Novel spectral kurtosis technology for adaptive vibration condition monitoring of multi-stage gearboxes. Insight Non-Destr. Test. Cond. Monit. 2016, 58, 409–416. [Google Scholar] [CrossRef]
- Ambarisha, V.K.; Parker, R.G. Nonlinear dynamics of planetary gears using analytical and finite element models. J. Sound Vib. 2007, 302, 577–595. [Google Scholar] [CrossRef]
- Bahk, C.J.; Parker, R.G. Analytical solution for the nonlinear dynamics of planetary gears. J. Comput. Nonlinear Dyn. 2011, 6, 1–15. [Google Scholar] [CrossRef]
- Amabili, M.; Rivola, A. Dynamic analysis of spur gear pairs: Steady-state responded and stability of the SDOF model with time-varying meshing damping. Mech. Syst. Signal Process. 1997, 11, 375–390. [Google Scholar] [CrossRef]
- Kahraman, A.; Singh, R. Non-Linear Dynamics of a Geared Rotor-Bearing System with Multiple Clearances. J. Sound Vib. 1991, 144, 469–506. [Google Scholar] [CrossRef]
- Kahraman, A.; Blankenship, G. Effect of Involute Tip Relief on Dynamic Response of Spur Gear Pairs. J. Mech. Des. 1999, 121, 313–315. [Google Scholar] [CrossRef]
- Hotait, M.A.; Kahraman, A. Experiments on the Relationship between the Dynamic Transmission Error and the Dynamic Stress Factor of Spur Gear Pairs. Mech. Mach. Theory 2013, 70, 116–128. [Google Scholar] [CrossRef]
- Inalpolat, M.; Handschuh, M.; Kahraman, A. Influence of Indexing Errors on Dynamic Response of Spur Gear Pairs. Mech. Syst. Signal Process. 2015, 60, 391–405. [Google Scholar] [CrossRef]
- Benatar, M.; Handschuh, M.; Kahraman, A.; Talbot, D. Static and Dynamic Transmission Error Measurements of Helical Gear Pair with Various Tooth Modifications. J. Mech. Des. 2019, 141, 103301. [Google Scholar] [CrossRef]
- Bruyere, J.; Velex, P.; Guilbert, B.; Houser, D.R. An Analytical Study on the Combination of Profile Relief and Lead Crown Minimizing Transmission Error in Narrow-faced Helical Gears. Mech. Mach. Theory 2019, 136, 224–243. [Google Scholar] [CrossRef]
- Villalba, R.T.; Ramirez, H.M.; Estrada, H.A. Classification of Design Methodologies to Minimize Vibrations in Gears and Bearings in the 21st Century: A Review. Machines 2021, 9, 212. [Google Scholar] [CrossRef]
- Wang, Z.G.; Chen, Y.C. Design of a Helical Gear Set with Adequate Linear Tip-relief Leading to Improved Static and Dynamic Characteristics. Mech. Mach. Theory 2020, 147, 103742. [Google Scholar] [CrossRef]
- Cai, Y. Simulation on the rotational vibration of helical gears in consideration of the tooth separation phenomenon (A new stiffness function of helical involute tooth pair). J. Mech. Des. 1995, 117, 460–469. [Google Scholar] [CrossRef]


Publisher’s Note: MDPI stays neutral with regard to jurisdictional claims in published maps and institutional affiliations. |
© 2022 by the authors. Licensee MDPI, Basel, Switzerland. This article is an open access article distributed under the terms and conditions of the Creative Commons Attribution (CC BY) license (https://creativecommons.org/licenses/by/4.0/).