Article

Fixed Abrasive Polishing in an Anhydrous Environment: A Material Removal Model for Fused Silica

Department of Mechanical and Electrical Engineering, Xiamen University, Xiamen 361102, China
*
Author to whom correspondence should be addressed.
Machines 2022, 10(2), 147; https://doi.org/10.3390/machines10020147
Submission received: 6 January 2022 / Revised: 28 January 2022 / Accepted: 15 February 2022 / Published: 17 February 2022

Abstract

:
Due to the prevalent randomness and uncertainties associated with traditional loose polishing, fixed abrasive polishing in an anhydrous environment has been chosen as a new polishing method. In this paper, cerium oxide is the main component for polishing pellets, and the particle size distribution of cerium oxide is measured. A material removal model for fixed abrasive polishing of fused silica in an anhydrous environment is proposed. Based on this model, we simulate the roughness of fused silica in fixed abrasive polishing process by using a Monte Carlo method with a constant removal mechanism and obtain the percentage of plastic and chemical removal. The percentage result is then taken into the material removal equation to calculate the material removal rate. The final convergence value of the roughness with 2 μm particle size is about 1.8 nm, while the final convergence value of the surface roughness of the workpiece by Monte Carlo simulation is about 1 nm. The experimental material removal rate at 2 μm particle size is 5.48 μm/h, while the simulation result is 4.29 μm/h. The experiment data of roughness and material removal rate all verify the model.

1. Introduction

With its excellent physical and chemical properties, fused silica is applied in a wide range of scientific and industrial applications, for example in chip shielding, as well as in lenses and phase plates in lasers. Each of these different systems places very stringent demands on the surface quality of the fused silica. Fused silica is a hard and brittle material and is usually machined with both conventional grinding and polishing methods. The polishing process removes some defects from the grinding process, such as surface brittle fracture, residual surface stresses, sub-surface damage, etc. Conventional polishing (e.g., loose polishing) uses rare earth or metal oxides, which are less hard than glass, mixed with deionized water and other chemical additives, to obtain a non-damaged glass surface utilizing a mechanochemical removal mechanism for material removal. However, some problems inevitably arise with traditional polishing methods. The material removal rate in loose abrasive polishing is influenced by several factors, including the nature of the polishing pad, the nature of the polishing solution, and the particle size distribution, which make it difficult to establish an accurate material removal model for loose abrasive polishing. The removal rate of traditional polishing materials is only 3–6 μ m / h [1,2,3]. Sometimes, there are also defects on the polished surface, where small pits can appear [4]. In addition, only <0.5% of the abrasive involved in polishing proved to be in the working area [5], indicating that a significant amount of abrasive particles is wasted. Therefore, it is difficult to make the loose polishing controllable.
In order to obtain a controllable polishing technology, research into fixed abrasive polishing has been widely carried out. There are two types of fixed abrasive polishing, one is to fix the abrasive particles on the polishing pad [6,7], and the other is to make particles into polishing wheel by a sintering process. Professor Stephen D. Jacobs developed a bound-abrasive polishers for optical glass—the RMS of fused silica glass can be reduced from over 400 nm to 1.5 nm in 1 h [6]. Professor L. Zhou achieved defect-free processing of single-crystal silicon wafers using cerium oxide fixed grinding wheels [7,8,9]. Subsequently, Professor Yongbo Wu and Yaguo Li [10,11,12] successfully introduced two-dimensional elliptical ultrasonic vibration-assisted technology into fixed abrasive polishing process, significantly improving the material removal rate and surface quality. Scholars at Ibaraki University used Cr2O3 and SiO2 to polish sapphire substrates, and the result shows that Cr2O3 abrasive particles have a higher chemical affinity for sapphire. Cr2O3 polishing efficiency is almost twice that of SiO2 polishing efficiency [13,14,15].
Although the fixed abrasive polishing technique achieves good results, such as surface roughness comparable to that of loose polishing, it still creates a hydrated layer on the glass surface in the presence of water, and additional processes are required to remove the hydrated layer for engineering applications. Researchers have therefore proposed fixed abrasive polishing in an anhydrous environment.
Our group has done a lot of work in previous research on the fixed abrasive polishing process for fused silica in an anhydrous environment. Wenjun Liu [16] described the manufacturing process of cerium oxide solidification wheels, and analyzed the processing products after the polishing. He noted that the material removal mechanism is dominated by chemical removal, as shown in Equations (1) and (2):
= Ce O Ce + = Si O Si 2 = Ce O Si
2 Ce 2 O 3 +   O 2   4 CeO 2
Then, Huiyang Tang [17] investigated the influence of pressure and speed on the material removal rate and surface roughness. Thermodynamic simulation was also carried out on the central area of the process and compared with the actual temperature to obtain the optimum polishing parameters for fixed abrasive polishing at 50 kPa and 150 rpm. Afterwards, Xinyu Luo [18] investigated the effect of particle size on subsurface damage and it was concluded that the larger the particle size, the greater the degree of subsurface damage.
Many researchers have also invested a lot of effort in building polishing models. Wei Yang proposed his own model for rapid polishing [19]. Some researchers have also proposed their own polishing models for fixed abrasive polishing: scholars at Nanjing University of Aeronautics and Astronautics developed a polishing model for abrasive particles on a polishing pad, while using a polishing fluid as an aid [20]. The polishing models described above were all modelled in aqueous environments and, in addition, all contained polishing pads.
Based on previous work, this article develops a material removal model between pellet and workpiece, without polishing pads, for fixed abrasive polishing in an anhydrous environment. The experimental data of roughness and material removal rate verifies the model. Different from previous studies, this article concludes that material removal is determined by a combination of chemical and plastic removal. The material removal model is also validated by simulating roughness and material removal rate with Monte Carlo methods.

2. Experiment

2.1. Particle Size Distribution and Pellet Preparation

Eight different particle sizes of cerium oxide were selected as abrasives for fused silica polishing. The particle size distribution of the abrasive particles was measured by Mastersizer (Mastersizer 2000 Malvern Instruments Ltd., Malvern, UK) and the eight different particle sizes of cerium oxide were then prepared into pellets. The composition of the pellets was 70 wt% cerium oxide (Regipol 830, Shanghai Yuancheng Optical Equipment Co., Ltd., Shanghai, China.), 15 wt% phenolic resin (Henan Pluton Casting Materials Co. Phenolic Resin 2123, Zhengzhou, China), and 15 wt% hollow glass microspheres (3 M Company, Sent Pol, MN, USA, Glass Microspheres S15) [16]. After mixing and grinding, the abrasives were pressed in a cylindrical model of 12.7   mm to make pellets, and then the pellets were fired at atmospheric pressure and 180 °C in accordance with the temperature rise procedure. The pellet production process is shown in Figure 1a.
The parameters of cerium oxide are shown in Table 1. Figure 1b shows a pellet made of cerium oxide with particle sizes of 2 μ m .

2.2. Polishing

Figure 2 shows a schematic diagram of the experiment [18].
The experimental setup consists mainly of a CNC machine (PKD300, Shanghai, China), a tool with cerium oxide pellets, a workpiece, and an aluminum plate base. The fused silica workpiece adheres to the aluminum plate base with beeswax (Y-SLOT-M, Shanghai Yuancheng Optical Equipment Co., Ltd., Shanghai, China). During the experiment, the aluminum plate base is placed on a working magnetic table of the machine and the workpiece is clamped with four thick iron blocks. The load required for the experiment is provided by the downward pressure of the machine tool. The magnetic table and workpiece rotate at a speed of ω 1 and the pellet rotates at a speed of ω 2 with an initial eccentricity of 32 mm. The processing parameters are shown in Table 2. In the initial experiments, we found that after 70 min of polishing, the pellets were heavily worn, while the roughness did not continue to decrease, so the polishing time was set at 70 min [16]. No water or other coolant of any kind are added throughout the polishing process.

2.3. Surface Measurement

The workpiece was 100 mm in diameter, 10 mm thick fused silica (Corning 7980, Shanghai, China) with an original roughness of 200–250 nm and a PV value less than 0.5 μ m . The workpiece was machined for 70 min and the surface was cleaned with ethanol after every 10 min. Material removal depth and roughness were measured using a profilometer (Taylor Hobson, PGI 1240, Leicester, UK). As the initial surface shape of the workpiece and the grinding wheel was not fully flat, in order to ensure the accuracy of the removal depth and roughness measurements, the workpiece measurement area was selected as the area with the lowest roughness after the first 10 min of machining. Five relatively dispersed locations within the area were selected for measurement and the average value was taken as the measurement result. Subsequent measurements were taken in the same area. In contrast to previous experiments, we used more appropriate filter values for the measured PV and Ra.

3. Results

3.1. Particle Size Distribution

The results of the particle size distribution measured using a Malvern particle sizer (Malvern, UK) are shown in Figure 3 below. The horizontal coordinates in Figure 3 are logarithmic. The particle size of the abrasive particles shows an approximately log-normal distribution. The dependent variable for subsequent calculations of the particle size distribution will be a linear variable.

3.2. Roughness Measurement

Figure 4a shows the changes in the roughness of the workpiece when it is polished for 70 min under eight different particle sizes of pellets. From the graph, we can learn that the roughness drops very quickly in the first 10 min, but in subsequent machining, the roughness changes start to slow down, and eventually, the roughness all converges to an approximate value. Figure 4b shows the final values of Ra for eight different particle sizes, which can reach as low as 1.8 nm. Figure 4c shows the roughness values measured with a profilometer after polishing with a particle size of 2 µm pellet.

3.3. Material Removal Rate Measurement

Figure 5 shows the variation in material removal rates when the workpiece is polished with eight different particle sizes for 70 min. The material removal rate generally increases with increasing particle size. Although the result has obvious fluctuations, the final removal rate is greatest at a particle size of 2 µm and smallest at 50 nm.

4. Discussion

4.1. Material Removal Model

An attempt was made to build a material removal model for fixed abrasive polishing. Before establishing the model, some assumptions need to be made in order to simplify the analysis [21,22]. Firstly, it is assumed that all the abrasive particles involved in the material removal are spherical. Secondly, it is observed that the abrasive particle size followed a lognormal distribution. Thirdly, there is no porosity in the model and the position of the abrasive particles are randomly distributed. Last, the particles are distributed as a single layer between the workpiece and the pellet and there is no stacking.
Illustration of the contact between the pellet and the workpiece of fixed abrasive polishing is shown in Figure 6. In the picture, the abrasive particle and the pellet are one unit. The pellet is subjected to an external load and transmits the force to the abrasive particle in contact with the workpiece, which is compressed between pellet and workpiece to produce deformation.
According to Greenwood and Williamson’s model [23], the pellet surface can be described as a problem of contact between a statistically protruding height and a rigid plane. Assuming that the surface of the pellet is the x -axis and the spacing between the pellet and the workpiece is g . Neglecting the elastic interaction between the micro protrusions, all micro-protrusions of height greater than g are in contact with a rigid plane. If the height of the micro-convex body is h , the indentation depth is h = H g . However, the height of the abrasive particle projection is at most 0.4 times its particle diameter.
Figure 7 shows a diagram of a single abrasive particle pressed into the workpiece. According to Hertzian contact theory, the contact force for a single micro-protrusions body is:
Δ F = 4 3 E * R 1 2 h 3 2
where E * is:
1 E * = 1 ν w 2 E w + 1 ν p 2 E p
E w , E p is the modulus of elasticity of the workpiece and the abrasive particle, ν w , ν p are the Poisson’s ratio of the workpiece and the abrasive particle.
By partitioning all micro-convex volumes, the total contact normal force can be obtained:
F = 4 3 E * g ( 1 2 f ( x ) ) 1 2 ( H ( x ) g ) 3 2 d x
The H ( x ) in this equation will be computed in the next section.
The plastic removal mechanisms vary for different materials and different abrasives [24,25]. The main influencing factors in fixed abrasive polishing are chemical and plastic removal [18,26,27]. This view is also confirmed in Suratwala’s article [28,29,30]. In his paper, Suratwala also points out that when the force exerted by the cerium oxide particles on the fused silica is greater than 1 × 10 6   N , the nature of the removal is plastic removal; when the force exerted by the cerium oxide particles on the fused silica is less than 1 × 10 6   N , the nature of the removal is chemical removal. The depth of removal is constant for both plastic and chemical removal [31], with the depth of removal for plastic removal being 0.55 nm and for chemical removal being 0.04 nm. Here, we assume that the depth d 0 is the critical depth for the chemical and plastic removal of the workpiece by the abrasive particles. The critical removal depth d 0 of the material differs when the particle size is different, as can be calculated from the single abrasive particle force equation. Figure 8 shows a diagram of plastic and chemical removal of workpieces by abrasive particles—when the embedding depth d is greater than d 0 , the removal of the material is plastic removal; when the embedding depth d is less than d 0 , the removal of the material is chemical removal. d 0 can be calculated by Equation (3).
Therefore, in the process of fixed abrasive polishing, if the percentage of plastic removal and chemical removal in the removal process is known, it is easy to predict the material removal rate under fixed abrasive polishing. Therefore, the value of g at different particle sizes can be found by numerical integration and be easily predicted. It is proposed here that the equation for the material removal rate is:
d M d t = N t f r v r ( f p d p 2 a p + f m d m 2 a m )
f r is the percentage of abrasive particles involved in material removal. v r is the relative speed of movement between the center of the pellet and the workpiece, which can be derived from the kinematic relationship. The calculation here is the percentage of the height of the abrasive particle projection, H , which is greater than g .

4.2. Calculations of the Number of Abrasive Particle Projections

Since the overall particle size distribution of abrasive particles shows a log-normal distribution, the particle size distribution of abrasive particles can be expressed as:
f ( x ) = { 1 x 2 π σ x exp [ 1 2 ( lg x μ x σ x ) 2 ]             x 1 x x 2 0                                                                                                               o t h e r w i s e
Here, x denotes the particle size of the abrasive particles, μ x denotes the average particle size, and σ x denotes the deviation from the particle size. A value of 99.7% of the abrasive particles lie within the ( μ g e o / 3 σ g e o , μ g e o × 3 σ g e o ) size range, where μ g e o is exp ( μ x ) , and σ is exp ( σ x ) . Here, the methods of Philip Koshy [21,22,32,33] are used, dividing the pellets into cubic units with cubic prism lengths of c . The presence of abrasive particles in the cubes takes the form shown in Figure 9, where a is the lowest height of projection and b is the highest height of the projection. The distribution of the protruding height y of the abrasive particles is then as follows:
y ~ U ( 0.1 μ x , c + 0.1 μ x )
Then the probability density function of the prominent height distribution of abrasive particles in the cubic cell satisfying the log-normal distribution is:
H = 1 2 x + y c
H ( x ) = 1 c + 0.2 μ x 0.1 μ x c + 0.1 μ x 1 2 f ( x ) d x
The probability of a mill particle satisfying the log-normal distribution to stand out in height in a cubic cell is thus:
P ( a H b ) = 1 c + 0.2 μ x 0.1 μ x c + 0.1 μ x c + a y c + b y 1 2 f ( x ) d x d y
The Monte Carlo method was used to calculate the above double integral.
The concentration number C of the pellets is divided by the percentage volume of 4 abrasive particles so that in a cube of volume c 3 , the volume of abrasive particles V a b c is:
V a b r = C c 3 400
Then, the number of particles projecting on each c 2 unit is:
N t = V a b r 4 3 π ( 1 2 x ) 3 P ( a H b )
The average particle surface density can be found for σ x = 0. Here, it is closer to the true value when c = μ x .
Here, H ( x ) can then be derived, while bringing H ( x ) into Equation (5). All parameters in Equation (5) are known quantities, except for g , which is unknown. Therefore, the value of g at different particle sizes can be found by numerical integration.

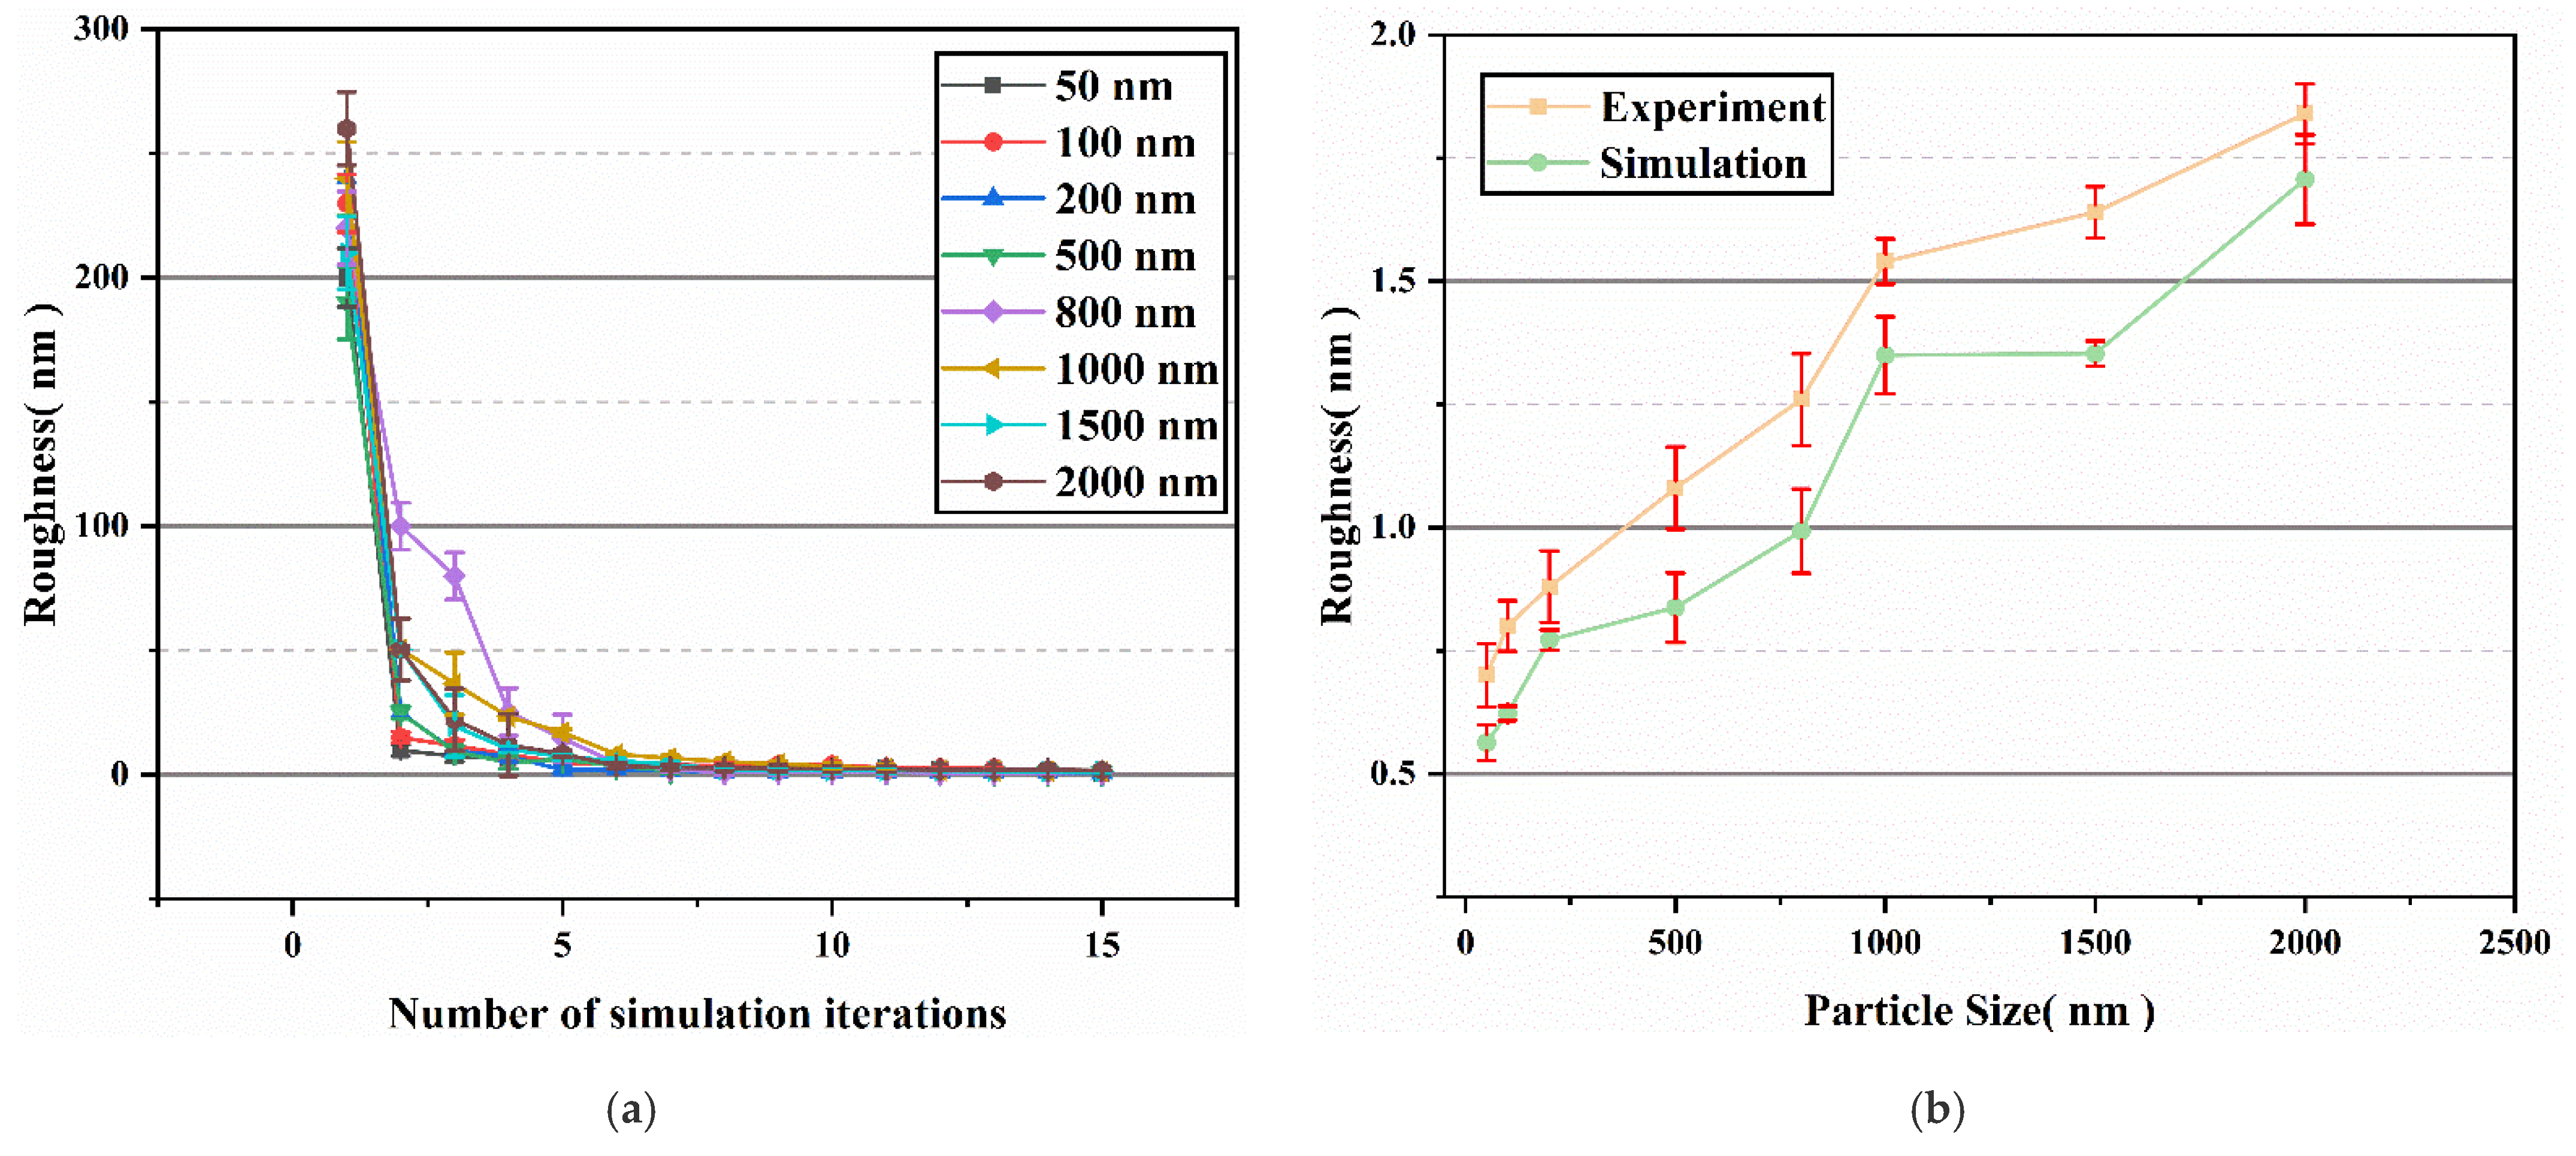
4.3. Roughness Simulation and Experiment Validation for the Material Removal Model

A Monte Carlo method is used on MATLAB to simulate the removal of material in fixed abrasive polishing and a graphical approach will be used here to simulate the change in roughness. The Monte Carlo is a method that uses random numbers to solve problems. In the simulation of roughness, the authors simulated roughness with a large number of random abrasive particles that match the distribution results. After the abrasive particles have removed the surface of the workpiece, the shape of the workpiece surface will change, and the formula for roughness is:
R a = 1 l 0 l | y y 0 | d x
Thus, after removing the surface of the workpiece using a large number of abrasive particles, the roughness of the workpiece can be derived from the above equation. The depth of chemical removal durincg the simulation is 0.04 nm and the depth of plastic removal is 0.55 nm [20,21,22]. The parameters of the simulation are shown in the table below. The simulation is also performed by recording the embedding depth of each abrasive particle concerning d 0 during material removal. The iterative process is repeated until the roughness results converge. The parameters required in the simulation are shown in Table 3.
The roughness results of the simulation are shown in Figure 10.
In the first few simulations, the roughness result drops very quickly, and as the number of cycles increases, the roughness drops more and more slowly, finally converging to a stable value. In Figure 10b, the final result of roughness increases with increasing abrasive particle size, with the specific values of roughness convergence for C1–C8 being: 0.56 nm, 0.62 nm, 0.77 nm, 0.84 nm, 0.99 nm, 1.35 nm, and 1.71 nm. The results are in approximate agreement with the experimental results.
The image shows quite visually that as the particle size increases, the convergence value of the roughness of the workpiece surface increases. We believe that this is due to the fact that smaller particle sizes produce more chemical removal during polishing. As the size increases, the pressure on the abrasive particle increases, and more abrasive particles will be plastic removal from the material, resulting in a more efficient plastic removal depth than the chemical removal depth. The experimental data is somewhat higher than the simulated data, which is due to the agglomeration of the abrasive particles, as will be explained in subsequent segments.

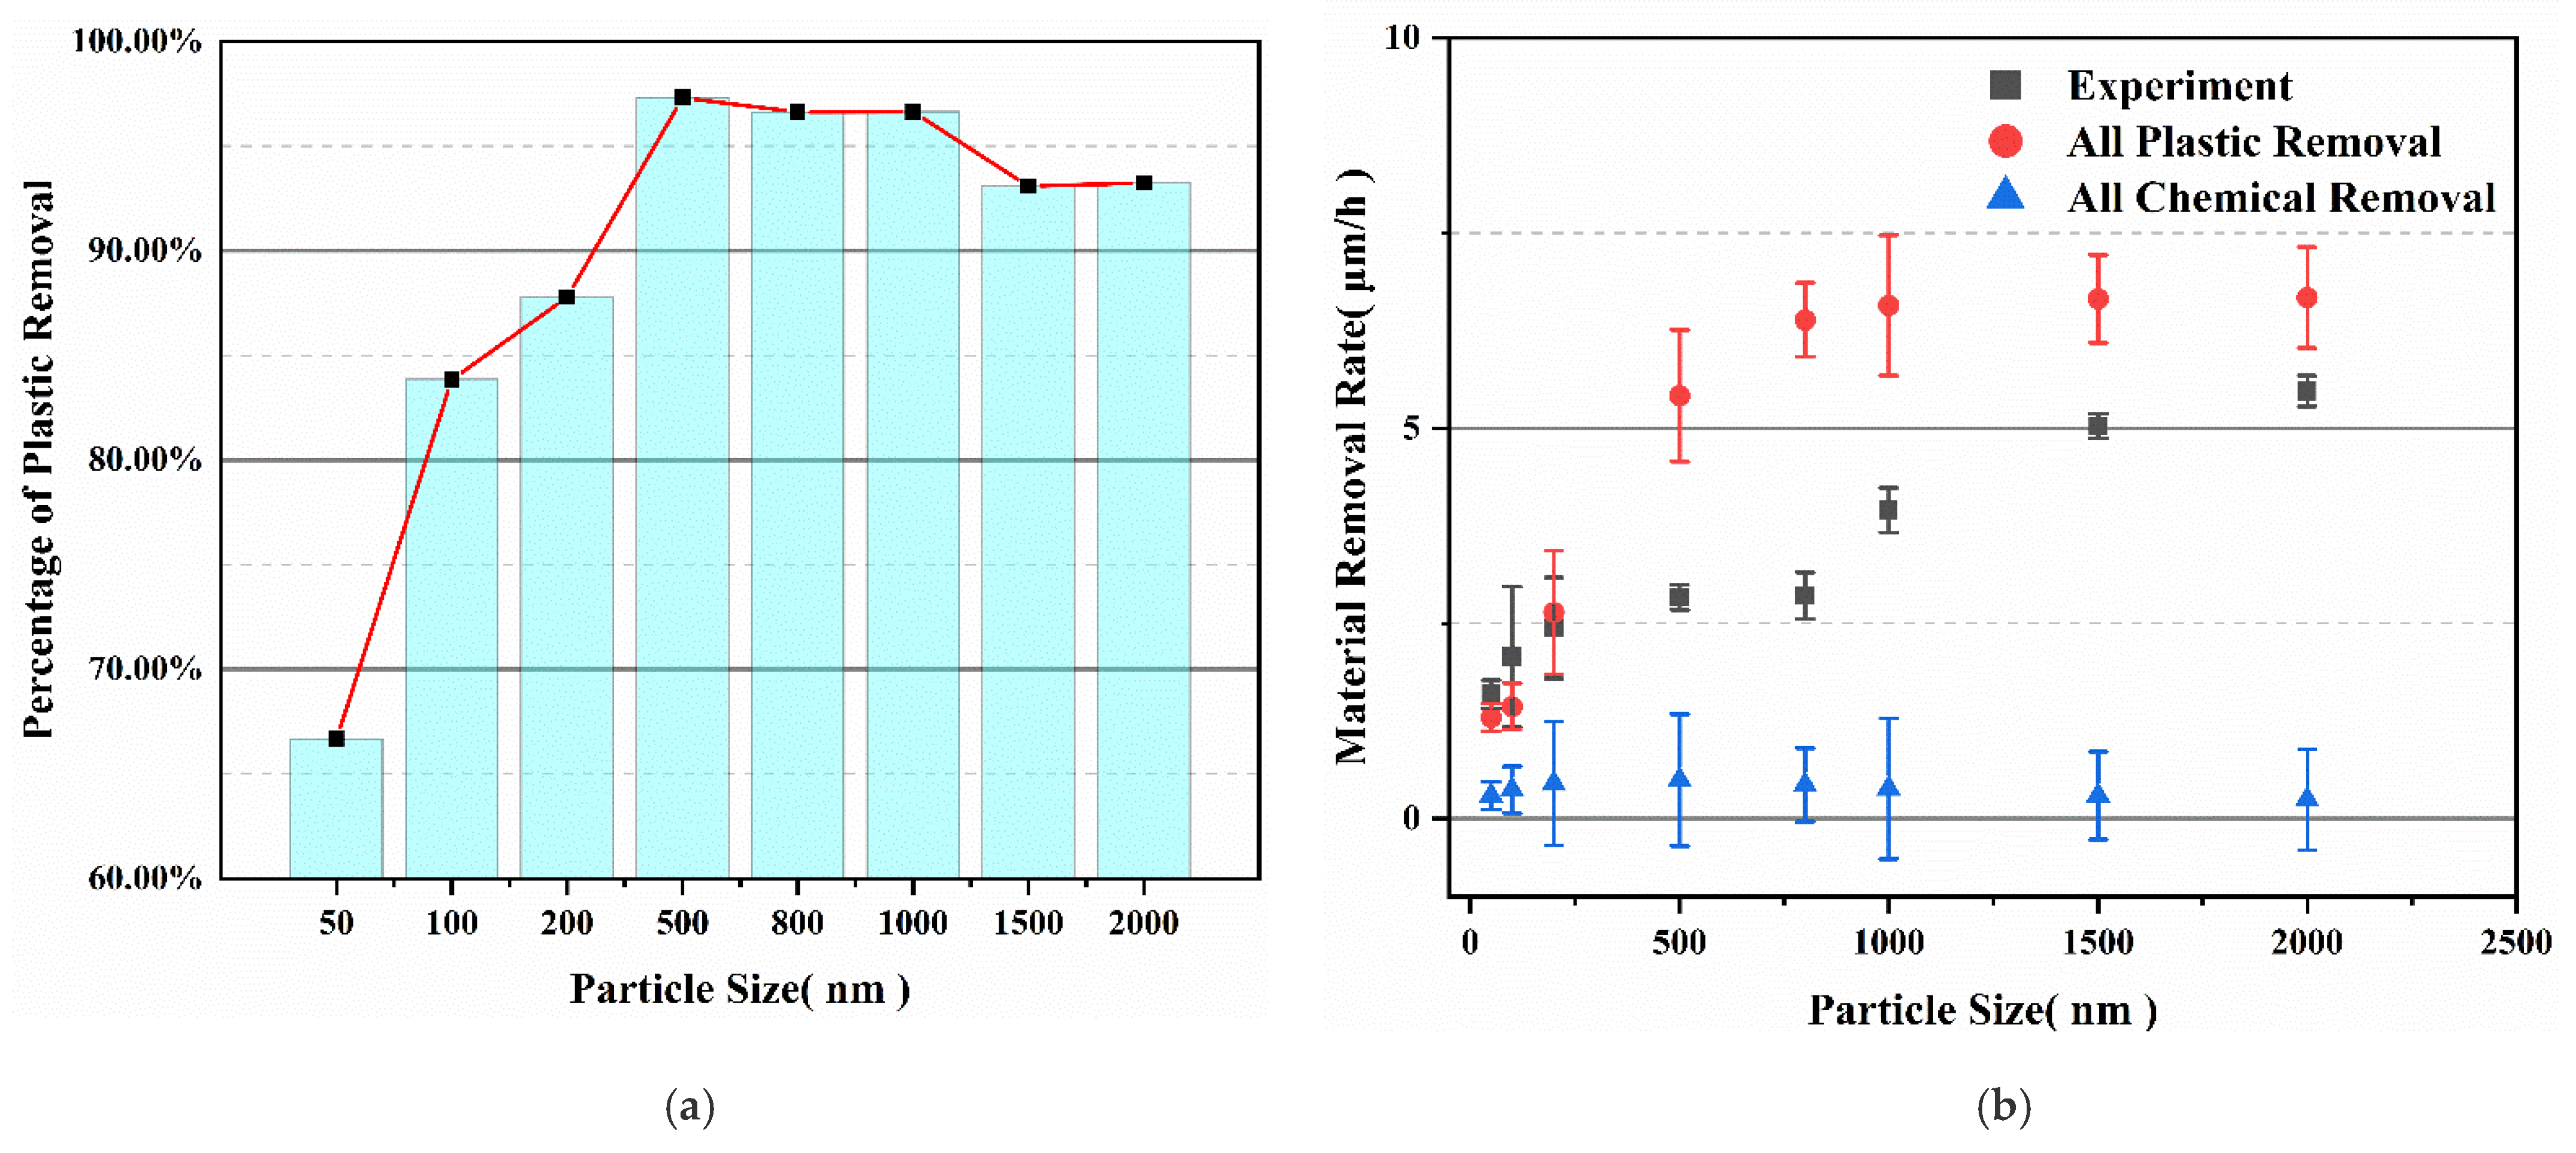
4.4. Material Removal Rate Experiment Validation for the Material Removal Model

During the simulation, we also counted the number of abrasive particles embedded at depths greater than d 0 and less than d 0 , i.e., the percentage of plastic and chemical removal; the results are shown in Figure 11.
In contrast to what was investigated by Wenjun Liu [16] and Yaguo Li [4,10,11,12], the simulation results show that plasticity removal occupies a major part of the fixed abrasive polishing in an anhydrous environment process.
It is clear from Figure 11a that as the particle size increases, the percentage of plastic removal during polishing increases [24,25]. Even abrasive particles with a particle size of 50 nm account for more than 60% of plastic removal during polishing. When the particle size is greater than 800 nm, the percentage of plastic removal remains stable at over 90%. By using the above percentages in Equation (6) for our assumed material removal rate, the simulated material removal rate can be obtained, as shown in Figure 12.
As can be seen from the graph, the overall increase in material removal with increasing particle size is similar to that of the experimental results. Since the depth of plastic removal is a constant value, it can also be inferred that large particle sizes also account for a large proportion of plasticity in polishing. The conclusion is also viewed by the experimental results of material removal.
We can also make an assumption that the process of material removal is all plastic removal or all chemical removal. With all plastic removal, f p equals 1 and f m equals 0; with all chemical removal, f p equals 0 and f m equals 1. Taking the above parameters into Equation (6), the material removal rate is calculated, as shown in Figure 11b.
The validation of the material removal model can also be illustrated by the results for material removal rates and the results for roughness.
However, the simulated material removal rate is slightly different from the experimental results: the results are smaller than the experimental results. In fact, in the process of material removal, a large number of abrasive particles will agglomerate, and the large particles formed by the agglomeration will remove more materials. At the same time, during the production of the pellets, the binder will also cause the abrasive particles to agglomerate.

4.5. Burning and Wear

Figure 13a shows the two phenomenon often found in fixed abrasive particle pellets—wear and burning. Under pressure and rotational speed, the temperature in the central area of the polishing rises and, as there are no cooling measures, the cerium oxide powder agglomerates into lumps, and the hardness changes. Therefore, not only plastic removal and chemical removal but also scratches from the burned agglomerates are involved in the polishing process, so that the removal process may also be accompanied by brittle fracture.
Figure 13b shows a photograph of cerium oxide after polishing under a 500× microscope (VHX-5000, KEYENCE, Tokyo, Japan). As can be seen in Figure 13b, most areas of the fused silica are smooth after cerium oxide polishing, but there are still a few scratches. The pellets in Figure 13a, on the other hand, show obvious burn marks, so it is presumed that mechano-chemical removal is the main means of removal during polishing, while burning increases the hardness of some areas of the pellets, thus affecting the removal efficiency and causing damage to the surface of the workpiece.
With the combined effect of all three—chemical removal, plastic removal, and burning—the actual roughness results are greater than the simulated results. The agglomeration of abrasive particles, on the other hand, causes an increase in the material removal rate. It is also inferred that the generation of sub-surface damage in the polishing of fixed abrasive particles is also caused by these agglomerates.
The effect of chip removal is not taken into account during the simulation. The polishing wheel generates a lot of wear during the polishing process. The powder also plays a non-negligible role in verifying the material removal mechanism but has a negative effect during processing, such as the production of a large number of agglomerated particles. This is one of the drawbacks of fixed abrasive particles. Further research will be carried out to reduce the negative effects of burning and abrasive agglomeration.

5. Conclusions

In this paper, cerium oxide was used as the main component to make pellets and the particle size distribution of cerium oxide is measured. Based on previous studies, the researchers developed a material removal rate model. The roughness and material removal rate of cerium oxide after polishing on fused silica were then obtained experimentally. By the Monte Carlo method, the roughness results were obtained by simulating the polishing effect of abrasive particles on fused silica under the mechanism of constant removal depth. In addition, and different from previous research, the simulation results yielded a predominantly plastic removal under the polishing of fixed abrasive particles in an anhydrous environment. The authors also established a relationship for material removal by bringing the chemical and plastic removal percentages obtained during the simulation into the material removal equation to obtain the calculated values of material removal, and compared them with the experimental values to explain the differences between the actual and simulated values, thus verifying the model.

Author Contributions

Y.Q. and W.Y. have made major contributions to the paper, including research design, data writing, data analysis and manuscript writing. Special thanks are given to the C.C. and X.Y. for their help in the process of the experiment. All authors have read and agreed to the published version of the manuscript.

Funding

This work was supported by the National Natural Science Foundation of China (No. 52075462).

Institutional Review Board Statement

Not applicable.

Informed Consent Statement

Not applicable.

Data Availability Statement

The data that support the findings of this study are available from the corresponding authors upon reasonable request.

Acknowledgments

The authors thank Chaoxu Chen and Xiaoluo Yu for their great help in the experiments.

Conflicts of Interest

The authors declare no conflict of interest.

References

  1. Li, Y.; Jing, H.; Qiao, X.; Jian, W.; Guo, Y.J.O.E. The characteristics of optics polished with a polyurethane pad. Opt. Express 2008, 16, 10285–10293. [Google Scholar] [CrossRef]
  2. Berggren, R.R.; Schmell, R.A. Pad polishing for rapid production of large flats. In Optical Manufacturing and Testing II; SPIE: Bellingham, WA, USA, 1997. [Google Scholar]
  3. Tesar, A.A.; Fuchs, B.A. Removal rates of fused silica with cerium oxide/pitch polishing. In Advanced Optical Manufacturing and Testing II; International Society for Optics and Photonics: Bellingham, WA, USA, 1992. [Google Scholar]
  4. Li, Y.G.; Wang, J. Surface characteristics of an optical component manufactured with a polyurethane lap. Appl. Opt. 2009, 48, 737–742. [Google Scholar] [CrossRef] [PubMed]
  5. Bulsara, V.H.; Ahn, Y.; Chandrasekar, S.; Farris, T.N. Mechanics of polishing. J. Appl. Mech.-Trans. ASME 1998, 65, 410–416. [Google Scholar] [CrossRef]
  6. Gillman, B.E.; Jacobs, S.D. Bound-abrasive polishers for optical glass. Appl. Opt. 1998, 37, 3498–3505. [Google Scholar] [CrossRef] [PubMed] [Green Version]
  7. Zhou, L.; Eda, H.; Shimizu, J.; Kamiya, S.; Iwase, H.; Kimura, S. Defect-free fabrication for single crystal silicon substrate by chemo-mechanical grinding. CIRP Ann.-Manuf. Technol. 2006, 55, 313–316. [Google Scholar] [CrossRef]
  8. Zhou, L.; Shiina, T.; Qiu, Z.; Shimizu, J.; Yamamoto, T.; Tashiro, T. Research on chemo-mechanical grinding of large size quartz glass substrate. Precis. Eng. 2009, 33, 499–504. [Google Scholar] [CrossRef]
  9. Tashiro, Y.; Zhou, L.; Shimizu, J.; Shinoda, N.; Mikami, Y. Research on Chemo-Mechanical-Grinding (CMG) of Si wafer. J. Jpn. Soc. Precis. Eng. 2005, 71, 466–470. [Google Scholar] [CrossRef] [Green Version]
  10. Li, Y.G.; Wu, Y.B.; Zhou, L.B.; Fujimoto, M.; Wang, J.; Xu, Q.; Sasaki, S.; Kemmochi, M. Chemo-Mechanical Manufacturing of Fused Silica by Combining Ultrasonic Vibration with Fixed-Abrasive Pellets. Int. J. Precis. Eng. Manuf. 2012, 13, 2163–2172. [Google Scholar] [CrossRef]
  11. Li, Y.G.; Wu, Y.B.; Wang, J.; Yang, W.; Guo, Y.B.; Xu, Q. Tentative investigation towards precision polishing of optical components with ultrasonically vibrating bound-abrasive pellets. Opt. Express 2012, 20, 568–575. [Google Scholar] [CrossRef]
  12. Li, Y.G.; Wu, Y.B.; Zhou, L.B.; Fujimoto, M. Vibration-assisted dry polishing of fused silica using a fixed-abrasive polisher. Int. J. Mach. Tools Manuf. 2014, 77, 93–102. [Google Scholar] [CrossRef]
  13. Wu, K.; Zhou, L.; Onuki, T.; Shimizu, J.; Yamamoto, T.; Yuan, J. Study on the finishing capability and abrasives-sapphire interaction in dry chemo-mechanical-grinding (CMG) process. Precis. Eng. 2018, 52, 451–457. [Google Scholar] [CrossRef]
  14. Wu, K.; Zhou, L.; Shimizu, J.; Onuki, T.; Yamamoto, T.; Ojima, H.; Yuan, J. Study on the potential of chemo-mechanical-grinding (CMG) process of sapphire wafer. Int. J. Adv. Manuf. Technol. 2017, 91, 1539–1546. [Google Scholar] [CrossRef]
  15. Wang, J.; Wu, K.; Maezaki, T.; Zhou, L.; Onuki, T.; Shimizu, J.; Zhu, Y. Development of binder-free CMG abrasive pellet and finishing performance on mono-crystal sapphire. Precis. Eng. 2020, 62, 40–46. [Google Scholar] [CrossRef]
  16. Jun, L.W.; Wei, Y.; Biao, G.Y. Characteristic of bound-abrasive polishing for fused silica glass in anhydrous environment. In Proceedings of the 9th International Symposium on Advanced Optical Manufacturing and Testing Technologies-Advanced Optical Manufacturing Technologies, Chengdu, China, 26–29 June 2018. [Google Scholar]
  17. Tang, H.Y.; Yang, W.; Liu, W.J.; Ma, J.L.; Luo, X.Y. Characteristic of fixed abrasive polishing for fused silica in anhydrous environment. Optik 2020, 202, 163623. [Google Scholar] [CrossRef]
  18. Luo, X.Y.; Yang, W.; Qian, Y. Fixed abrasive polishing: The effect of particle size on the workpiece roughness and sub-surface damage. Int. J. Adv. Manuf. Technol. 2021, 115, 3021–3035. [Google Scholar] [CrossRef]
  19. Wang, C.; Yang, W.; Wang, Z.; Yang, X.; Hu, C.; Zhong, B.; Guo, Y.; Xu, Q. Dwell-time algorithm for polishing large optics. Appl. Opt. 2014, 53, 4752–4760. [Google Scholar] [CrossRef]
  20. Wang, J.B.; Zhu, Y.W.; Wang, Z.K.; Gao, H.J.K.E.M. Mechanism on lapping sapphire single crystal waferwith fixed abrasive pad. Key Eng. Mater. 2015, 670, 181–186. [Google Scholar] [CrossRef]
  21. Koshy, P.; Jain, V.K.; Lal, G.K. A Model for the Topography of Diamond Grinding Wheels. Wear 1993, 169, 237–242. [Google Scholar] [CrossRef]
  22. Koshy, P.; Jain, V.K.; Lal, G.K. Stochastic simulation approach to modelling diamond wheel topography. Int. J. Mach. Tools Manuf. 1997, 37, 751–761. [Google Scholar] [CrossRef]
  23. Popov, V. Contact Mechanics and Friction: Physical Principles and Applications; Springer: Berlin/Heidelberg, Germany, 2010. [Google Scholar] [CrossRef]
  24. Chen, H.; Xu, Q.; Wang, J.; Li, P.; Yuan, J.; Lyu, B.; Wang, J.; Tokunaga, K.; Yao, G.; Luo, L.; et al. Effect of surface quality on hydrogen/helium irradiation behavior in tungsten. Nucl. Eng. Technol. 2021, 1738–5733. [Google Scholar] [CrossRef]
  25. Hang, W.; Wei, L.; Debela, T.T.; Chen, H.; Zhou, L.; Yuan, J.; Ma, Y. Crystallographic orientation effect on the polishing behavior of LiTaO3 single crystal and its correlation with strain rate sensitivity. Ceram. Int. 2021, 48, 7766–7777. [Google Scholar] [CrossRef]
  26. Luo, J.F.; Dornfeld, D.A. Material removal mechanism in chemical mechanical polishing: Theory and modeling. IEEE Trans. Semicond. Manuf. 2001, 14, 112–133. [Google Scholar] [CrossRef]
  27. Luo, J.F.; Dornfeld, D.A. Material removal regions in chemical mechanical planarization for submicron integrated circuit fabrication: Coupling effects of slurry chemicals, abrasive size distribution, and wafer-pad contact area. IEEE Trans. Semicond. Manuf. 2003, 16, 45–56. [Google Scholar] [CrossRef]
  28. Suratwala, T.; Steele, W.; Wong, L.; Feit, M.D.; Miller, P.E.; Dylla-Spears, R.; Shen, N.; Desjardin, R. Chemistry and Formation of the Beilby Layer During Polishing of Fused Silica Glass. J. Am. Ceram. Soc. 2015, 98, 2395–2402. [Google Scholar] [CrossRef]
  29. Shen, N.; Feigenbaum, E.; Suratwala, T.; Steele, W.; Wong, L.N.; Feit, M.D.; Miller, P.E. Nanoplastic removal function and the mechanical nature of colloidal silica slurry polishing. J. Am. Ceram. Soc. 2019, 102, 3141–3151. [Google Scholar] [CrossRef]
  30. Suratwala, T.; Steele, R.; Wong, L.; Miller, P.; Feigenbaum, E.; Shen, N.; Ray, N.; Feit, M. Towards predicting removal rate and surface roughness during grinding of optical materials. Appl. Opt. 2019, 58, 2490–2499. [Google Scholar] [CrossRef]
  31. Suratwala, T.; Feit, M.; Steele, W.; Wong, L.; Shen, N.; Dylla-Spears, R.; Desjardin, R.; Mason, D.; Geraghty, P.; Miller, P.; et al. Microscopic Removal Function and the Relationship between Slurry Particle Size Distribution and Workpiece Roughness during Pad Polishing. J. Am. Ceram. Soc. 2014, 97, 81–91. [Google Scholar] [CrossRef] [Green Version]
  32. Inasaki, I.J.C.A.-M.T. Grinding Process Simulation Based on the Wheel Topography Measurement. CIRP Ann. 1996, 45, 347–350. [Google Scholar] [CrossRef]
  33. Wang, Y.D.; Moon, K.S. A methodology for the multi-resolution simulation of grinding wheel surface. Wear 1997, 211, 218–225. [Google Scholar] [CrossRef]
Figure 1. Manufacturing process of pellets and a product sample. (a) Preparation for the manufacturing process of pellets. (b) Pellet made of 2 μm cerium oxide.
Machines 10 00147 g001
Figure 2. The tools used for fixed abrasive polishing (a) Schematic diagram of fixed abrasive polishing; (b) Picture of CNC for fixed abrasive polishing.
Machines 10 00147 g002
Figure 3. The particle size distributions of the eight abrasive particles.
Machines 10 00147 g003
Figure 4. The results of roughness derived from the experiment. (a) Roughness changes during po-ishing process with eight abrasive particles; (b) the final result of the polished roughness; (c) the roughness measured by Taylor Hobson after polishing with a particle size of 2 µm pellet.
Machines 10 00147 g004
Figure 5. The results of material removal derived from the experiment. (a) Material removal rate versus polishing time under varied particle size; (b) the trend of material removal rate with particle size after 70 min.
Machines 10 00147 g005
Figure 6. Schematic diagram of the interface contact during polishing.
Machines 10 00147 g006
Figure 7. Schematic diagram of the abrasive particle contact model during polishing.
Machines 10 00147 g007
Figure 8. Diagrams of the two materials removal mechanisms. (a) A schematic representation of plastic removal; (b) a schematic representation of chemical removal.
Machines 10 00147 g008
Figure 9. Diagram of the abrasive particle in a cubic unit.
Machines 10 00147 g009
Figure 10. Roughness results were obtained by using the Monte Carlo method with a constant removal depth mechanism. (a) The process of changing roughness as the number of iterations increases; (b) a comparison of the experimentally derived roughness and the simulation derived roughness.
Machines 10 00147 g010
Figure 11. (a)Percentage of plastic removal recorded during roughness simulation; (b) material removal results for all plastic and chemical removal.
Machines 10 00147 g011
Figure 12. A comparison of the experimentally derived material removal rate and the simulation derived material removal rate.
Machines 10 00147 g012
Figure 13. Pictures of the surface of the pellet and workpiece after polishing for 70 min. (a) Burn and abrasions of polishing wheels; (b) surface of fused silica by cerium oxide pellet.
Machines 10 00147 g013
Table 1. Types of polishing wheel.
Ceria Particle Size (nm)50100200500800100015002000
NamedC1C2C3C4C5C6C7C8
Table 2. Fixed abrasive polishing processing parameters.
ParameterCondition
Workpiece   speed   ω 1 150 rpm
Spindle   speed   ω 2 150 rpm
Eccentricity e32 mm
Pressure P50 kPa
Processing time t70 min
Table 3. Parameters of the fixed abrasive polishing model and the Monte Carlo simulation.
ParameterVariableSourceValue
Particle size distribution f ( x ) MeasuredSee Figure 3
Modulus and Poisson’s ratio of workpiece E w ν w [31] 72.7   GPa ;   0.16
Modulus and Poisson’s ratio of ceria E p ν p [31] 190   GPa ;   0.20
Plastic removal depth d p [31] 0.55   nm
Molecular removal depth d m [31] 0.04   nm
Publisher’s Note: MDPI stays neutral with regard to jurisdictional claims in published maps and institutional affiliations.

