
Stability Analysis of Vaneless Space in High-Head Pump-Turbine under Turbine Mode: Computational Fluid Dynamics Simulation and Particle Imaging Velocimetry Measurement

 , ,
, ,
Abstract
1. Introduction
2. Computational Fluid Dynamic Simulation
2.1. Geometry and Mesh
2.2. Boundary Conditions and Operating Points
2.3. Weakly Compressible Equation
2.4. Computational Fluid Dynamics Results
3. Particle Image Velocimetry Methods
3.1. Particle Image Velocimetry System and Model Pump-Turbine Parameters
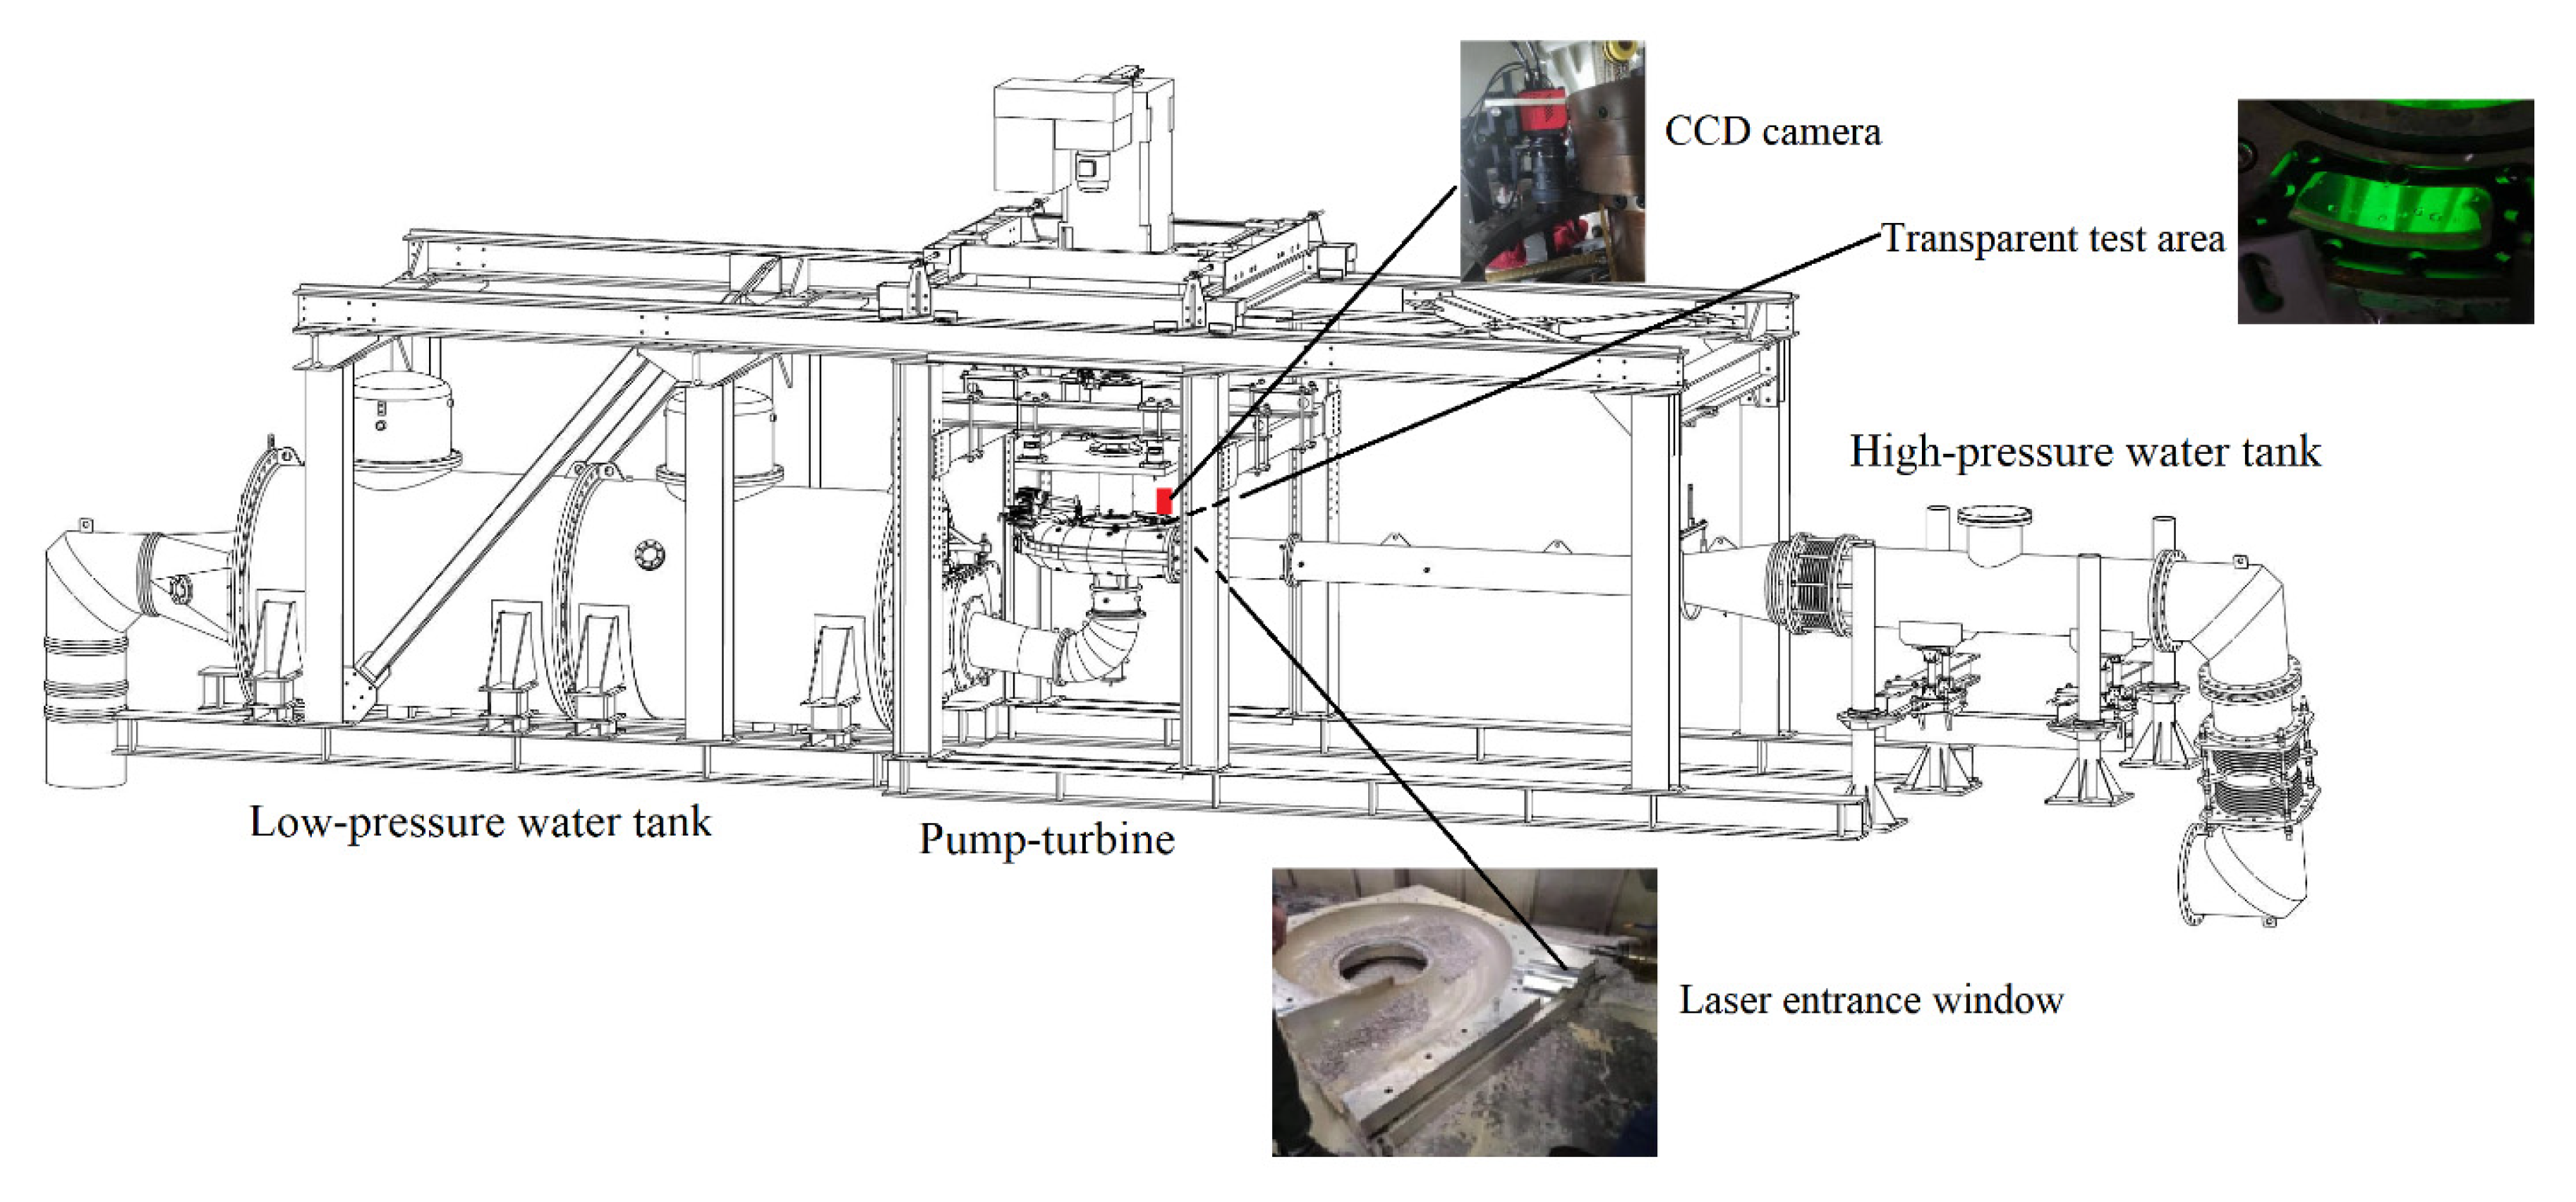
3.2. Test Site
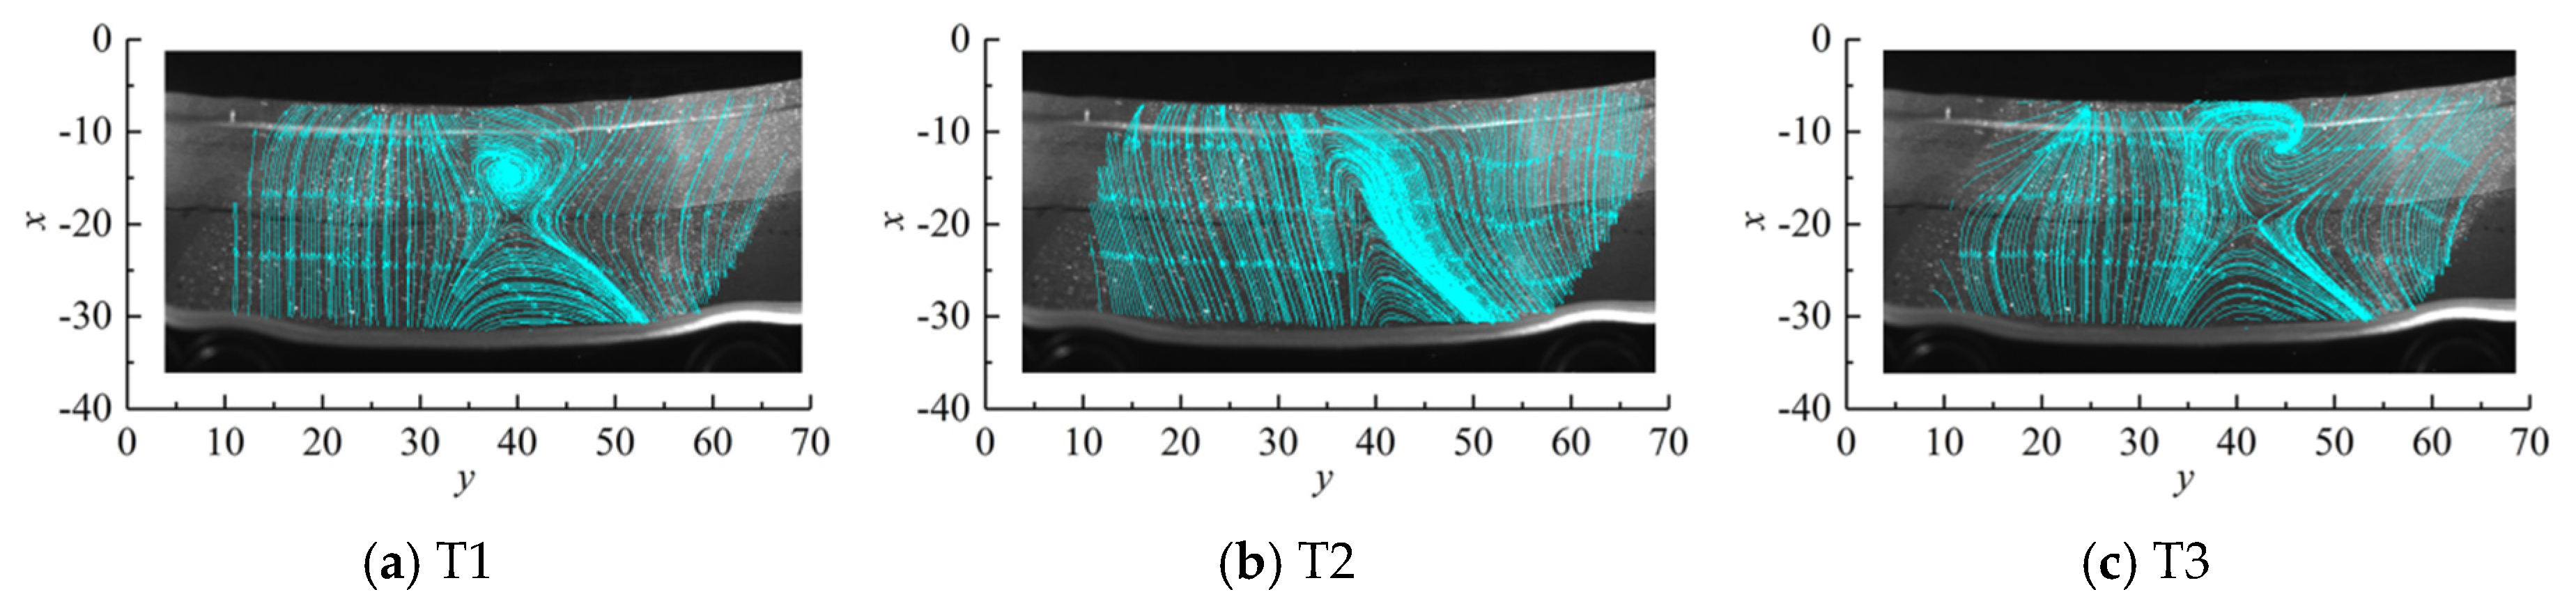
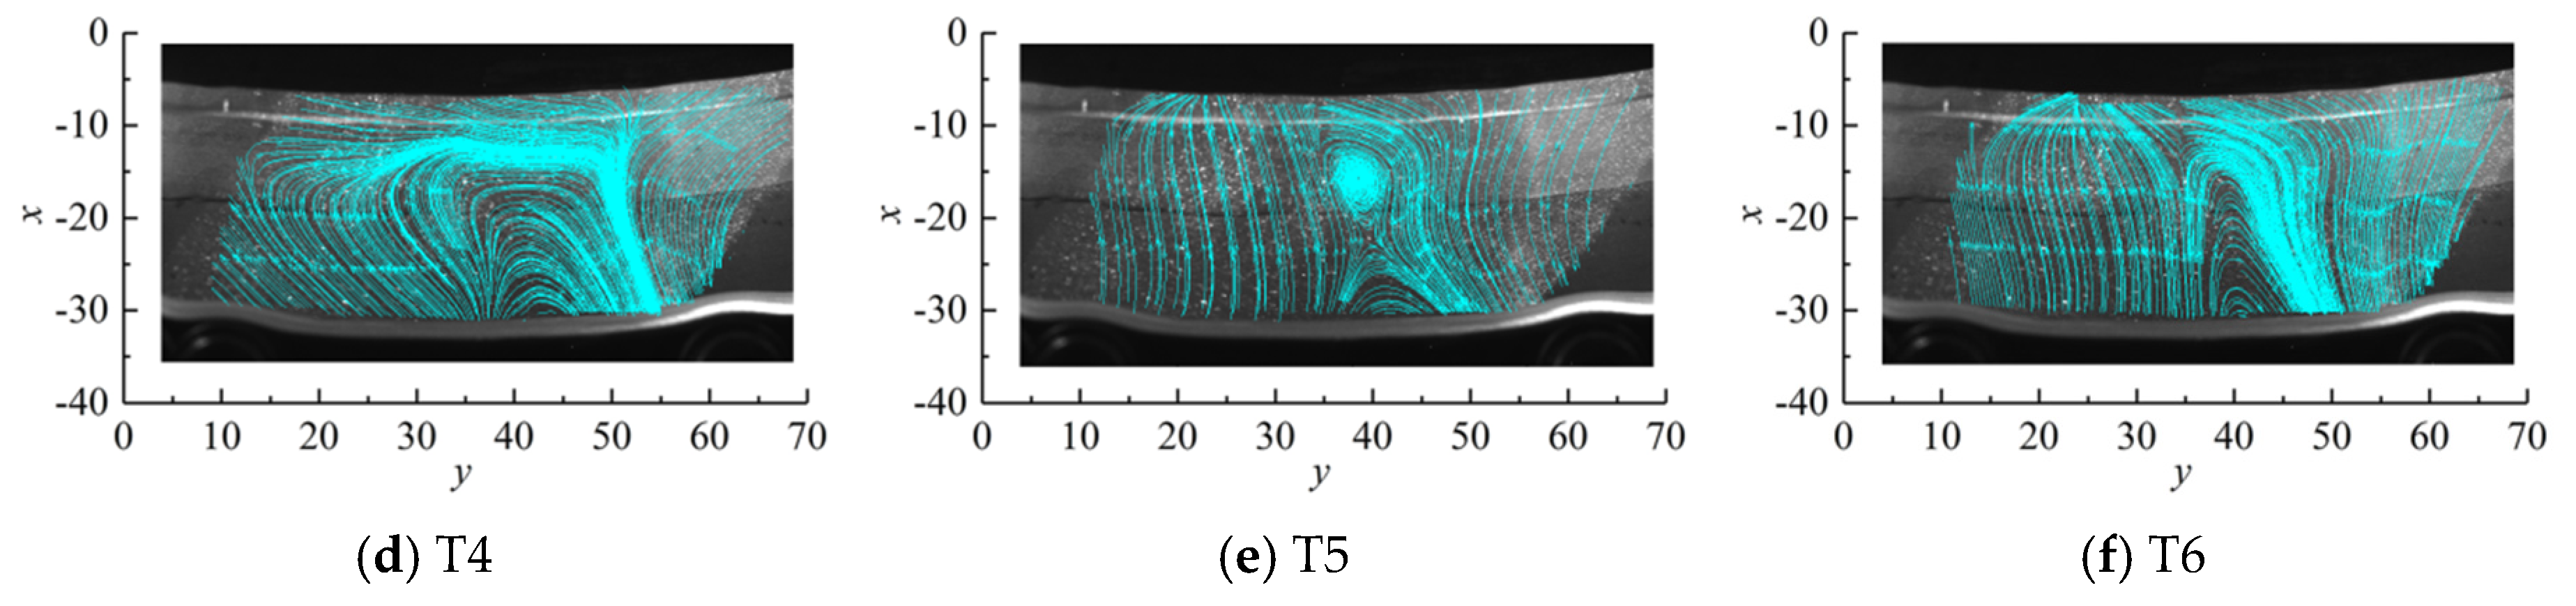
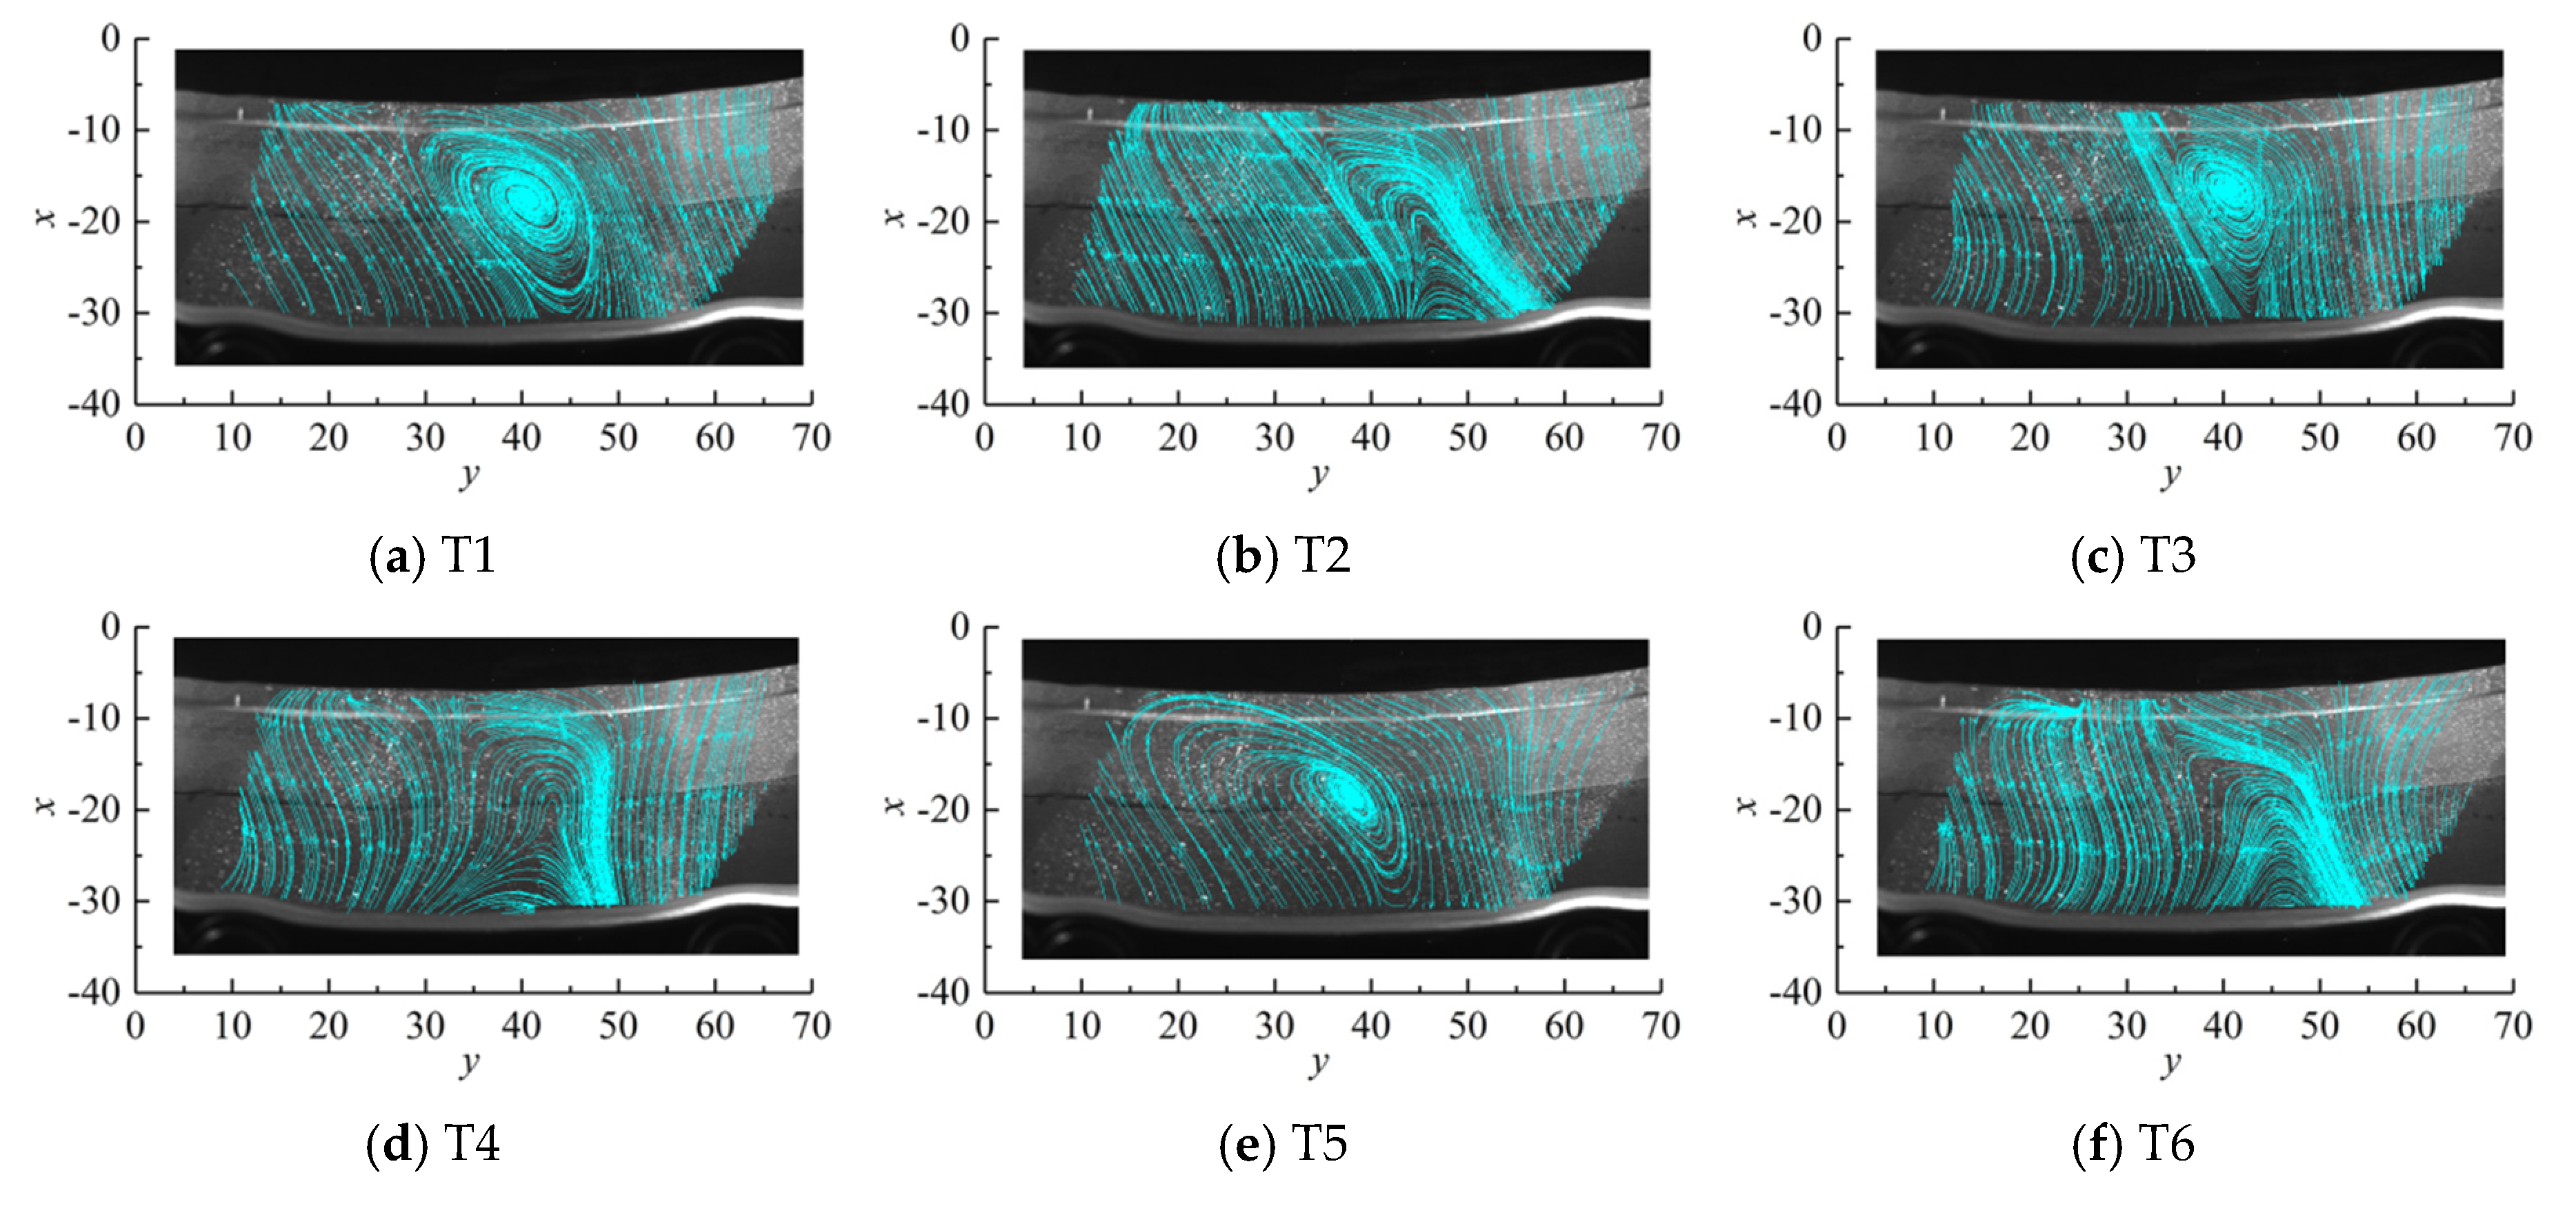
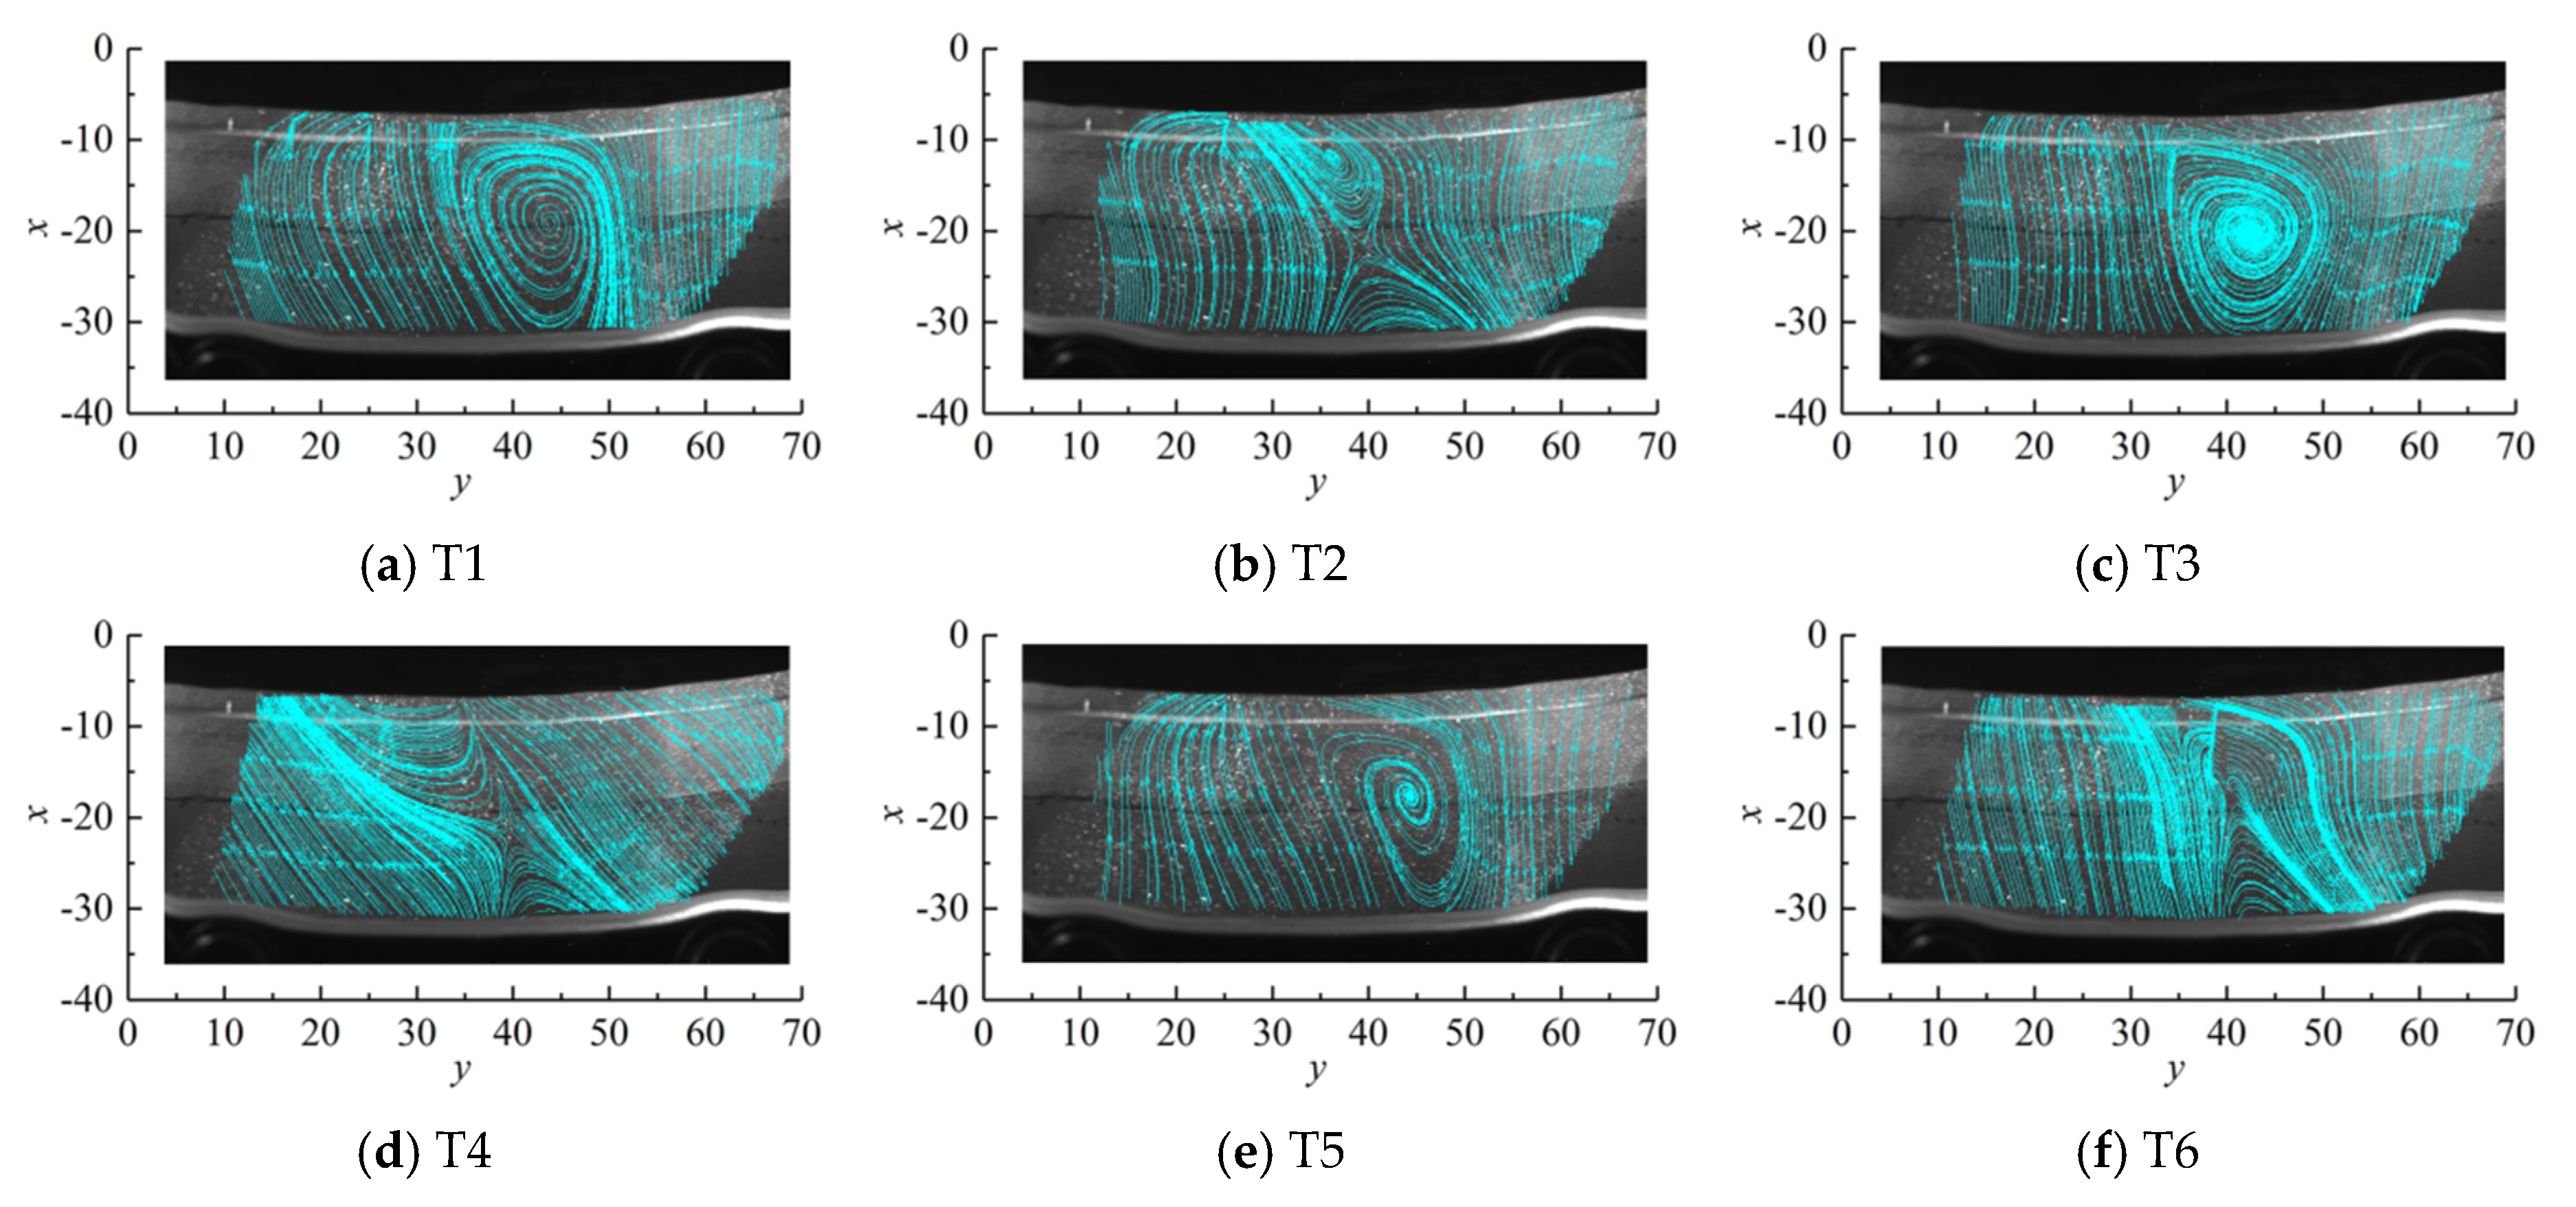
3.3. Test Results
4. Propagation Law of Pressure Pulsation in the Vaneless Space
Full-Flow Channel Pressure Pulsation Characteristics
5. Conclusions
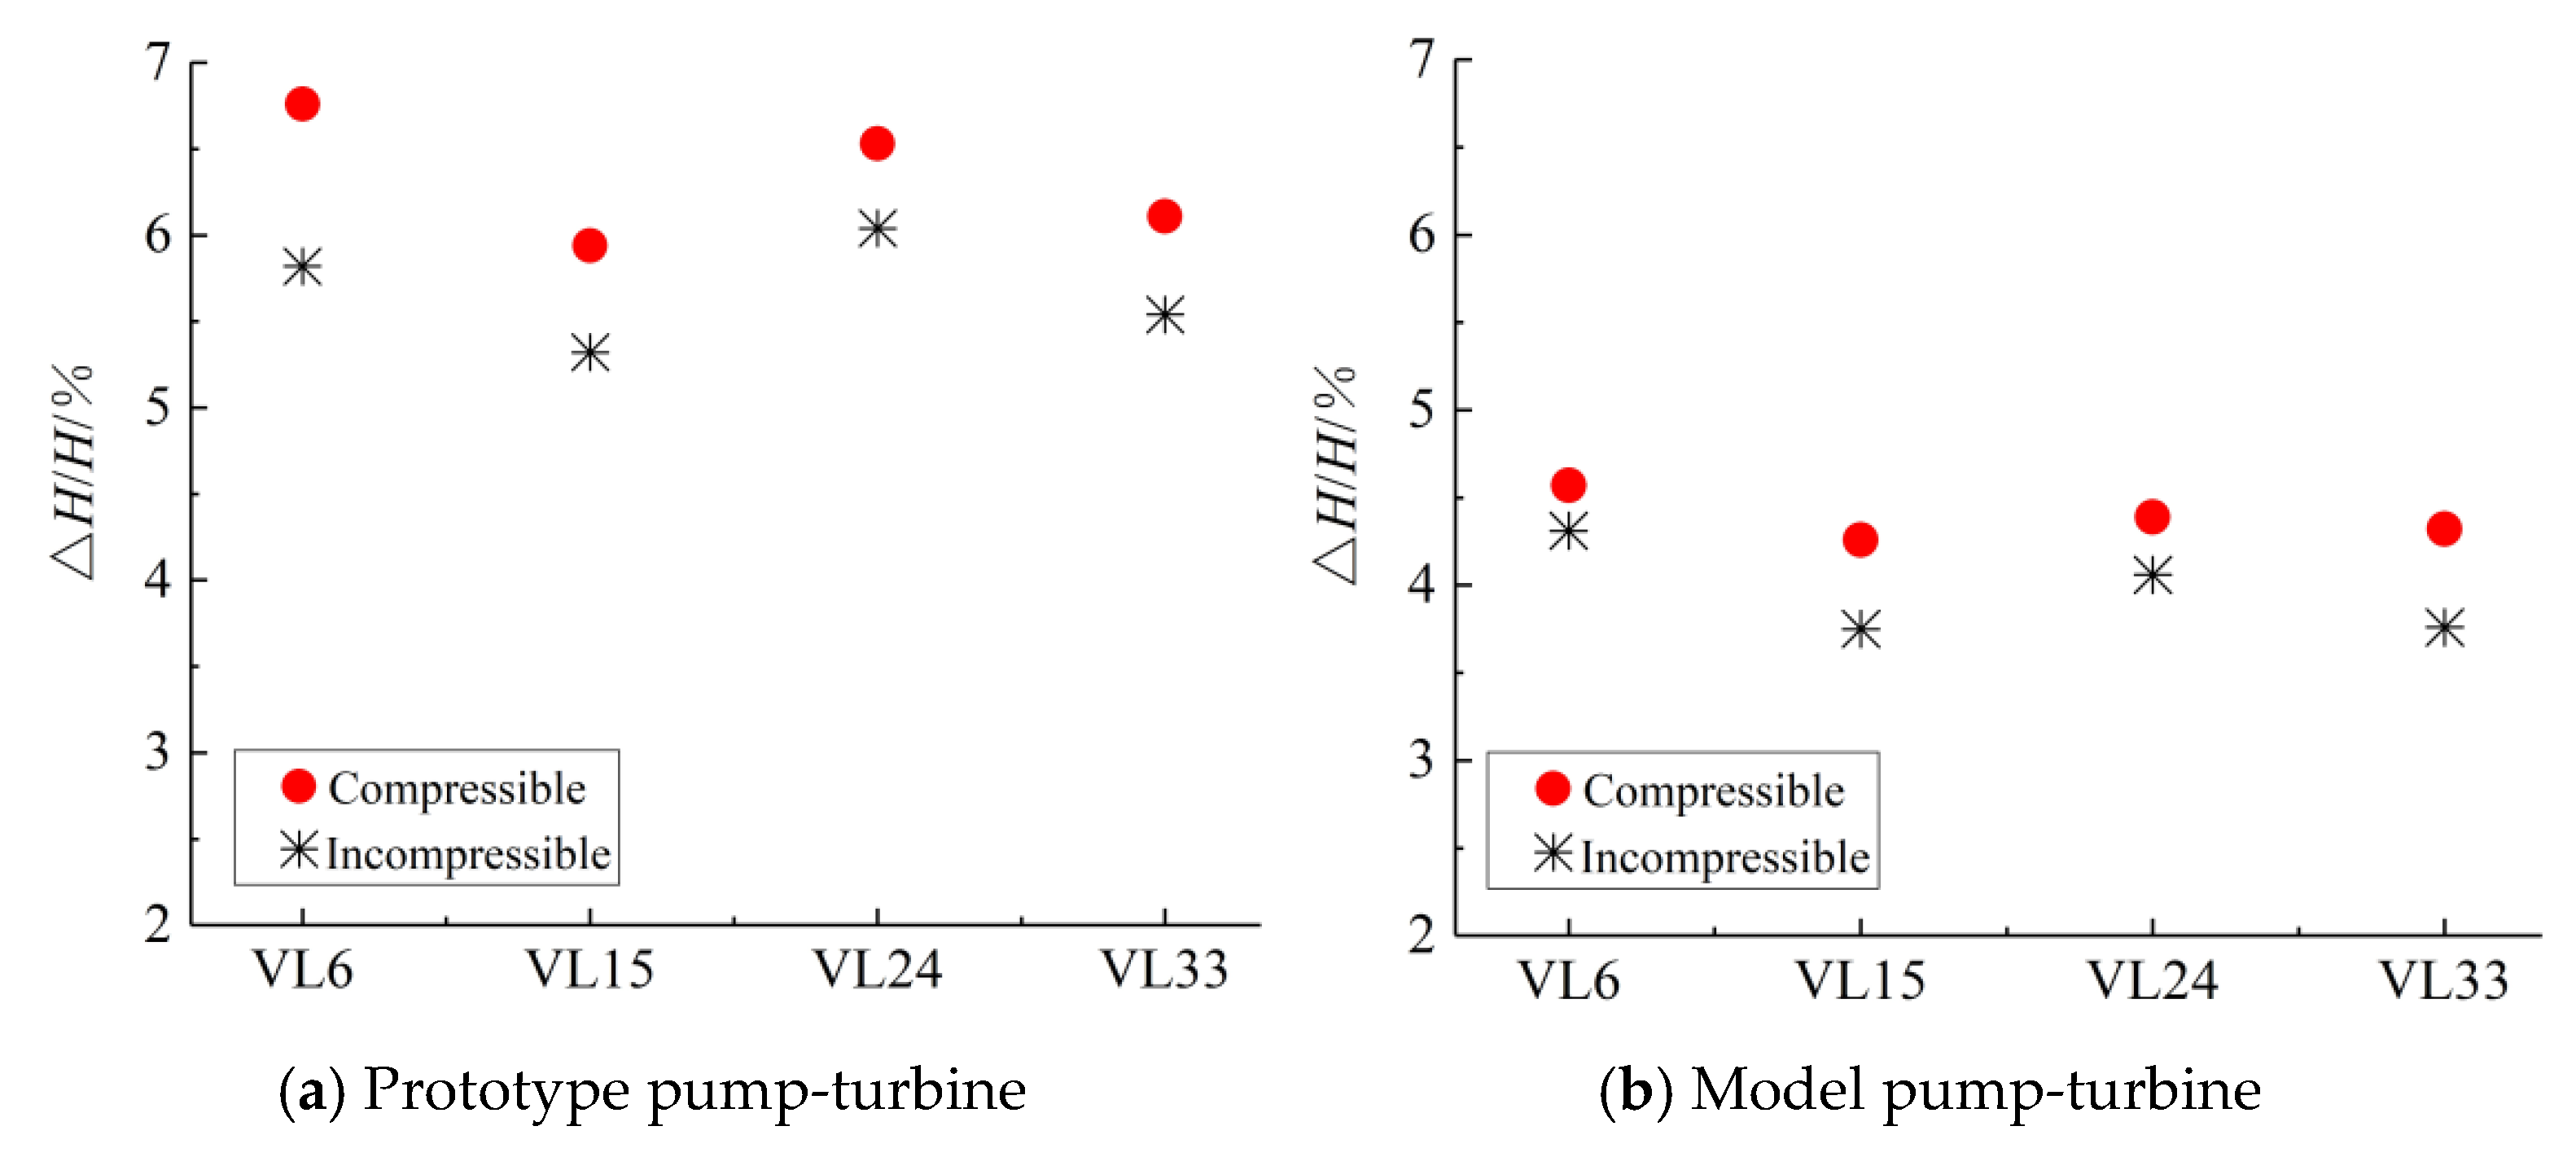
- Under compressible conditions, the pressure pulsation value calculated by CFD is closer to the test measured value of the prototype pump-turbine, and the increased unit instability caused by the compressibility of water should be considered in the design of high-head pump-turbines.
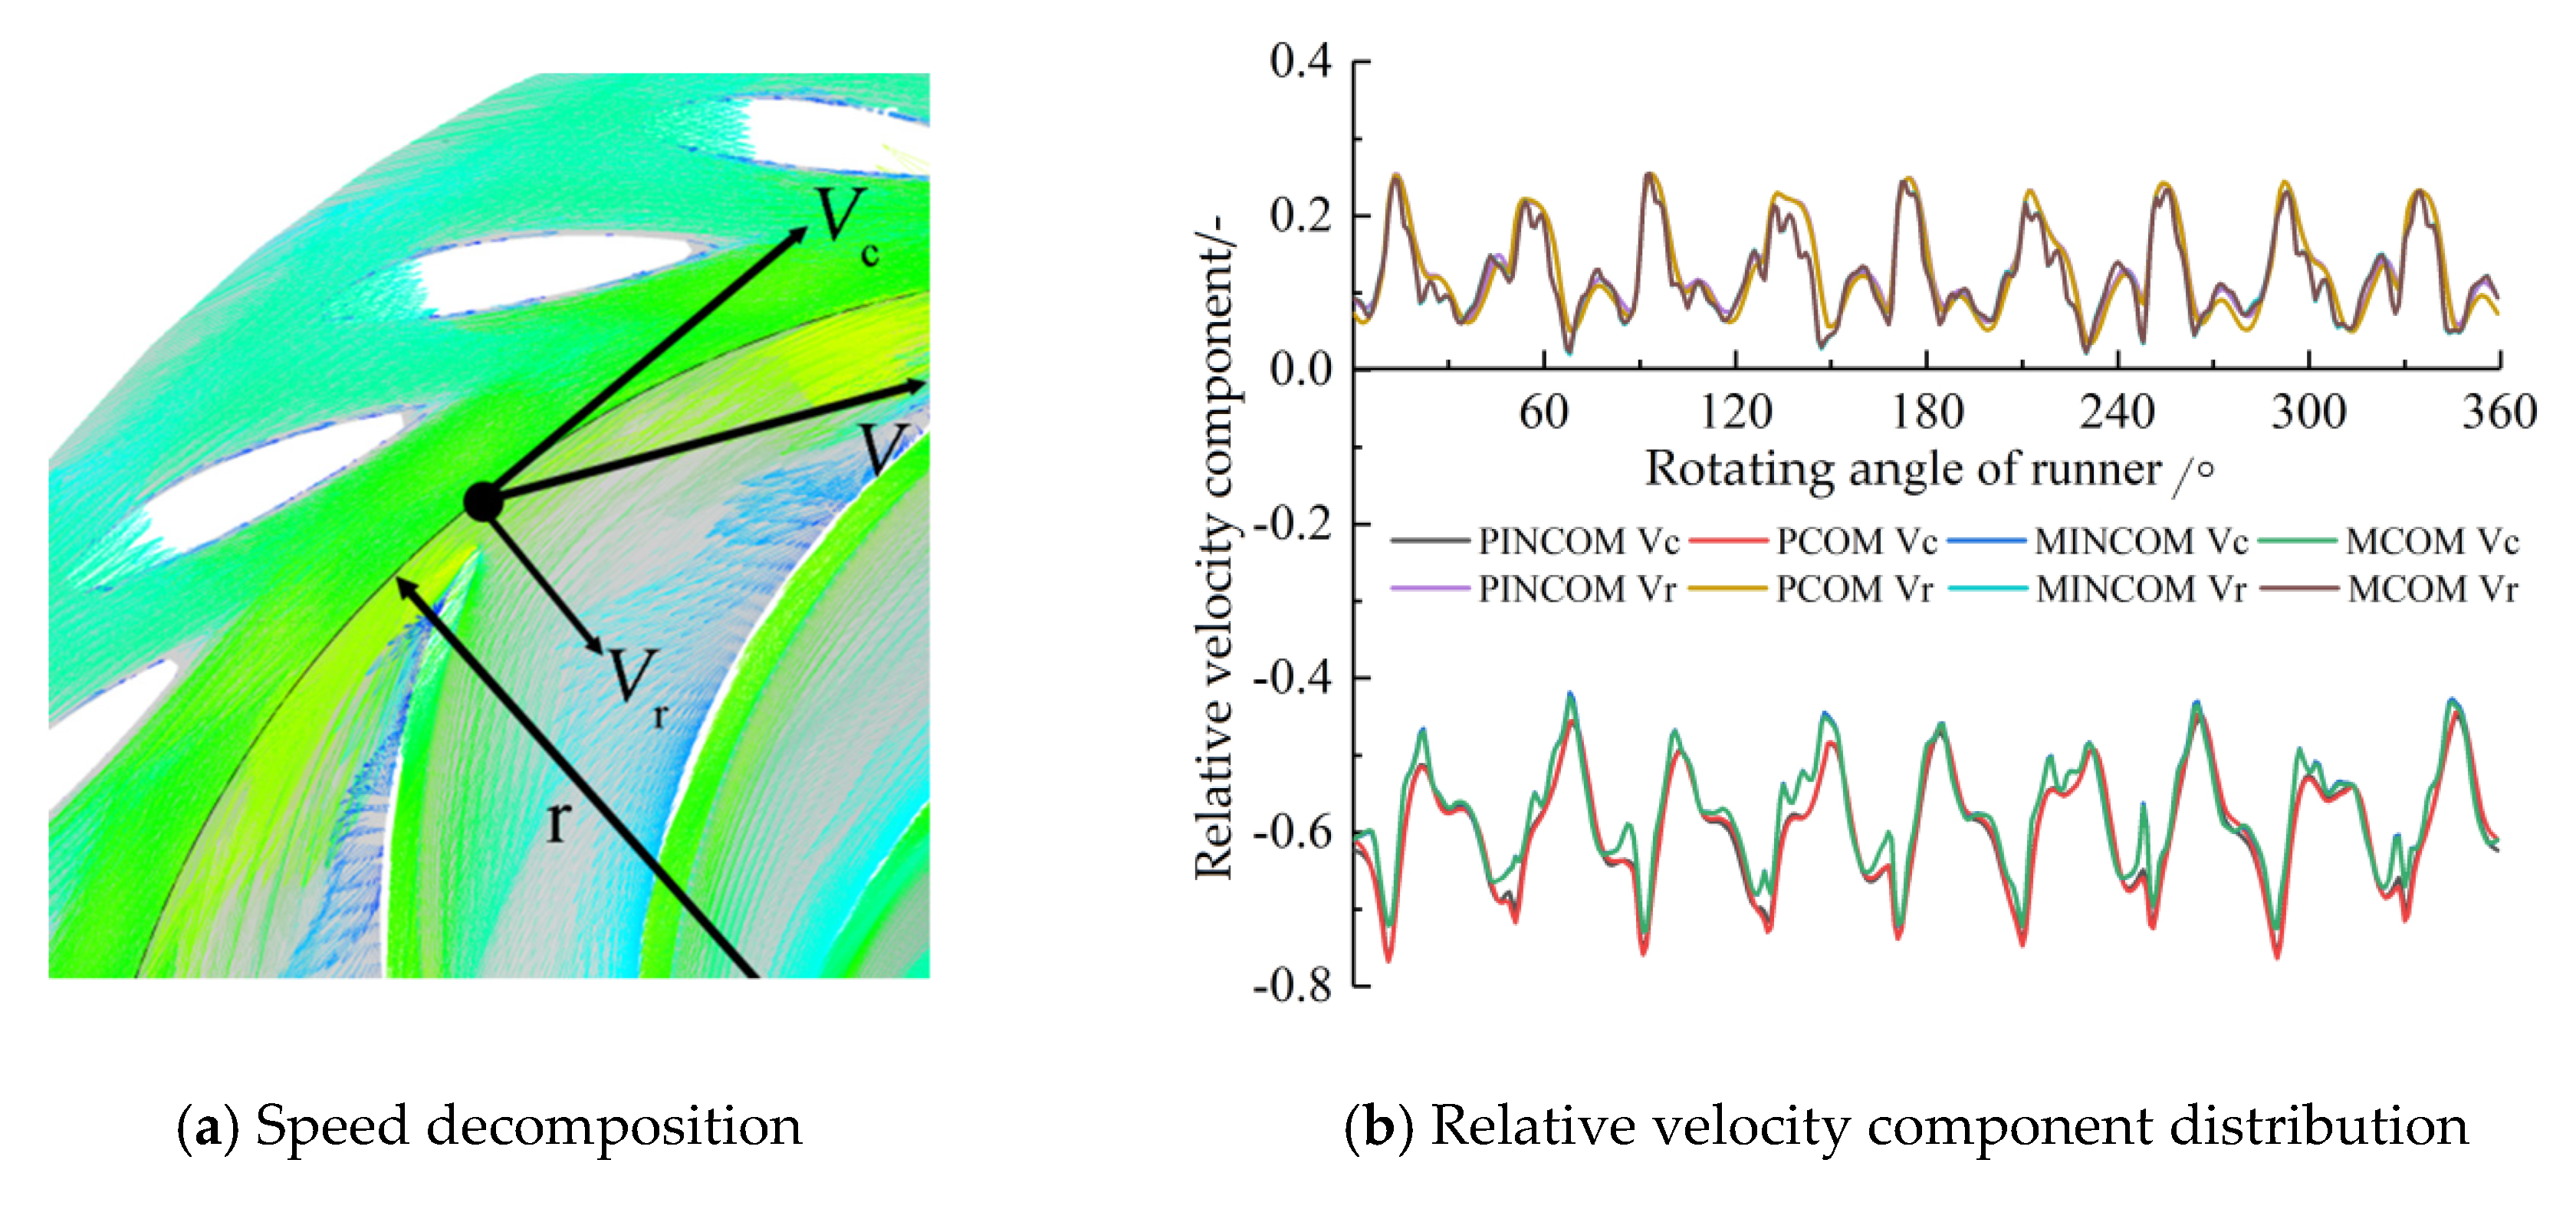
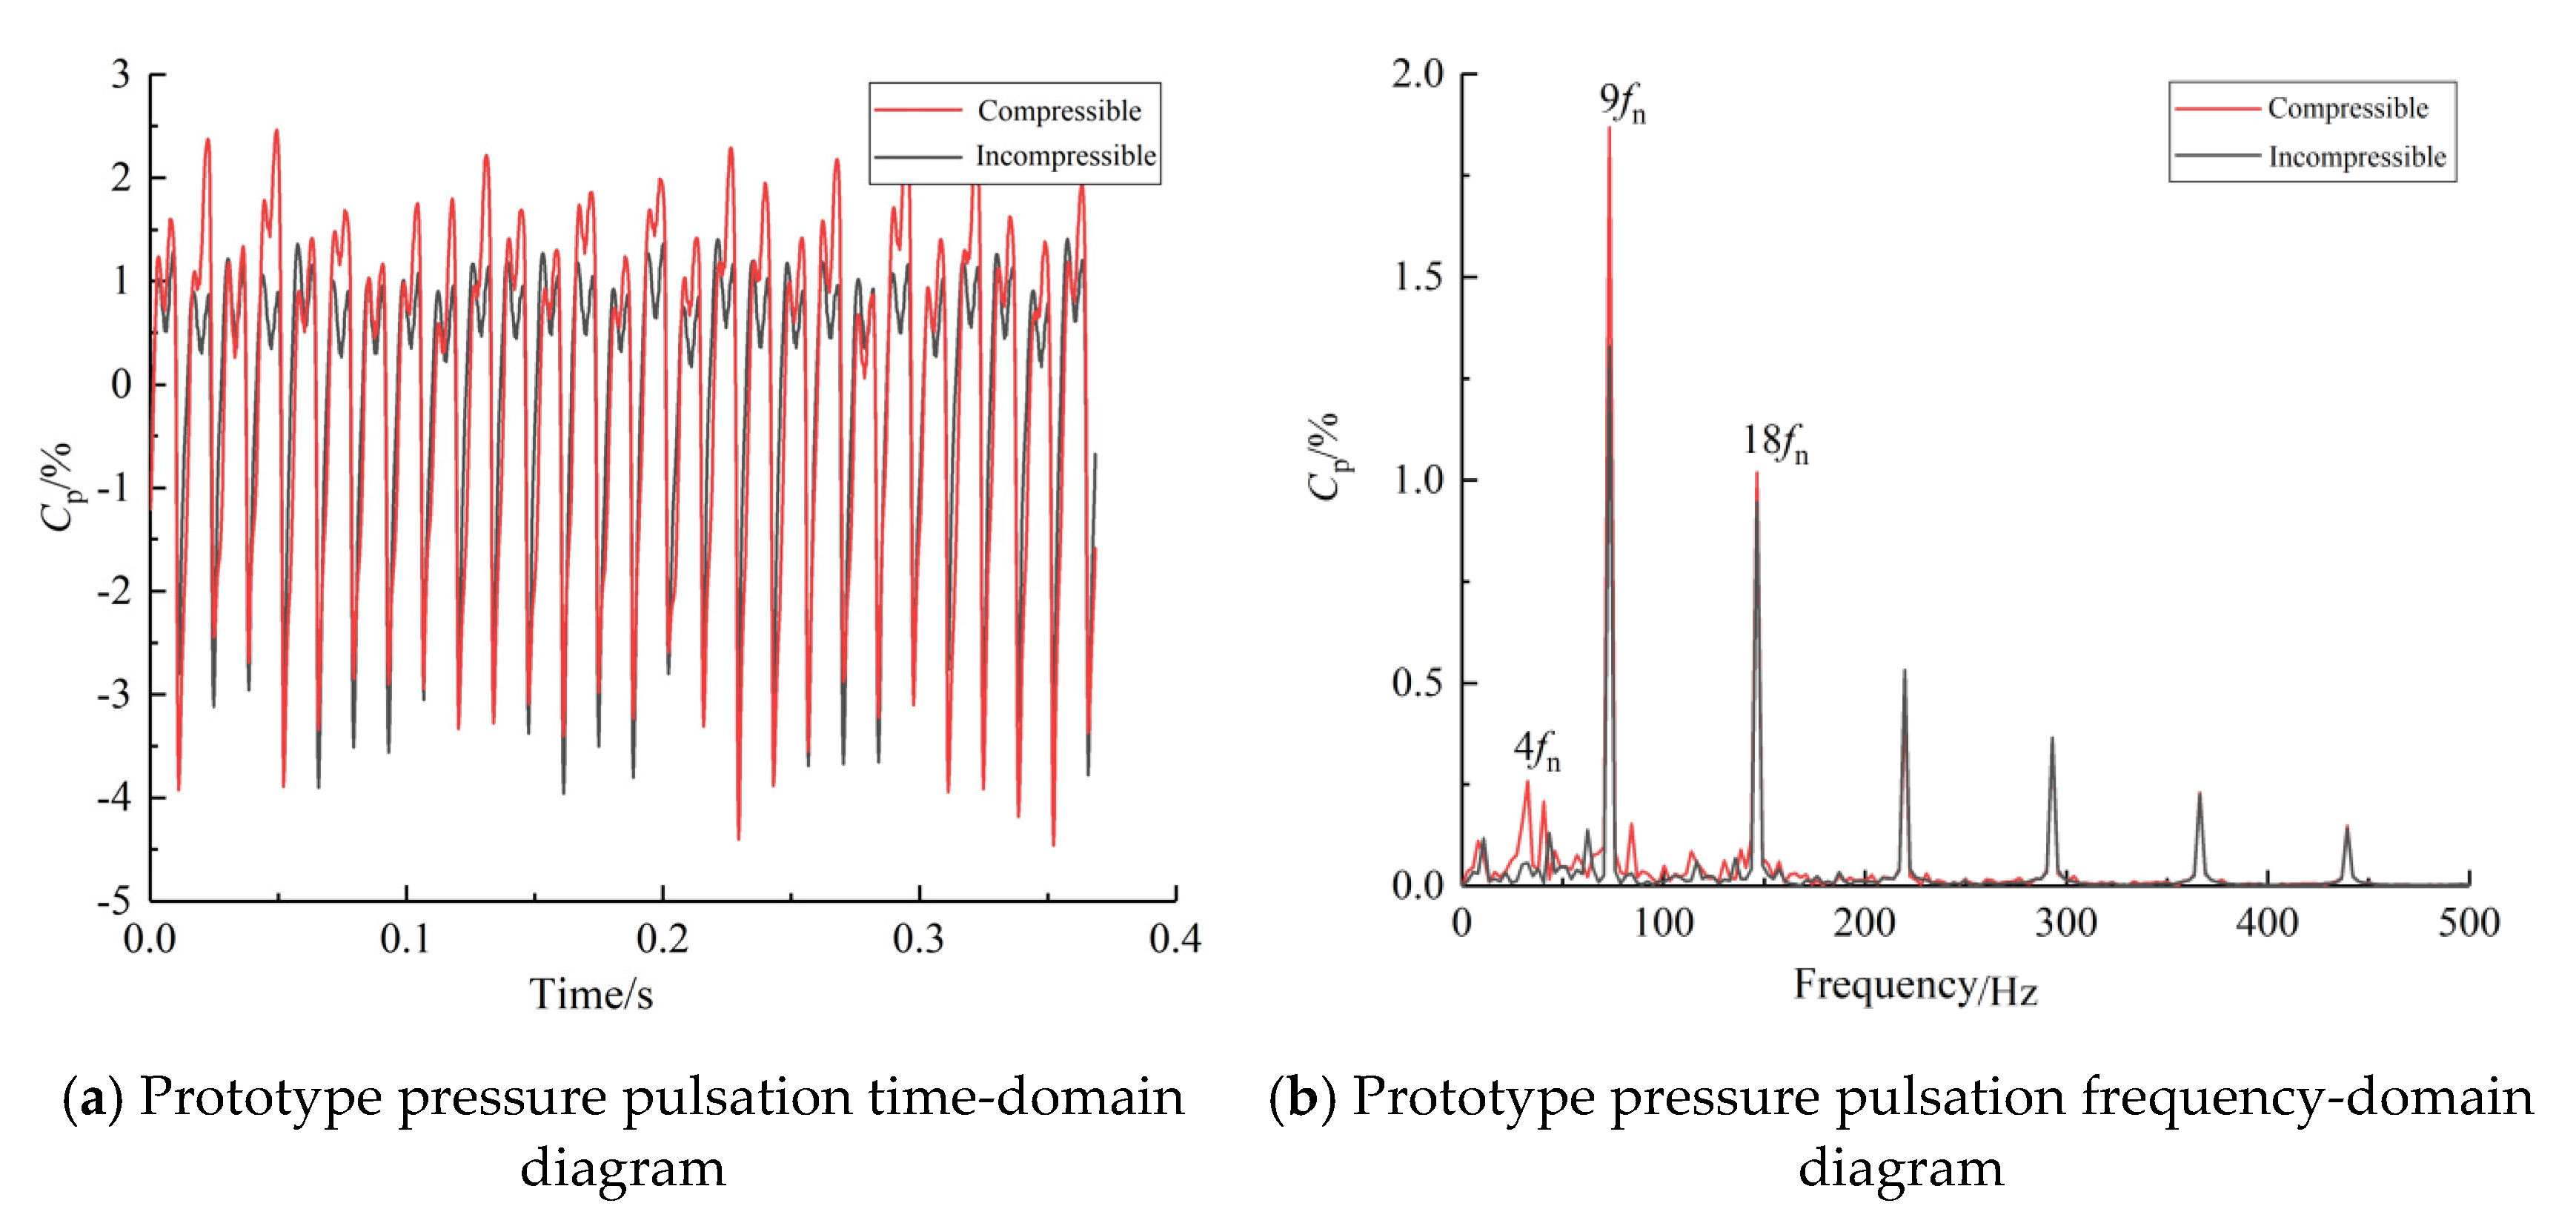
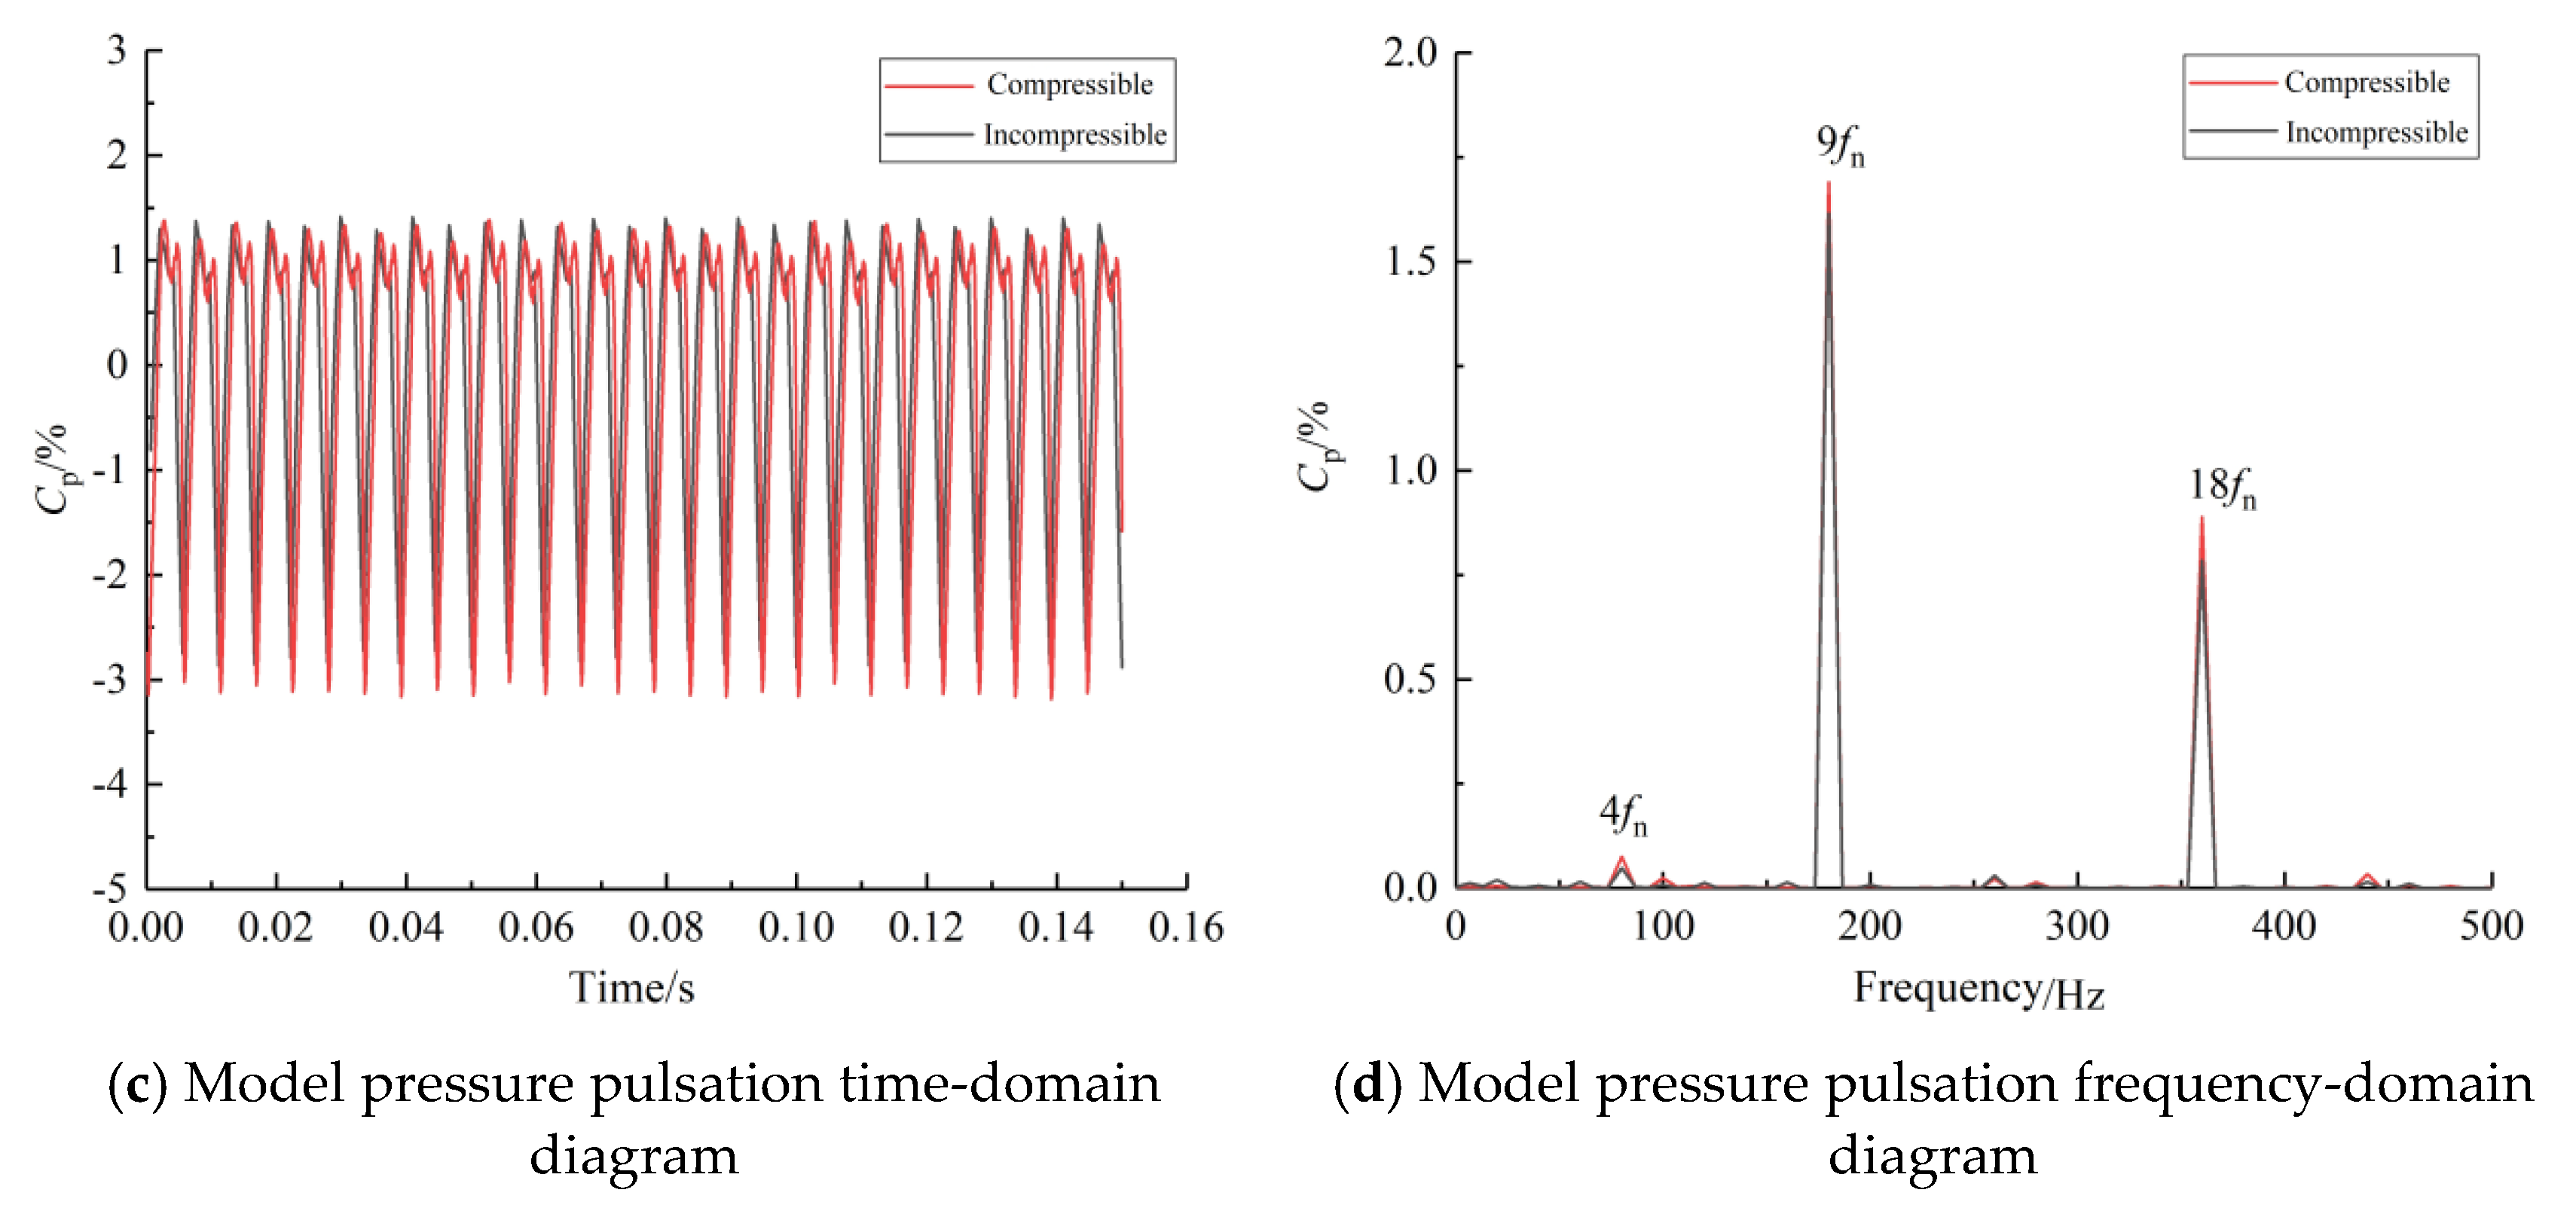
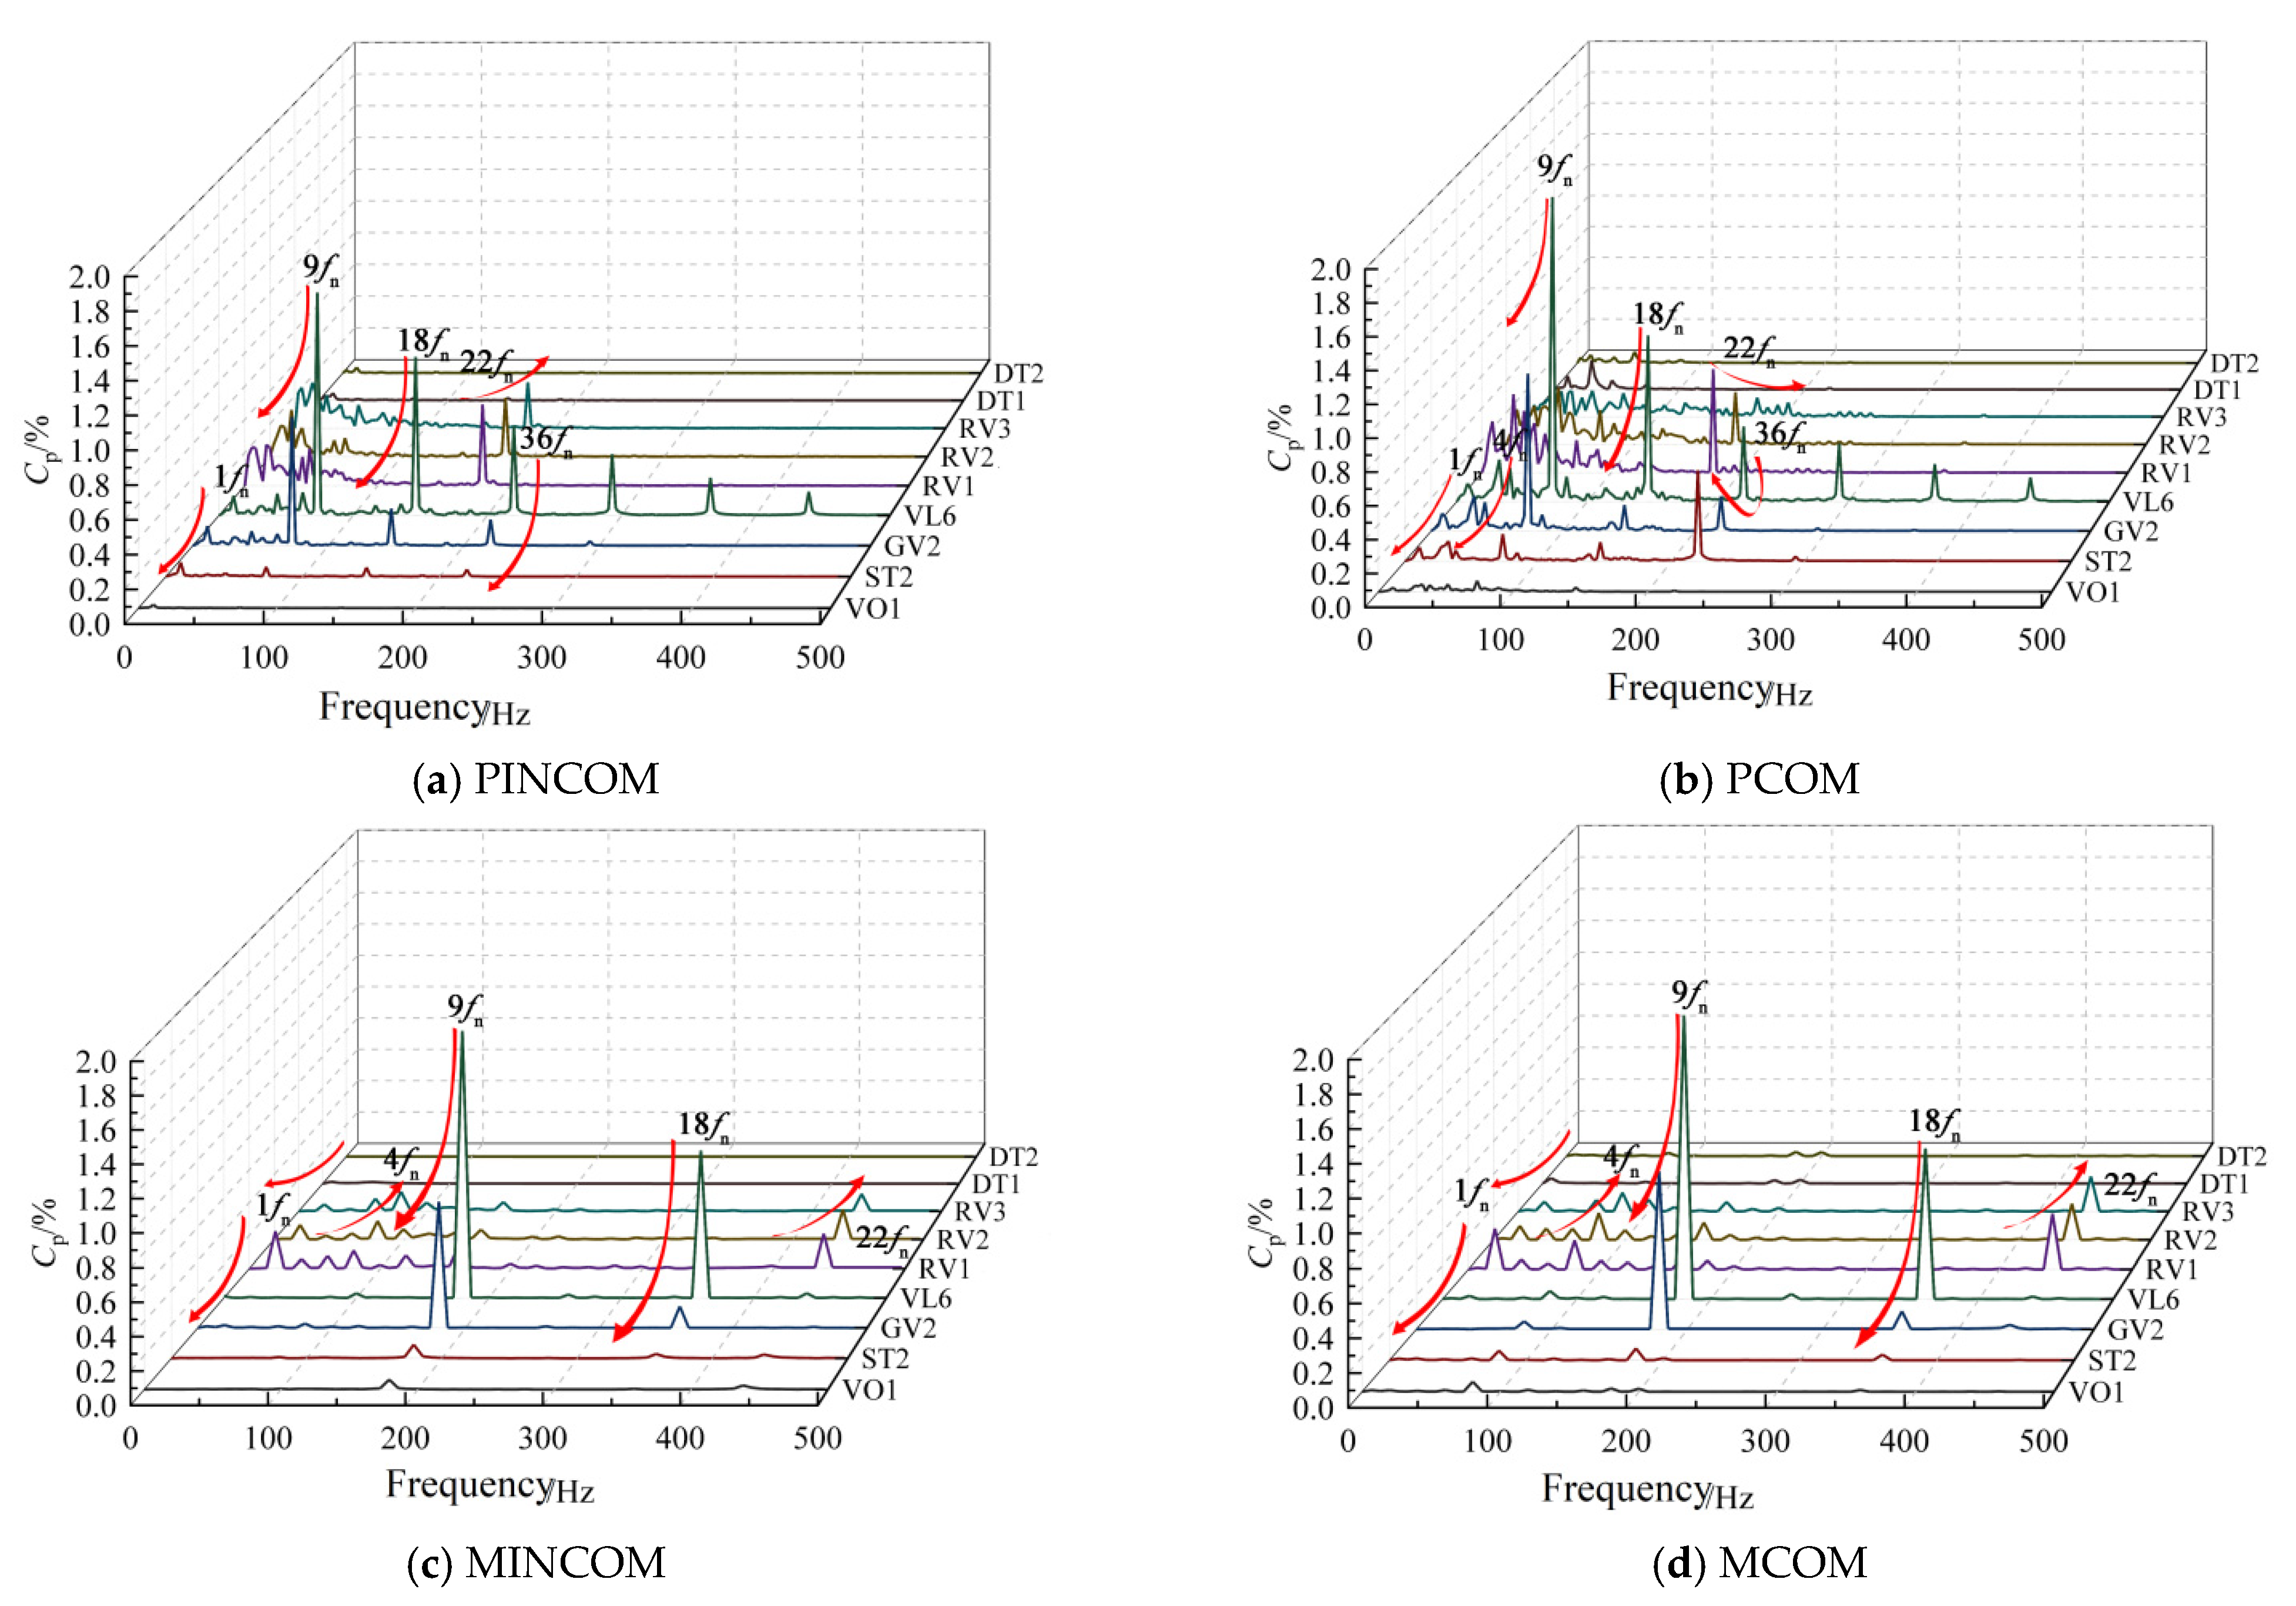
- Important causes of instability in the vaneless space of pump-turbines include RSI and vortex flow; RSI is the main source of instability, while the vortex motion in the vaneless space enhances the pressure pulsation caused by RSI. The main frequencies of pressure pulsation in the vaneless space of the prototype and the model pump-turbine are all RSI frequencies, and their harmonic frequencies, in addition to the relative pressure pulsation amplitude, are low in relation to the runner inlet runner pressure side flow separation 4fn.
- This unsteady vortex structure in the vaneless space owing to the operation of the unit in a non-optimal operating zone, has been identified by PIV tests as exacerbating flow instability in the vaneless space. This is caused by the negative attack angle resulting from the mismatch between the runner inlet water flow angle and the runner inlet blade placement angle, which generates a stall vortex on the pressure side of the runner inlet and a backflow structure near the runner inlet. With the change of operating conditions, the disturbance decreases with the increase in the unit load in the unit operating range and increases with the increase in the speed under the same load condition.
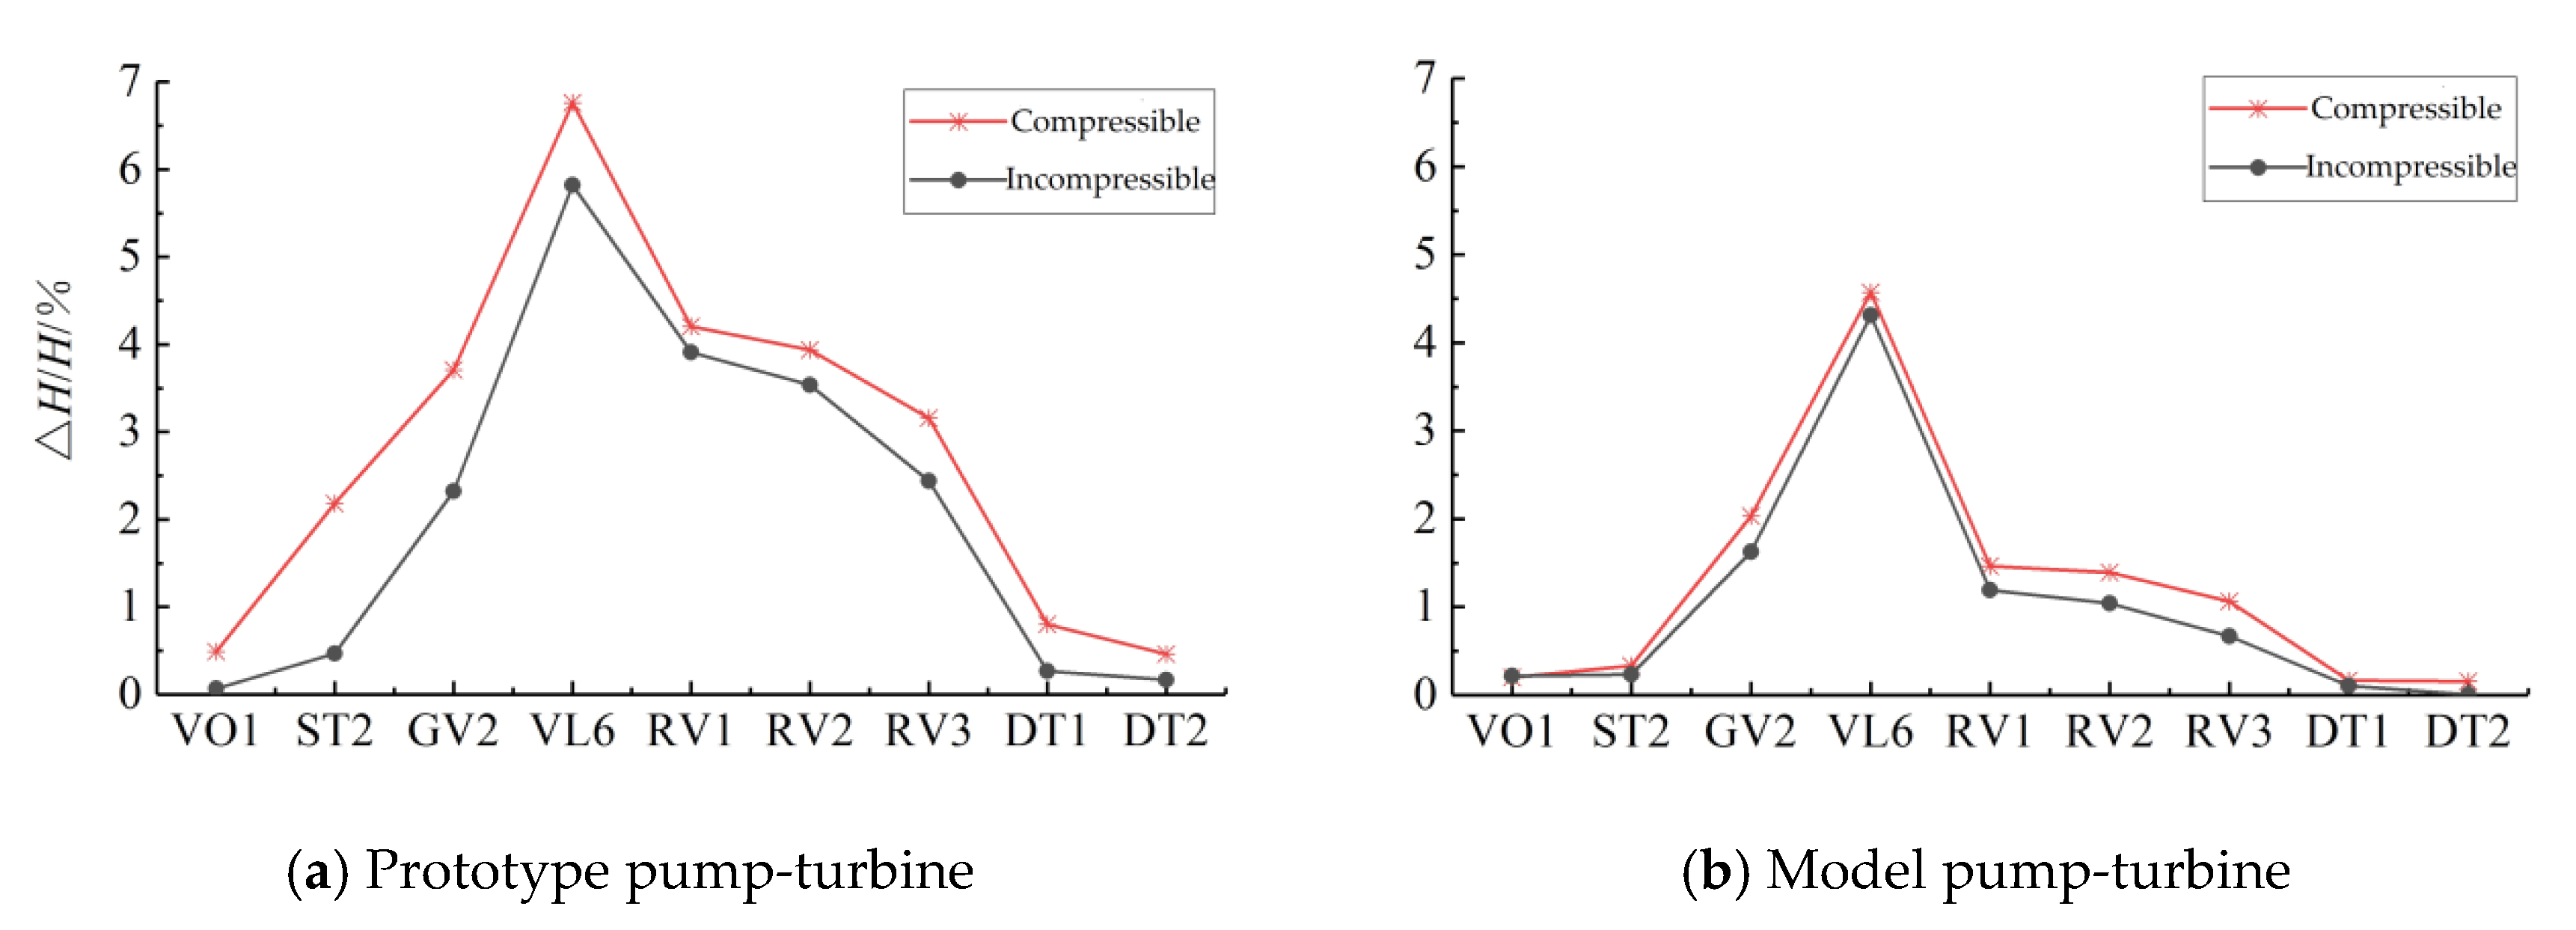
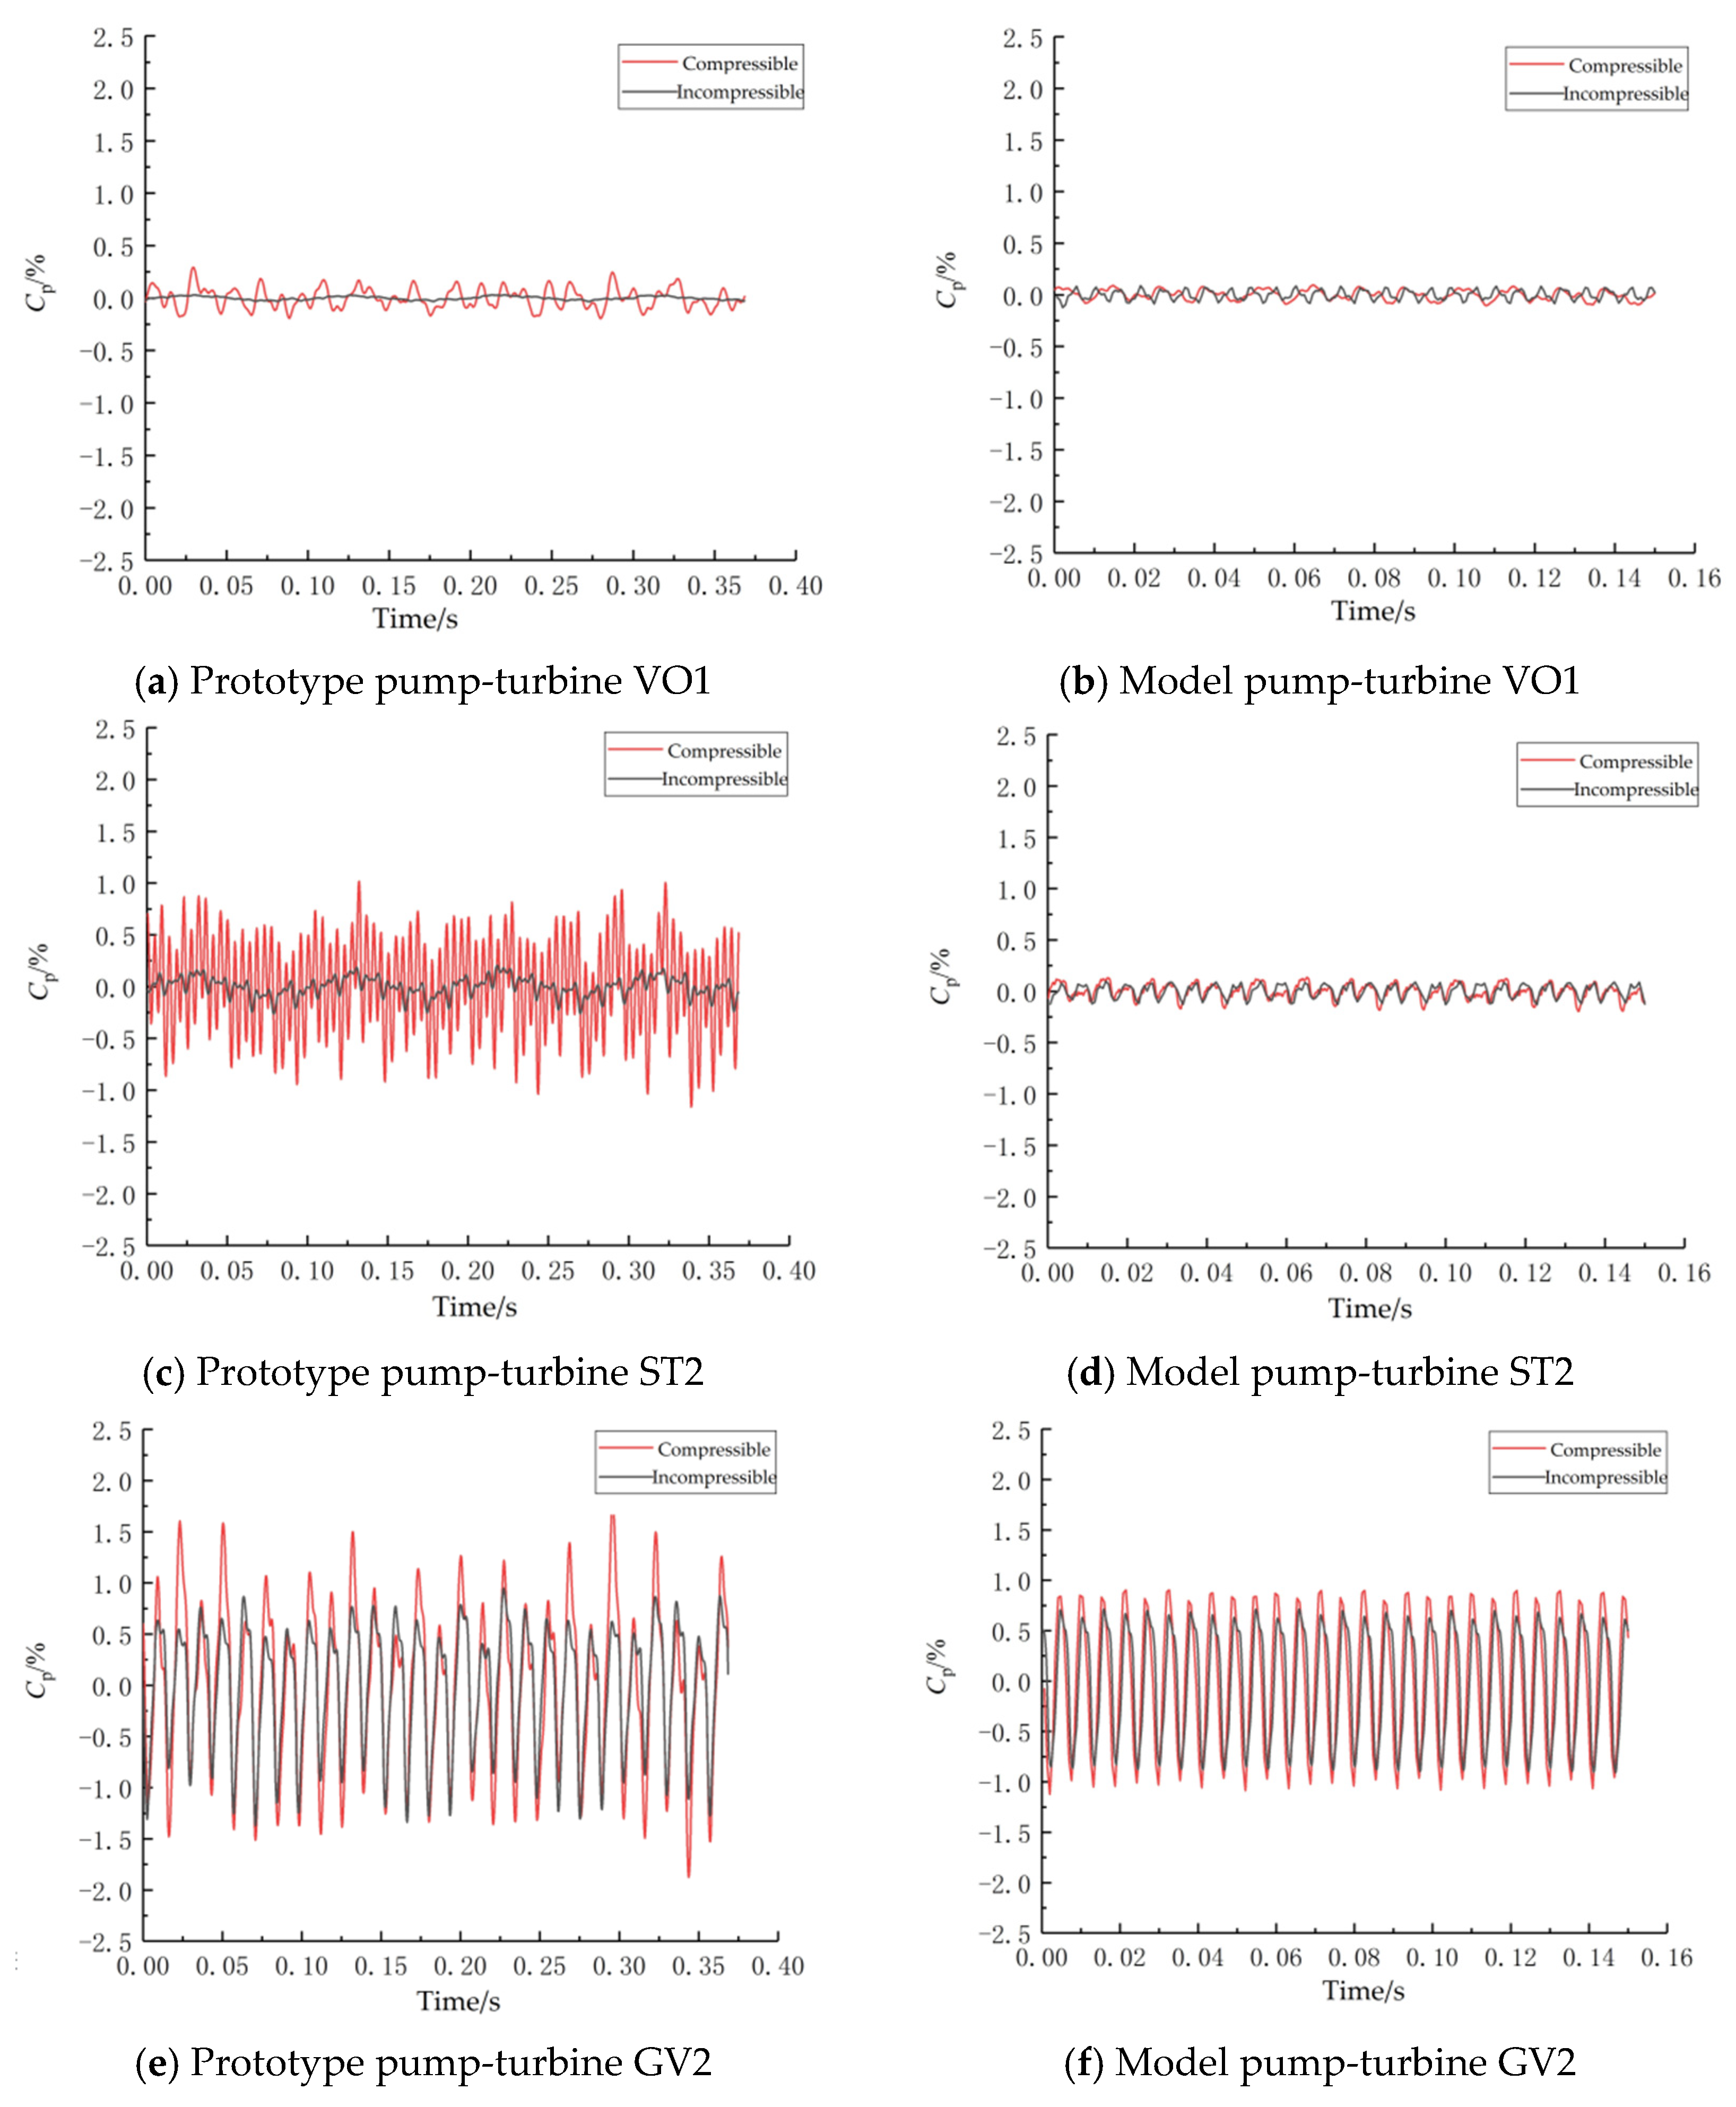
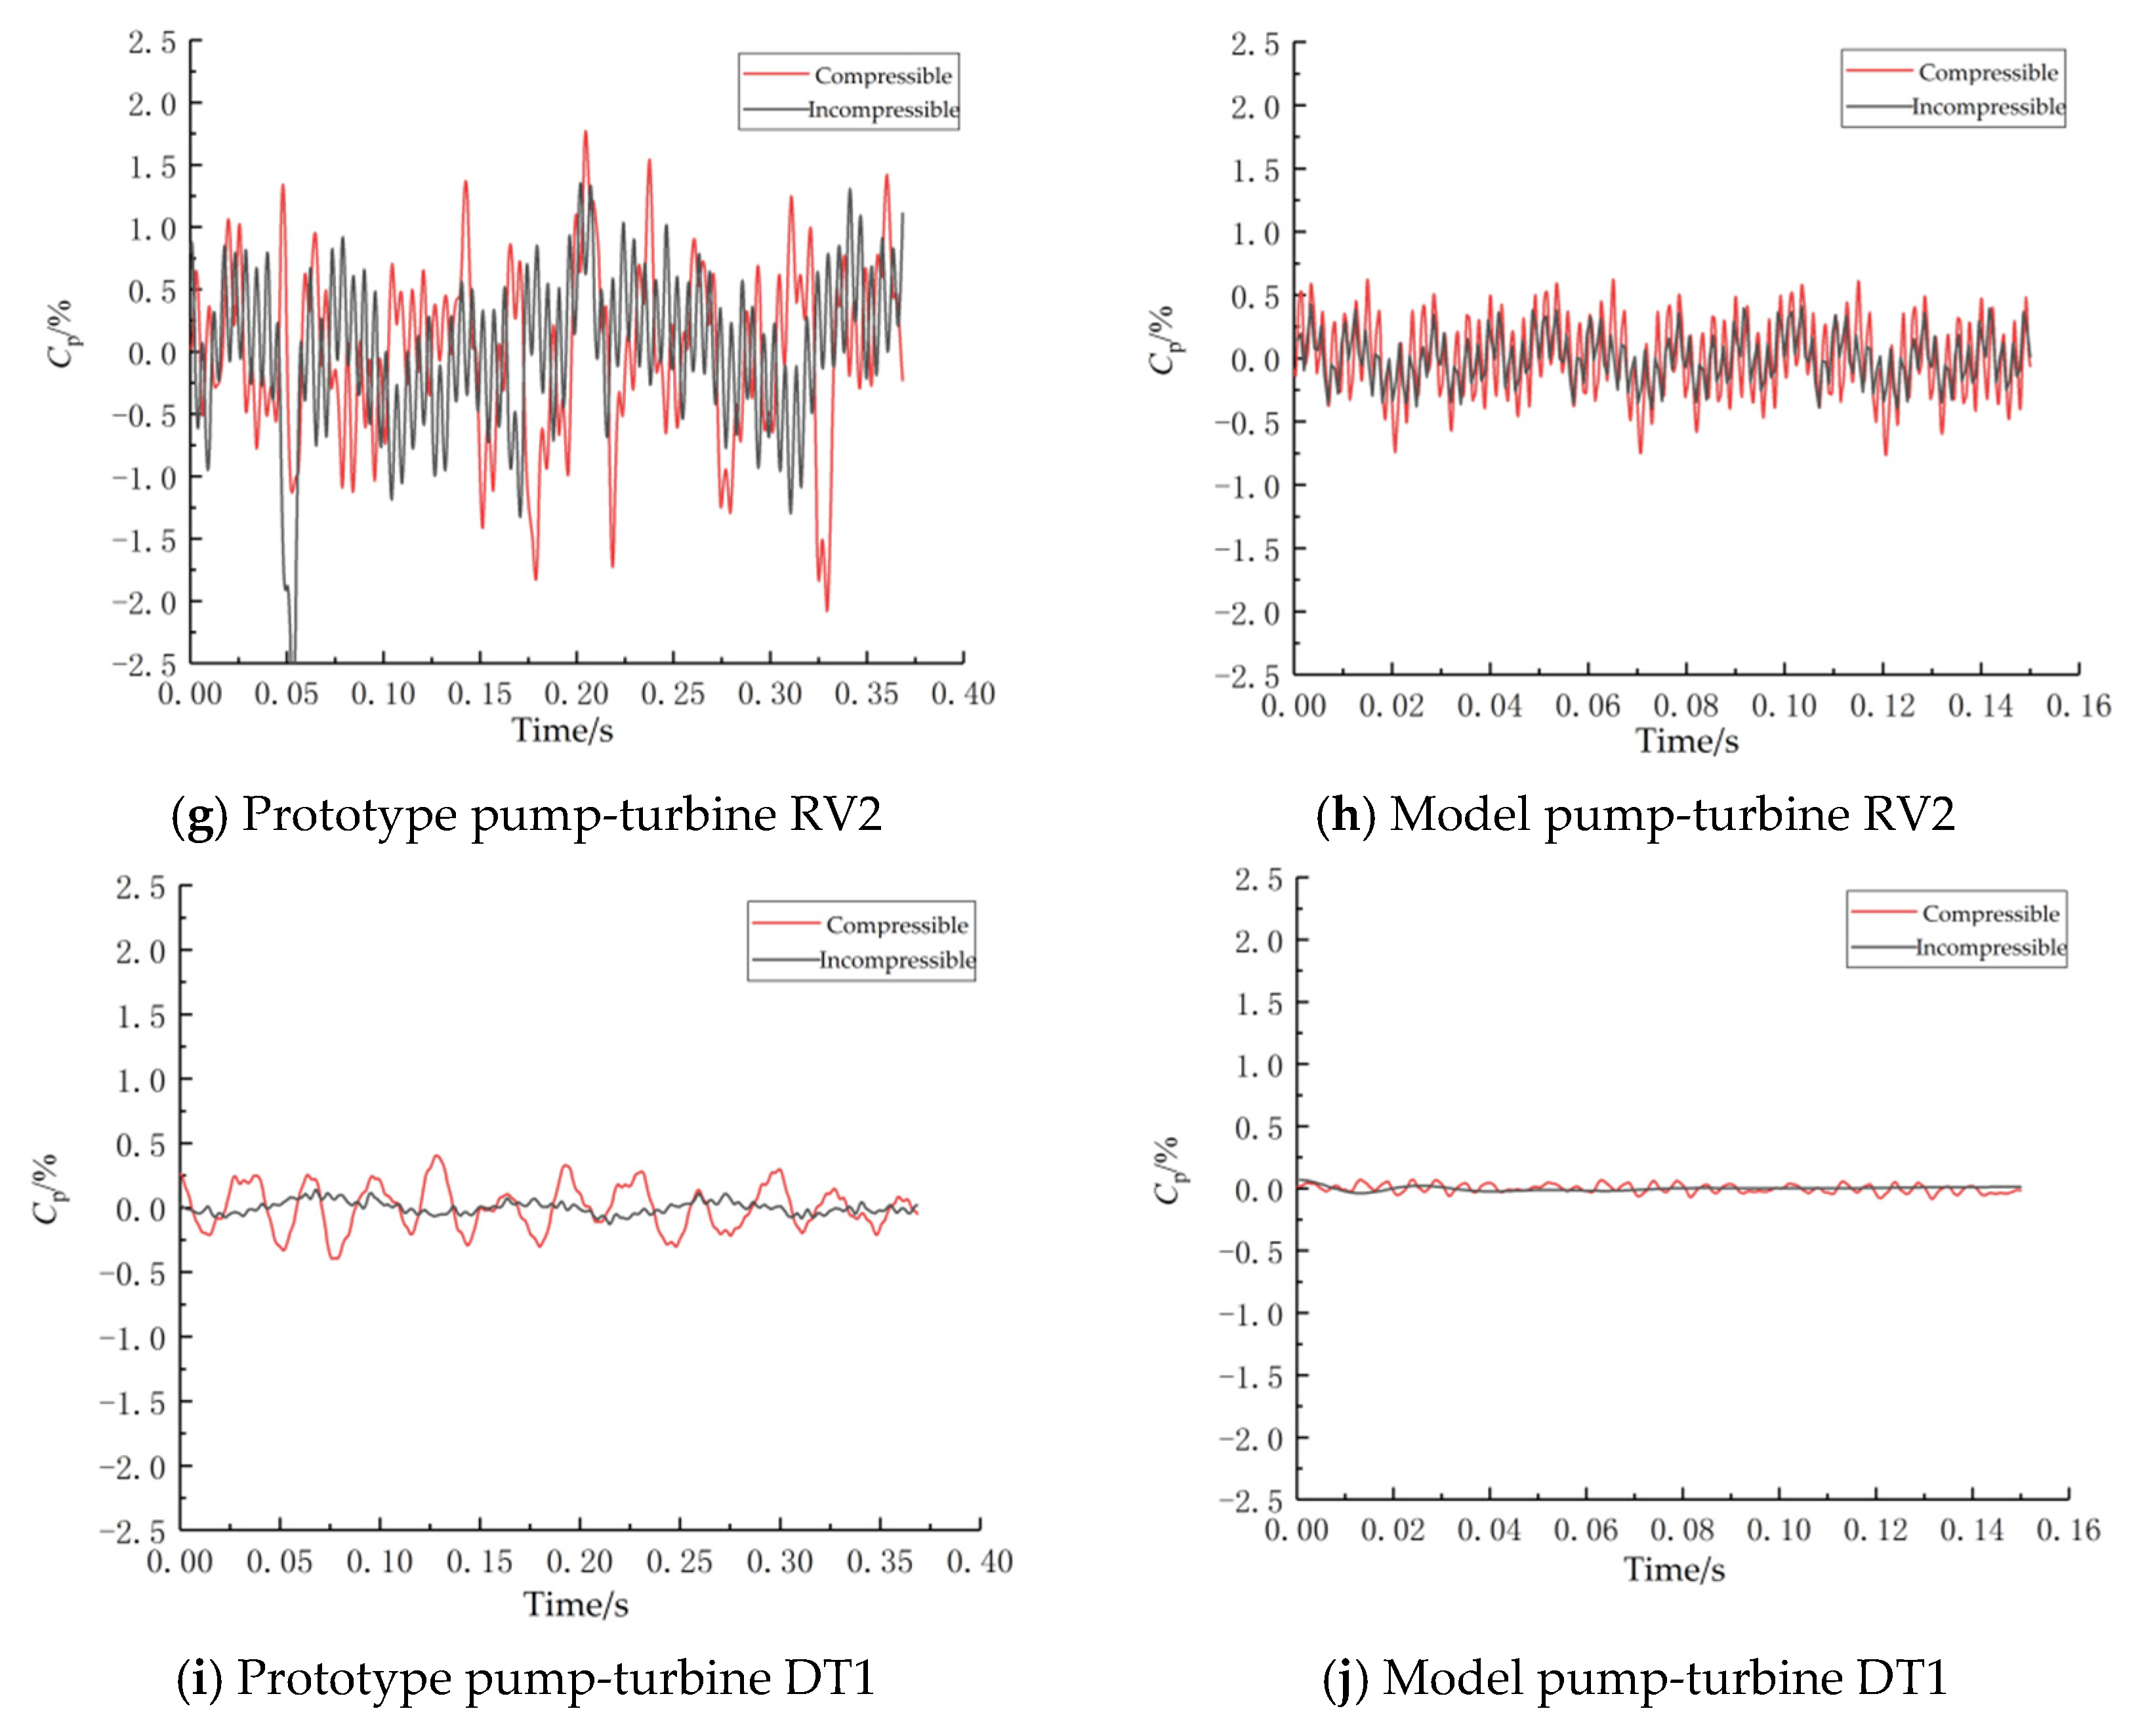
- The influence of the weak compressibility of water on the propagation law of pressure pulsation in the full-flow channel of the prototype and model pump-turbine is generally similar but with some variability. Considering the weak compressibility of water, the fluctuation of pressure pulsation in each flow channel of the prototype and model pump-turbine is increased to different degrees, but this effect is more obvious at the prototype scale, and the harmonic frequency 36fn of RSI at the prototype scale is amplified during the propagation along the upstream. This indicates that the pressure wave disturbance due to the weak compressibility of water is different in the prototype and model scales of the high-head Francis-type pump-turbine. This difference is attributed to acoustic resonance.
Author Contributions
Funding
Institutional Review Board Statement
Informed Consent Statement
Data Availability Statement
Acknowledgments
Conflicts of Interest
References
- Xia, L.; Cheng, Y.; Yang, J.; Cai, F. Evolution of flow structures and pressure fluctuations in the S-shaped region of a pump-turbine. J. Hydraul. Res. 2019, 57, 107–121. [Google Scholar] [CrossRef]
- Cavazzini, G.; Houdeline, J.B.; Pavesi, G.; Teller, O.; Ardizzon, G. Unstable behaviour of pump-turbines and its effects on power regulation capacity of pumped-hydro energy storage plants. Renew. Sust. Energ. Rev. 2018, 94, 399–409. [Google Scholar] [CrossRef]
- Zuo, Z.; Liu, S. Flow-Induced Instabilities in Pump-Turbines in China. Engineering 2017, 3, 504–511. [Google Scholar] [CrossRef]
- Landry, C.; Favrel, A.; Muller, A.; Nicolet, C.; Avellan, F. Local wave speed and bulk flow viscosity in Francis turbines at part load operation. J. Hydraul. Res. 2016, 54, 185–196. [Google Scholar] [CrossRef]
- Li, Z.; Bi, H.; Karney, B.; Wang, Z.; Yao, Z. Three-dimensional transient simulation of a prototype pump-turbine during normal turbine shutdown. J. Hydraul. Res. 2017, 55, 520–537. [Google Scholar] [CrossRef]
- Dring, R.P.; Joslyn, H.D.; Hardin, L.W.; Wagner, J.H. Turbine Rotor-Stator Interaction. J. Eng. Gas Turbine Power 1982, 104, 729–742. [Google Scholar] [CrossRef]
- Rodriguez, C.G.; Egusquiza, E.; Santos, I.F. Frequencies in the vibration induced by the rotor stator interaction in a centrifugal pump turbine. J. Fluids Eng. 2007, 129, 1428–1435. [Google Scholar] [CrossRef]
- Staubli, T.; Senn, F.; Sallaberger, M. Instability of Pump-Turbines during Start-up in Turbine Mode. Hydro 2008, 2008, 6–8. [Google Scholar]
- Widmer, C.; Staubli, T.; Ledergerber, N. Unstable Characteristics and Rotating Stall in Turbine Brake Operation of Pump-Turbines. J. Fluids Eng. 2011, 4, 41101. [Google Scholar] [CrossRef]
- Widmer, C.; Staubli, T.; Tresch, T.; Sallaberger, M. Unstable Pump-Turbine Characteristics and Their Interaction with Hydraulic Systems; Hydro Vision: Charlotte, NC, USA, 2010. [Google Scholar]
- Yin, J.L.; Wang, D.Z.; Wang, L.Q.; Wu, Y.L.; Wei, X.Z. Effects of water compressibility on the pressure fluctuation prediction in pump turbine. IOP conference series. Earth Environ. Sci. 2012, 15, 62030. [Google Scholar]
- Yan, J.; Koutnik, J.; Seidel, U.; Hübner, B. Compressible Simulation of Rotor-Stator Interaction in Pump-Turbines. Int. J. Fluid Mach. Syst. 2010, 3, 315–323. [Google Scholar] [CrossRef][Green Version]
- Wang, L.K.; Lu, J.L.; Liao, W.L.; Zhao, Y.P.; Ji, Q.F. Numerical analysis of the hydraulic force of a pump turbine under partial load conditions in turbine mode. IOP conference series. Earth Environ. Sci. 2019, 240, 72041. [Google Scholar]
- Trivedi, C. Compressible Large Eddy Simulation of a Francis Turbine During Speed-No-Load: Rotor Stator Interaction and Inception of a Vortical Flow. J. Eng. Gas Turbines Power 2018, 140, 112601. [Google Scholar] [CrossRef]
- Trivedi, C.; Dahlhaug, O.G. Interaction between trailing edge wake and vortex rings in a Francis turbine at runaway condition: Compressible large eddy simulation. Phys. Fluids 2018, 30, 75101. [Google Scholar] [CrossRef]
- Guo, C.Y.; Gui, Y.F.; Hang, Y.; Xu, P. Experimental study on the evolution of solitary wave flow structure based on PIV. J. Huazhong Univ. Sci. Technol. Nat. Sci. 2021, 9, 114–119. (In Chinese) [Google Scholar] [CrossRef]
- De Gregorio, F.; Visingardi, A.; Iuso, G. An experimental-numerical investigation of the wake structure of a hovering rotor by PIV combined with a r2 vortex detection criterion. Energies 2021, 14, 2613. [Google Scholar] [CrossRef]
- Jasper, S.; Hussong, J.; Lindken, R. PIV investigation of high Reynolds number submerged water jets at high-pressure ambient conditions. Exp. Fluid 2021, 62, 1–15. [Google Scholar] [CrossRef]
- Fu, H.; He, C.; Liu, Y. PN experimental study on flow characteristics of a low swirl number precessing jet. J. Exp. Fluid Mech. 2021, 35, 39–45. [Google Scholar]
- Wang, X.; Song, B.; Zhang, Y. Experimental investigation on axisynunetric surface source plume with particle image velocimetry. J. Refrig. 2021, 42, 145–150. [Google Scholar]
- Zhang, X.; Chen, Y.; Gao, Z. PN test of central Vortex flow in horizontal axis wind turbine. Acta Energ. Sol. Sin. 2020, 41, 288–296. [Google Scholar]
- Ghaemi, S.; Ragni, D.; Scarano, F. PIV-based pressure fluctuations in the turbulent boundary layer. Exp. Fluid 2012, 53, 1823–1840. [Google Scholar] [CrossRef]
- Luff, J.D.; Drouillard, T.; Rompage, A.M.; Linne, M.A.; Hertzberg, J.R. Experimental uncertainties associated with particle image velocimetry (PIV) based vorticity algorithms. Exp. Fluid 1999, 26, 36–54. [Google Scholar] [CrossRef]
- Wu, Y.; Liu, S.; Yuan, H.; Shao, J. PIV measurement on internal instantaneous flows of a centrifugal pump. Sci. China Technol. Sci. 2011, 54, 270–276. [Google Scholar] [CrossRef]
- Park, J.; Im, S.; Sung, H.J.; Park, J.S. PN measurement of flow around an arbitrarily moving body. Exp. Fluid 2015, 56, 1–16. [Google Scholar] [CrossRef]
- Sung, H.J.; Kim, K.C.; Lee, S.J. Micro PIV measurement of two-fluid flow with different refractive indices. Meas. Sci. Technol. 2004, 15, 1097. [Google Scholar] [CrossRef]
- Li, W.; Li, Z.; Deng, W.; Ji, L.; Qiu, Y.; Chen, H. Particle image velocimetry flowmeter for natural gas applications. Flow Meas. Instrum. 2004, 82, 102072. [Google Scholar] [CrossRef]
- Ren, Y.; Bi, Y.; Wu, R. Study on flow characteristics in the runner of Francis Pump-turbine based on piv technology. Chin. J. Hydrodyn. 2019, 34, 720–725. (In Chinese) [Google Scholar]
- Tang, Z. Experimental and Numerical Study on Channel Vortex of Francis Turbine; Xihua University: Chengdu, China, 2020. (In Chinese) [Google Scholar]
- Xu, L.; Jin, X.; Li, Z.; Deng, W.; Liu, D.; Liu, X. Particle image velocimetry test for the inter-blade vortex in a Francis Turbine. Processes 2021, 9, 1968. [Google Scholar] [CrossRef]
- Tang, Z.; Liu, X.; Wang, X.; Tina, C. PIV test study on the vaneless space of pump turbine in four quadrants working condition. Water Resour. Power 2020, 38, 154–156. (In Chinese) [Google Scholar]
- Liu, D.M.; Xu, W.L.; Zhao, Y.Z. Experimental study of the flow field of a high head model pump turbine based on PIV technique. J. Hydrodynam. 2021, 33, 1045–1055. [Google Scholar] [CrossRef]
- Menter, F.R. Improved Two-Equation k-w Turbulence Models for Aerodynamic Flows, NASA Technical Memorandum TM 103975; NASA Ames: Mountain View, CA, USA, 1992. [Google Scholar]
- Menter, F.R. Two-Equation Eddy-Viscosity Transport Turbulence Model for Engineering Applications. AIAA J. 1994, 32, 1598–1605. [Google Scholar] [CrossRef]
- Menter, F.R. Eddy viscosity transport equations and their relation to the k-ε model. J. Fluid Eng. 1997, 119, 876–884. [Google Scholar] [CrossRef]
- Yan, J.; Koutnik, J.; Seidel, U.; Hubner, B.; Scherer, T. Compressible simulation of rotorstator interaction in a pump turbine. In Proceedings of the 3rd IAHR International Meeting of the Workgroup on Cavitation and Dynamic Problems in Hydraulic Machinery and Systems, Belgrade, Serbia, 14–16 October 2009. [Google Scholar]


| Parameter | Model Value | Prototype Value |
|---|---|---|
| Rated hydraulic head Hr (m) | 59.8 | 635 |
| Runner inlet diameter D1 (mm) | 556 | 4448 |
| Runner outlet diameter D2 (mm) | 250 | 2000 |
| Guide vane height b (mm) | 38.258 | 306.064 |
| Number of runner blades Zr | 9 | 9 |
| Number of guide vanes Zg | 22 | 22 |
| Part | Grid Cells | Nodes |
|---|---|---|
| Spiral casing | 1,052,685 | 1,005,387 |
| Stay vane | 1,072,038 | 987,630 |
| Guide vane | 1,384,504 | 1,282,424 |
| Runner | 1,579,356 | 1,486,674 |
| Draft tube | 547,189 | 529,856 |
| Total | 5,635,772 | 5,291,971 |
| Type | Operating Point | Compressibility | Q11/(L/s) | n11/(r/min) | H/m | n/(r/min) | Add |
|---|---|---|---|---|---|---|---|
| Prototype | PINCOM | Incompressible | 727.150 | 45.520 | 635 | 488.79 | Rated operating point |
| PCOM | Compressible | ||||||
| Model | MINCOM | Incompressible | 59.8 | 1199.919 | |||
| MCOM | Compressible |
| Parameter | Value |
|---|---|
| Speed measurement range/m/s | 0~1000 |
| Speed measurement accuracy/% | ≤1 |
| Measured area/mm2 | ≥900 × 1000 |
| Overall operating frequency/Hz | ≤15 |
| Bits | 16 |
| Parameter | Value |
|---|---|
| Test bench number | DF-150 |
| Maximum test flow/m3 | 1.5 |
| Maximum test head/m | 150 |
| Maximum test speed/(r/min) | 2500 |
| Diameter of model runner/mm | 250–500 |
| Maximum power of dynamometer/kW | 500 |
| Rated power of pump motor/kW | 2 × 850 |
| Tail water pressure/kPa | −85~+250 |
| Uncertainty of efficiency measurement | ≤±0.25% |
| Test bed model type | Counterattack hydraulic machinery |
| Operating Point | Opening | Q11/(L/s) | n11/(r/min) | n/(r/min) | Load Range |
|---|---|---|---|---|---|
| OP1 | 9° | 352.543 | 37.073 | 1141.874 | 50% load |
| OP2 | 343.136 | 38.102 | 1174.798 | ||
| OP3 | 331.116 | 38.720 | 1194.869 | ||
| OP4 | 13° | 467.642 | 37.101 | 1144.785 | 75% load |
| OP5 | 458.519 | 38.103 | 1176.840 | ||
| OP6 | 451.722 | 38.727 | 1196.841 | ||
| OP7 | 17° | 588.954 | 37.061 | 1143.869 | 100% load |
| OP8 | 579.850 | 38.147 | 1178.841 | ||
| OP9 | 574.440 | 38.794 | 1199.916 |
Publisher’s Note: MDPI stays neutral with regard to jurisdictional claims in published maps and institutional affiliations. |
© 2022 by the authors. Licensee MDPI, Basel, Switzerland. This article is an open access article distributed under the terms and conditions of the Creative Commons Attribution (CC BY) license (https://creativecommons.org/licenses/by/4.0/).
Share and Cite
Deng, W.; Xu, L.; Li, Z.; Tang, W.; Wang, X.; Shang, L.; Liu, D.; Liu, X. Stability Analysis of Vaneless Space in High-Head Pump-Turbine under Turbine Mode: Computational Fluid Dynamics Simulation and Particle Imaging Velocimetry Measurement. Machines 2022, 10, 143. https://doi.org/10.3390/machines10020143
Deng W, Xu L, Li Z, Tang W, Wang X, Shang L, Liu D, Liu X. Stability Analysis of Vaneless Space in High-Head Pump-Turbine under Turbine Mode: Computational Fluid Dynamics Simulation and Particle Imaging Velocimetry Measurement. Machines. 2022; 10(2):143. https://doi.org/10.3390/machines10020143
Chicago/Turabian StyleDeng, Wanquan, Lianchen Xu, Zhen Li, Wen Tang, Xiaolong Wang, Linmin Shang, Demin Liu, and Xiaobing Liu. 2022. "Stability Analysis of Vaneless Space in High-Head Pump-Turbine under Turbine Mode: Computational Fluid Dynamics Simulation and Particle Imaging Velocimetry Measurement" Machines 10, no. 2: 143. https://doi.org/10.3390/machines10020143
APA StyleDeng, W., Xu, L., Li, Z., Tang, W., Wang, X., Shang, L., Liu, D., & Liu, X. (2022). Stability Analysis of Vaneless Space in High-Head Pump-Turbine under Turbine Mode: Computational Fluid Dynamics Simulation and Particle Imaging Velocimetry Measurement. Machines, 10(2), 143. https://doi.org/10.3390/machines10020143