Article

Modeling and Optimization of a Micro-Channel Gas Cooler for a Transcritical CO2 Mobile Air-Conditioning System

School of Mechanical Engineering & IEDT, Kyungpook National University, Daegu 41566, Republic of Korea
*
Author to whom correspondence should be addressed.
Machines 2022, 10(12), 1177; https://doi.org/10.3390/machines10121177
Submission received: 4 November 2022 / Revised: 24 November 2022 / Accepted: 2 December 2022 / Published: 7 December 2022
(This article belongs to the Section Micro/Nano Electromechanical Systems (MEMS/NEMS))

Abstract

:
This study focuses on developing and optimizing of a microchannel gas cooler model for evaluating the performance of a transcritical CO2 mobile air-conditioning system. A simulation model is developed with the aid of MATLAB R2022a. A segment-by-segment modeling approach is utilized by applying the effectiveness-NTU method. State-of-the-art heat transfer and pressure drop correlations are used to obtain air and refrigerant side heat transfer coefficients and friction factors. The developed model is validated through a wide range of available experimental data and is able to predict a gas cooler capacity and pressure drop within an acceptable range of accuracy. The average errors for a gas cooler capacity and pressure drop are 3.79% and 10.24%, respectively. Furthermore, a parametric optimization method is applied to obtain optimal microchannel heat exchanger dimensions, including the number of tubes, microchannel ports, and passes. Different combinations were selected within the practical range to obtain optimal dimensions while keeping the total core volume constant. The simultaneous effect of the number of tubes, the number of ports in each tube, and the number of passes is determined. The objective of the current optimization technique is to minimize the pressure drop for the specific design capacity under different operating conditions without changing the overall volume of the gas cooler. The average pressure drop reduction for the optimal geometry as compared with the baseline geometry under all operating conditions is about 15%. The results from this study can be used to select an optimal geometric design for the required design capacity with a minimal pressure drop without the need for expensive prototype development and testing.

1. Introduction

Microchannel heat exchangers (MCHXs) have gained significant attention in the field of automotive air conditioning systems during the past two decades due to their compactness, efficiency, light weight, and low refrigerant charge. Their integration into air conditioning systems was motivated by the need to increase efficiency and decrease refrigerant charge. In most heat exchanger (HX) designs, one of the primary goals is achieving a high heat transfer rate with a minimal pressure drop. Improving heat transfer across channel walls may increase the HX surface area and flow rates. The essential need for improvement led to heat exchangers with microchannel coils, which have a small cross-sectional area and a high surface area-to-volume ratio [1].
A microchannel gas cooler (MCGC) operates In a transcritical CO2 cycle at high pressure. The growing concern about environmental issues regarding the global warming potential (GWP) of these working fluids has led to some policy actions, such as the approval of the F-Gas Regulation [2] and the approval of the Kigali amendment to the Montreal Protocol, which aim to phase out their utilization soon. With the phasing out of hydrofluorocarbon (HFC) refrigerants following the provisions of the Montreal Protocol, CO2 has gained considerable attention and wider acceptance as an alternative refrigerant for use in automotive air-conditioning systems. Unlike all the new fluorocarbon alternatives, CO2 is widely available in large amounts in all regions of the world, behaves as an inert gas, and is thermally stable at higher temperatures. Additional toxicity testing is unnecessary because all the properties and characteristics of CO2 are already well-recognized and fully documented. When using CO2 as a refrigerant, the recycling or recovery of the refrigerant is not necessary either for environmental or economic reasons. Throughout the whole lifecycle of the system, this will decrease its cost and simplify work. The low viscosity of CO2 is positively utilized in component design, enhancing heat transfer and reducing the geometric parameters and weight by increasing flow velocities [3]. M.H. Kim et al. [4] discussed and critically reviewed the resurgence of the natural refrigerant CO2 in a transcritical cycle, its thermodynamic and transport properties, improvements in heat transfer and pressure drop characteristics, and the difficulties and design features associated with high operating pressure, particularly in automotive air-conditioning systems. The gas cooler performance of the transcritical CO2 system improved the system capacity and reduced the optimal operating pressure. Several models or simulation tools for MCHXs are now available in the literature [5,6,7]. Yin et al. [8] developed and validated a CO2 MCGC model for automotive air conditioning systems using a finite element method and concluded that the three-pass gas cooler performed well for a single slab heat exchanger. However, using a multi-slab HX is more efficient and enables better performance [9]. Chai et al. [10] used a distributed modeling approach paired with the NTU method to simulate a sCO2 finned tube gas cooler. The results revealed that increasing mass flow rates and decreasing tube diameters improved the gas cooler’s performance, but the pressure drop increased significantly. Geometrical parameters such as microchannel height and width, fin thickness, fin and tube pitches, the number of ports in a tube, the number of microchannel tubes in each pass, and the number of passes in each slab can all have an impact on HX performance. Heun and Dunn [11] investigated the impact of microchannel port diameter and shape on MCHX pass configurations. They concluded that smaller port sizes result in reduced HX internal volume and require additional parallel refrigerant passages with reduced tube length. The volume and MCHX pass arrangements were significantly affected by port shape. Mehendale et al. [12] investigated the effect of pass arrangement on the thermal–hydraulic performance of microchannel condensers and evaporators utilizing R410A as a working fluid. They recommended contracting or equal pass configurations for the condenser coil arrangement. For optimal evaporator heat duty, an expanding pass arrangement was preferred, with very few tubes being prescribed in the first pass and numerous tubes in the last pass. Moreover, the evaporator performance demonstrated more sensitivity to pass arrangement than condenser configuration. Therefore, evaporator pass configuration must be considered more carefully than condenser pass designs. Lawrence et al. [13] evaluated the impacts of varied microchannel evaporator dimensions on ejector refrigeration cycle performance. For the liquid recirculation ejector–expansion vapor compression system, it was suggested that the microchannel should overfeed through the ejector and that the heat transfer and pressure drop should be balanced by selecting appropriate refrigerant pass numbers. Yin et al. [14] analyzed the performance of microchannel condensers using a finite volume model utilizing CFD simulations. They developed an optimal design for the number of tubes in a single and two-slab MCHX condenser pass, assuming equal refrigerant mass flow rate distribution in all tubes of the same pass. Among the various geometric factors, the impact of the microchannel cross-sectional configuration on HX performance has been widely researched. Saleem and Kim [15] performed a numerical study using a CFD simulation module. They concluded that thermal–hydraulic performance could be improved by reducing fin height, which will result in a lower MCHX volume. Various research [16,17,18] has been undertaken to investigate the effects of channel shape (rectangular, triangular, trapezoidal) on fluid flow and heat transfer performance. The first two studies concluded that rectangular microchannels performed best while the performance of triangular microchannels was poor. However, Chen et al. [18] obtained contrary results: the triangular microchannel showed the highest thermal efficiency due to its low pumping power, and the reverse was true for the rectangular microchannels. According to Jing and He [19], these contrasting results are due to the specific sizes of the microchannel in each study. They proposed evaluating the hydraulic and thermal performances of microchannels of different shapes under different operating conditions and dimensional constraints. Huang et al. [20] employed a multi-objective evolutionary algorithm to reduce the material mass and optimize the capacity of the variable geometry of microchannel condensers, which included microchannel tubes, fin depth, and fin density. Capacity was plotted against material mass for both the variable and conventional geometry. For the same capacity, the optimized variable geometry design yielded a significant reduction in material mass but a higher airside pressure drop.
In order to solve engineering challenges, various single- and multi-objective optimizations techniques have been used in the past two decades, focusing on improving thermal and hydraulic performance [21]. Glazar and Lenic [22] performed a multivariate optimization of an MCHX using the response surface methodology to study the effect of four geometry parameters (fin pitch, transversal tube row pitch, the quantity of channels per tube, and wall thickness) on its heat transfer performance. The results showed that the overall performance improved by 91% with the optimal design compared with the reference MCHX at the highest parameter values. Ge et al. [23] developed a finned tube CO2 gas cooler/condenser model utilizing distributed and lumped methods. For predicting the refrigerant temperature profile, local heat transfer rates, and impact of the circuitry, the distributed method was applied. In contrast, the lumped method was used for the simulation and optimization of the system integration. Okasha et al. [24] utilized the Pareto front approach to perform the bi-objective optimization of transcritical CO2 heat pump systems. Instead of studying every parameter’s complete range, the Pareto front allows the designer to focus on a set of efficient options and make compromises within that set. He concluded that the pressure in the gas cooler could be independently managed and adjusted to obtain the maximum coefficient of performance and heating or cooling capacities. Garcia et al. [25] optimized and improved the shape of an MCHX by reducing its volume and fan power, influencing behavior recognition.
This study develops a numerical model and optimization of an MCGC for a design capacity with minimal pressure drop, analyzing the effect of different geometric parameters on gas cooler performance under various operating conditions. The simulation results are compared with a set of experimental data from the literature. Most of the recent MCHX performance optimization research has focused on condensers or evaporators. However, transcritical CO2 systems usually operate near the critical point with drastic changes in thermodynamic and transport properties, and their high operating pressure and temperature make them challenging to design. The design of an MCHXs involves a consideration of their geometric configuration (length, width, height, number of tubes, number of ports, and number of passes) based on a target capacity. Therefore, this study aims to obtain the optimal dimensions of the gas cooler to achieve the design capacity with a minimal pressure drop.

2. Model Development

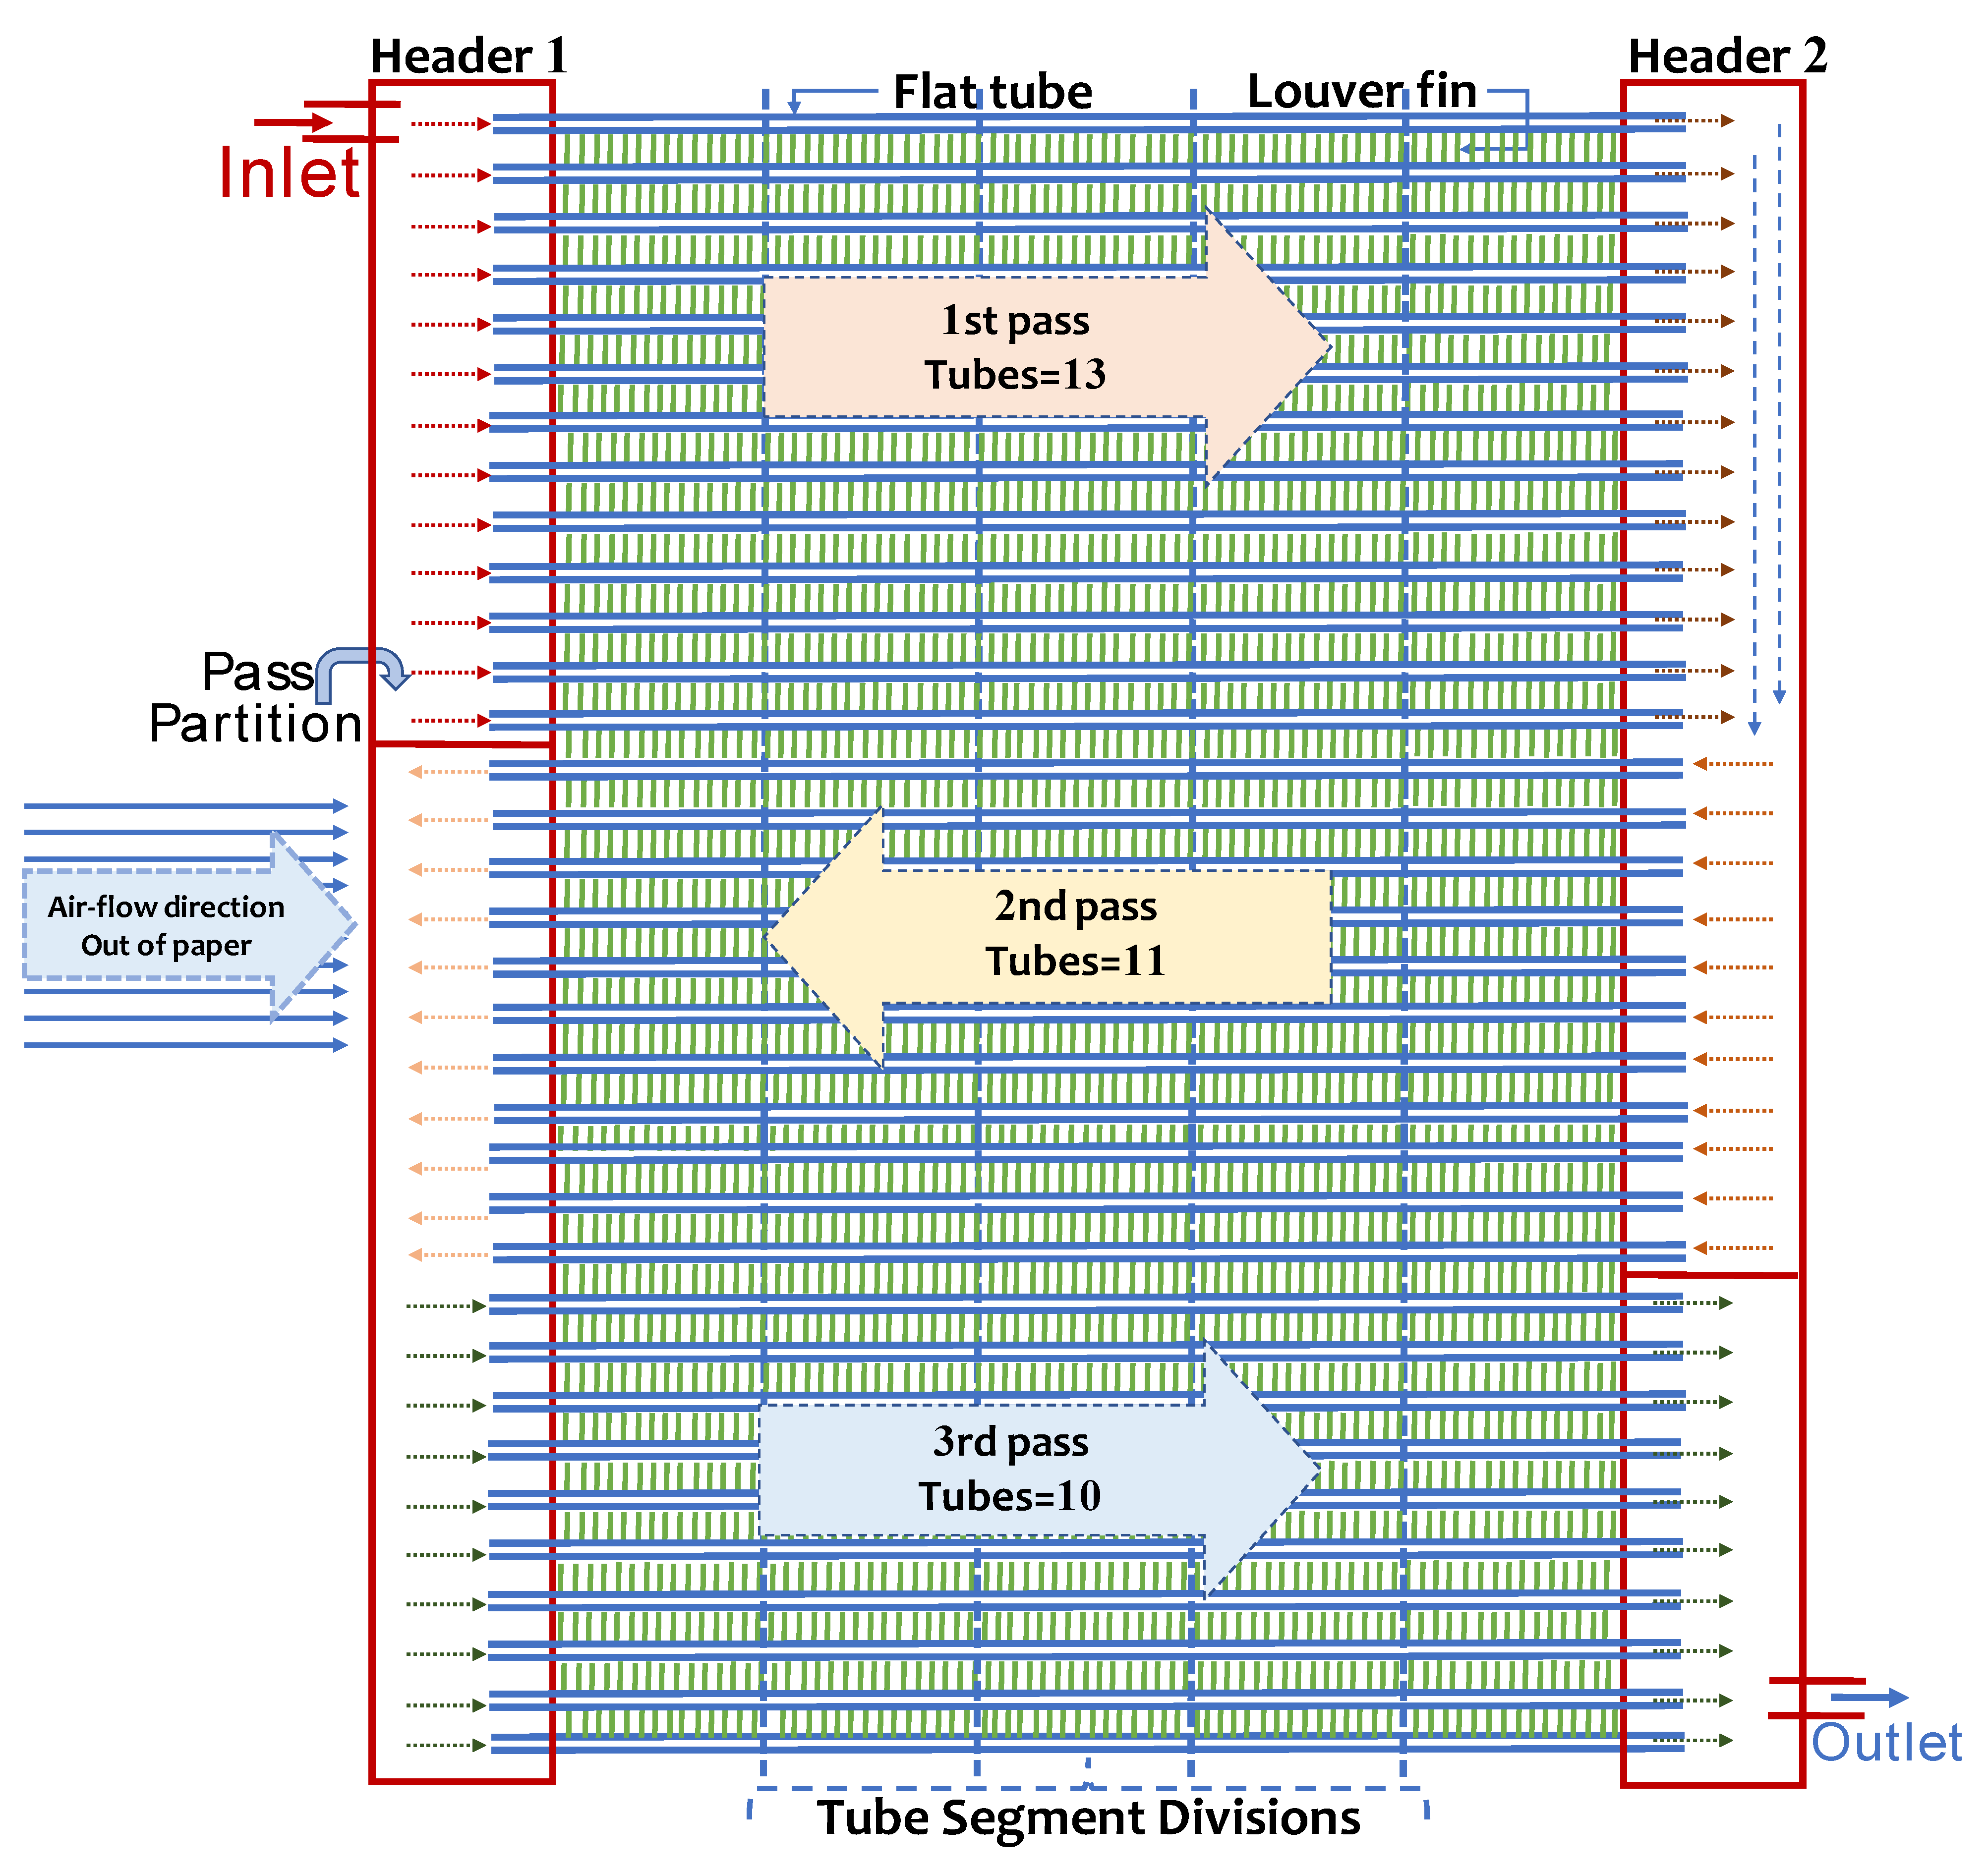
2.1. Microchannel Heat Exchanger Geometry

The MCHX used in this study is a single slab, where the refrigerant flows through the microchannel tubes and air flows through folded louver fins. The extruded microchannel gas cooler tubes and louver fins are constructed completely from aluminum. The baseline geometry used for the development of the model has 3 passes and 34 tubes, with each tube containing 11 circular ports. The overall dimensions of the microchannel tube are 545 mm × 16.51 mm × 1.65 mm (length × depth × height), as illustrated in Figure 1. Each pass consists of a different number of tubes with similar flow conditions, as depicted in Figure 2. The MCGC geometric parameters, configuration, and pass arrangement selected for this study are compiled in Table 1.

2.2. Operating Conditions

The following operating conditions, given in Table 2, are used to initialize the MATLAB code developed for the MCGC. The maximum ambient temperature is 55 °C, and the inlet air flow rate varies between 450 g/s and 700 g/s. Furthermore, the refrigerant flow rate and the refrigerant inlet temperature vary between 18 g/s and 57 g/s and 106 °C and 148 °C, respectively. The air flow rate over the gas cooler is related to the compressor speed for every condition. It is comprised of three compressor speeds: 950 rpm (shown as “I#”), which represents idling conditions, 1800 rpm (shown as “M #”), which represents medium speed driving operation, and 3000 rpm (shown as “H #”), which represents high speed operation. The inlet conditions for each segment are air inlet temperature, air flow rate, refrigerant flow rate, refrigerant inlet pressure, and refrigerant inlet temperature. The uncertainties for the pressure, temperature, and mass flow rate measurements were about 50 kPa, 1 °C, and 0.1%, respectively. The pressure drop measurements lower than about 70 kPa lie within the measurement error. The experimental uncertainty for the gas cooler capacity measurement was about ±5% [8].

2.3. Modeling Approach

To model the MCHX, s tube-by-tube or segment-by-segment modeling technique can be utilized. Although the tube-by-tube [26] modeling approach is computationally effective, in cases in which CO2 is working near its critical point, the property variation is very sensitive. Therefore, the segment-by-segment approach, as employed by Kim and Bullard [27], is used in the current study. Each segment is considered a small crossflow heat exchanger, and each segment’s heat transfer and pressure drop equations are solved individually. Each pass is made up of a variable number of tubes that all have comparable flow characteristics. As a result, one tube is divided into five segments with corresponding fins along the refrigerant flow direction. Although the port-by-port method is more effective for comprehensively investigating each microchannel tube port, which is time intensive and computationally costly, the accuracy of these two approaches has been proven to be comparable. When estimating the heat transfer rate, the segment-by-segment method was employed rather than the port-by-port method.

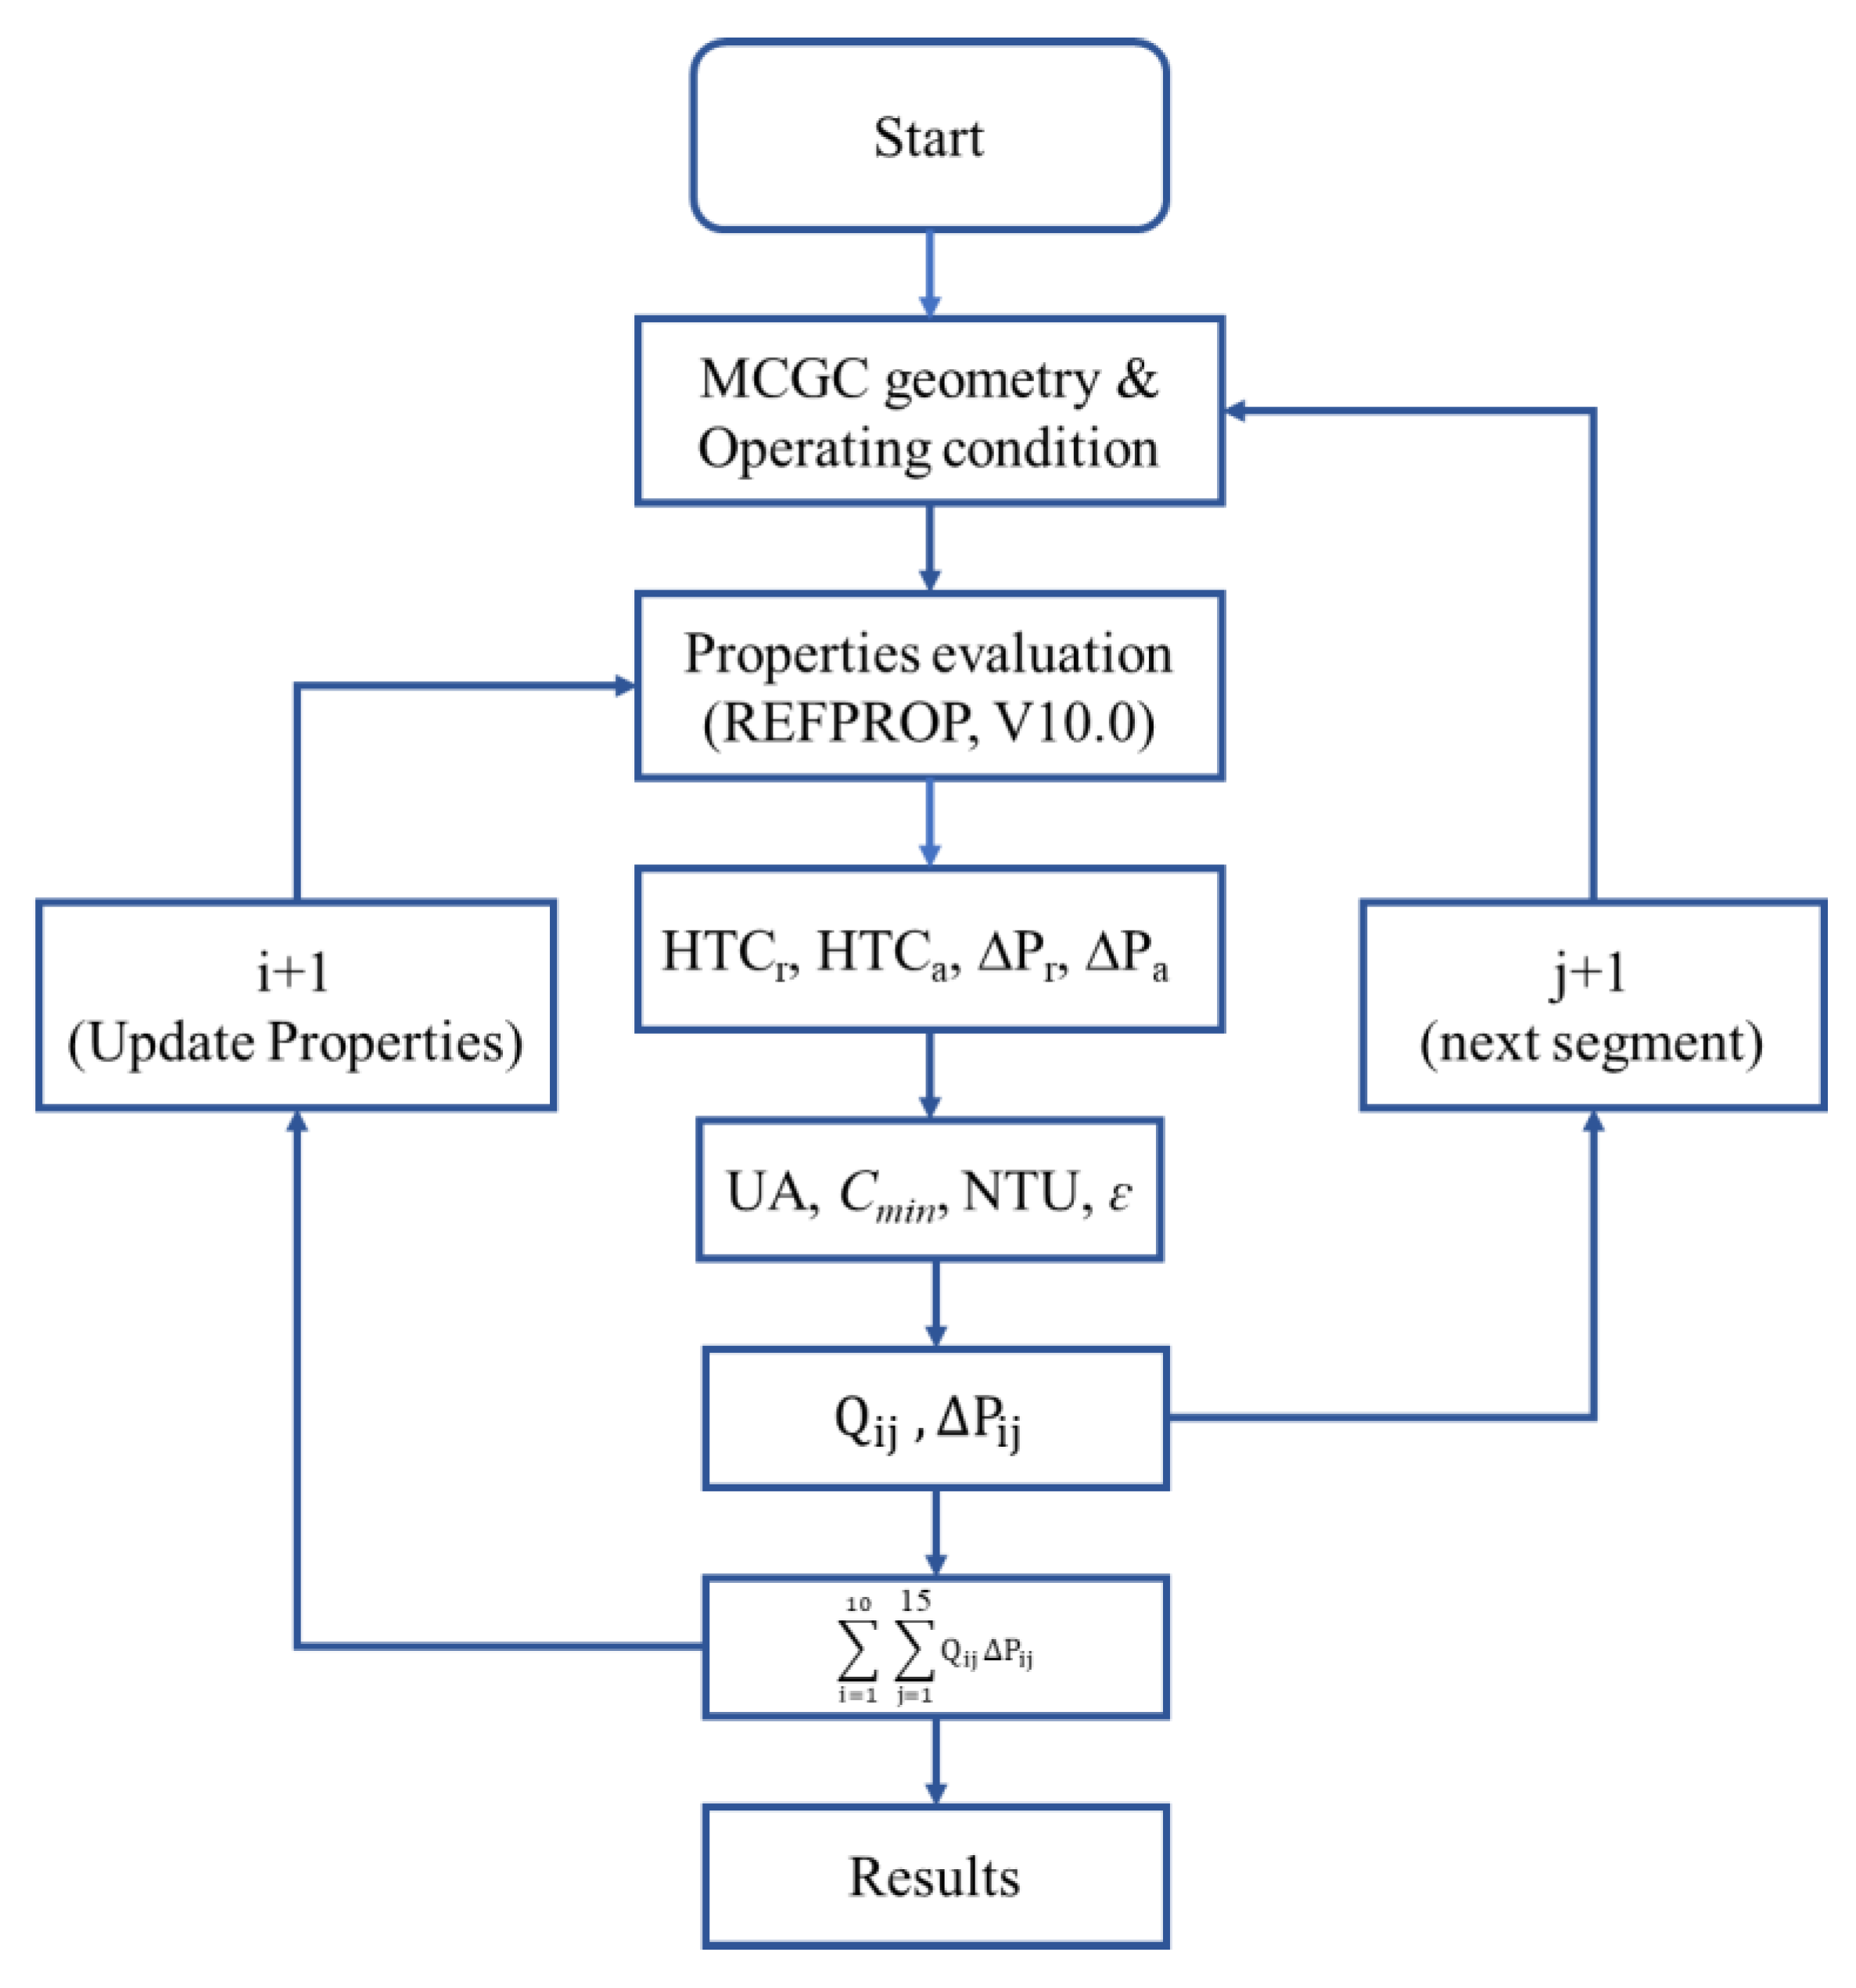
2.4. Numerical Methodology

The ɛ-NTU method [28] was used in this gas cooler model to compute the heat transfer and pressure drop. ɛ is a function of heat duty and/or outlet temperatures, and ɛ-NTU is a function of the heat transfer area. Fins prevent mixing in microchannel crossflow heat exchangers. The air was always assumed to be unmixed and the refrigerant to be mixed. The issue of air non-uniformity and refrigerant properties was quickly addressed by dividing the MCHX into various segments. The variation in the thermo-physical properties of the fluids was generated by coupling MATLAB with NIST’s REFPROP Version 10.0 [29] using an in-house code. Each segment’s air-to-refrigerant heat transfer and the refrigerant pressure drop were determined separately. The inlet temperature, inlet pressure, and mass flow rate were provided as inlet conditions for each segment on the refrigerant side, while the air inlet temperature and flow rate for the modeling heat transfer underwent forced convection on the air side. Since the behavior of the CO2 refrigerant was unpredictable, an iterative loop was employed to calculate the thermal properties for each segment independently. For the calculation, the constant refrigerant properties, i.e., the arithmetic mean of the inlet and outlet conditions of the segment, were needed. Initially, the inlet conditions of the segments were known, but the outlet conditions were unknown. Therefore, an initial estimate was made for the outlet conditions, and the proposed iterative method was used to refine the solution. Once the heat transfer and pressure drop were determined for the first segment of the tube, the process was repeated for subsequent segments of the same tube. The outlet of one segment was treated as the inlet for the following segment, and the process continued until the last segment of the final run was reached. The total capacity of the heat exchanger is the sum of the individual capacities of all the tubes. Similarly, the pressure drop in each pass is the average of the pressure drops along the individual tubes in that pass. The stepwise numerical methodology is summarized in Figure 3. The following assumptions were made to simplify the numerical task involved in developing the model.
  • The airflow is uniformly distributed over the entire surface of the HX.
  • A uniform refrigerant flow is assumed in each tube.
In the current gas cooler case, the refrigerant is in a single phase, and no phase change phenomena occur, so the heat transfer equation can be approximated for each segment of the tube as follows:
Q = r (hr,outhr,in) = r cp,r (T r,out − T r,in)
The heat transfer between the air and the refrigerant is described as follows:
Q = a (h a,inh a,out) = a cp,a (Ta,inTa,out)
A technique of determining the outlet temperatures is necessary to apply these energy balance equations to compute the heat transfer between the air and the refrigerant. The ɛ-NTU approach is employed for this purpose in a crossflow setup with a mixed fluid and an unmixed fluid. The refrigerant is represented as a mixed fluid, whereas the air is represented as an unmixed fluid. The heat capacity of each fluid is as follows:
Cmixed = r cp,r
Cunmixed = acp,a
Moreover, the number of heat transfer units, NTU, is defined as:
NTU = UA/Cmin
UA is an overall heat conductance that is calculated using following equation:
U A = ( 1 A t i × h r + t w A m e a n × k t + 1 A t o × h f + 1 h a × A a × η s   + 1 h a × ( 1 A f A a ) × ( 1 η f ) )  
η s = 1 A f A a ( 1 η f )
η f = tan h ( m l ) m l ,   m = 2 h a k f δ f × ( 1 + δ f F d ) ,   l = H 2 δ f
The heat exchange effectiveness ε is the ratio between the temperature change ∆T and the maximum possible temperature change based on the inlet temperatures of the two fluids. ε is calculated for each segment as a function of each fluid’s heat capacities, C. For the case where Cmax = Cunmixed,
ε = 1 exp [ C m a x C m i n { 1 exp ( N T U C m i n C m a x ) } ]
ε = T r , i n T r , o u t T r , i n T a , i n
On the other hand, for Cmax = Cmixed,
ε = C m a x C m i n [ 1 exp { C m i n C m a x ( 1 exp ( N T U ) } ]
ε = T a , o u t T a , i n T r , i n T a , i n
Once ε is calculated for the tube, the outlet temperature of either the refrigerant or the air can be calculated by rearranging Equations (10) and (12), respectively. After calculating the outlet temperatures, the capacity of the tube can then be calculated.

2.5. Heat Transfer and Pressure Drop Correlations

Appropriate correlations for heat transfer and pressure drop are essential for model accuracy. The convective heat transfer coefficient of the airside was selected based on the fin configuration. In the present model, the Colburn j factor and friction f factor, as developed by Kim and Bullard [30], were used for the louver fins, as the authors report that these are the most accurate. These correlations were developed for ReLp 100–600 and Fp/Lp <1, with RMS errors of ±14.5 and ±7%, respectively.
j = R e L p 0.487 ( L α 90 ) 0.257 ( F p L p ) 0.13 ( H L p ) 0.29   ( F d L p ) 0.235 ( L l L p ) 0.68 ( T p L p ) 0.279 ( δ f L p ) 0.05
f = R e L p 0.781 ( L α 90 ) 0.444 ( F p L p ) 1.682 ( H L p ) 1.22   ( F d L p ) 0.818 ( L l L p ) 1.97
The heat transfer coefficient for the transcritical R744 was computed using the Gnielinski correlation [28], which was determined to be the best for a single-phase R744 at supercritical and subcritical levels after comparing six correlations. The correlations differed by less than 30% over a wide temperature range. The difference between the Gnielinski correlation and Rieberer’s measurement was negligible at mass fluxes (~500 kg/m2s) and heat fluxes (~40 kW/m2) typical of CO2 gas coolers. The Gnielinski correlation is valid in the range of 3000 R e 5 × 10 6 and 0.5 P r 2000 . The friction factor was calculated using the Darcy friction factor fD from Equation (16), developed by Petukhov [28], a single correlation that spans a wide range of Reynold numbers, 3000 R e 5 × 10 6 .
N u = ( f D 8 ) × ( Re 1000 ) × P r 1 + 12.7 ( f D 8 ) 1 2 ( Pr 2 3 1 )
f D = ( 0.79 ln ( Re ) 1.64 ) 2
The total refrigerant side pressure drop across the gas cooler can be calculated by adding each pressure drop together. In order to simplify the data analysis, uniform mass flow rate distribution was assumed for each port and tube. The pressure drop was calculated from the friction along ports as:
Δ P = L t D p o r t × f D × G r 2 2 ρ r

2.6. Model Validation

In this study, the gas cooler capacity and the pressure drop are examined. The simulated gas cooler capacity and pressure drop results are compared with the experimental data [31] under each operating condition, as shown in Figure 4a,b, respectively. The solid line shows the experimental results, and the dots indicate the simulation results. As the figures highlight, all the predicted data points for the gas cooler capacity and pressure drop are within the average error bounds of ±3.79% and 10.24%, respectively, which proves that the numerical model can accurately predict the gas cooler capacity and pressure drop. The difference between the experimental and simulation results slightly increases at higher flow rates. The slightly underestimated results of the simulation model for the gas cooler capacity and pressure drop may result from the high turbulence due to the absolute roughness of the extruded aluminum microchannel tubing, which was about 4.2 µm to 5.3 µm based on the experimental measurement [8].

3. Gas Cooler Optimization

Air conditioning system designers must consider various performance factors to provide maximum thermal comfort to the user. A system designer selects appropriate components and assembles them into a complete air conditioning system to achieve the desired system performance. Component selection forms the basis of the system optimization problem. The designer must select the best combination of components to create a system that meets performance specifications. An MCGC provides greater design flexibility because additional refrigerant channels can be achieved either by increasing the size of the tubes or by increasing the number of ports.
In the current study, a parametric optimization method is used, a synthesis approach in which the design space is represented by a set of parameters and their associated bounds on their values. For the current optimization problem, a combination of different parameters, encompassing the number of ports, the number of tubes, and the number of passes of the core, was simultaneously studied in such a way that the overall volume of the core remains the same. Based on the application and available space, one can select, for the given design capacity, a gas cooler model with a minimal pressure drop without changing the overall size of the heat exchanger.
The number of tubes is directly proportional to the HX height, while the number of ports is directly proportional to the HX width. Hence, for a constant core volume and the same refrigerant charge, the tube length will vary if we fix the total number of tubes or the number of ports in each tube. As is well known, the tube length directly affects the heat exchanger’s capacity and pressure drop. As a result, as tube length increases, so do pressure drop and HX capacity. Conversely, a shorter tube will result in a lower pressure drop and HX capacity.

3.1. Optimization Model

3.1.1. Parameters

Gas cooler tube length, height, and width are considered parameters that change in each iteration. The ranges of each optimization parameter, i.e., the number of tubes, the number of microchannel ports, and the number of passes, are summarized in Table 3.

3.1.2. Sets

The range of options for the number of tubes, microchannel ports, and passes for a specific operating condition while keeping the volume of the HX constant can be expressed as follows:
Set   of   tubes :   N t u b e s = [ 12 , 13 , 14 , N t ]
Set   of   ports :   N p o r t s = [ 9 , 10 , 11 , N p ]
Set   of   passes :   N p a s s e s = [ 3 , 4 , 5 , N s ]

3.1.3. Decision Variable

The domain of a variable represents the range of values that can be assigned to it. The model’s underlying optimizers determine the exact nature of the decision variables by pointing the pointers to objects.
i N t j N p k N s x i j k = 1
The x i j k is 1 when i t h number of tubes, j t h number of ports, and k t h number of passes are selected, and it is 0 when these are not selected.

3.1.4. Constraints

A set of constraints allows some decision variables to take on specific values and exclude others. From a manufacturing point of view, investing time, money, and energy in calculating and manufacturing unfeasible solutions does not make sense. In practice, obtaining a feasible HX design from the application and manufacturing point of view is often impossible without putting constraints on the decision variables. The mathematical representation of our optimization model, along with the constraints, can be expressed as:
i N t j N p k N s Q i j k × x i j k   Q d e s i g n
where Qijk is the gas cooler capacity with an ith number of tubes, jth number of ports, and kth number of passes. The constraint in Equation (22) ensures that all the combinations are selected from i t h number of tubes, j t h number of ports, and k t h number of passes, which yields a gas cooler capacity equal to or greater than the design gas cooler capacity from all the available combinations of tubes, microchannel ports, and passes.

3.1.5. Objective Function

Considering the above sets, parameters, and decision variables, we aim to achieve the design capacity with the minimum pressure drop in the available space. Equation (23) requires that the minima must be selected considering the benchmark, i.e., Q d e s i g n .
min x i N t j N p k N s Δ P i j k × x i j k
The ∆Pijk in Equation (23) represents the pressure drop with an ith number of tubes, jth number of ports, and kth number of passes.

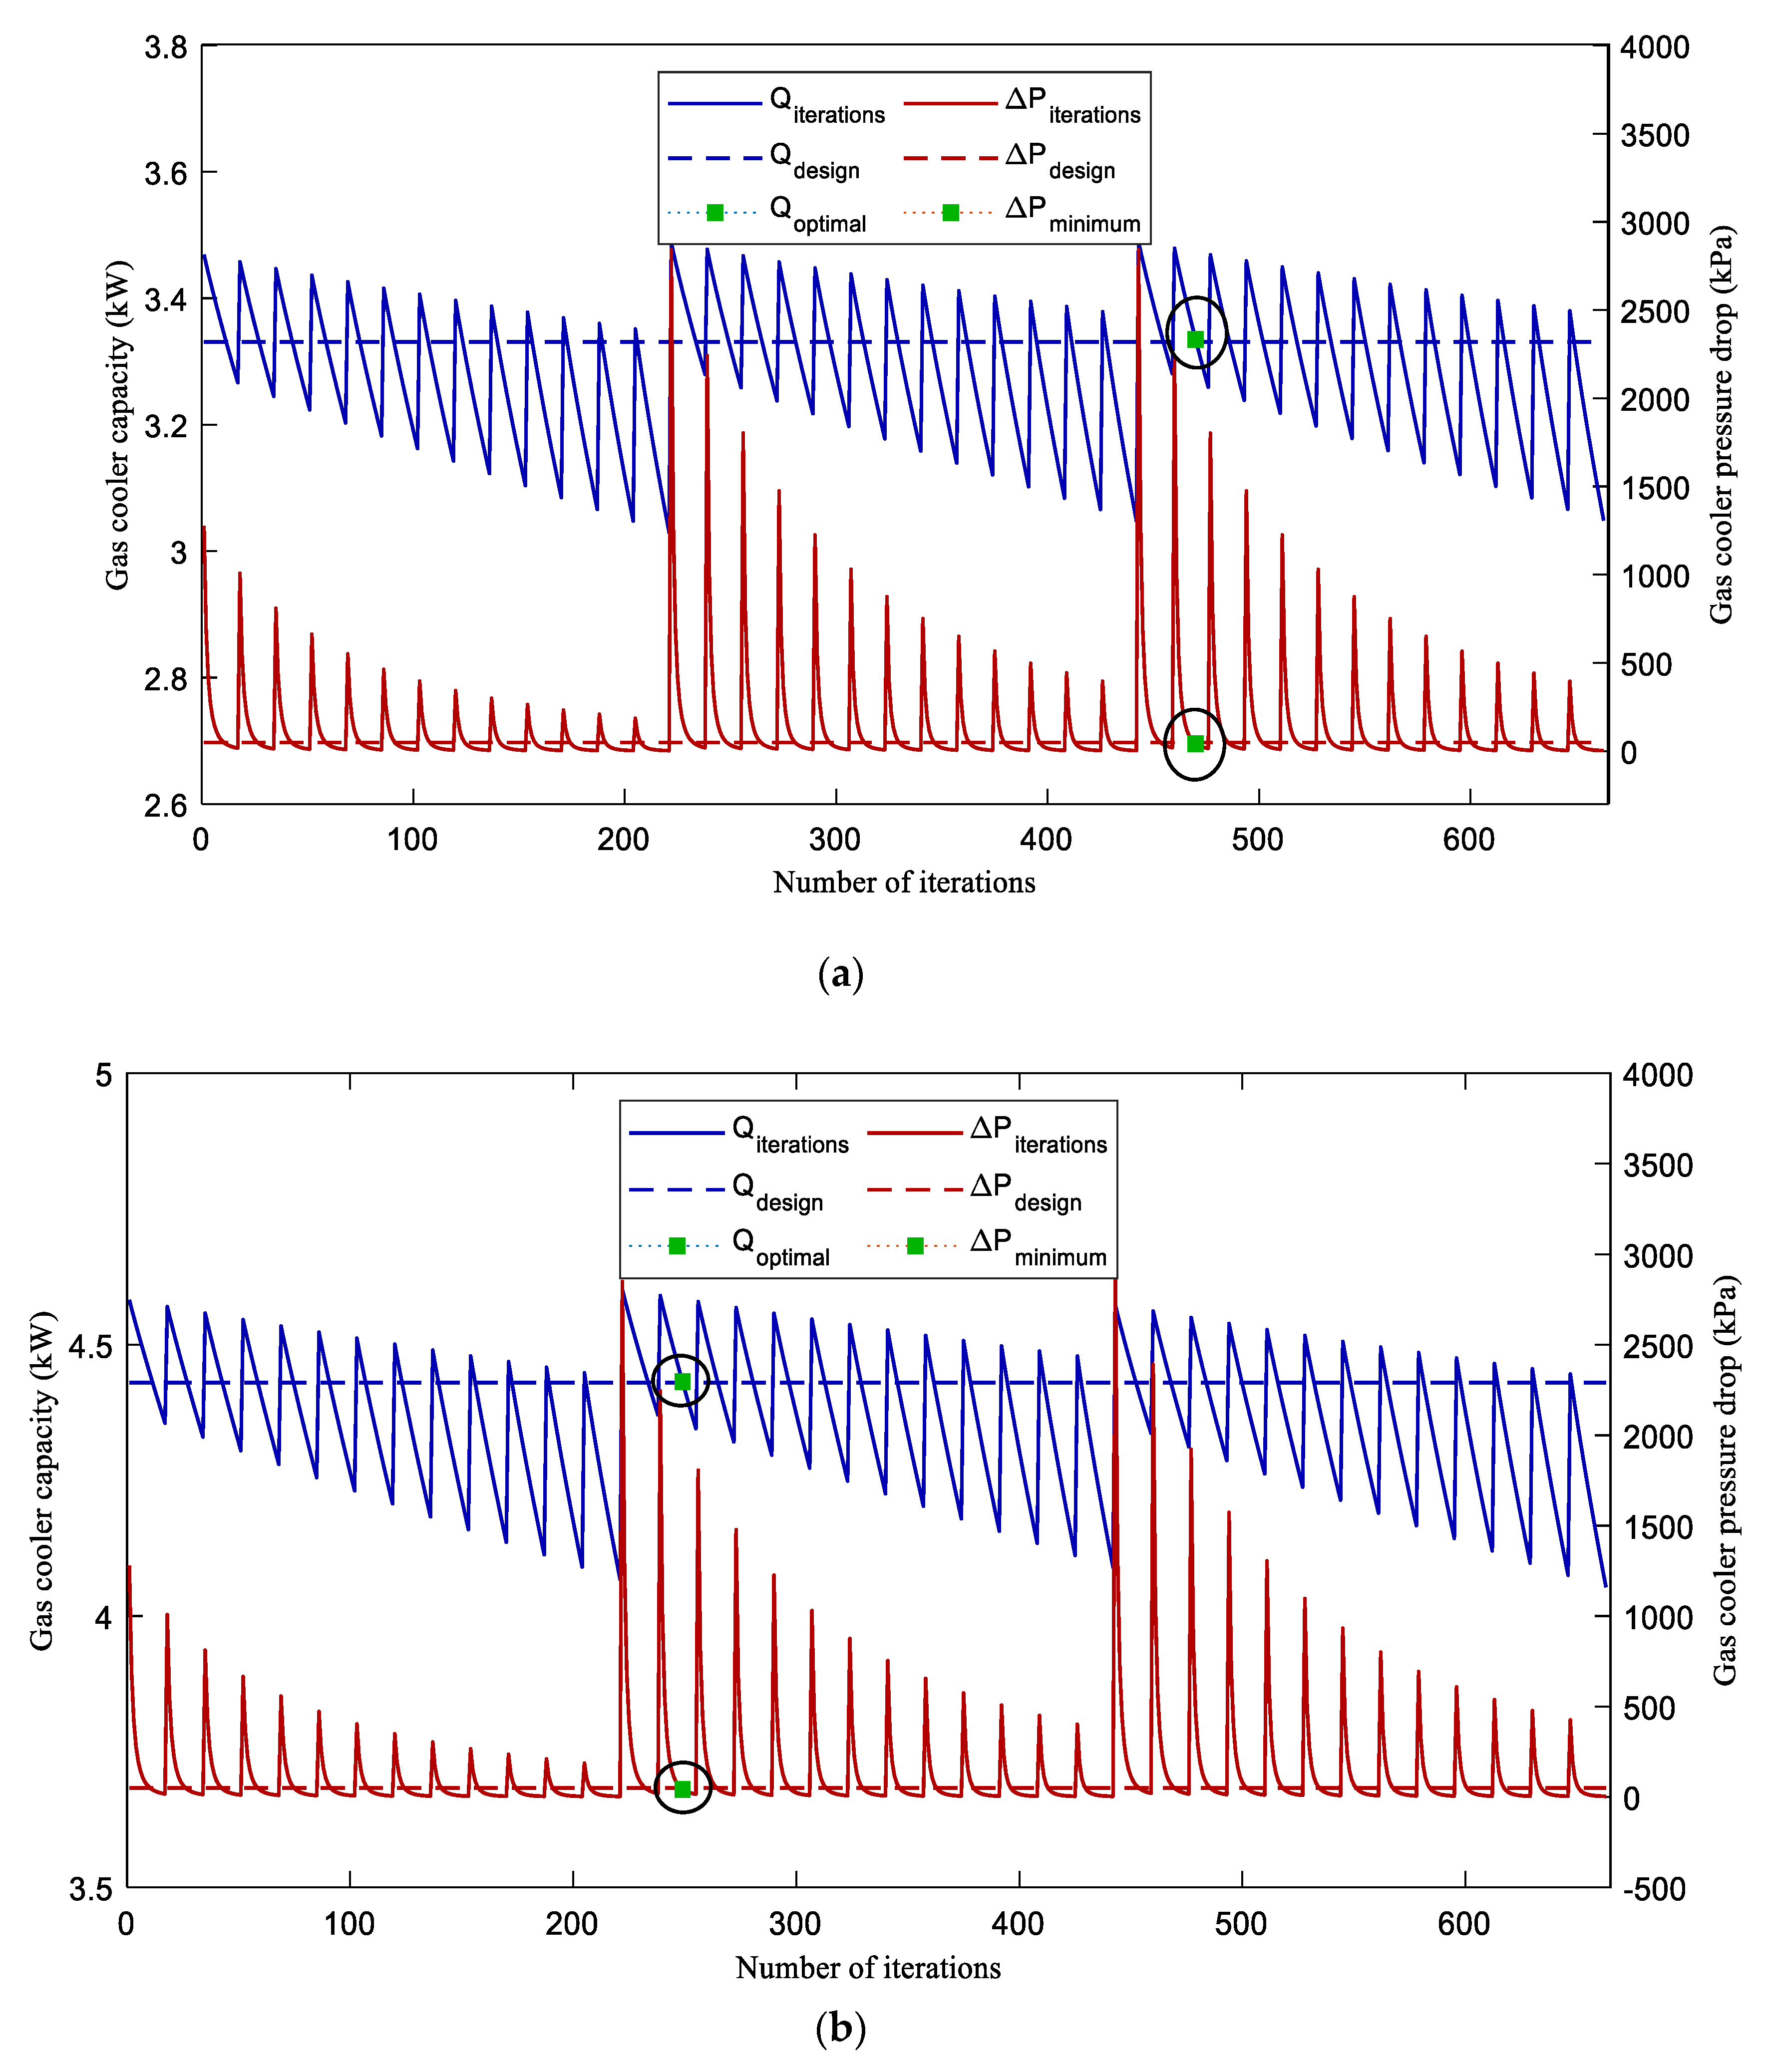
4. Results and Discussion

The simulation model takes the geometric parameters and operating conditions as input and calculates the heat transfer and pressure drop. With a constant port diameter, the varying number of ports, ranging from 9 to 21, increases with tube width. The number of tubes varies from 12 to 95 according to the varying number of ports, increasing the HX’s height and decreasing its length. However, the overall volume remains constant. The gas cooler capacity should increase with an increasing number of tubes, but, at the same time, the length of the tubes decreases, reducing gas cooler capacity. The CO2 pressure drop varies with an increasing number of tubes for each fixed core width and with varying numbers of ports. While the total volume of the heat exchanger remains the same, the tube length decreases, reducing the pressure drop. An optimal combination based on a minimal pressure drop will incorporate a high number of tubes with a maximum number of ports and tubes of the minimum possible length. An optimal combination can be selected based on the requirement for the maximum gas cooler capacity and minimum pressure drop. Moreover, by increasing the number of passes, better heat transfer performance is expected due to higher refrigerant side heat transfer, but at the expense of an increased pressure drop.
Figure 5 shows the range of gas cooler capacities for all possible combinations under each operating condition shown in Table 2 and the range of geometric configurations outlined in Table 3, whereas the middle pointers having square, triangular, rhomboid, or circular shapes show the baseline design capacity. The minimum/maximum values for each operating condition are determined by combinations of the parameters of the MCHX’s geometric configuration, including the number of tubes, ports, and passes. For example, in the case of I17, the minimum value is obtained at iteration #470 when the number of ports and tubes reach their maximum while the number of passes is at its minimum. The reason is that keeping the volume of the MCGC constant and increasing the number of tubes and/or microchannel ports reduces the tube length and refrigerant mass flow rate within those tubes and/or ports, which results in a heat transfer decrease.
Four cases were selected randomly (S# I17-1, I6-6, M03-2, and H03-5) from Table 2. The results can be seen in Figure 6a–d, in which the Y-axis (left) shows gas cooler capacity in kW, the Y-axis (right) shows pressure drop in kPa, and the X-axis shows iterations of the geometric configuration, including the number of tubes, the number of ports, and the number of passes keeping the volume constant. The simulation results in Figure 6a–d show Qiteration and ΔPiteration, which are simulation capacity and pressure drop. At the same time, Qdesign and ΔPdesign are the gas cooler capacity and pressure drop for the baseline geometry under each operating condition. The simulation results below Qdesign were omitted from the calculation of the optimal point as they did not satisfy the objective function.
The ΔPmin at Qdesign for case I17-1 is predicted at iteration 470, shown in Figure 6a. When Qdesign = 3.34 kW at operating condition I17-1 with ΔPmin, the number of tubes required is 65, distributed in 5 passes containing 13 tubes each. The optimum number of ports for the ΔPmin is 10, and the optimum length, width, and height for the Qdesign at the highlighted ΔPmin are 0.290 m, 0.016 m, and 0.705 m, respectively. The optimal predicted ΔPmin at condition I17-1 is about 41.68 kPa, which shows a pressure drop reduction of 15% in the optimal value compared with the design value. Similarly, for case I6-6, the ΔPmin is predicted at iteration 249 for the given Qdesign, as shown in Figure 6b. This iteration’s geometric configuration exhibits the best pressure drop with the lowest value of 41.68 kPa, which shows an increase of 15% from the design to the optimal value. This corresponds to 52 tubes distributed in 4 passes, with each pass containing 13 tubes. The optimum number of ports is 10, whereas the optimum tube length, width, and height are 0.374 m, 0.015 m, and 0.564 m, respectively. Figure 6c shows that the ΔPmin at Qdesign for case M03-2 is predicted at iteration 27, corresponding to 39 tubes distributed in 3 passes, each with 13 tubes. The optimum number of ports is 10, and the optimal tube length, width, and height values are 0.499 m, 0.015 m, and 0.423 m, respectively. The optimal predicted value of the ΔPmin is about 116.81 kPa, which shows a pressure drop reduction of 16% from the design value to the optimal value. At a constant HX volume and with the requirement of a larger heat transfer capacity, the same code was applied to find the required geometrical configuration of the new Qdesign for the second operating condition H03-5 selected from Table 2. Figure 6d illustrates that when Qdesign = 10.66 kW, the ΔPmin = 287.45 kPa at iteration #470, which has 5 passes containing 65 tubes with 10 microchannel ports in each tube and showed about a 13% improvement compared with the design value. The number of tube distributions in each pass is 13, and the optimum length, width, and height for the Qdesign at the ΔPmin are 0.299 m, 0.015 m, and 0.705 m, respectively.
The pressure drop is an essential factor to consider when assessing heat exchangers. The pressure drop in the microchannels was calculated according to the data in Table 3 and the equations mentioned in Section 2.5. Figure 7 compares each operating condition’s MCGC baseline geometry pressure drop and the proposed optimal geometric configuration pressure drop for four different cases, i.e., I17, I6, M03, and H03. X-axis coordinates indicate the operating condition while Y-axis coordinates represent the corresponding pressure drop for that specific operating condition. The percentage mentioned at the top of the bar graph shows the difference between the ΔP obtained from the baseline and the proposed optimization approach.
The proposed approach can reduce the pressure drop by up to 16% compared with the baseline geometry. The average decrease in the pressure drops for each case (I17, I6, M03, and H03) were 14%, 15%, 16%, and 15%, respectively. The mechanism of the pressure drop in the MCGC improvement can be explained by the increase in the number of ports and tubes, which leads to the distribution of the refrigerant flow rate in respective tubes and ports. For the operating condition studied, increasing the number of ports and tubes could augment the effect of the pressure drop reduction.

5. Conclusions

A comprehensive MATLAB code was developed for analyzing an MCHX and validated for a flat tube louver fin MCGC. A segment-by-segment modeling approach was adopted for the evaluation of the gas cooler’s performance and the pressure drop. Furthermore, this approach is also applicable to various MCGC configurations with different operating conditions. The simulations were conducted for various operating conditions and geometric configurations, as discussed earlier. The influence of the geometric parameters on the performance of the MCGC were explored and optimized in this study. A total of 663 configurations were simulated for each 3-pass, 4-pass, and 5-pass, under conditions typically encountered by transcritical CO2 gas cooler systems. All designs had constant volume while the wide range of geometric configurations, i.e., the number of tubes, microchannel ports, and passes, were changed to allow a fair assessment of their performance. For the four cases, I17, I6, M03, and H03, average pressure drop reductions of 14%, 15%, 16%, and 15% were observed, respectively. The respective configurations and pass arrangements emphasized the importance of appropriately selecting the MCGC coil configuration. The model established in this study correctly predicted the experimental results and can be used for performance analysis and the design of an MCGC with minimal numerical uncertainty.

Author Contributions

Conceptualization, methodology, formal analysis, and original draft preparation by N.U. and S.I. M.-H.K. and S.C. supervised the research and edited the manuscript. All authors have read and agreed to the published version of the manuscript.

Funding

This research was partly supported by the Korea Evaluation Institute of Industrial Technology (KEIT) grant, funded by the Korean government (MOTIE) (Project No. 20015917).

Data Availability Statement

Data are contained in within the article.

Conflicts of Interest

The authors declare no conflict of interest.

Nomenclature

Affin surface area (m2)
Atitube inside surface area (m2)
Ameanmean surface area of the tubes (m2)
AtoTube outside surface area (m2)
Aaairside heat transfer area (m2)
Cheat capacity (kJ/K)
cpspecific heat capacity (kJ·kg−1·K−1)
Dportport diameter (mm)
ffriction factor
Fdflow depth (mm)
Fpfin pitch (mm)
Gmass flux (kg·m−2·s−1)
hheat transfer coefficient (W·m−2·K−1)
Hfin height (mm)
jColburn j factor
kthermal conductivity (W·m−1·K−1)
Lllouver length (mm)
Lplouver pitch (mm)
Lttube length (mm)
Lαlouver angle (°)
mass flow rate (kg/s)
NTUnumber of transfer units
Npnumber of ports
Ntnumber of tubes
Nsnumber of passes
NuNusselt number
Ppressure (kPa)
PrPrandtl number ( μ ρ α )
Qgas cooler capacity (kW)
ReReynolds number (=G·Dh)
ReLpairside Reynolds number, based on louver pitch (= V c L p / υ )
twwall thickness (mm)
Ttemperature (°C)
Tptube pitch (mm)
UAoverall heat transfer conductance (W·K−1)
Vcair velocity through minimum free-flow area (m/s)
ΔPpressure drop (kPa)
Greek letters
αvoid fraction or thermal diffusivity (k/ ρ c p ) (m2/s)
ɛeffectiveness
δ fin thickness (mm)
η f fin efficiency
η s surface effectiveness
μ dynamic viscosity (kg/m/s)
υ kinematic viscosity (=µ/ρ) (m2/s)
ρ density (kg/m3)
Subscripts
aair
ffin
iith segment or number or inlet
jjth term or number
kkth term or number
rrefrigerant
ttube
Abbreviations
HXheat exchanger
MCHXmicrochannel heat exchanger
MCGCmicrochannel gas cooler

References

  1. Kandlikar, S.G.; Garimella, S.; Li, D.; Colin, S.; King, M. Heat Transfer and Fluid Flow in Minichannels and Microchannels; Butterworth-Heinemann: Oxford, UK, 2014; ISBN 9780080983462. [Google Scholar]
  2. Schulz, M.; Kourkoulas, D. Regulation (EU) No 517/2014 of The European Parliament and of the Council of 16 April 2014 on Fluorinated Greenhouse Gases and Repealing Regulation (EC) No 842/2006. Off. J. Eur. Union 2014, 57, L150. [Google Scholar]
  3. Lorentzen, G.; Pettersen, J. A New, Efficient and Environmentally Benign System for Car Air-Conditioning. Int. J. Refrig. 1993, 16, 4–12. [Google Scholar] [CrossRef]
  4. Kim, M.H.; Pettersen, J.; Bullard, C.W. Fundamental Process and System Design Issues in CO2 Vapor Compression Systems. Prog. Energy Combust. Sci. 2004, 30, 119–174. [Google Scholar] [CrossRef]
  5. Jiang, H.; Aute, V.; Radermacher, R. CoilDesigner: A General-Purpose Simulation and Design Tool for Air-to-Refrigerant Heat Exchangers. Int. J. Refrig. 2006, 29, 601–610. [Google Scholar] [CrossRef]
  6. Fronk, B.M.; Garimella, S. Water-Coupled Carbon Dioxide Microchannel Gas Cooler for Heat Pump Water Heaters: Part II—Model Development and Validation. Int. J. Refrig. 2011, 34, 17–28. [Google Scholar] [CrossRef]
  7. García-Cascales, J.R.; Vera-García, F.; Gonzálvez-Maciá, J.; Corberán-Salvador, J.M.; Johnson, M.W.; Kohler, G.T. Compact Heat Exchangers Modeling: Condensation. Int. J. Refrig. 2010, 33, 135–147. [Google Scholar] [CrossRef]
  8. Yin, J.M.; Bullard, C.W.; Hrnjak, P.S. R-744 Gas Cooler Model Development and Validation. Int. J. Refrig. 2001, 24, 692–701. [Google Scholar] [CrossRef] [Green Version]
  9. Khatoon, S.; Ishaque, S.; Kim, M.H. Modeling and Analysis of Air-Cooled Heat Exchanger Integrated with Supercritical Carbon Dioxide Recompression Brayton Cycle. Energy Convers. Manag. 2021, 232, 113895. [Google Scholar] [CrossRef]
  10. Chai, L.; Tsamos, K.M.; Tassou, S.A. Modelling and Evaluation of the Thermohydraulic Performance of Finned-Tube Supercritical Carbon Dioxide Gas Coolers. Energies 2020, 13, 1031. [Google Scholar] [CrossRef] [Green Version]
  11. Heun, M.K.; Dunn, W.E. Performance and Optimization of Microchannel Condensers; ACRC TR-81; Air Conditioning and Refrigeration Center: Urbana, IL, USA, 1995; p. 269. [Google Scholar]
  12. Mehendale, S.; Li, Z.; Aute, V.; Park, C. Refrigerant Circuit Optimization of Dual-Mode Single-Row Microchannel Heat Exchangers Used for R410A Heat Pumps. In Proceedings of the International Refrigeration and Air Conditioning Conference, West Lafayette, IN, USA, 11–14 July 2016; pp. 1–10. [Google Scholar]
  13. Lawrence, N.; Elbel, S. Numerical Study on the Design of Microchannel Evaporators for Ejector Refrigeration Cycles. In Proceedings of the International Refrigeration and Air Conditioning Conference, West Lafayette, IN, USA, 11–14 July 2016; pp. 1–10. [Google Scholar]
  14. Yin, X.W.; Wang, W.; Patnaik, V.; Zhou, J.S.; Huang, X.C. Evaluation of Microchannel Condenser Characteristics by Numerical Simulation. Int. J. Refrig. 2015, 54, 126–141. [Google Scholar] [CrossRef]
  15. Saleem, A.; Kim, M.H. Air-Side Thermal Hydraulic Performance of Microchannel Heat Exchangers with Different Fin Configurations. Appl. Therm. Eng. 2017, 125, 780–789. [Google Scholar] [CrossRef]
  16. Gunnasegaran, P.; Mohammed, H.A.; Shuaib, N.H.; Saidur, R. The Effect of Geometrical Parameters on Heat Transfer Characteristics of Microchannels Heat Sink with Different Shapes. Int. Commun. Heat Mass Transf. 2010, 37, 1078–1086. [Google Scholar] [CrossRef]
  17. Wang, H.; Chen, Z.; Gao, J. Influence of Geometric Parameters on Flow and Heat Transfer Performance of Micro-Channel Heat Sinks. Appl. Therm. Eng. 2016, 107, 870–879. [Google Scholar] [CrossRef]
  18. Chen, Y.; Zhang, C.; Shi, M.; Wu, J. Three-Dimensional Numerical Simulation of Heat and Fluid Flow in Noncircular Microchannel Heat Sinks. Int. Commun. Heat Mass Transf. 2009, 36, 917–920. [Google Scholar] [CrossRef]
  19. Jing, D.; He, L. Numerical Studies on the Hydraulic and Thermal Performances of Microchannels with Different Cross-Sectional Shapes. Int. J. Heat Mass Transf. 2019, 143, 118604. [Google Scholar] [CrossRef]
  20. Huang, L.; Aute, V.; Radermacher, R. Airflow Distribution and Design Optimization of Variable Geometry Microchannel Heat Exchangers. Sci. Technol. Built Environ. 2015, 21, 693–702. [Google Scholar] [CrossRef]
  21. Ishaque, S.; Kim, M.H. Refrigerant Circuitry Optimization of Finned Tube Heat Exchangers Using a Dual-Mode Intelligent Search Algorithm. Appl. Therm. Eng. 2022, 212, 118576. [Google Scholar] [CrossRef]
  22. Glazar, V.; Trp, A.; Lenic, K. Optimization of Air-Water Microchannel Heat Exchanger Using Response Surface Methodology. Int. J. Heat Mass Transf. 2020, 157, 119887. [Google Scholar] [CrossRef]
  23. Ge, Y.T.; Tassou, S.A.; Santosa, I.D.; Tsamos, K. Design Optimisation of CO2 Gas Cooler/Condenser in a Refrigeration System. Appl. Energy 2015, 160, 973–981. [Google Scholar] [CrossRef] [Green Version]
  24. Okasha, A.; Müller, N.; Deb, K. Bi-Objective Optimization of Transcritical CO2 Heat Pump Systems. Energy 2022, 247, 123469. [Google Scholar] [CrossRef]
  25. Garcia, J.C.S.; Tanaka, H.; Giannetti, N.; Sei, Y.; Saito, K.; Houfuku, M.; Takafuji, R. Multiobjective Geometry Optimization of Microchannel Heat Exchanger Using Real-Coded Genetic Algorithm. Appl. Therm. Eng. 2022, 202, 117821. [Google Scholar] [CrossRef]
  26. Ishaque, S.; Kim, M.H. Numerical Modeling of an Outdoor Unit Heat Exchanger for Residential Heat Pump Systems with Nonuniform Airflow and Refrigerant Distribution. Int. J. Heat Mass Transf. 2021, 175, 121323. [Google Scholar] [CrossRef]
  27. Kim, M.H.; Bullard, C.W. Development of a Microchannel Evaporator Model for a CO2 Air-Conditioning System. Energy 2001, 26, 931–948. [Google Scholar] [CrossRef]
  28. Incropera, F.P.; Dewitt, D.P.; Bergman, T.L.; Lavine, A.S. Fundamentals of Heat and Mass Transfer, 6th ed.; John Wiley & Sons: Hoboken, NJ, USA, 2007; ISBN 978-0-471-45728-2. [Google Scholar]
  29. Lemmon, E.W.; Bell, I.H.; Huber, M.L.; McLinden, M.O. NIST Standard Reference Database 23: Reference Fluid Thermodynamic and Transport Properties-REFPROP, Version 10.0; National Institute of Standards and Technology: Gaithersburg, MD, USA, 2018. [Google Scholar]
  30. Kim, M.H.; Bullard, C.W. Air-Side Thermal Hydraulic Performance of Multi-Louvered Fin Aluminum Heat Exchangers. Int. J. Refrig. 2002, 25, 390–400. [Google Scholar] [CrossRef]
  31. Giannavola, M.S.; Hrnjak, P.S. Experimental Study of System Performance Improvements in Transcritical R744 Systems for Mobile Air-Conditioning and Heat Pumping; Acrc CR-46; Air Conditioning and Refrigeration Center: Urbana, IL, USA, 2002; Volume 61801, p. 231. [Google Scholar]
Figure 1. Schematic of the Microchannel gas cooler with flow direction.
Machines 10 01177 g001
Figure 2. CO2 Microchannel gas cooler baseline configuration.
Machines 10 01177 g002
Figure 3. Flow chart of a numerical model for a transcritical CO2 gas cooler.
Machines 10 01177 g003
Figure 4. (a) Comparison of experimental vs. simulated gas cooler capacity; (b) comparison of experimental vs. simulated gas cooler pressure drop.
Machines 10 01177 g004
Figure 5. Range of heat transfer rate Q for given operating conditions.
Machines 10 01177 g005
Figure 6. (a) Variation of gas cooler capacity and pressure drop with each iteration (I17-1); (b) variation of gas cooler capacity and pressure drop with each iteration (I6-6); (c) variation of gas cooler capacity and pressure drop with each iteration (M03-3); (d) variation of gas cooler capacity and pressure drop with each iteration (H03-5).
Machines 10 01177 g006aMachines 10 01177 g006b
Figure 7. Pressure drop percentage improvement compared with the baseline geometry of the MCGC.
Machines 10 01177 g007
Table 1. Microchannel CO2 gas cooler baseline geometric specifications.
Core volume (m3)0.00332
Refrigerant pass13-11-10
FinTypeLouvered fins
Height (mm)8.89
Pitch (mm)2.5
Width (mm)16
Thickness (mm)0.10
Louver pitch (mm)0.99
Louver angle (°)23
Louver length (mm)5.98
TubeNumber of tubes34
Tube length (mm)545
Number of ports11
Port diameter (mm)0.79
Wall thickness (mm)0.43
Web thickness (mm)0.70
Table 2. Operating conditions.
S.NoCompressor Speed
[RPM]
Tri [°C]Pri [kPa]Tai [°C]r [g/s]a [g/s]
I17-1 106.8983343.620.78451
I17-2 111.710,35543.619.80451
I17-3950115.810,88843.619.02452
I17-4 119.711,38843.618.45452
I17-5 123.011,85443.617.96452
I6-1 115.812,46455.126.39457
I6-2 118.012,67255.025.91457
I6-3950119.212,85555.025.61457
I6-4 120.512,96054.925.26456
I6-5 125.013,33554.924.47456
I6-6 126.613,59254.923.94456
M03-1 124.710,93742.737.84537
M03-21800124.310,95042.838.05537
M03-3 125.010,97442.937.75537
M03-4 124.710,97542.937.93537
H03-1 129.310,33843.656.39701
H03-23000129.510,35143.956.39700
H03-3 138.610,79243.556.36701
H03-4 142.611,02543.754.83700
H03-5 148.911,75643.550.13700
Table 3. Range of parameters for the optimization model.
Parameter RangeParameterRange
No. of tubes12–95Heat exchanger height (m)0.130–1.031
No. of ports9–21Heat exchanger width (m)0.015–0.024
No. of passes3,4,5Heat exchanger length (m)0.216–1.706
Publisher’s Note: MDPI stays neutral with regard to jurisdictional claims in published maps and institutional affiliations.

