Article

Influence of Different Reflux Groove Structures on the Flow Characteristics of the Roots Pump

1
Research Center of Fluid Machinery Engineering and Technology, Jiangsu University, Zhenjiang 212013, China
2
Jiangsu XCMG Engineering Machinery Research Institute Co., Ltd., Xuzhou 221004, China
3
Vacculex Vacuum Equipment (Zhejiang) Co., Ltd., Huzhou 313100, China
*
Author to whom correspondence should be addressed.
Machines 2022, 10(11), 1087; https://doi.org/10.3390/machines10111087
Submission received: 17 October 2022 / Revised: 10 November 2022 / Accepted: 14 November 2022 / Published: 17 November 2022
(This article belongs to the Section Machine Design and Theory)

Abstract

:
A Roots pump often exhibits the typical characteristics of high gas pressure in the exhaust port, low pressure at a basic volume and large airflow pulsation at the outlet as a result of gas reflux. In light of this, this study employed Pumplinx software for the numerical calculation of the entire flow field of a two-bladed Roots pump. The effects of the rectangular and curved reflux groove structures on the internal flow field of a Roots pump, especially on the outlet pressure pulsation and flow rate, were unveiled separately. The rectangular reflux groove controlled the angle and thickness, while the curved reflux groove regulated the coordinates of the key points on the Bezier curve. It is worth recognizing that different reflux groove structures were not noticeable in enhancing the inlet measurement flow pattern; reduce the exhaust pressure pulsation, flow pulsation and exhaust section vortex. Interestingly, the rectangular return groove far outweighed the curved groove when optimizing the pressure and flow pulsation when registering the higher flow loss compared to the curved return groove. The merits and demerits of the Q criterion and omega criterion in characterizing the vortex structure of the flow field in the Roots pump were compared by Tecplot software. The omega criterion looked more robust, clear and continuous in revealing the strong and weak vortices in the Roots pump. The outcome of this research work could provide a reference for the study of Roots pump airflow pulsation, vortex analysis and casing structure design optimization.

1. Introduction

The Roots pump is a double-rotor volumetric pump with a simple structure, good power balance, high volumetric efficiency, large vacuum and forced transport. Due to the fact of its distinct features, it is widely used in electric power, smelting, petroleum, and chemical and other engineering perspectives that require a large pumping speed.
A roots pump is a positive displacement pump, and it is a related to piston pump, slide pump, screw pump, etc. The research on other positive displacement pumps shows that it also has certain reference significance in the research, analysis and optimization of Roots pumps. Kovacevic et al. [1] studied the interaction system of CFD simulations. Borisova et al. [2] studied the effect of a screw pump rotor on its pressure inertial force. Radovan [3] and others scholars performed experimental works combined with the mathematical modeling in the optimization analysis of the axial piston pump to conduct optimization analyses. Todić [4] and others carried out mathematical modeling on water hydraulic axial piston pump fluid dynamic processes using instruction pump parameter optimizations. Petrovic [5] considered the effect of the size and shape of the opening on the valve plate on the pressure loss. Roots pumps operate at a faster speed, that exacerbates the reflux phenomenon due to the high pressure differences at the inlet and exit. Due to the fact of this phenomenon, the outlet pressure pulsation and flow pulsation increase, which culminates in vibration and noise, hence affecting the performance of the pump. For this reason, several authors have recently expressed interest on research on Roots pump. Notable amongst them are Kris [6], Yang [7] and Voss [8] et al., who studied theoretical calculations and an analytical model for Roots pump. Sun and Singh [9,10] ascertained the correctness of a simulation by comparing the transient analysis particle image velocimetry (PIV) method with the calculation. Deng and Wu [11,12] explored the influence of multistage roots on flow characteristics. It was observed that researches on reducing the pressure pulsation were mainly centered on three aspects specifically: rotor, cooling reflux and widening the gap. Li et al. [13] analyzed the influence of the profile pressure angle on the flow field and concluded that the pressure pulsation attained its peak at an angle of 40°. Hsieh [14] and Wang [15] introduced the elliptic arc profile as a parametric elliptic axial ratio in their studies. It was revealed that when the parameter was 0.6, the performance became optimal. It is worth noticing that the profile that the optimization proffers has a great impact on the efficiency, thus suggesting that the optimization effect’s influence on the pressure pulsation is not as ideal. To effectively enhance the pressure pulsation with a straight blade rotor, the rotor structure could be utilized to convert it from a straight to a torsional blade rotor [16,17] or perhaps to augment the number of blades [18]. Meanwhile, the torsional blade rotor possesses the quality of higher stability and reduced pressure pulsation; however, to some extent, the efficiency might be lost. Similar to this, the three-bladed rotor stabilizes the pressure more swiftly and has a smaller exhaust flow pulsation amplitude than a two-bladed rotor. Vizgalov [19] introduced an injector structure that could accurately reduce the pressure pulsation and temperature. Theoretically, it belongs to a cooling reflux structure, but due to the fact of its body size and the necessity for more accurate settings, it was only suitable and recommended for usage on a few specific occasions. Sun et al. [20,21] carried out simulation calculations on a commonly used Roots pump with a cooling reflux structure and concluded that the reflux structure had quite obvious optimization effect on the outlet pressure pulsation. They revealed that this technique could restrain the exhaust pulsation by approximately 50%, while the efficiency could be reduced to a certain degree in the pump. Li et al. [22,23] investigated the effect of the widening gap structure on the pressure pulsation and radial excitation force, with the goal of reducing the pressure pulsation and simplifying it’s structure. To ascertain the veracity of these structures, they conducted an in-depth comparison of the simulations between the cooling reflux structure and the widening gap structure [24].
How to reduce the exhaust pressure pulsation and flow pulsation was analyzed and studied, primarily in the direction of the countercurrent cooling and the widening gap. Countercurrent cooling does not, however, only reduce the exhaust pulsation, it increases the vortex volume and curtails the noise reduction effect. The widening gap structure is a kind of internal reflux groove structure and, hitherto, researchers have verified that it can vastly reduce the flow pulsation and the noise of the exhaust flow measurement. In addition, it is restricted to a two-dimensional simulation analysis, which is considered only for the influence of the widening gap angle on the internal flow field. Unfortunately, there has been relatively little research works available on the length, thickness, shape, etc. of the internal reflux groove in general. The existing research on Roots pump vortexes lack a thorough investigation. In this paper, Pumplinx V4.6.0 software was employed to simulate and analyze a two-leaf Roots pump model. The influence of the thickness, angle and shape factors of the inner reflux groove structure on the exhaust pressure pulsation and exhaust flow pulsation of a Roots pump was compared. Furthermore, the effects of the Bézier curve control point parameters on the performance of the Roots pump were investigated. In order to provide theoretical basis for stable operation of Roots pump, different vortex analysis methods are used to extract and analyze the vortex structure of flow field using Tecplot 2021 R1 software. Finally, the merits and demerits of Q criterion and omega criterion in characterizing vortex structures and the selection of proper parameters are compared.

2. Governing Equations of Gas Flow

The gas in a Roots pump can be regarded as a compressible ideal gas, and the Reynolds-averaged Navier–Stokes equations of compressible air can be written in the form of a Cartesian tensor using a summation convention. The governing equations are [25]:
Continuity equation:
ρ t + ( ρ V ) = 0
Momentum equation:
ρ [ V t + ( V ) V ] p + ( τ ) = ρ g + f
In the equation, ρ —the static pressure; τ —the stress tensor; ρ g —gravity; f —Surface force.
The RNG K-ε turbulence model with high accuracy was selected for the unsteady flow calculation. This is similar to the standard K-ε model; however, it was optimized and improved to augment the exactness of the high-speed flow and vortex flow, rendering the calculation results more accurate and reliable. Its tensor form is [26]:
ρ d k d t = x i ( α k u e f f k x j ) + 2 u t S i j ¯ u i ¯ x j ρ ε
ρ d ε d t = x j ( α ε u e f f ε x j ) + 2 C 1 ε ε k v t S i j ¯ u i ¯ x j C 2 ε ρ ε 2 k R
In the equation, C 1 ε and C 2 ε are empirical constants; k is turbulent pulsating kinetic energy; ε is the turbulent dissipation rate; α k and α ε are the reciprocals of the effective turbulent Prandtl number of the turbulent kinetic energy k and dissipation rate ε, respectively.

3. Flow Field Calculation of the Roots Pump

3.1. Fluid Domain Modeling and Meshing

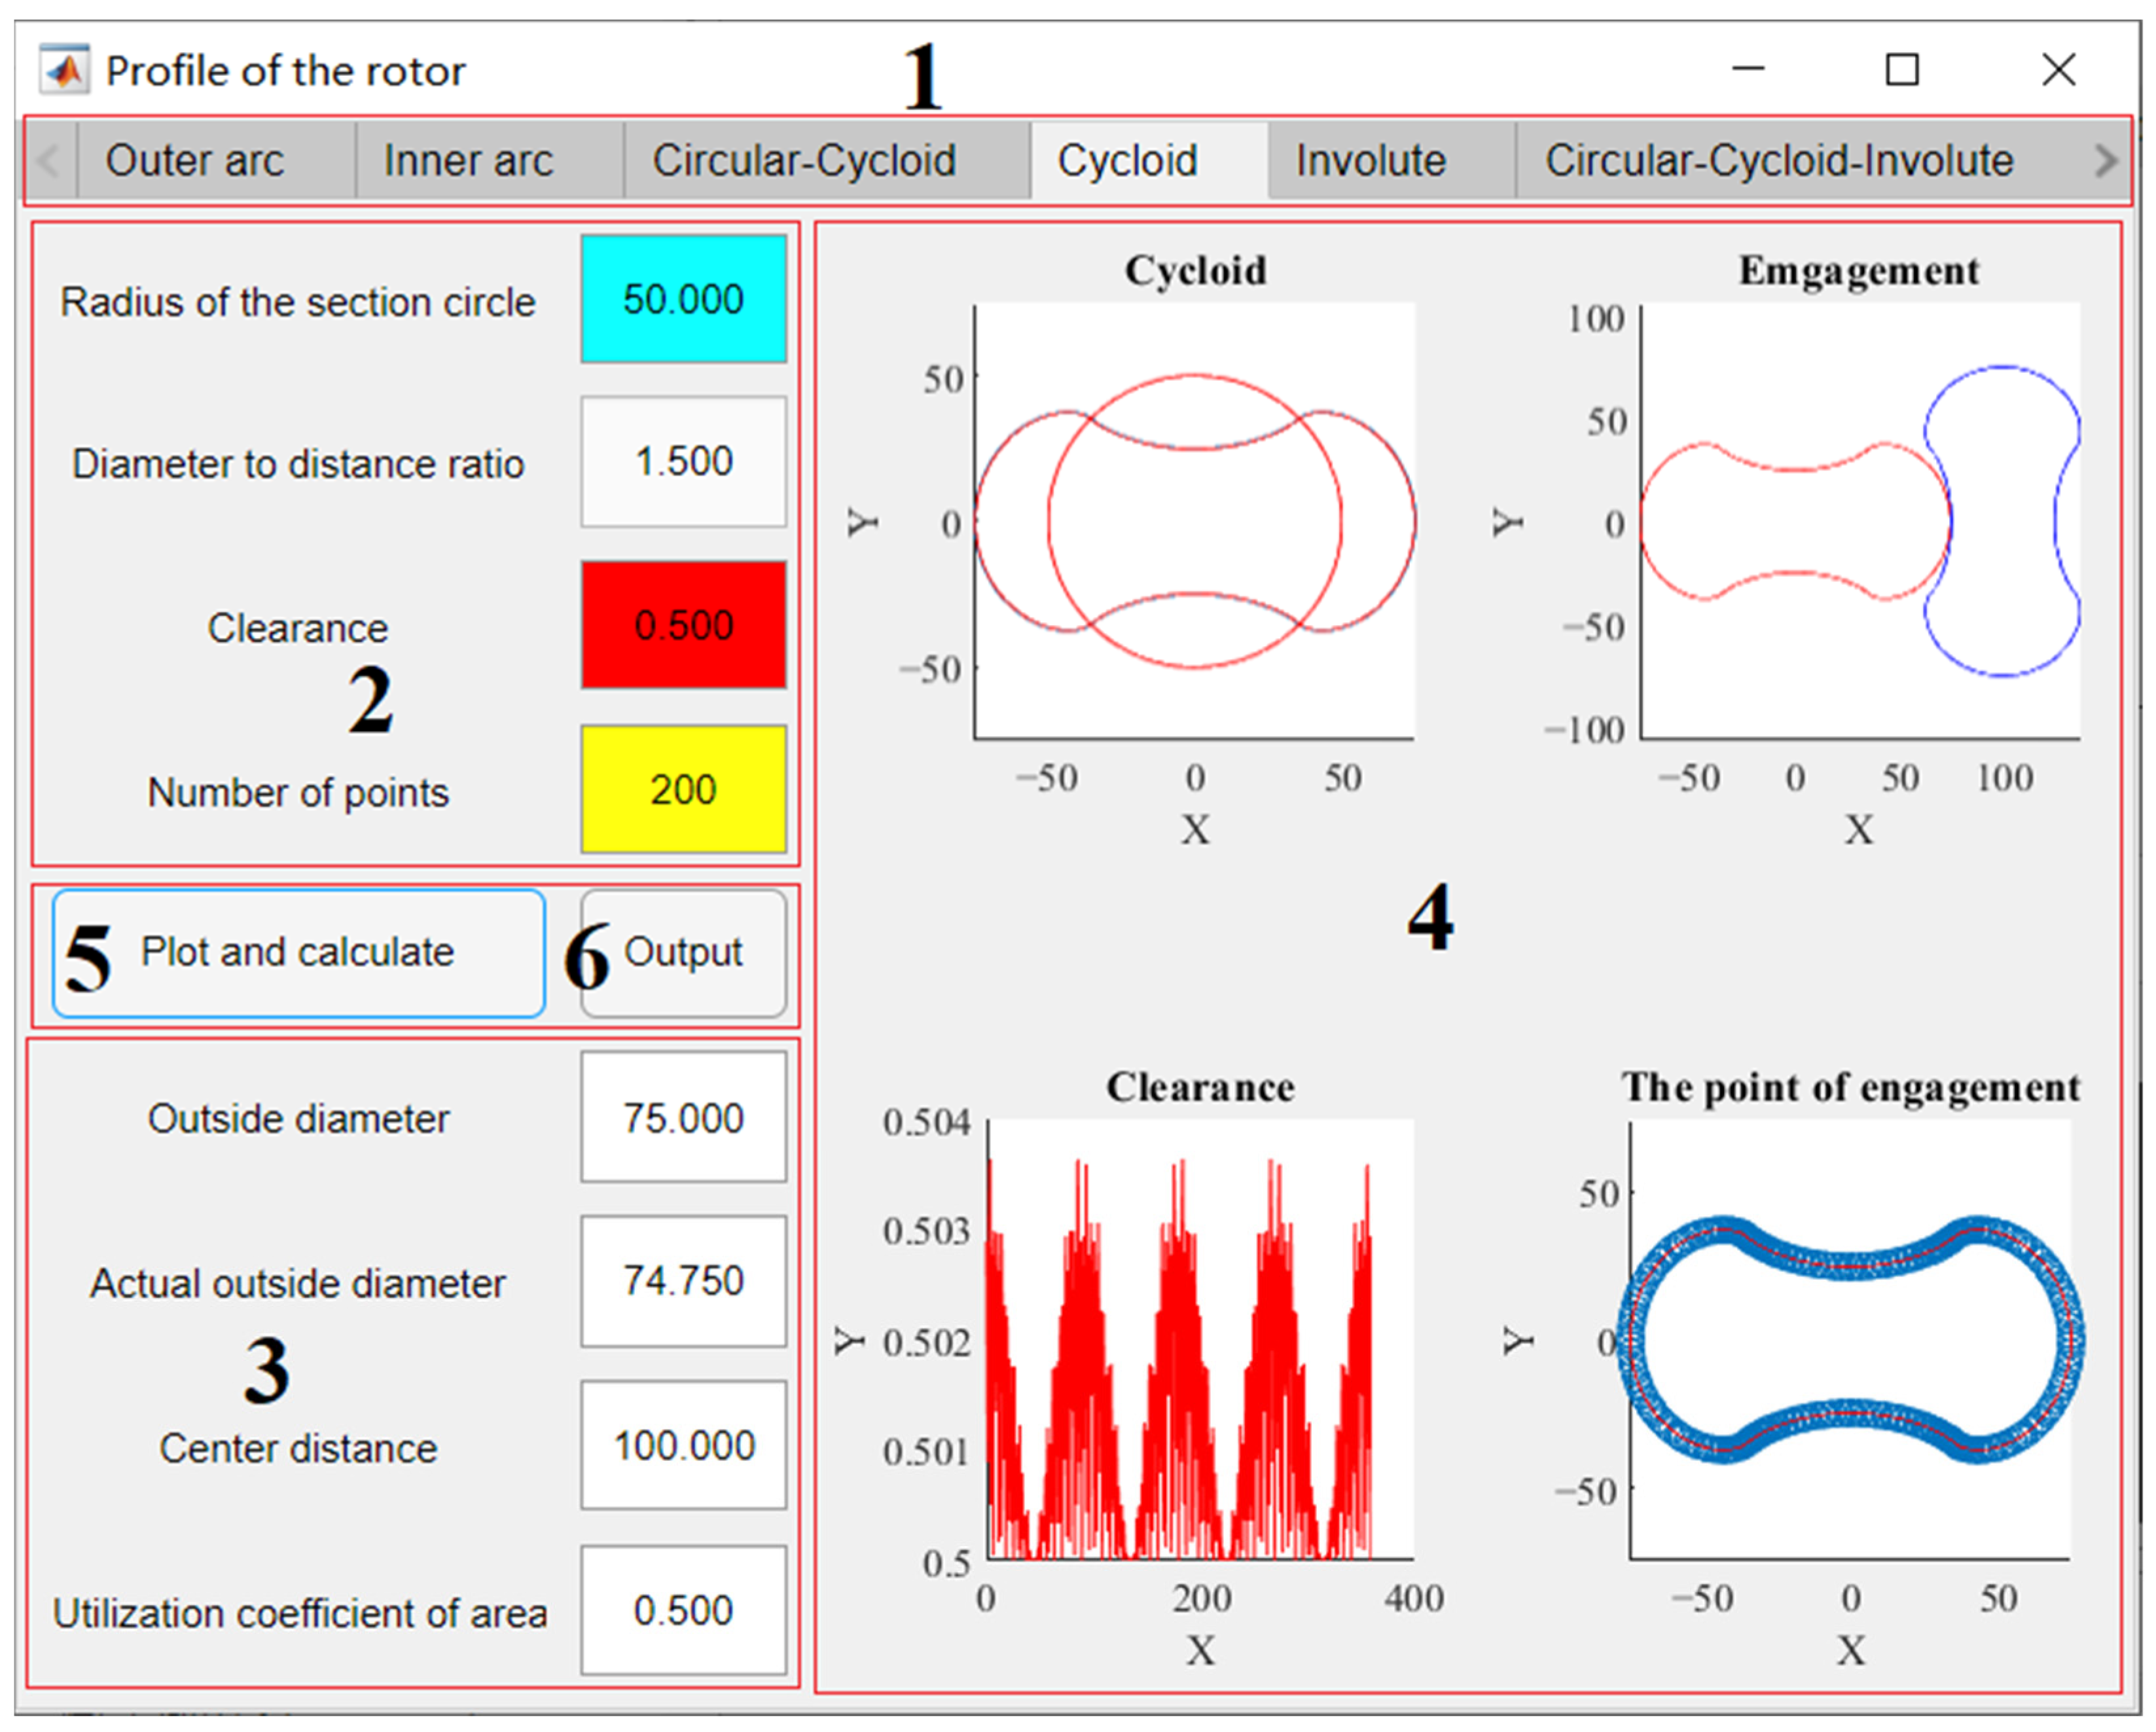
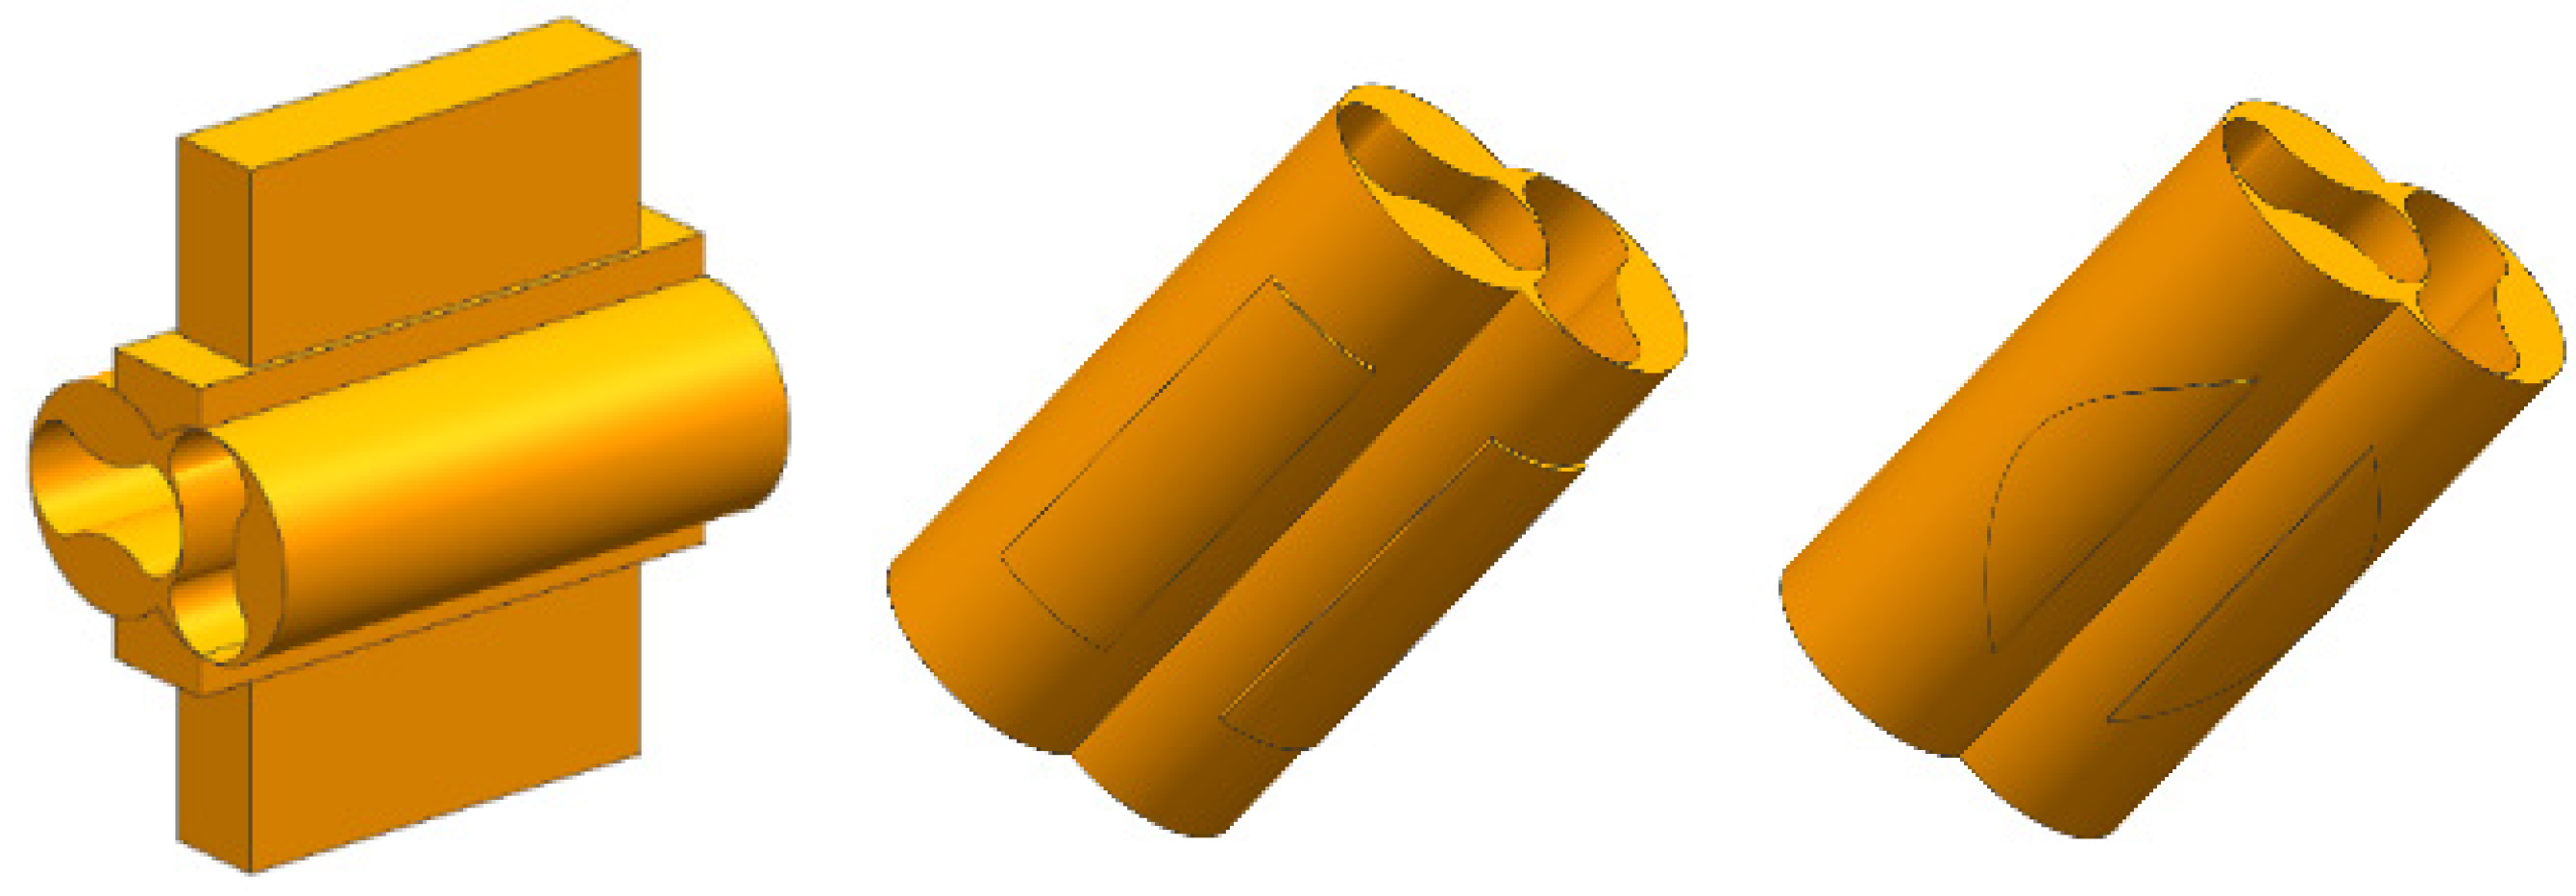
The model employed in this paper is a two-blade Roots pump. The three-dimensional model of the Roots pump is shown in Figure 1. The outer diameter of the rotor is 344.44 mm, the length is 919 mm, the center distance of the rotor is 230 mm, and the speed is 2400 r/min. The length of the outlet channel is 710 mm and the width of the outlet channel is 161 mm. Because of the symmetrical distribution at the inlet and outlet of the model, the size of the inlet channel is the same as that of the outlet channel. The Roots pump rotor calculation and analysis software, which employs the use of MATLAB APP R2019a, generates the rotor profile and allows for the use of the profile selection module, parameter input module, data calculation module, drawing module, drawing calculation button, and output button. Meanwhile, Figure 2 depicts the running interface of the software. Based on the parameteric equations of the different rotor profiles and filling in the main parameter information, the software could draw the rotor profile, meshing clearance, and meshing point distribution during operation. This could serve as a reference for the optimization of the Roots rotor and allow for the analysis of the existing profile to carry out reverse engineering. The rotor point file could be output by the output button, which is convenient for fast modeling in 3D software. The profile types included cycloid, arc, involute and common combined profile. The number of the profile blades included two blades and three blades. Due to the fact that the performance of a cycloid rotor under a large flow is better than an arc type [26], a two-blade cycloid rotor was therefore applied in this paper. The profile equation of the rotor is:
{ x n = R m 2 ( Z + 1 ) { ( 2 Z 1 ) cos θ cos [ ( 2 Z 1 ) θ ] } δ 2 cos [ ( Z 1 ) θ ] y n = R m 2 ( Z + 1 ) { ( 2 Z 1 ) sin θ sin [ ( 2 Z 1 ) θ ] } + δ 2 sin [ ( Z 1 ) θ ]
In the equation, 0 θ π / 4 ;
{ x n = R m 2 ( Z + 1 ) { ( 2 Z + 1 ) cos θ + cos [ ( 2 Z + 1 ) θ ] } + δ 2 cos [ ( Z + 1 ) θ ] y n = R m 2 ( Z + 1 ) { ( 2 Z + 1 ) sin θ + sin [ ( 2 Z + 1 ) θ ] } + δ 2 sin [ ( Z + 1 ) θ ]
In the equation, π / 4 θ π / 2 .
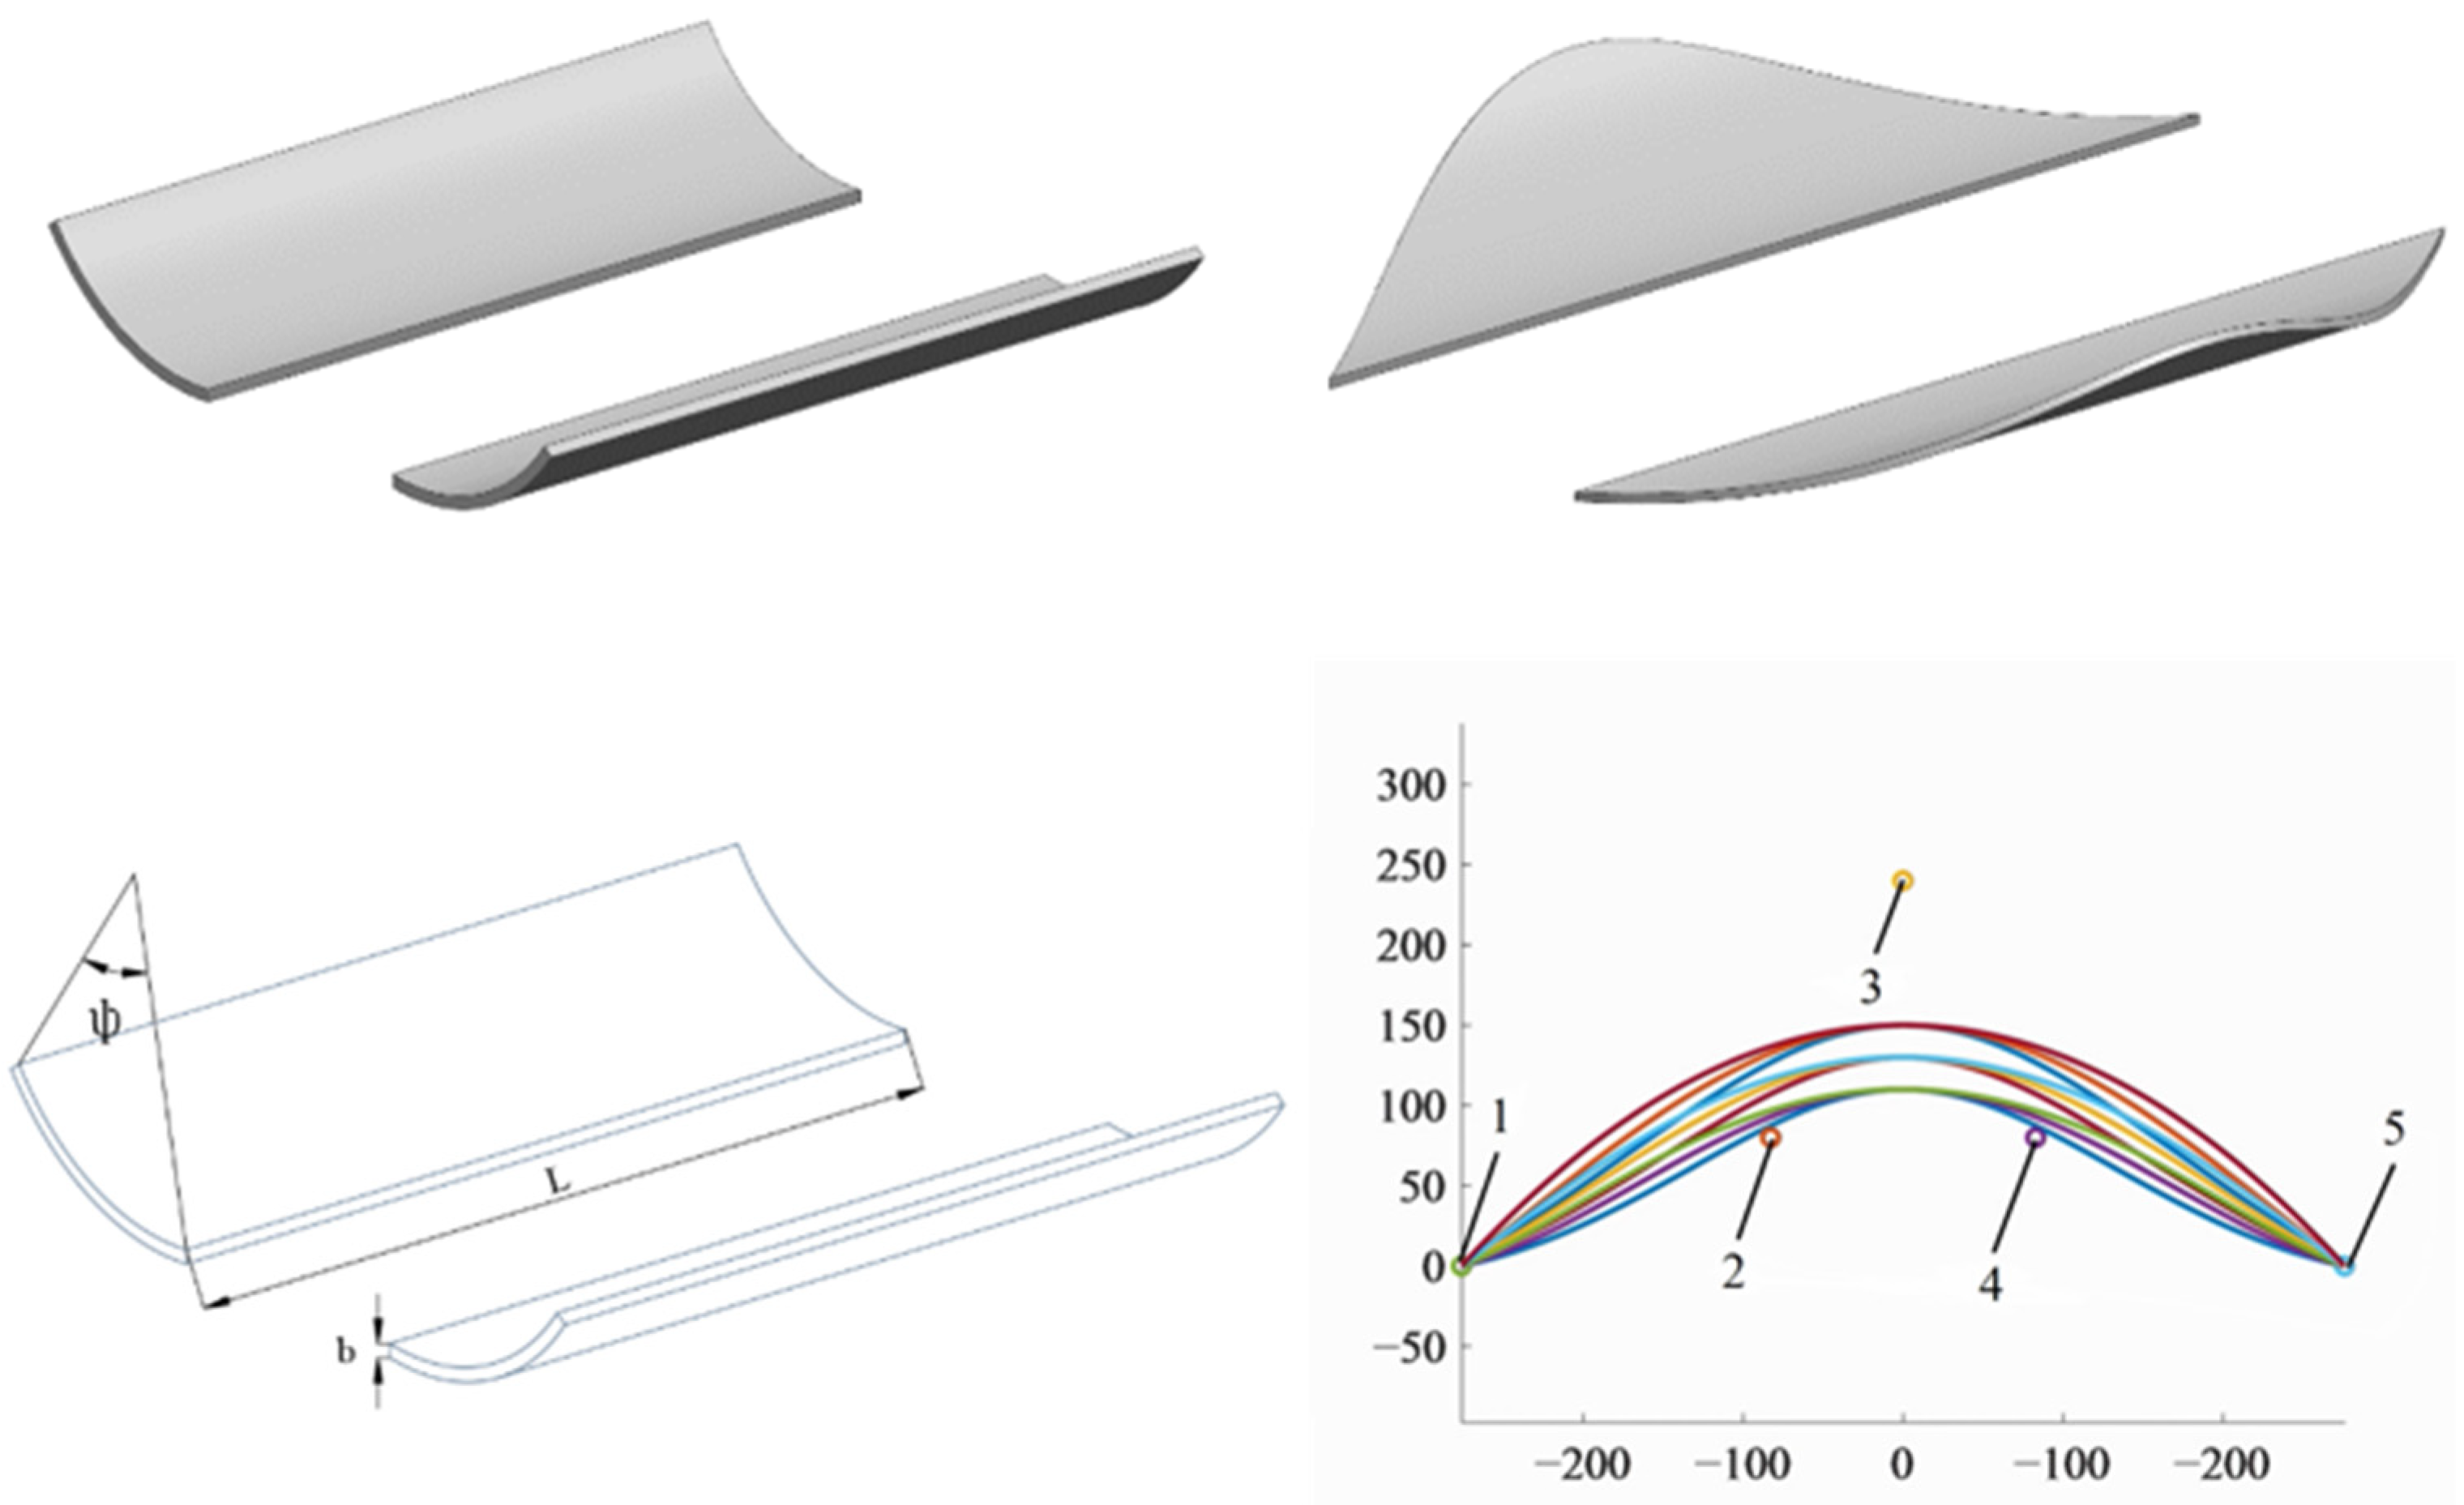
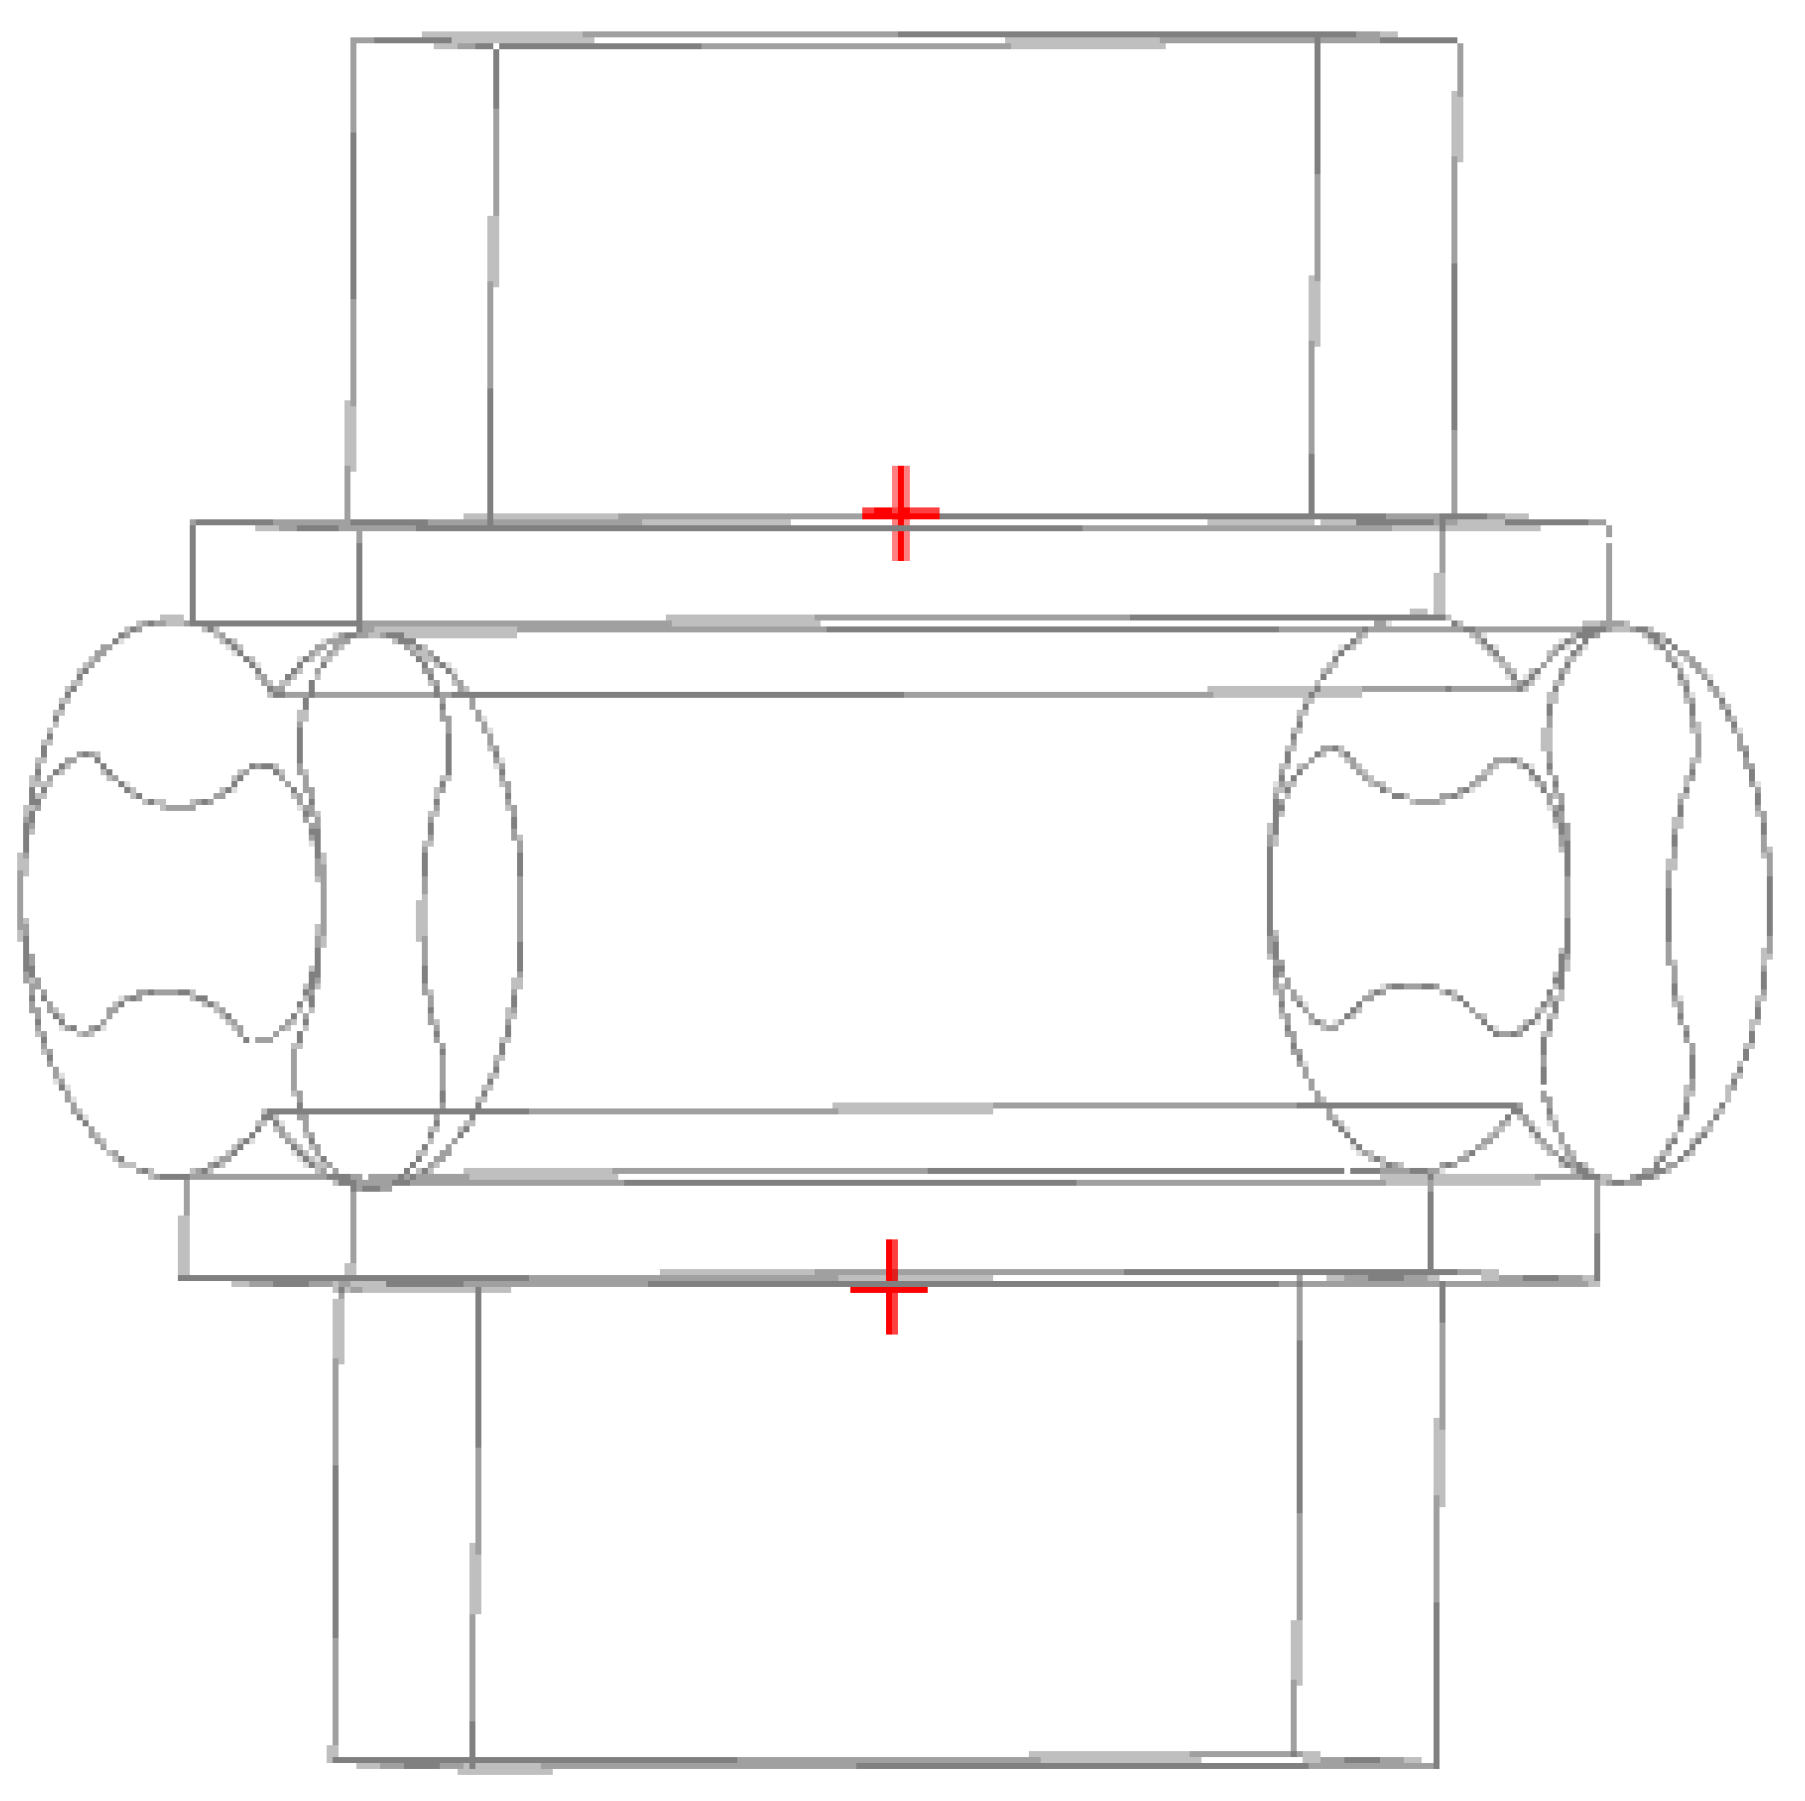
Figure 3 shows a simplified model of the original fluid domain and the fluid domain structure of the added reflux groove structure (the reflux groove structure was located in the exhaust gas measurement). Figure 4 reveals the structure of the reflux groove, comprising of arc-shaped reflux groove and the rectangular reflux groove, where L is the length of the rectangular reflux groove, b is the thickness of the rectangular reflux groove and φ is the angle of the rectangular reflux groove. The shape of the curved reflux groove is controlled by Bezier curve containing 5 control points, and thickness of 5 mm. The control points 1, 3 and 5 are denoted as fixed points. Meanwhile, the coordinates of the points are as follows: point 1 (−a, 0), point 3 (0, b), point 5 (a, 0), point 2 ( c 1 × a , c 2 × b ) , point 4 ( c 1 × a , c 2 × b ) , and lastly points 2 and 4 are selected as moving points, where a is set at 276 and b is set at 240. In this study, the inner reflux groove was 0.6 times the length of the rotor, and by varying the thickness B, the angle of the rectangular reflux groove and the control point coefficients c1 and c2 of the curved reflux groove, the various reflux grooves’ effects on the internal flow characteristics of the Roots pumps were investigated. Meanwhile, Table 1 displays the optimization parameters of the rectangular reflux groove, while Table 2 shows the optimization parameters of the curved reflux groove.
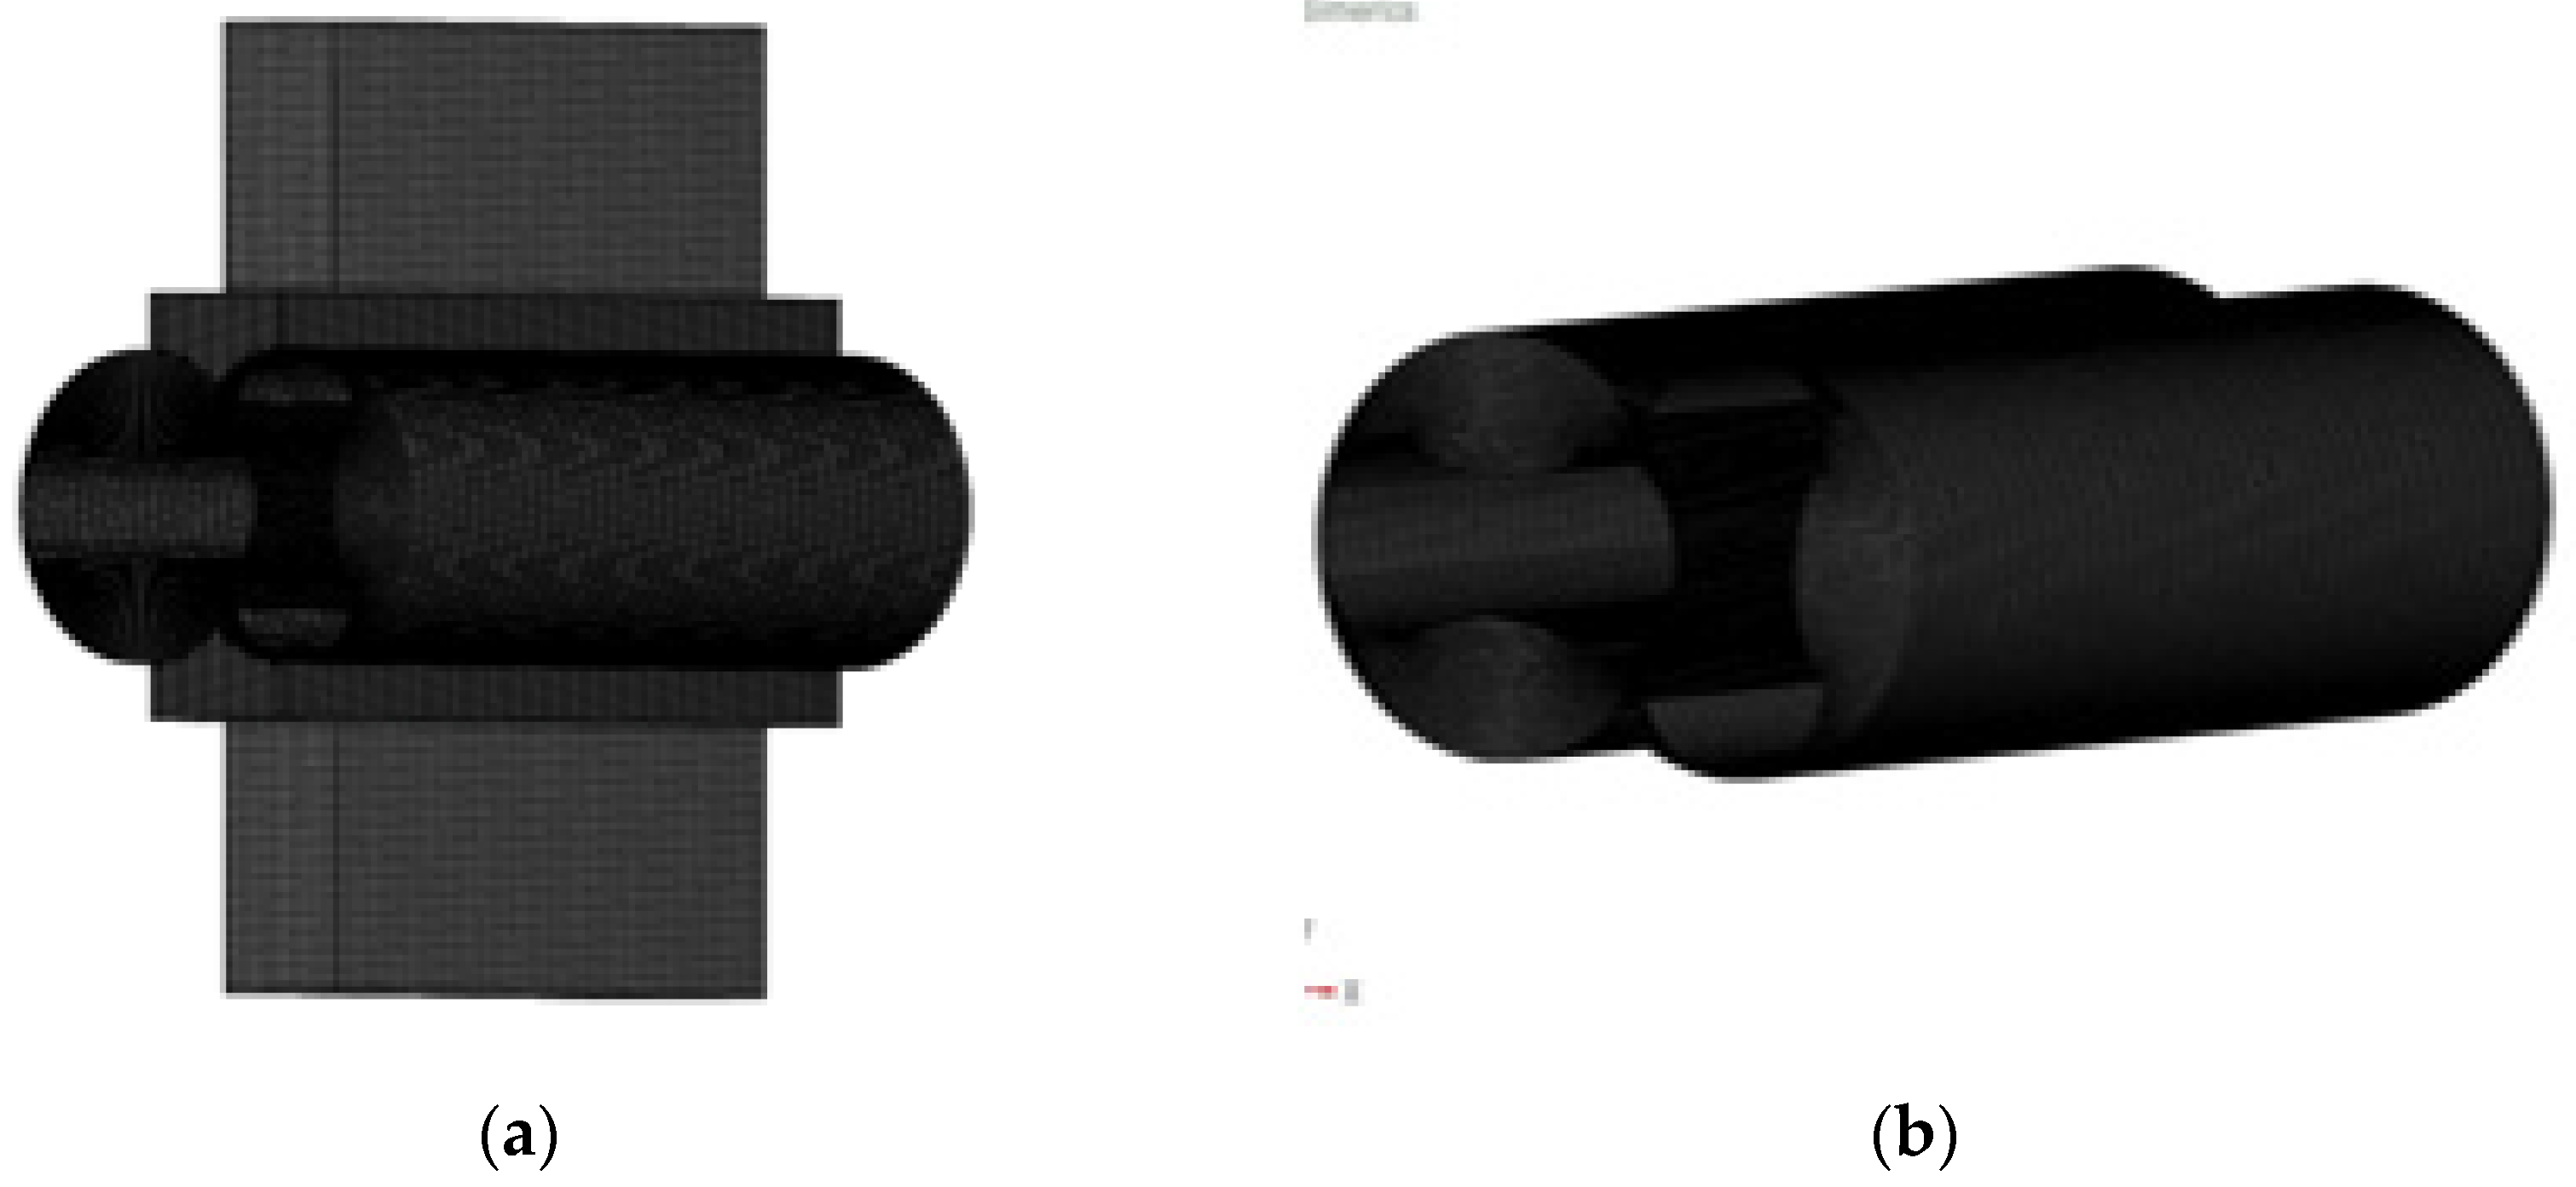
Common analysis software for the internal flow of a Roots pump encompasses CFX [10,27], Fluent [28,29,30] and Pumplinx [11,15]. However, owing to the marginal gap between the Roots pump rotors, the gap between the rotor and the casing is small, making the internal turbulent flow complex. Numerical simulation necessitates the use of dynamic grid technology. Traditional dynamic grid analysis requires a large number of grids, which makes it prone to error. The Pumplinx software includes an automated Cartesian grid generator that facilitates the generation of high-quality grids that CFD solvers can efficiently solve. The software includes a variety of pump and valve simulation templates for rapid simulation. Therefore, in this paper, the external gear pump template of the Pumplinx software was applied to effectively generate dynamic mesh for the rotor area, and the model mesh was as depicted in Figure 5. Through the simulation analysis of the models with different numbers of outer grids, when the number of grids increased from 780,000 to 1.02 million, the import flow changed by 0.2%. Hence, the analysis was carried out with 780,000 grids. During this time, the number of cells in the rotational direction was 360, the number of cells in the radial direction was 15, and the number of cells in the axial direction was 40.

3.2. The Setting of the CFD

The external gear pump template in Pumplinx was used.The added modules were Gear, Flow, Heat and Streamline, in which the Flow module was added with Turbulence module. The pressure inlet and outlet conditions were used in the calculation, and the inlet and outlet pressures remained constant. The outlet pressure was the standard atmospheric pressure, which remained unchanged. Different working conditions were simulated by changing the inlet pressure, while the simulated speed was set to 2400 rad/min. The active rotor rotated counterclockwise, and the driven rotor rotated clockwise to realize the upward and downward discharge of the gas. The wall condition of the two rotors was maintained as the “rotating wall”, and the other wall condition was the “wall”. In the turbulence model, all wall conditions were defined as standard smooth walls. The fluid medium employed in this study was air, and the ideal gas equation of the state was used. The dynamic viscosity was 1.853 × 10 5   Pa · s , the thermal conductivity was 0.7 and the heat capacity was 1005   J / ( kg · k ) . Based on Pumplinx dynamic grid technology and the RNG k-ε model, the SIMPLEC algorithm was applied to solve the Reynolds-averaged Navier–Stokes equations. Meanwhile, the second-order upwind scheme was selected as the discrete scheme. A three-dimensional unsteady simulation analysis of the Roots pump was carried out.
The total duration of the numerical calculation was the time required for f rotations of the rotor, while the number of steps for each tooth of the rotor was 60. (That is, the rotation of each step was 3°, and the iteration of each step was 200 steps.) To verify the accuracy of the number of steps, 1°, 3° and 5° were compared. Noticeably, when the time step was 1°, the waveform became more delicate; nevertheless, it changed the shape marginally compared to 3°. Meanwhile, all of the models were analyzed with a step of 3°, and afterwards, these models were compared with regard to their advantages and disadvantages. When each time step was 5°, there existed only 18 points in a cycle, which was an excessively large range, making it challenging to analyze the flow field from different angles. In order to conserve time and computer memory, the findings were saved every 120 steps for the first three weeks. The results were then steadily used for analysis in the fourth week, with just one step being saved. The monitoring points at the inlet and outlet positions, prior to the calculation, are shown in Figure 6.

3.3. Comparison between the Experimental and Simulation Results

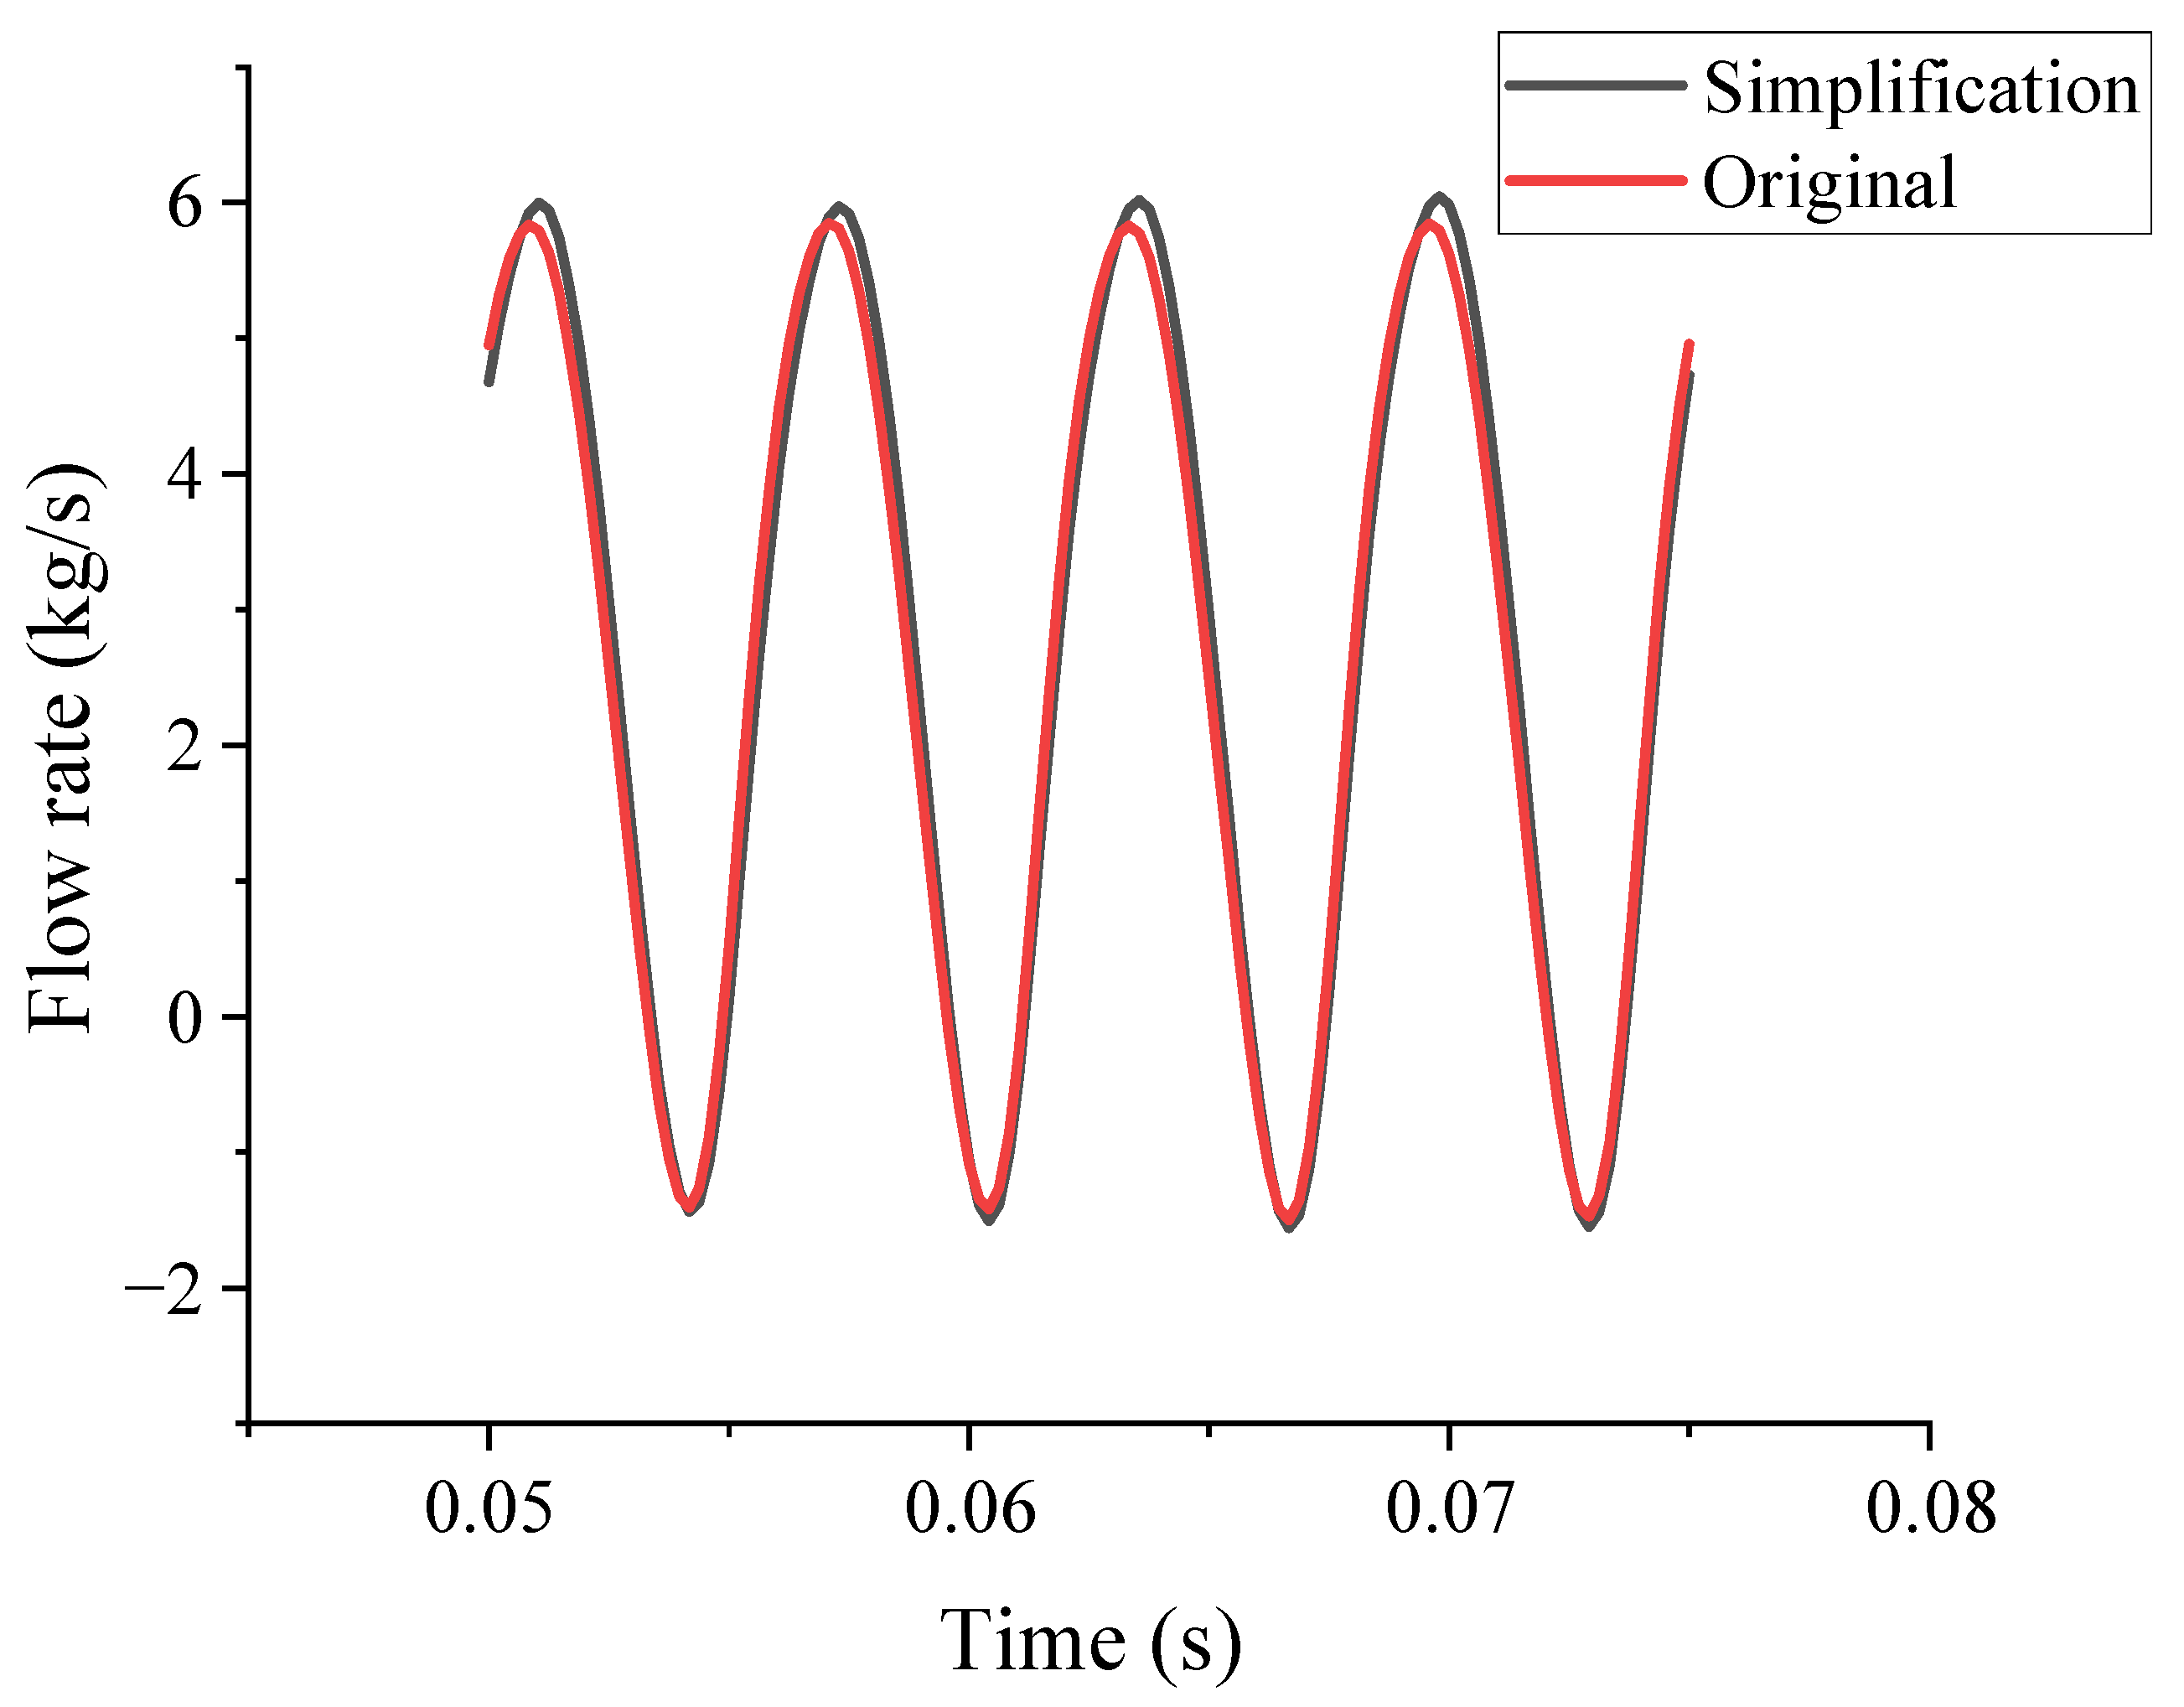
This work reduced the complexity of the original model to some extent to enable the simulation and analysis. It mainly simplified the structure of the inlet, outlet and the junction part of the inlet and outlet with the rotor and, finally, compared the calculation results before and after the simplification. Figure 7 shows a comparative analysis of the instantaneous exhaust flow between the simplified model and the original model at the outlet. It is noticeable from Figure 7 that the instantaneous flow at the outlet was basically equal, and the unevenness error approached 0. Therefore, the simplified model was used as the original model for the analysis. In order to ensure the stability of the analysis data, the data of the fourth week were chosen as the analysis data. The rotor rotation had four complete pulsation cycles, and the two-blade rotor sucked and exhausted four times per rotation. It was observed that the simulation results were comparable with the actual law. Meanwhile, when the gas was discharged outward, the instantaneous flow at the exhaust side became positive. In addition, when the gas was returned inward as a result of the pressure difference, the instantaneous flow at the exhaust side became negative. The negative value was related to the speed, pressure difference and other factors [31]. The average value was positive. Two measures, flow unevenness (δ) and pressure pulsation coefficient (σ), are defined to reflect the degree of the flow and pressure pulsation more directly. The specific formulas are as follows [32]:
δ = 2 Δ Q Q m
σ = P max + P min P o u t l e t
where Δ Q —flow pulsation amplitude; Q m —is the theoretical average flow.
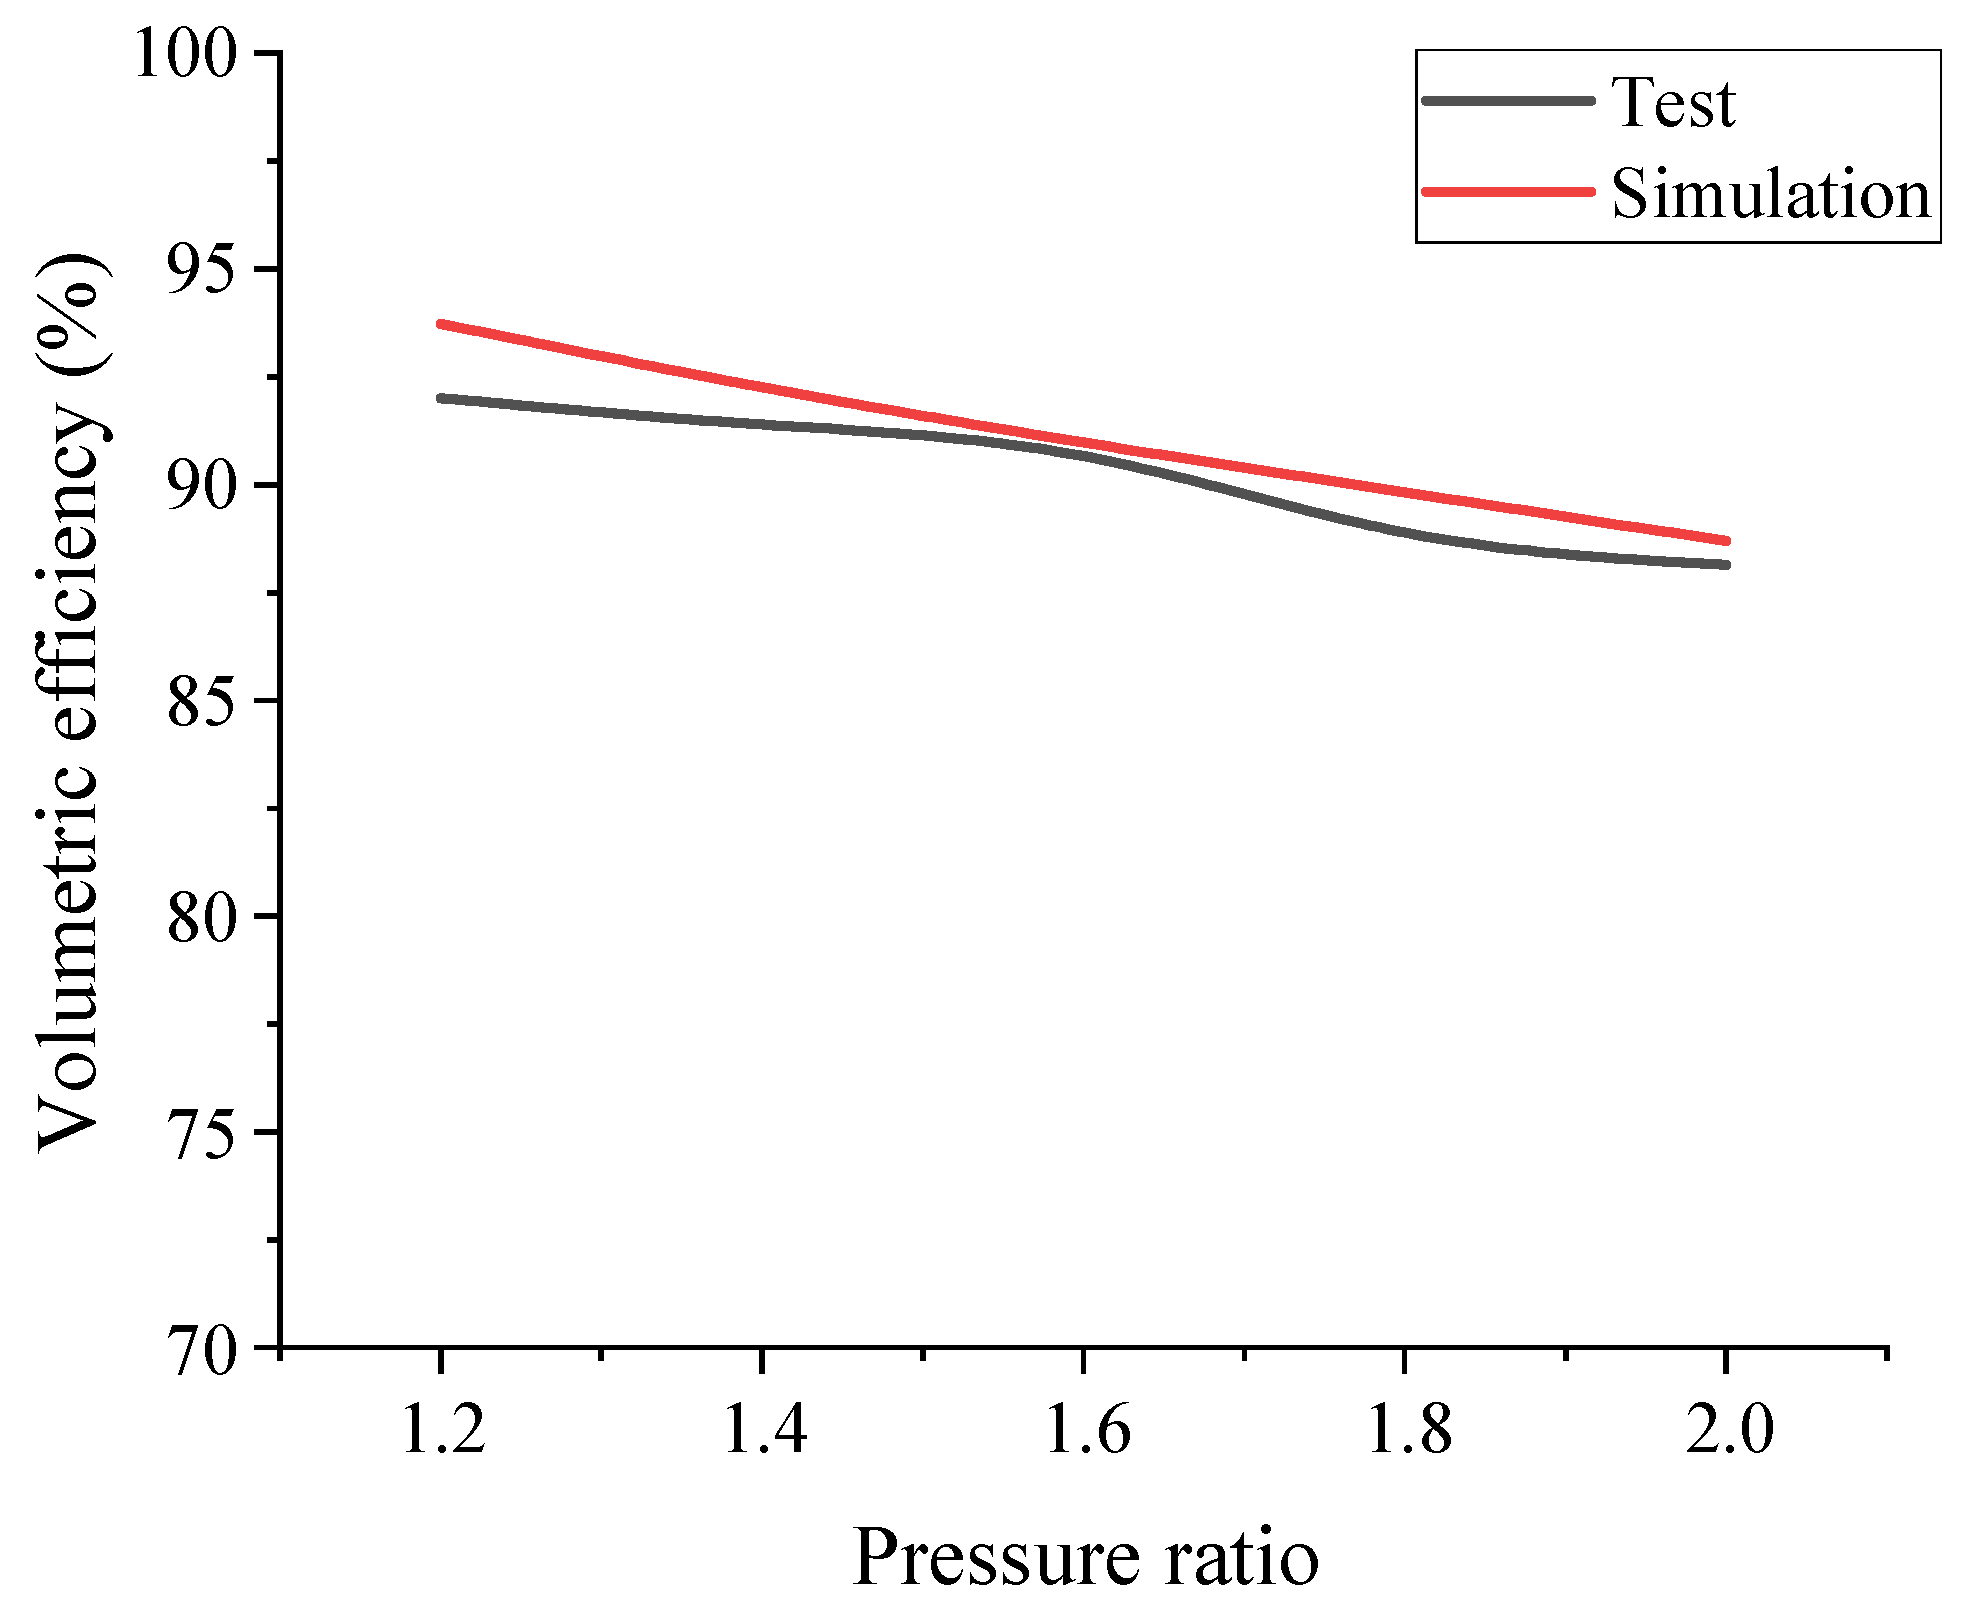
Figure 8 presents a comparison of the simulation and test results under different pressure ratios. The outlet pressure was controlled at 101,325 Pa. By varying the outlet pressure, the working conditions under which the pressure ratio was 1.2, 1.4, 1.6, 1.8 and 2.0 and the vacuum degree was 30% (pressure ratio: 1.4475) were simulated. Because the end surface leakage was not taken into consideration in the simulation, the volumetric efficiency was relatively large. The maximum deviation of the volumetric efficiency attained was 1.73%, while the minimum deviation was 0.32%. Therefore, this provides justification that the simulation results had reference significance. The theoretical flow calculation formula was as follows [32]:
Q t h = π 120 λ D 2 L n = 3.424   m 3 / s
where n—Speed, r/min; λ —Impeller area utilization coefficient; L—the length of the rotor, m; D—rotor outer diameter, m.

4. Analysis of the External Characteristics

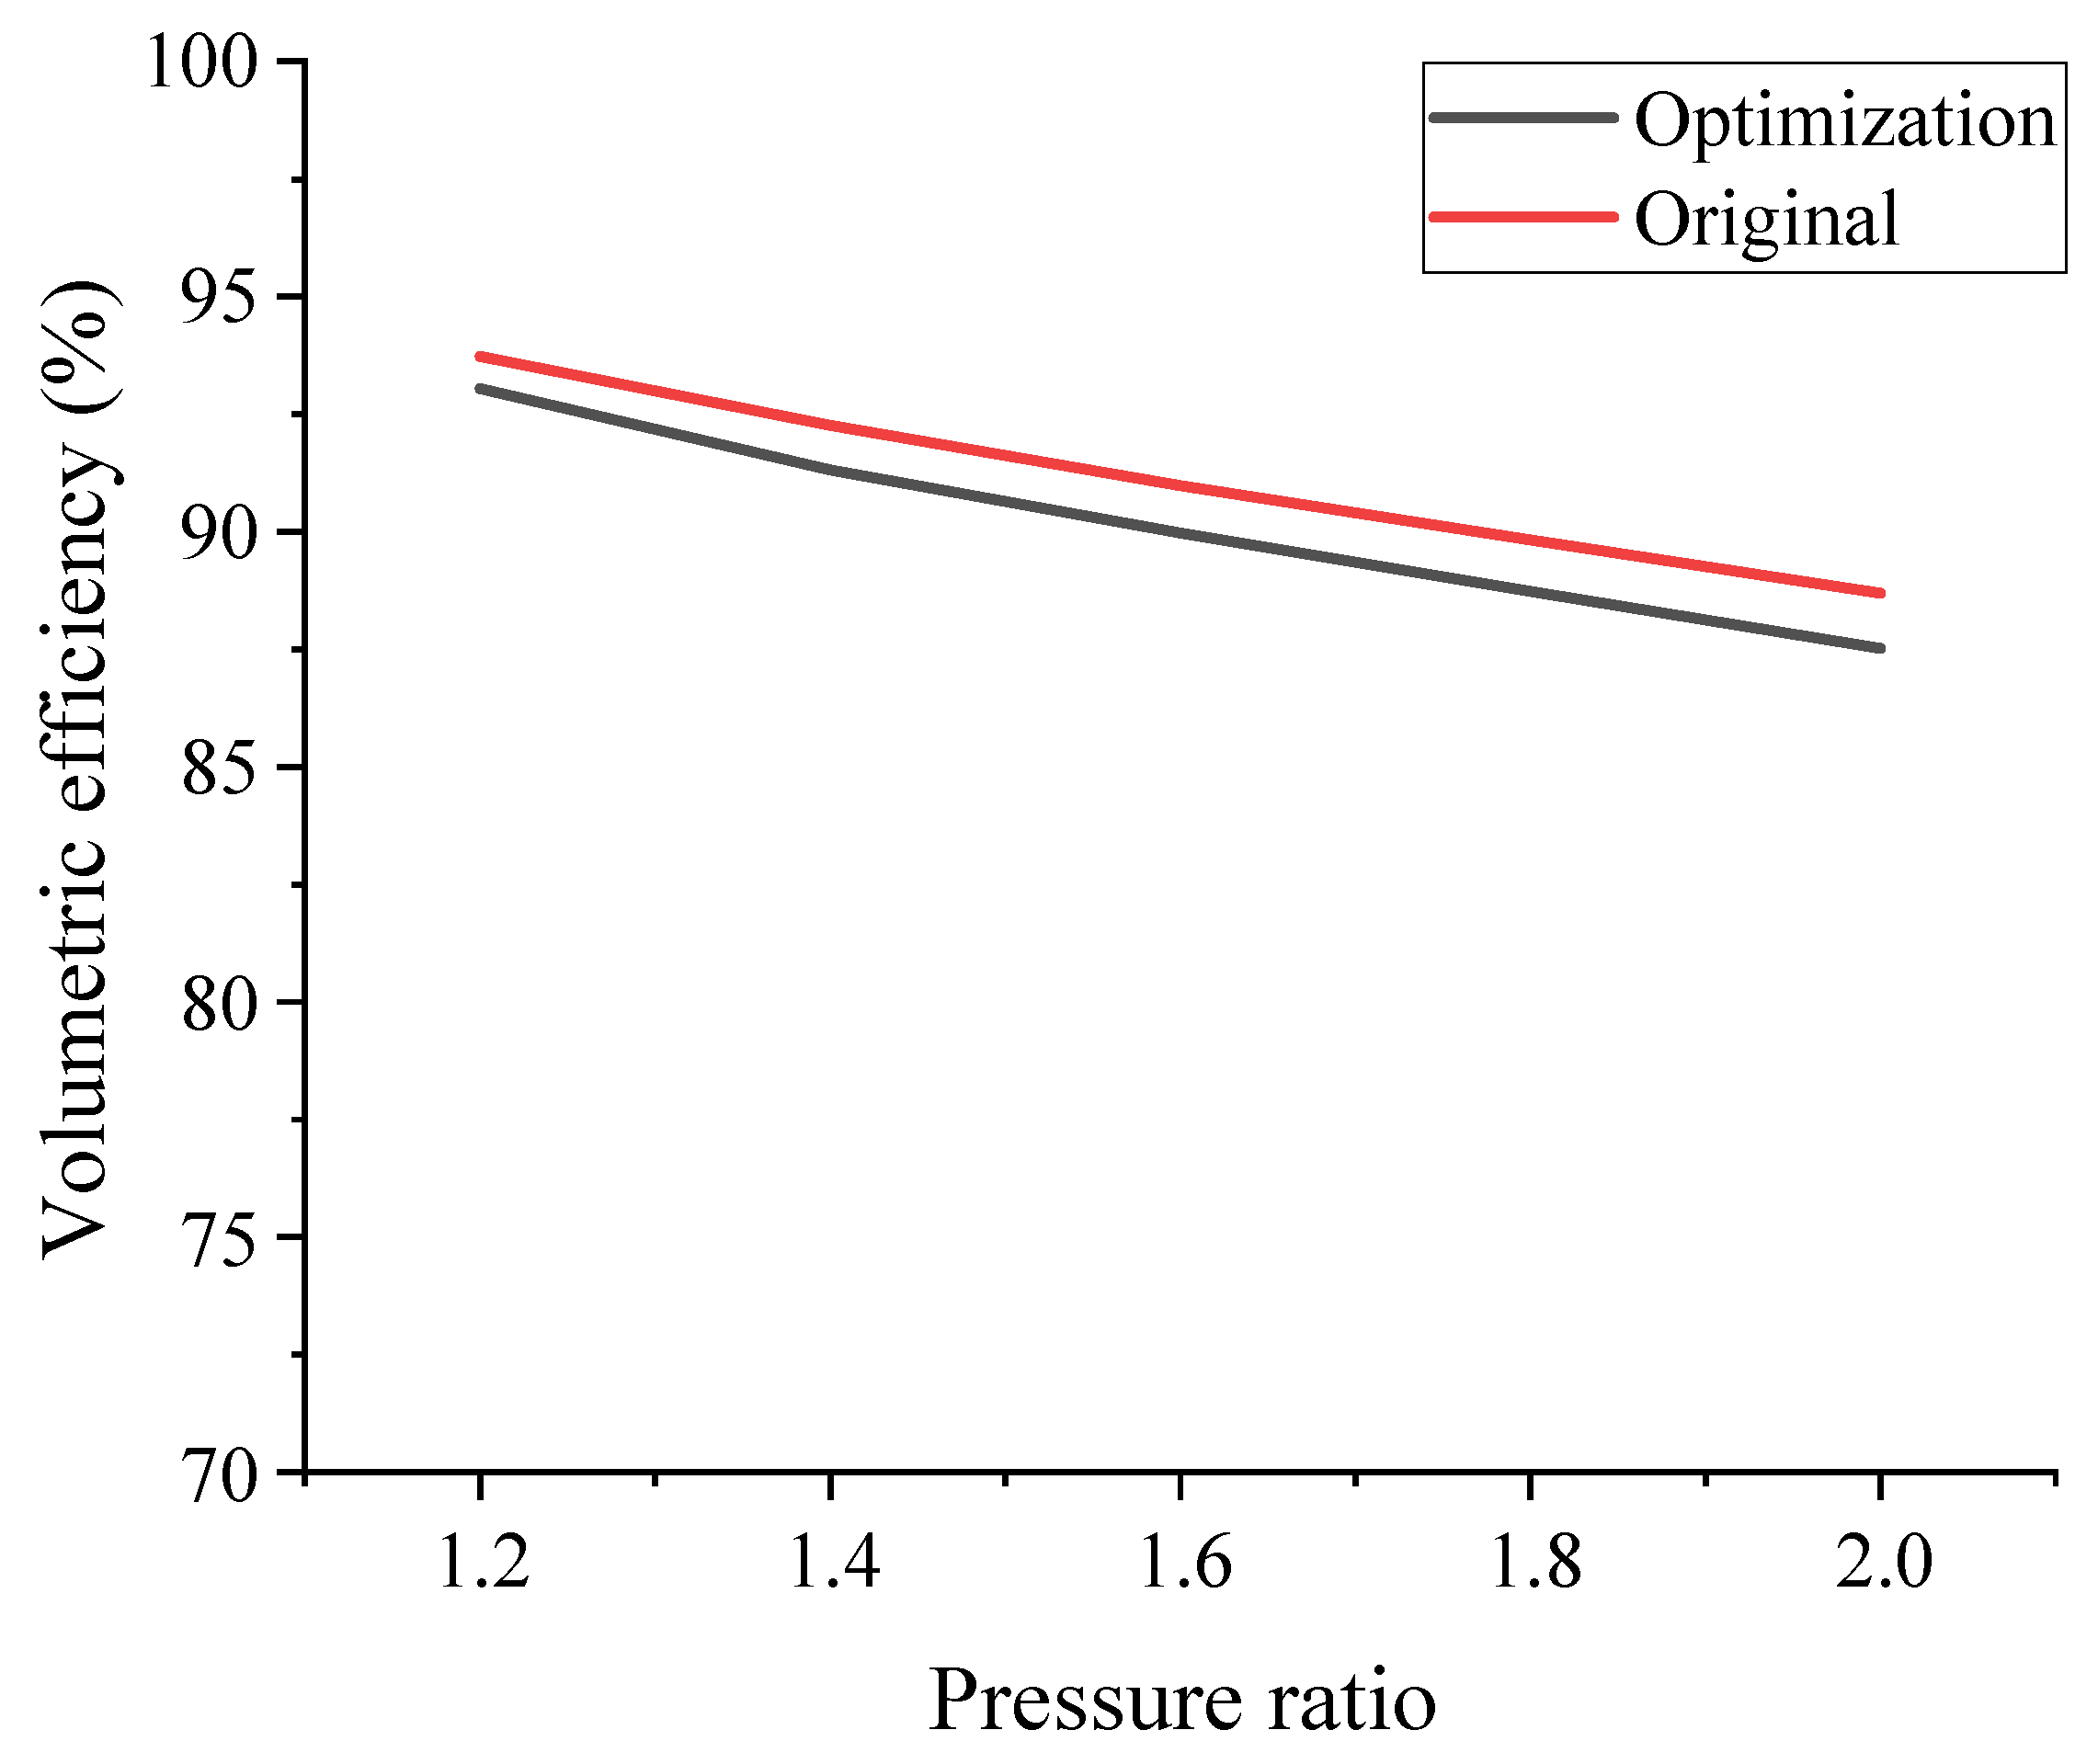
Hitherto studies on Roots pump usually operates under the condition of a 30% vacuum degree (pressure ratio: 1.4475). In light of this, the subsequent optimization analysis was carried out under this working condition. Table 3 shows the simplified import and export data of the original model under this working condition. The volume-efficiency of the optimized model 5 and the original model under different pressure ratios are analyzed. The findings are shown in Figure 9, with the maximum reduction of 1.17%. Therefore, the influence of the reflux groove flow could be ignored.

4.1. Influence of the Reflux Groove Structure on the Inlet Flow Measurement

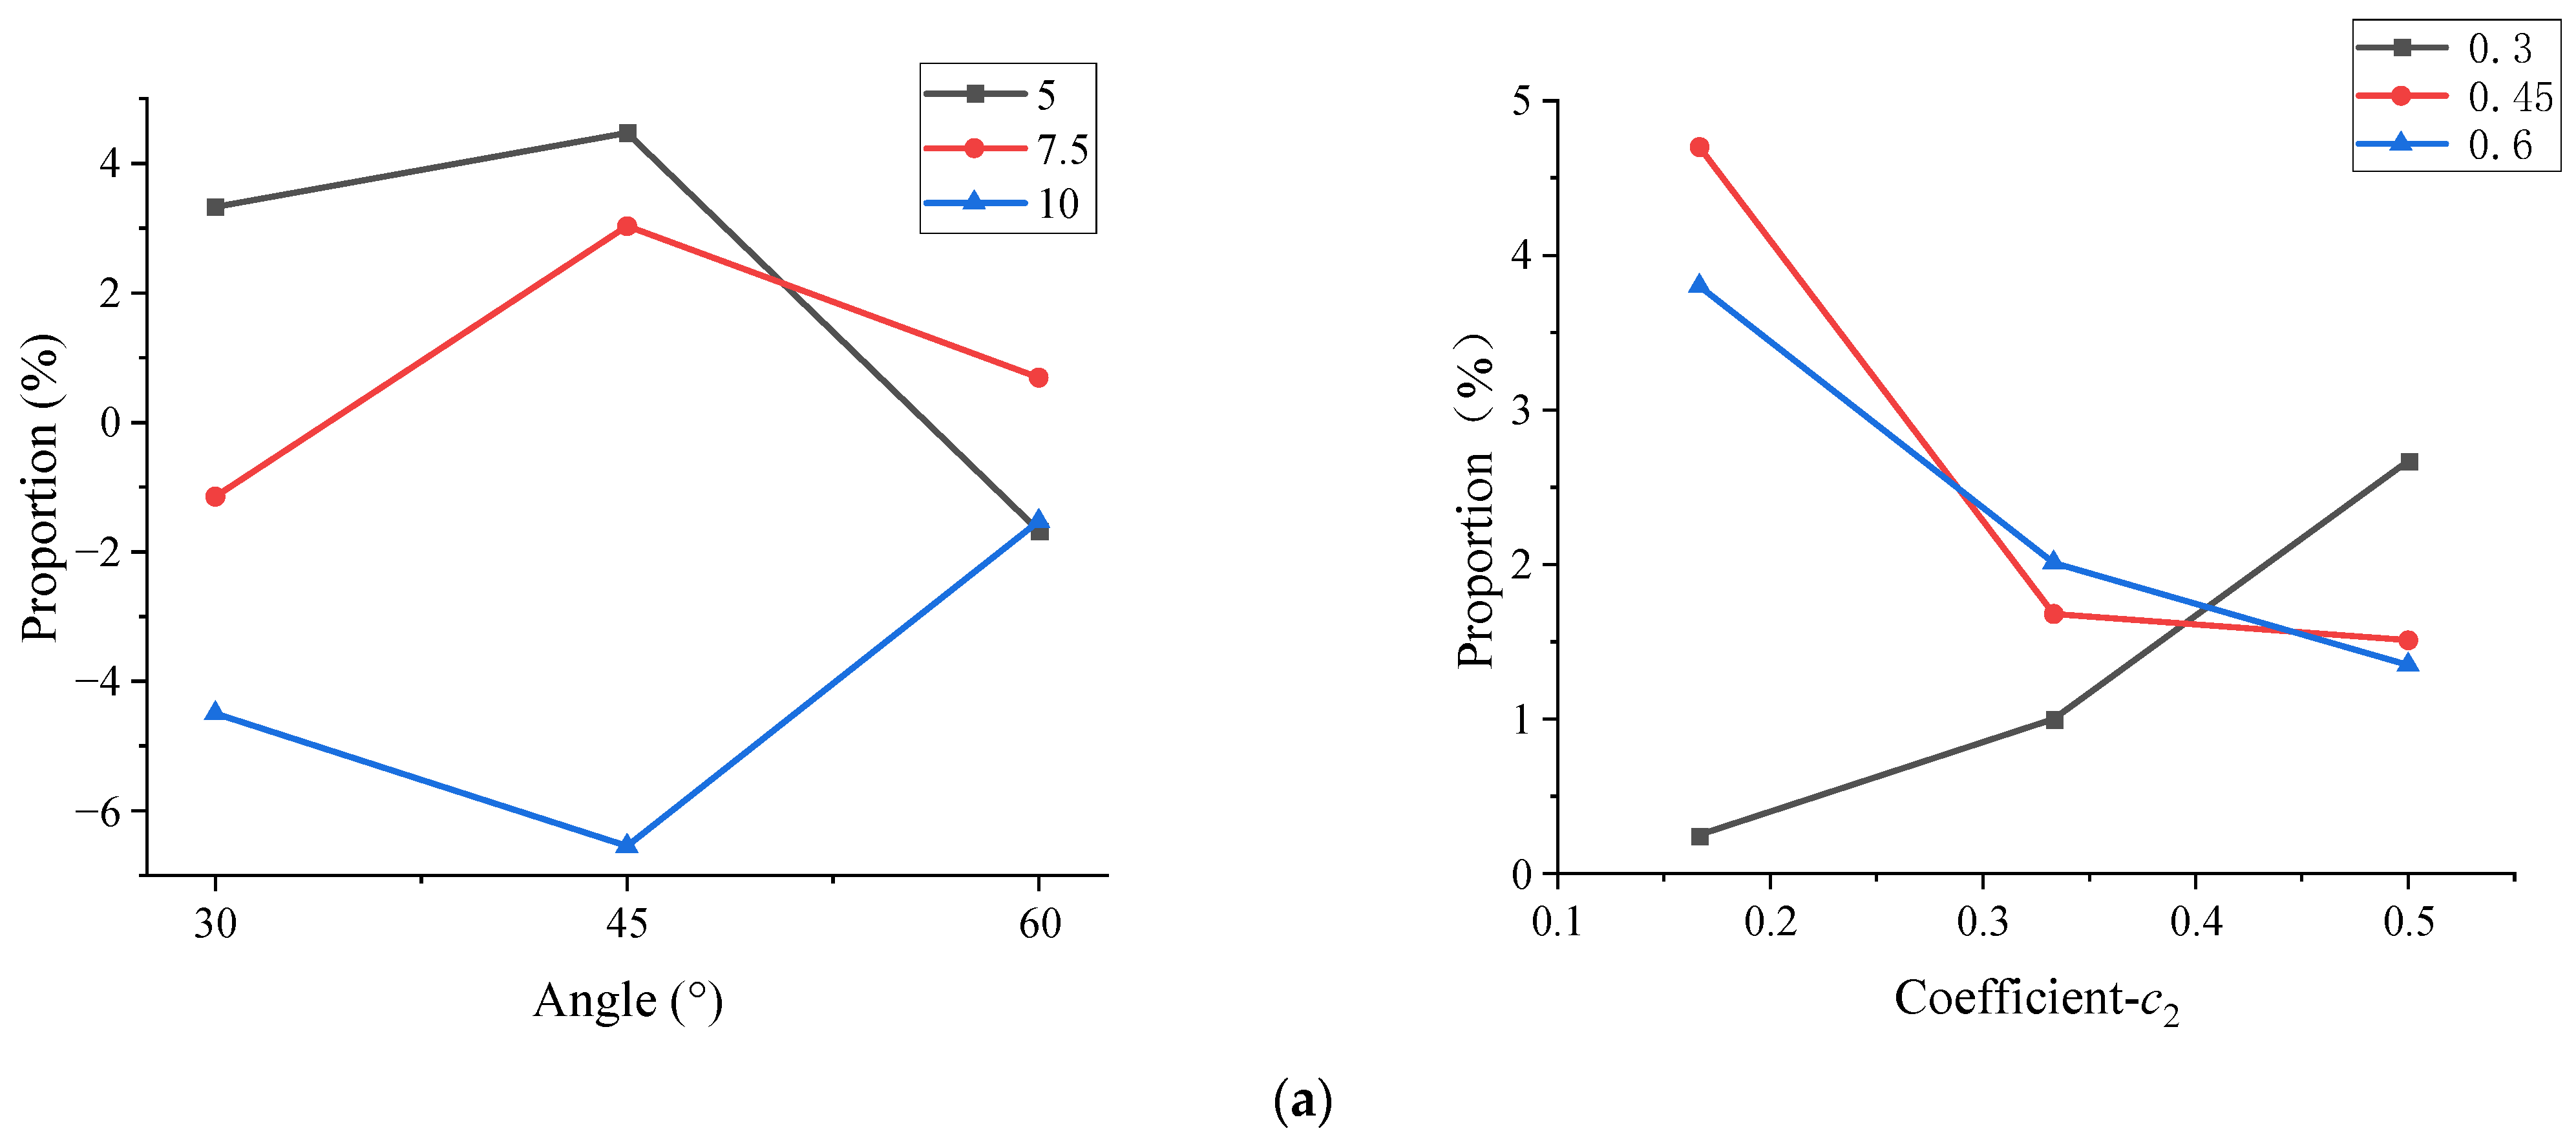
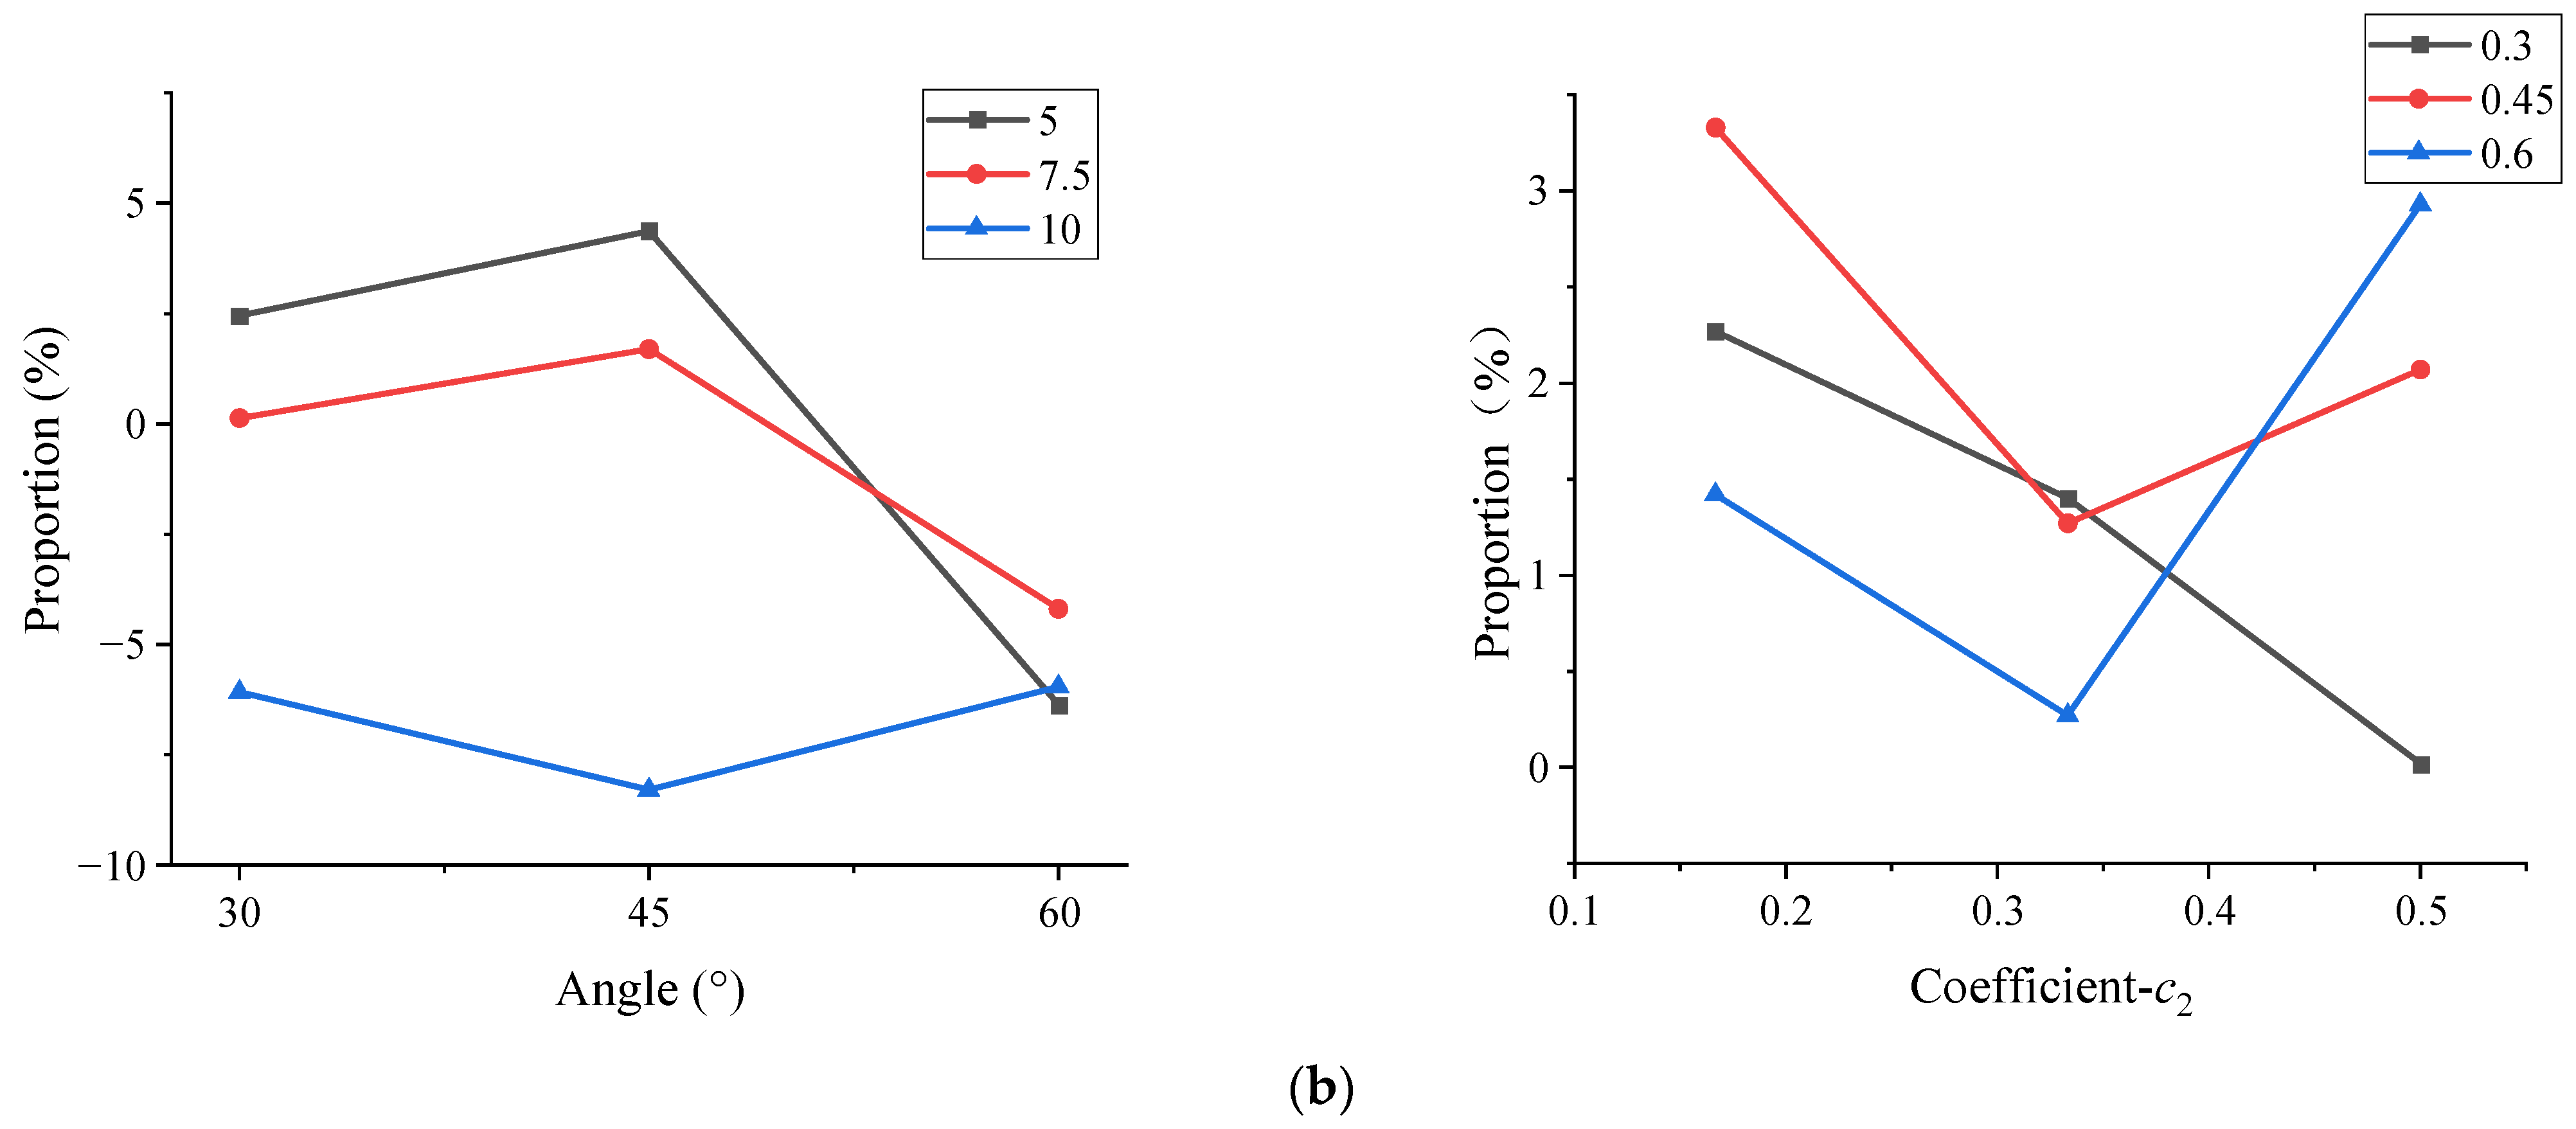
Figure 10 shows the change curves of the inlet flow inhomogeneity and inlet pressure pulsation coefficient before and after optimization. Glaringly, the flow inhomogeneity and pressure pulsation coefficient rose to a certain extent due to the reflux groove structure, as revealed in Figure 10. The maximum increase of the flow pulsation at the inlet and pressure pulsation at the inlet of the rectangular reflux groove were 4.47% and 4.37%, respectively. The maximum increase proportions of the flow pulsation and pressure pulsation at the inlet of the arc-type reflux groove were 4.70% and 3.33%, respectively. It is worth observing that the proportions increase were all within 5%, justifying that the influence was not obvious. Therefore, the effect of the inner reflux groove structure on the exhaust side was considered.

4.2. Influence of the Reflux Groove Structure on the Exhaust Flow Measurement

Table 4 displays the data of the different models, including the maximum outlet flow Q o u t l e t m a x , the minimum outlet flow Q o u t l e t m i n and the unevenness of the outlet flow δ outlet . Figure 11 depicts the exhaust flow pulsation in one cycle. In order to show the change in the exhaust volume before and after the optimization more clearly, only the instantaneous exhaust volume of the original model and the three optimization models were compared and displayed. It is apparent from Table 4 and Figure 11 that the internal reflux groove structure could effectively reduce the exhaust flow pulsation and make the pump operate more efficiently.
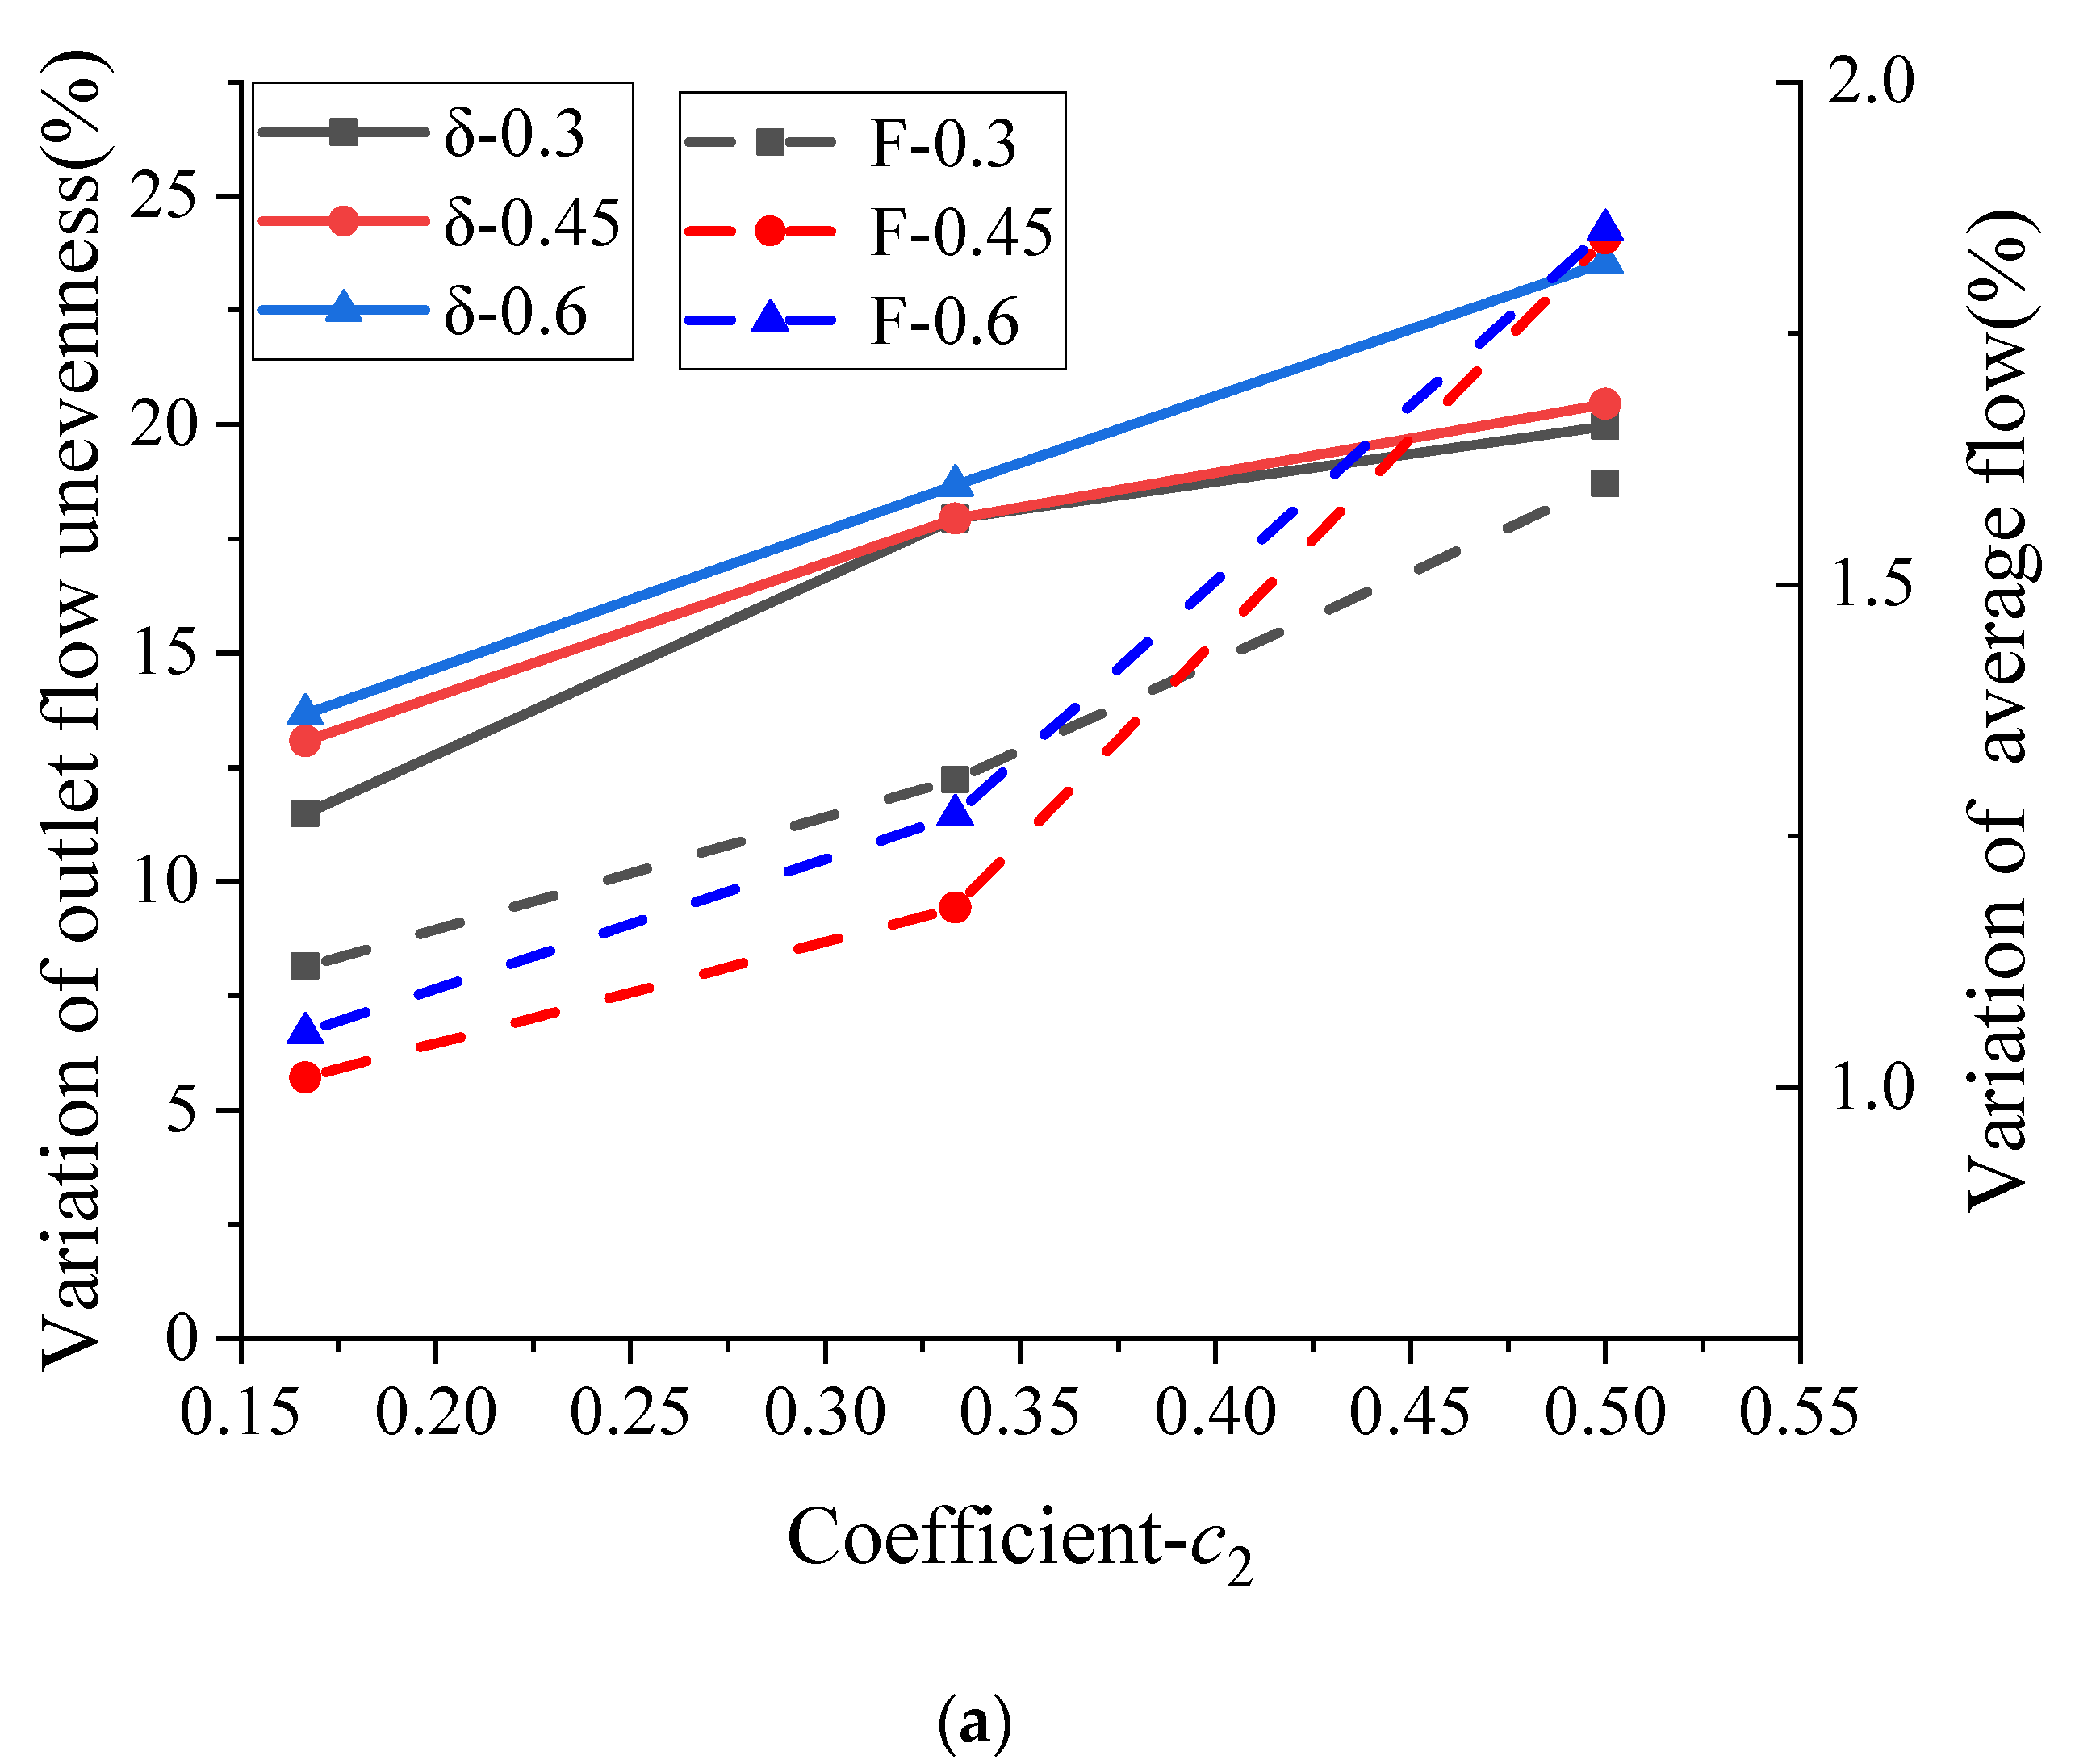
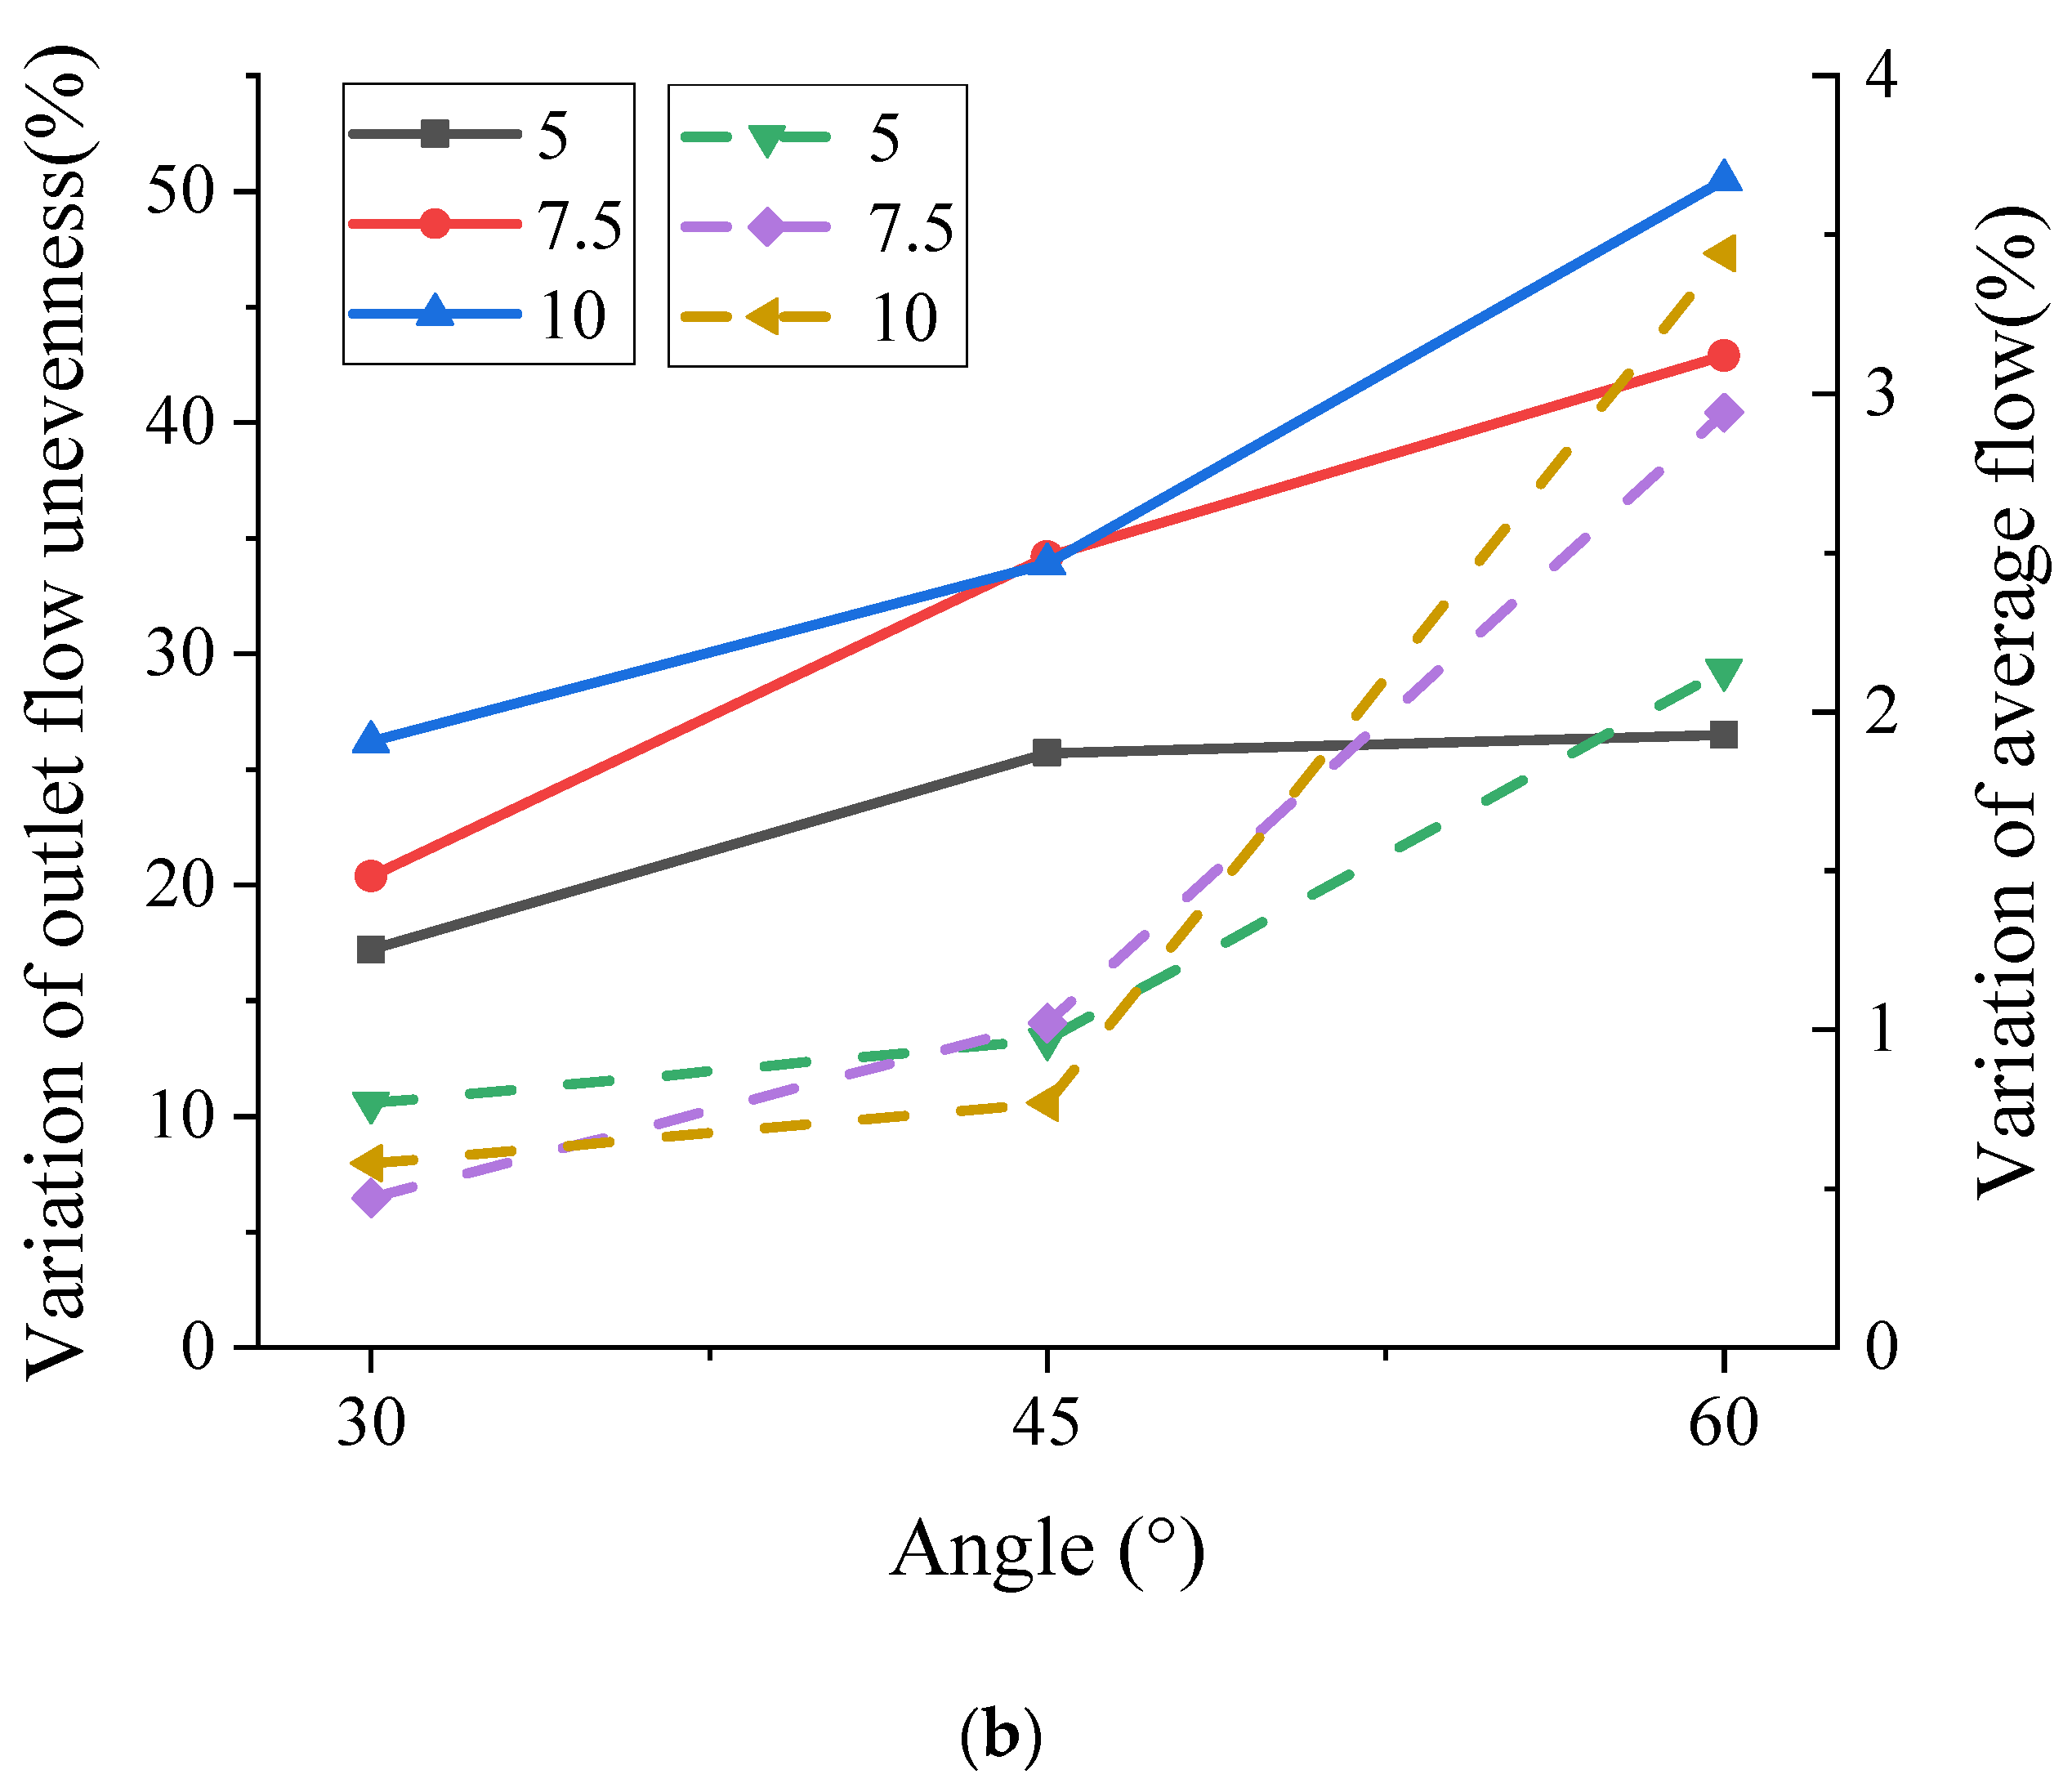
Figure 12a presents the flow inhomogeneity and average flow variation at the outlet of the nine groups of the arc-shaped reflux groove optimization model. Also, Figure 12b shows the flow inhomogeneity and average flow variation at the outlet of the nine groups of the rectangular reflux groove optimization model. The solid line denotes the decreasing proportion of the unevenness of the outlet flow, while the dashed line represents the decreasing proportion of the average outlet flow.
It can be noticed from Figure 12a that with regards to the reflux groove’s curve constructed by the Bezier curve, when the starting point, middle point and end point were determined with the increase in coefficient c 1 and coefficient c 2 , the decrease in the proportion of the flow inhomogeneity was higher. However, with the increase in c 2 , when c 1 was less than 0.45, the change in c 1 had little influence on the inhomogeneity, and the increase in the optimization effect was weak with the increase in c 2 . In addition, when c 1 was higher than 0.45 and c 2 was higher than one-third, the change in coefficient c 2 had a dominant influence on the pressure pulsation of the Roots pump.
It can be seen from Figure 12b that for the rectangular reflux groove, the decreased ratio of the outlet flow’s unevenness gradually increased with the increase in the reflux groove’s thickness and angle. It is noted, however, from Figure 12b that for the rectangular reflux groove, the decreased ratio of the outlet flow’s unevenness gradually increased with the increase in the reflux groove’s thickness and angle. Nevertheless, with the increase in the clearance, the leakage also increased, and the average of the outlet flow gradually decreased. Especially, when the angle increased from 45° to 60°, the flow rate decreased significantly. Taking a thickness of 10 mm as an example, compared with 45°, the flow rate of 60° decreased by 17.7% and 346.7%.
Because the thickness of the curved reflux groove was 5 mm, compared with the optimization results of the 5 mm curved reflux groove, the unevenness of the flow at the outlet of the rectangular reflux groove was reduced by approximately 25% at 5 mm. This was slightly higher than that of the curved reflux groove, but the flow loss was higher than that of the curved reflux groove.

5. Analysis of the Internal Characteristics

5.1. Vortex Distribution in the Roots Pump

The vortex is a typical flow state that occurs during the operation of rotating machinery. The evolution and development of the vortex will degrade the mechanical energy utilization and increase the machinery’s energy consumption. In a Roots pump, the vortex caused by the reflux at the outlet will also generate vortex noise. In this paper, the Q criterion and omega criterion were used to extensively analyze the flow field data of the Roots pump. The Q criterion is premised on the decomposition of the velocity gradient tensor, including the symmetric tensor A of the velocity gradient and the antisymmetric tensor B of the velocity gradient. Meanwhile, the calculation equation is as follows [33]:
A = 1 2 ( V + V T ) = [ u x 1 2 ( u y + v x ) 1 2 ( u z + w x ) 1 2 ( v x + u y ) v y 1 2 ( v z + w y ) 1 2 ( w x + u z ) 1 2 ( w y + v z ) w z ]
B = 1 2 ( V V T ) = [ 0 1 2 ( u y v x ) 1 2 ( u z w x ) 1 2 ( v x u y ) 0 1 2 ( v z w y ) 1 2 ( w x u z ) 1 2 ( w y v z ) 0 ]
Q = 1 2 ( B F 2 A F 2 )
where B F 2 and A F 2 denote the squared norms of the matrices B and A, respectively. The positive value of Q represents the region dominated by the vorticity in the flow field, while the negative value represents the region dominated by strain rate or viscous stress. The larger the value of Q, the higher the fluid rotation rate, and the more likely the vortex exists.
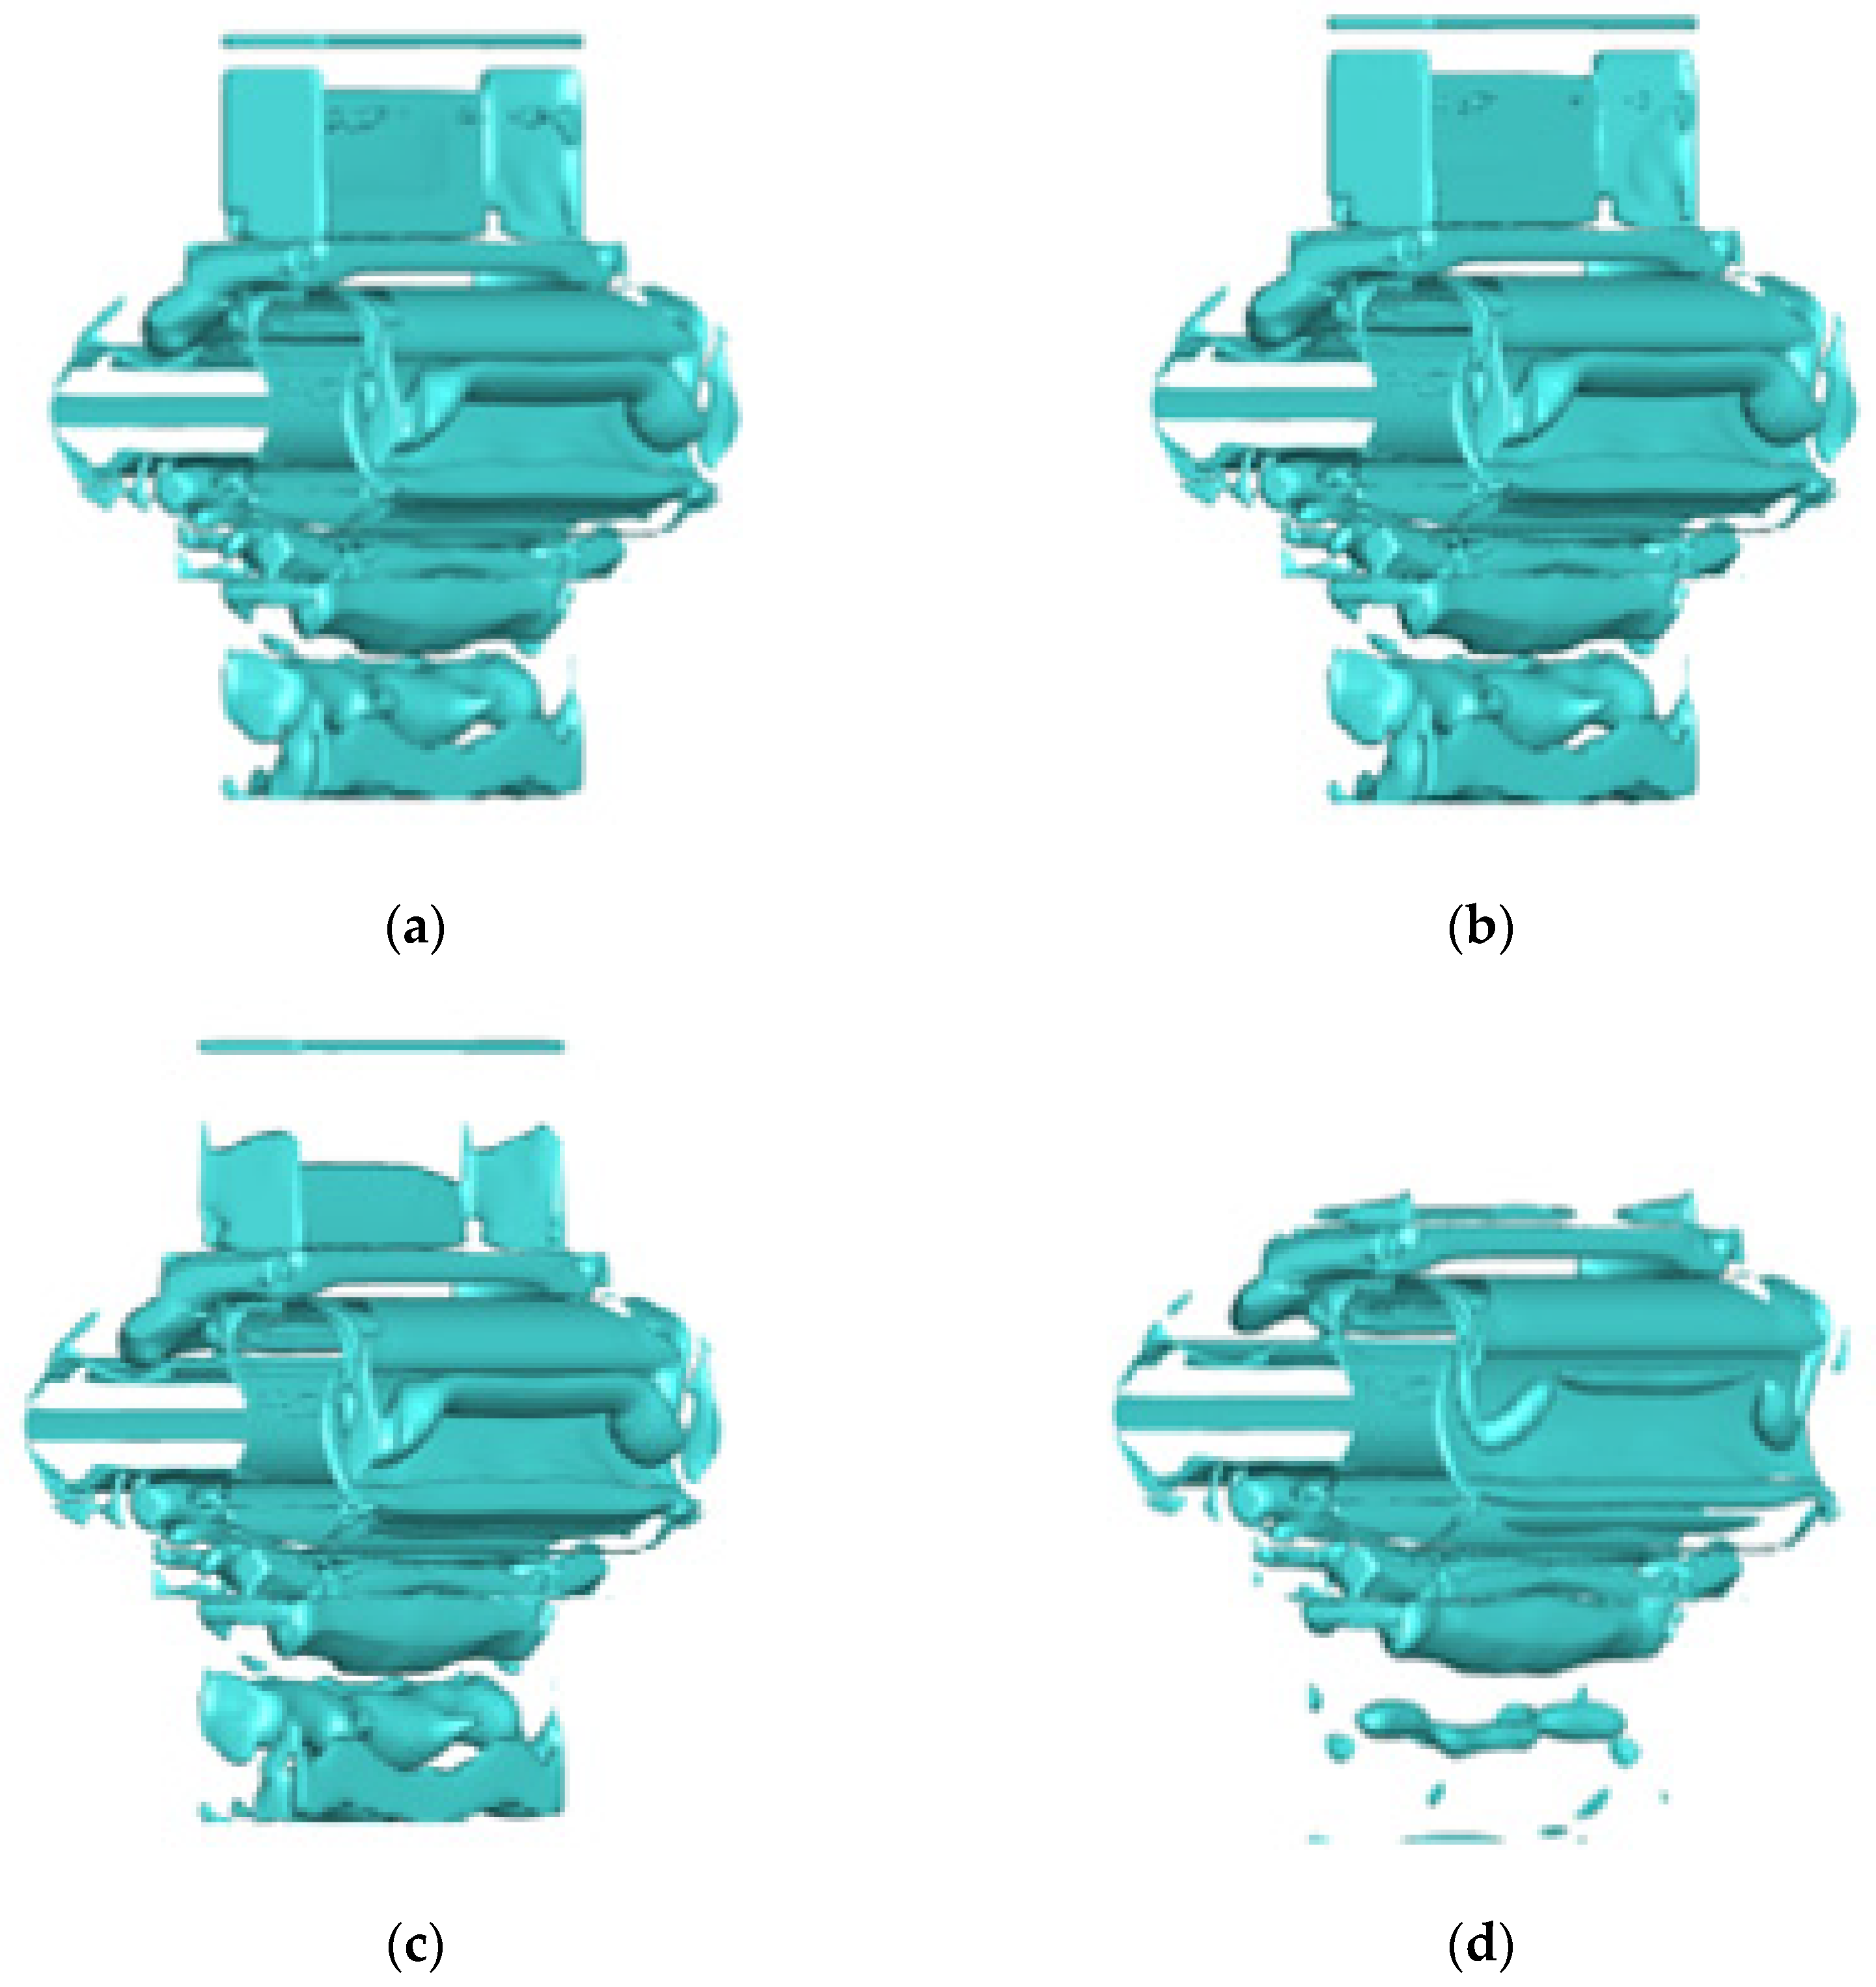
The choice of threshold affects whether the entire vortex structure can be captured when the Q criterion is employed to identify vortices. A weak vortex structure can be seen when the threshold decreases [34]. Figure 13 shows the variation of the identified vortex area with the threshold. It can be seen from Figure 13 that when the threshold was 0.0001, the vortex structure was the most complete, and when the threshold was approximately 300 and 5000, the captured vortex would be greatly reduced. Figure 14 shows the vortex structure of the Roots pump at 0° under different thresholds. It can be seen from Figure 14 that the larger the corresponding threshold, the less the vortex structure can be captured. To obtain a clearer perspective of vortex structure in the qualitative analysis, a higher threshold is used. For analysis and comparison in this research, 2000 was used as the threshold.
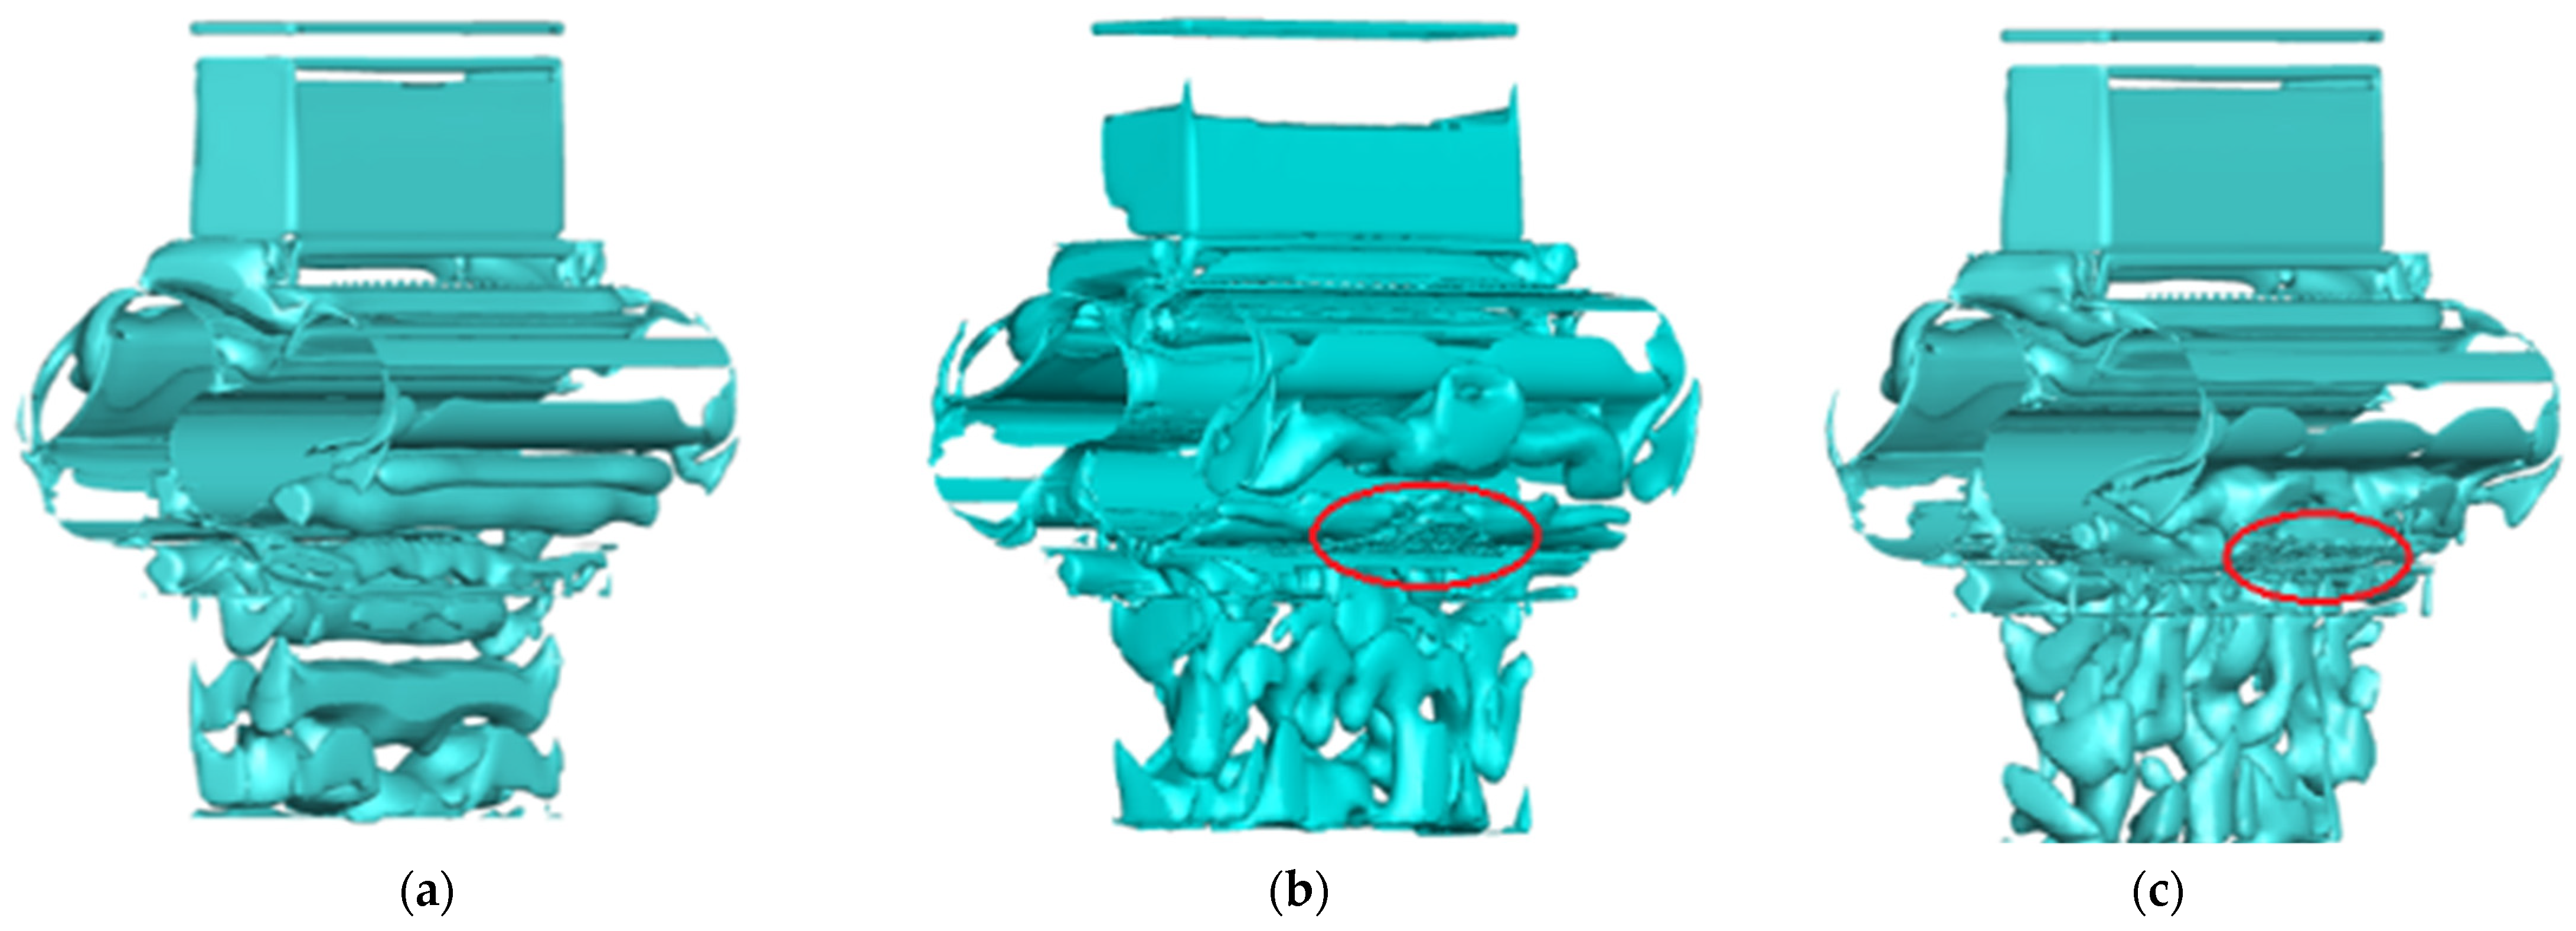
Figure 15 presents the vortex structure inside the Roots pump at an angle and threshold of 60° and 2000, respectively. It is glaring from Figure 15 that after the optimization of the model, the number of large vortices at the outlet side shrunk, but the number of small vortices at the inner reflux groove increased. Overall, the vortex situation significantly improved.
The choice of threshold selection largely influenced the Q criterion vortex structure. Hence, a poor threshold selection will largely affect the vortex analysis of the flow field.
For example, when Q = 10,000, most of the vortices at the outlet to be analyzed cannot be obtained. Therefore, to curb this problem, Liu [35] et al. proposed an omega vortex identification method, with the calculation formula as follows [35]:
Ω = B F 2 B F 2 + A F 2 + ε
In the equation, ε is a small positive number to prevent a large calculation error when the denominator is extremely small. For different models, the value of ε is not the same. Dong et al. [36] proposed ε = 0.002 Q m a x as an approximation, and Zhang [34] took ε = 10 7 in the analysis of the side channel pump. In this paper, different values of ε were used for comparison, when ε = 0.002 Q m a x , the maximum value of Ω could only approach 0.8, and the obtained vortex loss was serious, the reference value was not suitable for the analysis of the Roots pump vortex structure; in the final attempt to select a ε value of 0.001, the obtained vortex structure was complete and clear.
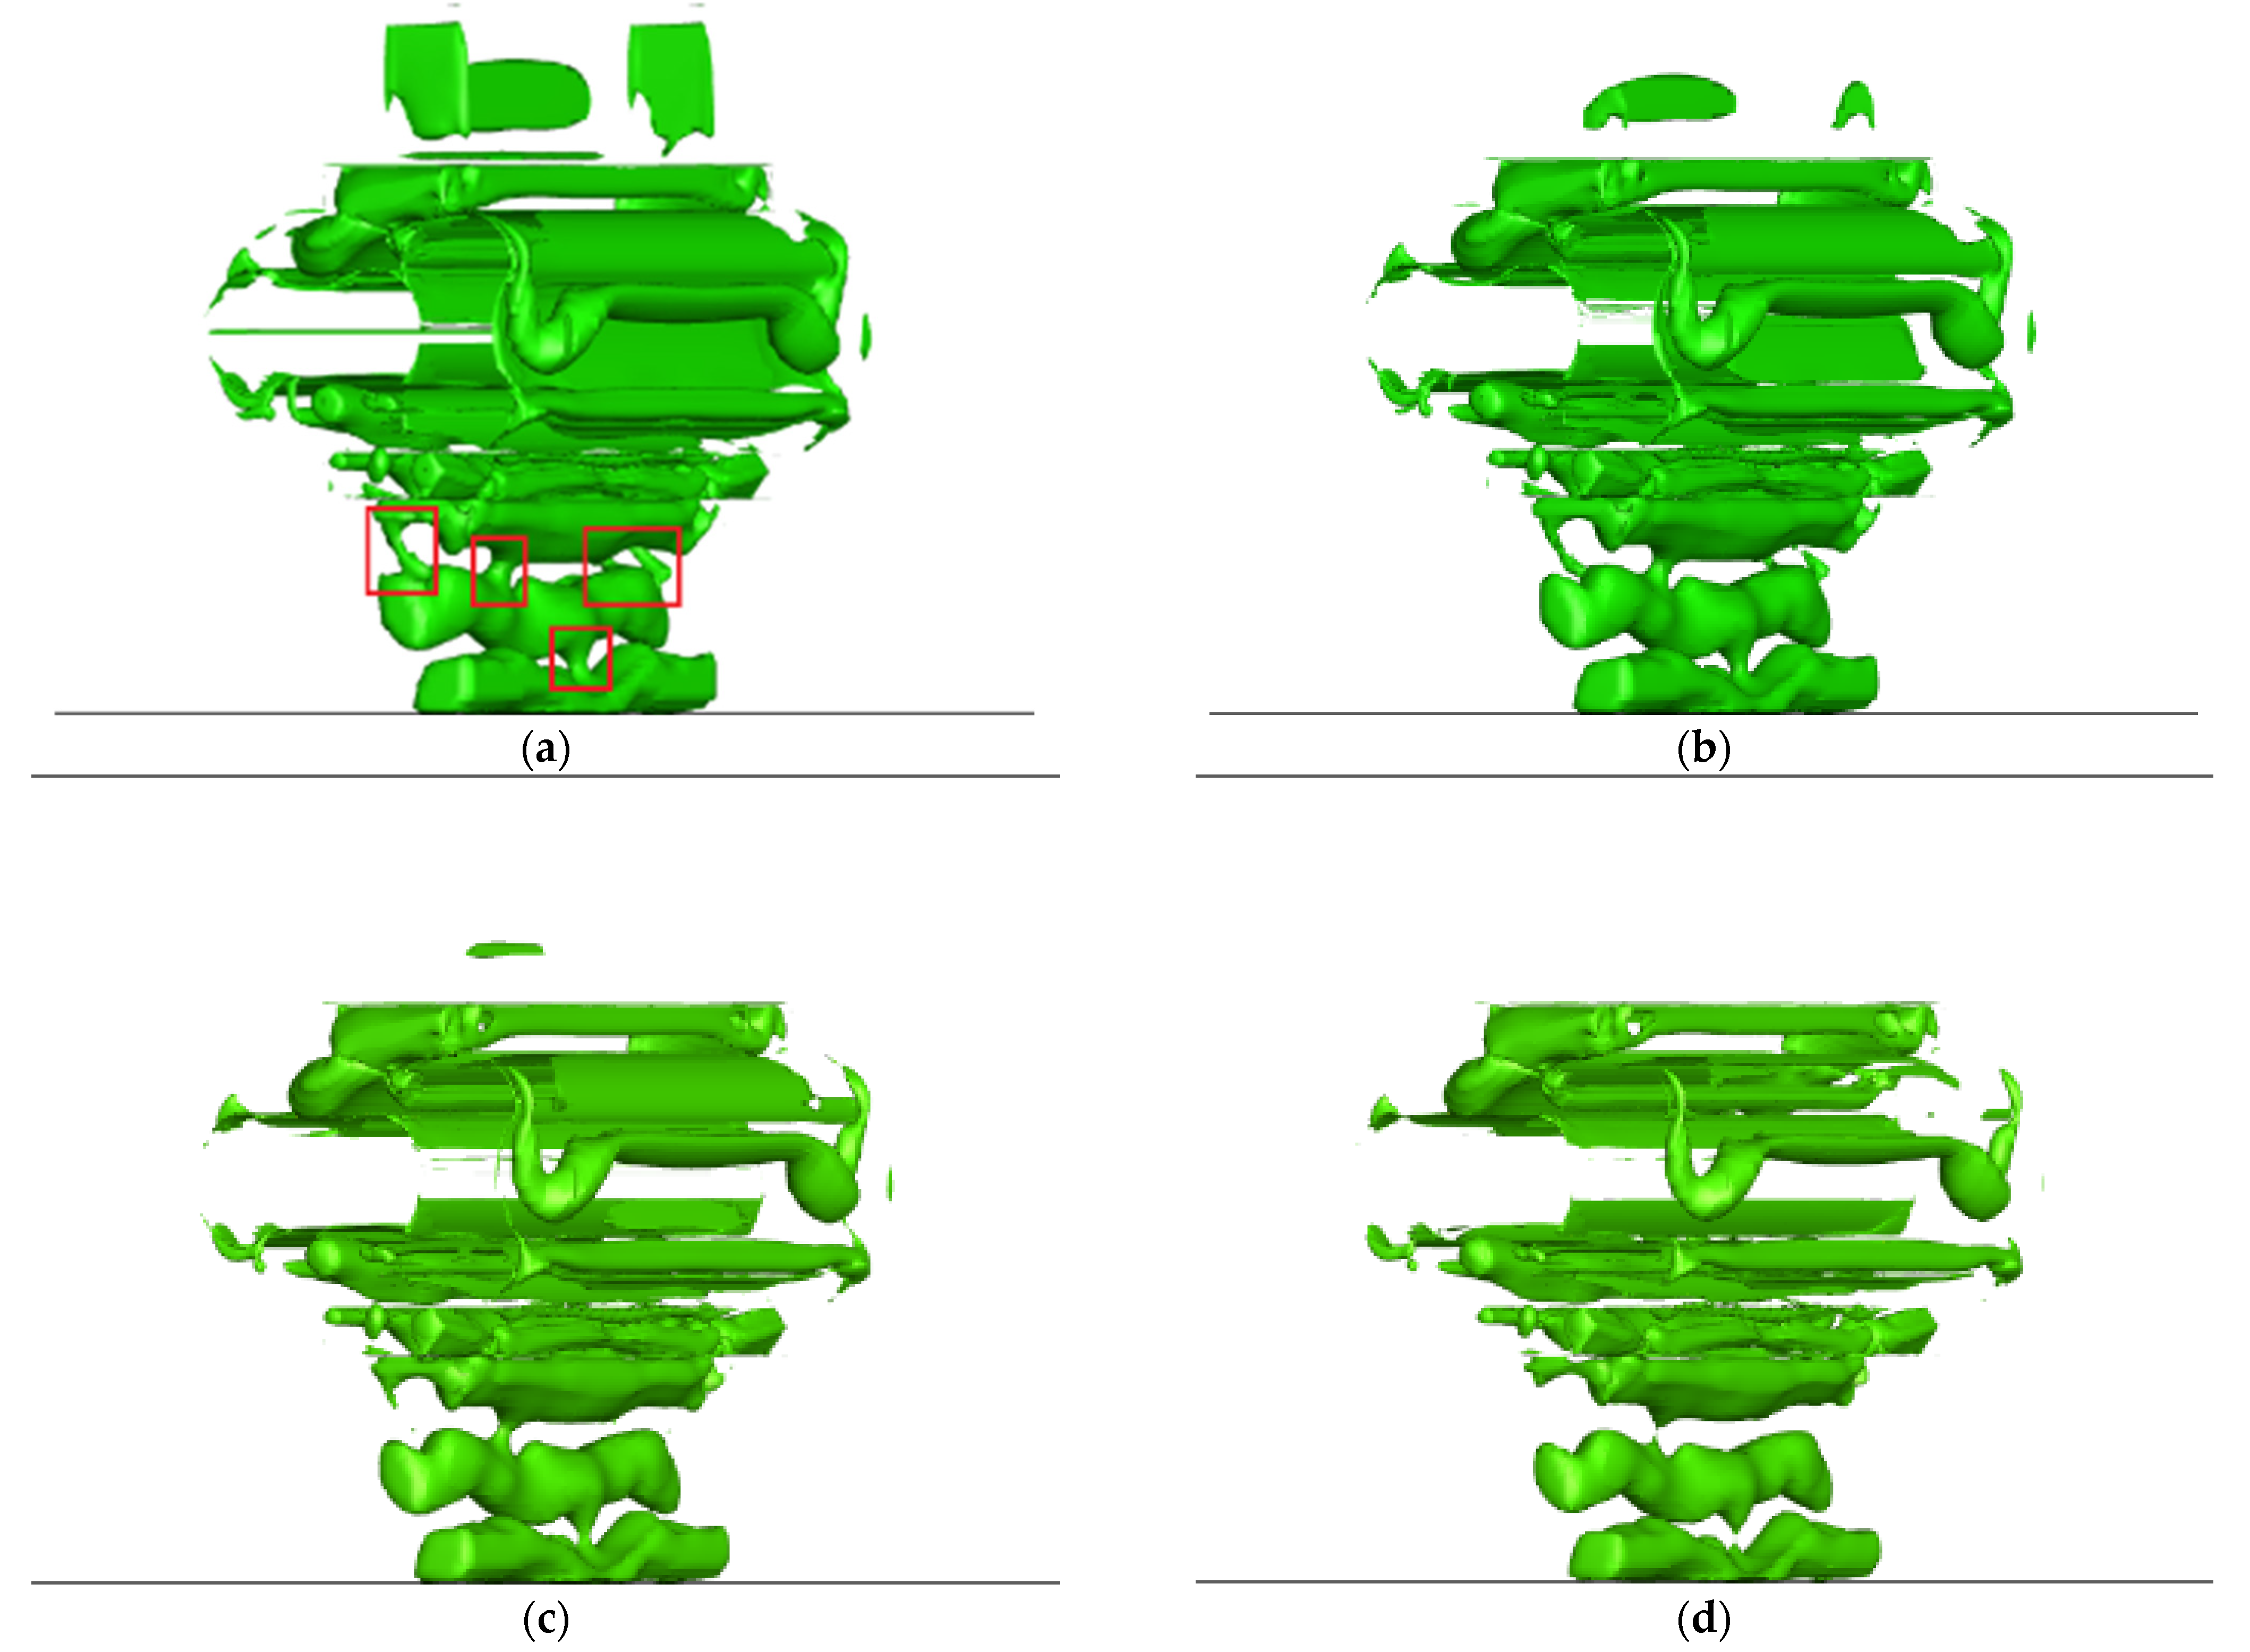
The omega criteria was less susceptible to the choice of a threshold value than the Q criterion, and generally 0.52 to 0.65 is selected [35]. Figure 16 depicts the vortex identification results when the Roots pump angle was 0° and Ω was 0.51, 0.53, 0.56 and 0.60. Noticeably, the vortex structure of the rotor edge and the exhaust port, which primarily produces vortex, was mostly unchanged, producing a clearer and more visible vortex structure.
In contrast to the three-dimensional vortex structure, the two-dimensional planar vortex cloud map could easily demonstrate the benefits of the omega criterion in generating both strong and weak vortex. Figure 17 shows a comparison of the vortex distribution cloud images at the middle section of the Q criterion and omega criterion when the Roots pump angle was 0°. The vortex cloud map obtained from the upper limit of the Q criterion ranged from 5000 to 100,000. Meanwhile, the vortex stratification with different intensities was not obvious. Therefore, the omega criterion was adopted to analyze the operation of the Roots pump at different angles.
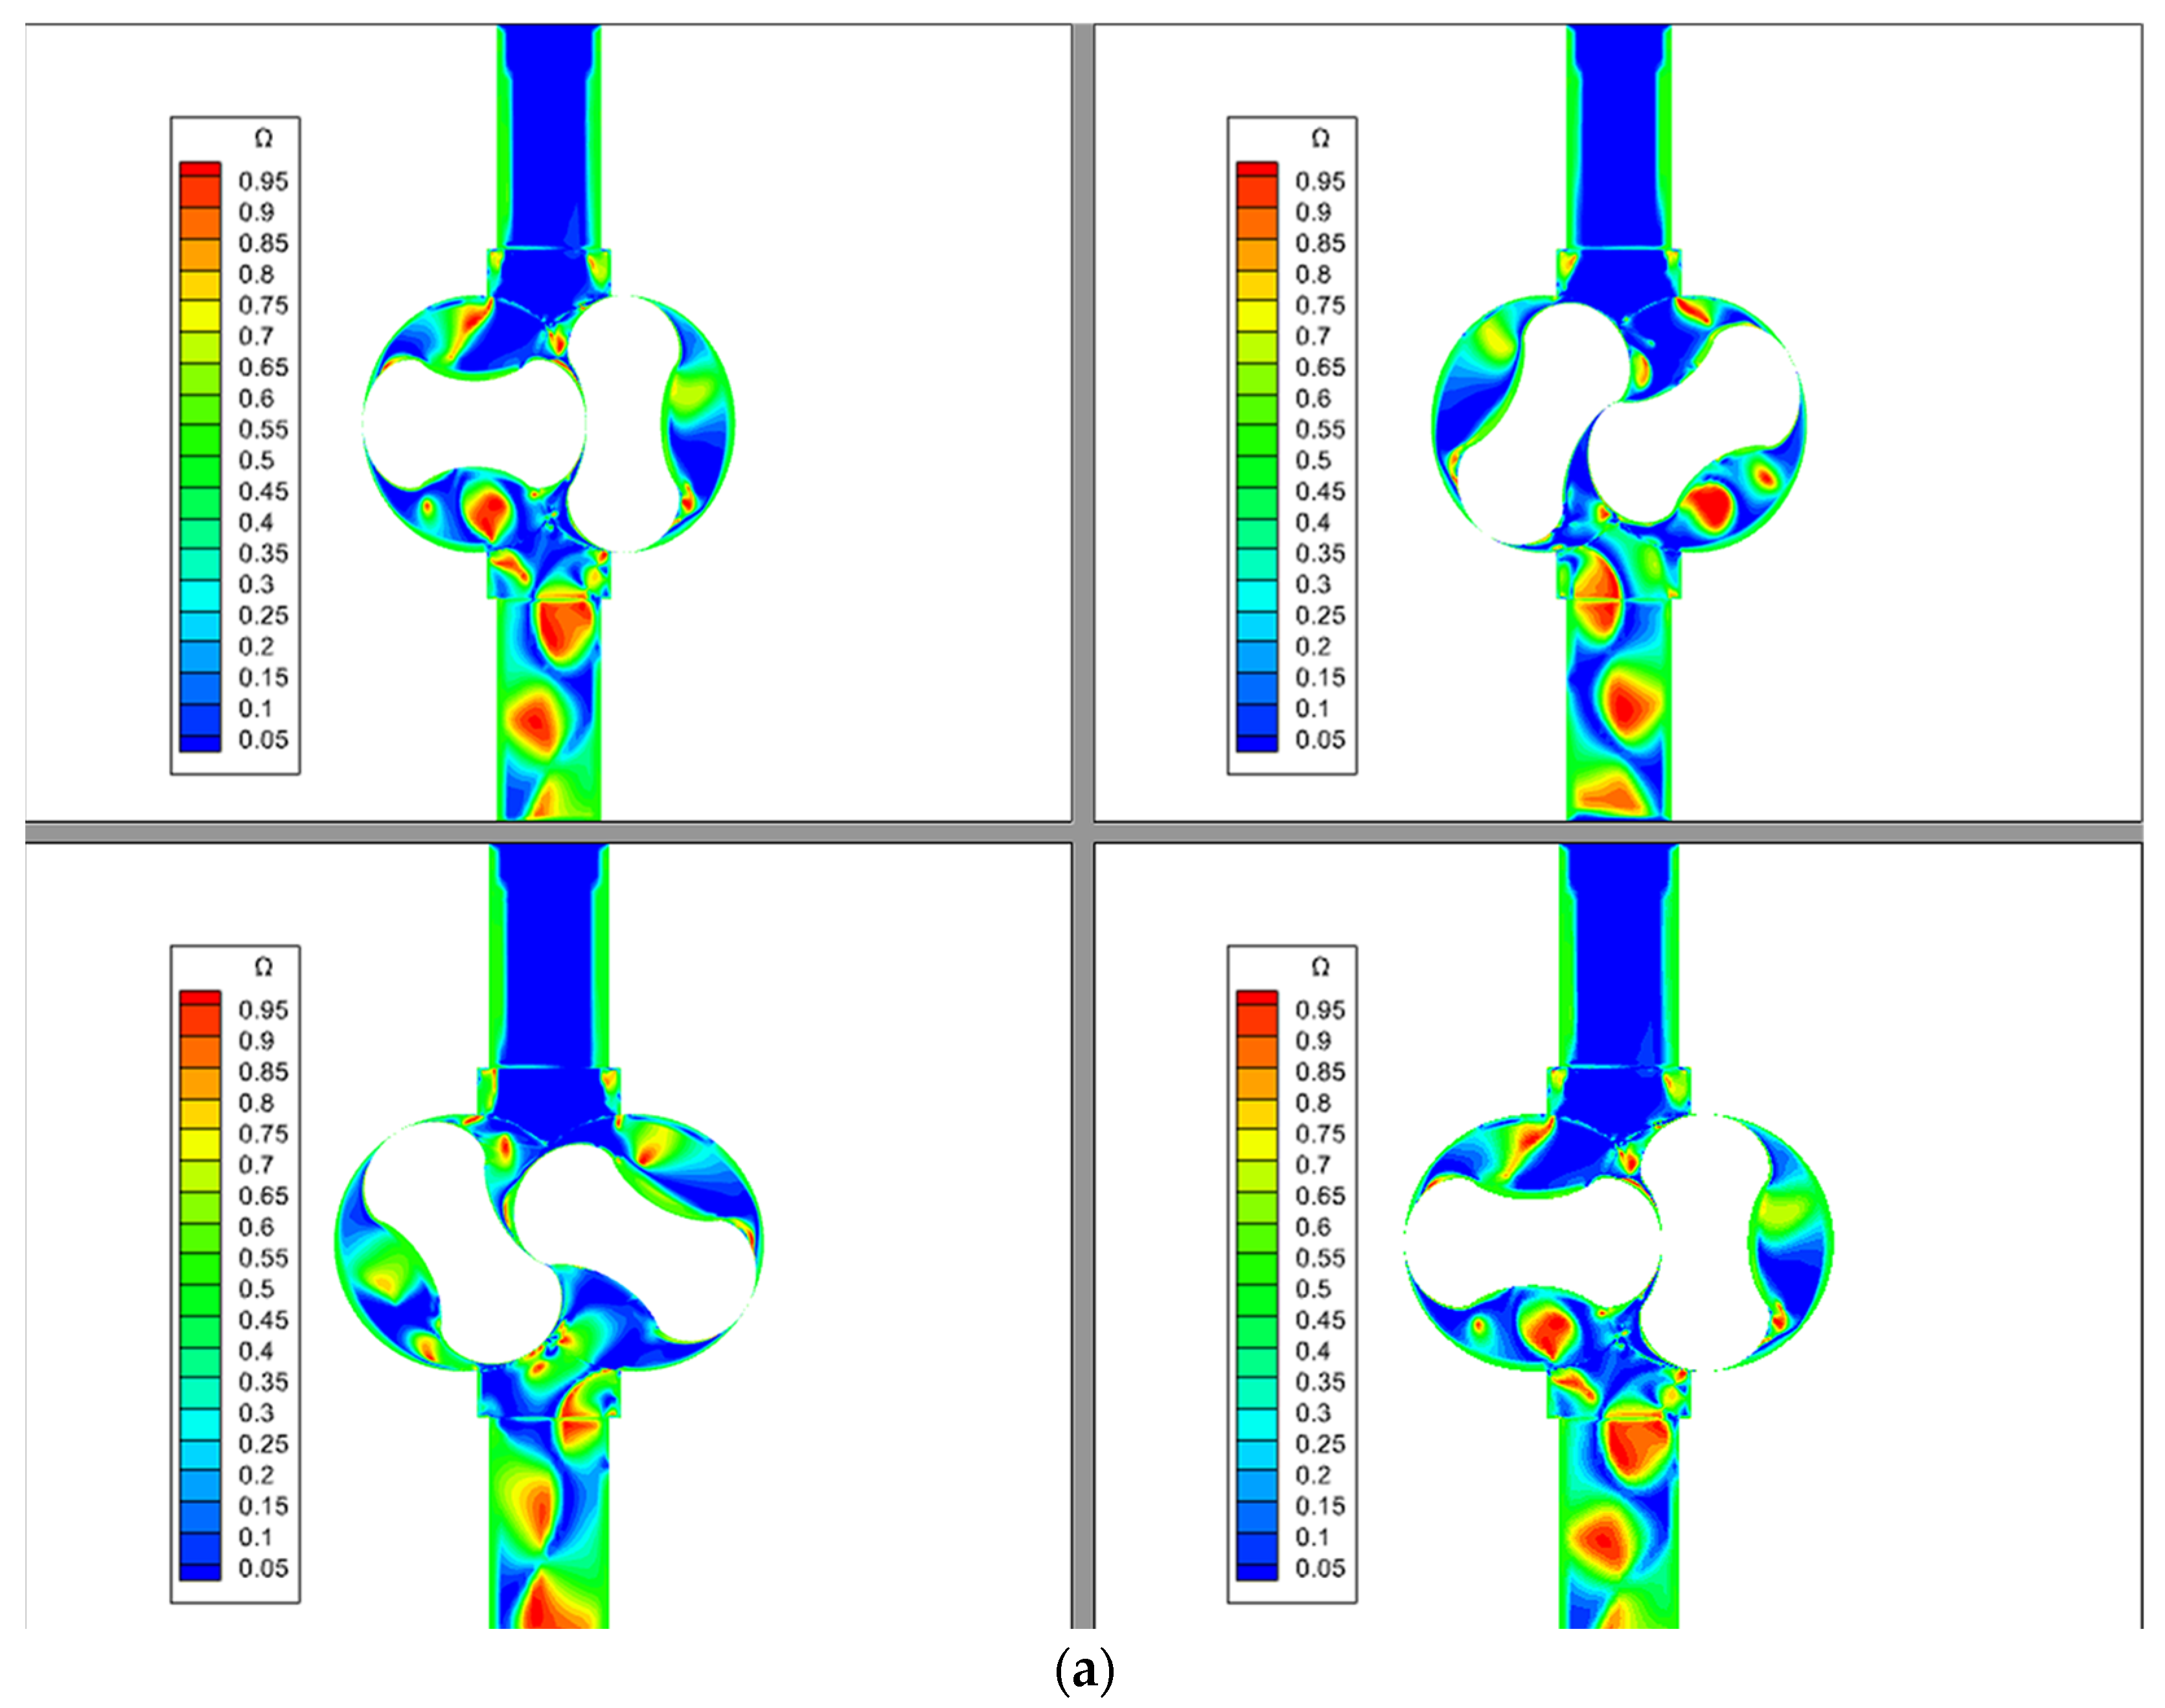
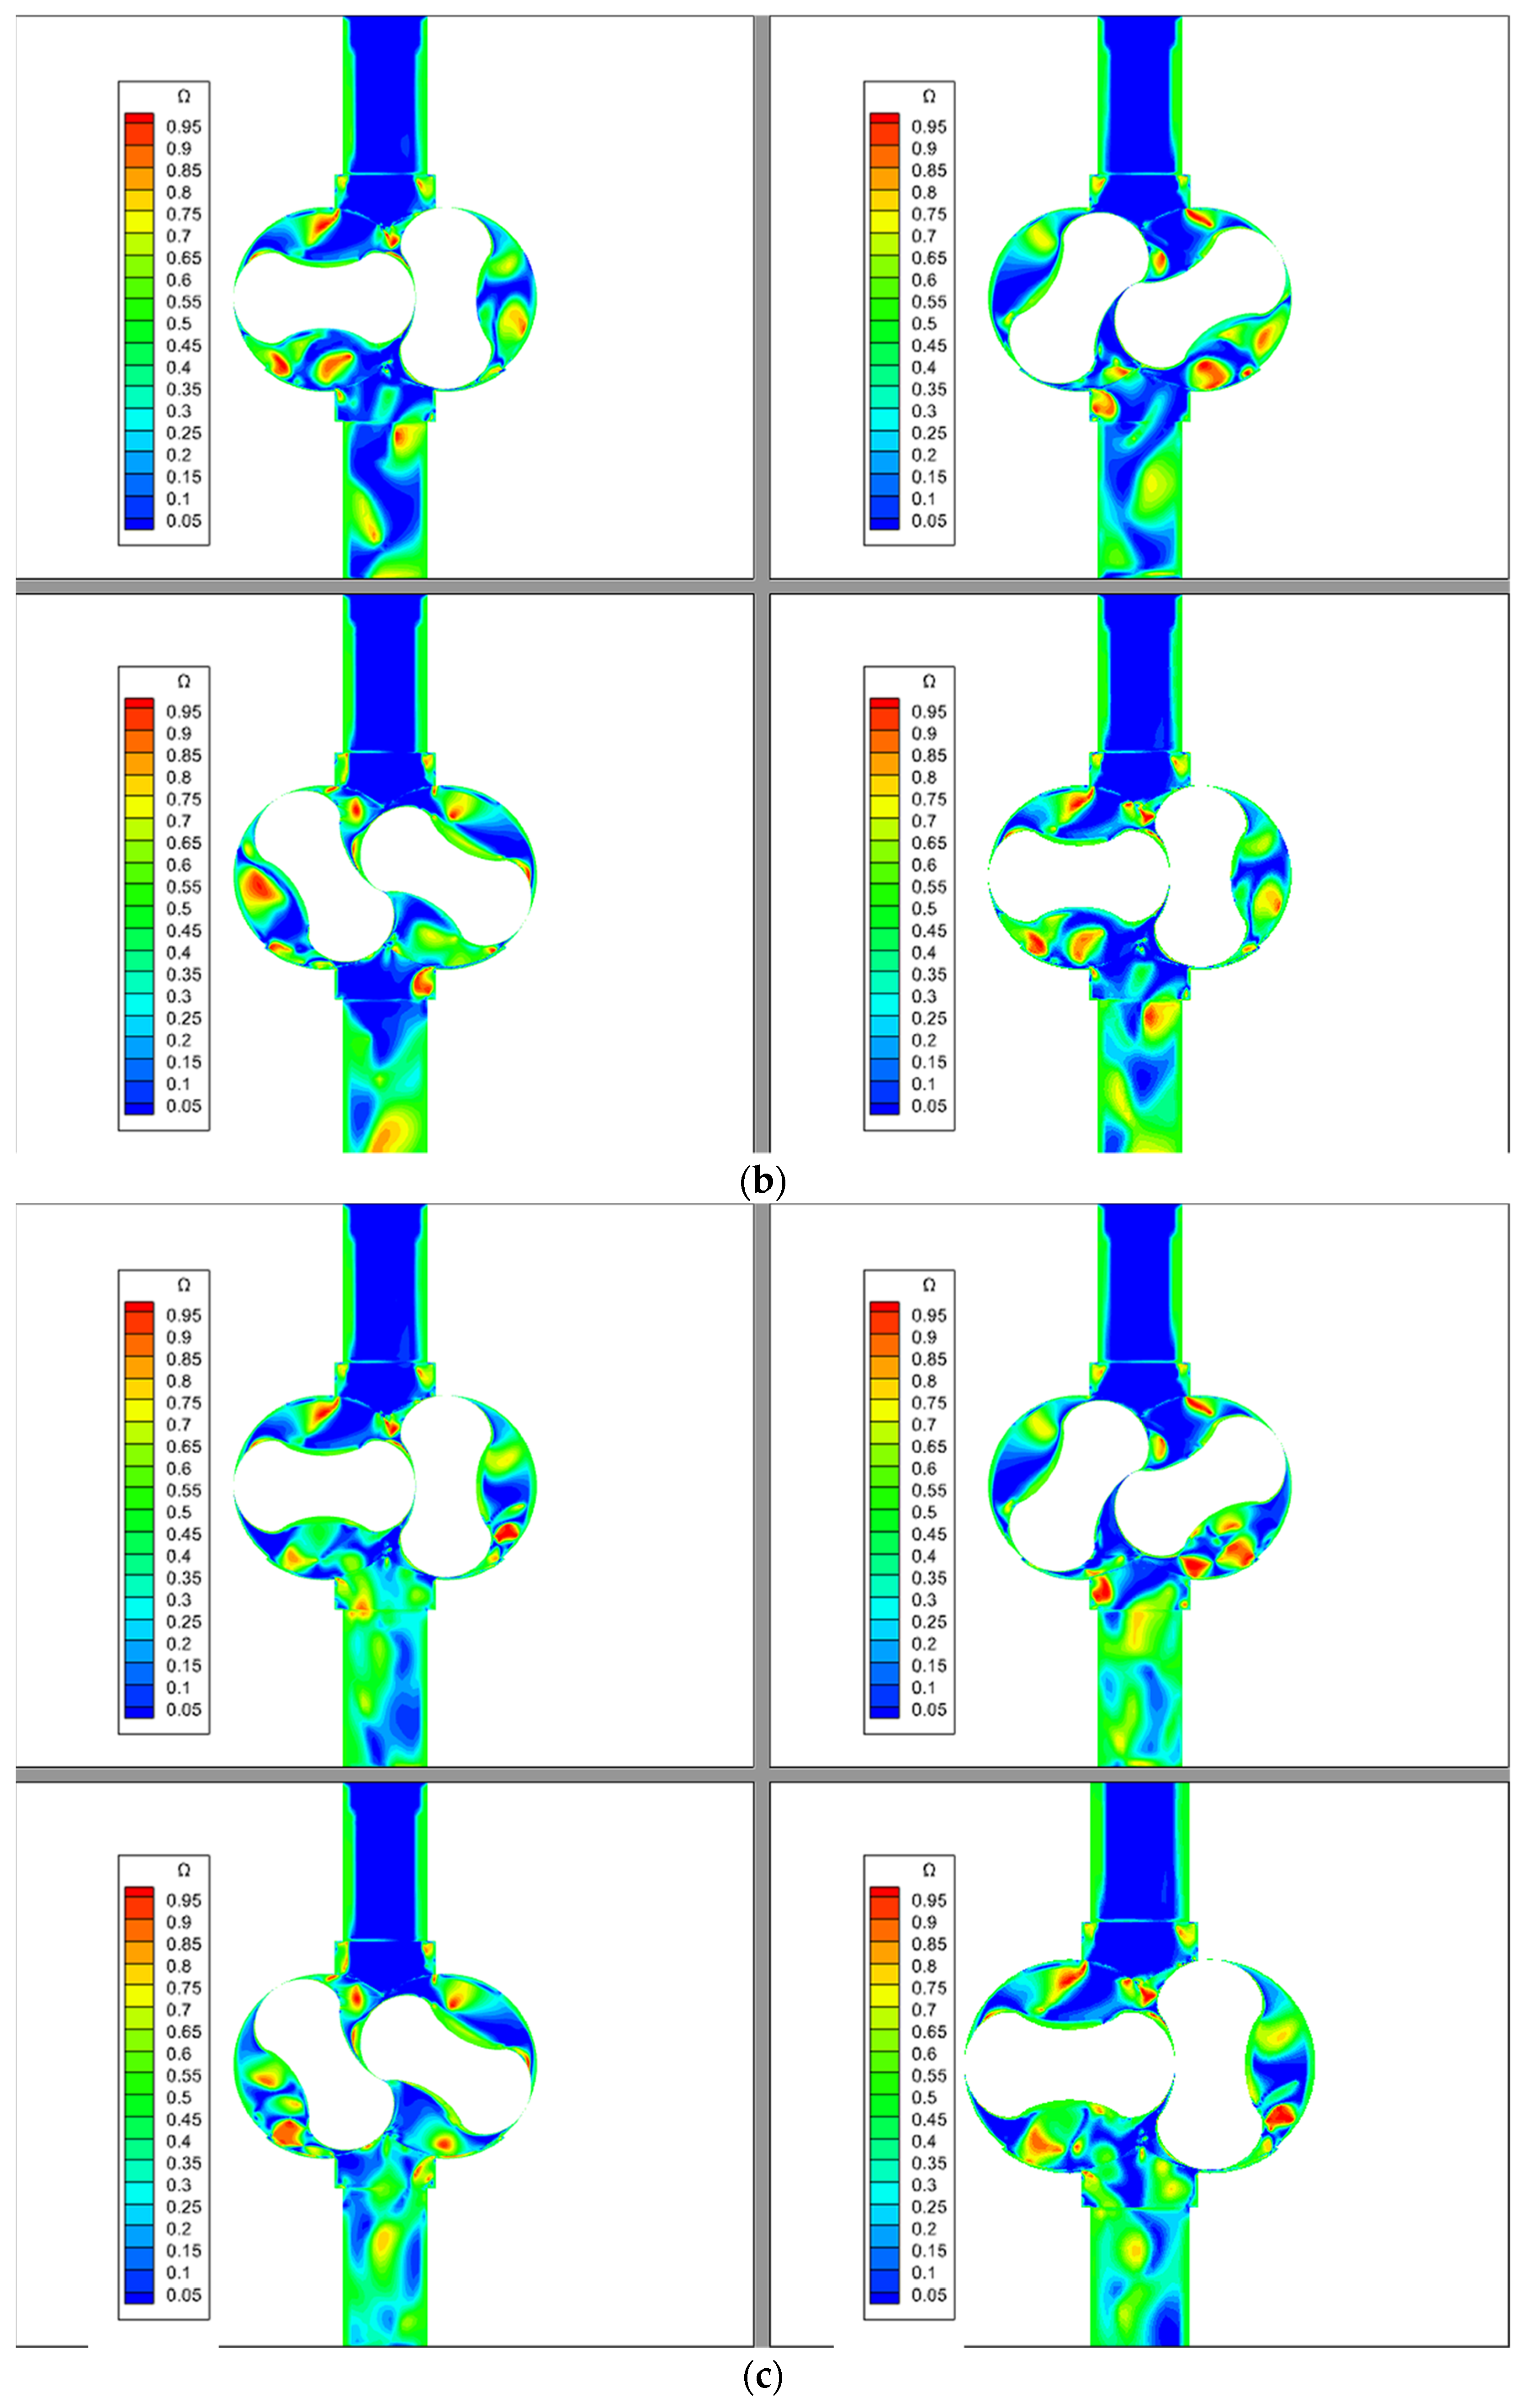
Figure 18 displays the vortex distribution cloud diagram at the middle section when the omega criterion was used at different rotation angles before and after optimization. It was keenly observed that prior to the optimization the vortices were mostly concentrated in the rotor and outlet areas, with less vortices in the inlet area, and more concentrated vortices emerging at the outlet area. However, after optimization, the vortex changes were not obvious at the inlet and rotor edges, and the strong eddy area was greatly reduced at the outlet. Therefore, the vortex at the exhaust port was clearly optimized by various reflux groove shapes.

5.2. The Pressure Distribution in the Roots Pump

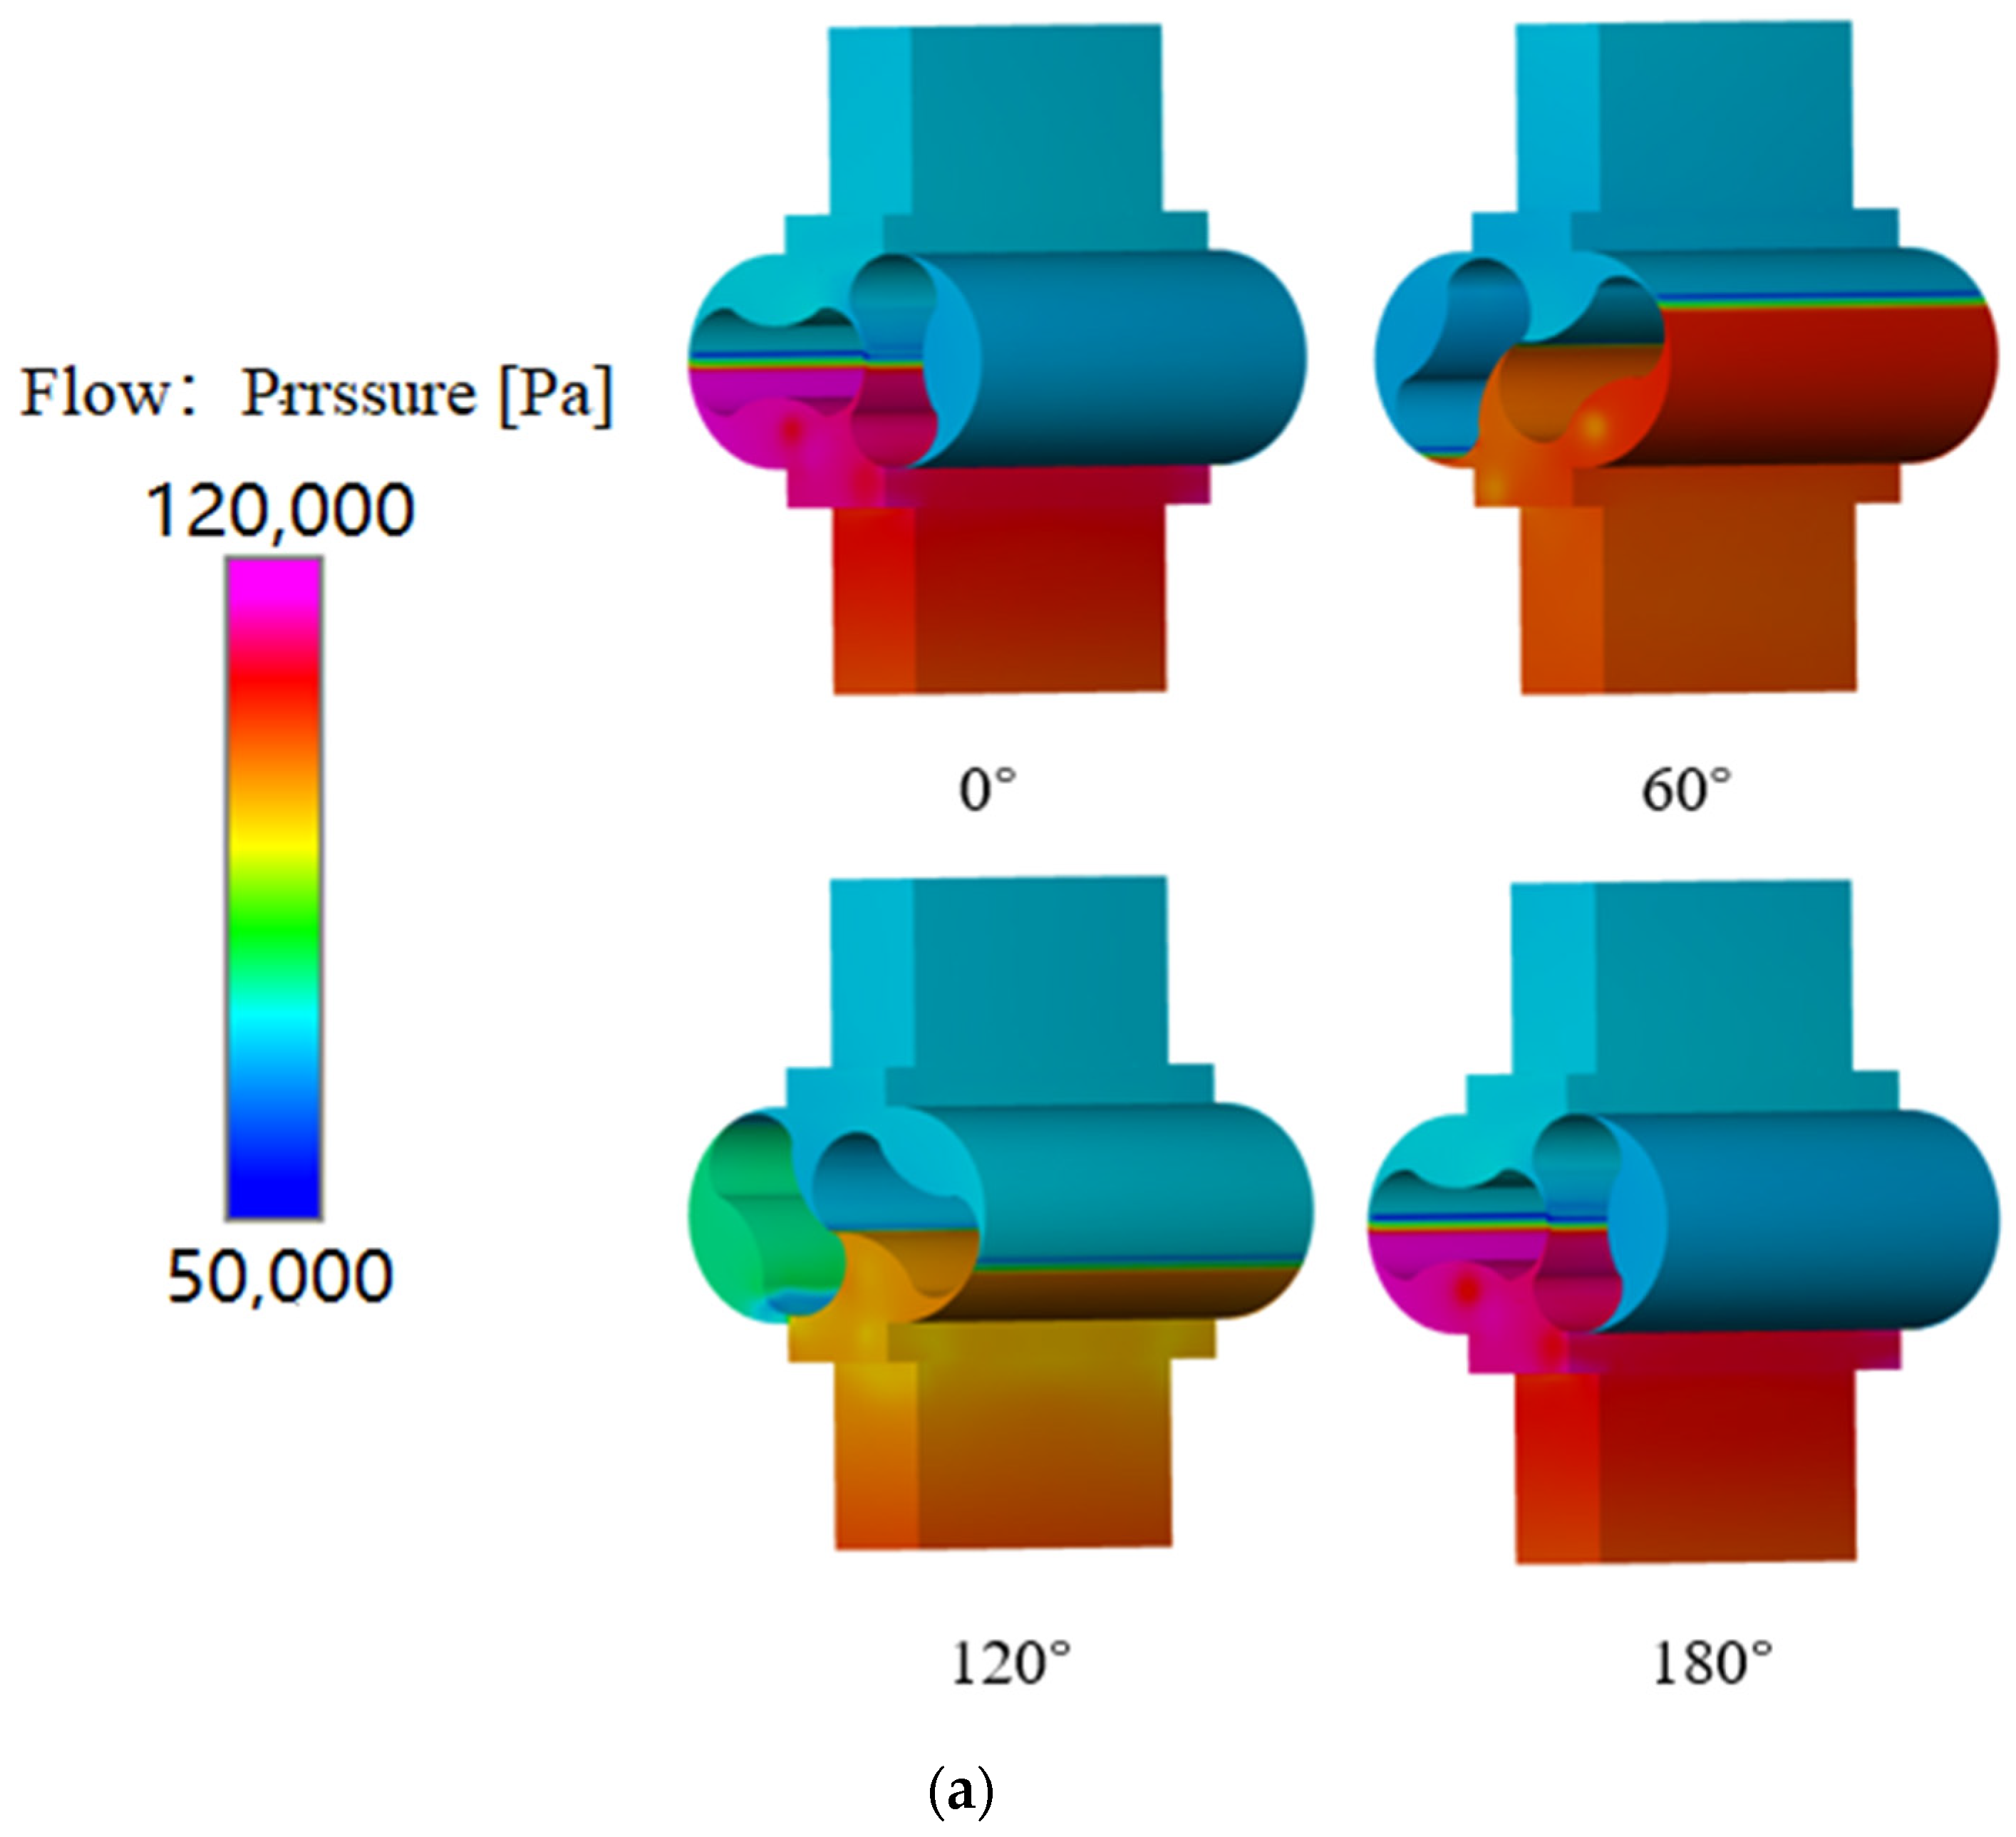
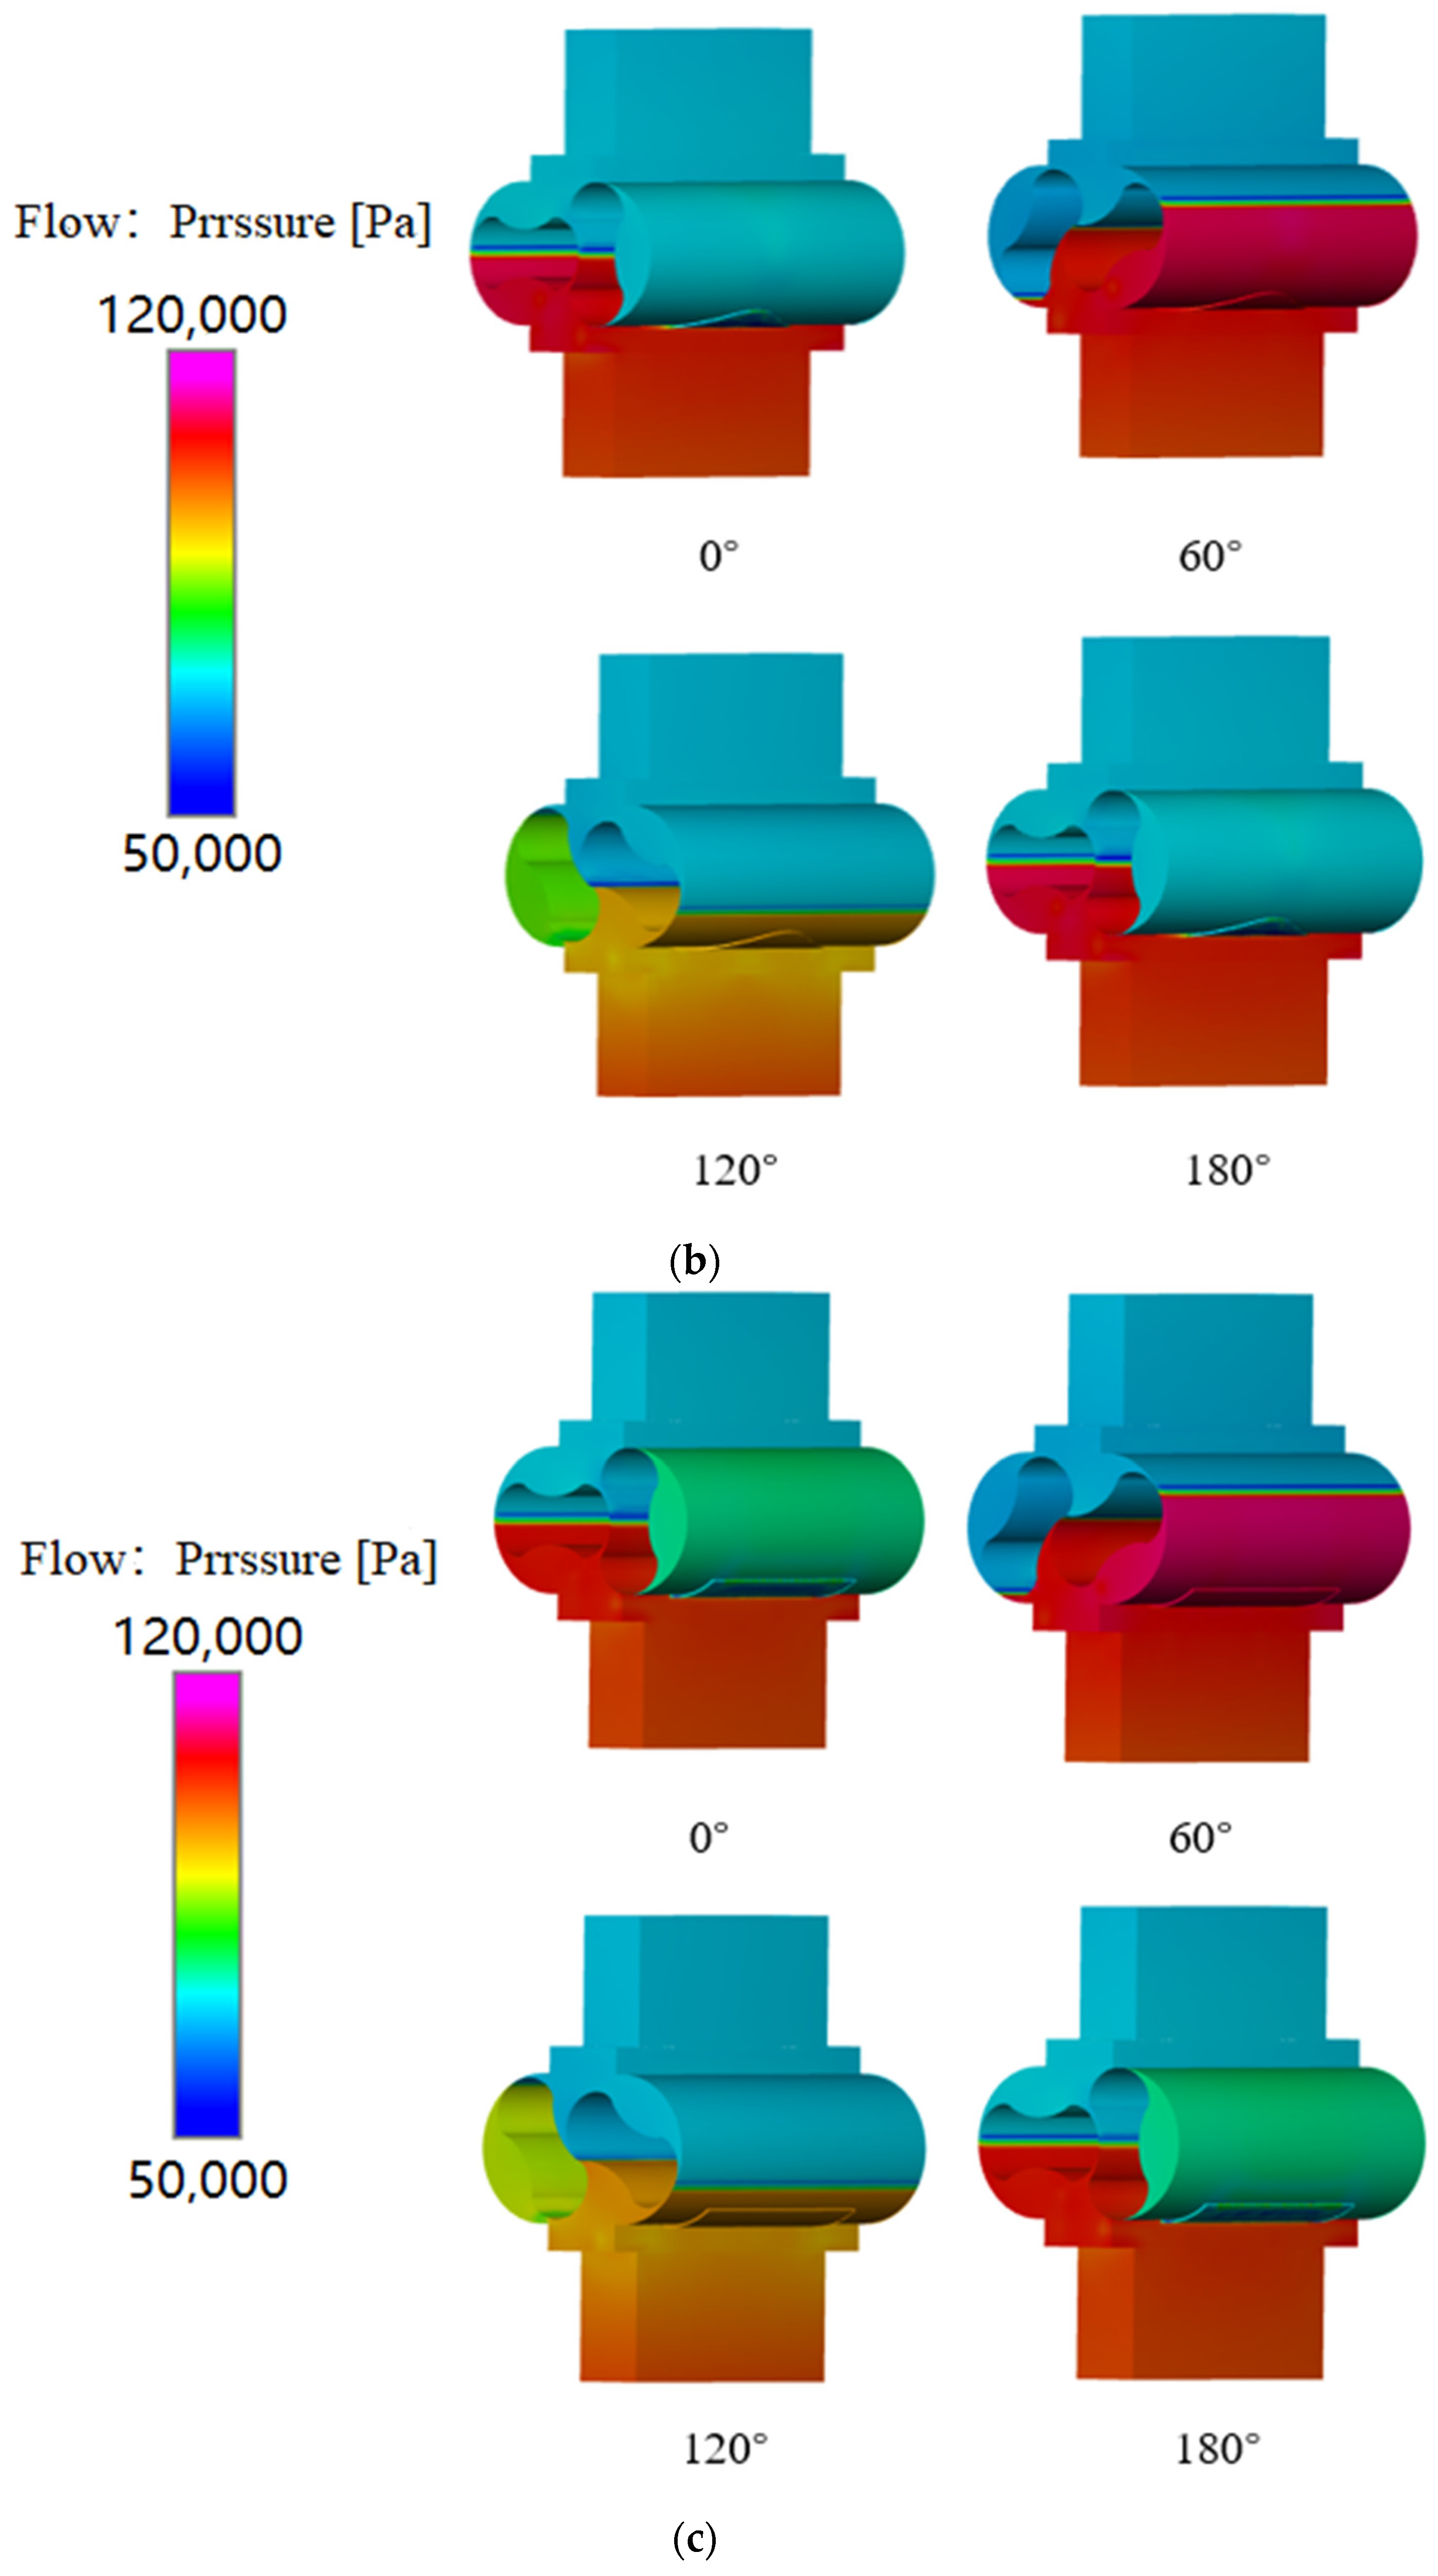
Figure 19 presents a pressure cloud diagram when the rotor turned at 0°, 60°, 120° and 180° at the fourth week before and after optimization of the two-blade Roots pump. Noticeably, when the fundamental volume was connected to the exhaust port, the presence of the reflux groove structure subtly produced high-pressure gas in the exhaust section input to the fundamental volume through the reflux groove structure. The essence of this phenomenon was to stabilize the pressure on both sides when the fundamental volume was disconnected to the exhaust port. Nonetheless, when the angle was set to 0° (180°), the volume pressure of the right element became higher in the structure with the reflux groove as juxtaposed to the structure without the reflux groove. The process of connecting the volume of the left element with the exhaust section at 60–120° was also compared with the pressure cloud diagram of the flow field before and after optimization at 60°. At this time, the volume of the element was just in contact with the inner reflux groove, and the pressure in the volume of the element was basically analogous before and after the optimization, justifying that the thickness of the inner reflux groove was appropriate and would not cause large leakages. When the position was 120°, the volume of the left element contacts with the exhaust section, and the volume pressure of the left element of the optimized model became higher. When the fundamental volume on both sides was connected to the exhaust section, the presence of the inner reflux groove structure increased the pressure in the fundamental volume, which reduced the high-pressure gas reflux intensity at the exhaust port at the moment of connection. This effectively reduced the pressure pulsation at the exhaust side and restrained the vortex disturbance and aerodynamic noise. Finally, the pressure differential of the rectangular reflux groove at 0° and 180° was comparatively less and had a superior effect of minimizing thepressure pulsation when compared to the arc-shaped reflux groove in the pressure cloud diagram.

6. Conclusions

The simulation of ฟ Roots pump was carried out using Pumplinx V4.6.0 software. This paper mainly investigated the influence of different reflux groove structures on the flow field of a Roots pump, especially the influence on the pressure pulsation of the exhaust port. The pros and cons of the Q criterion and omega criterion in obtaining the vortex structure of the Roots pump were compared, and the following findings are summarized below:
(1)
The reflux groove structure only had a better optimization effect on the outlet flow pulsation of the Roots pump; nevertheless, it had a subtle effect on the inlet flow field, which was within the range of 5%. The effect of the rectangular reflux groove on reducing the pulsation amplitude was comparatively better compared to the curved reflux groove. In addition, the flow loss of the rectangular reflux groove was quite substantial than that of the curved reflux groove.
(2)
With regards to the rectangular groove, the outlet flow pulsation unevenness and the exhaust pressure pulsation coefficient gradually decreased with the increase in the thickness and angle of the reflux groove, meanwhile increasing the flow rate. Taking the flow rate and outlet pulsation into consideration, the effect was more pronounced when the reflux groove angle was approximately 45° and the thickness was approximately 7.5 mm. Without considering the other optimized structures, the size of the reflux groove could avert the negative flow when the angle was 45–60° and the thickness was 7.5–10 mm.
(3)
When the Bezier curve of the arc-type reflux groove was constructed to determine the starting point, middle point and the end point, it was realized that the increase in the coefficient c 1 and coefficient c 2 , the decreased proportion of the flow inhomogeneity was higher. However, the change in c 1 had minimal impact on the inhomogeneity when c 1 was less than 0.45, and the optimization effect increased only modestly as c 2 increased. When both c 1 and c 2 were more than 0.45, the change in c 2 had a disproportionately large impact on the Roots pump’s pressure pulsation.
(4)
Although the Q criterion could be analyzed quickly, it had a poor capacity to capture both strong and weak vortices, and this capability was significantly influenced by the threshold. The Q criterion is therefore proposed for qualitative analysis. In comparison to the Q criterion, the vortex structure captured by the omega criterion was more distinct, continuous and less sensitive to the threshold. In the Roots pump, when ε was 0.001, the effect of obtaining the vortex was better, and the vortex production site of the Roots pump was mainly located in the rotor edge and outlet sections. At the same time, the reflux groove structure had a good effect on reducing the vortex structures at the outlet section.

Author Contributions

Conceptualization, F.Z.(Fan Zhang); Data curation, F.Z. (Feifei Zhao) and J.S.; Supervision, F.Z. (Fan Zhang), X.Z. and X.T.; Writing—original draft, W.X. All authors have read and agreed to the published version of the manuscript.

Funding

This work was supported by the National Key R&D Program of China (2021YFC3090404).

Institutional Review Board Statement

Not applicable.

Informed Consent Statement

Not applicable.

Data Availability Statement

Not applicable.

Conflicts of Interest

The authors declare no conflict of interest.

References

  1. Kovacevic, A.; Stosic, N.; Mujic, E.; Smith, I.K. CFD Integrated Design of Screw Compressors. Eng. Appl. Comput. Fluid Mech. 2007, 1, 96–108. [Google Scholar] [CrossRef] [Green Version]
  2. Borisova, K.; Ivanova, T.; Latypov, R. Study of Screw Pump Stator and Rotor Working Capacity to Increase the Output. Procedia Eng. 2017, 206, 688–691. [Google Scholar] [CrossRef]
  3. Petrovic, R.; Pezdirnik, J.; Banaszek, A.; Duricic, L. Influence of compressibility of working fluid on hydrodynamic processes in the axial piston pump with combined distribution/flow of working fluid. In Proceedings of the 2011 International Conference on Fluid Power and Mechatronics, Beijing, China, 17–20 August 2011; pp. 335–339. [Google Scholar] [CrossRef]
  4. Todić, N.; Savić, S.; Gordić, D.; Petrović, R. Experimental Research of the Hydrodynamic Processes of an Axial Piston Water Hydraulic Pump. Machines 2022, 10, 728. [Google Scholar] [CrossRef]
  5. Petrovic, R.; Andjelkovic, M.; Radosavljevic, M.; Todić, N. Experimental Research and Optimization of Characteristic Parameters of the Valve Plate of the Axial Piston Pump/Motor. In The Latest Methods of Construction Design; Dynybyl, V., Berka, O., Petr, K., Lopot, F., Dub, M., Eds.; Springer International Publishing: Berlin/Heidelberg, Germany, 2016; pp. 173–183. [Google Scholar] [CrossRef]
  6. Riemslagh, K.; Vierendeels, J.; Dick, E. Two-dimensional incompressible Navier-Stokes calculations in complex-shaped moving domains. In Floating, Flowing, Flying; Dijkstra, D., Geurts, B.J., Kuerten, J.G.M., Kuiken, H.K., Eds.; Springer: Dordrecht, The Netherlands, 1998; pp. 57–73. [Google Scholar] [CrossRef]
  7. Yang, D.C.H.; Tong, S.-H. The specific flowrate of deviation function based lobe pumps—Derivation and analysis q. Mech. Mach. Theory 2002, 18, 1025–1042. [Google Scholar] [CrossRef]
  8. Voss, G. An analytical model to describe the compression in turbomolecular pumps and roots blowers. J. Phys. Conf. Ser. 2008, 114, 012018. [Google Scholar] [CrossRef] [Green Version]
  9. Sun, S.H.; Kovacevic, A.; Bruecker, C.; Leto, A.; Singh, G.; Ghavami, M. Numerical and Experimental Analysis of Transient Flow in Roots Blower. IOP Conf. Ser. Mater. Sci. Eng. 2018, 425, 012024. [Google Scholar] [CrossRef]
  10. Singh, G.; Sun, S.; Kovacevic, A.; Li, Q.; Bruecker, C. Transient flow analysis in a Roots blower: Experimental and numerical investigations. Mech. Syst. Signal Process. 2019, 134, 106305. [Google Scholar] [CrossRef]
  11. Hsieh, C.-F.; Deng, Y.-C. A design method for improving the flow characteristics of a multistage Roots pumps. Vacuum 2015, 121, 217–222. [Google Scholar] [CrossRef]
  12. Wu, Y.-R.; Tran, V.-T. Generation method for a novel Roots rotor profile to improve performance of dry multi-stage vacuum pumps. Mech. Mach. Theory 2018, 128, 475–491. [Google Scholar] [CrossRef]
  13. Li, Y.B.; Jia, K.; Meng, Q.W.; Shen, H.; Sang, X.H. Flow simulation of the effects of pressure angle to lobe pump rotor meshing characteristics. IOP Conf. Ser. Mater. Sci. Eng. 2013, 52, 032022. [Google Scholar] [CrossRef]
  14. Hsieh, C.-F. A new curve for application to the rotor profile of rotary lobe pumps. Mech. Mach. Theory 2015, 87, 70–81. [Google Scholar] [CrossRef]
  15. Wang, J.; Liu, R.; Yang, S.; Li, H.; Wang, Z.; Li, Q. Geometric study and simulation of an elliptical rotor profile for Roots vacuum pumps. Vacuum 2018, 153, 168–175. [Google Scholar] [CrossRef]
  16. Xing, L.; Feng, J.; Chen, W.; Xing, Z.; Peng, X. Development and Testing of a Roots Pump for Hydrogen Recirculation in Fuel Cell System. Appl. Sci. 2020, 10, 8091. [Google Scholar] [CrossRef]
  17. Hsieh, C.-F.; Zhou, Q.-J. Fluid analysis of cylindrical and screw type Roots vacuum pumps. Vacuum 2015, 121, 274–282. [Google Scholar] [CrossRef]
  18. Li, Y.B.; Sang, X.H.; Meng, Q.W.; Shen, H.; Jia, K. Transient simulation in interior flow field of lobe pump. IOP Conf. Series: Mater. Sci. Eng. 2013, 52, 032019. [Google Scholar] [CrossRef] [Green Version]
  19. Vizgalov, S.V.; Chekushkin, G.N.; Volkov, M.V. Investigation of three lobes roots blower with special ejector. IOP Conf. Series: Mater. Sci. Eng. 2015, 90, 012082. [Google Scholar] [CrossRef] [Green Version]
  20. Sun, S.K.; Zhou, Q.; Wen, J.; Peng, X.Y. Three-dimensional numerical simulation and experimental validation of flows in working chambers of roots blowers with backflow design. IOP Conf. Ser. Mater. Sci. Eng. 2017, 232, 012079. [Google Scholar] [CrossRef]
  21. Sun, S.-K.; Jia, X.-H.; Xing, L.-F.; Peng, X.-Y. Numerical study and experimental validation of a Roots blower with backflow design. Eng. Appl. Comput. Fluid Mech. 2018, 12, 282–292. [Google Scholar] [CrossRef]
  22. Li, Y.-B.; Guo, D.-S.; Li, X.-B. Mitigation of radial exciting force of rotary lobe pump by gradually varied gap. Eng. Appl. Comput. Fluid Mech. 2018, 12, 711–723. [Google Scholar] [CrossRef]
  23. Li, Y.-B.; Du, J.; Guo, D.-S. Numerical research on viscous oil flow characteristics inside the rotor cavity of rotary lobe pump. J. Braz. Soc. Mech. Sci. Eng. 2019, 41, 274. [Google Scholar] [CrossRef]
  24. Liu, H.; Wu, Y.; Li, Z. Simulation research on Reducing Airflow Pulsation method of Roots Mechanical Supercharger Based on CFD. Intern. Combust. Engine Accessories 2015, 4, 8–12. (In Chinese) [Google Scholar]
  25. Li, Y.B.; Guo, D.S. Transient Mechanism of CAM Pump Rotor Cavity; Jiangsu University Press: Zhenjiang, China, 2019. [Google Scholar]
  26. Kang, Y.-H.; Vu, H.-H. A newly developed rotor profile for lobe pumps: Generation and numerical performance assessment. J. Mech. Sci. Technol. 2014, 28, 915–926. [Google Scholar] [CrossRef]
  27. Zhou, S.; Jia, X.; Yan, H.; Peng, X. A novel profile with high efficiency for hydrogen-circulating Roots pumps used in FCVs. Int. J. Hydrogen Energy 2021, 46, 22122–22133. [Google Scholar] [CrossRef]
  28. Guo, Q.; Qin, K.; Li, D.; Huang, C.; Luo, K. Numerical investigation and performance enhancement of roots pumps operating with gas-liquid mixtures. Vacuum 2020, 176, 109303. [Google Scholar] [CrossRef]
  29. Li, Y.; Guo, D.; Li, X. The effect of startup modes on a vacuum cam pump. Vacuum 2019, 166, 170–177. [Google Scholar] [CrossRef]
  30. Sun, S.-K.; Zhao, B.; Jia, X.-H.; Peng, X.-Y. Three-dimensional numerical simulation and experimental validation of flows in working chambers and inlet/outlet pockets of Roots pump. Vacuum 2017, 137, 195–204. [Google Scholar] [CrossRef]
  31. Bhuyan, P.; Ghosh, S. Influence of rotor speed, discharge pressure, and clearance size on the unsteady flow dynamics and heat interaction of roots blower. J. Braz. Soc. Mech. Sci. Eng. 2021, 43, 48. [Google Scholar] [CrossRef]
  32. Su, C.M. Roots Blower and Its Use; Central South University Press: Changsha, China, 2000. [Google Scholar]
  33. Gao, Y.; Liu, C. Rortex and comparison with eigenvalue-based vortex identification criteria. Phys. Fluids 2018, 30, 085107. [Google Scholar] [CrossRef]
  34. Zhang, F.; Appiah, D.; Chen, K.; Yuan, S.; Adu-Poku, K.A.; Zhu, L. Investigation on the Flow Behavior of Side Channel Pumps Based on Vortex Identification. Chin. J. Mech. Eng. 2021, 34, 120. [Google Scholar] [CrossRef]
  35. Liu, C.; Wang, Y.; Yang, Y.; Duan, Z. New omega vortex identification method. Sci. China Ser. G Phys. Mech. Astron. 2016, 59, 684711. [Google Scholar] [CrossRef]
  36. Dong, X.; Wang, Y.; Chen, X.; Dong, Y.; Zhang, Y.; Liu, C. Determination of epsilon for Omega vortex identification method. J. Hydrodyn. 2018, 30, 541–548. [Google Scholar] [CrossRef]
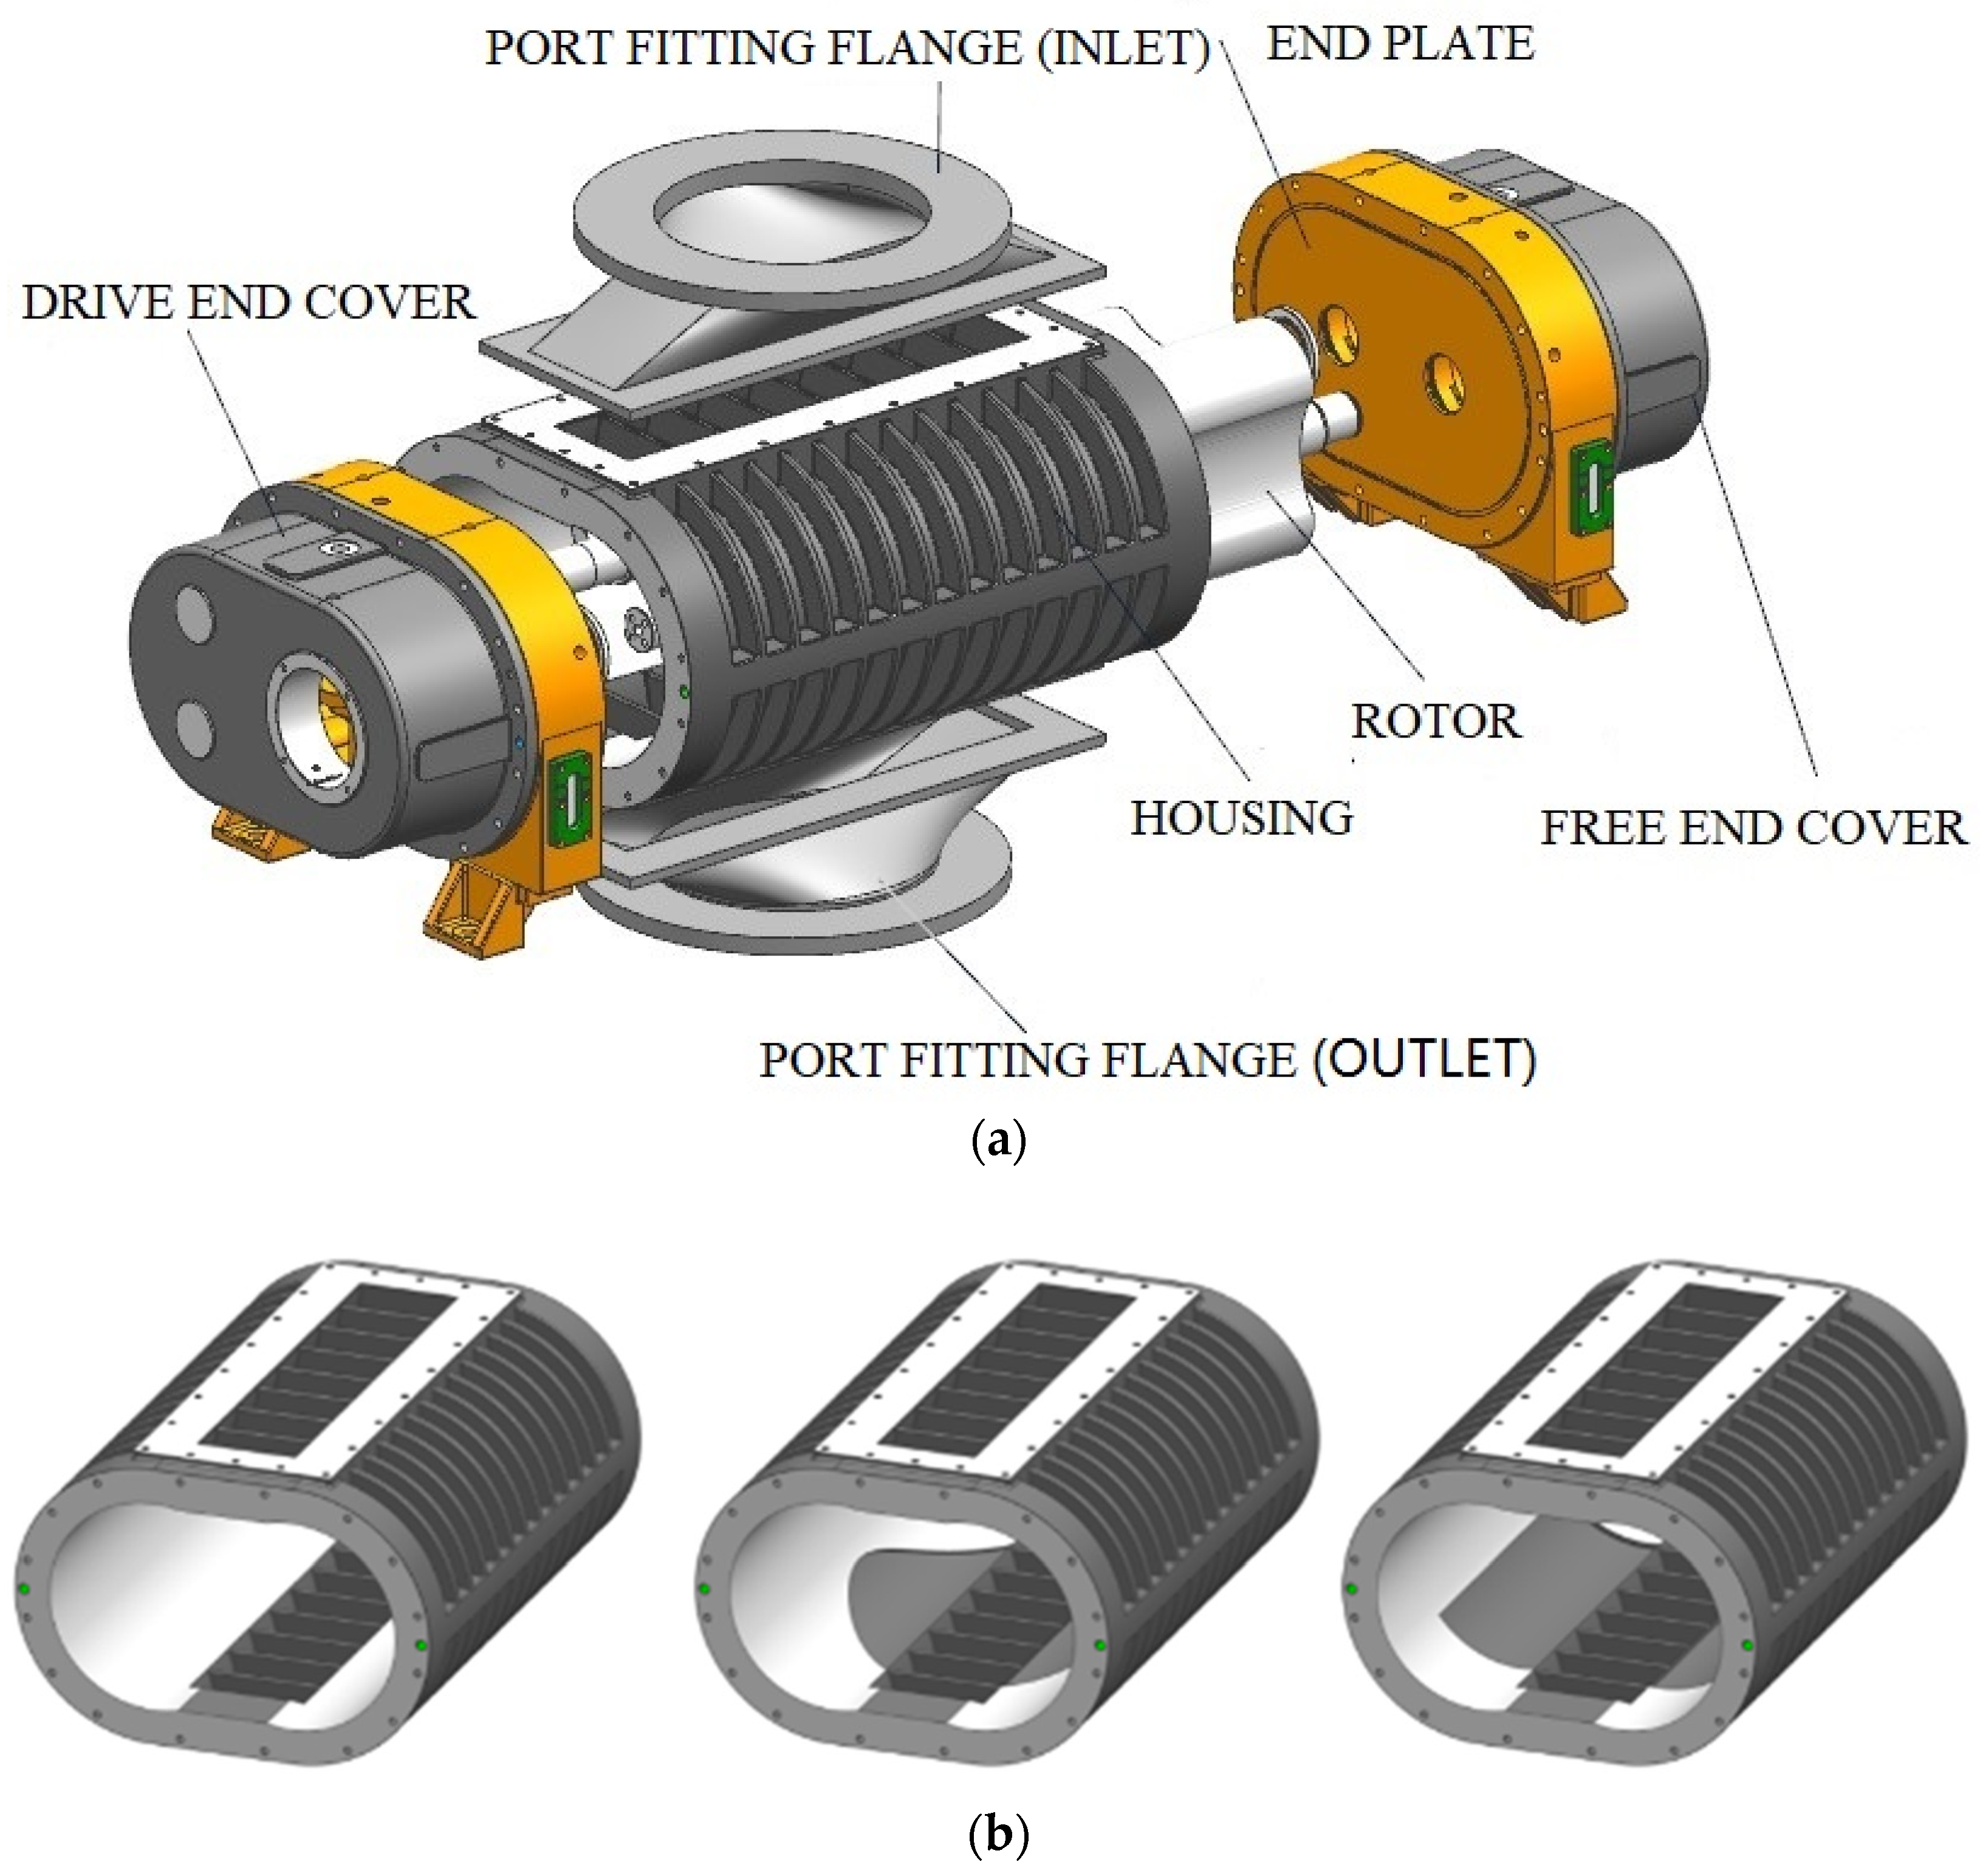
Figure 1. Three-dimensional model of the Roots pump: (a) overall model; (b) model of the housing.
Machines 10 01087 g001
Figure 2. Roots pump profile generation program.
Machines 10 01087 g002
Figure 3. The fluid domain.
Machines 10 01087 g003
Figure 4. Reflux groove construction.
Machines 10 01087 g004
Figure 5. Grids of the Roots pump: (a) overall grid; (b) rotor grid.
Machines 10 01087 g005
Figure 6. Position of the monitoring points.
Machines 10 01087 g006
Figure 7. The original model simplified the outlet flow before and after.
Machines 10 01087 g007
Figure 8. The volumetric efficiency of the simulation and test varies with the pressure ratio.
Machines 10 01087 g008
Figure 9. The volumetric efficiency of the optimization and the original with different pressure ratios.
Machines 10 01087 g009
Figure 10. Influence of the reflux groove structure on the inlet side: (a) change in the inhomogeneity of the inlet flow; (b) change in the inlet pressure pulsation coefficient.
Machines 10 01087 g010aMachines 10 01087 g010b
Figure 11. Outlet flow fluctuation.
Machines 10 01087 g011
Figure 12. Variation of the outlet flow unevenness and average flow: (a) curved reflux groove; (b) rectangular reflux groove.
Machines 10 01087 g012aMachines 10 01087 g012b
Figure 13. The vortex area under different thresholds varied with the thresholds.
Machines 10 01087 g013
Figure 14. Q criterion vortex identification results of the Roots pump flow field at different thresholds: (a) Q = 0.0001; (b) Q = 100; (c) Q = 5000; (d) Q = 100,000.
Machines 10 01087 g014
Figure 15. Internal vortex structure of the Roots pump before and after optimization: (a) original model; (b) Model 14; (c) Model 5.
Machines 10 01087 g015
Figure 16. The Ω criterion vortex identification results of the Roots pump flow field at different thresholds: (a) Ω = 0.51; (b) Ω = 0.53; (c) Ω = 0.56; (d) Ω = 0.6.
Machines 10 01087 g016
Figure 17. Comparison between Q criterion and omega criterion.
Machines 10 01087 g017
Figure 18. Vortex cloud images at different rotation angles: (a) vortex cloud image of the original model; (b) vortex cloud image of optimization Model 14; (c) vortex cloud image of optimization Model 5.
Machines 10 01087 g018aMachines 10 01087 g018b
Figure 19. A comparison of the pressure clouds: (a) original model; (b) optimization Model 14; (c) optimization Model 5.
Machines 10 01087 g019aMachines 10 01087 g019b
Table 1. The parameters of the rectangular reflux groove model.
ModelAngle (°)Thickness (mm)
Model 1305
Model 2307.5
Model 33010
Model 4455
Model 5457.5
Model 64510
Model 7605
Model 8607.5
Model 96010
Table 2. The parameters of the arc-shaped reflux groove model.
ModelCoefficient c1Coefficient c2
Model 100.31/6
Model 110.31/3
Model 120.31/2
Model 130.451/6
Model 140.451/3
Model 150.451/2
Model 160.61/6
Model 170.61/3
Model 180.61/2
Table 3. Data of the original model.
ParameterValue
Unevenness of inlet flow−0.33396
Unevenness of outlet flow3.390946
Inlet pressure pulsation coefficient0.027563
Outlet pressure pulsation coefficient0.184533
Average outlet flow ( kg / s ) 2.561141
Table 4. Date of the outlet exhaust.
Model Q o u t l e t m a x
( m 3 / s )
Q o u t l e t m i n
( m 3 / s )
δ outlet Model Q o u t l e t m a x
( m 3 / s )
Q o u t l e t m i n
( m 3 / s )
δ outlet
Model 16.04−1.552.97Model 105.65−1.133.00
Model 25.60−1.102.98Model 115.60−1.072.95
Model 35.66−0.622.49Model 125.58−1.052.93
Model 45.28−0.742.65Model 135.45−0.892.78
Model 55.09−0.332.28Model 145.46−0.892.78
Model 65.26−0.112.09Model 155.44−0.872.76
Model 75.18−0.722.65Model 165.30−0.802.71
Model 84.650.451.96Model 175.30−0.792.70
Model 94.600.401.68Model 185.23−0.672.60
Publisher’s Note: MDPI stays neutral with regard to jurisdictional claims in published maps and institutional affiliations.