Article

Design and Evaluation of a Low-Cost Electromechanical System to Test Dynamic Performance of Force Sensors at Low Frequencies

by
Daniele Esposito
1,*,
Jessica Centracchio
1,
Emilio Andreozzi
1,
Paolo Bifulco
1 and
Gaetano D. Gargiulo
2
1
Department of Electrical Engineering and Information Technologies, Polytechnic and Basic Sciences School, University of Naples “Federico II”, 80125 Naples, Italy
2
School of Engineering, Design and Built Environment, Western Sydney University, Penrith, NSW 2747, Australia
*
Author to whom correspondence should be addressed.
Machines 2022, 10(11), 1017; https://doi.org/10.3390/machines10111017
Submission received: 29 September 2022 / Revised: 28 October 2022 / Accepted: 1 November 2022 / Published: 2 November 2022
(This article belongs to the Section Machines Testing and Maintenance)

Abstract

:
Piezoresistive or piezoelectric force sensors are widely available today. These sensors are preferred to loadcells because of their extremely reduced size, slimness, and low cost, which allow their easy inclusion in a large variety of devices including wearables. In particular, many applications are devoted to monitoring human body movements, such as those related to breathing, muscle contraction, walking, etc. However, such sensors offer variable performance, and they need to be individually calibrated and tested to ensure accurate measurements. An automated electromechanical system that allows simple mechanical tests of force sensors is proposed. The system by means of an electrical motor; a gear box; a connecting rod-crank mechanism; two pistons, and a coupling spring between them, impress sinusoidal axial forces onto the sensor under test. The system is designed as modular so that it can be customized: the force range to which the sensor is subjected, the frequency range, and the coupler with the sensor can be changed to resemble the actual application context. The actual force (read from a loadcell coupled to the sensor under test), a piston displacement, and the sensor output are simultaneously recorded. The electromechanical system generates nearly pure sinusoidal stresses at varying low frequencies (mean total harmonic distortion of 2.77%). The energy dissipated for a single stress cycle was 3.62 gf mm on average. The developed system was used to test a Force Sensitive Resistor (FSR)-based sensor and a piezoelectric (PZT) sensor. The tests revealed significant differences from the actual force values (particularly at very low frequencies), output drifts of the FSR sensor in measurements, and non-linear behaviors. The system was found to be able to provide dynamic performances, accurate calibration, and non-linear behavior of the individual sensor.

1. Introduction

Loadcells are among the most accurate sensors that measure forces. However, in some application areas, such as wearables, other types of force sensors are preferred, even if they are less performing. The primary need in a wearable application is that the information about the user should be collected in an unobtrusive way. There are many types of force sensors, which can be categorized by the physical phenomenon used. Some sensors use a change in the electrical properties of a material subjected to mechanical stress, e.g., resistance or capacitance, other sensors (piezoelectric) generate a charge displacement, and still, others use changes in further physical quantities, such as a magnetic field or light [1,2,3].
The loadcells themselves typically use a bridge of strain gauges applied to a deformable material: each strain gauge varies its resistance in relation to the mechanical strain it undergoes, which in turn depends on the particular force applied to the material [4]. Alternatively, Force Sensing Resistors (FSRs) consist of a thin layer of polymeric composite materials that produce a change in resistance at least an order of magnitude greater than strain gauges, when subjected to compression [5,6]. Other advantages over conventional loadcells include low cost, low power consumption, very small footprint, and simplicity of design. However, FSRs exhibit non-linearities and are subject to drift phenomena. Nevertheless, they are widely used for wearable applications having the virtue of being extremely thin, unobtrusive, and very sensitive.
Piezoelectric force sensors generate a charge displacement when stressed. They exploit the piezoelectric properties of some materials, such as elastomers like PolyVinyliDene Fluoride (PVDF), or ceramics like Lead Zirconate Titanate (PZT). Specific conditioning circuits are needed to measure the piezoelectric charge, because parasitic effects tend to recombine the charges [5]. For this reason, such sensors are generally not used to measure static or slowly varying forces or pressures. However, piezoelectric sensors have recently been successfully employed to monitor respiratory and cardiac activities in humans [7,8,9]. Indeed, by using special conditioning circuits, common PZT sensors can be used to record mechanical vibrations at frequencies below 1 Hz [9].
There are also many proposals in literature for innovative sensors that use conductive polymers, such as EeonTex (EeonTex Eeonyx, Pinole USA) strain fabric or Velostat (3M™ Velostat™), which changes their electrical resistance when a mechanical deformation is applied. These materials enable the fabrication of ad-hoc pressure sensors, which can even be embedded in clothing or apparel. Materials such as Velostat or Eeontex are commercially available as thin sheets from which sensors of generic shapes can be made by cutting out the desired form. Electrical contacts can be provided to the sensing elements via conductive textile fiber yarns. Such sensors can be sewn onto other fabrics and provide for wearable applications. In this article, the terms force and pressure are used synonymously. In fact, these two quantities are intimately related, considering that pressure is expressed as a force on a surface and assuming that the surface is known.

1.1. Applications of Force/Pressure Sensors

A review study presented various applications of FSR sensors for realizing Human-Machine Interfaces for assistance and rehabilitation purposes [10]. An FSR technology was adopted to sense pressure changes during the walking of children with cerebral palsy [11]. FSR-based force sensors were proposed to measure muscle contraction [12,13], and mechanical activity of the heart and lungs [14,15].
An e-textile smart mat prototype was proposed to measure the pressure distribution and pressure changes of a subject while sleeping [16]. Park et al. employed a flexible capacitive pressure sensor, based on Ecoflex porous dielectric material, to realize a real-time respiration monitoring system [17], which can also be integrated into wearables.
After some preliminary studies conducted on PVDF-based sensors, PZT disks have been successfully used to monitor respiration, infrasonic heart vibrations, and heart sounds [9]. Thanks to an innovative circuit exhibiting an ultra-high input impedance [9], ordinary PZT discs can also transduce slow vibrations down to tenths of Hertz, which is useful for recording breath movements on the chest or abdomen. A dome-shaped mechanical coupler was used to ensure the stable positioning of the sensor on patients’ skin and allow appropriate transmission of mechanical movements [12,14,15].
In [18], a force sensor was developed to measure chest movements during respiration by using a conductive strain fabric, wrapped around the thorax of the subject. This sensor could be employed in infant respiration monitoring to prevent sudden deaths. Spilz et al. [19] designed a smart glove equipped with Eeontex-based force sensors, intended to help physiotherapists in controlling the force applied to patients. A further Eeontex-based fabric sensor was presented in [20]: preliminary experimental tests were performed by measuring the pressure due to the feet loading on the fabric patch, and a non-linear relationship was found between conductivity and shape. Teyeme et al. presented a resistive strain sensor based on the Eeontex conductive fabric, which resulted in not very suitable for smart textile applications because it could detect only slow-varying pressures, it was not stable over time and was also affected by sweating [21]. Other authors presented a smart call detection system, named ePillow, intended for tetraplegic patients who strongly require a call system working without the need of pushing a button [22]. This system is based on Eeontex pressure fabric sensors, arranged in a matrix array configuration.
Martinez-Cesteros et al. presented MatVelo, a Velostat-based, low-cost, pressure-sensitive mat system for measuring displacements of the body center of pressure [23]. In [24], the mechanical and electrical properties of a Velostat-based pressure sensor were investigated. In [25] an unobtrusive, e-textile, Velostat-based pressure sensor was proposed to measure the respiration of newborn or preterm babies in Neonatal Intensive Care Units. Bucinskas et al. developed three Velostat-based foot pressure sensors for gait analysis, which were aimed at fall prevention [26]. Finally, a smart IoT system based on Velostat pressure sensors was developed to detect the position of people lying on a bed, with the aim of preventing bedsores in clinical or home settings [27].

1.2. Machines for Testing Force/Pressure Sensors

Accurate calibration of force sensors in dynamic conditions is obtained by exciting a loading mass fixed to the sensor by means of an electrodynamic shaker and accurately measuring its acceleration [28,29,30,31,32]. In general, shakers are used to impress sinusoidal vibrations and laser Doppler vibrometers are used to obtain the most accurate acceleration measurements [28,29,30,31,32]. The sensor to be tested is placed between the shaker head and the loading mass, while the laser vibrometer measures the acceleration of the loading mass, thus allowing us to measure the actual force impressed on the sensor. Auxiliary triaxial accelerometers are needed to monitor the rocking modes or side resonances of the transducer. This technology provides very accurate measurements, but it is particularly complex and generally used for frequencies ranging from tens to thousands of Hertz [30]. In addition, special adapters must be designed for proper mechanical connection of the force sensor. Finally, it has been shown that the intense magnetic field generated by electrodynamic shakers can degrade the operation of the force sensors, especially in the case of large-sized sensors tested with light loads and low-stress frequencies [33,34].
Other studies conducted dynamic tests on force sensors using commercial professional equipment of high complexity and cost. For example, Swanson et al. [35] used the MTM Instron 5944 (Instron Corporation, High Wycombe, UK) [36] to dynamically stress FSR sensors, with the aim of simulating typical stress conditions in lower limb prostheses. Dabling et al. [37] used the electromechanical system Alliance RT/5 (MTS, Eden Prairie, MN, USA) [38] to dynamically stress force sensors, in order to simulate the cyclic load in prosthetics, orthotics, or shoes.
Saadeh et al. [39] presented a much simpler electromechanical system for testing FSR sensors, based on a modular aluminum structure, a stepper/DC motor, an actuating rod, and a loaded spring to apply stresses with frequencies up to 10 Hz on a force sensor placed on a loadcell. The proposed machine utilizes appropriately profiled cams to generate sinusoidal compressions. The cams were fabricated via 3D printing of a plastic material. However, this study did not provide information on the accuracy of the forces generated, information on the stability of the mechanical contact on the cam, or the possible wear of the cam material. Another custom solution is suggested by Hall et al. [40].
In addition, commercial products with lower cost, but limited performance, are also available. For example, Tekscan (Norwood, MA, USA) sells a kit [41], based on a linear actuator and an Arduino nano, which allows for performing static calibrations and hysteresis/drift assessment of proprietary force sensors (FlexiForce®). Unfortunately, dynamic sensor testing cannot be performed with this kit.

1.3. Rationale

Each of the sensors described in Section 1.1, especially those that are custom-made, special, or adapted, needs individual calibration and verification before being used. In particular, for a variety of applications, including wearables for monitoring human movement, respiration, and other physiological functions [18], it is necessary to verify that the sensor bandwidth fits the frequency content of the input signal, which is usually at low or very low frequencies.
The various calibration systems reported in literature and available on the market, such as those listed in Section 1.2, are particularly complex and expensive. Most of them do not support test protocols with particularly low frequencies and light loads. In addition, commercial mechanical test systems usually do not allow simultaneous recording of their internal mechanical parameters and the electrical output of the sensor under test.
This study presents a relatively simple and inexpensive machine that is capable of generating sinusoidal stresses at both very low frequencies and light loads, thus reproducing typical stress conditions of sensors for human body measurements. The proposed machinery is scalable, customizable, open-source, and does not generate appreciable magnetic disturbances. It offers acceptable measurement accuracy and the ability to synchronously record mechanical and electrical sensor signals.

2. Materials and Methods

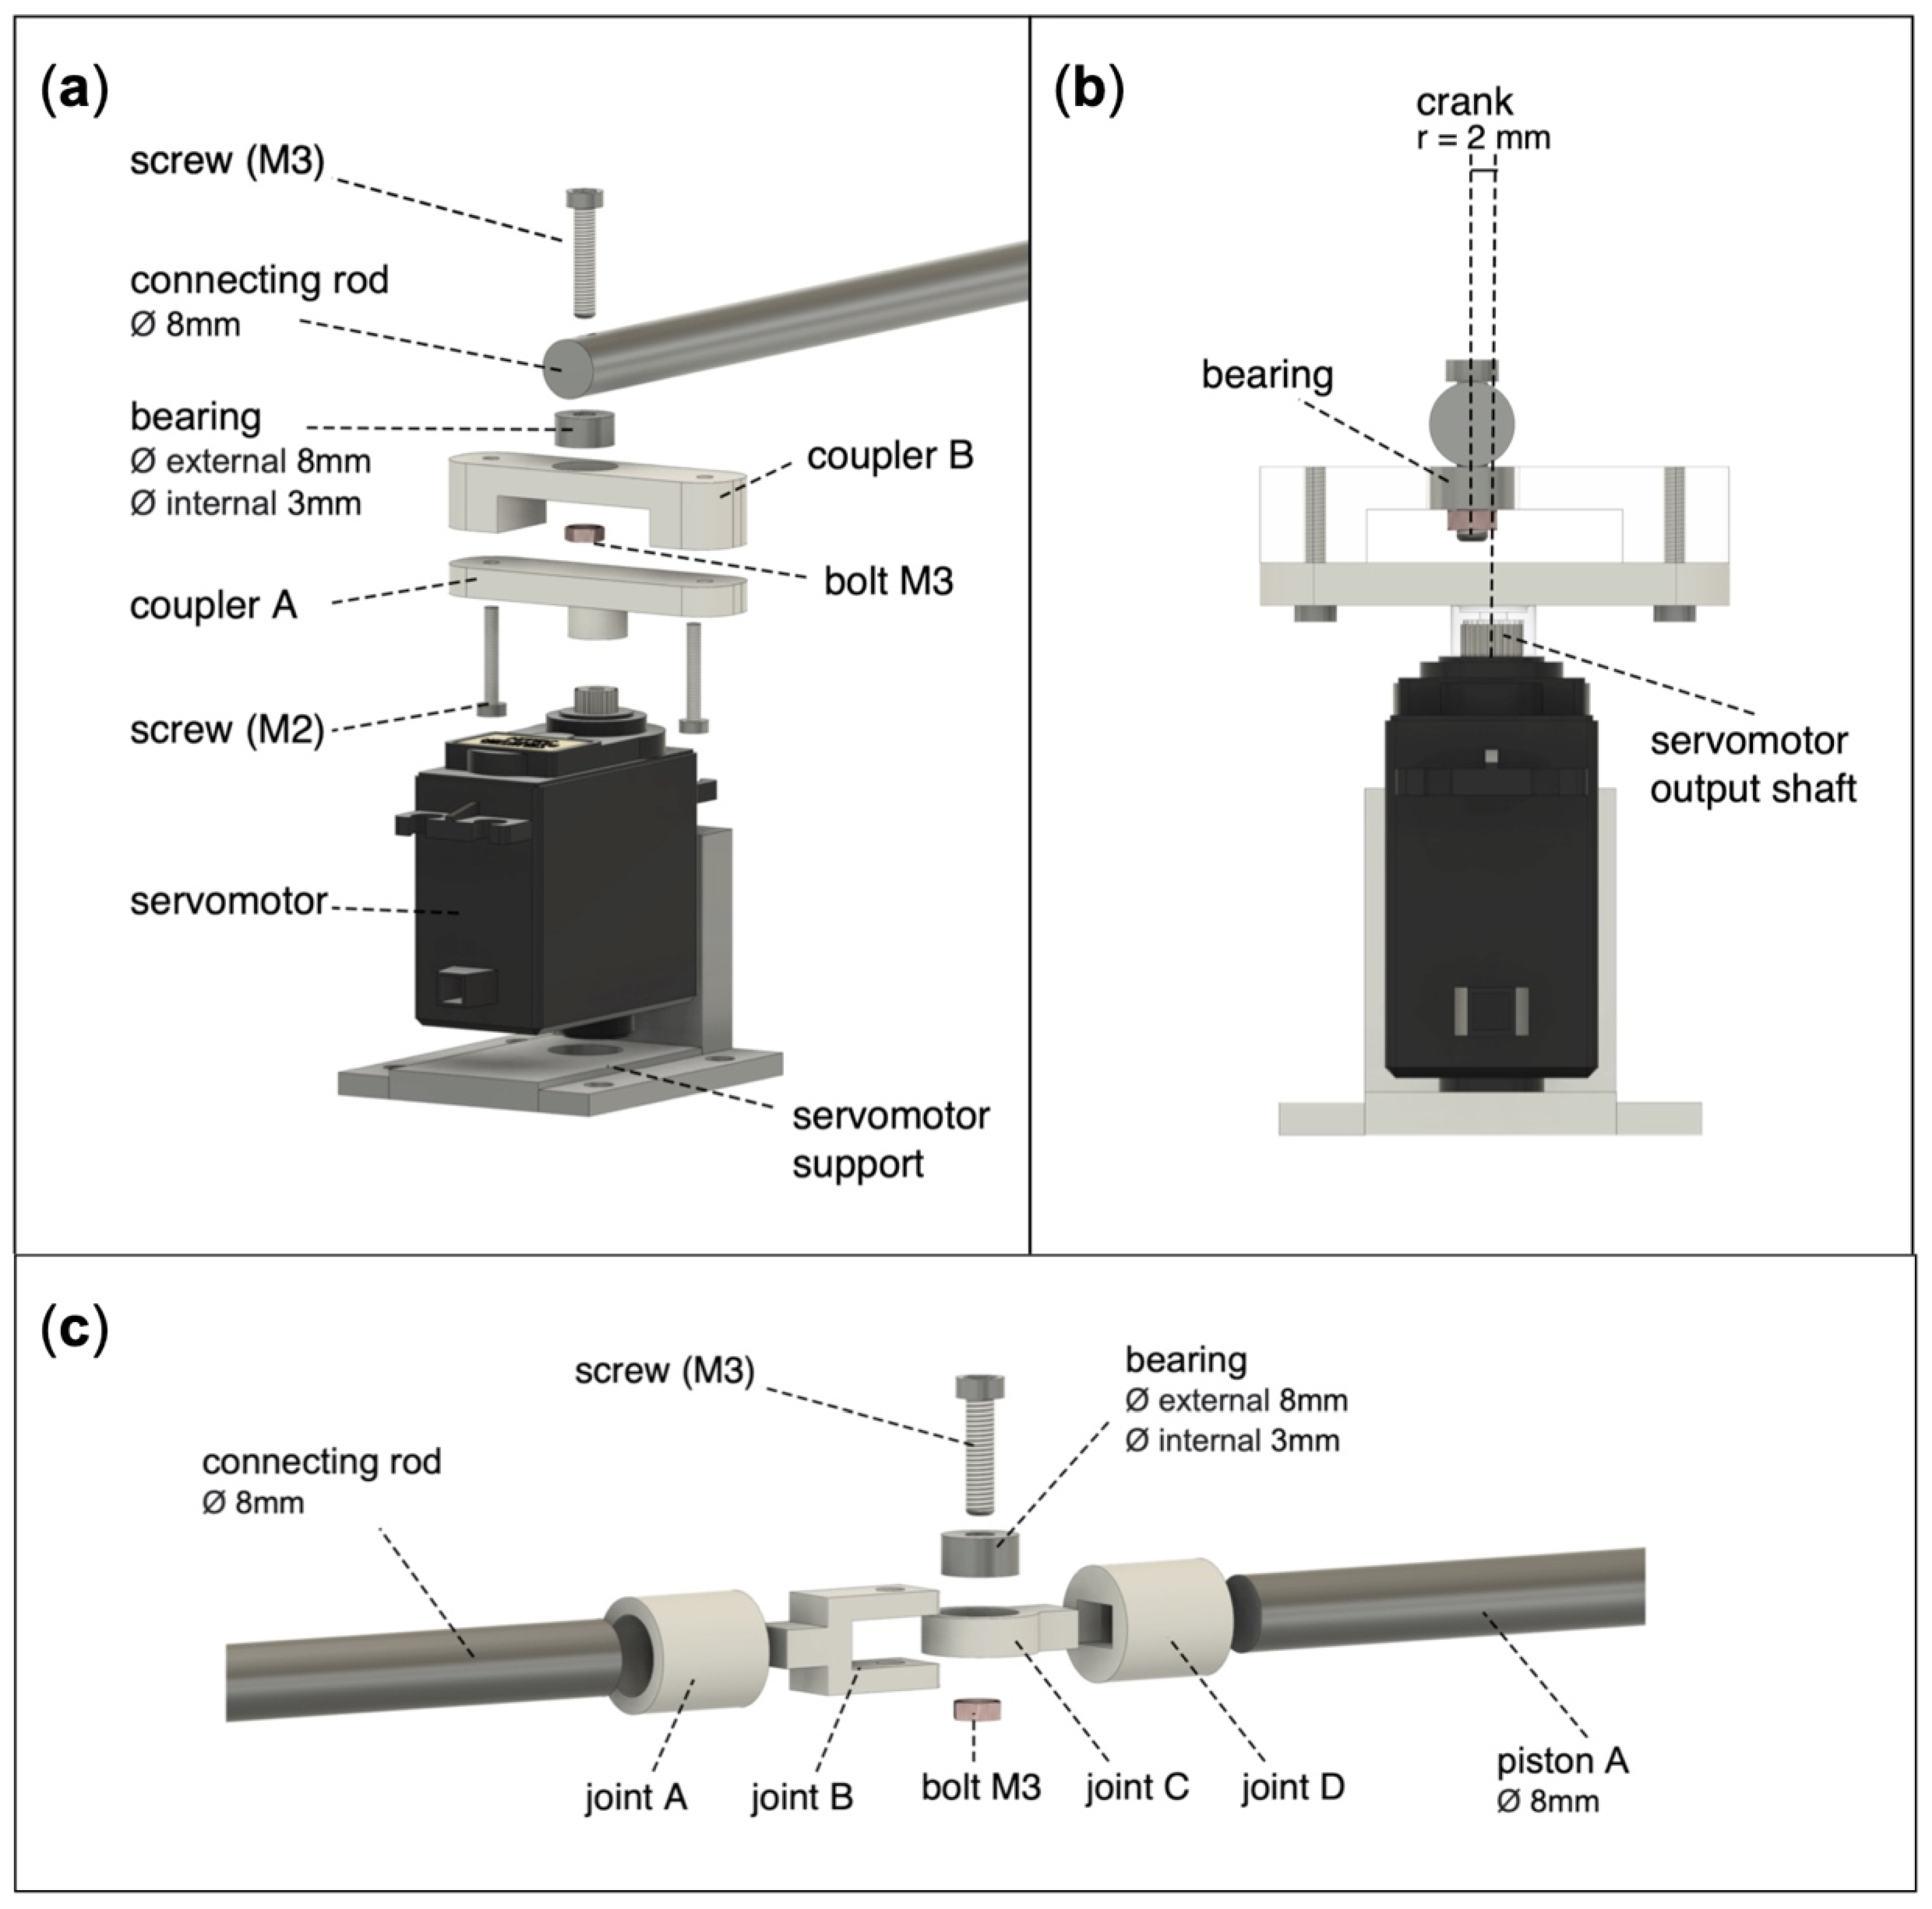
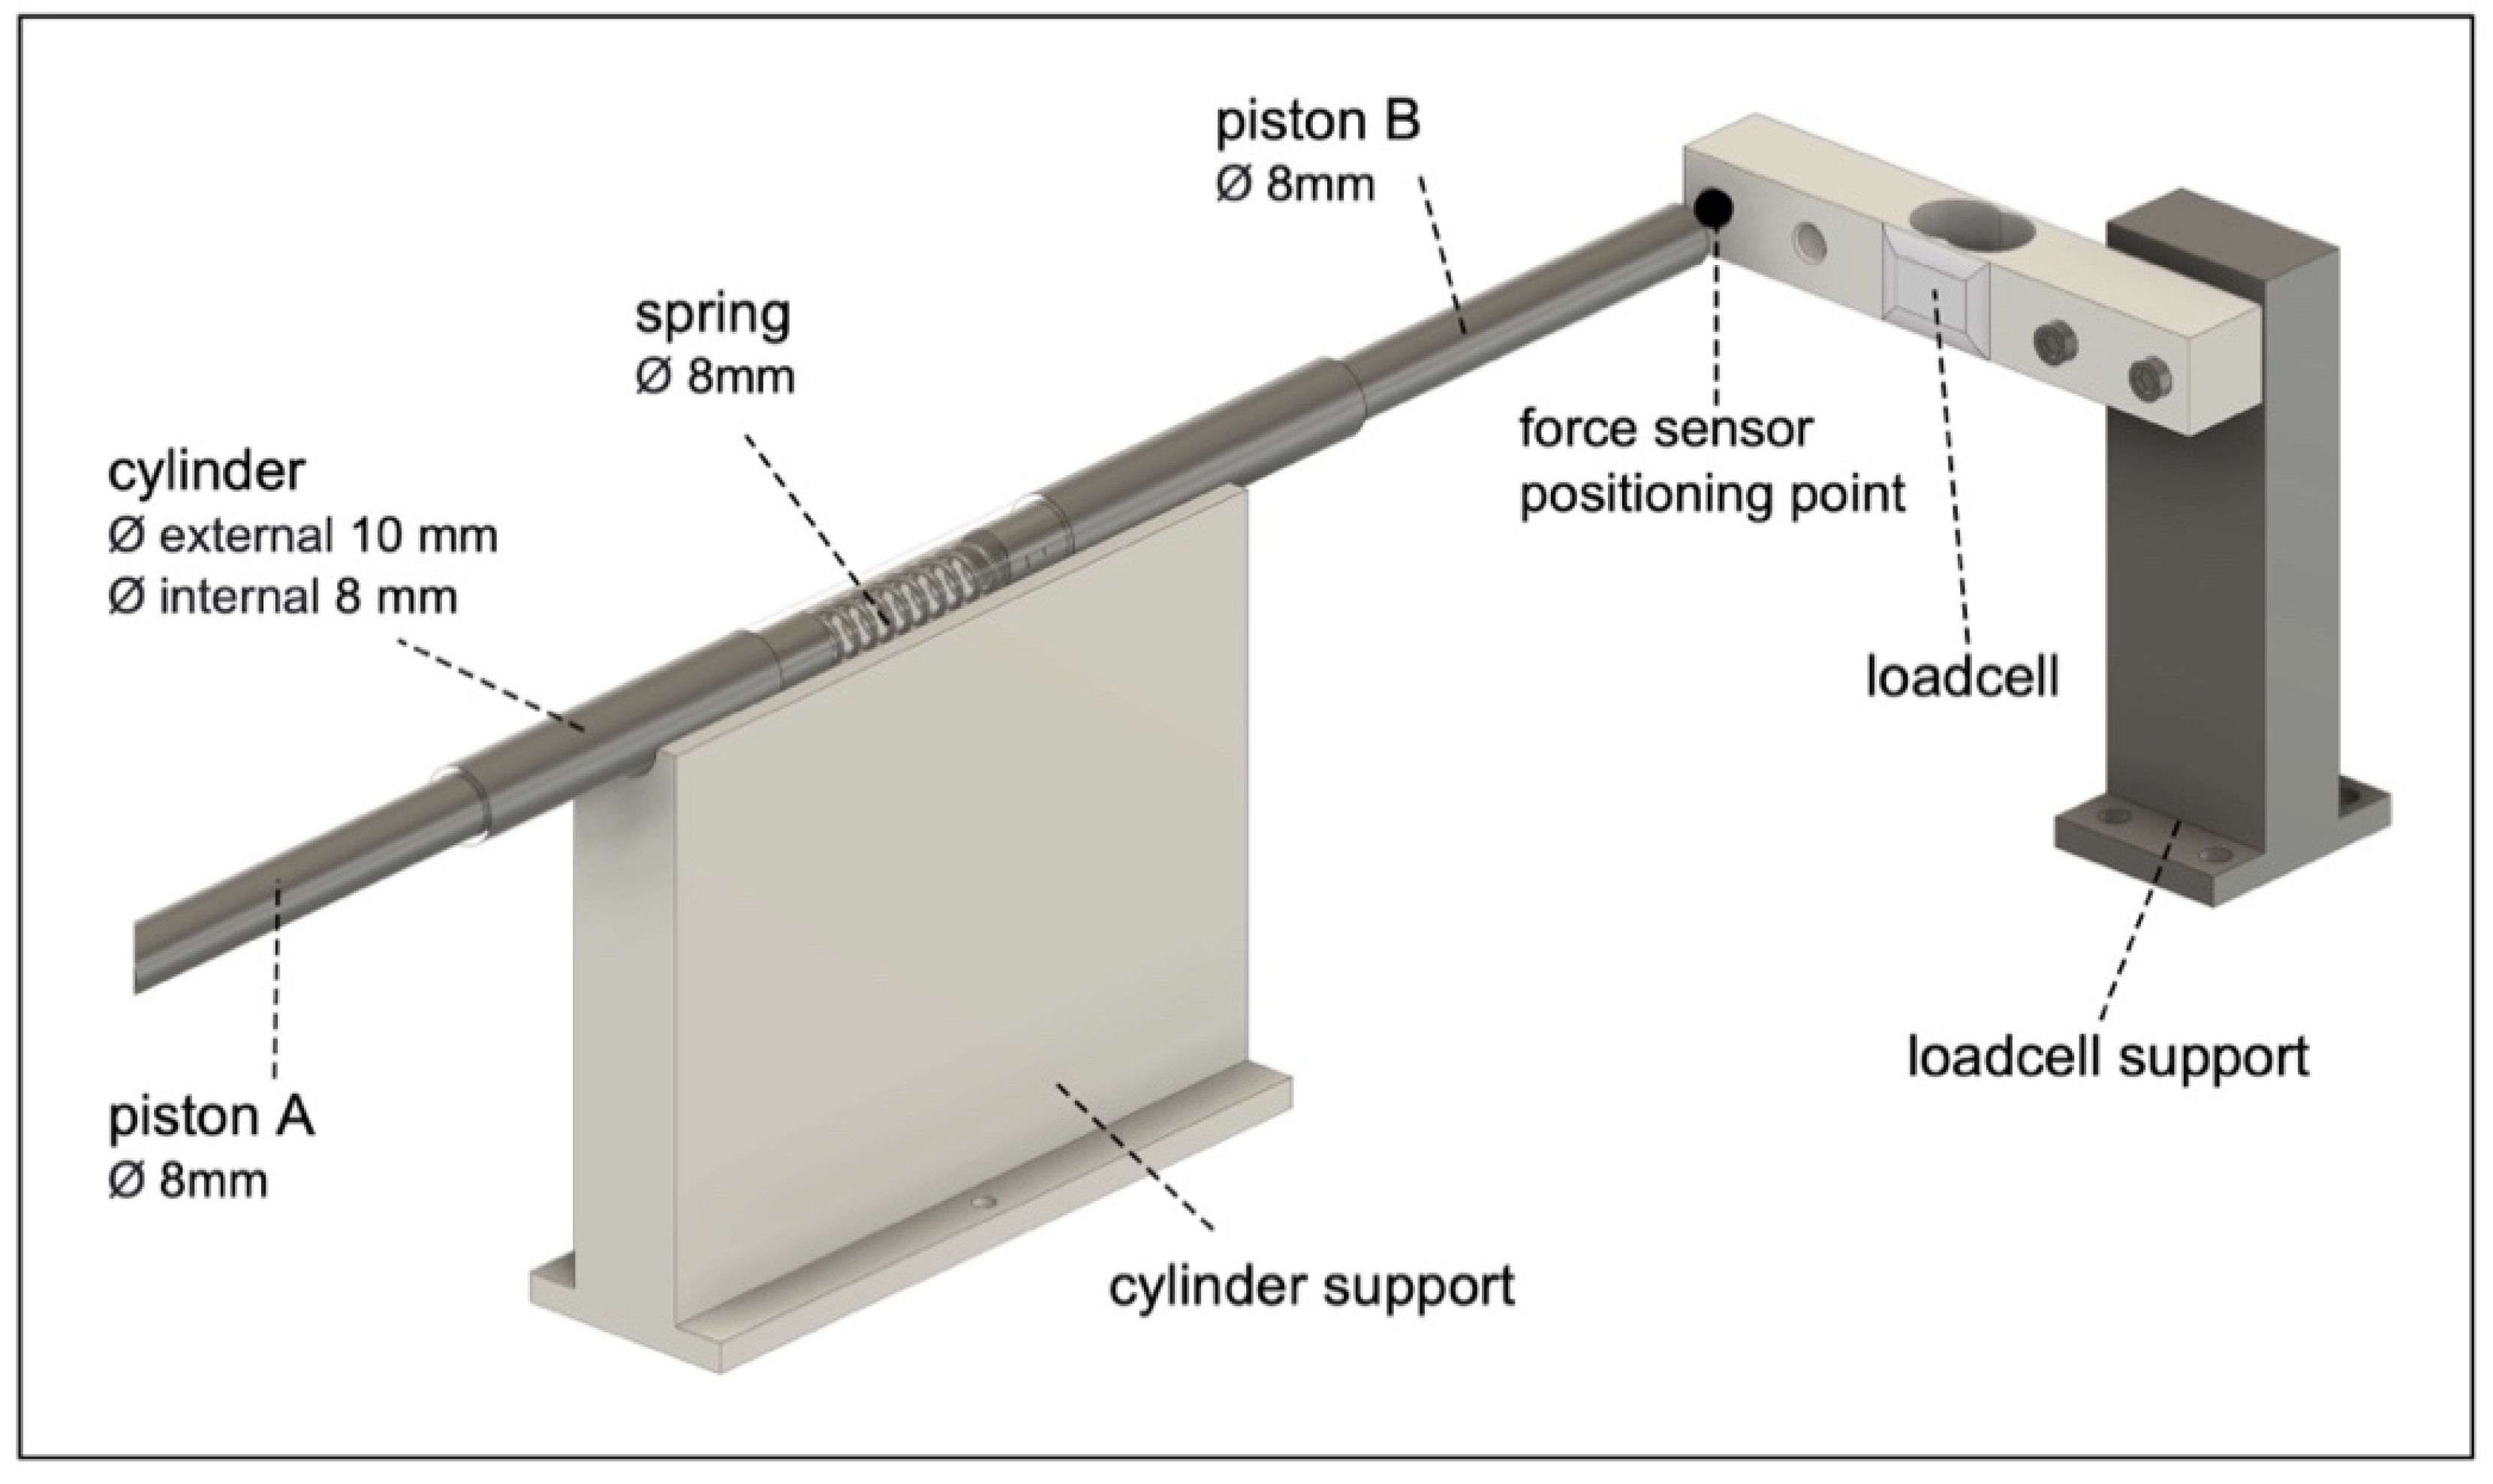
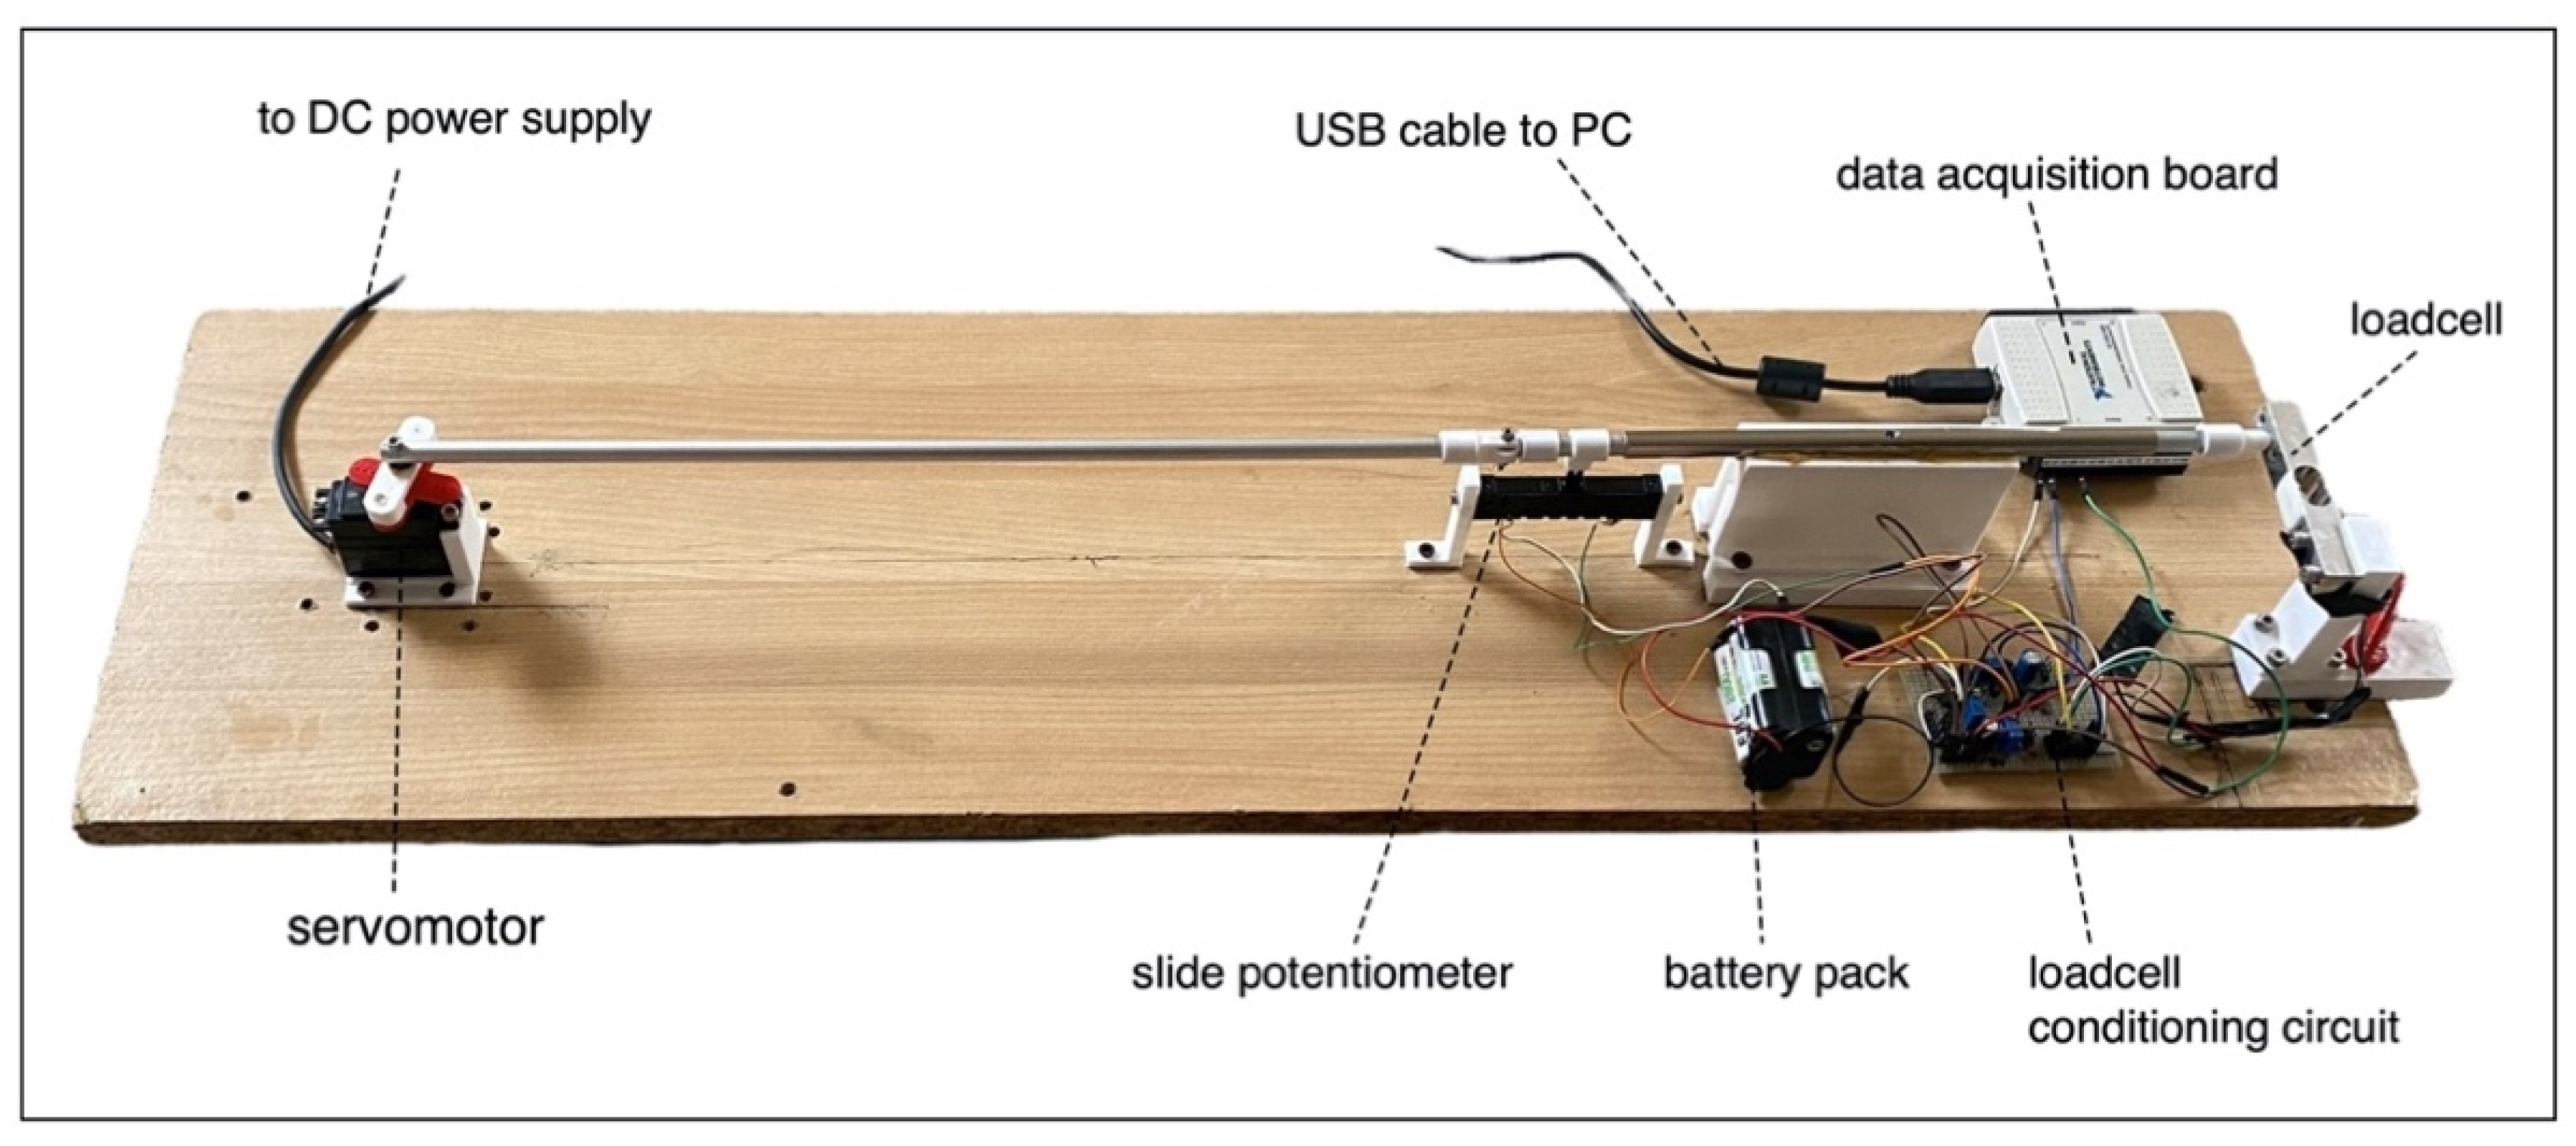
2.1. Electromechanical System Design and Operation

The electromechanical actuation system can be powered by a DC or stepper motor, connected to a gearbox to reduce the rotational velocity and increase the torque. For more convenience, the experimented setup used a custom continuous rotation servomotor, already equipped with a reduction gearbox. Specifically, starting with the Hitec HSR 5990TG servo motor (Hitec RCD, San Diego, CA, USA) [42], the lock for rotations greater than 180° was manually removed and the control board was bypassed, by directly connecting the DC motor to an AC/DC power supply.
The output shaft of the servomotor was connected to an ad-hoc designed crank—rod mechanism [43], as depicted in the exploded view rendering of Figure 1A. By means of 2-level couplers (coupler A and B) for the motor output shaft, it was possible to make a crank with a radius of only 2 mm (see Figure 1B), so as to have a total displacement of piston A of 4 mm, which was measured by means of a slide potentiometer. The connecting rod, with a length of 40 cm, was in turn connected to piston A via a joint rotating in the horizontal plane (see Figure 1C). The connecting rod—crank mechanism enabled the rotary movement of the crank to be transformed into the axial movement of piston A. In particular, thanks to a very low ratio between the crank radius and the connecting rod length ( 5 × 10 3 in the experimented design), the foot travel (T) of piston A approximates a sinusoidal waveform [43], as reported in Equation (1):
T = C ( 1 c o s α ) + R ( 1 1 ( C / R ) 2 s i n 2 α
where T is the foot travel, C is the crank radius, R is the connecting rod length, and α is the crank angle.
Figure 2 shows that the axial motion of piston A is transmitted to piston B through a spring with a known elastic constant (about 35     gf / mm ). The coupling between piston A, spring, and piston B occurs within a linear guide consisting of a hollow cylinder, suitably lubricated to minimize friction. Moreover, the use of different materials for pistons and cylinders, respectively, made of aluminum and steel, also helps reduce friction [44].
The back of the force sensor to be tested rests on the surface of a single axis loadcell, which provides an accurate measurement of the forces impressed on the sensor under test. The end of piston B can be outfitted with a 3D-printed rigid coupler to change the geometry and the area of contact with the force sensor. Ultimately, the force impressed by piston B on the sensor under test is given by Hooke’s Law, as shown in Equation (2):
F = k × T
where F is the force, k is the elastic constant of the spring, and T is the foot travel of piston A.
A 5 V battery pack powers the loadcell, the sensor under test, and the slide potentiometer of 4.7 kΩ, which was fixed to piston A.
Figure 3 shows the whole electromechanical system used in the experimental tests. All the supports, adapters, and couplers were designed in 3D via Fusion 360® (Autodesk, San Rafael, CA, USA) and materialized in polylactic acid (PLA) with a 3D printer (Dreamer NX, FlashForge 3D Technology, Jinhua, China). CAD files and assembly instructions are provided as Supplementary Materials.
The approximate costs for the realization of the electromechanical system, excluding the acquisition board, are shown in Table 1. The higher cost was due to the servomotor “Hitec HSR-5990TG”, while costs related to 3D-printed and other metal components were much more affordable.

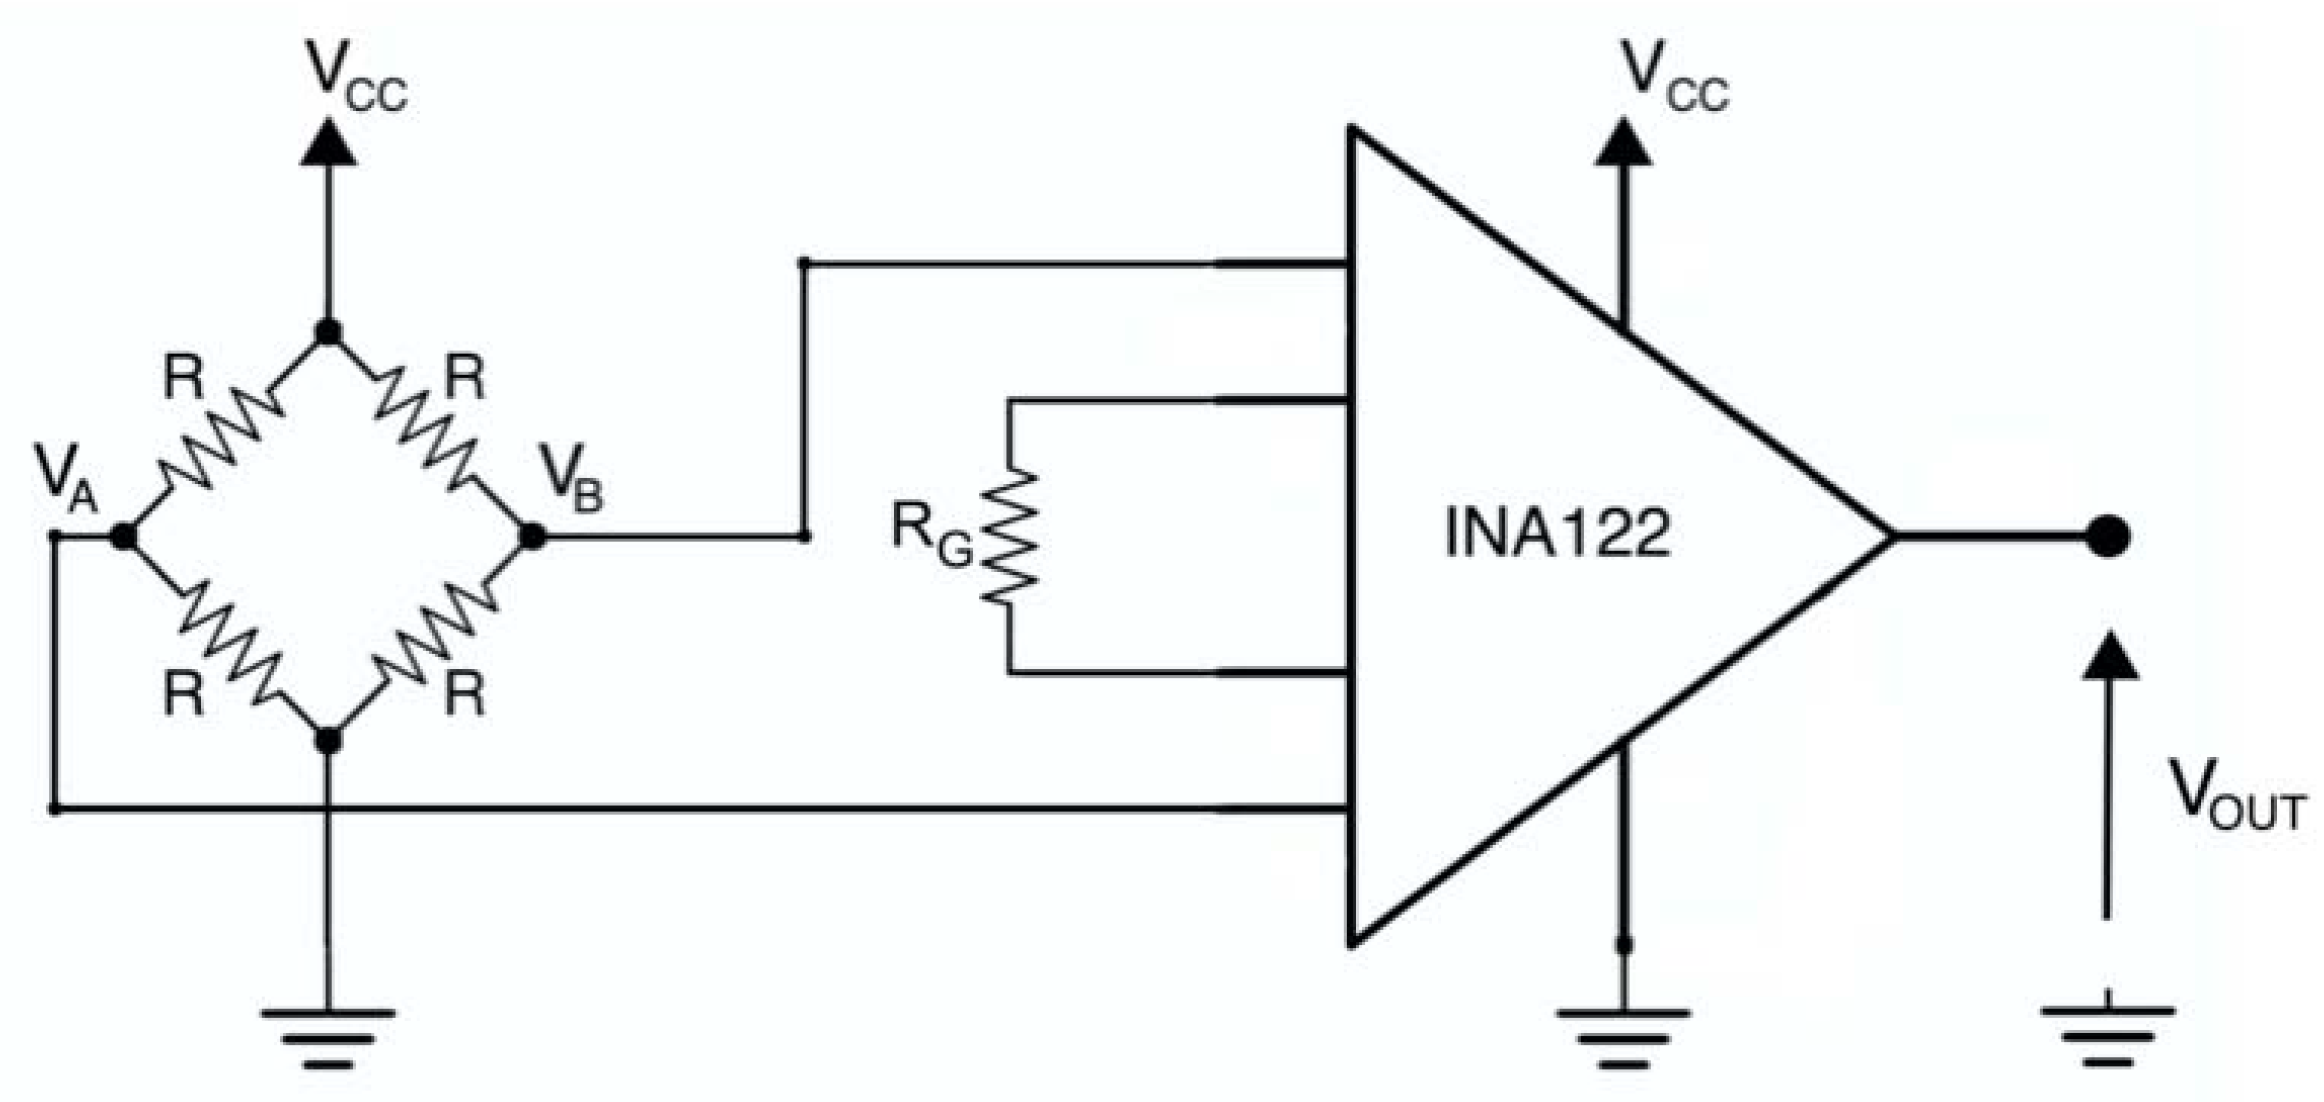
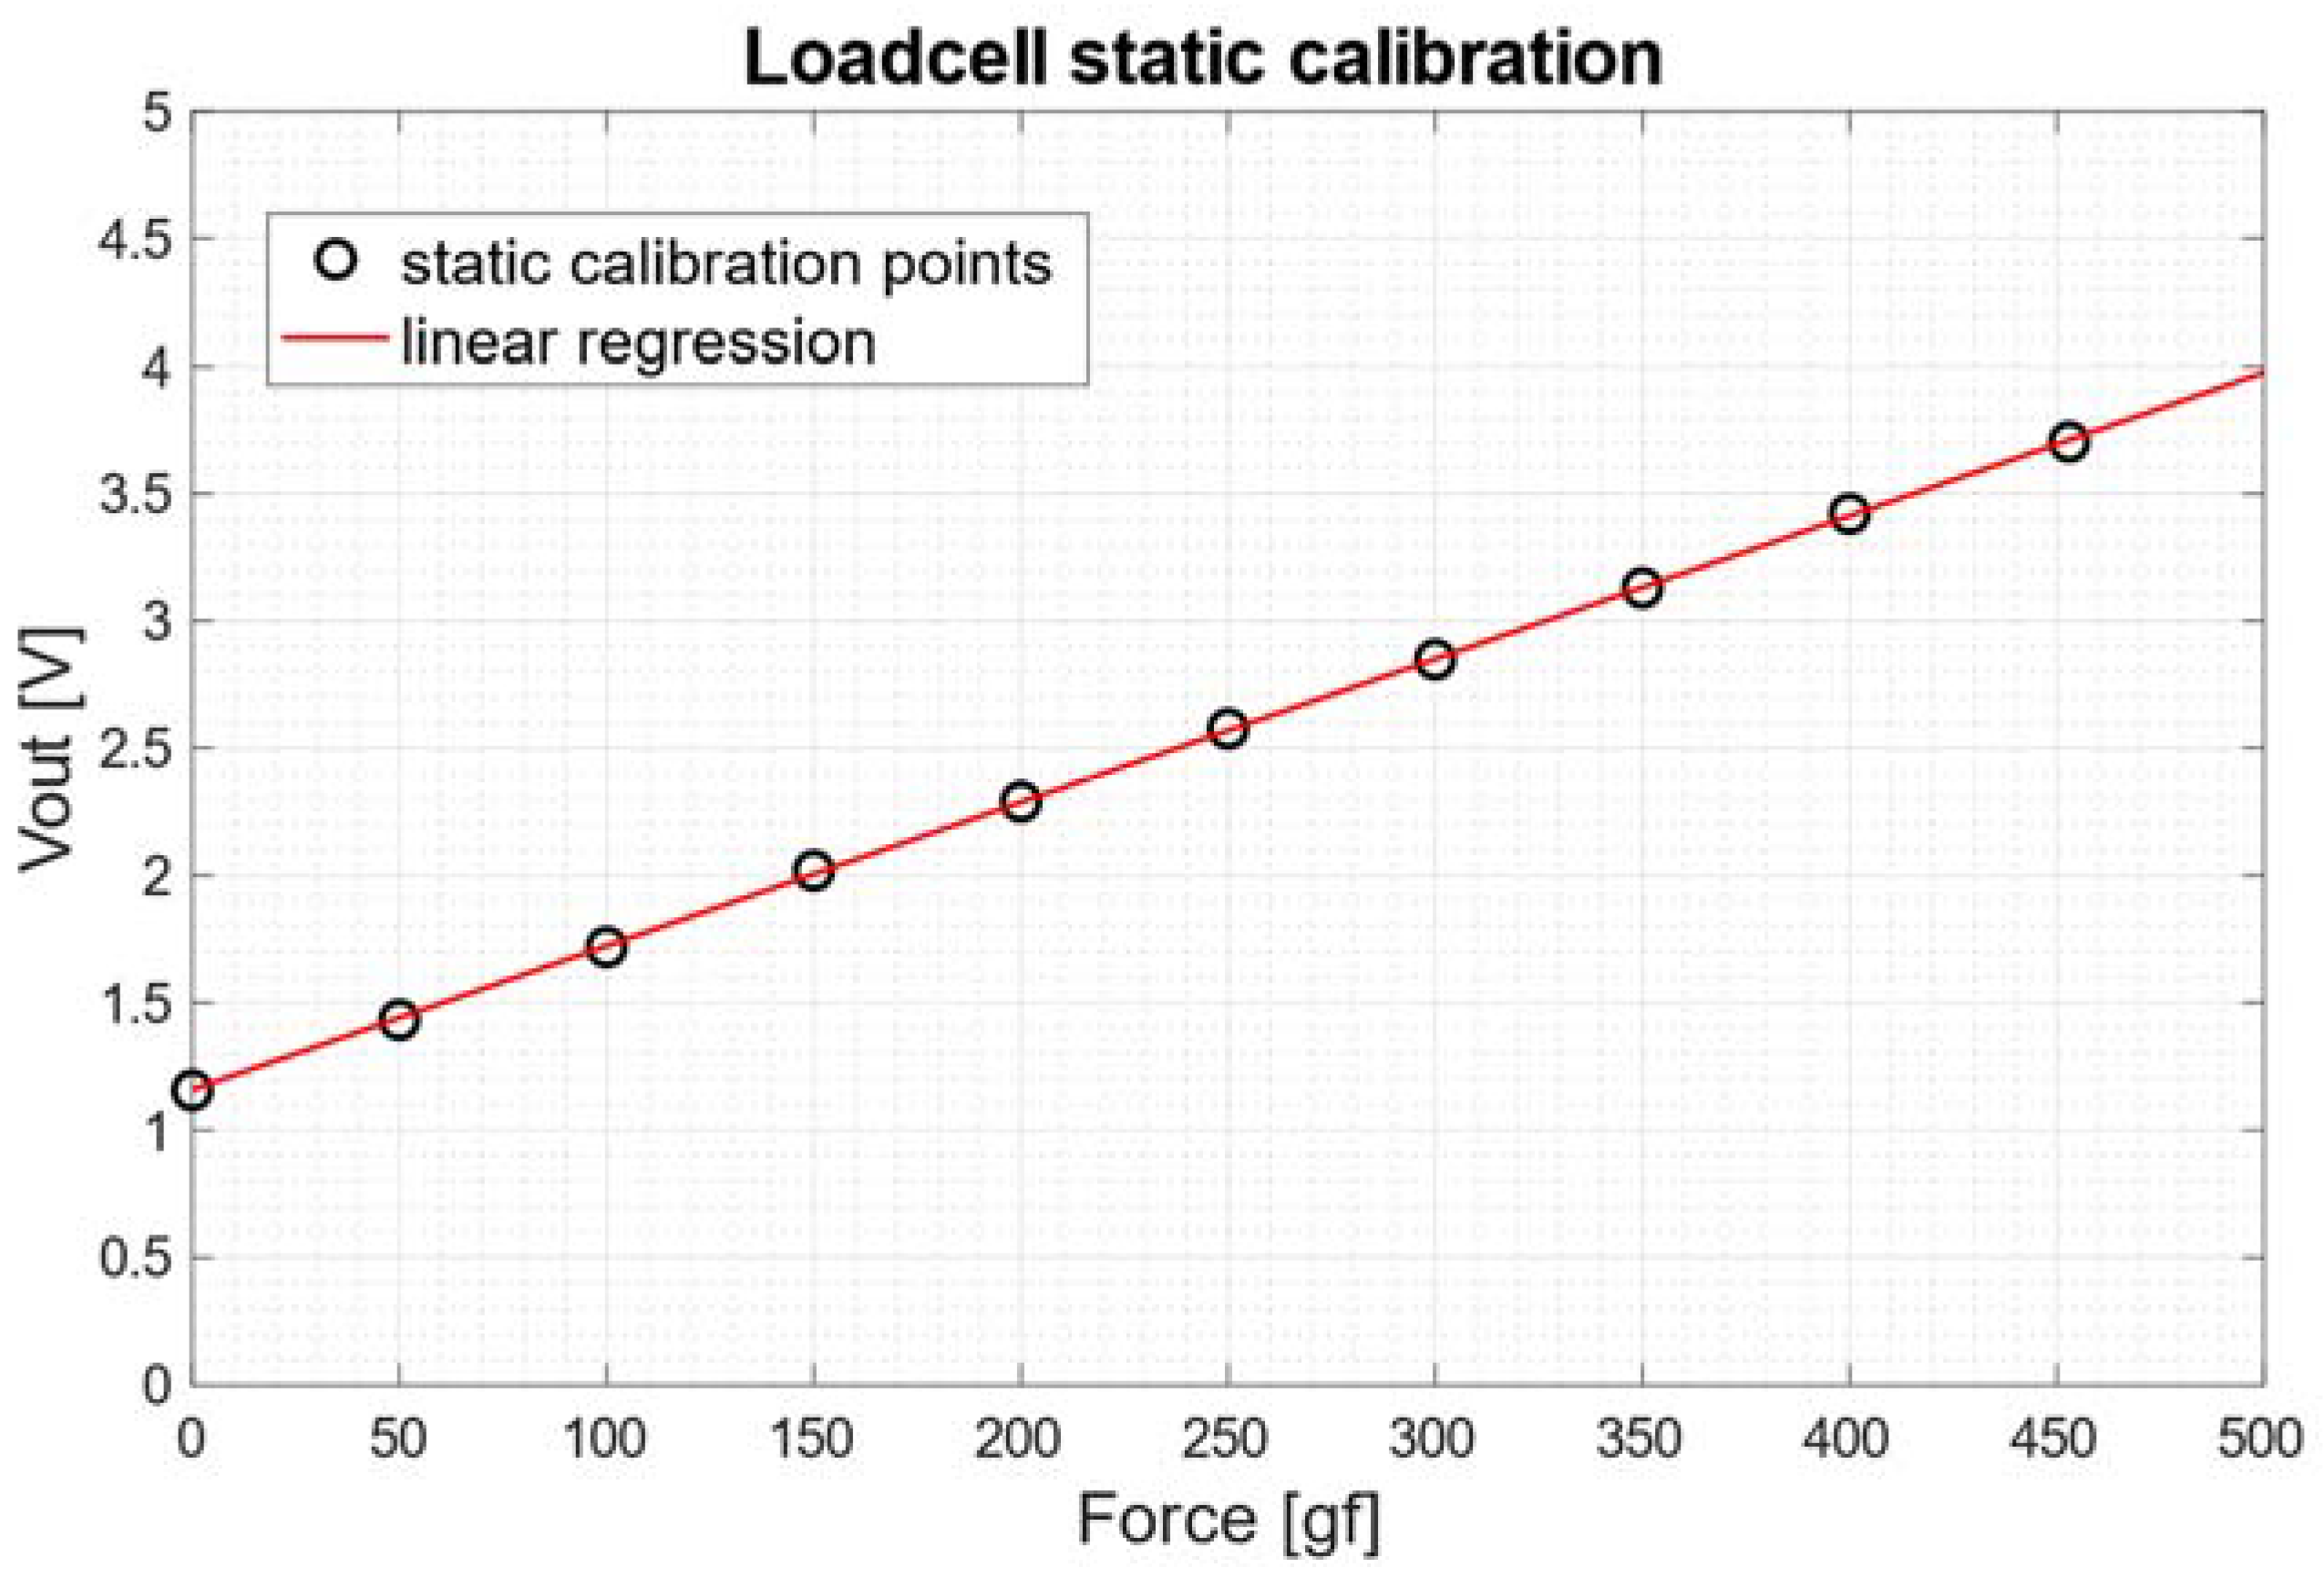
2.2. Loadcell and its Conditioning Circuit

The single-axis load cell consisted of an aluminum bar and 4 strain gauges with a resting resistance of 1 kΩ, arranged in a full Wheatstone bridge circuit. The strain gauges were properly attached to the bar close to each other, to ensure insensitivity to temperature changes, and in such a way that 2 of them worked in compression and 2 in tension, as this configuration increases the sensitivity of the Wheatstone bridge [4].
The output voltage of the Wheatstone bridge was amplified by means of an instrumentation amplifier (INA122) [45], and the gain resistor RG was set to 100 Ω (see Figure 4), providing a gain of about 2000 V/V.
The Equation (3) describing the output voltage from the loadcell conditioning circuit is showed below:
V O U T = G (   V A V B ) = G   Δ R R   V C C
where G ≈ 2000 is the gain set for the INA122, ΔR is the resistance variation exhibited by the strain gauges of the load cell when subjected to a certain load, R = 1 kΩ is the resistance of the strain gauges at rest, and VCC = 5 V is the supply voltage of the Wheatstone bridge and the INA 122.
A static calibration of the loadcell was performed by fixing one end, applying known suspended weights to the other end, and then recording the corresponding output voltages.

2.3. Electromechanical System Testing

Recordings were carried out at different motor supply voltages, provided by an AC/DC power supply: from 1 V to 9 V in steps of 1 V. In view of the type of servomotor used, application of higher voltages was not feasible. The force impressed by piston B and the displacement of piston A were both measured by a data acquisition board (NI USB-6009, National Instruments, Austin, TX, USA), by simultaneously recording the output voltages of the loadcell conditioning circuit and the slide potentiometer at 1 kHz with 12-bit resolution.
A first test was aimed at determining the relationship between the motor supply voltage, which is related to its rotational speed, and the sinusoidal stress frequency generated. In addition, the total harmonic distortion (THD) was computed to assess the purity of the sinusoidal stress delivered. In particular, the THD referred to the fundamental frequency was computed as the ratio of the RMS value of the sum of all higher harmonics to the RMS of the fundamental component [46], as reported in Equation (4):
T H D   [ % ] = k = 2 n V k 2 V 1 × 100
where V1 is the RMS of the fundamental, Vk is the RMS of kth harmonic, and n is the number of higher harmonics considered (up to the Nyquist limit).
A further test was aimed at verifying the relationship between the force exerted by piston A as a function of its displacement. In detail, the end of piston B is placed in direct contact with the loadcell, so that during the compression-release cycles, the excursion of piston A is largely absorbed by the spring, which will shorten/lengthen by the same amount as the forward/backward displacement of the piston A, while the force exerted by piston A is totally transferred to piston B and in turn to the loadcell.
By knowing the force exerted by piston A and its displacement, the work needed to operate the electromechanical system can be computed. The amount of work corresponds to the area under the force-displacement curve, as explained in Equation (5):
W = 0 L F ( x ) d x
where W is the work, x is the displacement of piston A, F(x) is the functional relationship between the displacement and the force impressed by piston A, and L is the maximum displacement of piston A, which was expected to be about 4 mm for a crank radius of 2 mm. After computation of the work spent in compression and release of the spring for one stress cycle, the hysteresis was computed according to Equation (6):
H y s t e r e s i s   [ gf   mm ] = W o r k r e l e a s e [ gf   mm ] W o r k c o m p r e s s i o n [ gf   mm ]  

2.4. Testing Force Sensors for Biomedical Applications

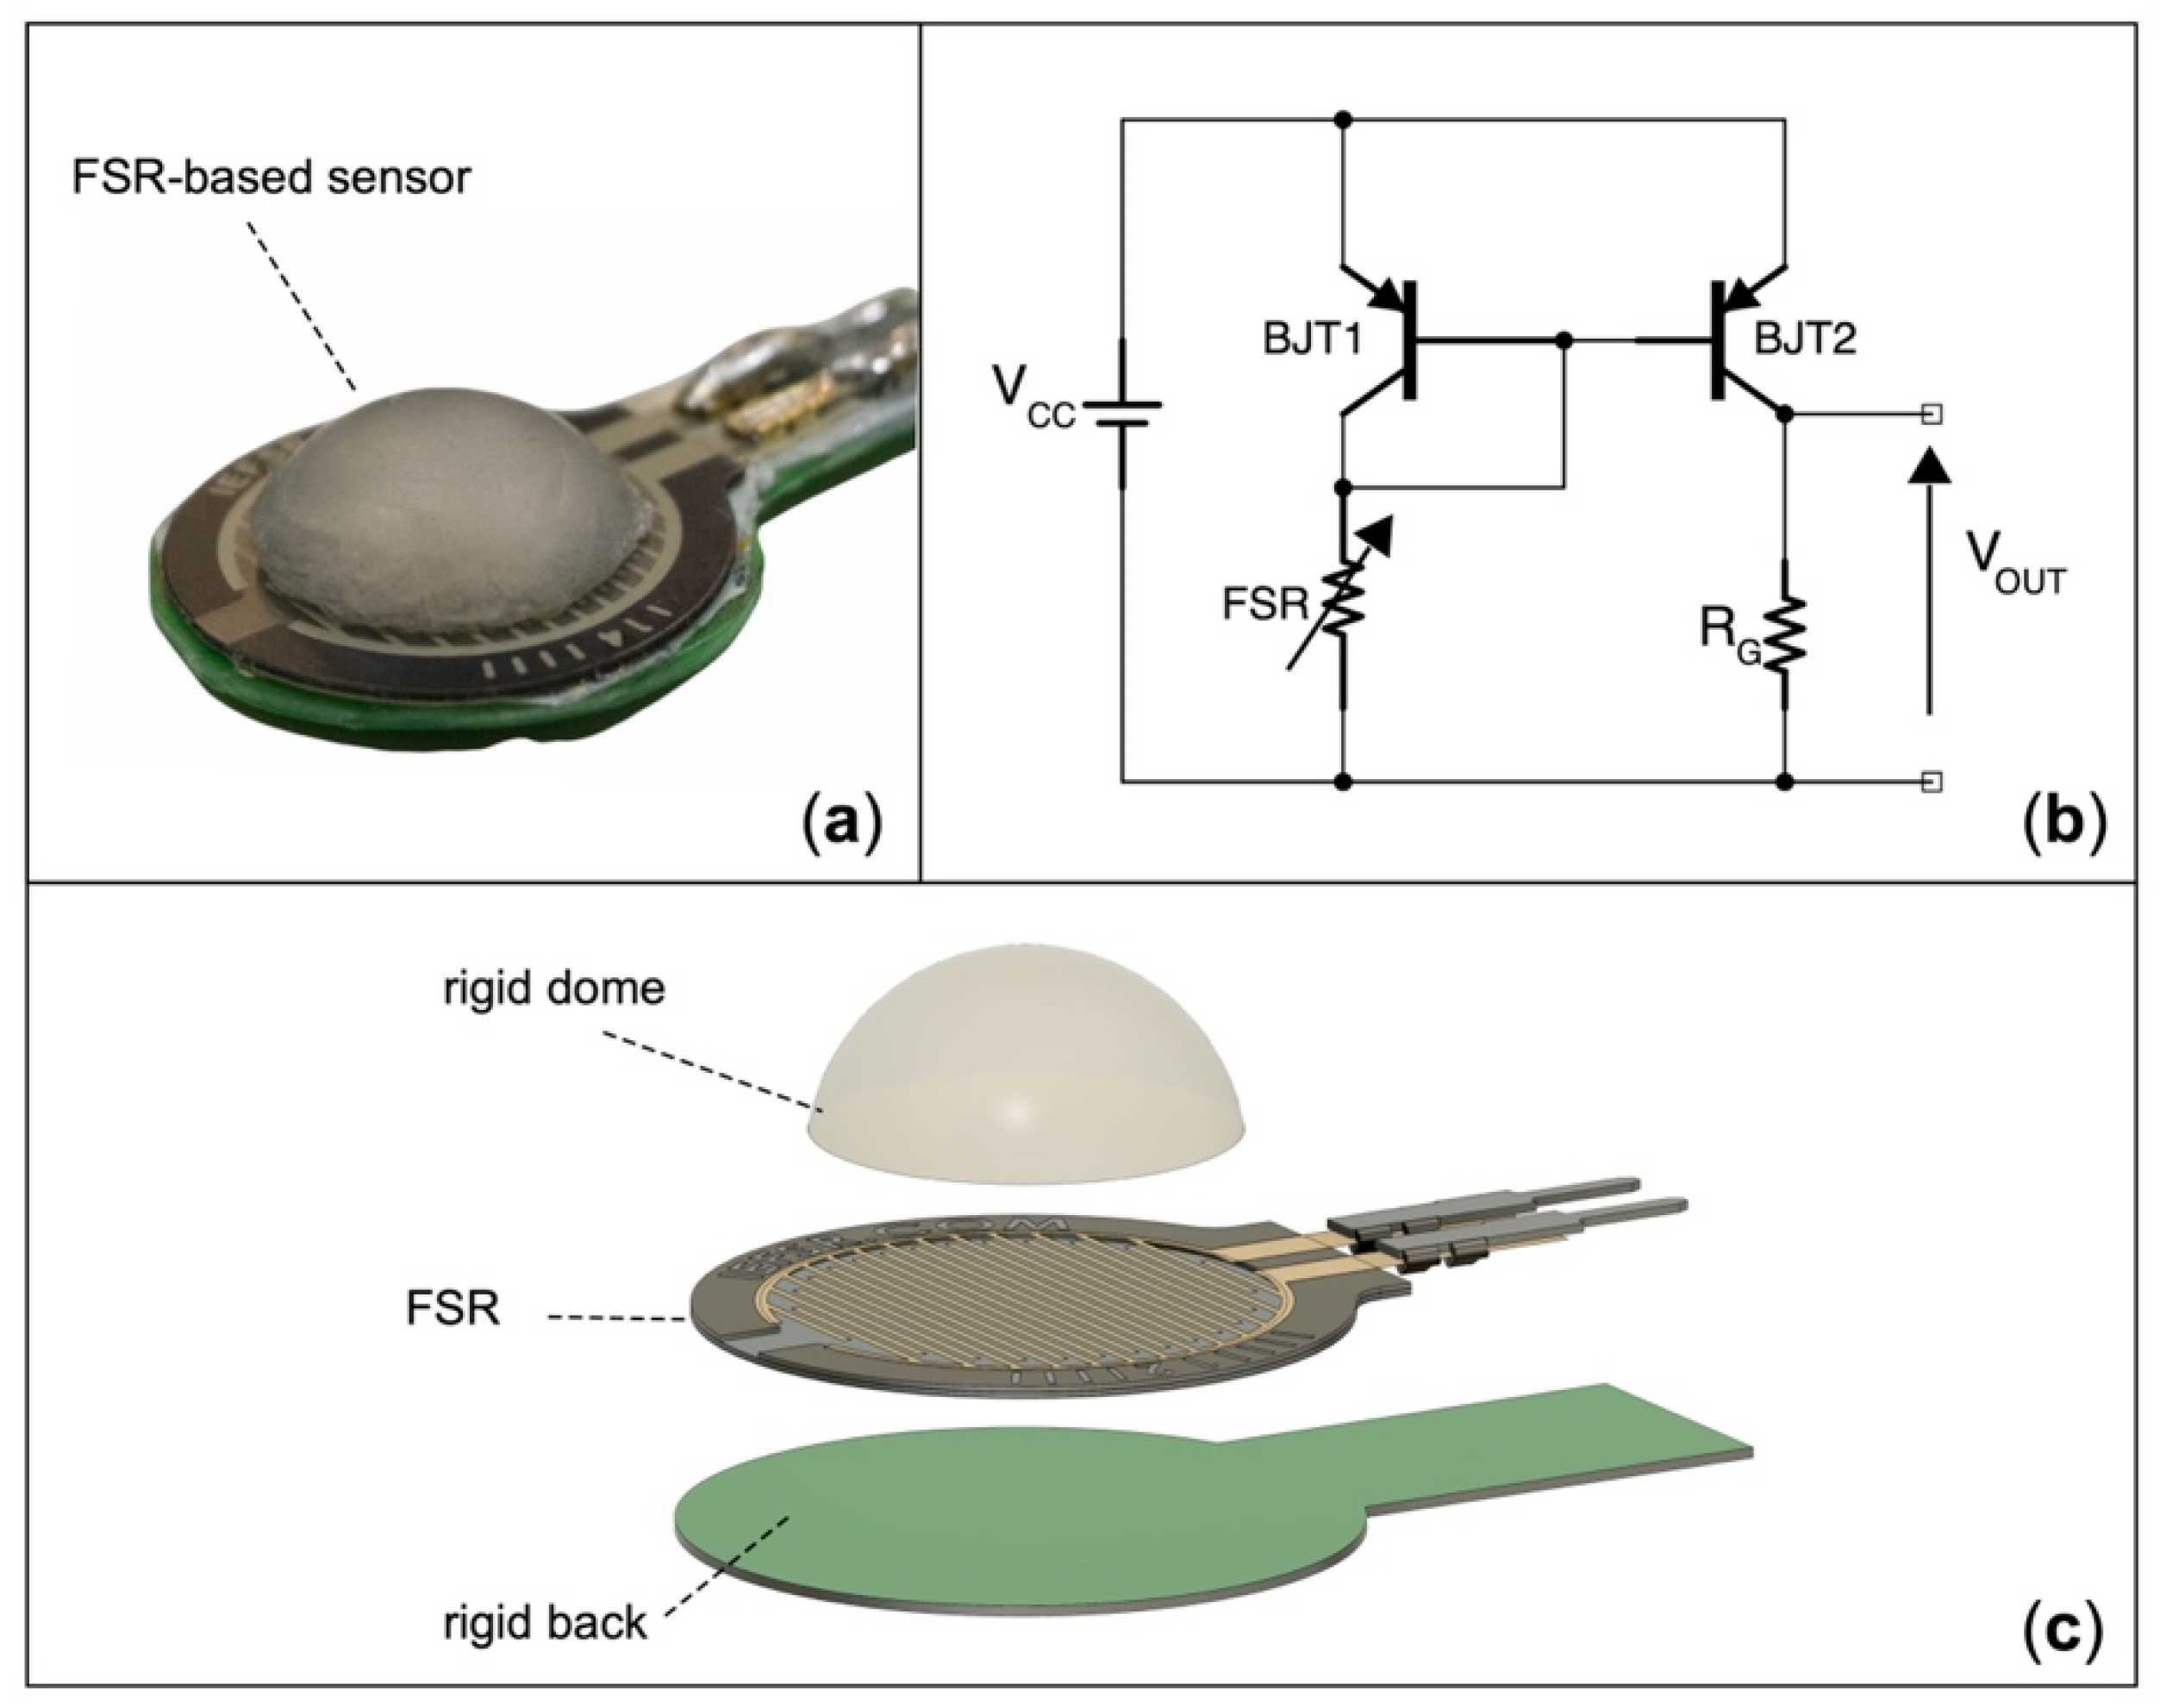
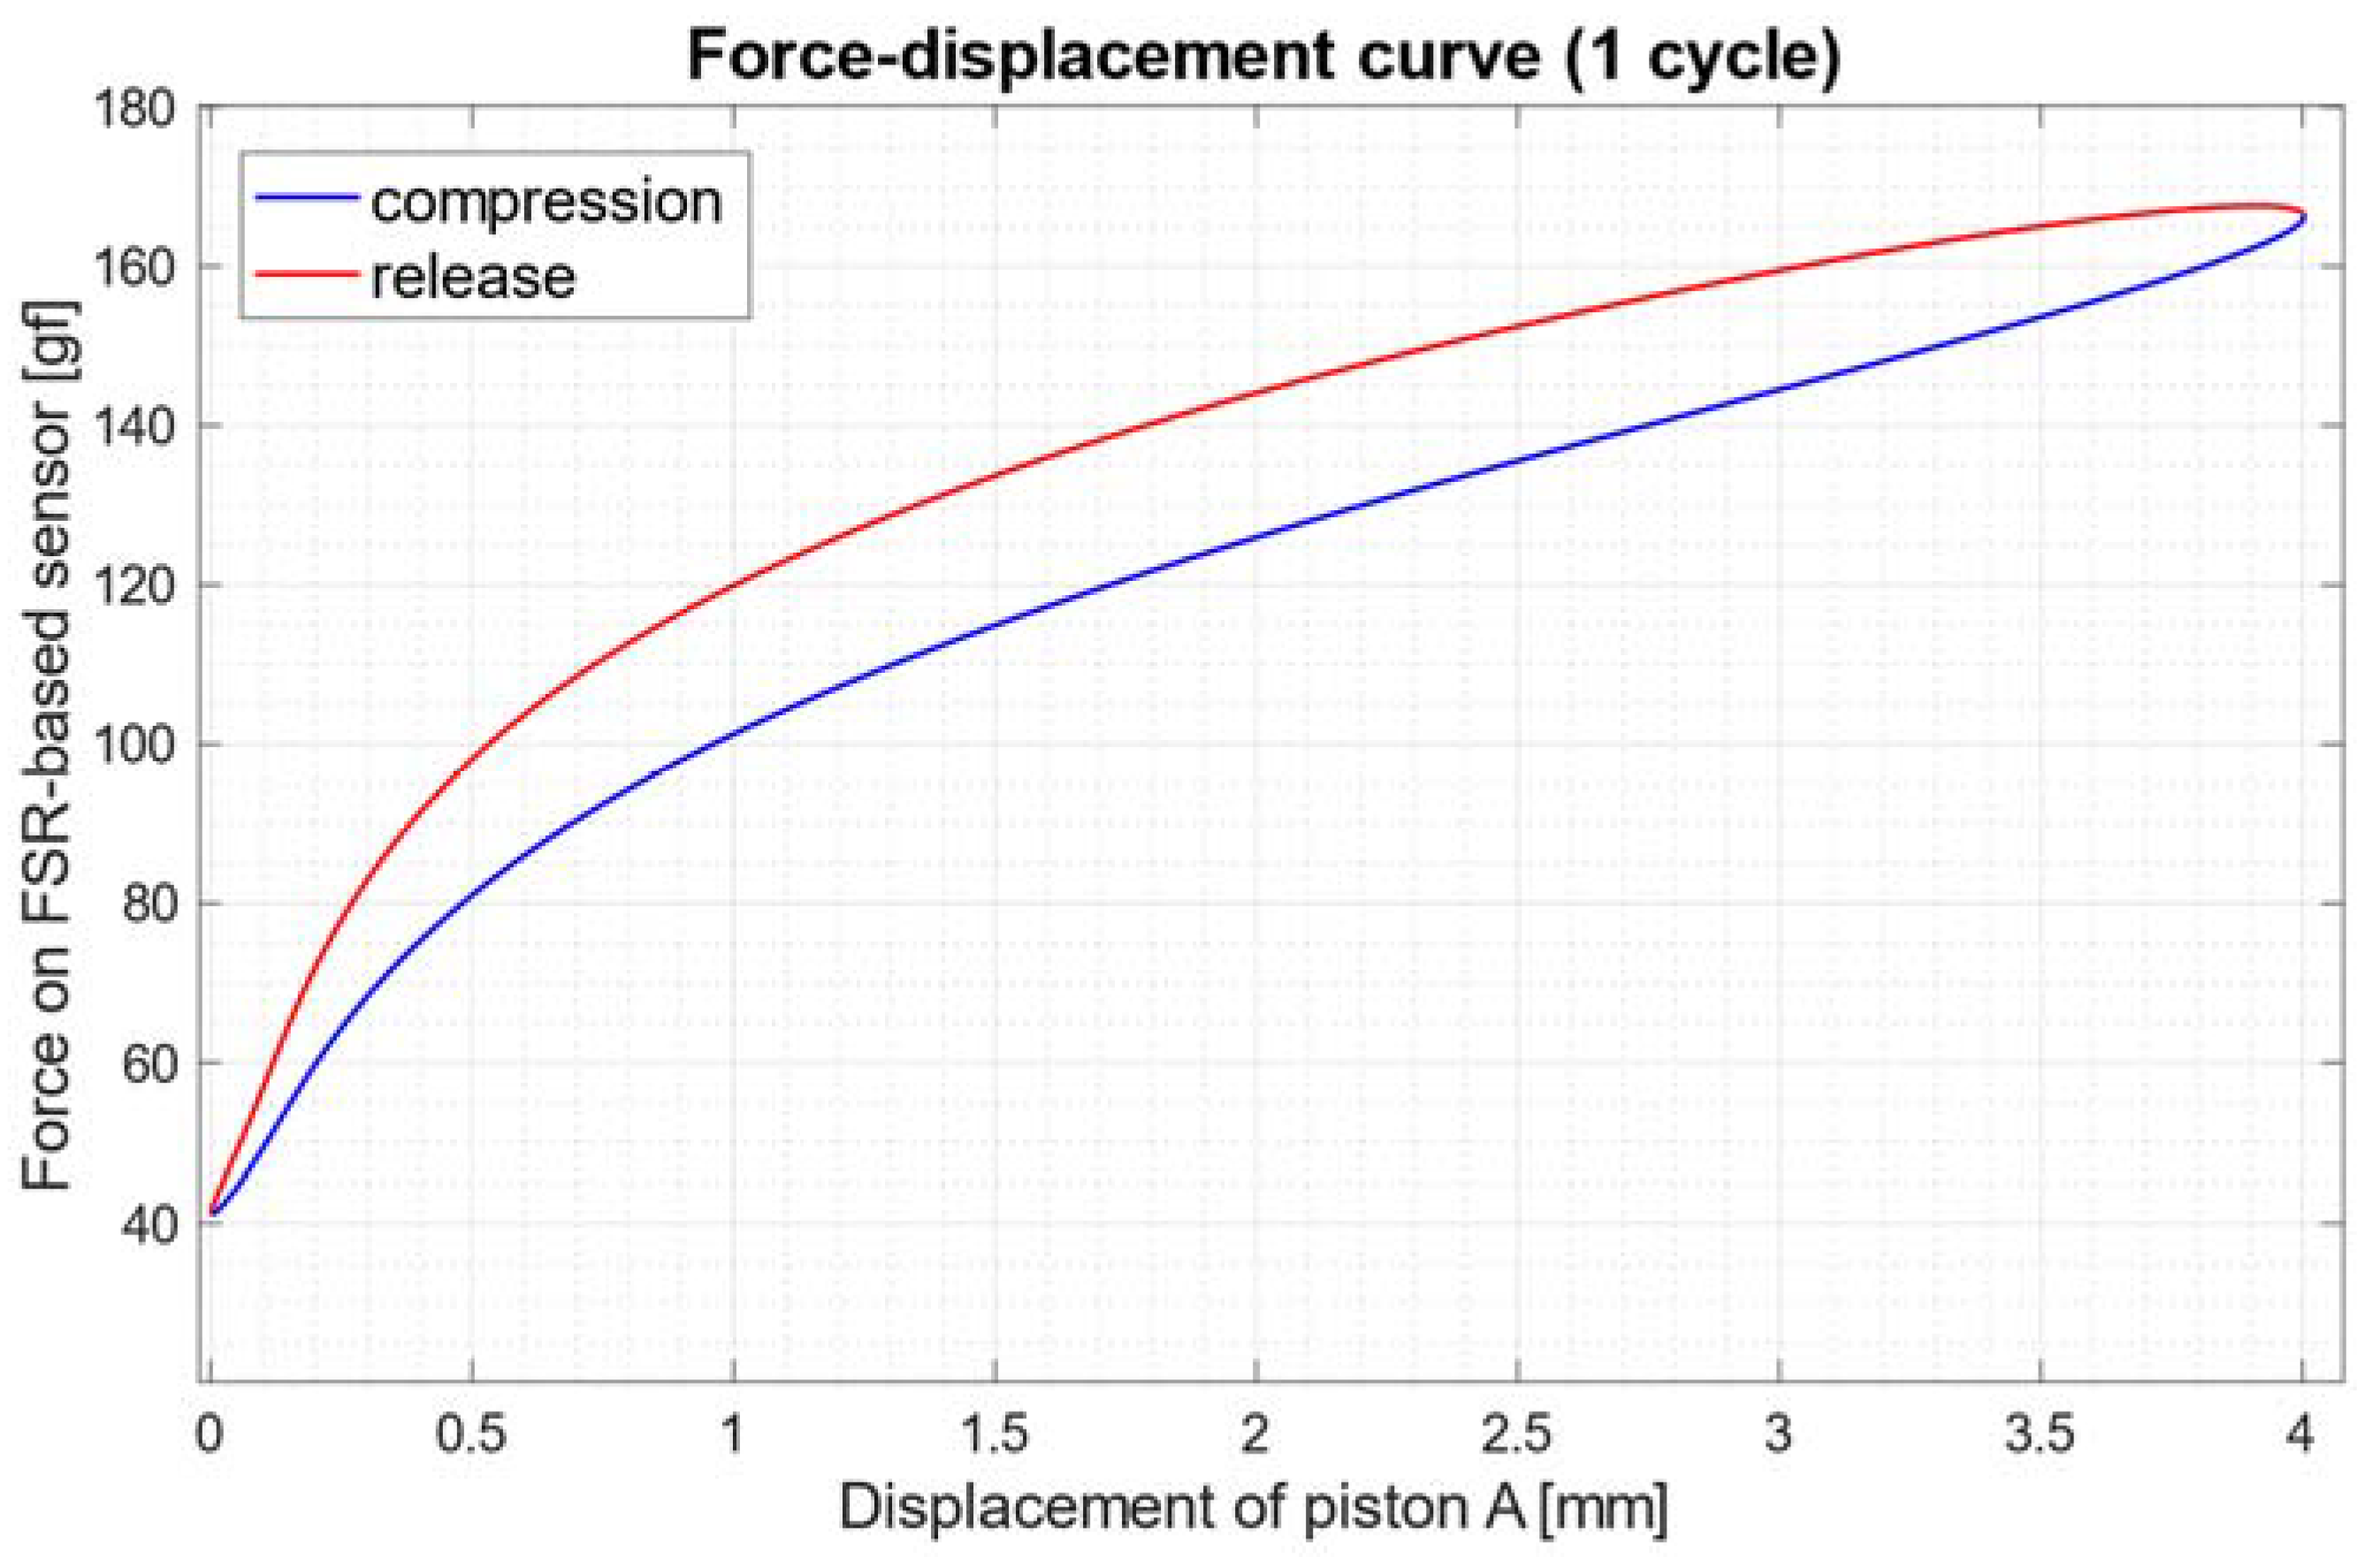
2.4.1. Low-Frequency Behavior of an FSR-Based Sensor

An FSR-based sensor [47] was tested in order to verify its behavior at the different stress frequencies generated by the electromechanical system. Such sensors had previously been experimented with in various biomedical applications, such as monitoring of muscle contraction [12,13,48], respiration [15], and cardiac mechanical activity [14], as well as control of 3D-printed hand prostheses [45,49,50] and exoskeletons [51].
The actual realization of the FSR-based sensor and its exploded view rendering is depicted in Figure 5. A flat rigid back prevents improper sensor bending, while a hemispherical dome provides efficient force transmission from users’ skin to the sensitive area of the sensor [12]. The sensor was conditioned by means of a current mirror circuit, based on a pair of PNP bipolar junction transistors [49,51], which replicated the FSR current in the gain resistor (set to 0.91 kΩ), thus providing an output voltage that was directly proportional to the force exerted on the sensor. The static calibration of the FSR-based sensor was carried out as in a previous study [49]. The conditioning circuit shown in Figure 5B can be improved by using a cascode configuration for the current mirror. In case an even better-performing circuit is needed, the use of a transimpedance amplifier is recommended [12,52].
Recordings were carried out in the same setup as presented in Section 2.3. FSR-based sensor signals were compared at various stress frequencies with those obtained from the loadcell, which provided measures of the actual force impressed on the sensor. The percent errors for the various descriptive statistics (minimum, maximum, mean, and standard deviation) of the FSR measurements with respect to the loadcell measurements, were computed as in Equation (7):
P e r c e n t   E r r o r   [ % ] = | F S R s t a t i s t i c L o a d c e l l s t a t i s t i c | L o a d c e l l s t a t i s t i c × 100
In addition, the relationship between the force impressed on the FSR-based sensor and the displacement of piston A was evaluated, in order to measure the hysteresis generated by the sensor at the various stress frequencies.

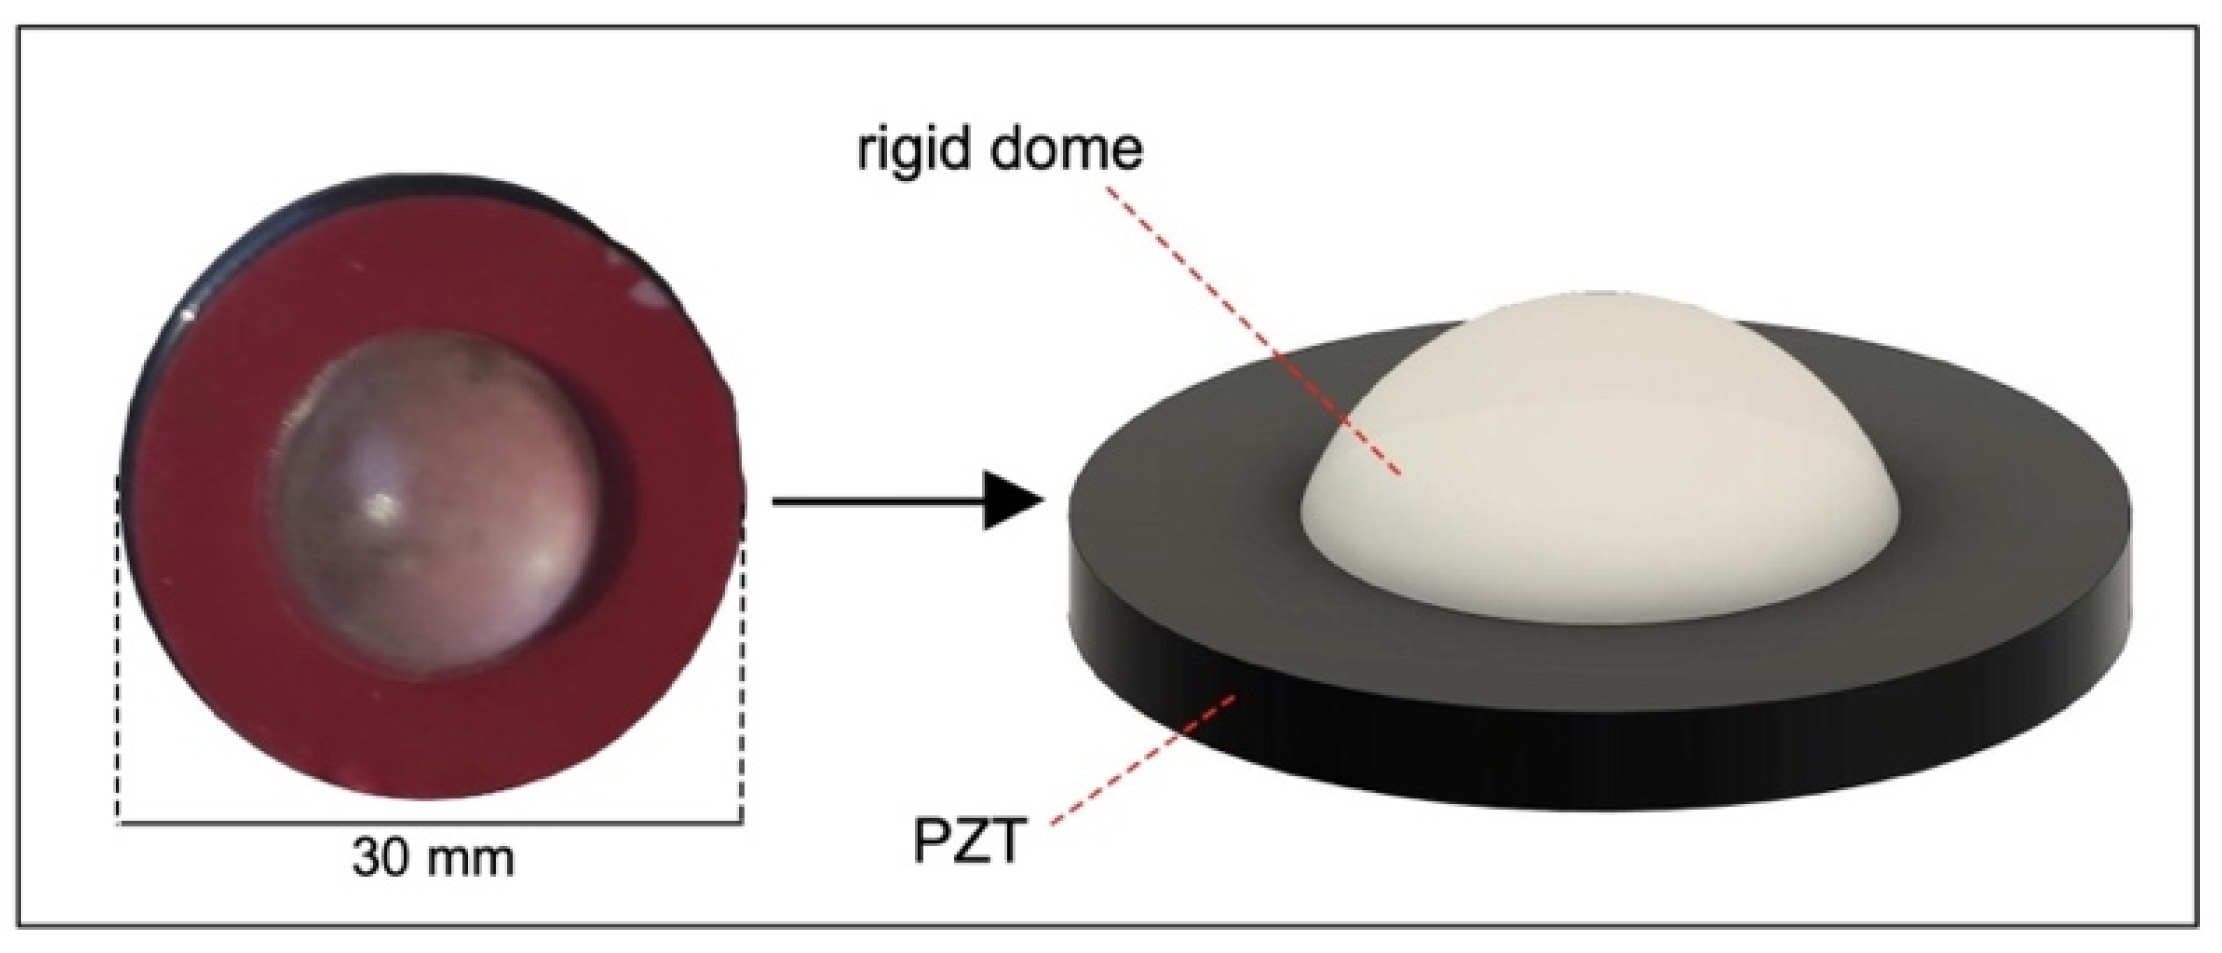
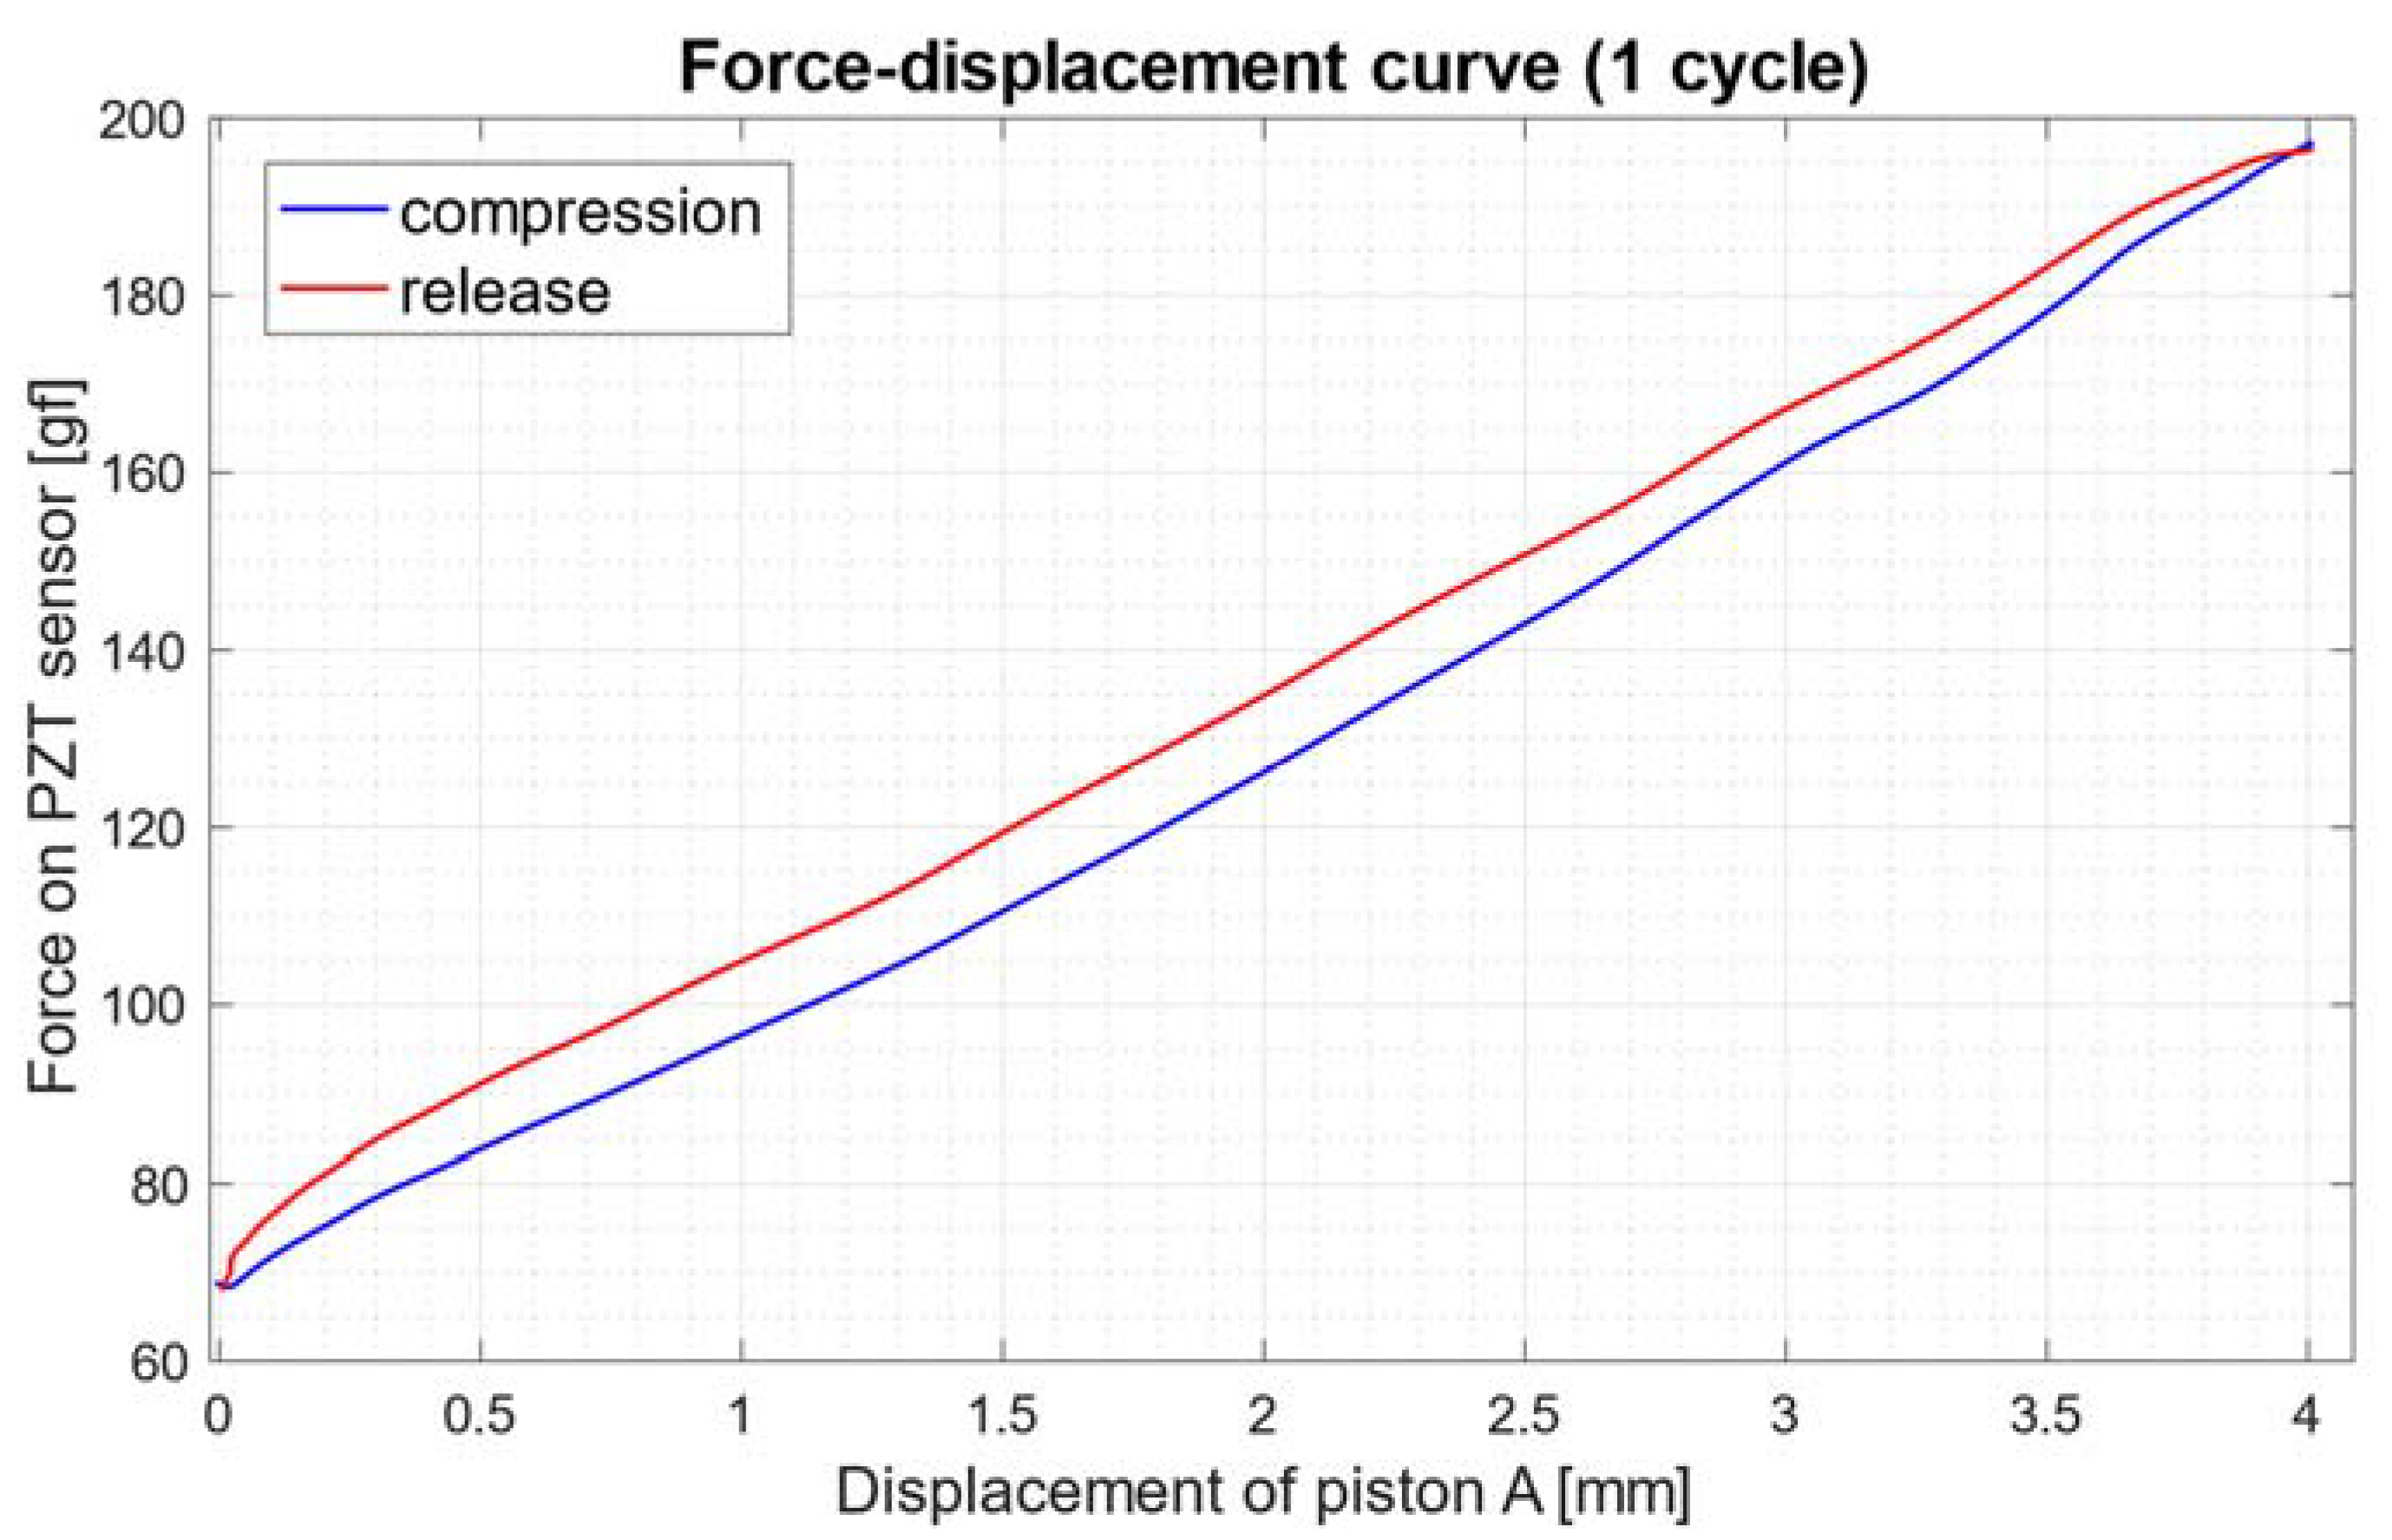
2.4.2. Low-Frequency Behavior of a PZT Sensor

The behavior at low frequencies of a PZT sensor, previously employed to monitor human respiration, heartbeat, and aortic valve opening [7,8,9,53] was dynamically tested with the electromechanical system.
The actual realization of the PZT sensor and its 3D rendering are depicted in Figure 6. Its conditioning circuit is described in [9]. Sensor sensitivity expressed in [V/gf] was calculated by interpolating the data acquired during dynamic tests.
Recordings were carried out in the same setup as presented in Section 2.3. PZT sensor signals were compared at various stress frequencies with those obtained from the loadcell. In addition, the relationship between the force impressed on the PZT sensor and the displacement of piston A was evaluated, in order to compute the hysteresis generated by the sensor at the various stress frequencies.

3. Results

3.1. Static Calibration of the Loadcell

The results of the static calibration of the loadcell are presented in Figure 7. The experimental measurements are represented as circles, while the linear regression is represented as a continuous red line. The angular coefficient of the regression line was 0.006 [V/gf], whereas the coefficient of determination R2 of the linear regression was 0.99, thus confirming the linear behavior of the loadcell.
Equation (8) defines the force applied to the loadcell as a function of its output voltage:
F o r c e   [ gf ] = V O U T [ V ] 1.159 0.006

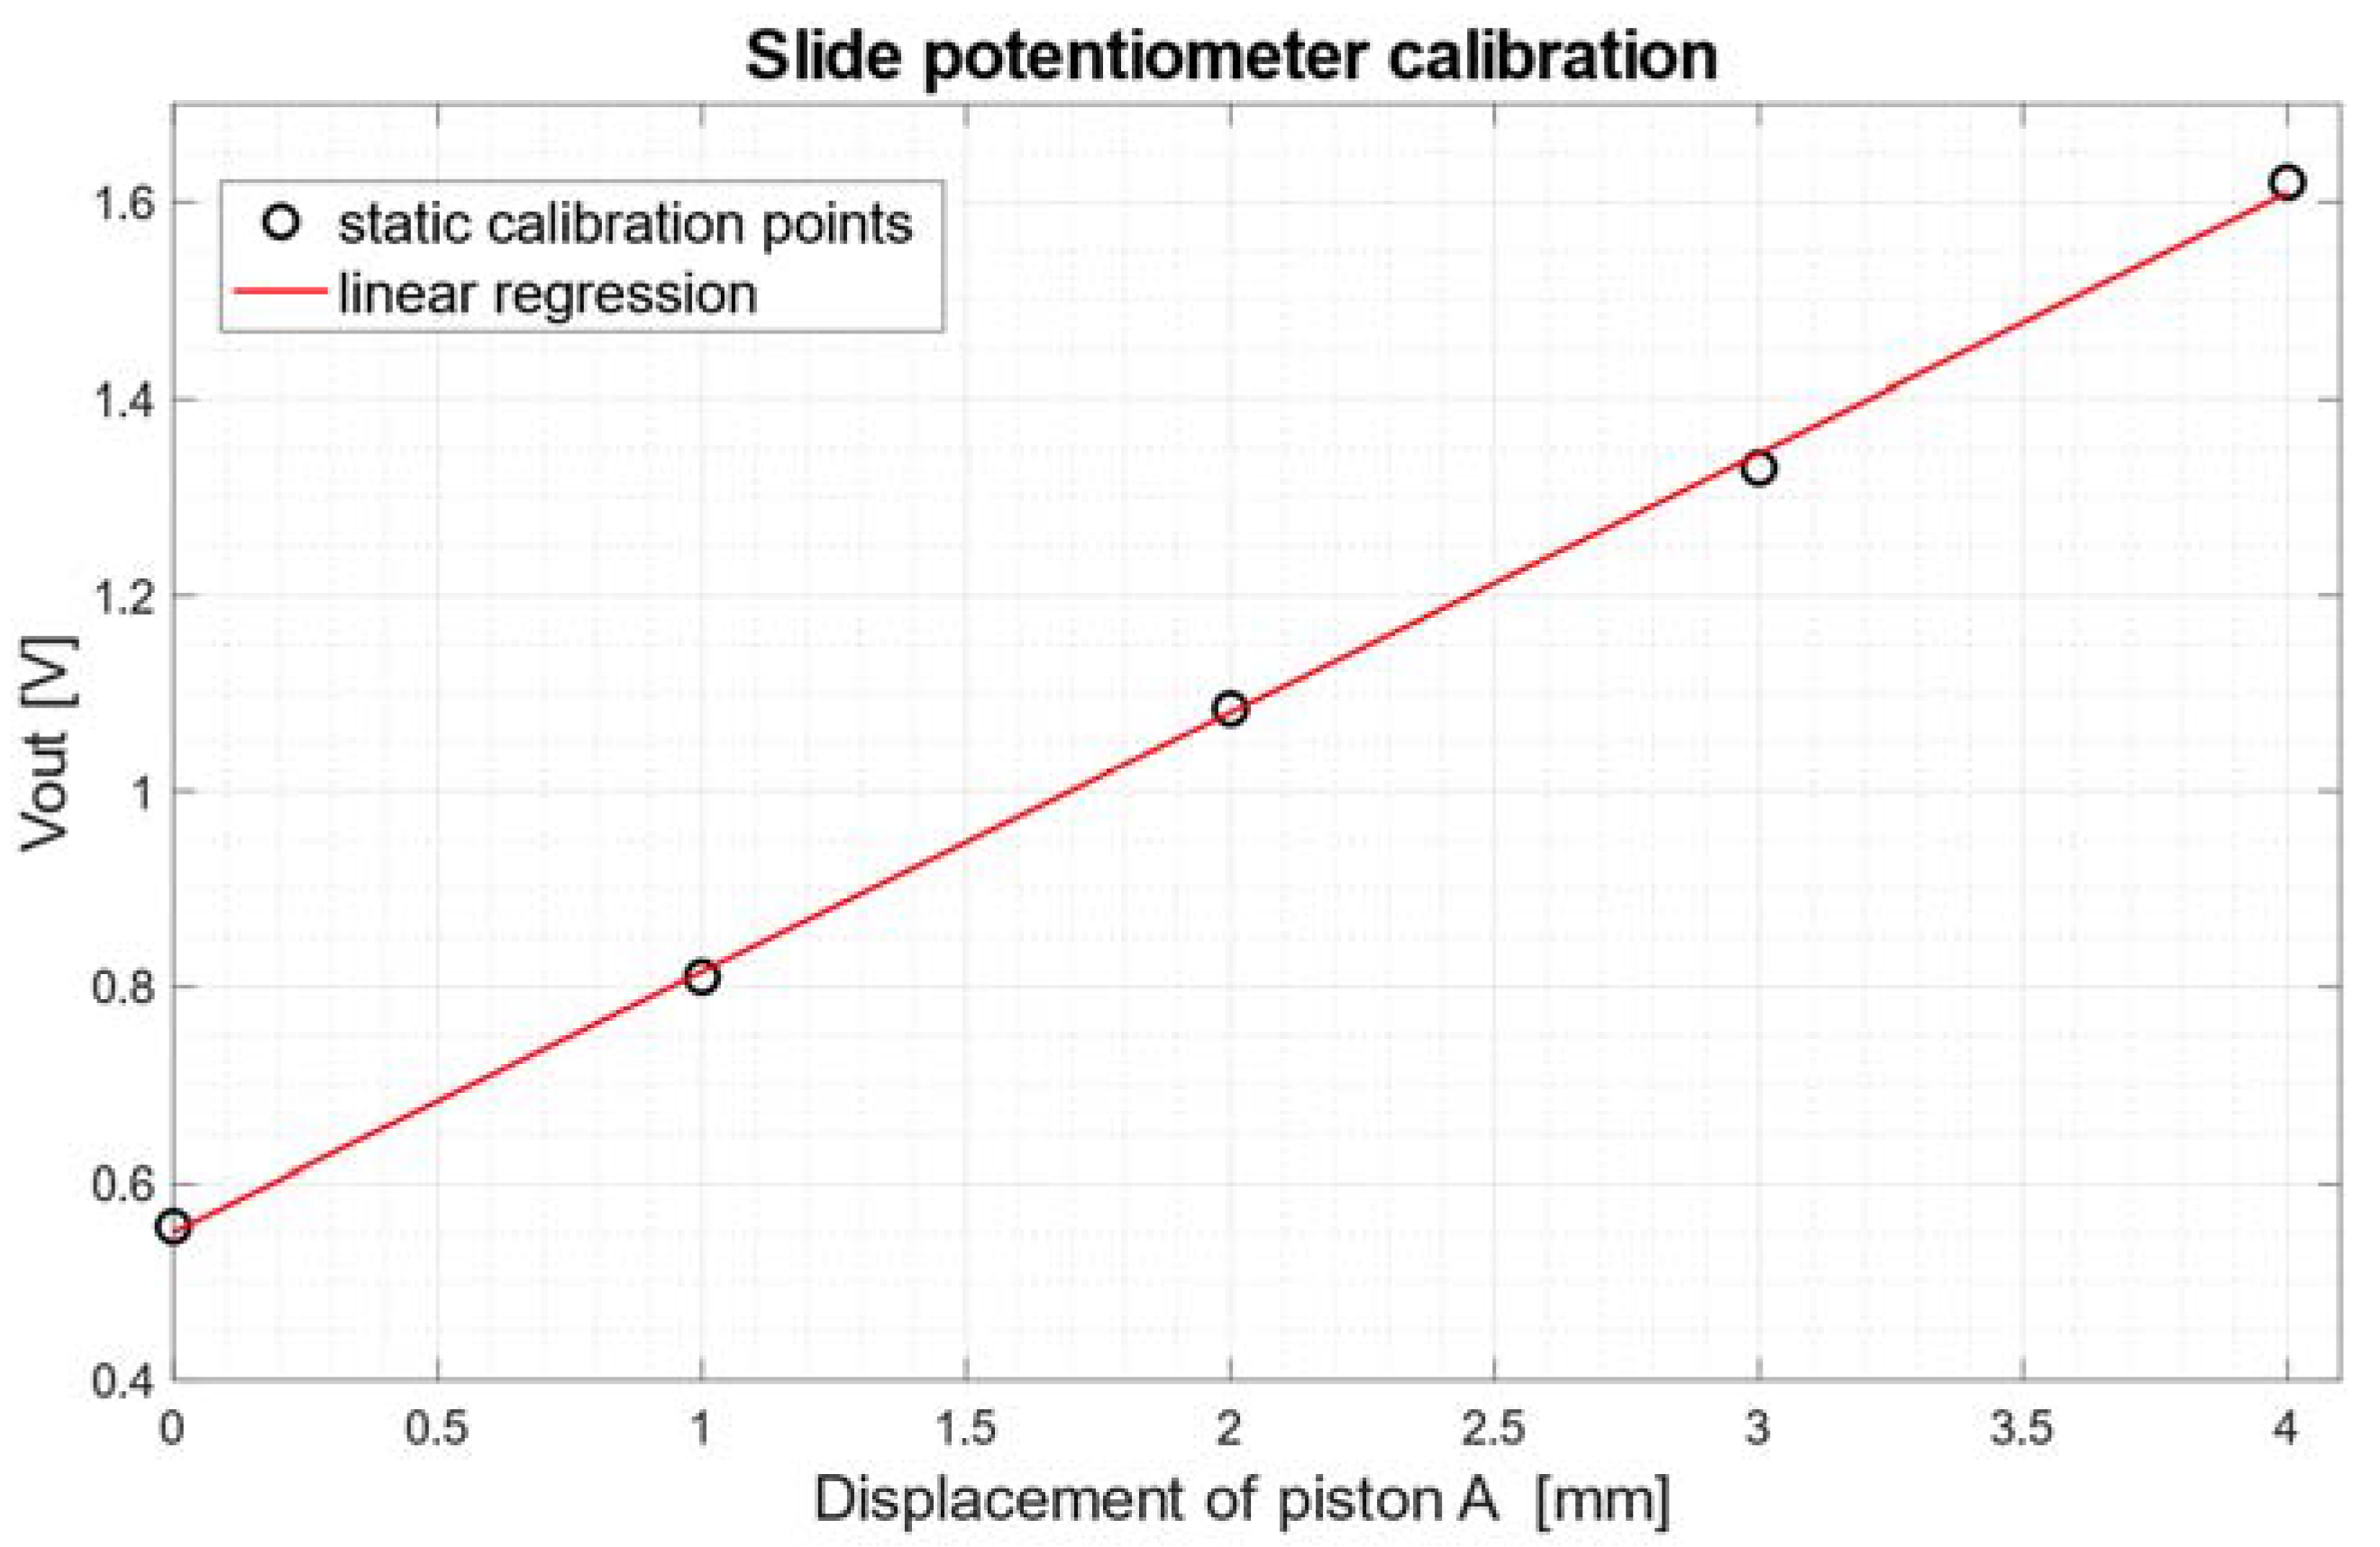
3.2. Static Calibration of the Slide Potentiometer

The results of the static calibration of the slide potentiometer fixed to piston A are shown in Figure 8. The experimental measurements are represented as circles, while the linear regression is represented as a continuous red line. The angular coefficient of the regression line was 0.26 [V/mm], whereas the coefficient of determination R2 of the linear regression was 0.99, thus confirming the linear behavior of the potentiometer.
Equation (9) defines the displacement of the slide potentiometer (fixed to piston A) as a function of its output voltage:
D i s p l a c e m e n t   [ mm ] = V O U T   [ V ] 0.55 0.26

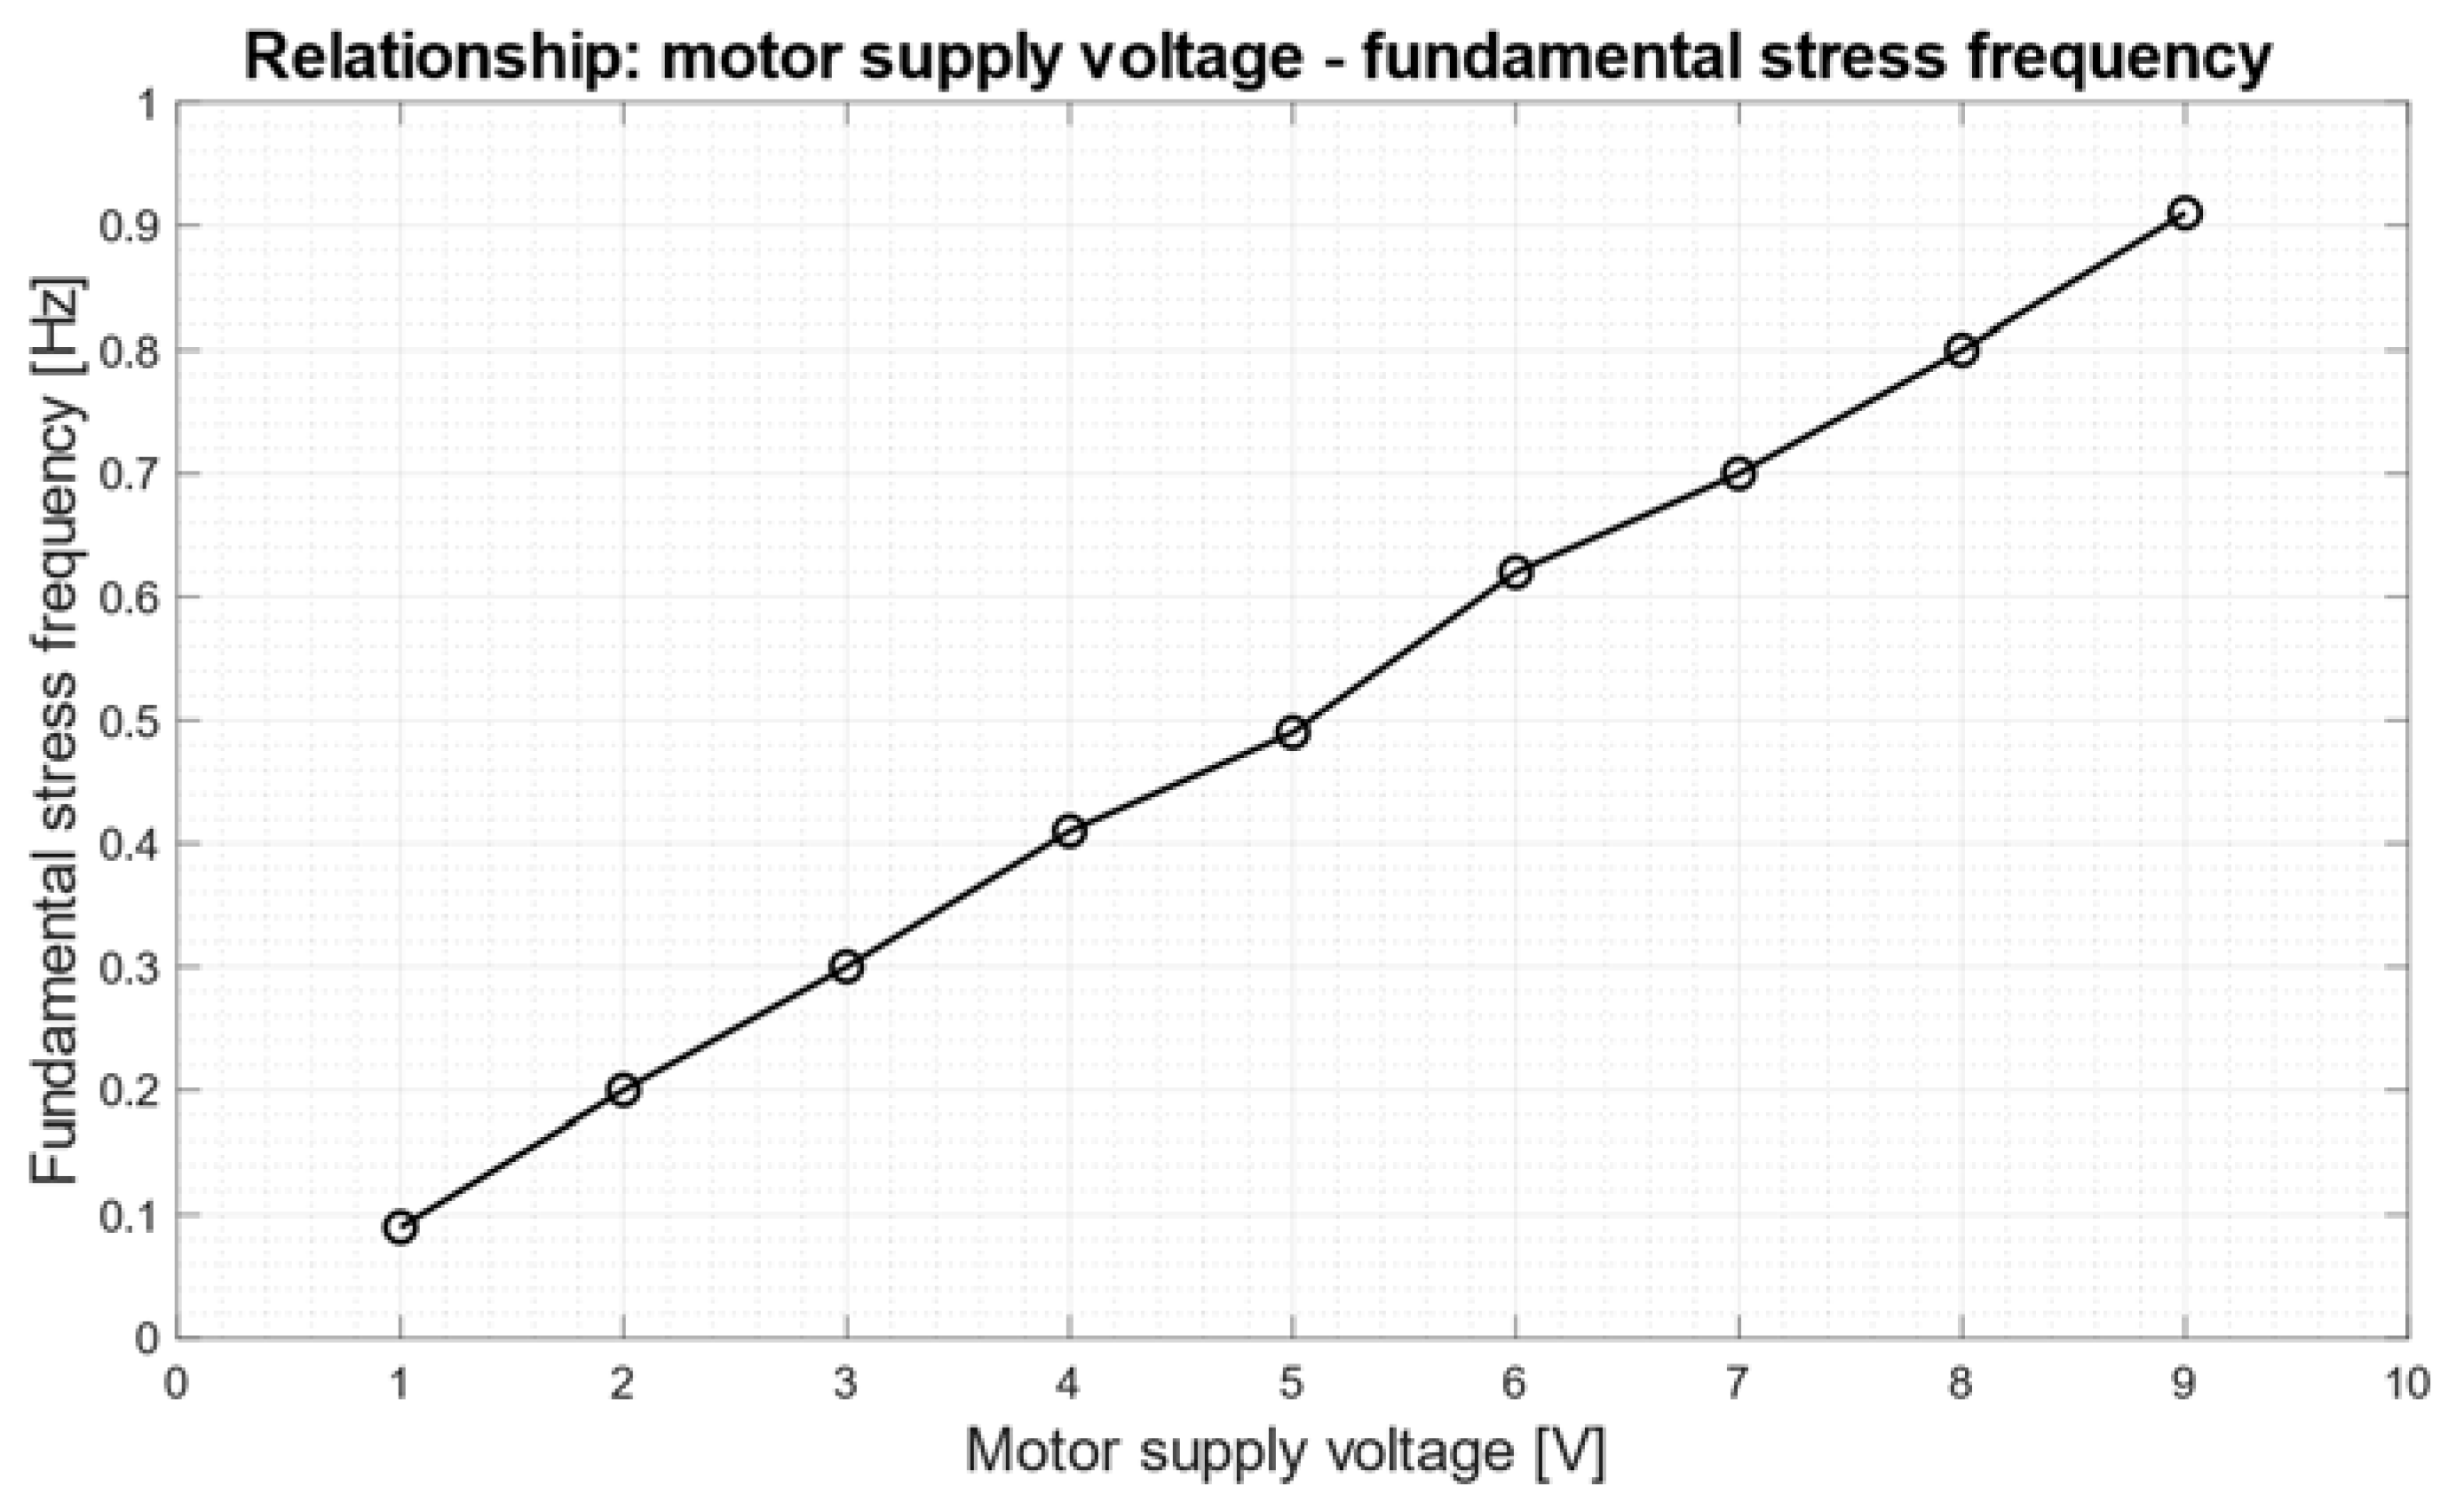
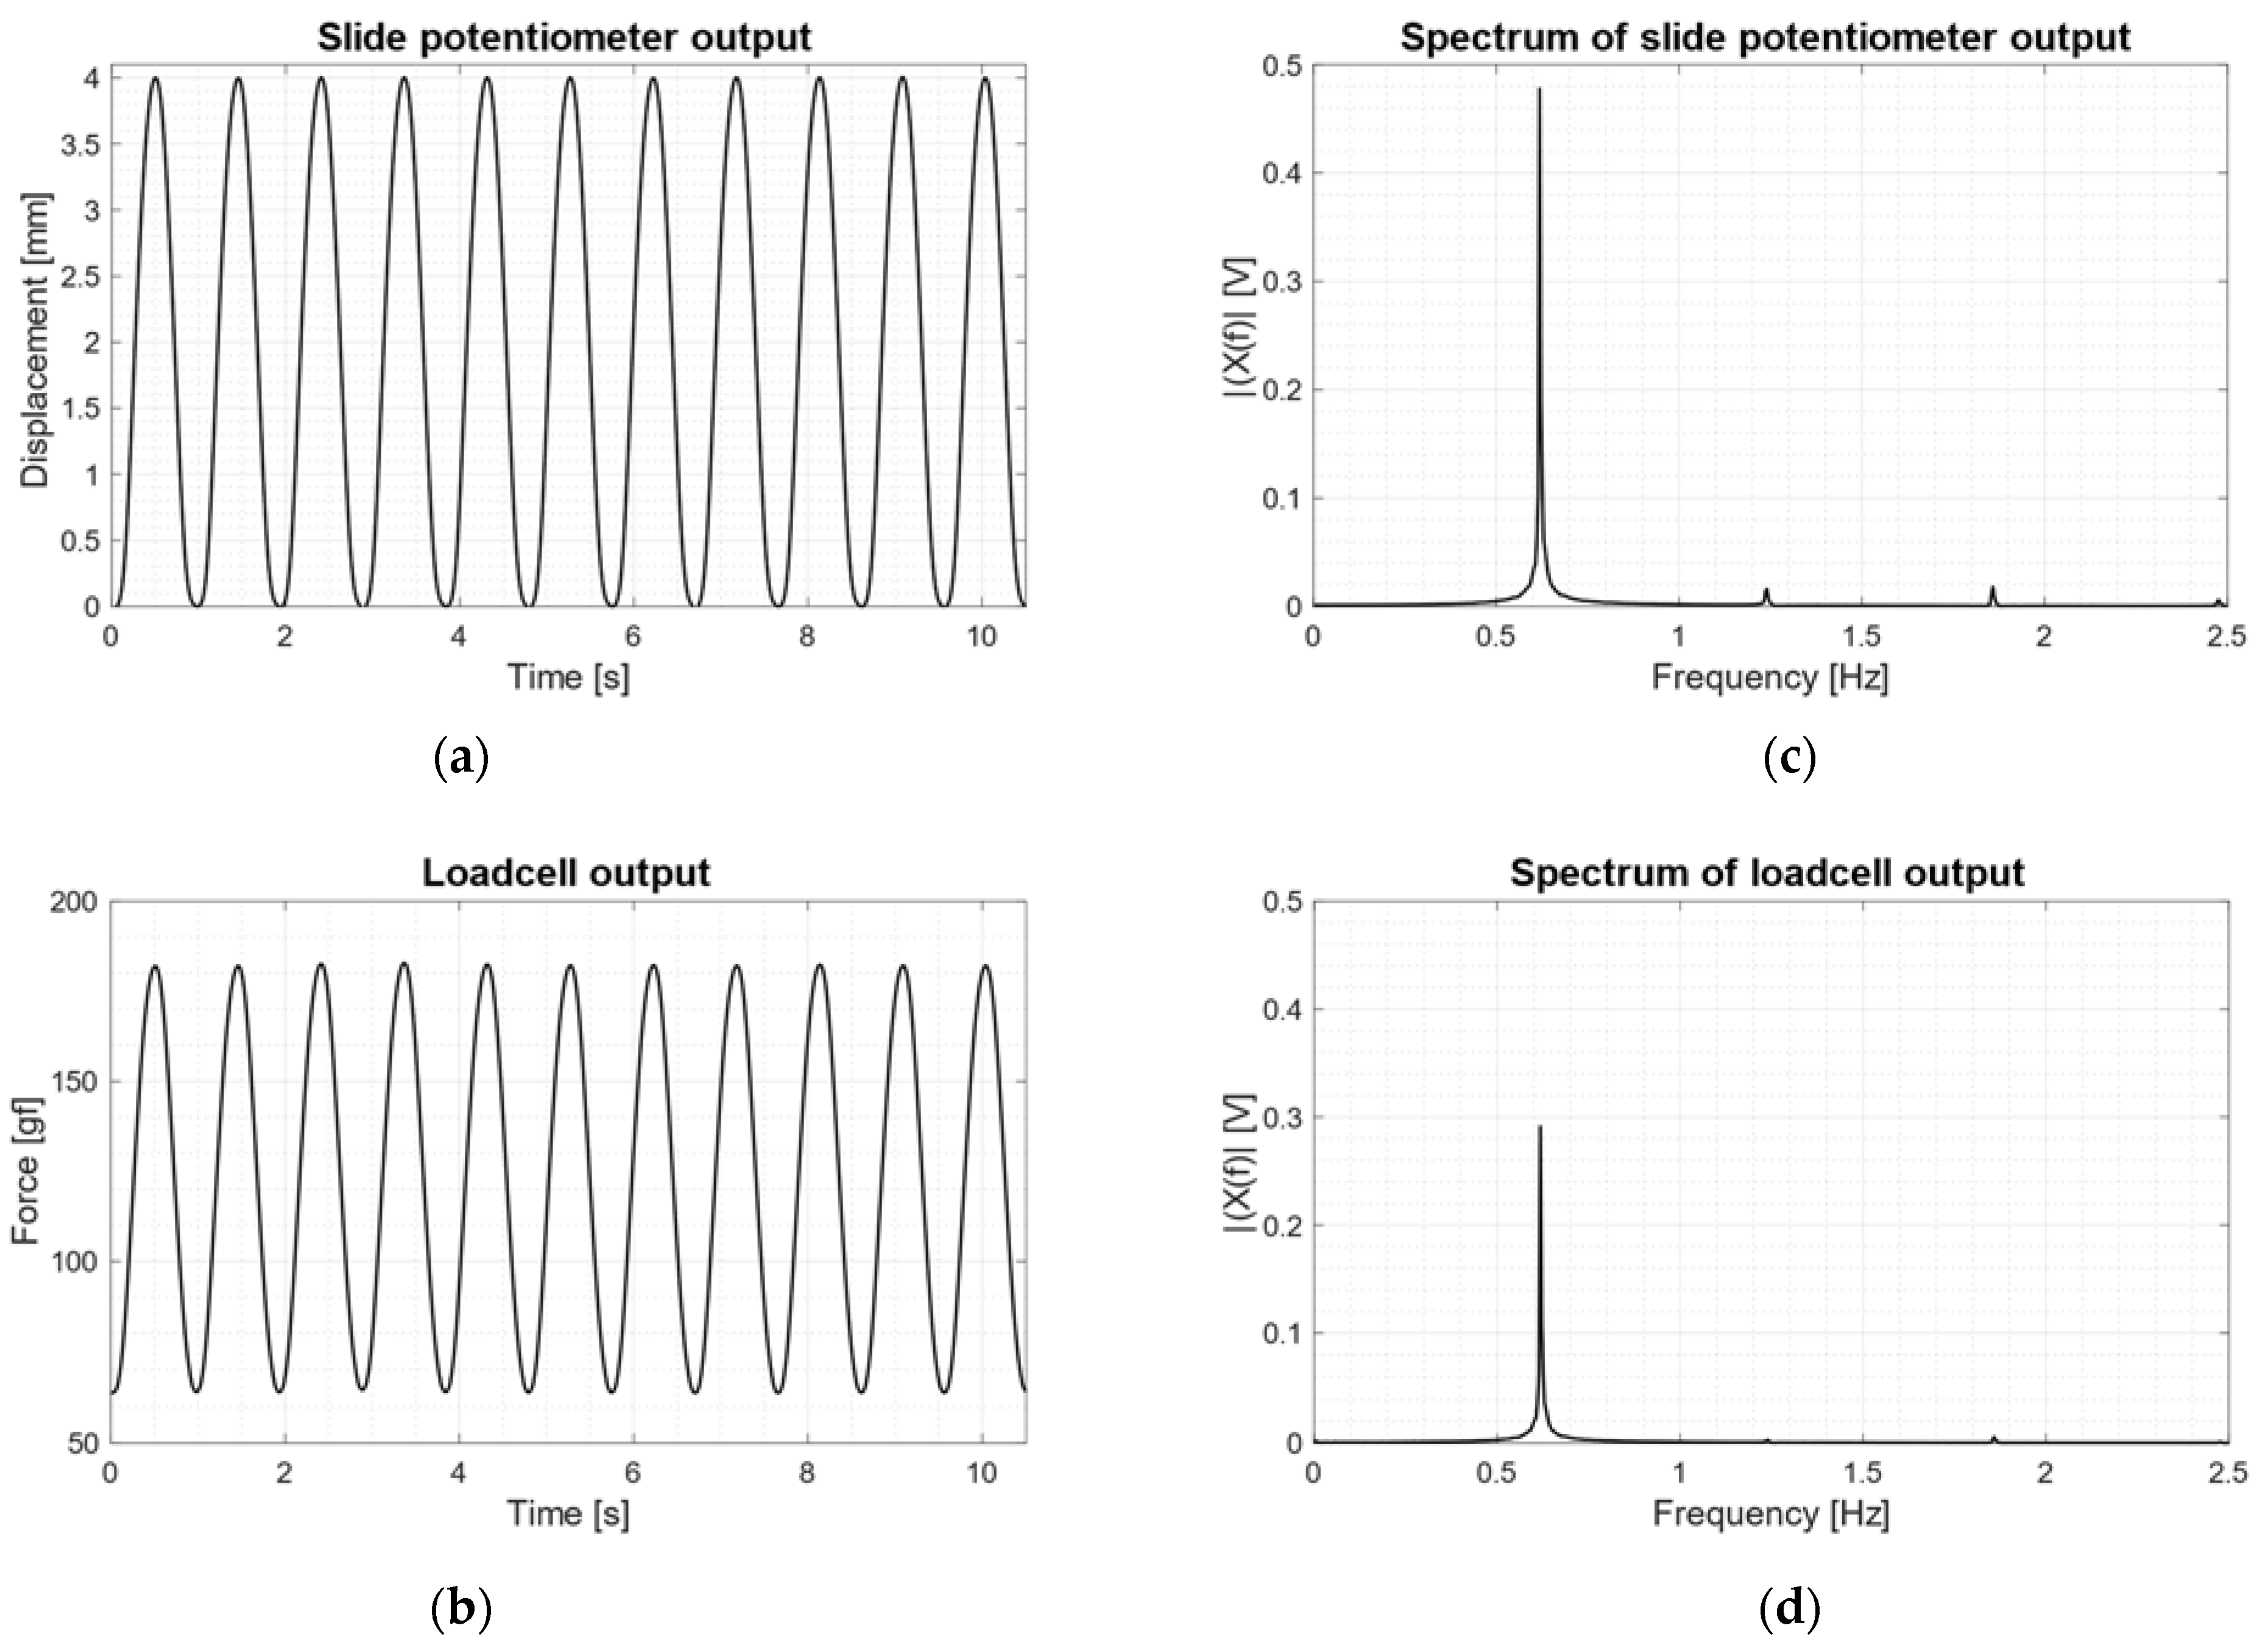
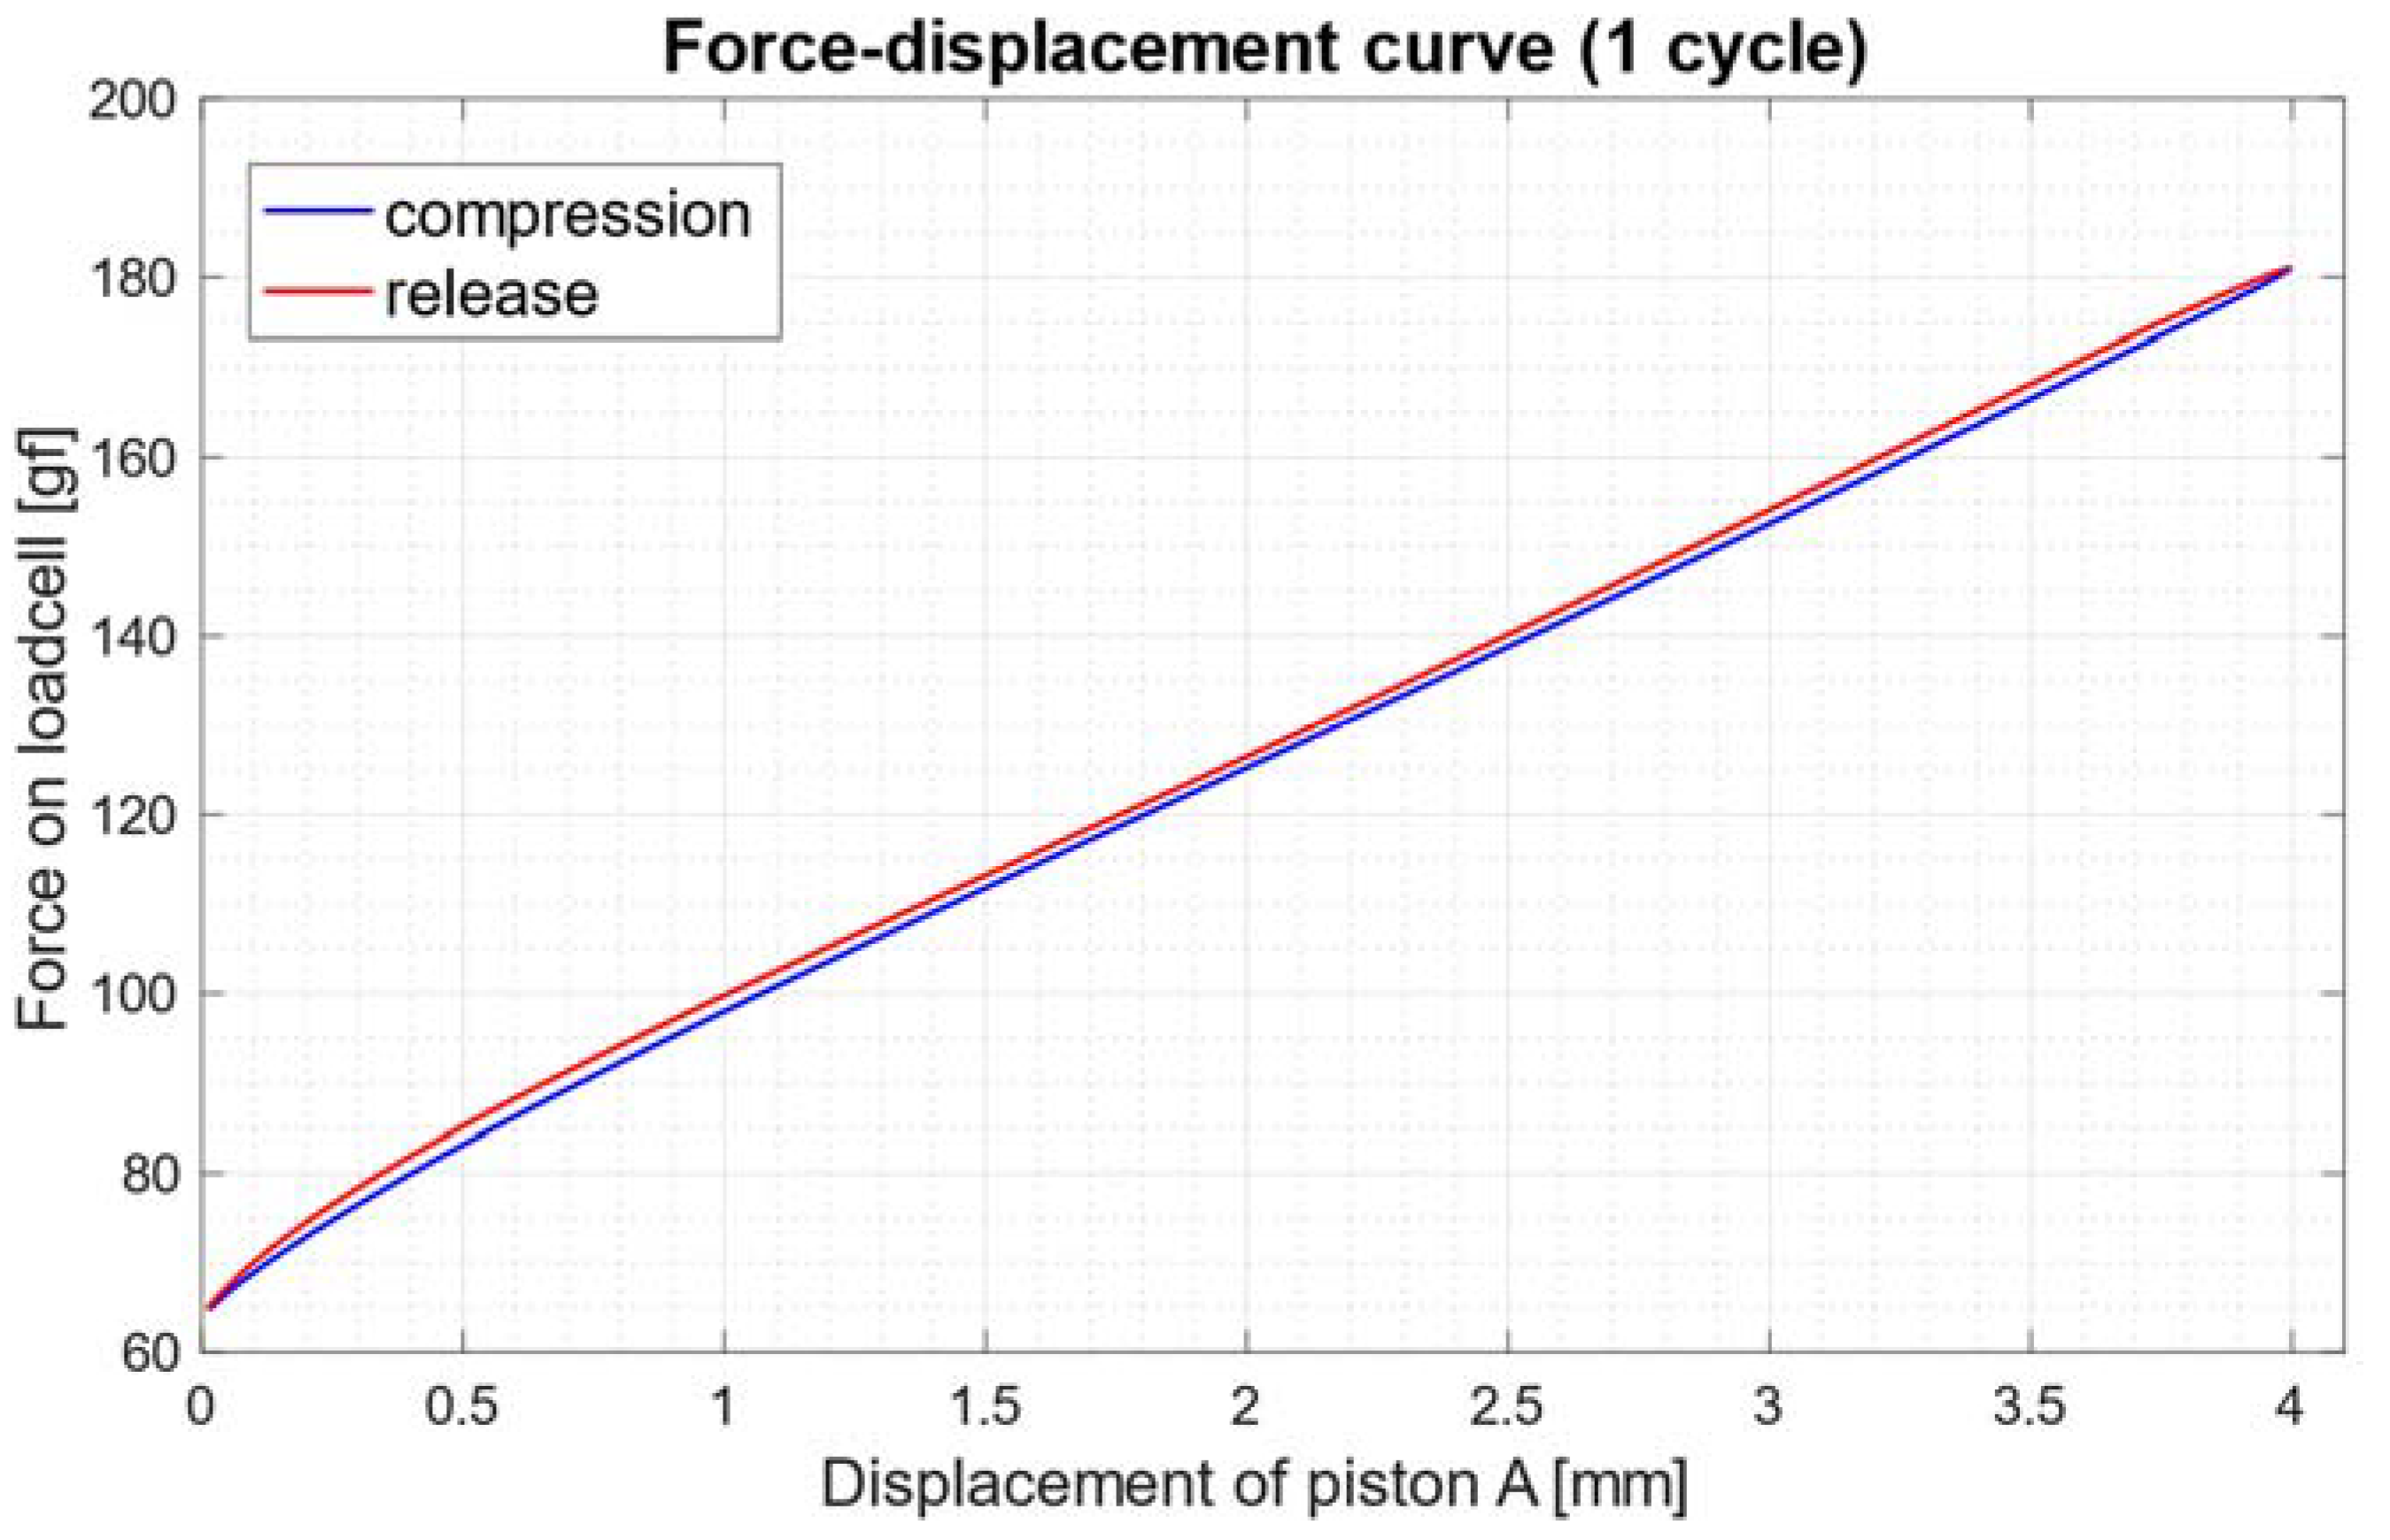
3.3. Results of the Electromechanical System Tests

Figure 9 shows the relationship between the motor supply voltage and the fundamental frequency of the sinusoidal stress generated by the axial motion of piston A, which corresponds to the frequency of the stress applied to the loadcell. A linear trend can be observed between the supply voltages, which ranged from 1 to 9 V, and the related stress frequencies, which ranged from 0.09 to 0.91 Hz.
The output voltage signals from the slide potentiometer and the loadcell were low-pass filtered at 5 Hz via a moving average, and then converted to the related measurement units ([mm] for the slide potentiometer and [gf] for the loadcell). All signal processing operations were performed in MATLAB® R2021a (The MathWorks, Inc., 1 Apple Hill Drive, Natick, MA 01760, USA).
For each motor supply voltage (1 V to 9 V), both the slide potentiometer and the loadcell signals were found to be almost pure sinusoids at the same frequency. As an example of sinusoidal stress generated by the electromechanical system, Figure 10 shows the results obtained by supplying the motor with 6 V, which resulted in a stress frequency of 0.62 Hz: panels (a) and (b) show, respectively, the outputs of the slide potentiometer and the loadcell in the time domain, while panels (c) and (d) show the corresponding frequency spectra (computed over about 3 min of recordings after DC removal). Both spectra show a narrow pulse at the fundamental frequency and spurious pulses at higher frequencies, but with lower amplitudes.
A measure of the purity of the sinusoidal stresses imposed on the loadcell by the electromechanical system was provided by the total harmonic distortion, which was computed for all stress frequencies and reported in Table 1. The THD was found to decrease with increasing stress frequencies, and its mean value was 2.77% (SD: 0.52%).
Further tests proved that the electromechanical system obviously dissipates energy during the compression/release cycles. A mean hysteresis of 3.62 (SD: 1.00) gf mm was found, with a maximum value of 6.14 gf mm obtained for a stress frequency of 0.80 Hz. As an example, Figure 11 shows the force-displacement curve for one stress cycle at 0.80 Hz: the hysteresis is graphically represented by the area between the curves depicted in red and blue.
Finally, Table 2 provides a summary of the tests performed on the electromechanical system, detailed for each stress frequency.

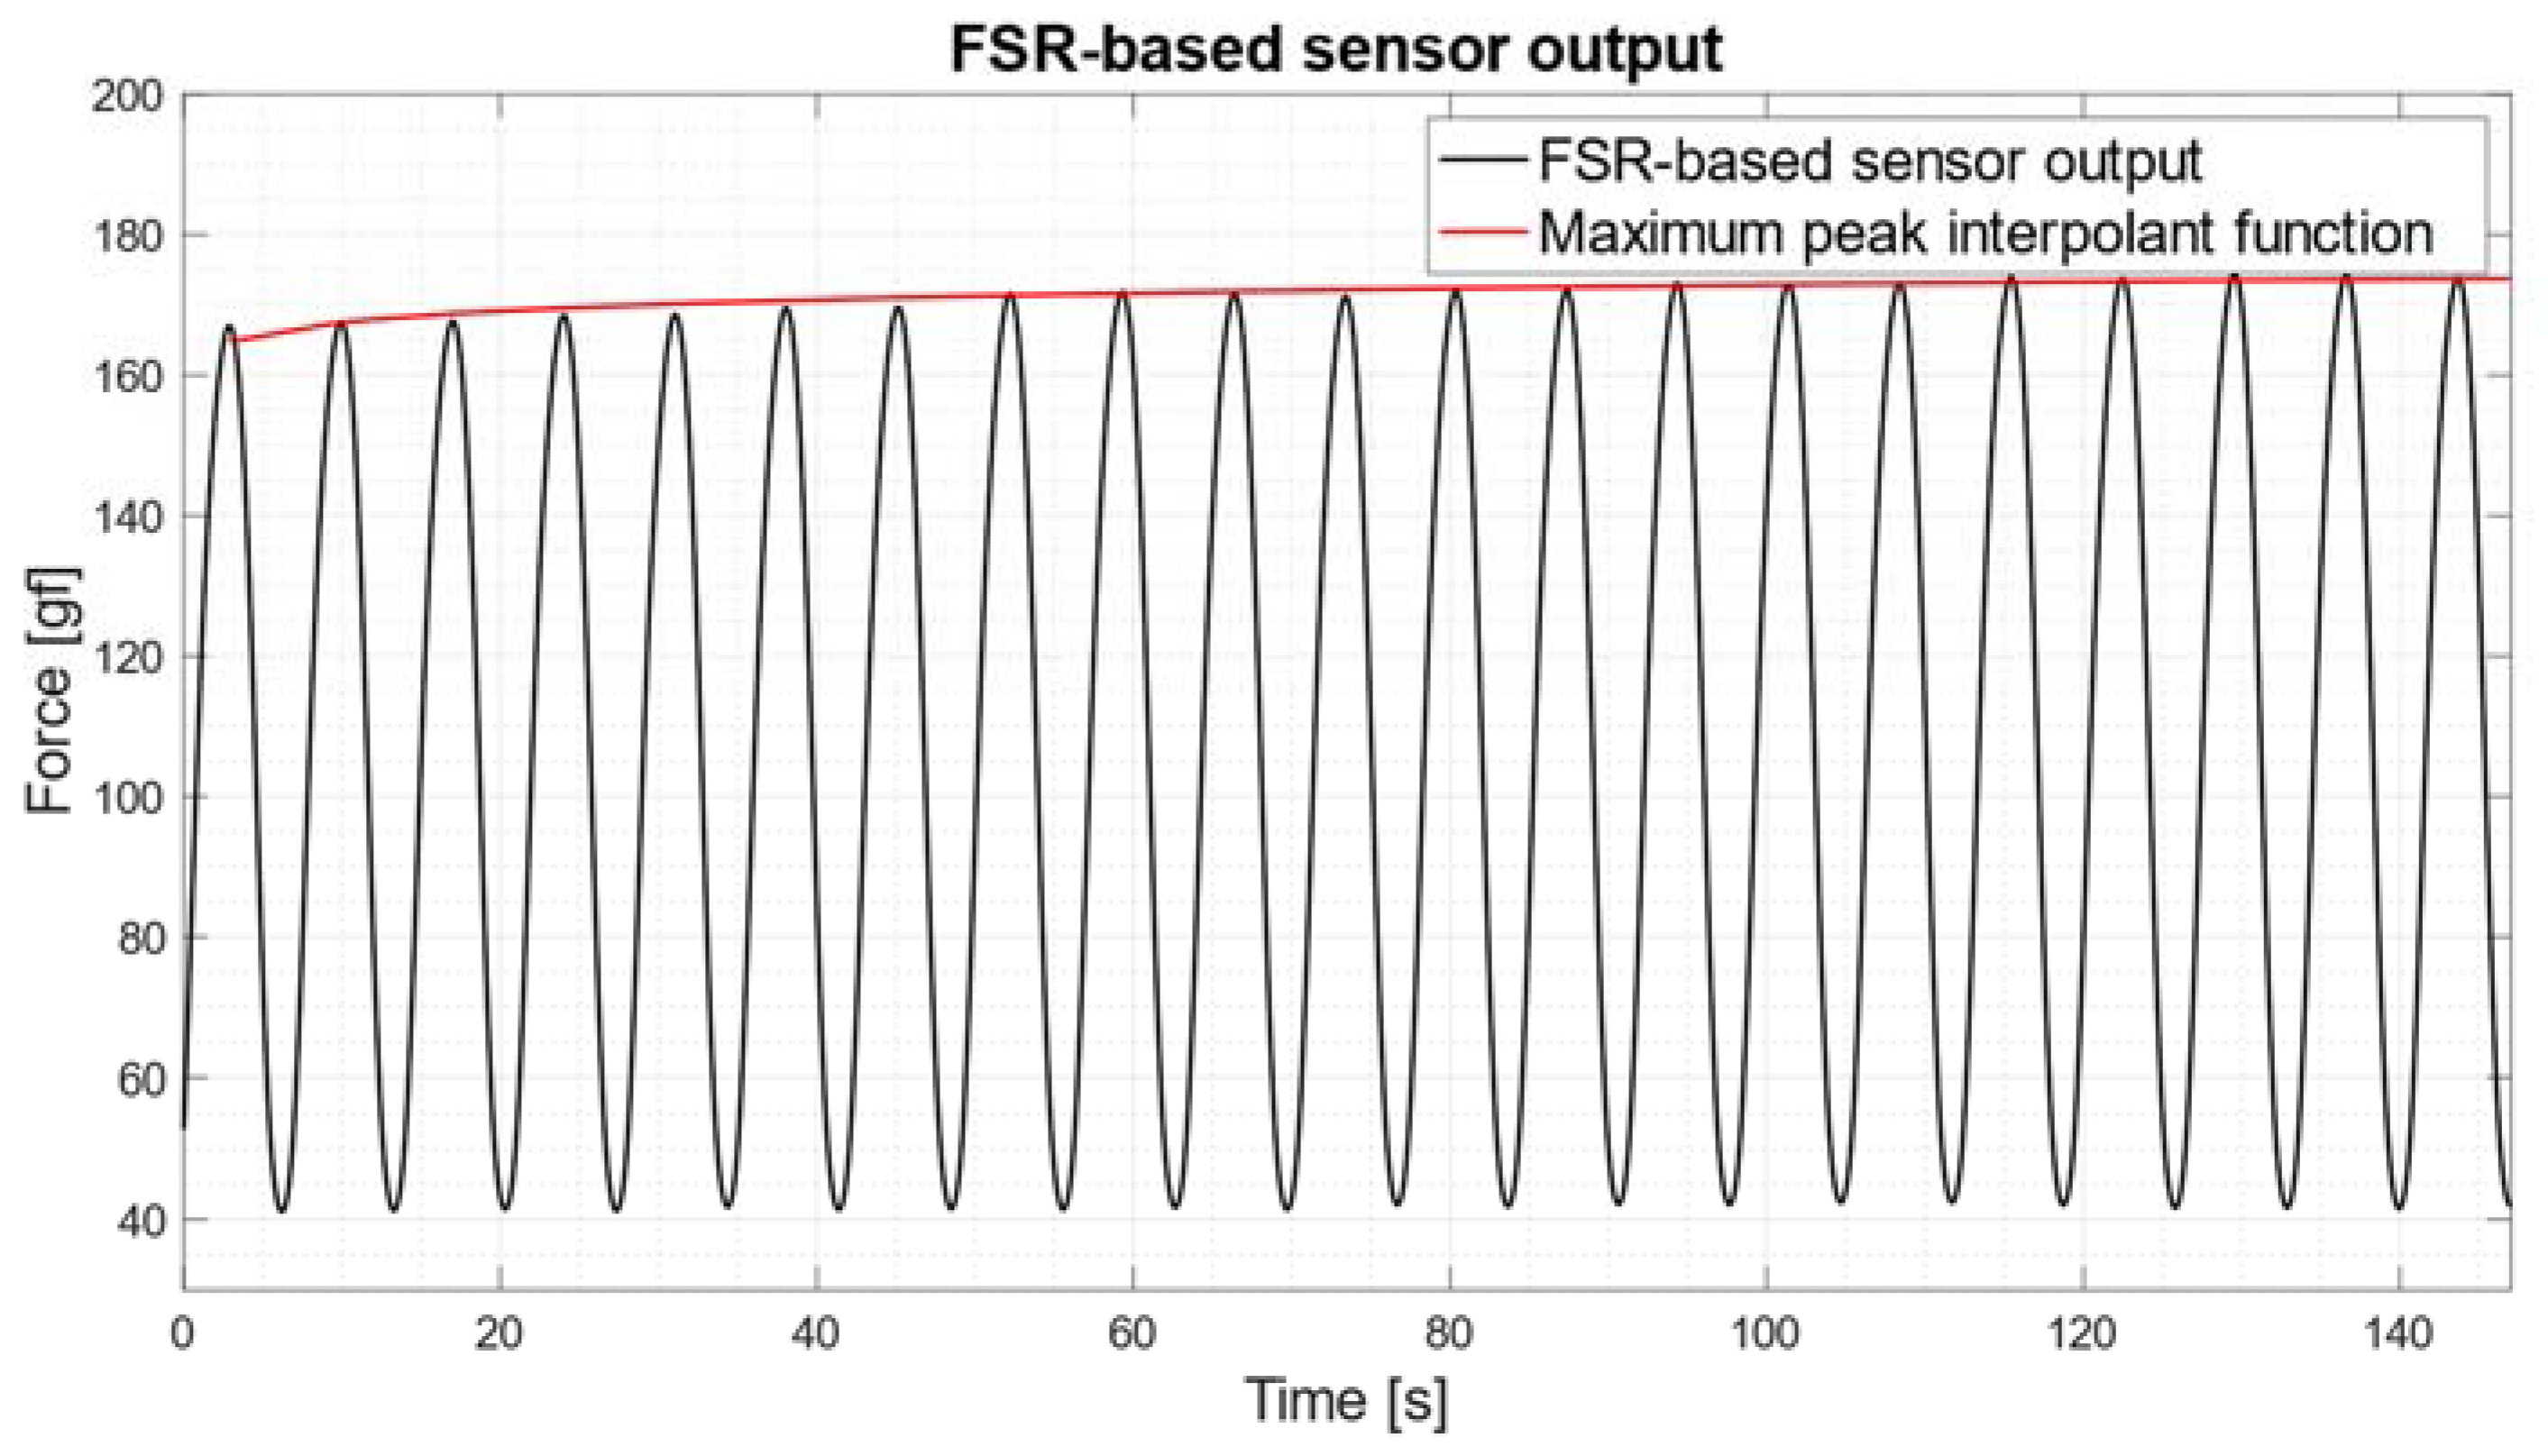
3.4. FSR-Based Sensor Test Results

The FSR-based sensor showed clear drifts in the measurements, especially at the lowest stress frequencies, as shown in Figure 12 (stress frequency of 0.09 Hz), where the drift trend is represented as a red line (power function: y = a × x b ; a = 162 ; b = 0.013 ; R 2 = 0.87 ) superimposed on the FSR signal.
Such behavior exhibited by the FSR-based sensor is most likely due to its rheological characteristics. In fact, when it is constantly stressed for extended periods of time, as is the case for very low-stress frequencies, mechanical creep can be observed, causing the measured force signal to drift [12,52].
Table 3 shows the various stress frequencies: the hysteresis of the FSR-based sensor; the percentage errors of the main descriptive statistics (minimum, maximum, mean, and standard deviation) of measurements from the FSR versus loadcell values; the correlation coefficients between the FSR and loadcell signals.
For all stress frequencies, measurements from the FSR-based sensor are found to have a high correlation (Pearson’s r correlation coefficient of 0.99) with those from the loadcell. The percent errors among the descriptive statistics of the FSR measurements with reference to loadcell values are all contained below 10%, except for the percent error on minimum value related to the stress frequency of 0.09 Hz. Hysteresis values showed an almost decreasing trend with increasing stress frequencies. The mean value was 53.23 (SD: 7.45) gf mm; the highest value of 61.04 gf mm, corresponding to the area between the red and blue curves depicted in Figure 13, was obtained for a stress frequency of 0.09 Hz.

3.5. PZT Sensor Test Results

Unlike the FSR-based sensor, the PZT sensor showed no drifts in the measurements. Table 4 presents the various stress frequencies: the hysteresis of the PZT sensor; the percent errors of the main descriptive statistics of measurements from the PZT versus loadcell values; the correlation coefficients between the PZT, and loadcell signals.
For all stress frequencies, measurements from the PZT sensor were found to have a high correlation (Pearson’s r correlation coefficient of 0.99) with those from the loadcell. The percent errors among the descriptive statistics of the PZT measurements with reference to loadcell values are all contained below 10%. Hysteresis values showed an evident decreasing trend with increasing stress frequencies. The mean value was 19.29 (SD: 3.17) gf mm; the highest value of 26.55 gf mm, corresponding to the area between the red and blue curves depicted in Figure 14, was obtained for a stress frequency of 0.09 Hz.

4. Discussion

An electromechanical system for the characterization of force/pressure sensors has been presented. The system offers the possibility to calibrate an individual sensor and evaluate its dynamic performance and non-linearities.
The proposed system, making use of a single data acquisition board with multiple inputs, has the advantage of being able to synchronously record both mechanical parameters (e.g., force and displacement) and sensor outputs to be tested. In this way, any phase shifts between the signals can also be accurately measured. In particular, tests on an FSR-based sensor and a PZT sensor have been reported. As an alternative method of measuring piston displacement, a vision-based system could be experimented with as in [54].
The proposed system is easy to implement, scalable and reconfigurable, thus being simply adaptable to specific applications. For example, different test frequencies can be achieved by replacing the electric motor or by using different rotation gear ratios. The DC motor could be replaced with a stepper motor, but the single-step angle and the typical jerky pattern that such motors generate should be considered. However, such effects should be practically eliminated or greatly reduced by using large rotation gear ratios. By using springs with different elastic coefficients, different force ranges can be imparted to the sensor under test and those most relevant to the practical application of interest can be chosen. The piston tip that faces the sensor under test can be easily customized with ad-hoc geometries that mimic the actual mechanical coupling between the force sensor and the stimulating source, to closely reproduce the particular operating conditions of the target application.
The ability of the proposed electromechanical system to generate nearly pure sinusoidal stresses at varying frequencies, proved by the low values of total harmonic distortions (2.77 ± 0.52%), allows precise dynamic characterization of a sensor in a specific frequency range suitable for the desired application.
In particular, this study was planned to verify the dynamic behavior of sensors at specifically low frequencies (from 0.09 Hz to 0.91 Hz), such as those characteristics of a person’s breathing or those of walking because of their large use.
The proposed system is also capable of providing accurate calibration of a single sensor. In addition, it can quantitatively evaluate the non-linear or drift phenomena commonly exhibited by sensors made of polymeric, composite, and/or viscoelastic materials [52]. The FSR-based sensor showed clear drifts in the measurements, especially at very low-stress frequencies (see Figure 12); this behavior is mainly due to the phenomenon of mechanical creep [12,52]. Instead, the PZT sensor showed no drift in the measurements.
Further tests showed that the electromechanical system itself introduces a very small hysteresis, i.e., energy dissipated for one stress cycle (3.62 ± 1.00 gf mm), for all the stress frequencies. The FSR-based sensor exhibited significantly higher hysteresis values (53.23 ± 7.45 gf mm) as compared to the PZT sensor (19.29 ± 3.17 gf mm).
Ultimately, unlike other experimental and commercial machines designed to test force sensors, this study aims to propose, as an open-source project (see Supplementary Materials), a simple and inexpensive electromechanical system to evaluate the dynamic performance of force sensors at very low-stress frequencies, far below the 5–10 Hz achievable with electrodynamic shakers [28,29,30,31,32]. Moreover, given the purely mechanical actuation by the connecting rod—crank mechanism, there is no magnetic influence on force sensor behavior, such as that caused by electrodynamic shakers [33]. The simplicity of assembly and the low manufacturing cost of about 70 USD allow simple replication and customization of the device for specific purposes.

5. Conclusions

This study proposed an open-source design of a simple and inexpensive electromechanical system to evaluate the dynamic performance of force sensors at very low-stress frequencies. The system is based on a rod-crank mechanism actuated by a voltage-controlled DC motor, which is able to apply accurate sinusoidal stress on the sensor under test. It can be easily scaled and reconfigured to be adapted to specific applications. A single data acquisition board allows the simultaneous recording of mechanical parameters (force and displacement) and electrical sensor output. The described system allows the calibration of an individual sensor, along with the characterization of its dynamic performance and non-linearities.
Future developments of this project include verifying the operation of the electromechanical system in a wider range of frequencies, by testing new solutions with higher-performance motors and rotation gears. In addition, it is planned to experimentally verify the upper limit of mechanical frequencies that this system can provide. Further advance involves the complete automation of the tests needed for a given sensor, to provide accurate data sheets for each individual sensor produced.

Supplementary Materials

The information to reproduce the electromechanical system (including CAD files and other documentation) can be downloaded from: https://www.doi.org/10.6084/m9.figshare.20425137 (accessed on 20 September 2022).

Author Contributions

Conceptualization and methodology, D.E., P.B., formal analysis and data curation, D.E.; investigation, D.E., E.A., J.C.; writing—original draft preparation, D.E.; writing—review and editing, D.E., E.A., J.C., G.D.G., P.B.; visualization, D.E.; supervision, G.D.G. All authors have read and agreed to the published version of the manuscript.

Funding

This research was funded by The NSW Smart Sensing Network (NSSN) and 3-Aim Solutions via the “Grand challenges program (ageing) https://www.nssn.org.au/grand-challenges (accessed on 20 September 2022).

Institutional Review Board Statement

Not applicable.

Informed Consent Statement

Not applicable.

Data Availability Statement

The data presented in this study are available on request from the corresponding author.

Conflicts of Interest

The force sensors used in this study are protected by the (pending) patent PCT/AU2020/051107. E.A., P.B., D.E. and G.D.G. are listed as inventors. G.D.G. was a minority shareholder of Medical Monitoring Solutions PTY, which owns the mentioned IP. J.C. declares no conflict of interest.

References

  1. Almassri, A.M.; Wan Hasan, W.Z.; Ahmad, S.A.; Ishak, A.J.; Ghazali, A.M.; Talib, D.N.; Wada, C. Pressure sensor: State of the art, design, and application for robotic hand. J. Sens. 2015, 2015, e846487. [Google Scholar] [CrossRef] [Green Version]
  2. Chuah, M.Y.; Estrada, M.; Kim, S. Composite force sensing foot utilizing volumetric displacement of a Hyperelastic polymer. In Proceedings of the 2012 IEEE/RSJ International Conference on Intelligent Robots and Systems, Vilamoura-Algarve, Portugal, 7–12 October 2012; pp. 1963–1969. [Google Scholar]
  3. Donati, M.; Vitiello, N.; De Rossi, S.M.M.; Lenzi, T.; Crea, S.; Persichetti, A.; Giovacchini, F.; Koopman, B.; Podobnik, J.; Munih, M.; et al. A flexible sensor technology for the distributed measurement of interaction pressure. Sensors 2013, 13, 1021–1045. [Google Scholar] [CrossRef] [PubMed] [Green Version]
  4. Hoffmann, K. Applying the Wheatstone Bridge Circuit. HBM: Darmstadt, Germany, 1974. [Google Scholar]
  5. Tekscan|Pressure Mapping, Force Measurement, & Tactile Sensors. Available online: https://tekscan.com/ (accessed on 26 June 2022).
  6. Sensitronics—Manufacturers of the Force Sensing Resistor and Other Force-Sensing Electronic Components. Available online: https://www.sensitronics.com/ (accessed on 26 June 2022).
  7. Andreozzi, E.; Centracchio, J.; Esposito, D.; Bifulco, P. A Comparison of Heart Pulsations Provided by Forcecardiography and Double Integration of Seismocardiogram. Bioengineering 2022, 9, 167. [Google Scholar] [CrossRef]
  8. Centracchio, J.; Andreozzi, E.; Esposito, D.; Gargiulo, G.D. Respiratory-induced amplitude modulation of forcecardiography signals. Bioengineering 2022, 9, 444. [Google Scholar] [CrossRef] [PubMed]
  9. Andreozzi, E.; Gargiulo, G.D.; Esposito, D.; Bifulco, P. A novel broadband Forcecardiography sensor for simultaneous monitoring of respiration, infrasonic cardiac vibrations and heart sounds. Front. Physiol. 2021, 12, 1988. [Google Scholar] [CrossRef]
  10. Esposito, D.; Centracchio, J.; Andreozzi, E.; Gargiulo, G.D.; Naik, G.R.; Bifulco, P. Biosignal-based human–machine interfaces for assistance and rehabilitation: A survey. Sensors 2021, 21, 6863. [Google Scholar] [CrossRef]
  11. Smith, B.T.; Coiro, D.J.; Finson, R.; Betz, R.R.; McCarthy, J. Evaluation of force-sensing resistors for gait event detection to trigger electrical stimulation to improve walking in the child with cerebral palsy. IEEE Trans. Neural. Syst. Rehabil. Eng. 2002, 10, 22–29. [Google Scholar] [CrossRef]
  12. Esposito, D.; Andreozzi, E.; Fratini, A.; Gargiulo, G.D.; Savino, S.; Niola, V.; Bifulco, P. A piezoresistive sensor to measure muscle contraction and mechanomyography. Sensors 2018, 18, 2553. [Google Scholar] [CrossRef] [Green Version]
  13. Esposito, D.; Andreozzi, E.; Gargiulo, G.D.; Fratini, A.; D’Addio, G.; Naik, G.R.; Bifulco, P. A piezoresistive array armband with reduced number of sensors for hand gesture recognition. Front. Neurorobot. 2020, 13, 00114. [Google Scholar] [CrossRef] [Green Version]
  14. Andreozzi, E.; Fratini, A.; Esposito, D.; Naik, G.; Polley, C.; Gargiulo, G.D.; Bifulco, P. Forcecardiography: A novel technique to measure heart mechanical vibrations onto the chest wall. Sensors 2020, 20, 3885. [Google Scholar] [CrossRef]
  15. Andreozzi, E.; Centracchio, J.; Punzo, V.; Esposito, D.; Polley, C.; Gargiulo, G.D.; Bifulco, P. Respiration monitoring via forcecardiography sensors. Sensors 2021, 21, 3996. [Google Scholar] [CrossRef] [PubMed]
  16. Li, W.; Sun, C.; Yuan, W.; Gu, W.; Cui, Z.; Chen, W. Smart mat system with pressure sensor array for unobtrusive sleep monitoring. In Proceedings of the 2017 39th Annual International Conference of the IEEE Engineering in Medicine and Biology Society (EMBC), Jeju, Korea, 11–15 July 2017; pp. 177–180. [Google Scholar]
  17. Park, S.W.; Das, P.S.; Chhetry, A.; Park, J.Y. A flexible capacitive pressure sensor for wearable respiration monitoring system. IEEE Sens. J. 2017, 17, 6558–6564. [Google Scholar] [CrossRef]
  18. Munz, M.; Wolf, N. Simulation of breathing patterns and classification of sensor data for the early detection of impending sudden infant death. Curr. Dir. Biomed. Eng. 2019, 5, 401–403. [Google Scholar] [CrossRef] [Green Version]
  19. Spilz, A.; Engleder, T.; Munz, M.; Karge, M. Development of a smart fabric force-sensing glove for physiotherapeutic applications. Curr. Dir. Biomed. Eng. 2019, 5, 513–515. [Google Scholar] [CrossRef] [Green Version]
  20. EIT-Based Fabric Pressure Sensing. Available online: https://www.hindawi.com/journals/cmmm/2013/405325/ (accessed on 26 June 2022).
  21. Teyeme, Y.; Malengier, B.; Tesfaye, T.; Van Langenhove, L. A fabric-based textile stretch sensor for optimized measurement of strain in clothing. Sensors 2020, 20, 7323. [Google Scholar] [CrossRef] [PubMed]
  22. Alias, N.M.; Razak, Z.A.; Janjori, M.; Ahmad, M.Y.; Engkasan, J.P.; Hamzaid, N.A. Epillow: A fabric-based pressure sensor array for tetraplegic patient call detection system. J. Teknol. 2022, 84, 183–192. [Google Scholar] [CrossRef]
  23. Martinez-Cesteros, J.; Medrano-Sanchez, C.; Plaza-Garcia, I.; Igual-Catalan, R.; Albiol-Pérez, S. A velostat-based pressure-sensitive mat for center-of-pressure measurements: A preliminary study. Int. J. Environ. Res. Public Health 2021, 18, 5958. [Google Scholar] [CrossRef] [PubMed]
  24. Dzedzickis, A.; Sutinys, E.; Bucinskas, V.; Samukaite-Bubniene, U.; Jakstys, B.; Ramanavicius, A.; Morkvenaite-Vilkonciene, I. Polyethylene-carbon composite (Velostat®) based tactile sensor. Polymers 2020, 12, 2905. [Google Scholar] [CrossRef] [PubMed]
  25. Cay, G.; Ravichandran, V.; Saikia, M.J.; Hoffman, L.; Laptook, A.; Padbury, J.; Salisbury, A.L.; Gitelson-Kahn, A.; Venkatasubramanian, K.; Shahriari, Y.; et al. An E-textile respiration sensing system for NICU monitoring: Design and validation. J. Sign. Process. Syst. 2022, 94, 543–557. [Google Scholar] [CrossRef]
  26. Bucinskas, V.; Dzedzickis, A.; Rozene, J.; Subaciute-Zemaitiene, J.; Satkauskas, I.; Uvarovas, V.; Bobina, R.; Morkvenaite-Vilkonciene, I. Wearable feet pressure sensor for human gait and falling diagnosis. Sensors 2021, 21, 5240. [Google Scholar] [CrossRef]
  27. Hudec, R.; Matúška, S.; Kamencay, P.; Benco, M. A smart IoT system for detecting the position of a lying person using a novel textile pressure sensor. Sensors 2021, 21, 206. [Google Scholar] [CrossRef] [PubMed]
  28. Schlegel, C.; Kiekenap, G.; Glöckner, B.; Kumme, R. Sinusoidal calibration of force transducers using electrodynamic shaker systems. Sens. Transducers 2012, 14, 95–111. [Google Scholar]
  29. Schlegel, C.; Kieckenap, G.; Kumme, R. Application of a scanning vibrometer for the periodic calibration of force transducers. In Proceedings of the International Conference on IMEKO Metrology for Green Growth, Busan, Korea, 9–14 September 2012; Volume 1, pp. 651–656. [Google Scholar]
  30. Medina, N.; De Vicente, J. Force sensor characterization under sinusoidal excitations. Sensors 2014, 14, 18454–18473. [Google Scholar] [CrossRef] [PubMed] [Green Version]
  31. Medina, N.; Robles, J.; De Vicente, J. Realization of sinusoidal forces at CEM. In Proceedings of the IMEKO Proceedings TC3 Conference 2014, Cape Town, South Africa, 3–5 February 2014; E.T.S.I. Industriales (UPM): Ciudad del Cabo, Sudáfica, 2014; pp. 58–61. [Google Scholar]
  32. Kobusch, M.; Link, A.; Buss, A.; Bruns, T. Comparison of shock and sine force calibration methods. In Proceedings of the IMEKO TC3 & TC16 & TC22 International Conference, Merida, Mexico, 27–30 November 2007. [Google Scholar]
  33. Medina, N.; de Vicente, J.; Robles, J. Magnetic fields influence on sensors with electrical output under sinusoidal excitations. ACTA IMEKO 2016, 5, 51–58. [Google Scholar] [CrossRef] [Green Version]
  34. Andreozzi, E.; Gargiulo, G.D.; Fratini, A.; Esposito, D.; Bifulco, P. A contactless sensor for pacemaker pulse detection: Design hints and performance assessment. Sensors 2018, 18, 2715. [Google Scholar] [CrossRef] [Green Version]
  35. Swanson, E.C.; Weathersby, E.J.; Cagle, J.C.; Sanders, J.E. Evaluation of force sensing resistors for the measurement of interface pressures in lower limb prosthetics. J. Biomech. Eng. 2019, 141, 1010091–10100913. [Google Scholar] [CrossRef]
  36. Out of Production 5900 Series Universal Testing Systems. Available online: http://www.instron.com/en-us/products/testing-systems/universal-testing-systems/low-force-universal-testing-systems/5900-series (accessed on 18 August 2022).
  37. Dabling, J.G.; Filatov, A.; Wheeler, J.W. Static and cyclic performance evaluation of sensors for human interface pressure measurement. In Proceedings of the 2012 Annual International Conference of the IEEE Engineering in Medicine and Biology Society, San Diego, CA, USA, 28 August–1 September 2012; Volume 2012, pp. 162–165. [Google Scholar] [CrossRef]
  38. MTS. Available online: https://www.mts.com/en/applications/materials/test-type/dynamic-mechanical-analysis (accessed on 18 August 2022).
  39. Saadeh, M.Y.; Carambat, T.D.; Arrieta, A.M. Evaluating and modeling force sensing resistors for low force applications. In Proceedings of the ASME 2017 Conference on Smart Materials, Adaptive Structures and Intelligent Systems, Snowbird, UT, USA, 18–20 September 2017. [Google Scholar]
  40. Hall, R.S.; Desmoulin, G.T.; Milner, T.E. A Technique for conditioning and calibrating force-sensing resistors for repeatable and reliable measurement of compressive force. J. Biomech. 2008, 41, 3492–3495. [Google Scholar] [CrossRef]
  41. FlexiForce Sensor Characterization Kit. Available online: https://tekscan.com/products-solutions/electronics/flexiforce-sensor-characterization-kit (accessed on 17 August 2022).
  42. Hitec HITEC Robot Servo. Available online: https://hitecrcd.com/products/servos/discontinued-servos-servo-accessories/hsr-5990tg-hmi-ultra-premium-robot-servo/product (accessed on 20 August 2020).
  43. Crank Mechanism—An Overview|ScienceDirect Topics. Available online: https://www.sciencedirect.com/topics/engineering/crank-mechanism (accessed on 18 June 2022).
  44. Coefficient of Friction Reference Chart. Available online: https://www.schneider-company.com/coefficient-of-friction-reference-chart/ (accessed on 19 June 2022).
  45. Esposito, D.; Savino, S.; Cosenza, C.; Andreozzi, E.; Gargiulo, G.D.; Polley, C.; Cesarelli, G.; D’Addio, G.; Bifulco, P. Evaluation of Grip Force and Energy Efficiency of the “Federica” Hand. Machines 2021, 9, 25. [Google Scholar] [CrossRef]
  46. Total Harmonic Distortion—An Overview|ScienceDirect Topics. Available online: https://www.sciencedirect.com/topics/engineering/total-harmonic-distortion (accessed on 29 July 2022).
  47. Interlink Electronics FSR Sensor, Force Sensing Resistor|Interlink Electronics. Available online: https://www.interlinkelectronics.com/force-sensing-resistor (accessed on 13 November 2020).
  48. Esposito, D.; Gargiulo, G.D.; Parajuli, N.; Cesarelli, G.; Andreozzi, E.; Bifulco, P. Measurement of muscle contraction timing for prosthesis control: A comparison between electromyography and force-myography. In Proceedings of the 2020 IEEE International Symposium on Medical Measurements and Applications (MeMeA), Bari, Italy, 1 June–1 July 2020; pp. 1–6. [Google Scholar]
  49. Esposito, D.; Savino, S.; Andreozzi, E.; Cosenza, C.; Niola, V.; Bifulco, P. The “Federica” hand. Bioengineering 2021, 8, 128. [Google Scholar] [CrossRef]
  50. Esposito, D.; Cosenza, C.; Gargiulo, G.D.; Andreozzi, E.; Niola, V.; Fratini, A.; D’Addio, G.; Bifulco, P. Experimental study to improve “Federica” prosthetic hand and its control system. In Proceedings of the XV Mediterranean Conference on Medical and Biological Engineering and Computing—MEDICON 2019; Henriques, J., Neves, N., de Carvalho, P., Eds.; Springer International Publishing: Cham, Switzerland, 2020; pp. 586–593. [Google Scholar]
  51. Esposito, D.; Centracchio, J.; Andreozzi, E.; Savino, S.; Gargiulo, G.D.; Naik, G.R.; Bifulco, P. Design of a 3D-printed hand exoskeleton based on force-myography control for assistance and rehabilitation. Machines 2022, 10, 57. [Google Scholar] [CrossRef]
  52. Paredes-Madrid, L.; Matute, A.; Bareño, J.O.; Parra Vargas, C.A.; Gutierrez Velásquez, E.I. Underlying physics of conductive polymer composites and force sensing resistors (FSRs). A study on creep response and dynamic loading. Materials 2017, 10, 1334. [Google Scholar] [CrossRef] [PubMed] [Green Version]
  53. Centracchio, J.; Andreozzi, E.; Esposito, D.; Gargiulo, G.D.; Bifulco, P. Detection of aortic valve opening and estimation of pre-ejection period in forcecardiography recordings. Bioengineering 2022, 9, 89. [Google Scholar] [CrossRef] [PubMed]
  54. Cosenza, C.; Nicolella, A.; Esposito, D.; Niola, V.; Savino, S. Mechanical system control by RGB-D device. Machines 2021, 9, 3. [Google Scholar] [CrossRef]
Figure 1. 3D renderings of first part of the electromechanical system: (a) exploded view of the coupling between the servomotor output shaft and the ad-hoc designed connecting rod—crank mechanism; (b) perspective to appreciate the 2-mm crank obtained with the 2-level coupler; (c) exploded view of the coupling system between the connecting rod and piston A.
Machines 10 01017 g001
Figure 2. 3D rendering of the final part of the electromechanical system: the coupling between piston A, spring, and piston B occurs within a linear guide consisting of a hollow cylinder, and allows impressing the force on the loadcell and the sensor under test.
Machines 10 01017 g002
Figure 3. Prototype of the realized electromechanical system for testing force sensors.
Machines 10 01017 g003
Figure 4. Loadcell conditioning circuit based on an instrumentation amplifier (INA122).
Machines 10 01017 g004
Figure 5. FSR-based sensor: (a) actual realization; (b) conditioning circuit based on current mirror (RG = 0.91 kΩ); (c) exploded 3D view rendering of the sensor components.
Machines 10 01017 g005
Figure 6. Actual realization of the PZT sensor and its 3D rendering.
Machines 10 01017 g006
Figure 7. Static calibration of the loadcell: scatter plot of the experimental data (circles) and linear regression (continuous red line).
Machines 10 01017 g007
Figure 8. Static calibration of the slide potentiometer: scatter plot of the experimental data (circles) and linear regression (continuous red line).
Machines 10 01017 g008
Figure 9. Relationship between the motor supply voltage and the fundamental frequency of the sine wave generated by the axial motion of piston A.
Machines 10 01017 g009
Figure 10. Recordings obtained with motor power supply set to 6 V, resulting in a stress frequency of 0.62 Hz: (a) slide potentiometer output in time domain; (b) loadcell output in time domain; (c) spectrum of slide potentiometer output (after DC removal); (d) spectrum of loadcell output (after DC removal).
Machines 10 01017 g010
Figure 11. Force—displacement relationship for one stress cycle at 0.80 Hz (motor power supply set to 8 V): force on loadcell vs. displacement of piston A. The hysteresis is graphically represented by the area between the curves depicted in red and blue.
Machines 10 01017 g011
Figure 12. FSR-based sensor output and interpolation function of its maximum peaks (red line) for motor stress frequency of 0.09 Hz (motor power supply set to 1 V).
Machines 10 01017 g012
Figure 13. Relationship between the force applied on the FSR-based sensor and the displacement of piston A, for one stress cycle at 0.09 Hz. The hysteresis is graphically represented by the area between the curves depicted in red and blue.
Machines 10 01017 g013
Figure 14. Relationship between the force applied on the PZT sensor and the displacement of piston A, for one stress cycle at 0.09 Hz. The hysteresis is graphically represented by the area between the curves depicted in red and blue.
Machines 10 01017 g014
Table 1. List of components used for the realization of the electromechanical system, and related costs in USD.
COMPONENTCOST (USD)
3D printed components (PLA)5
metal mechanical components (tubulars, bolts, screws, etc.)10
servomotor (Hitec HSR-5990TG)35
single axis loadcell (1 Kg)10
electric/electronic components (battery pack, INA, potentiometer, etc.)10
Total70
Table 2. Fundamental stress frequency, total harmonic distortion (THD), and hysteresis of the electromechanical system for various power supply voltages.
Power Supply [V]Stress Frequency [Hz]Total Harmonic Distortion [%]Electromechanical System Hysteresis [gf mm]; [µJ]
10.093.393.09; 30.3
20.203.273.52; 34.5
30.303.133.29; 32.3
40.412.992.55; 25.0
50.493.053.67; 36.0
60.622.603.27; 32.1
70.702.463.63; 35.6
80.802.146.14; 60.2
90.911.883.43; 33.6
Table 3. Hysteresis of the FSR-based sensor, percent errors of the main descriptive statistics of measurements from FSR versus loadcell values, and correlation coefficients between the FSR and loadcell signals, computed for various stress frequencies.
Stress Frequency [Hz]FSR Hysteresis [gf mm]; [µJ]Percent Error on Minimum [%]Percent Error on Maximum [%]Percent Error on Mean [%]Percent Error on SD [%]Corr. Coeff. (r): FSR vs. Loadcell
0.0961.04; 598.621.334.959.332.660.99
0.2059.21; 580.71.842.131.302.040.99
0.3062.38; 611.88.011.073.442.280.99
0.4157.09; 559.96.531.471.771.520.99
0.4953.79; 527.57.392.111.661.390.99
0.6247.51; 465.93.901.001.465.380.99
0.7047.93; 470.07.092.250.750.520.99
0.8050.33; 493.64.070.472.203.080.99
0.9139.86; 390.90.902.290.101.010.99
Table 4. Hysteresis of the PZT sensor, percent errors of the main descriptive statistics of measurements from PZT versus loadcell values, and correlation coefficients between the PZT and loadcell signals, computed for various stress frequencies.
Stress Frequency [Hz]PZT Hysteresis [gf mm]; [µJ]Percent Error on Minimum [%]Percent Error on Maximum [%]Percent Error on Mean [%]Percent Error on SD [%]Corr. Coeff. (r): PZT vs. Loadcell
0.0926.55; 260.46.546.240.159.290.99
0.2021.56; 211.45.110.140.841.500.99
0.3019.93; 195.53.500.820.930.580.99
0.4118.60; 182.43.550.221.100.510.99
0.4918.25; 179.04.990.900.010.380.99
0.6218.04; 177.03.510.770.161.070.99
0.7017.90; 175.52.431.090.202.210.99
0.8016.90; 165.77.770.840.821.670.99
0.9115.92; 156.13.441.670.480.380.99
Publisher’s Note: MDPI stays neutral with regard to jurisdictional claims in published maps and institutional affiliations.

