Article

Study on Inflow Distortion Mechanism and Energy Characteristics in Bidirectional Axial Flow Pumping Station

1
Research Center of Fluid Machinery Engineering and Technology, Jiangsu University, Zhenjiang 212013, China
2
Wenling Fluid Machinery Technology Institute of Jiangsu University, Wenling 317525, China
3
Crane Fengqiu (Zhejiang) Pump Co., Ltd., Zhuji 311800, China
*
Author to whom correspondence should be addressed.
Machines 2022, 10(11), 1014; https://doi.org/10.3390/machines10111014
Submission received: 9 October 2022 / Revised: 26 October 2022 / Accepted: 27 October 2022 / Published: 2 November 2022
(This article belongs to the Section Turbomachinery)

Abstract

:
In the present work, unsteady flow solved by the Reynolds time-averaged Navier–Stokes equation was investigated to determine the inflow distortion mechanism and the spatial distribution of hydraulic loss in a bidirectional axial flow pumping station (Case 1) based on the entropy production theory. A laboratory-scale performance experiment was also employed for the accuracy verification of the simulation approach, and an axial flow pump with pipe passages (Case 2) accompanying uniform inflow was utilized for analysis comparison. The results show that the non-uniform inflow causes a noticeable reduction in head and efficiency, as high as 27% and 21%, respectively, and the best efficiency point with uniform inflow shifts to the point with a larger flow rate. The axial velocity of the impeller inlet in Case 2 changes more smoothly along the Span compared with that in Case 1, which further indicates a more uniform inflow at the impeller inlet. The total entropy production (TEP) of each domain in Case 1 is always higher than that in Case 2, and the TEP of the whole domain in Case 1 increased by 18.68%, 30.50%, and 29.67% with flow rates of 0.8Qdes, 1.0Qdes, and 1.2Qdes, respectively, compared with that in Case 2. In the inlet passage, the larger TEPR regions in Case 1 are mainly located in the horn passage, which is far away from the inlet side, and are also distributed in the suction side of impeller blades and guide vanes. Therefore, this work may provide an optimal design reference for pumping stations in practical application.

1. Introduction

Pumps are widely used in life and industries, including micropumps, which are utilized as the driving device of microfluidic in microelectromechanical systems [1,2,3], and the pumping stations in inter-basin water transfer projects and the fields of urban and industrial water supply and drainage [4,5,6]. Among them, the bidirectional vertical axial flow pumping station is commonly applied for both irrigation and drainage due to its compact structure, convenient maintenance, and low cost. Owing to the special structure of two-way passages, non-uniform inflow occurs at the impeller inlet, which often alters the hydraulic performance [7]. A good example is the experimental analysis of the effects of the inlet conduit on the performance of the pumping station [8], wherein the non-uniform inflow may result in bearing wear, excessive noise, vibration, and even blade damage, followed by a remarkable reduction in hydraulic efficiency. Therefore, the inflow distortion mechanism, which comes from the non-uniform inflow caused by the non-axisymmetric inlet conduit, appears to be a critical element in understanding the decrease in hydraulic performance to ensure the sustainable stable operation of the pumping station.
To cover the functions of irrigation and drainage, bidirectional inlet and outlet passages are applied in the pumping station. These passages differ from straight (or pipe) passages with a uniform inflow. It was reported that the inflow distortion caused by the curved inlet channel leads to an uneven, asymmetrical, and non-axial velocity distribution of the blade inlet section with seriously unbalanced radial force [9,10,11]. Lu et al. [12] experimentally found that various inlet passages of the axial flow pump are accompanied by different inflow fields and hydraulic loss, which causes different pump performances. Based on the PIV method, Xu et al. [13] investigated the influence of non-uniform inflow on the streamline and vortex characteristics of the inlet channel. They showed that a large suction vortex occurs at the inlet of the impeller, and the turbulent flow intensity further increases with the existence of non-uniform inflow. Wang et al. [14] analyzed the velocity field of the inflow and the pressure loading on the blades with distortion inflow in a reactor coolant pump and revealed that the circular symmetry of the flow field is destroyed, followed by unbalanced force on the blades, which exacerbates the fatigue of the impeller. Consequently, the inlet pre-swirl is not negligible, such that the cylinder-independent assumption used in the theoretical design of an axial flow pump is no longer valid, and the maximum reduction in hydraulic performance is as high as 30% in a water jet pump [15,16,17].
For further visual analysis of the spatial distribution of hydraulic loss in pumps, entropy generation theory was proposed in computational fluid dynamics (CFD) [18,19,20,21,22]. Non-uniform inflow aggravates the vortex phenomenon inside the pumping station, and a low-pressure area generated by the vortex core forms a high-pressure gradient, which leads to a significant energy exchange followed by hydraulic loss. Entropy generation theory is an efficient method to capture energy dissipation. The idea of optimizing the design of working components with the goal of minimizing entropy production was formulated by Bejan [23]. Shen et al. [24] investigated the effects of discharge and tip clearance on mechanical energy dissipation of an axial flow pump with the entropy generation method and analyzed the distributions of the turbulent entropy generation rate for different components. Böhle et al. [25] explored the location of hydraulic losses in a side-channel pump and estimated the magnitude of losses using the entropy generation rate. Based on the theory of entropy production, Li et al. [26] utilized the relationship between velocity distribution and entropy generation fields in a single-stage centrifugal pump to reveal that the backflow near the water outlet of the blade is the main reason for the unstable characteristics of the head–efficiency curve. Feng et al. [27] studied the distribution of energy loss in the flow field of overcurrent components during the power-off runaway process in a centrifugal pump and reported that the energy loss is closely related to the undesired flow phenomena such as flow separation, backflow, and vortex inside the flow field.
Consequently, the entropy generation theory is proven to be a feasible and effective method for analyzing the effect of inflow distortion on hydraulic losses. The main aim of this study was to investigate the spatial distribution of hydraulic loss caused by inflow distortion and reveal the energy characteristics in a bidirectional vertical axial flow pumping station. In this paper, the simulation models with bidirectional passages and pipe passages are firstly described, as well as the main design parameters. Then, the governing equations and boundary conditions employed for the three-dimensional viscous, incompressible, unsteady flow are introduced, and the entropy production theory is also illustrated in detail. A laboratory-scale hydraulic performance experiment was carried out to verify the accuracy of the calculation method. Finally, the local energy loss using the entropy production approach with non-uniform and uniform inflow is visualized and discussed, and the main conclusions are presented in the Section 5.

2. Simulation Model

2.1. Pump Models with Bidirectional Passages and Pipe Passages

It is widely known that the shape of the inflow channel alters the inflow field, which determines whether the inflow distortion occurs or not, having remarkable effects on the hydraulic performance of the whole pumping station. In this work, we focused on a bidirectional vertical axial flow pumping station model to investigate the inflow distortion mechanism and energy characteristics caused by an X-shaped flow channel, and a model with pipe passages was also constructed for comparison. The three-dimensional hydraulic pumping station was generated by Creo software for each component, including the X-shaped flow channel (or bidirectional passages), pipe passages (for inflow and outflow passages), impeller domain, and guide vane domain. The assembled pumping station models with the same impeller and guide vane and different passages are shown in Figure 1, and several key parameters for the design operation of the bidirectional vertical axial flow pumping station are listed in Table 1.

2.2. Mesh Generation

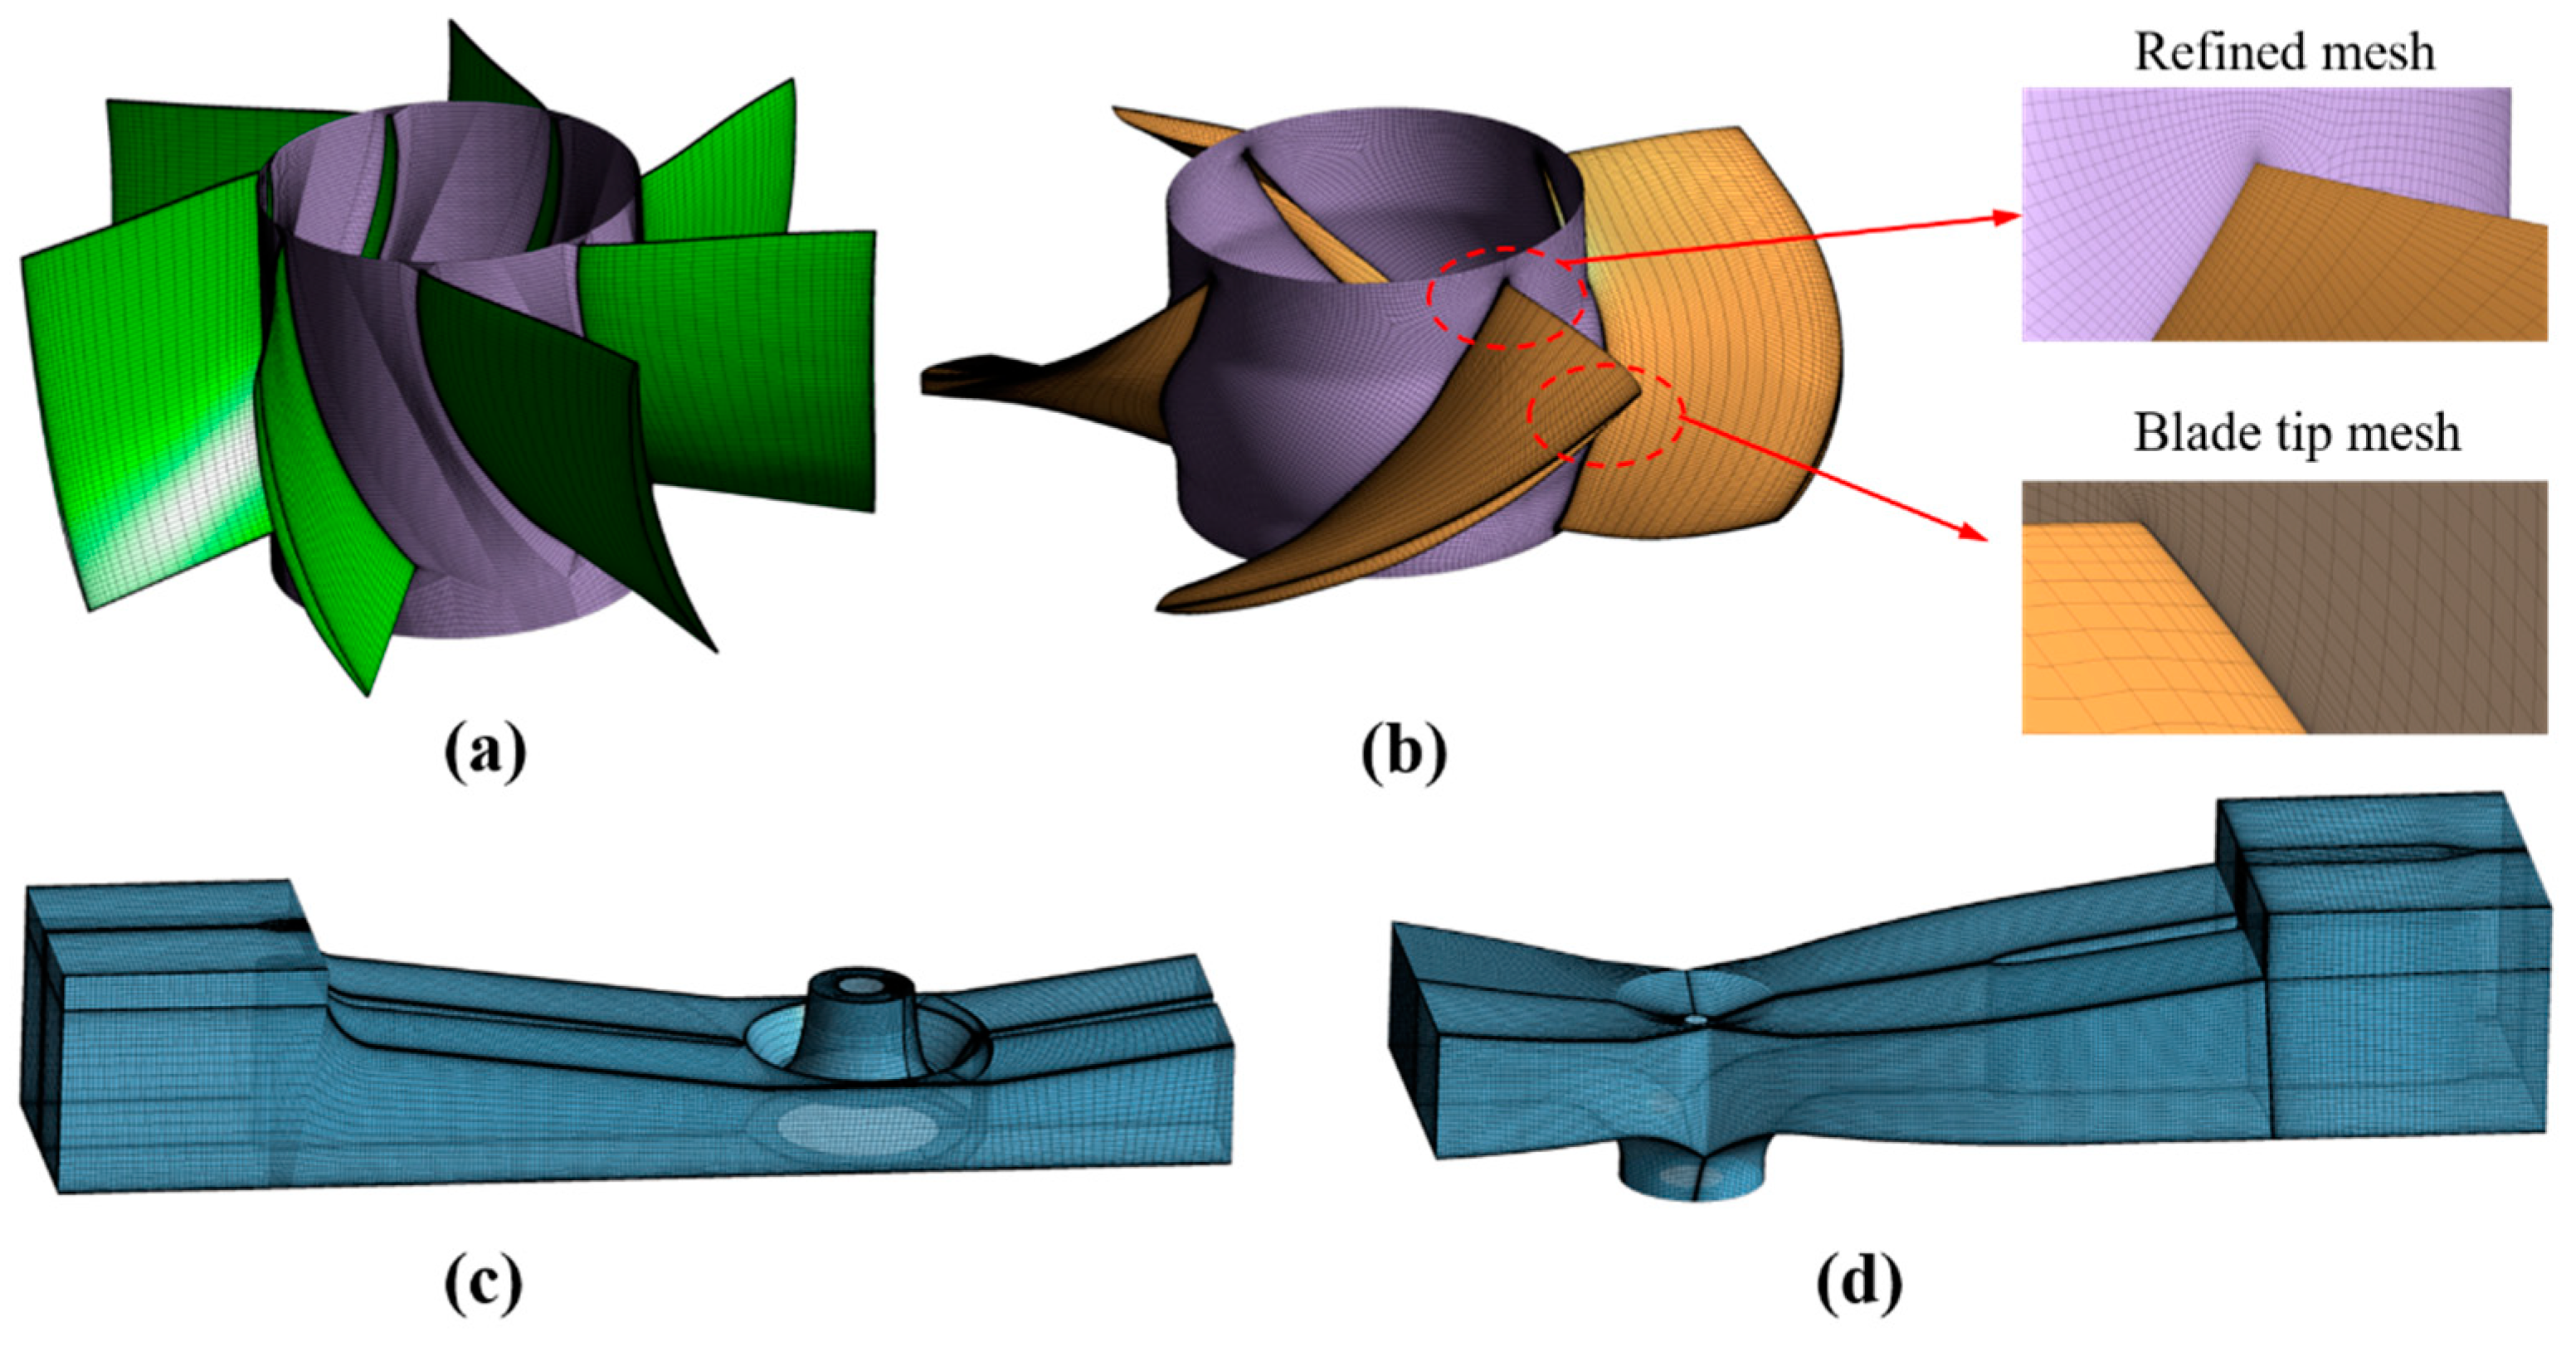
The grid generation is the basis for the spatial discretization of the governing equations for the flow field, and it is also a crucial part of the preprocessing of the numerical simulations. Considering the complex architecture of the bidirectional vertical axial flow pumping station, the hexahedral structured meshes were generated by the commercial software ANSYS ICEM for all domains aiming for better convergence of the calculation. For the pipe passages, an O-block topological structure was produced due to the cylindrical architecture. In order to capture the flow field with high precision near the solid walls and relief of the simulation divergence, the refined mesh was utilized in the solid surface and the blade tip region. The numbers of elements for the impeller and guide vanes were around 1.3 and 1.9 million, respectively, and the total numbers of elements for the bidirectional axial flow pumping station and axial flow pump with pipe passages were around 5.56 and 5.02 million, respectively. The whole structured mesh information is depicted in Figure 2.

3. Numerical Simulation Method

3.1. Governing Equations and Boundary Conditions

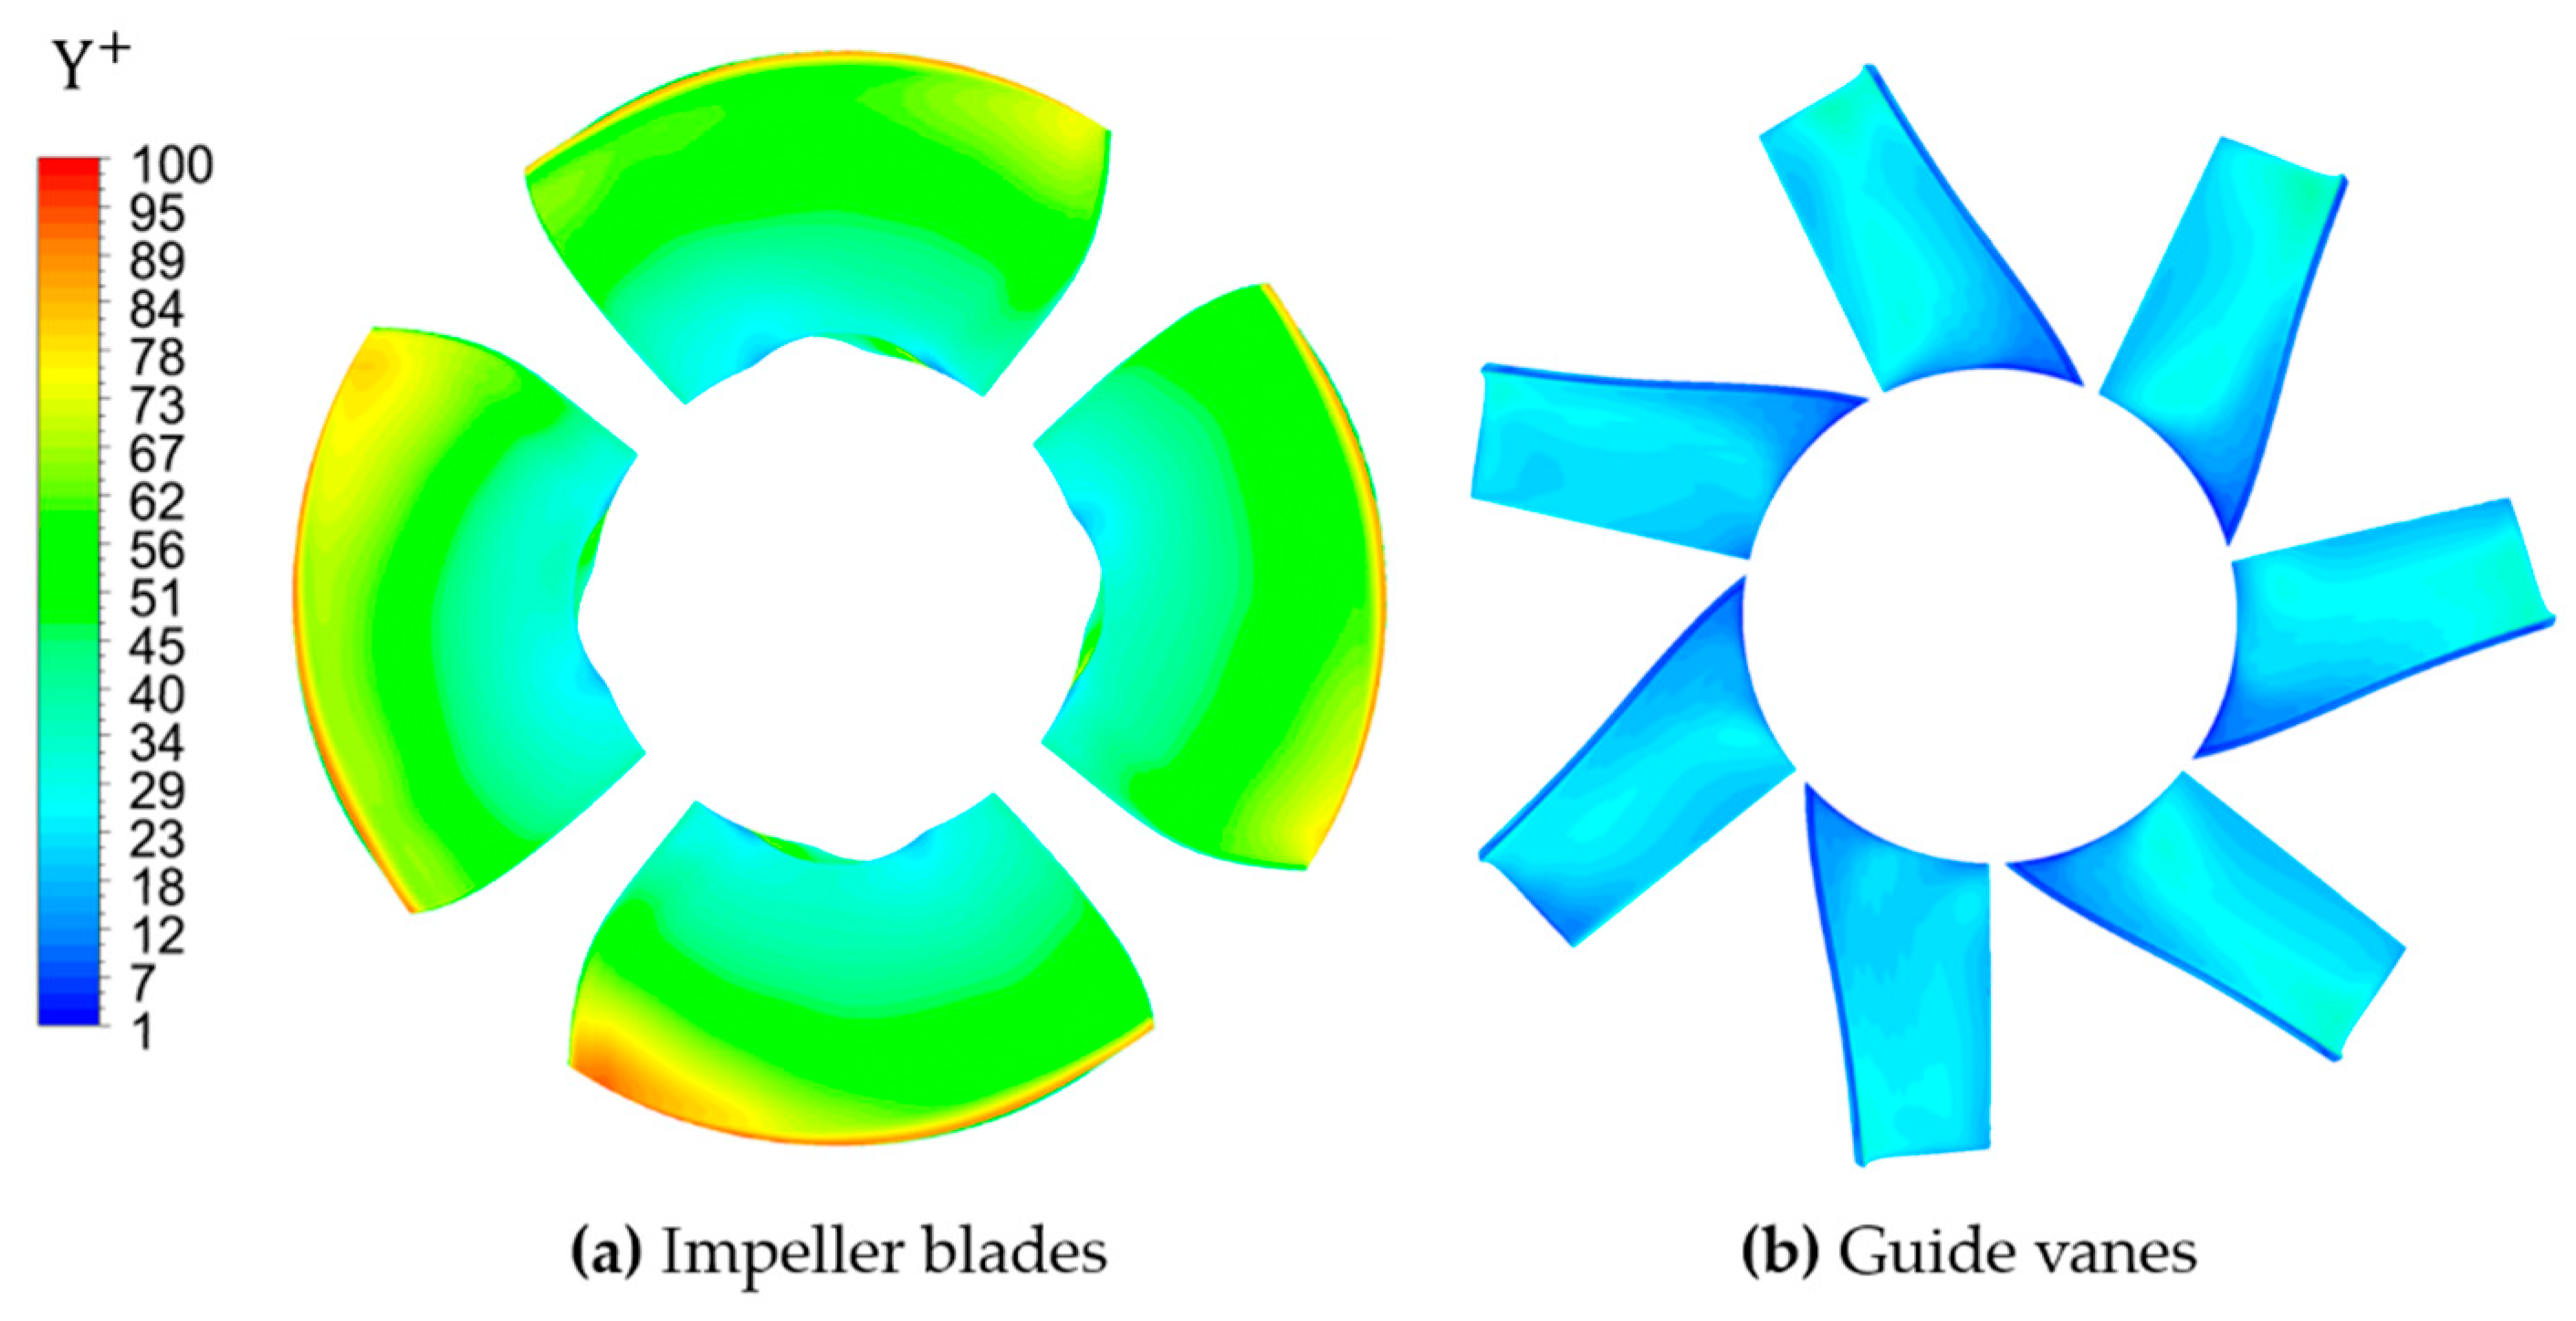
The flow inside the pumping station is three-dimensional, viscous, incompressible, unsteady flow, governed by the continuity equation and momentum equation. Therefore, all the simulations with the unsteady Reynolds time-averaged Navier–Stokes equation were carried out using the CFD software of ANSYS CFX. The turbulence model with the shear stress transfer model (SST k ω ) is adopted since pioneering works in the literature [28,29] have reported that it is suitable for predicting the vortex structure and pump performance. Considering the calculation requirement for the mentioned turbulence model, the maximum Y+ value of the impeller blade and guide vane surface is less than 110, as shown in Figure 3.
Initially, steady simulations of the vertical axial flow pump with bidirectional passages and with pipe passages were conducted, and the transient simulations, which were used for the analysis of internal flow fields, were then carried out based on the initial data of the previous steady results. The mass flow rate was set as the inlet boundary condition, while the “Opening Pres. and Dirn” was applied for the outlet section. The reference pressure with a value of 1 atm was selected for all the simulations. Considering the wall roughness in practical operation, all the solid walls were set as “rough walls”, with a value of 0.0125 mm. In the setup process, the stage (mixing plane) was employed for the steady simulations, while the transient rotor–stator interface was selected for the transient simulation. The timestep of the transient simulation is 3.5486 × 10 4 s, and accordingly the impeller rotation was set to 3°. When the iteration of the calculation results approaches 10 5 , the simulation can be regarded as converged.

3.2. Entropy Production Theory

In fluid machinery, the irreversible losses caused by the fluid viscosity and Reynold stress always occur during operation when part of the mechanical energy from the motor is dissipated into internal energy, followed by an increased entropy generation. Therefore, the entropy production theory could be a proper approach to evaluate the hydraulic energy loss in a bidirectional vertical axial flow pumping station, which comes from the inflow distortion. Considering the incompressible flow field and constant temperature with single-phase fluid, the entropy production rate in the axial flow pump with the fluid density ρ can be expressed as below [30]:
ρ S t + u 1 S x + u 2 S y + u 3 S z = d i v q T + Φ T
where q , t , and T represent the heat flux, time, and temperature, respectively; S stands for the specific entropy, and u 1 ,   u 2 , u 3 are the velocities in three different directions of the Cartesian coordinate. Φ / T is the specific entropy production rate, which is generated by the viscosity dissipation.
As the flow in the pumping station is turbulent with a high Reynolds number, the local total entropy production rate (TEPR) S ˙ D   can be determined by time-averaging with another two terms included as follows:
Φ T ¯ = S ˙ D = S ˙ D ¯ + S ˙ D
where S ˙ D ¯ , S ˙ D stand for the entropy production rate induced by the time-averaged process and the velocity fluctuation, respectively. Considering the incompressible fluid during operation, these two terms can be expressed based on the continuity equation as below:
S ˙ D ¯ = μ T 2 u ¯ 1 x 2 + u ¯ 2 y 2 + u ¯ 3 z 2 + u ¯ 1 y + u ¯ 2 x 2 + u ¯ 2 z + u ¯ 3 y 2 + u ¯ 3 x + u ¯ 1 z 2
S ˙ D = μ T 2 u 1 x 2 + u 2 y 2 + u 3 z 2 + u 1 y + u 2 x 2 + u 2 z + u 3 y 2 + u 3 x + u 1 z 2
where u ¯ and u are the averaged velocity and fluctuating velocity quantities, respectively, and μ is the dynamic viscosity. The variable S ˙ D ¯ can be calculated directly during post-processing with the simulated results, while the term by the velocity fluctuation S ˙ D needs to be further calculated by the expression below:
S ˙ D = ρ ε T
where ε stands for the turbulent dissipation rate. Therefore, combined with all the expressions above, the total entropy production (TEP) S ˙ D   can be evaluated by integrating each entropy production rate in a certain volume as follows:
S ˙ D ¯ = V S ˙ D ¯ d V
S ˙ D = V S ˙ D d V
S ˙ D = S ˙ D ¯ + S ˙ D
where the symbols S ˙ D ¯ and S ˙ D are the entropy production induced by the time-averaged process and by velocity fluctuation, respectively. Thus, once the total entropy production is estimated, the energy losses in the flow field can be also obtained.

4. Results and Discussions

4.1. Pump Performance Verification

The laboratory-scale hydraulic performance experiment in a bidirectional axial flow pumping station was carried out as shown in Figure 4. Both the test loop and the pump unit were vertically installed in a closed test bench. Due to the low obstruction by the electromagnetic fluctuation, a DC motor was arranged above the shaft for the power supply. A torque meter with ±0.1% accuracy was placed to measure the value of shaft speed. Two water tanks were located at the inlet and outlet of the pump unit to ensure stable pressure. When the pump system was operated with a large flow rate, a booster pump was employed to maintain the circulation of water, and electric valves were utilized to adjust the flow rate, which was measured by a flowmeter for different operation conditions. In addition, the measurement uncertainty of the flow rate, the head, and the test bench system was 0.2%, 0.1%, and less than 0.3%, respectively.
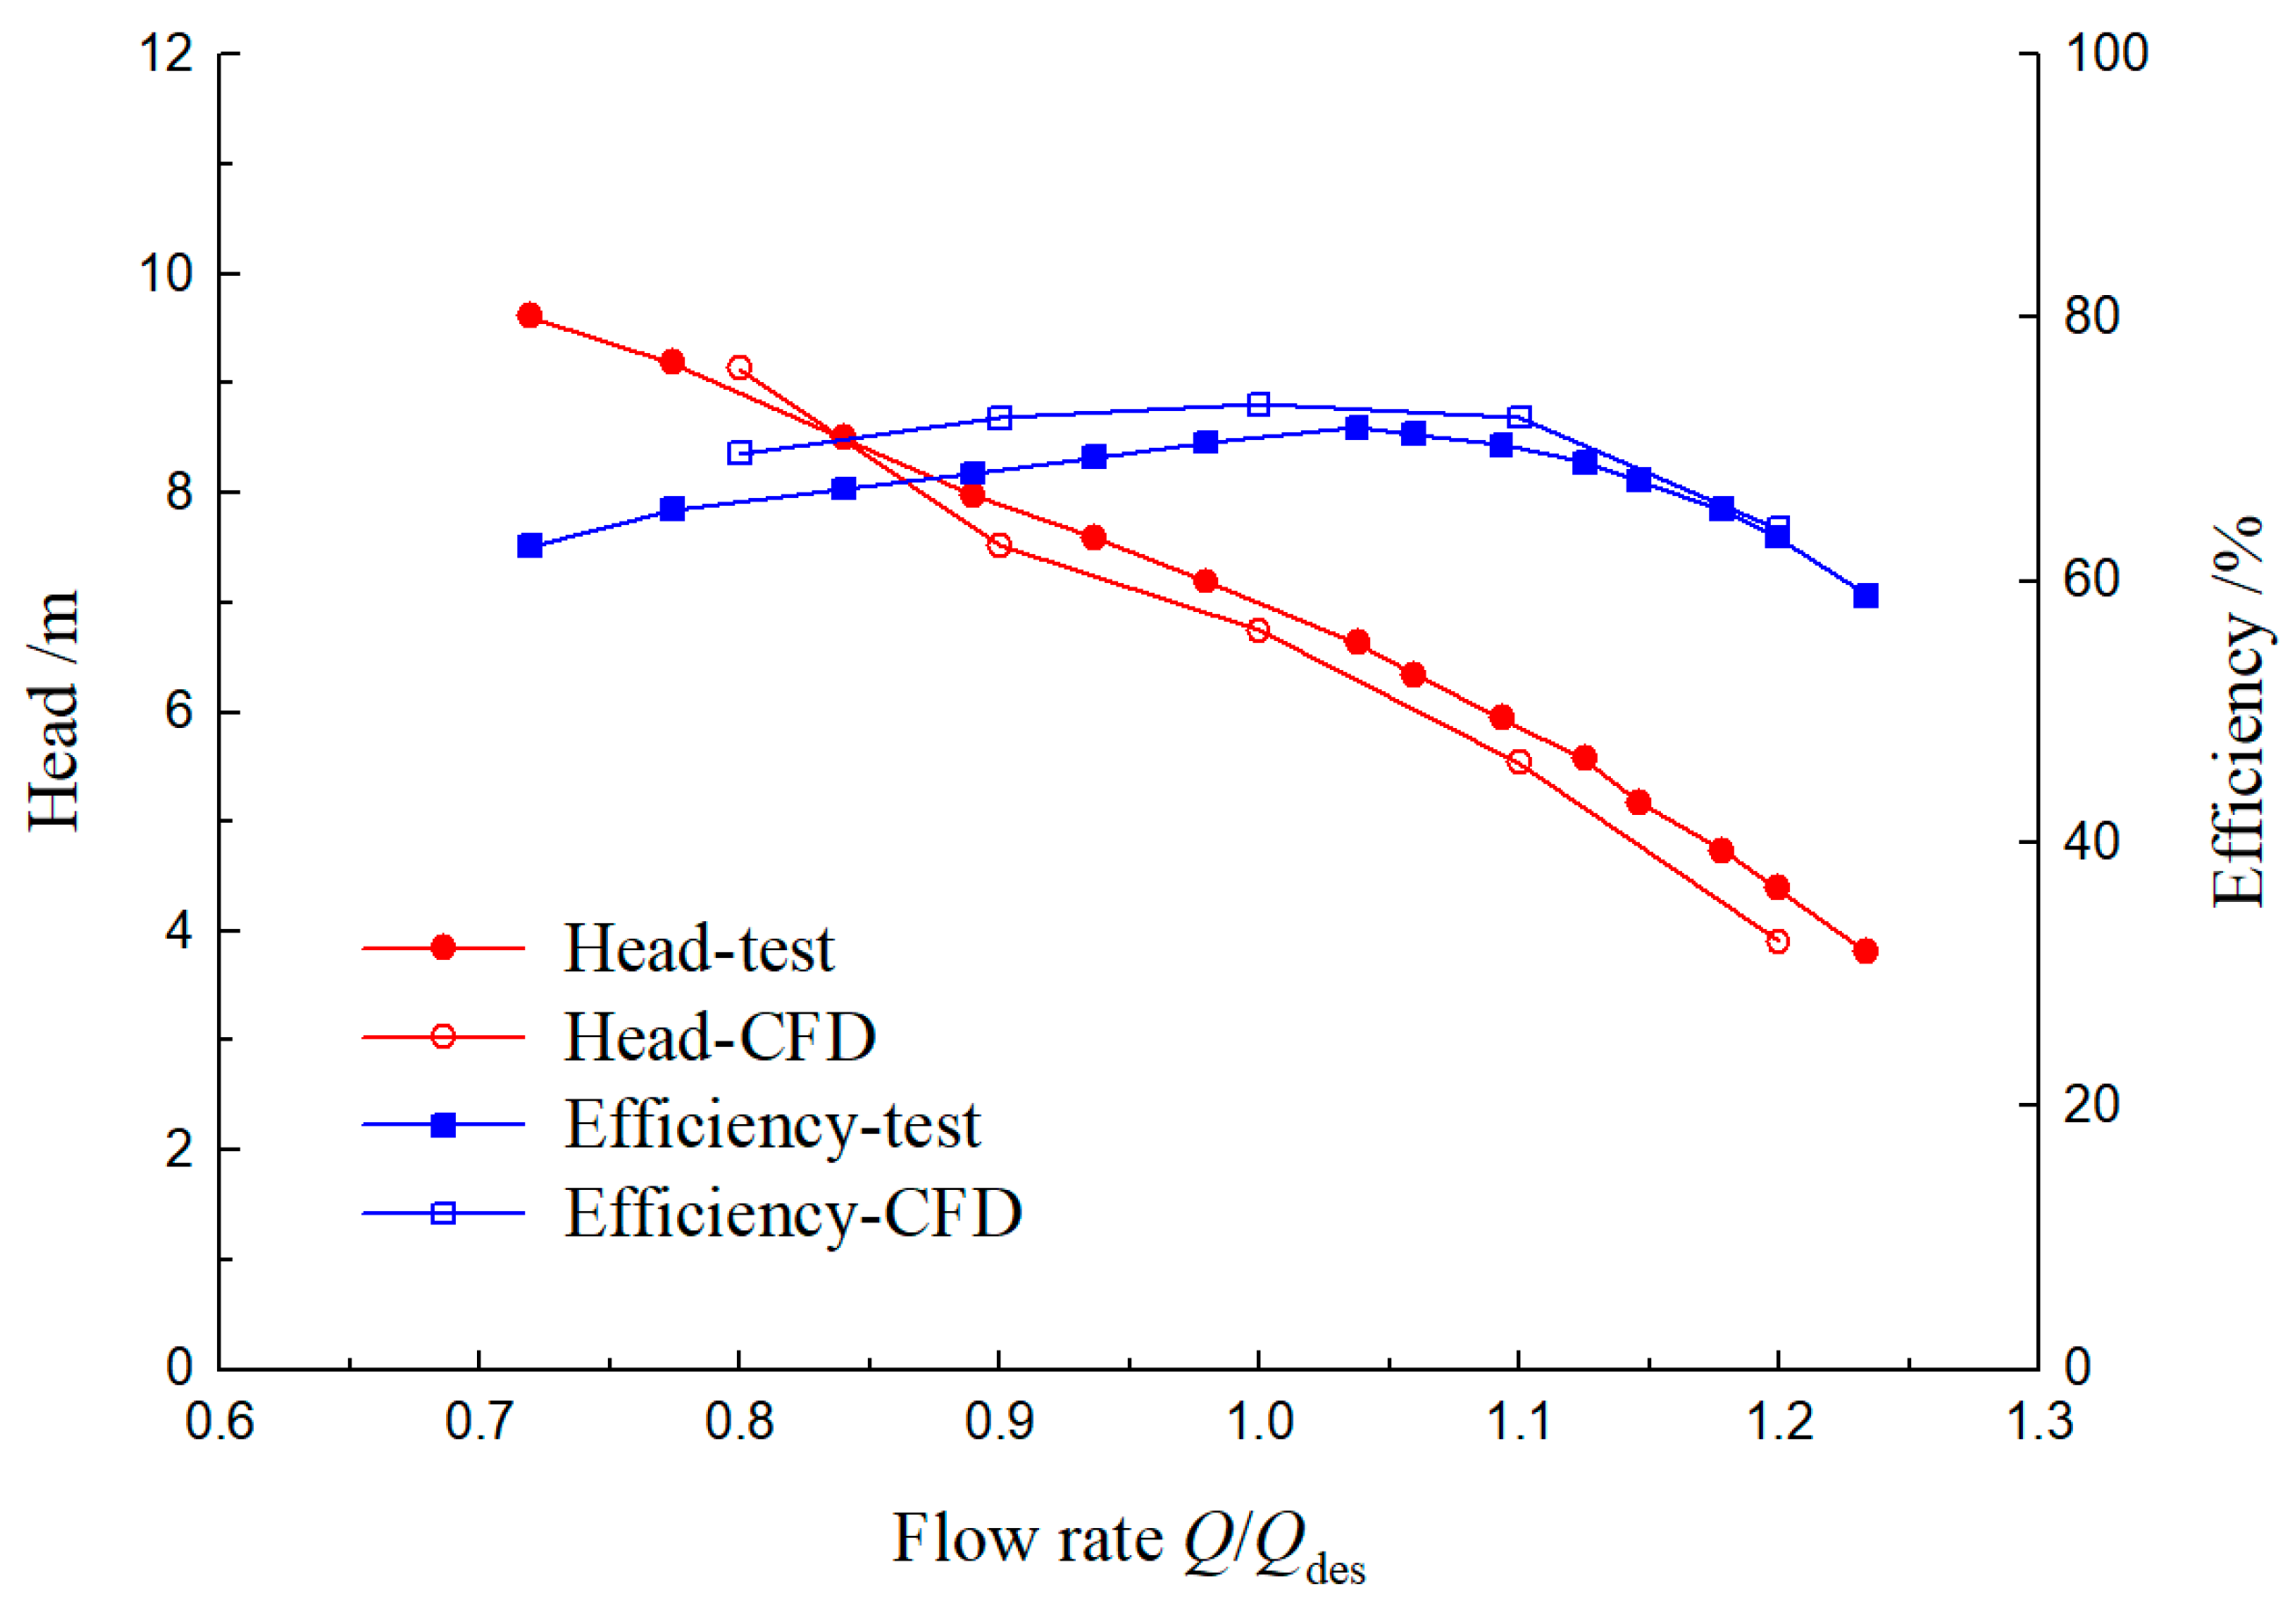
The results of the hydraulic performance in a bidirectional axial flow pumping station between the experiment and the simulation data are compared in Figure 5. From the figure, a good agreement can be clearly identified between the results of the experiment and those found through calculation. The head of CFD is slightly lower than that of the test except for the data for a small flow rate (Q = 0.8Qdes with Qdes denoting the design flow rate), while the efficiency of CFD is slightly higher than that of the test. For the design flow rate, the efficiencies of test and CFD are 70.96% and 73.44%, and the heads of test and CFD are 6.75 and 6.52 m with the errors between test and CFD being 3.49% and 3.41%, respectively. For the results with an off-design flow rate, the largest error between the simulation and experiment is less than 6%, which is acceptable. Thus, the simulation results can be regarded as reliable, and the simulation method used in this study can be utilized in further studies.

4.2. Energy Performance Comparison between the Uniform and Non-Uniform Inflow

The bidirectional intake causes non-uniform inflow (or inflow distortion), while the pipe passage intake results in uniform inflow. Therefore, the distortion mechanism caused by the non-uniform inflow needs to be further explored by comparing the results between uniform and non-uniform inflows. In addition, for better identification, all the calculated results of the bidirectional axial flow pumping station are referred to as “Case 1” and those of the axial flow pump with pipe passages are named “Case 2”. Figure 6 presents the results of energy performance between Case 1 (bidirectional passages) and Case 2 (pipe passages), and both two cases contain the same impeller and the guide vanes for the same simulation method. The effect of non-uniform inflow on the energy characteristics of the axial flow pump is obvious. Although both tendencies with the flow rate of the head and efficiency for Cases 1 and 2 are the same, the hydraulic performance of Case 1 is much lower than that of Case 2, especially with a large flow rate, which means the non-uniform inflow causes a large drop in the energy performance, and the largest reduction is as high as 27% for head and 21% for efficiency at a flow rate of 1.2Qdes. In addition, it is clearly shown that the highest efficiency operating point shifts to a larger flow rate of 1.1Qdes with Case 2 for uniform inflow.
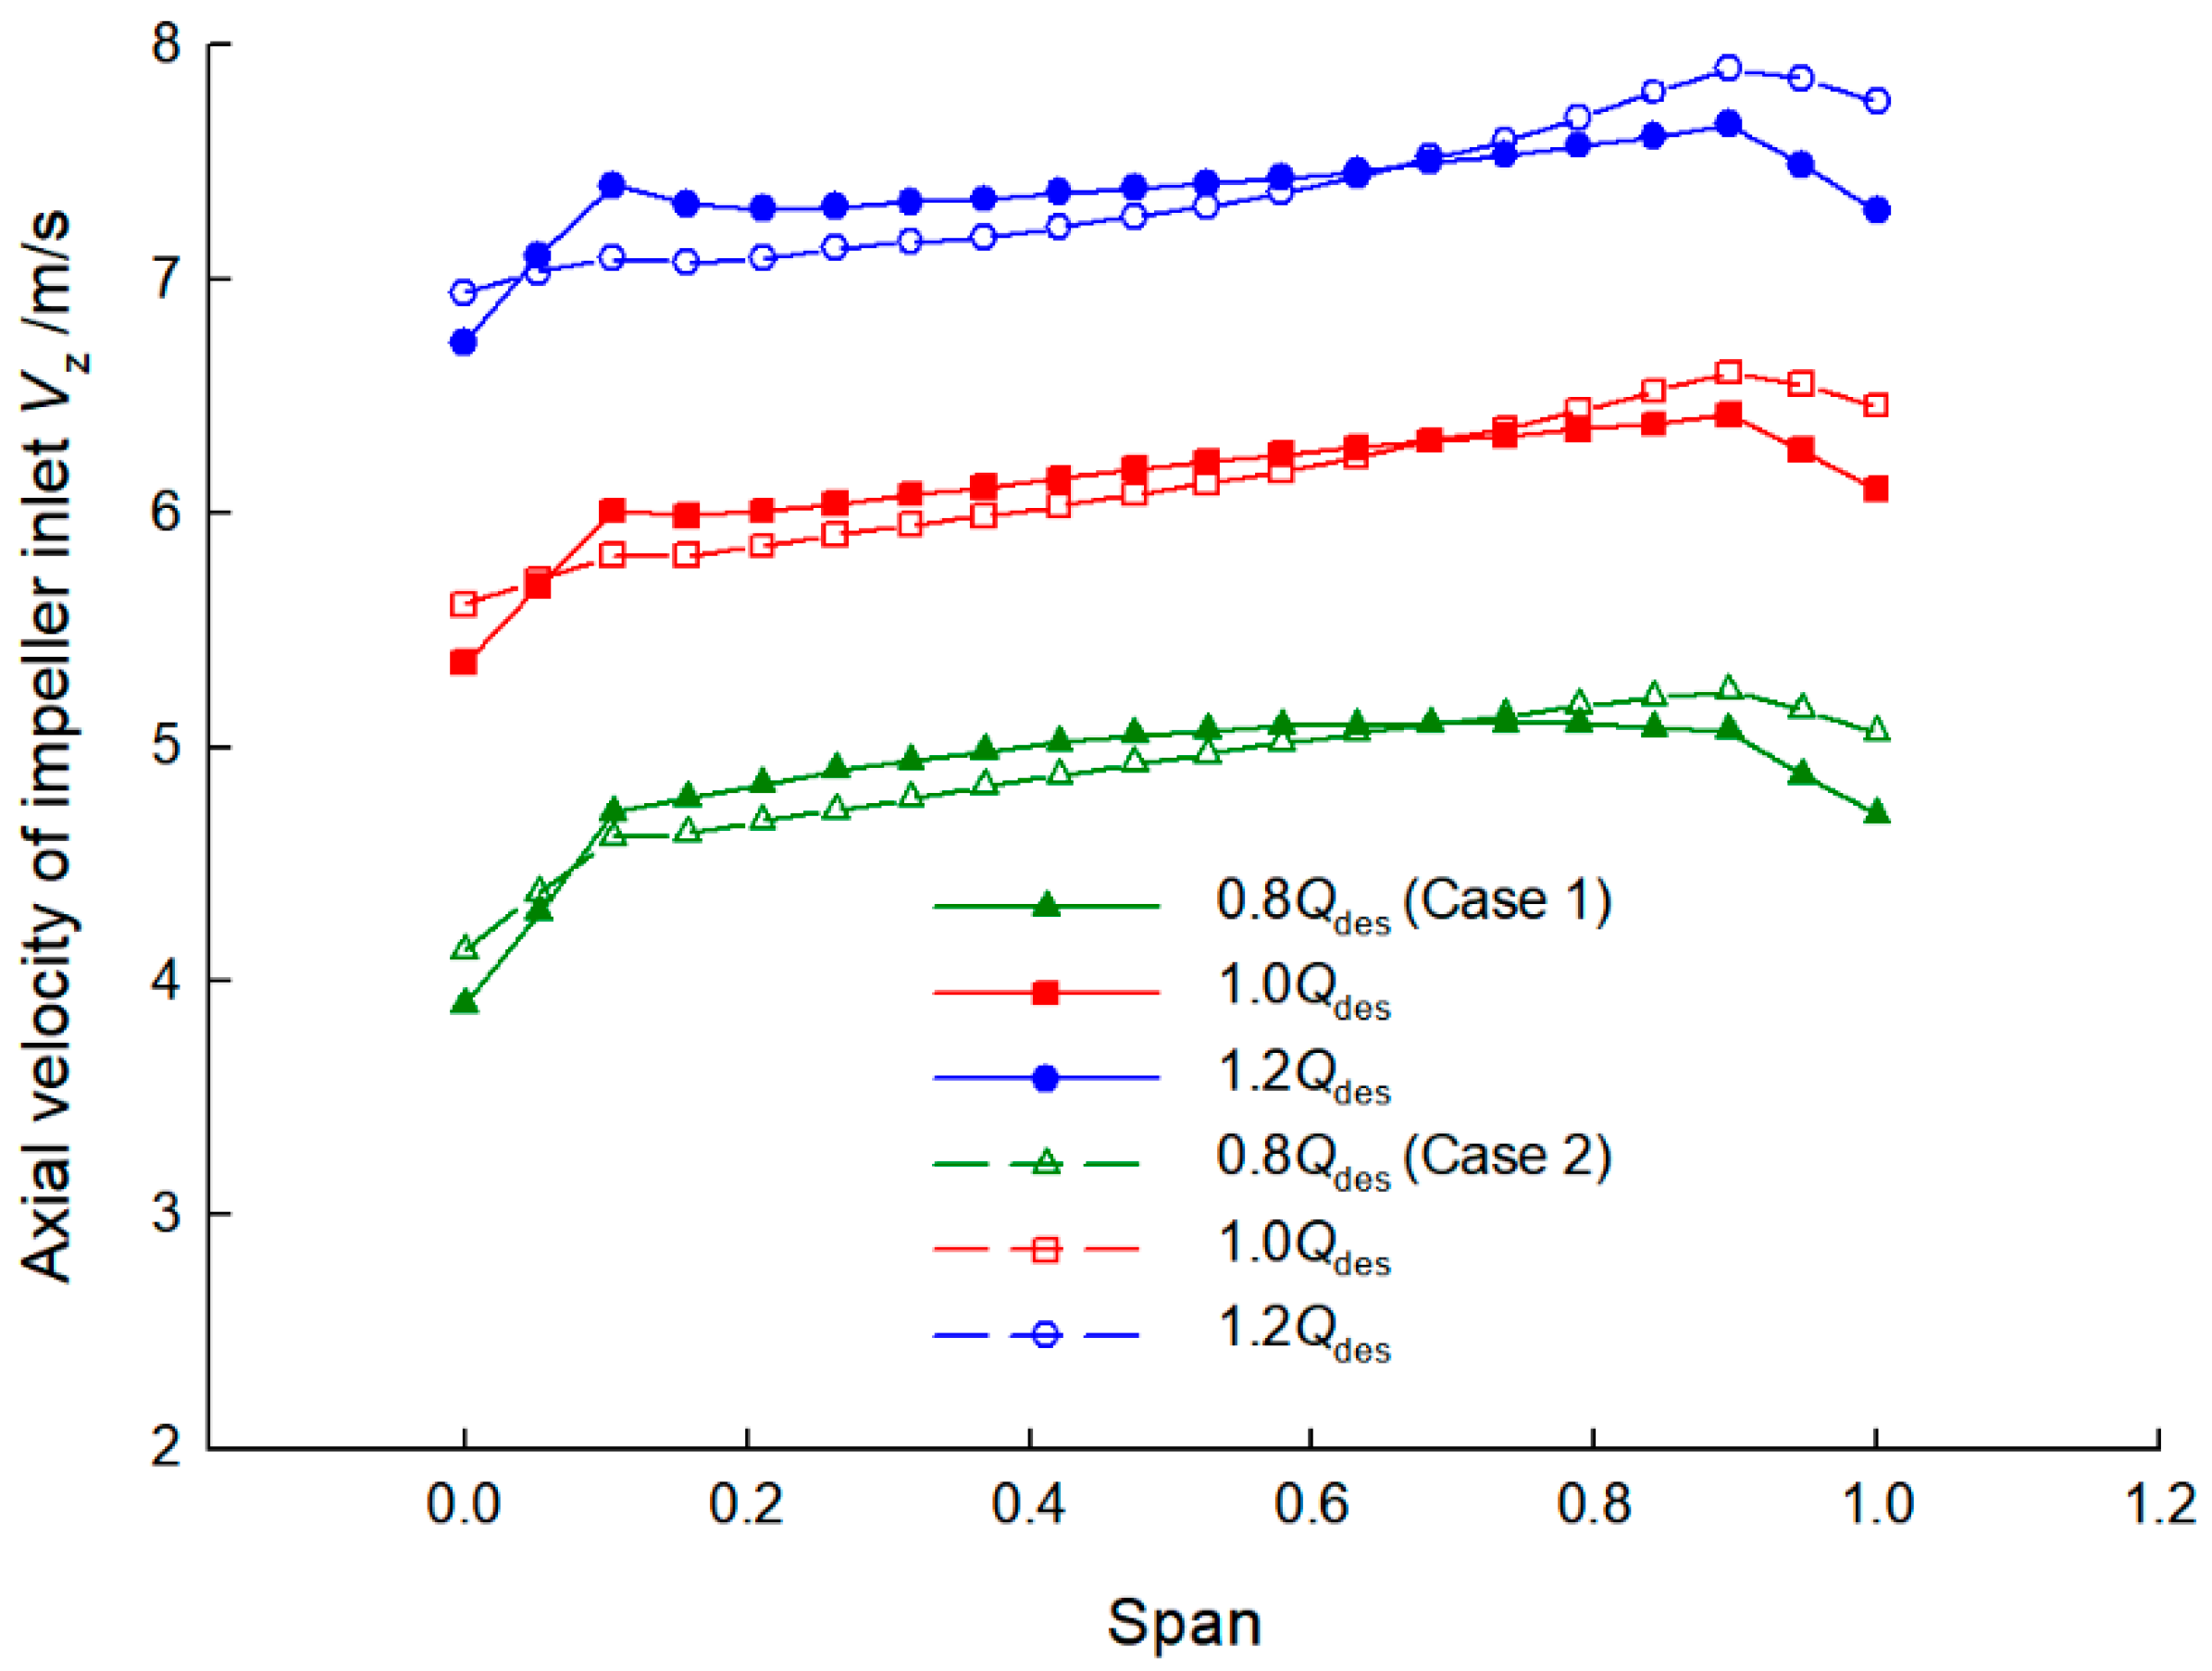
The bidirectional passages in Case 1 accompany a non-uniform inflow, while the pipe passages in Case 2 have a uniform inflow. A straightforward effect of non-uniform inflow is described with the axial velocity of the impeller inlet for each case as a function of Span with different flow rates as shown in Figure 7. The Span is a dimensionless variable that is defined as Span = R R h / R s R h , with R , R h and R s being the radius of the calculated circle, the hub radius, and the shroud radius, respectively. As the axial velocity is proportional to the flow rate, an obvious improvement can be achieved with a flow rate of 0.8Qdes to a flow rate of 1.2Qdes in both cases. An increase in axial velocity near Span = 0 (near the hub) and a reduction in axial velocity near Span = 1 (near the shroud) are observed due to the effects of wall viscous shear and tip clearance. However, compared with the apparent ascent and descent of the axial velocity along the Span in Case 1, the change in axial velocity in Case 2 appears more smoothly with the growth of the Span, especially with flow rates of 1.0Qdes and 1.2Qdes. This further indicates that the inflow at the impeller inlet in Case 2 is much more uniform than that in Case 1.

4.3. Analysis of Total Entropy Production for Each Case with Different Flow Rates

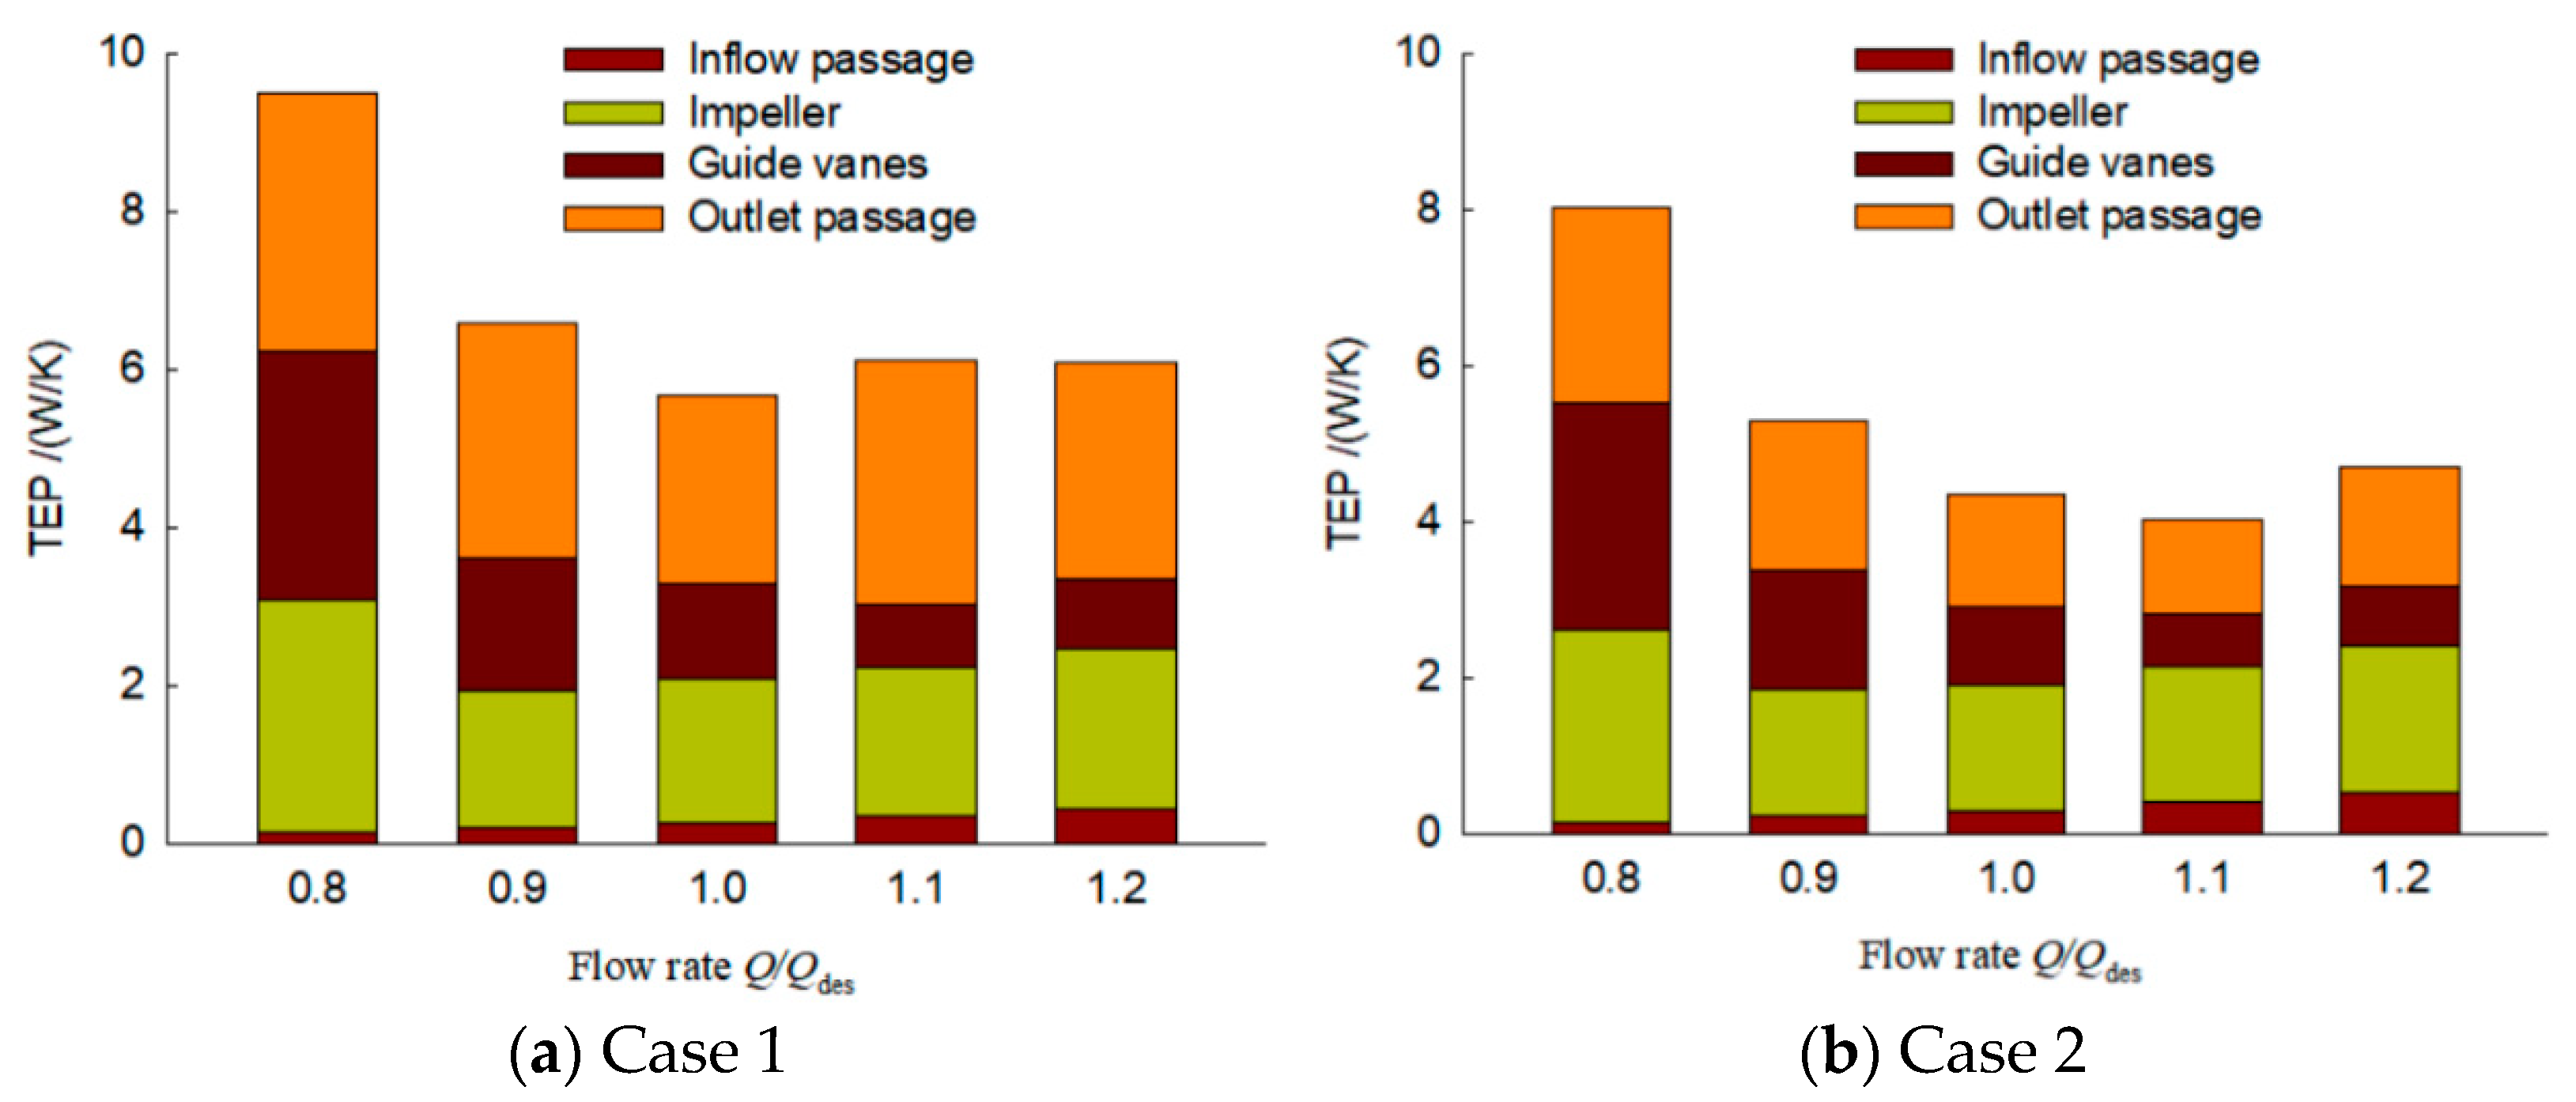
The total entropy production (TEP) of each component, i.e., inflow passage, impeller, guide vanes, and outlet passage, between Cases 1 and 2 with various flow rates is depicted in Figure 8. It is obvious that the TEP of the sum of the impeller and guide vanes is the largest, accounting for almost 43~67% from the small flow rate of 0.8Qdes to the large flow rate of 1.2Qdes, due to the fact that most flow separation and flow fluctuation occur in the impeller and guide vanes, resulting in serious energy losses. The TEP of the inflow passage of both cases is the lowest compared with other domains, only 2~11%, and it increases with flow rates, while the TEP of guide vanes decreases with an increase in flow rate, since the flow circulation at the impeller outlet is relieved gradually with an increase in flow rate. As for the TEP of the outlet passage, it does not change linearly with the flow rate. For Case 1, the TEP of the outlet passage decreases first and increases again from a flow rate of 0.8Qdes to 1.2Qdes, with the same tendency occurring with the flow rate for Case 2. In addition, the non-uniform inflow in Case 1 makes it clear that the TEP of each domain in Case 1 is obviously larger than that in Case 2 with the uniform inflow.
The total entropy production of the whole calculated domain between Cases 1 and 2 with different flow rates is shown in Table 2. The TEP of both Cases 1 and 2 presents a decrease first and an increase again from 0.8Qdes to 1.2Qdes. At design flow rate, the TEP of Case 1 is clearly the lowest compared with that with off-design flow rate, and the TEP of both cases with the flow rate 0.8Qdes has the largest proportion, which also reflects that the energy losses with design flow rate are minimum, with the least unsteady flow characteristics and the highest flow efficiency. Interestingly, the minimum proportion of TEP in Case 2 occurs with a flow rate of 1.1Qdes, which is consistent with the result in Figure 6 that the best efficiency point shifts to a higher flow rate with uniform inflow. Compared with the TEP of Case 2 with uniform inflow, the TEP of Case 1 with non-uniform inflow is significantly larger with each flow rate, and the largest increase rate is as high as 52.15%. The design flow rate increased by 30.50% while with flow rates of 0.8Qdes and 1.2Qdes, and it improved by 18.68% and 29.67%, respectively.

4.4. Analysis of Total Entropy Production Rate for Each Case with Different Flow Rates

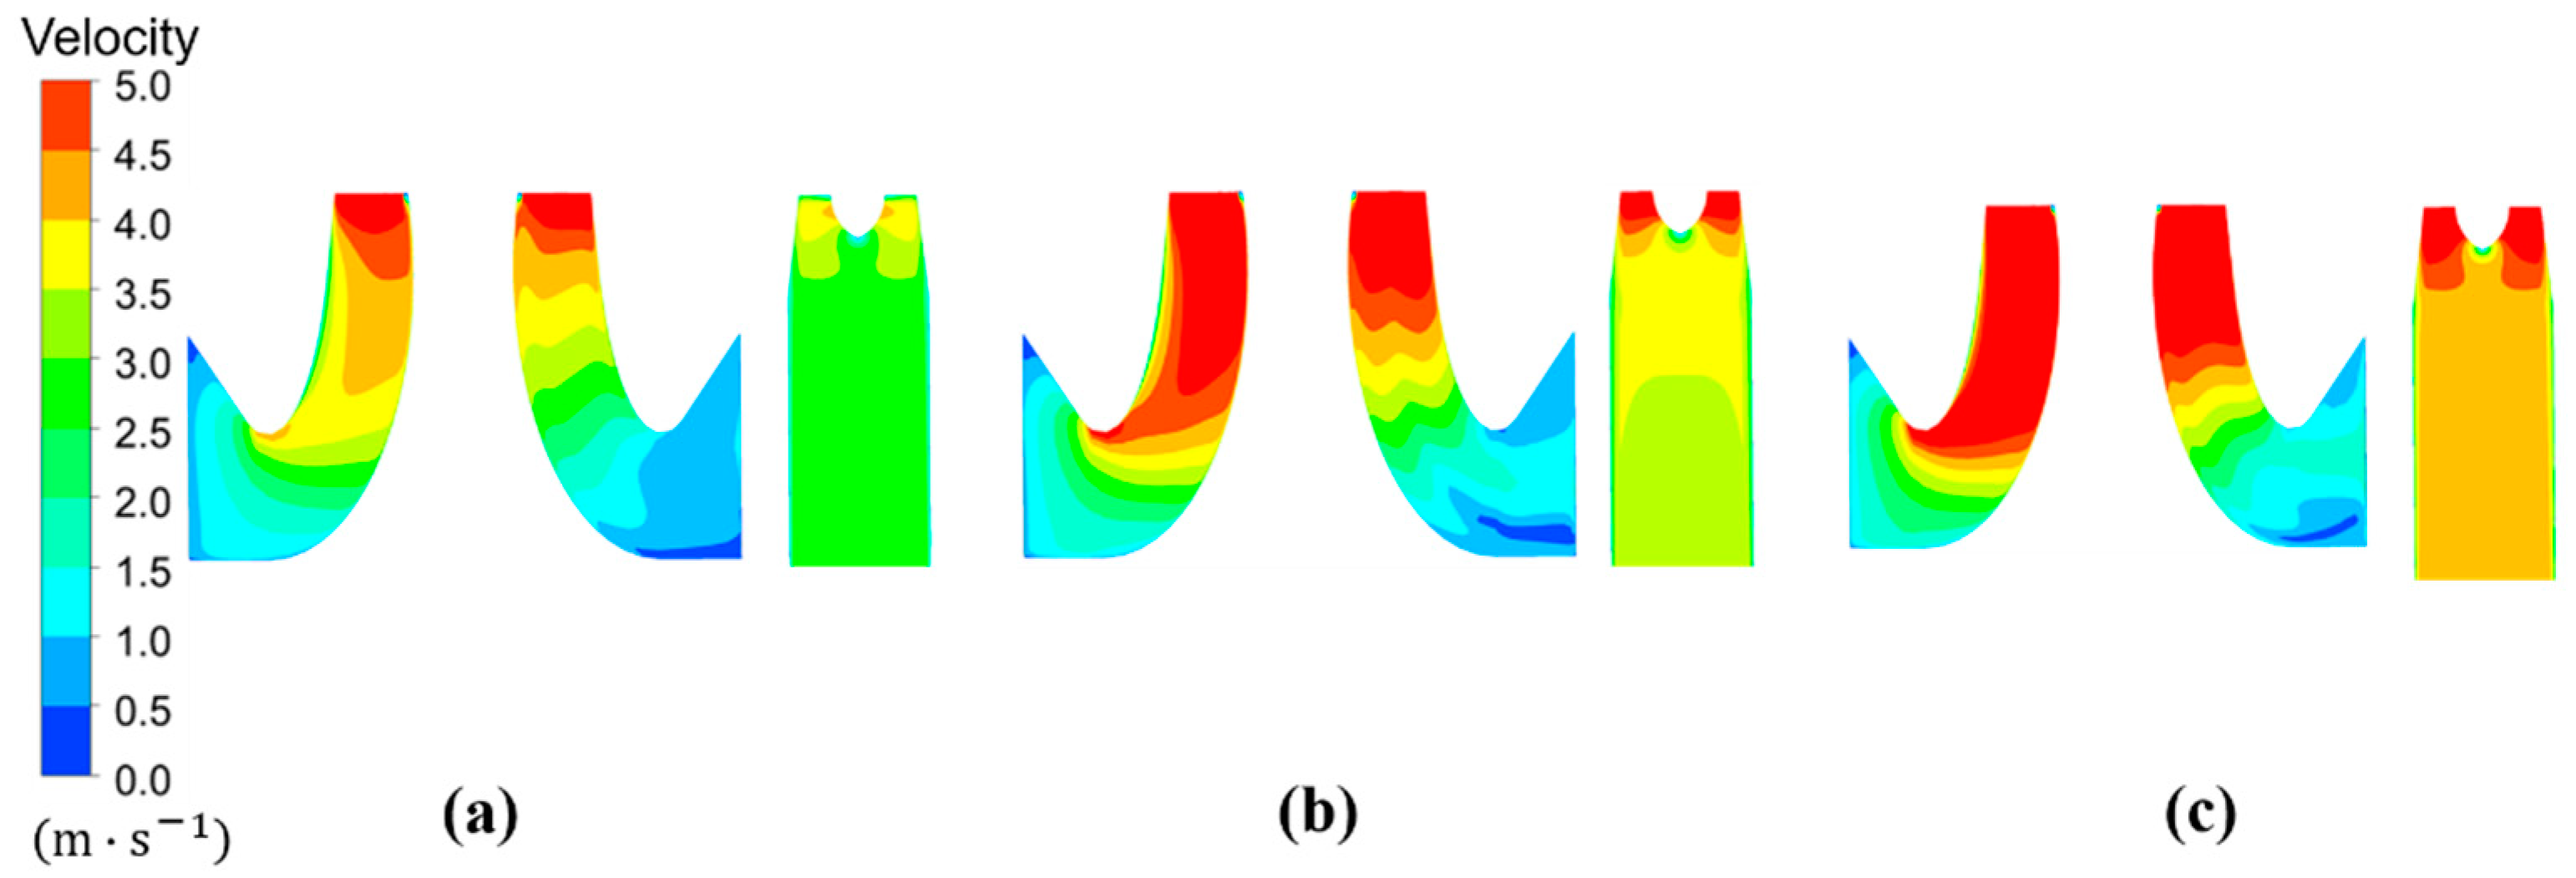
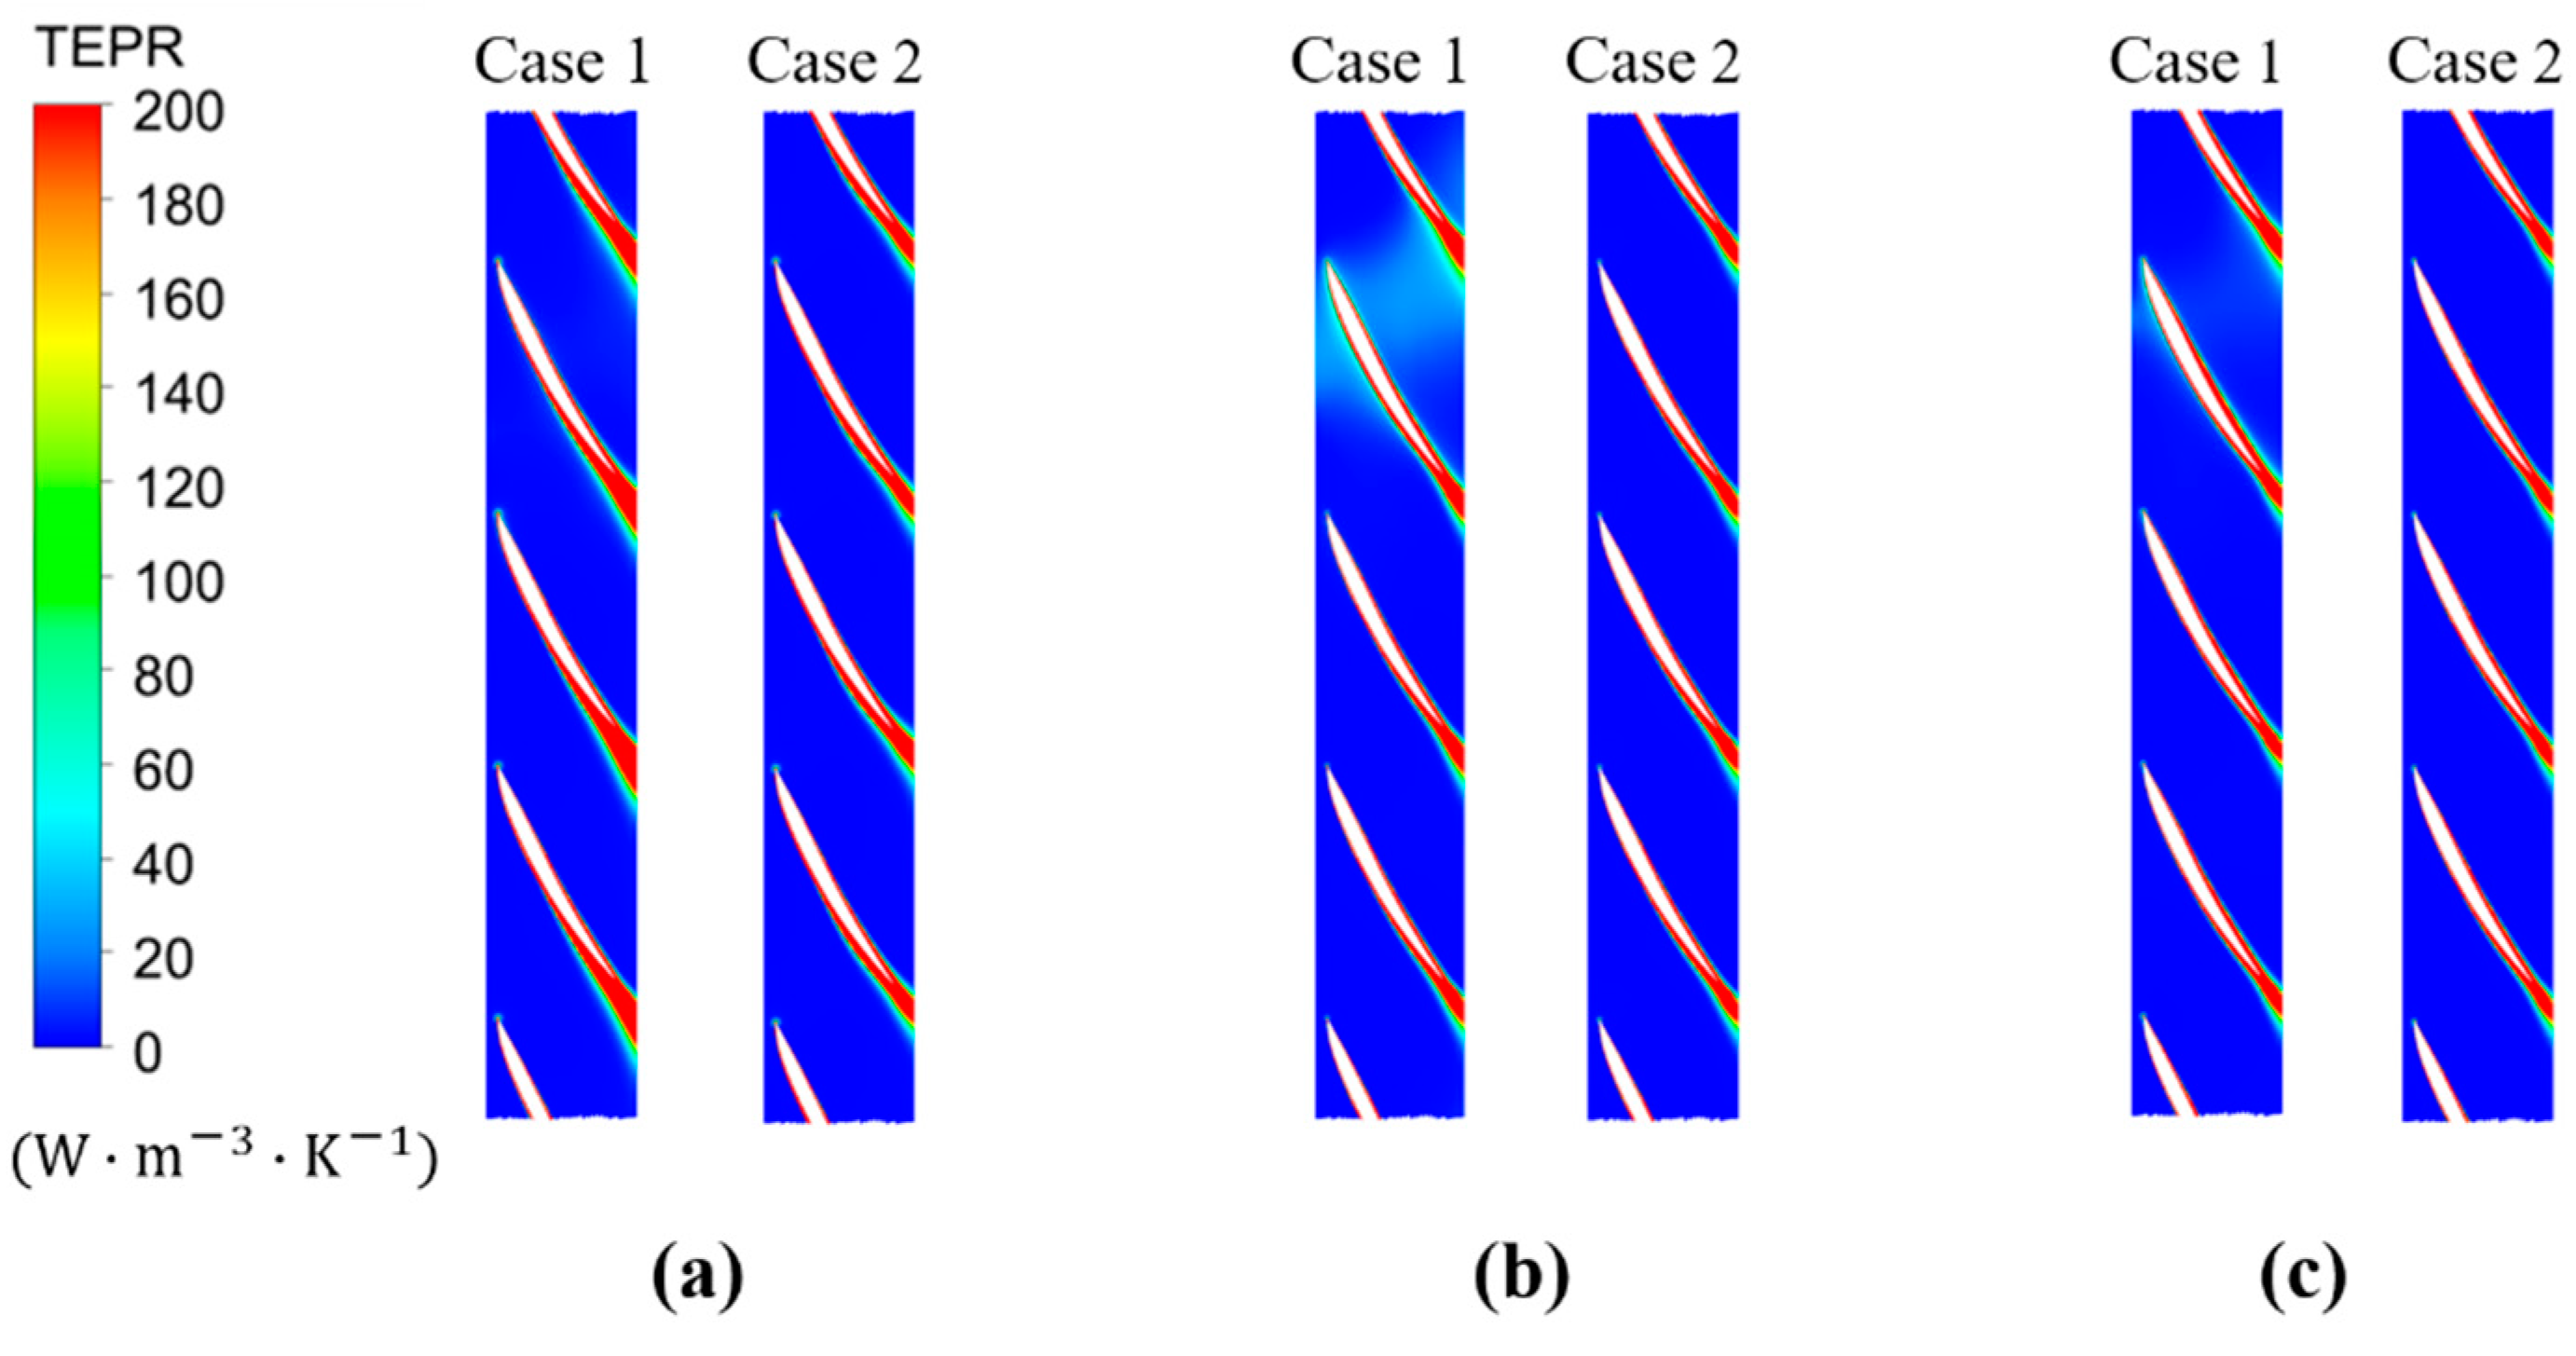
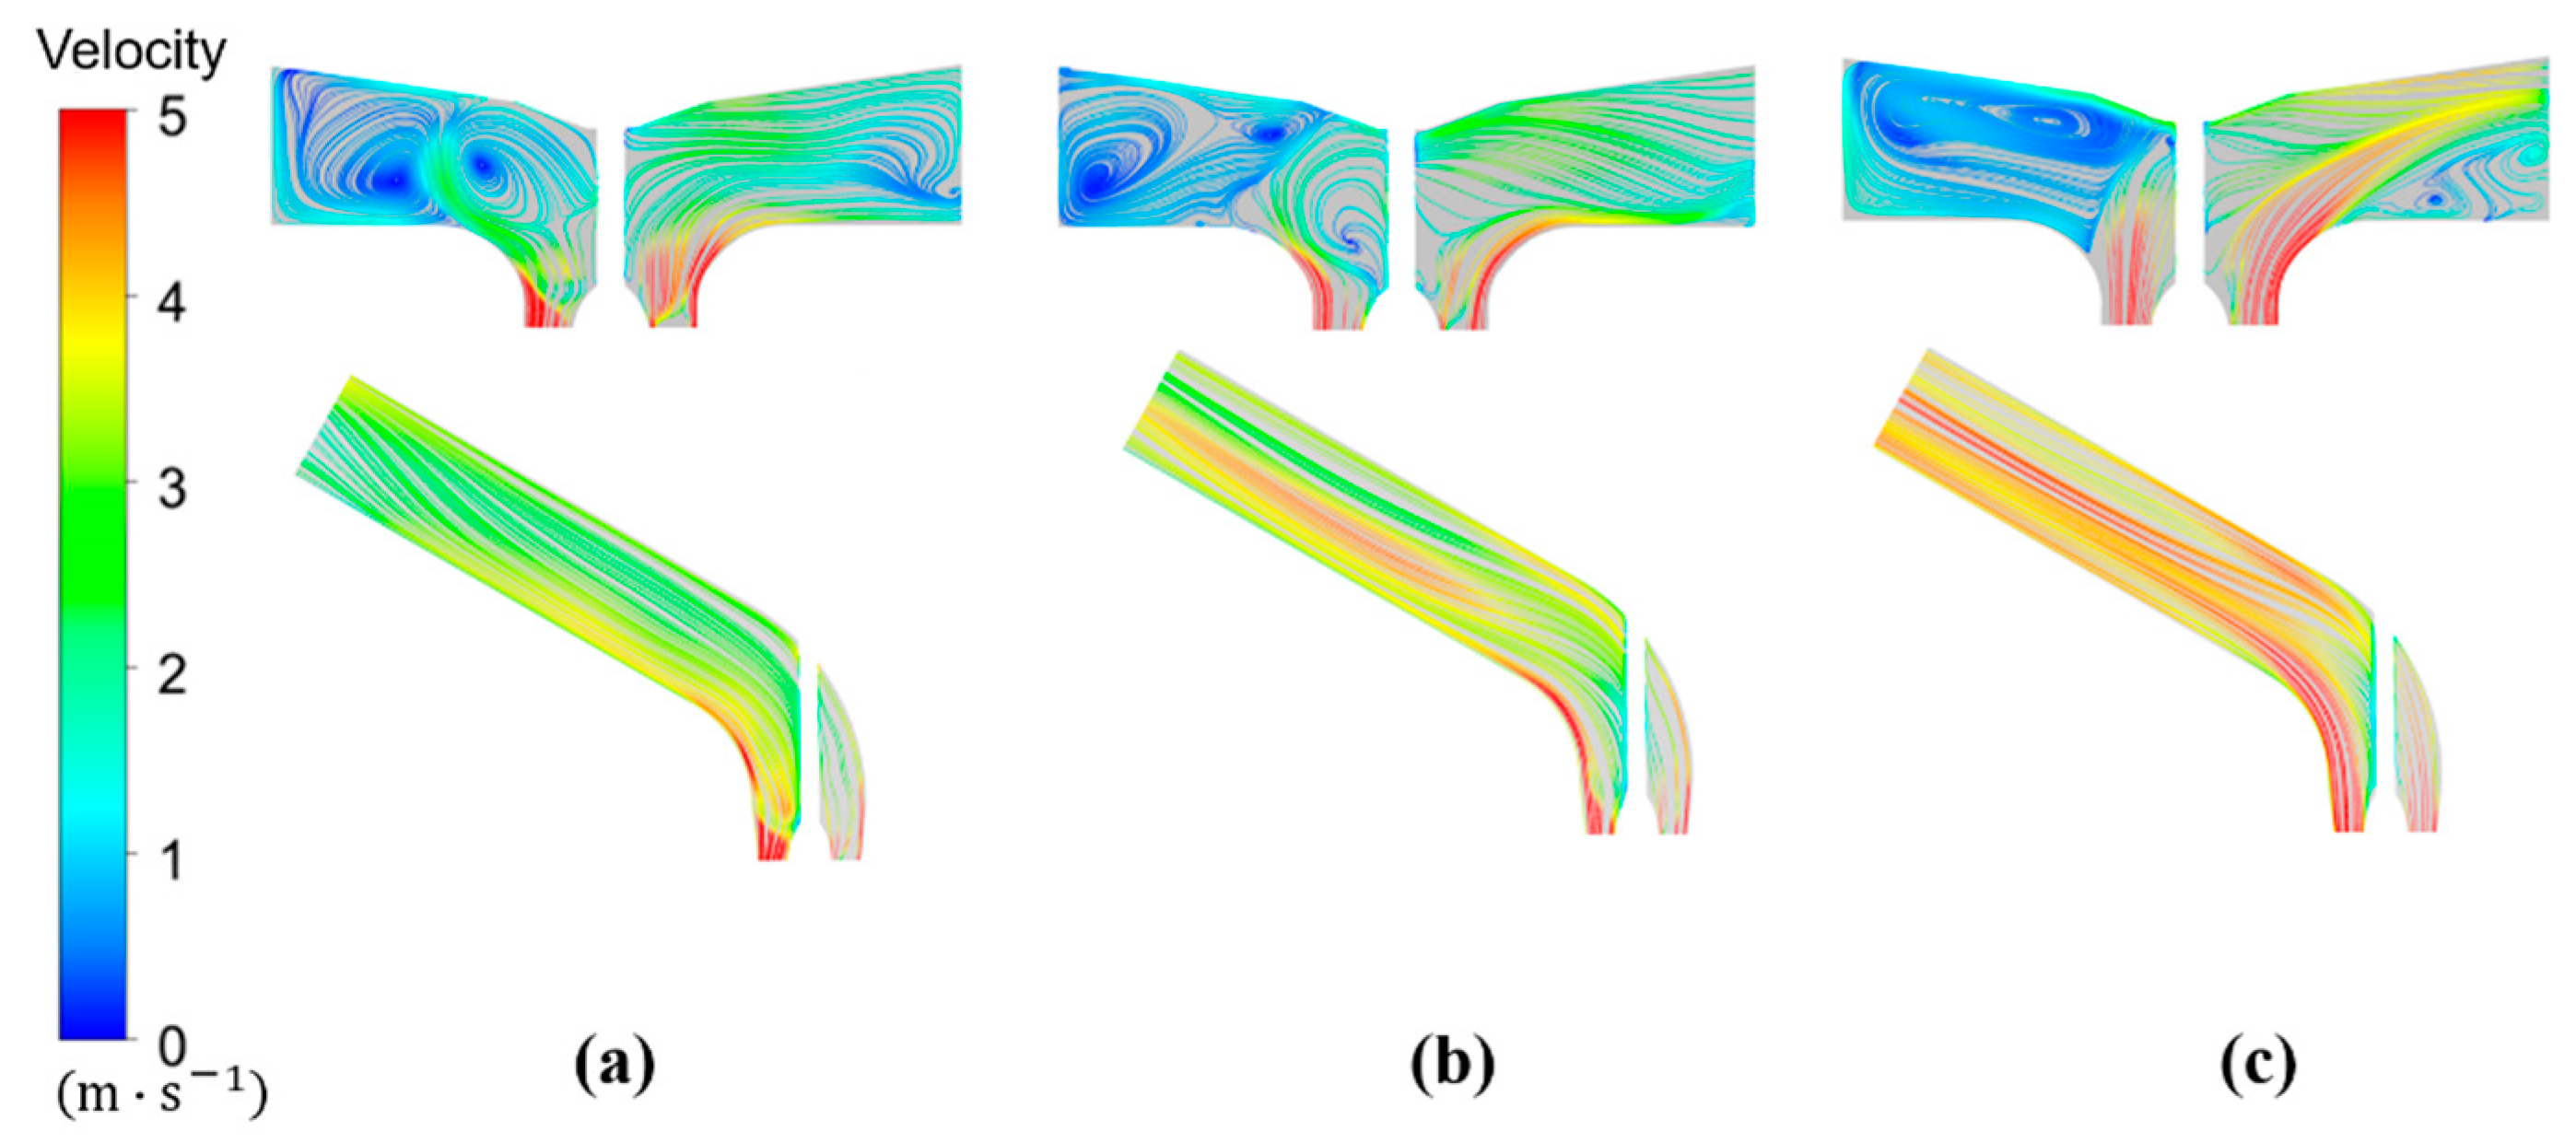
The inflow distortion or non-uniform inflow has a strong effect on the flow field of inlet passages. Figure 9 shows the total entropy production rate (TEPR) of the inflow passage for Cases 1 and 2 with different flow rates. As shown in Figure 8, the internal hydraulic loss in the inlet passages is minor due to its location upstream of the impeller. In Case 1, the large TEPR area is mainly located in the right horn passage, which is far away from the inlet side because the vortices impede the flow of fluid, and the impact effect creates high energy loss. However, in Case 2, a symmetrical distribution of TEPR can be clearly found in the inlet passage, and the value of TEPR is also much lower compared with that in Case 1. Figure 10 is the velocity distribution of the inflow passage for each case with different flow rates. The amplitude of velocity improves with the increase in flow rate for each case, and the high-velocity area expands with the flow rate. From the inlet of the inflow passage to the impeller inlet, the velocity gradually increases and comes to a peak near the impeller inlet. Different from the symmetrical velocity distribution of the impeller inlet in Case 2, an apparent non-symmetrical velocity distribution occurs in the horn passage of Case 1. In other words, the complex bidirectional passages result in a non-uniform outflow in the horn passage, which leads to the inflow distortion of the impeller and finally has a strong influence on the hydraulic performance.
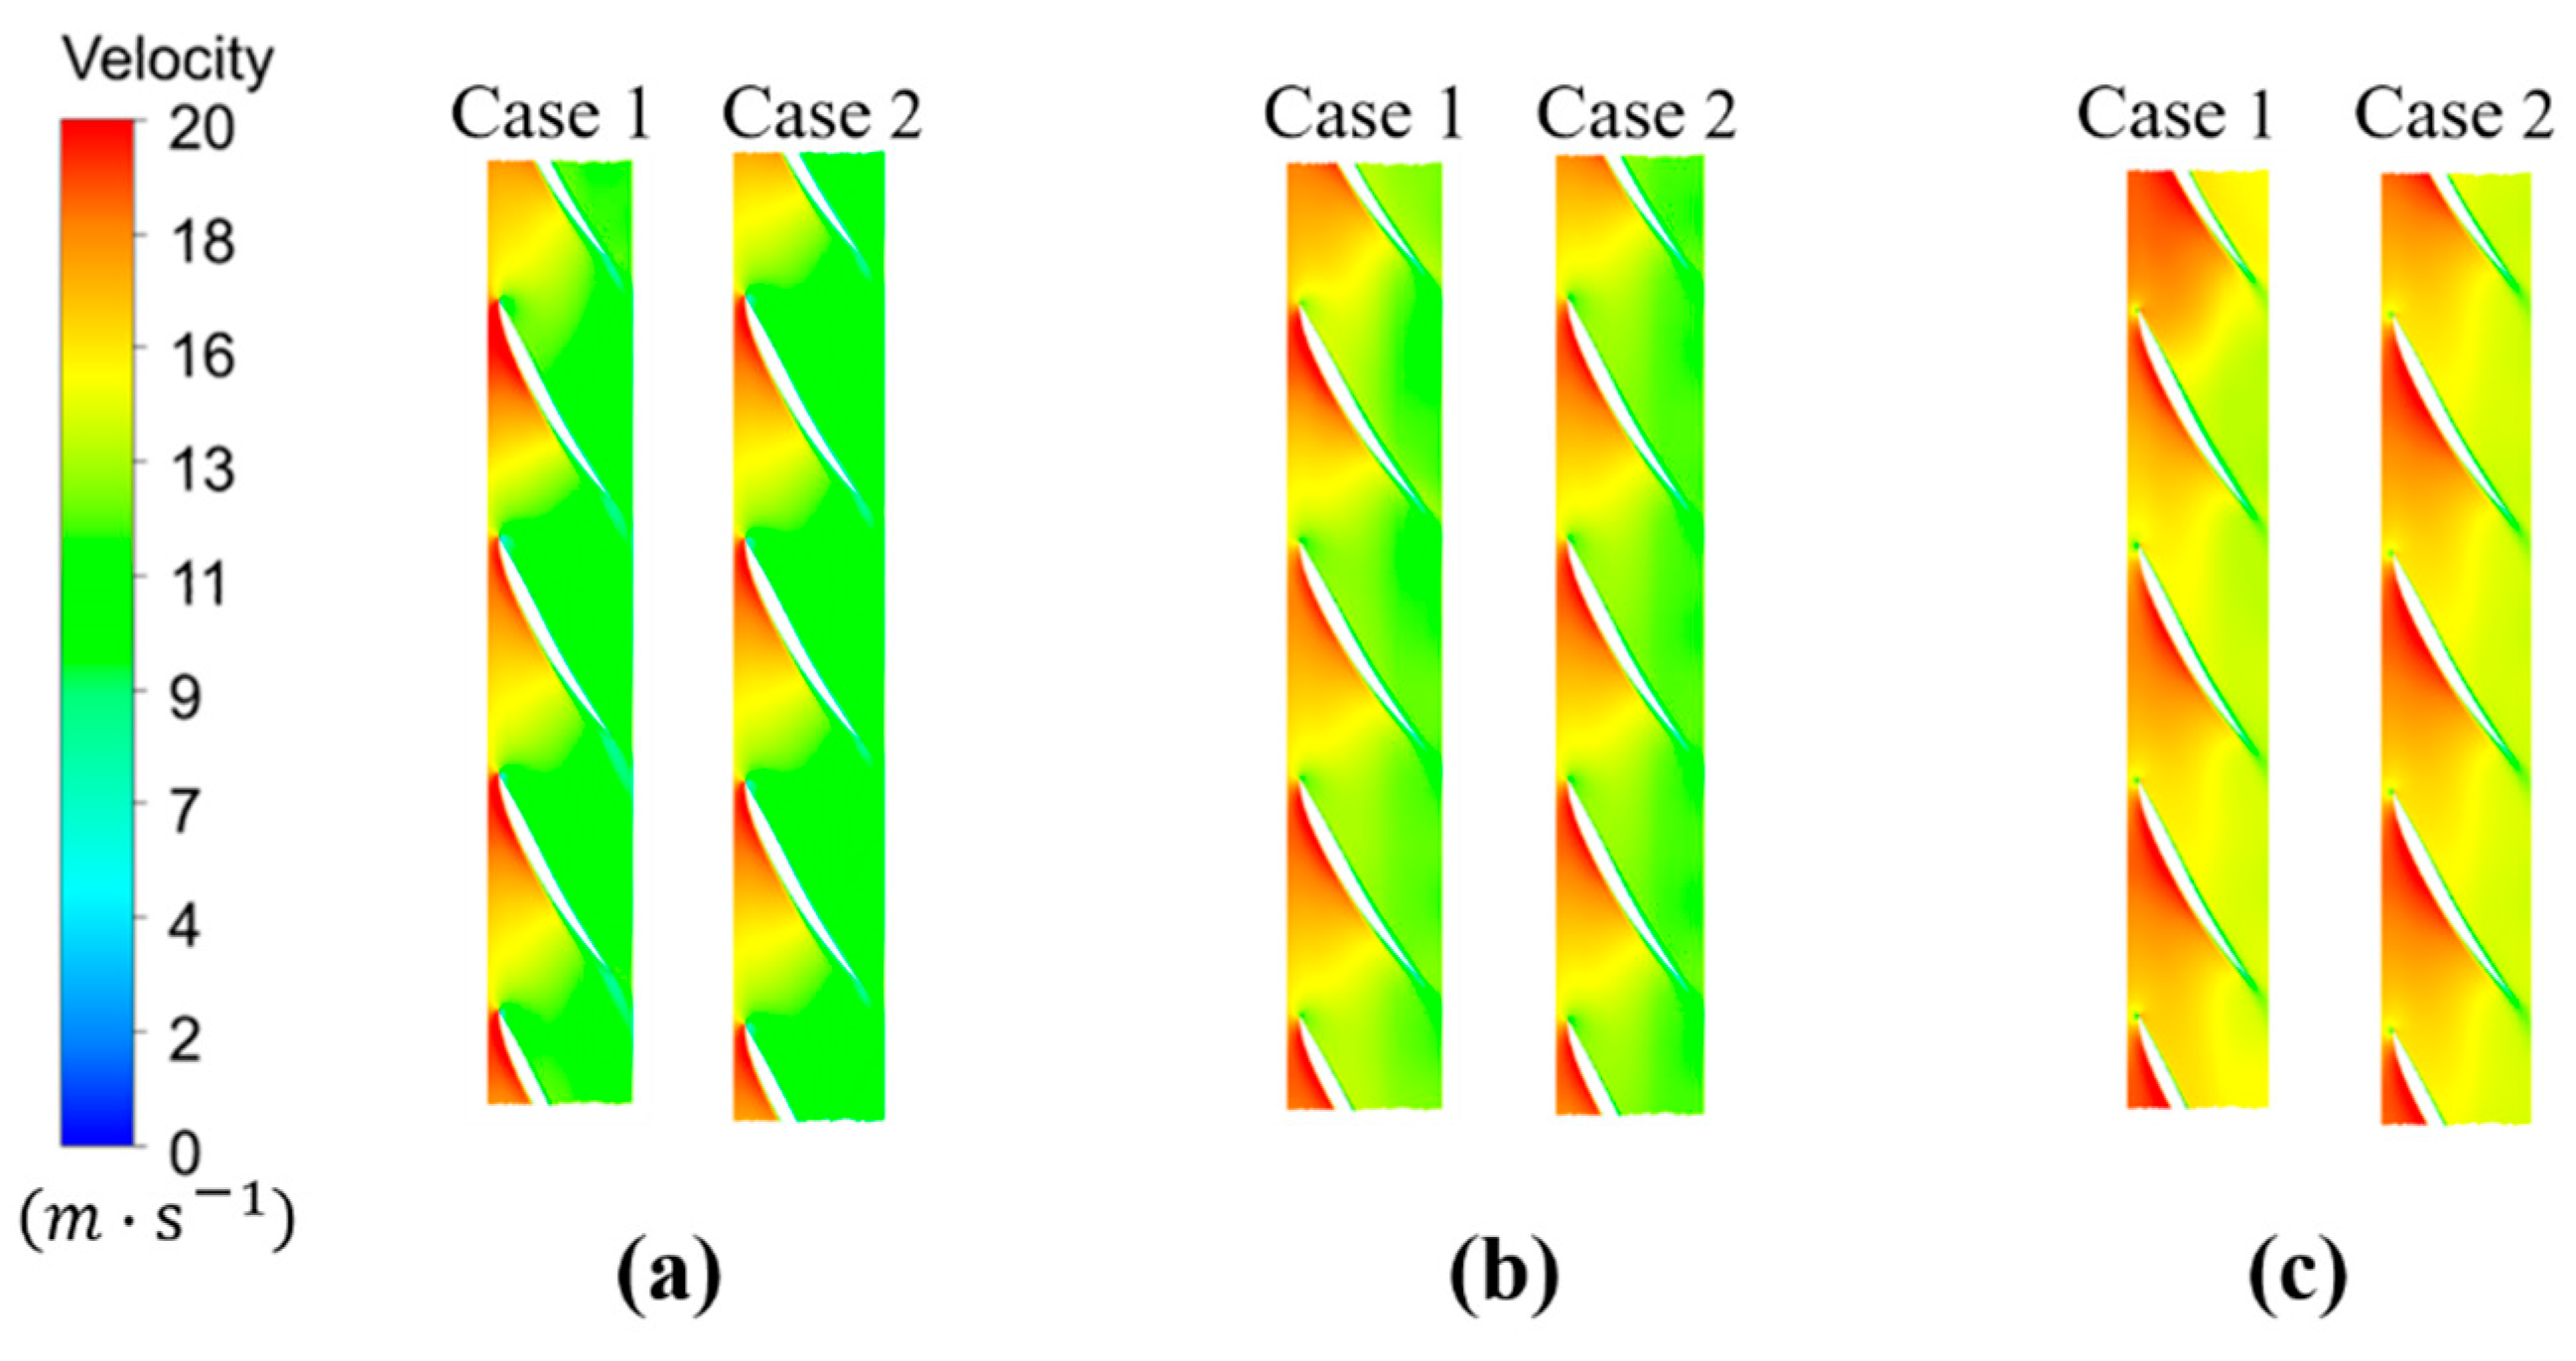
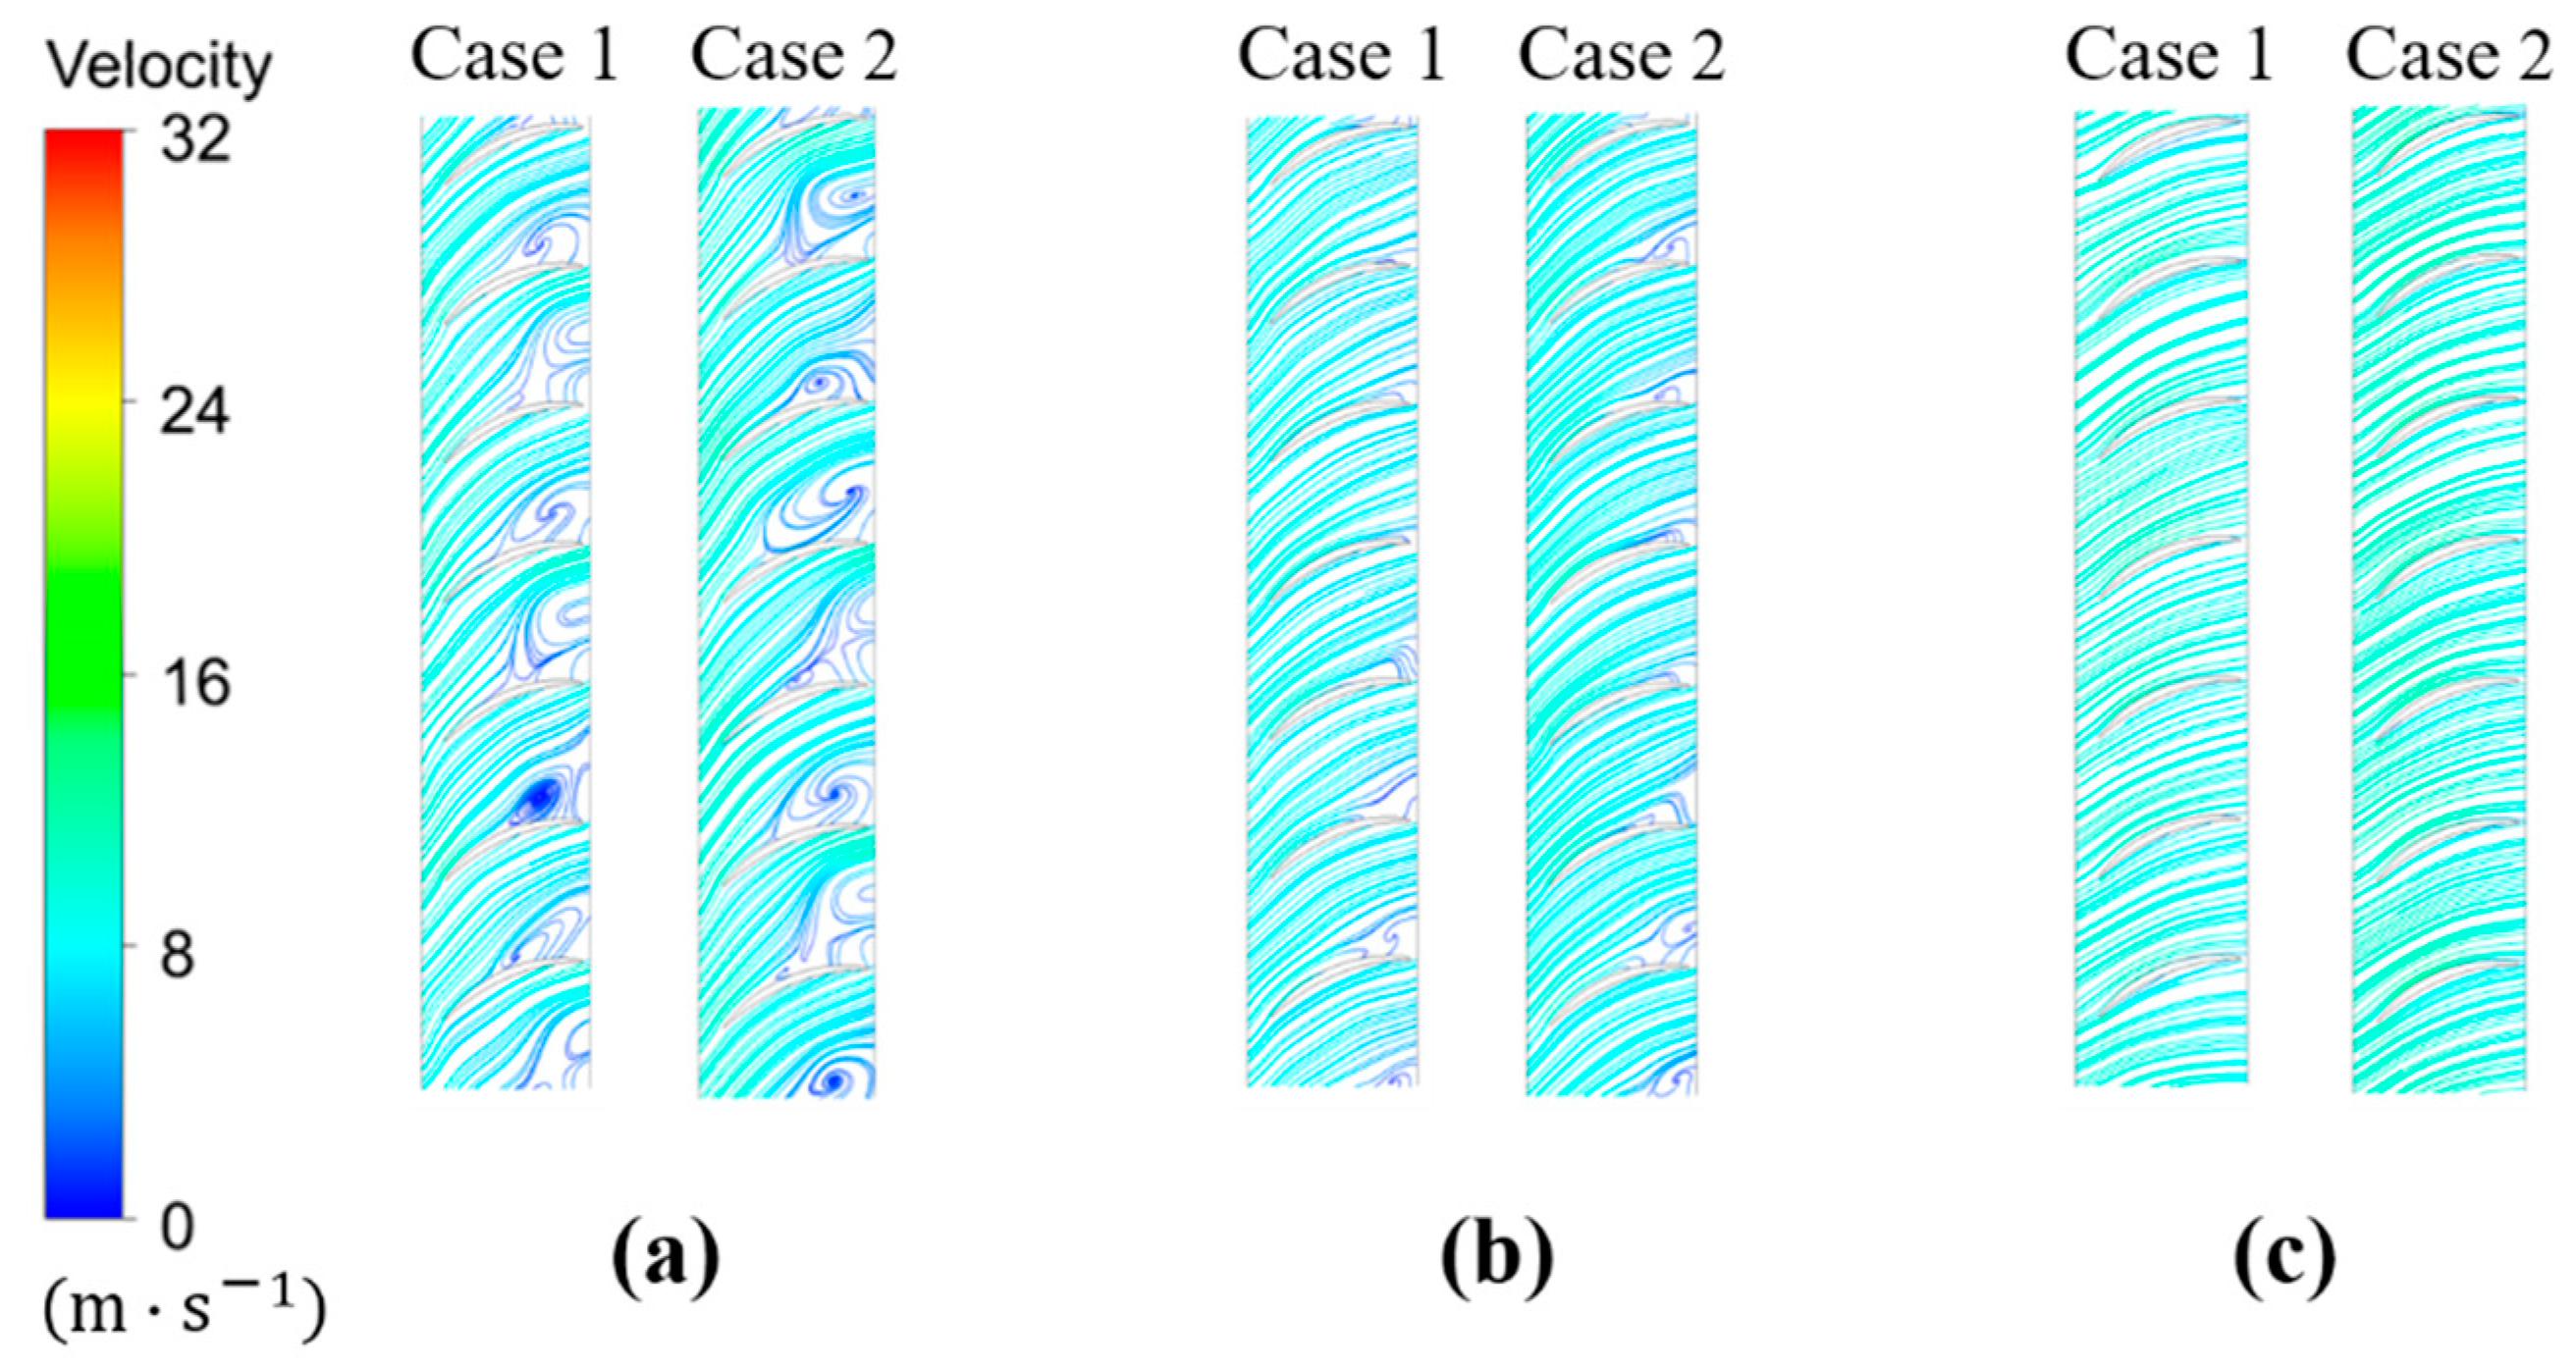
Similarly, the TEPR on the turbo surface of the impeller with Span = 0.5 between Cases 1 and 2 with three flow rates is shown in Figure 11. The high TEPR area can be observed in the suction side of blades, especially near the trailing edge due to the strong effect of the wake vortex on the mainstream. From the low flow rate of 0.8Qdes to the large flow rate of 1.2Qdes, an obvious increase in the high TEPR area can be seen in both Cases 1 and 2. In Case 1, owing to the effect of non-uniform inflow of the bidirectional passages, the attack angle is much larger than that in Case 2 with uniform inflow, which leads to an apparent flow separation near the trailing edge of the impeller blade. In addition, the regions of the wake vortex and hydraulic loss are also larger in Case 1 compared with those in Case 2. Figure 12 presents the corresponding velocity distribution for each case with different flow rates. In addition, an improvement in velocity is also obtained with the increase in flow rate for each case, and the high-velocity area is more likely to distribute near the leading edge. Though it is not especially clear, the region of high-velocity distribution in Case 1 is slightly higher than that in Case 2.
The TEPR on the turbo surface with Span = 0.5 of guide vanes for each case with various flow rates was obtained as shown in Figure 13 and Figure 14 is the corresponding velocity streamline for each case. With the increase in flow rate, the manifest high TEPR area gradually disappears in both Cases 1 and 2 as can be seen in Figure 13, and the streamlines become uniform as shown in Figure 14. With a flow rate of 0.8Qdes, a large area of flow separation occurs in the suction side of guide vanes as depicted in Figure 14a, which results in high energy loss shown in Figure 13a. With the design flow rate, since the axial velocity of the impeller outflow becomes larger, the circumferential velocity decreases, such that the area of high energy loss in Figure 13b in the suction side of guide vanes consequently shrinks considerably (little flow separation can be observed in Figure 14b). With a large flow rate of 1.2Qdes, with the further increase in axial velocity of the impeller outflow, the circumferential velocity becomes minor, and little flow separation occurs in the suction side of guide vanes as shown in Figure 14c; therefore, there is no obvious high hydraulic loss area in Figure 13c. In Case 1, the angle of impeller outflow with the condition of non-uniform inflow is obviously larger compared with that with uniform inflow in Case 2; thus, the high TEPR regions in Case 1 are larger than those in Case 2 for each flow rate.
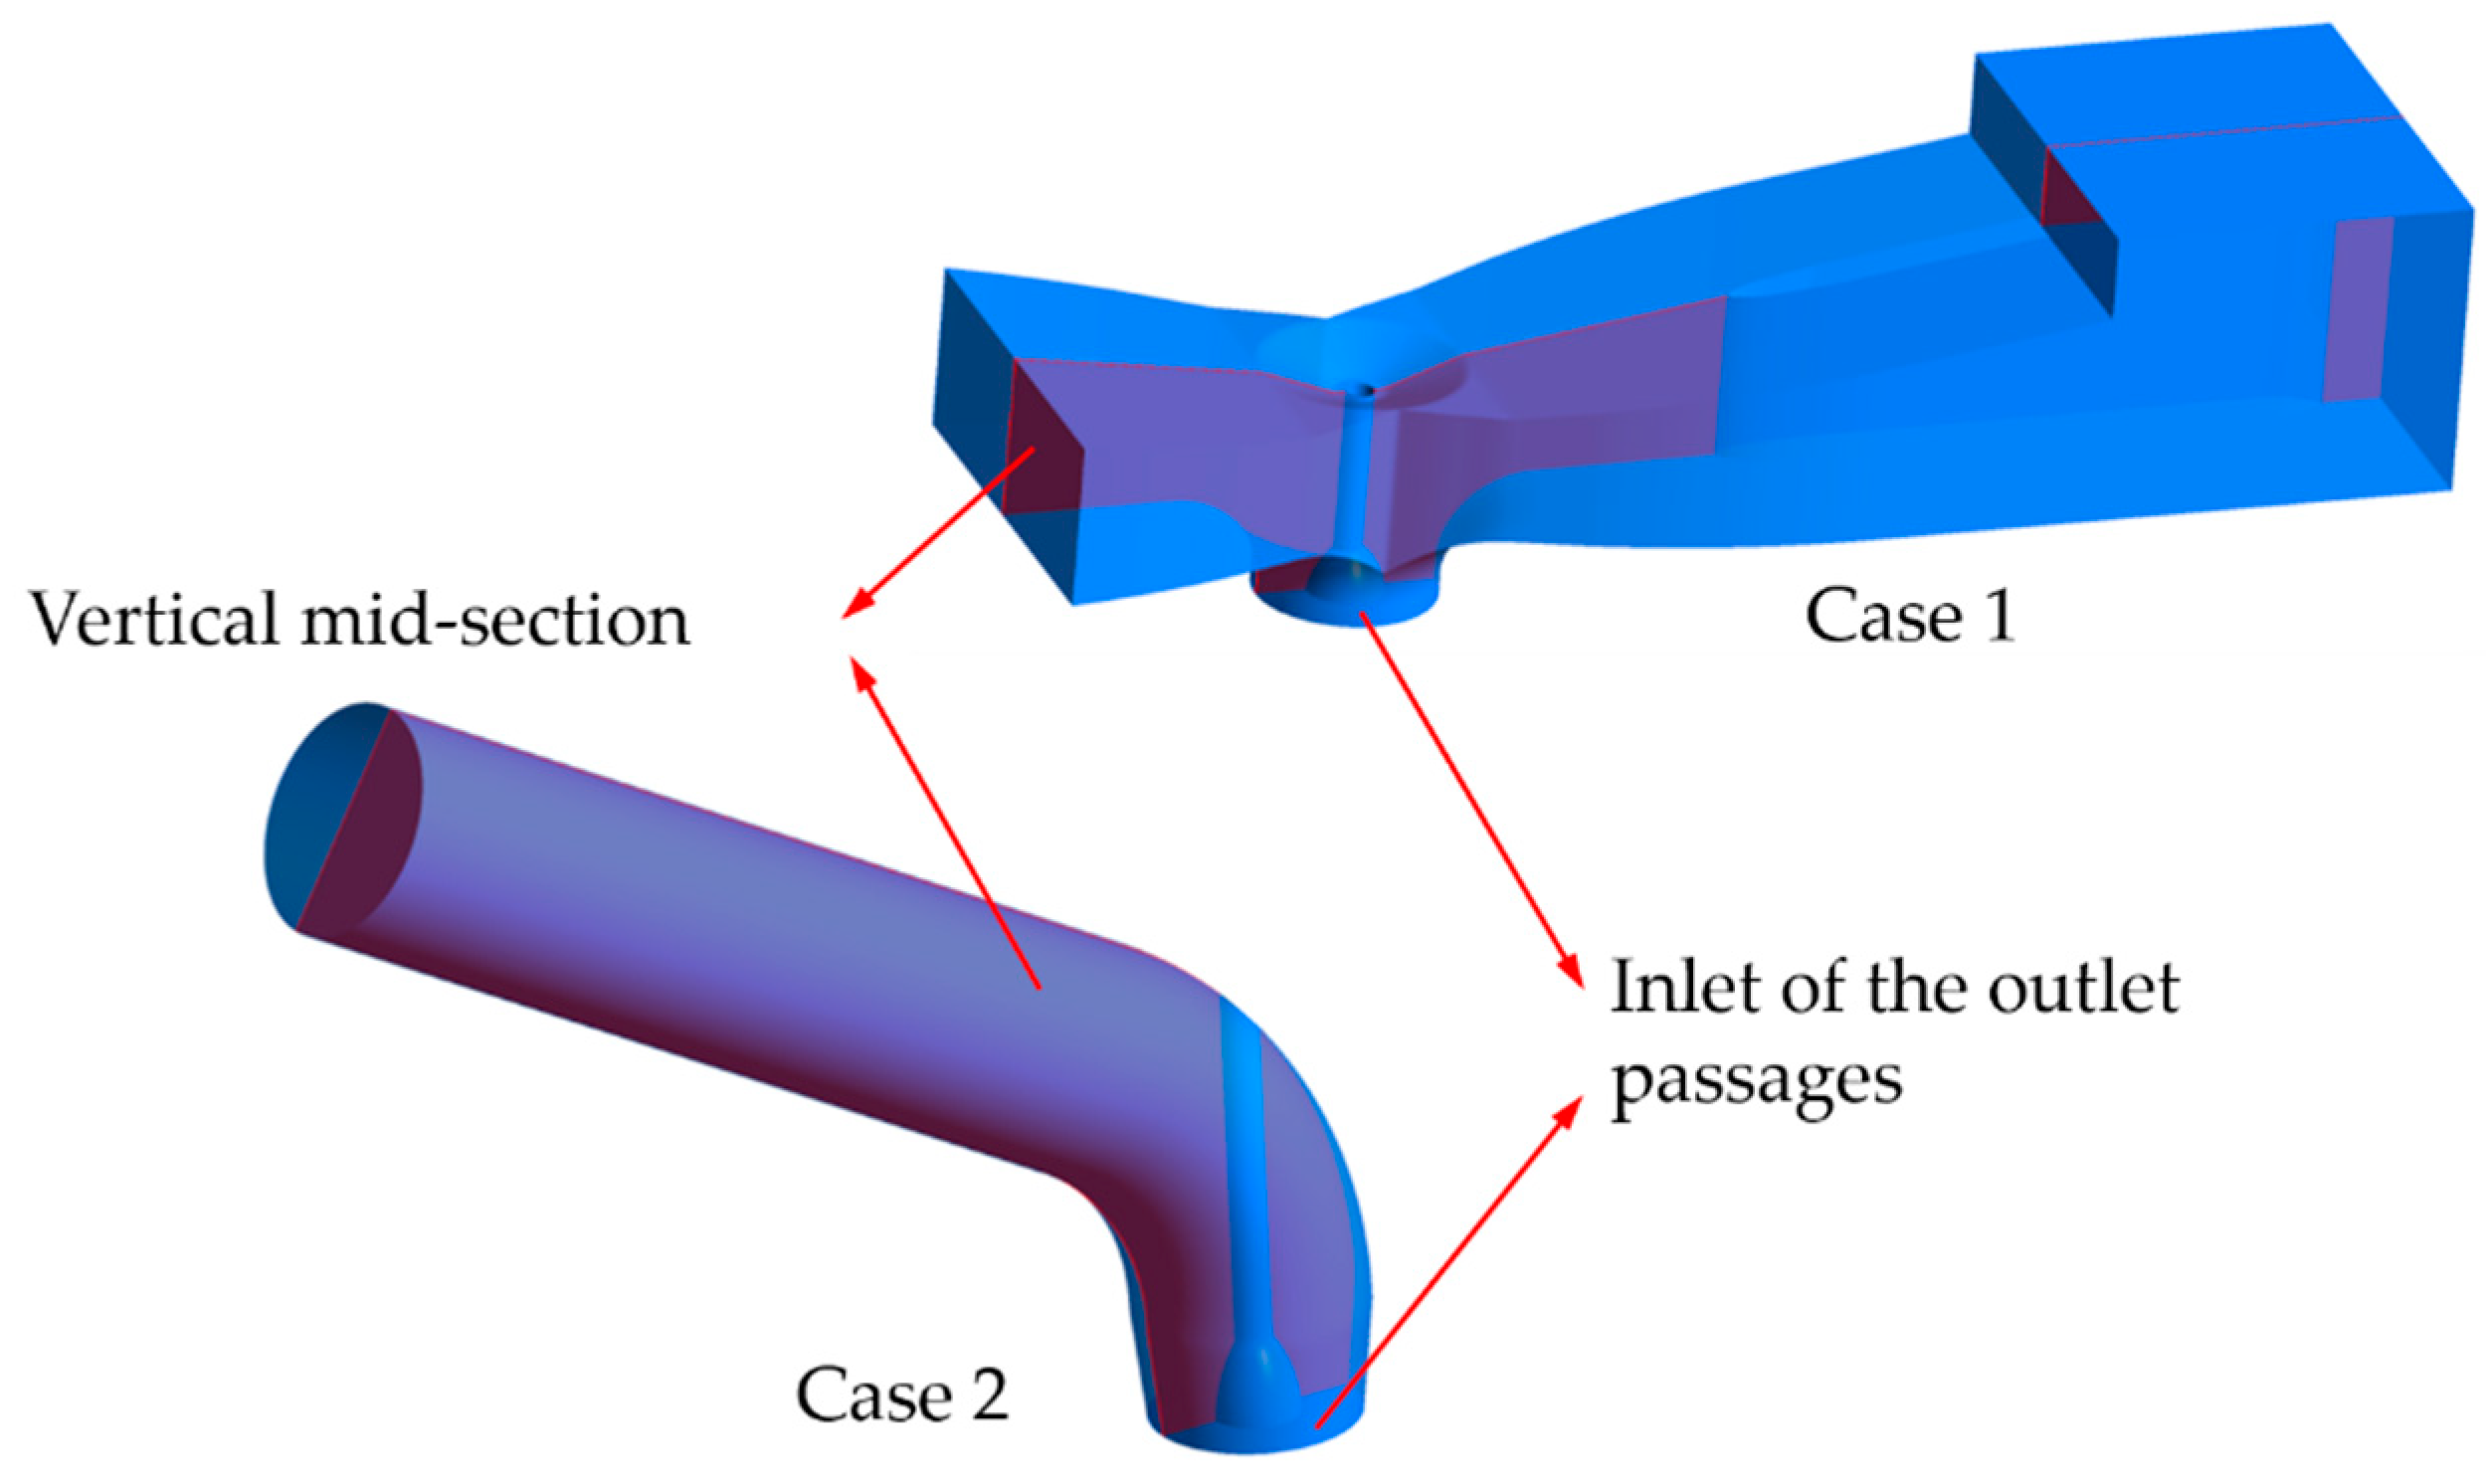
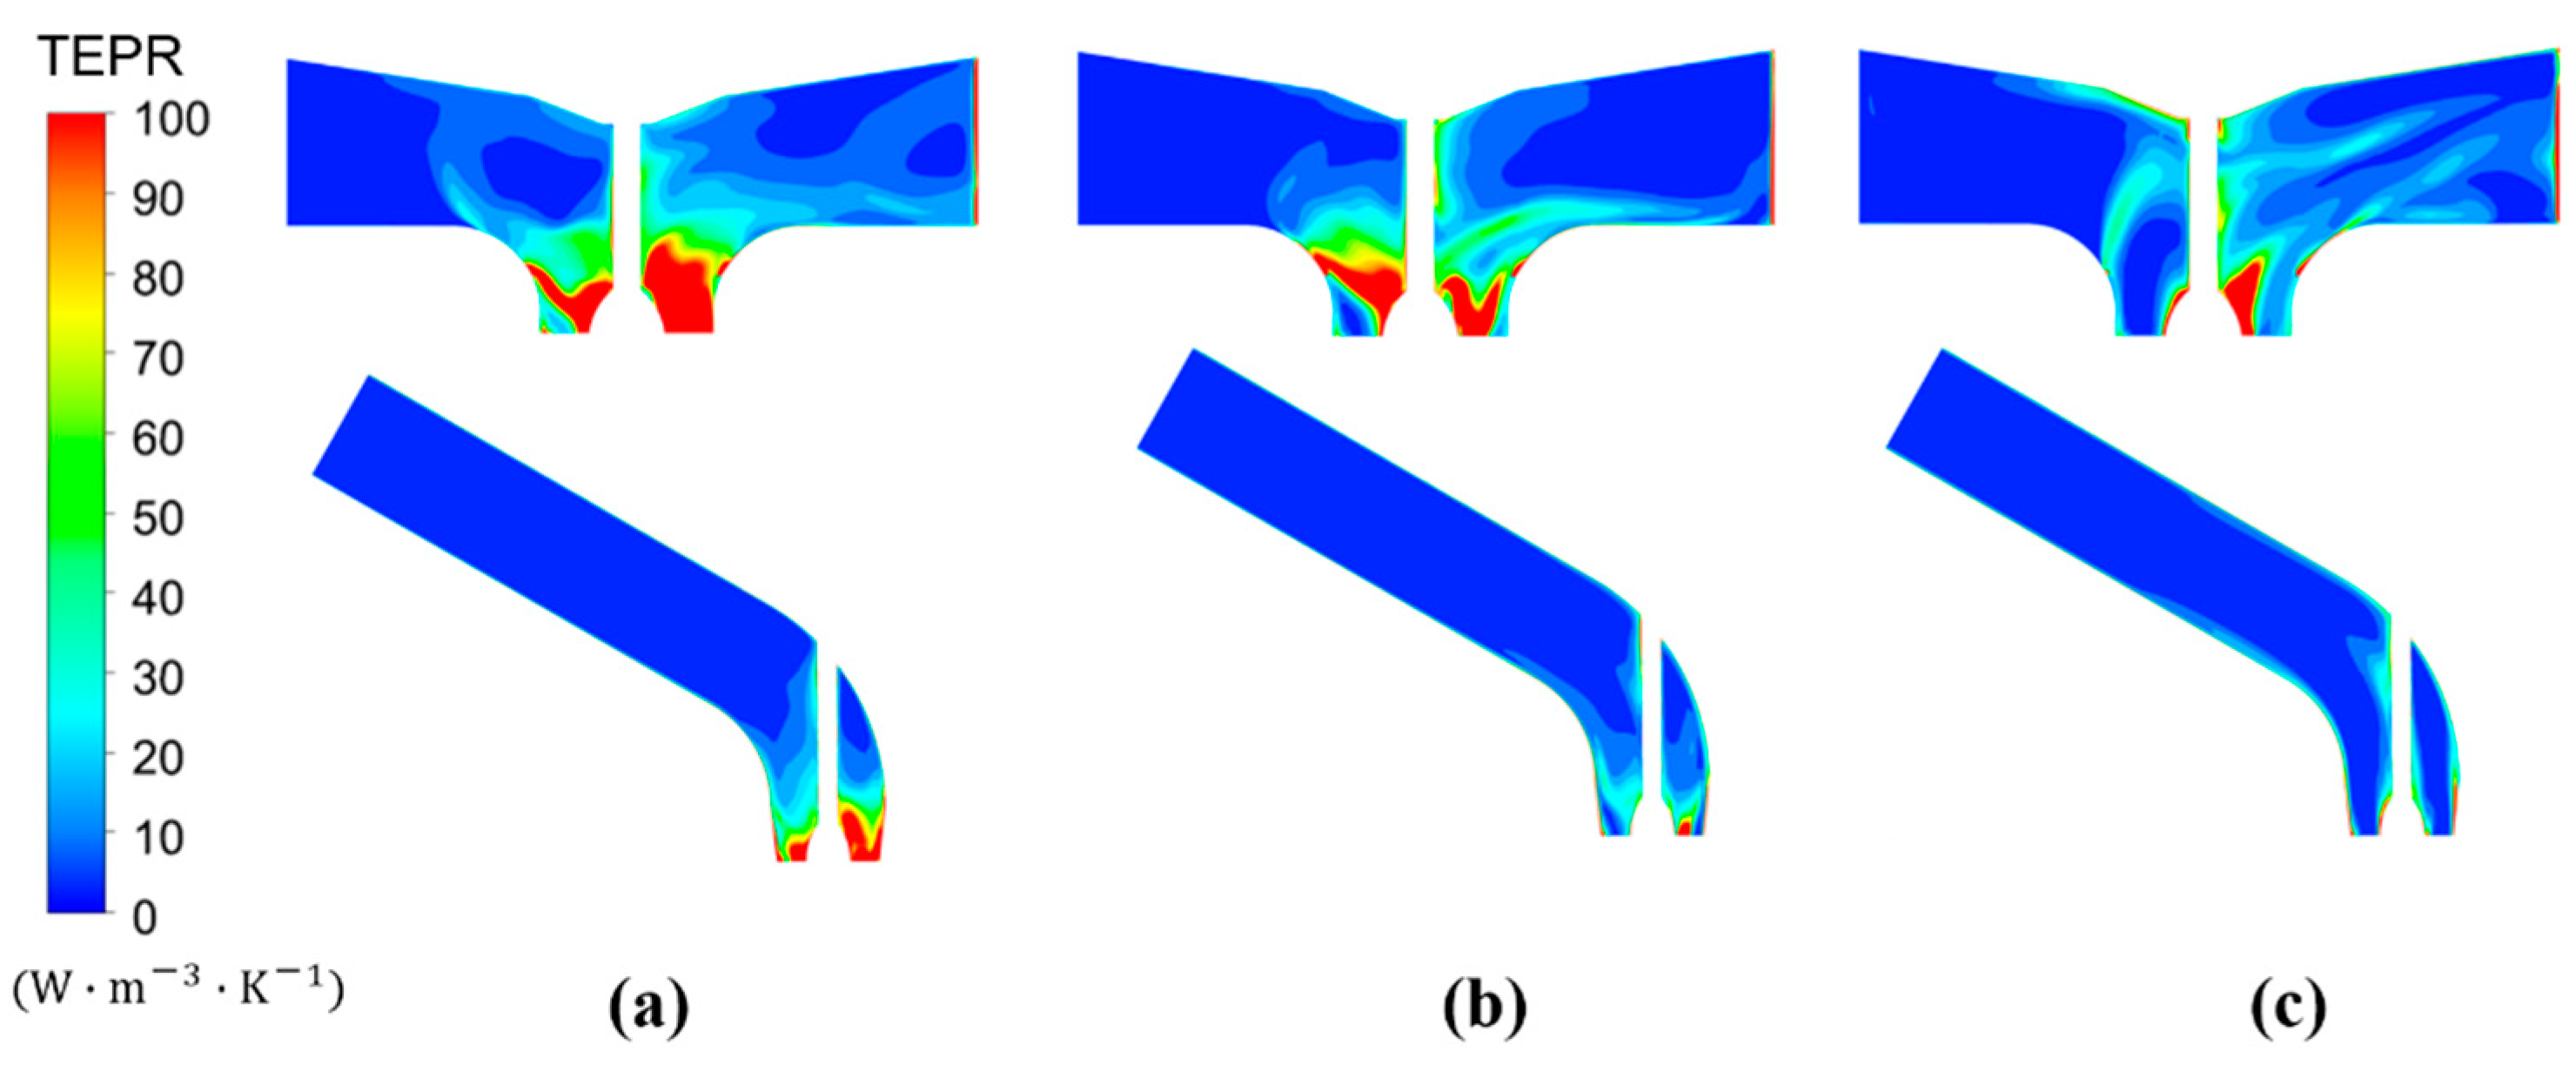
For further analysis of the energy loss in Cases 1 and 2, the location of the vertical mid-section of the outlet passage in each case was firstly obtained as shown in Figure 15 and the TEPR distribution and the velocity streamline distribution on the vertical mid-section of the outlet passage for each case with different flow rates are presented in Figure 16 and Figure 17, respectively. In Figure 16, the large TEPR area or high hydraulic loss region is mainly distributed near the inlet of the outlet passages in both cases, where the flow separation phenomenon is more likely to occur due to the changes in direction of the outflow, resulting in the formation of areas with high energy loss. The region of large TEPR drops slowly with the increase in flow rate, due to the reduction in the residual circulation inside the outflow. Compared with the pipe passages in Case 2, the bidirectional passages in Case 1 have more complex structures. Therefore, the high energy loss area of the outlet passage in Case 1 is clearly greater than that in Case 2 from a flow rate of 0.8Qdes to 1.2Qdes. By comparing the velocity streamline for each case as shown in Figure 17, it appears much more uniform in Case 2 than in Case 1, and almost no streamline vortex can be observed in the pipe passage of Case 2 from the small flow rate to the large flow rate. In the bidirectional passage of Case 1, a large area of the streamlined vortex is noticeably located in the side far away from the outlet of the passage, where a large stagnant flow region is easily formed, which further leads to energy loss owing to the blocking effect of the vortex. In addition, the vortex in the stagnant flow region diminishes gradually with the increase in flow rate. At a flow rate of 0.8Qdes, the vortex almost fills in the entire left outlet passage, and when it comes to the high flow rate of 1.2Qdes, only a small region of the vortex exists near the upper side of the left outlet passage.

5. Conclusions

In this work, the three-dimensional viscous, incompressible, unsteady flow was investigated by solving the unsteady Reynolds time-averaged Navier–Stokes equation. The entropy production theory was employed to explore the inflow distortion mechanism and energy characteristics by comparing the internal flow in a bidirectional vertical axial flow pumping station (Case 1) and an axial flow pump with pipe passages (Case 2). In addition, the hydraulic loss in each component, which is induced by the inflow distortion (or non-uniform inflow), is visualized in detail. The major findings are listed below:
(1)
The non-uniform inflow in Case 1 plays an important role in the hydraulic performance compared with that in Case 2, and it leads to an obvious reduction in the head and efficiency, especially with a large flow rate of 1.2Qdes. The largest declines in head and efficiency are as high as 27% and 21%, respectively. In addition, for the uniform inflow with Case 2, the optimal efficiency point obviously shifts to the point with a larger flow rate.
(2)
By comparing the axial velocity of the impeller inlet between Cases 1 and 2, owing to the effects of wall viscous shear and the tip clearance, an increase in axial velocity near the hub and a reduction in axial velocity near the shroud can be observed, and with the presence of bidirectional passages in Case 1, the change in velocity in Case 2 with pipe passages appears more smoothly, which indicates the non-uniform inflow at the impeller inlet in Case 1.
(3)
In both cases, the TEP of the whole computational domain with design flow rate is clearly lower than that with off-design flow rate, and the TEP of the inflow passage of both cases occupies only 2~11%. In addition, the TEP of each component in Case 1 presents a higher value than that in Case 2, and the increase rates of TEP for the whole domain with flow rates of 0.8Qdes, 1.0Qdes, and 1.2Qdes are 18.68%, 30.50% and 29.67%, respectively.
(4)
The TEPR in each domain between Cases 1 and 2 was compared with the capture of the spatial distribution of energy loss caused by flow distortion. In the inlet passage, the high TEPR area is mainly located in the horn passage, which is far away from the inlet side, and it is distributed in the suction side of the impeller blades and guide vanes. In the outlet passage, a larger TEPR region in Case 1 mainly occurs near the inlet of the outlet passages due to the presence of flow separation.

Author Contributions

Conceptualization, J.C.; Data curation, J.C., H.Z., F.M. and Y.Z.; Methodology, J.C. and H.Z.; Formal analysis, J.C. and H.Z.; Resources, J.C. and H.Z.; Investigation, J.C. and H.Z.; Software, J.C.; Project administration, Y.L.; Supervision, Y.L.; Validation, J.C. and H.Z.; Writing—original draft preparation, J.C.; Writing—review and editing, J.C., H.Z., F.M. and Y.Z. All authors have read and agreed to the published version of the manuscript.

Funding

This research was funded by ranking the top of the list for science and technology projects of Yunnan Province (Grant No. 202204BW050001).

Conflicts of Interest

The authors declare that there are no conflicts of interest.

Nomenclature

Qdes (m3/s)Design flow rate
q (W)Heat flux
t (s)Time
T (K)Temperature
S (J/(kg K))Specific entropy
u 1 (m/s)Velocity in the x-direction of the Cartesian coordinate system
u 2 (m/s)Velocity in the y-direction of the Cartesian coordinate system
u 3 (m/s)Velocity in the z-direction of the Cartesian coordinate system
Φ / T (W/(m3 · K ))Specific entropy production rate
S ˙ D ¯ (W/(m3 · K ))Entropy production rate induced by the time-averaged process
S ˙ D (W/(m3 · K ))Entropy production rate induced by the velocity fluctuation
S ˙ D (W/ K )Total entropy production
CFDComputational fluid dynamics
SpanRadial coefficient
R (mm)Radius of the calculated circle
Rs (mm)Shroud radius
Rh (mm)Hub radius
Vz (m/s)Axial velocity of impeller inlet
TEPTotal entropy production
TEPRTotal entropy production rate

References

  1. Mao, Z.; Asai, Y.; Yamanoi, A.; Seki, Y.; Wiranata, A.; Minaminosono, A. Fluidic rolling robot using voltage-driven oscillating liquid. Smart Mater. Struct. 2022, 31, 105006. [Google Scholar] [CrossRef]
  2. Satoh, A.; Katoh, K. An Experimental Study for Clarifying the Mechanism of a Microjet in an Electro-Conjugate Fluid by the 2D PIV Analysis. In Proceedings of the International Conference of Fluid Power and Mechatronics, Beijing, China, 17–20 August 2011. [Google Scholar]
  3. Laser, D.J.; Santiago, J.G. A review of micropumps. J. Micromech. Microeng. 2004, 14, R35. [Google Scholar] [CrossRef]
  4. Meng, F.; Yuan, S.; Li, Y. Fluid-structure coupling analysis of impeller in unstable region for a reversible axial-flow pump device. Adv. Mech. Eng. 2018, 10, 1687814017751762. [Google Scholar] [CrossRef]
  5. Lei, X.; Tian, Y.; Zhang, Z.; Wang, L.; Xi, X.; Wang, H. Correction of pumping station parameters in a one-dimensional hydrodynamic model using the Ensemble Kalman filter. J. Hydrol. 2019, 568, 108–118. [Google Scholar] [CrossRef]
  6. Li, Y.; Lu, R.; Zhang, H.; Deng, F.; Yuan, J. Improvement of intake structures in a two-way pumping station with experimental analysis. Appl. Sci. 2020, 10, 6842. [Google Scholar] [CrossRef]
  7. Meng, F.; Qin, Z.; Li, Y.; Chen, J. Investigation of transient characteristics of a vertical axial-flow pump with non-uniform suction flow. Machines 2022, 10, 855. [Google Scholar] [CrossRef]
  8. Tang, F.; Yuan, J.; Zhou, J. Influence of water inlet channel on pump performance. Pump Technol. 1994, 20–21. [Google Scholar]
  9. Qiu, B.; Lin, H.; Huang, J.; Feng, X. Study on flow field in blade inlet of large vertical axial-flow pump and its influence on pump. J. Mech. Eng. 2005, 41, 28–34. [Google Scholar] [CrossRef]
  10. Cao, P.; Yin, G.; Wang, Y.; Li, G.; Wu, W. Numerical analysis of double tornado-type separation vortices in centrifugal pump. Trans. Chin. Soc. Agric. Mach. 2016, 47, 22–28. [Google Scholar]
  11. Van Esch, B.P.M. Performance and radial loading of a mixed-flow pump under non-uniform suction flow. J. Fluid. Eng. 2009, 131, 051101. [Google Scholar] [CrossRef]
  12. Lu, L.; Liu, C.; Chen, Y. Influence of inlet channel on hydraulic performance of axial flow pump. Pump Tech. 1997, 25–26, 39. [Google Scholar]
  13. Xu, Z.; Fan, Y.; Liu, S.; Wu, Y. 2D PIV experiments on non-uniform flow in a rectangular open model pump suction passage. In Proceedings of the ASME 2005 International Mechanical Engineering Congress and Exposition, Orlando, FL, USA, 5–11 November 2005. [Google Scholar]
  14. Wang, Y.; Wang, P.; Tan, X.; Xu, Z.; Ruan, X. Research on the non-uniform inflow characteristics of the canned nuclear coolant pump. Ann. Nucl. Energy 2018, 115, 423–429. [Google Scholar] [CrossRef]
  15. Wang, Y.; Cao, P.; Yin, G.; Li, G. Flow feature and blade loading of a water-jet pump under non-uniform suction flow. J. Propuls. Technol. 2017, 38, 69–75. [Google Scholar]
  16. Jin, S.; Cao, P.; Wang, Y. Numerical analysis on velocity field of water- jet pump under non-uniform inflow. J. Drain. Irrig. Mach. Eng. 2016, 34, 115–121. [Google Scholar]
  17. Bulten, N.W.H. Numerical Analysis of a Waterjet Propulsion System; Technische Universiteit Eindhoven: Eindhoven, The Netherlands, 2006. [Google Scholar]
  18. Kock, F.; Herwig, H. Local entropy production in turbulent shear flows: A high-Reynolds number model with wall functions. Int. J. Heat Mass Transf. 2004, 47, 2205–2215. [Google Scholar] [CrossRef]
  19. Kock, F.; Herwig, H. Entropy production calculation for turbulent shear flows and their implementation in CFD codes. Int. J. Heat Fluid Flow 2005, 26, 672–680. [Google Scholar] [CrossRef]
  20. Herwig, H.; Kock, F. Direct and indirect methods of calculating entropy generation rates in turbulent convective heat transfer problems. Heat Mass Transf. 2007, 43, 207–215. [Google Scholar] [CrossRef]
  21. Ji, L.; Li, W.; Shi, W.; Chang, H.; Yang, Z.; Lund, H.; Kaiser, M.J. Energy characteristics of mixed-flow pump under different tip clearances based on entropy production analysis. Energy 2020, 199, 117447.1–117447.15. [Google Scholar] [CrossRef]
  22. Zhang, H.; Zang, J.; Zhang, D.; Shi, W.; Shen, J. Analysis of the formation mechanism of secondary tip leakage vortex (S-TLV) in an axial flow pump. Machines 2022, 10, 41. [Google Scholar] [CrossRef]
  23. Bejan, A. General criterion for rating heat-exchanger performance. Int. J. Heat Mass Transf. 1978, 21, 655–658. [Google Scholar] [CrossRef]
  24. Shen, S.; Qian, Z.; Ji, B. Numerical analysis of mechanical energy dissipation for an axial-flow pump based on entropy generation theory. Energies 2019, 12, 4162. [Google Scholar] [CrossRef] [Green Version]
  25. Böhle, M.; Fleder, A.; Mohr, M. Study of the losses in fluid machinery with the help of entropy. In Proceedings of the 16th International Symposium on Transport Phenomena and Dynamics of Rotating Machinery, Honolulu, HI, USA, 10–15 April 2016. [Google Scholar]
  26. Li, X.; Zhu, Z.; Li, Y.; Chen, X. Experimental and numerical investigations of head-flow curve instability of a single-stage centrifugal pump with volute casing. Proc. Inst. Mech. Eng. Part A-J. Power 2016, 230, 633–647. [Google Scholar] [CrossRef]
  27. Feng, J.; Zhang, Y.; Zhu, G.; Li, Y.; Li, W.; Luo, X. Transition process characteristics of centrifugal pump with power-off based on entropy production theory. Trans. Chin. Soc. Agric. Eng. 2020, 36, 10–17. [Google Scholar]
  28. Zhang, D.; Wu, S.; Shi, W.; Pan, D.; Zhang, G. Application and experiment of different turbulence models for simulating tip leakage vortex in axial flow pump. Trans. Chin. Soc. Agric. Eng. 2013, 29, 46–53. [Google Scholar]
  29. Yang, X.; Yu, Y.; Dong, L.; Zhu, X. Study of improvement of flow pattern in side-inlet pumping station based on SST k-ω turbulence model. J. China Three Gorges Univ. (Nat. Sci.) 2018, 40, 1–4. [Google Scholar]
  30. Bejan, A. Entropy Production through Heat and Fluid Flow; John Wiley & Sons: New York, NY, USA, 1994. [Google Scholar]
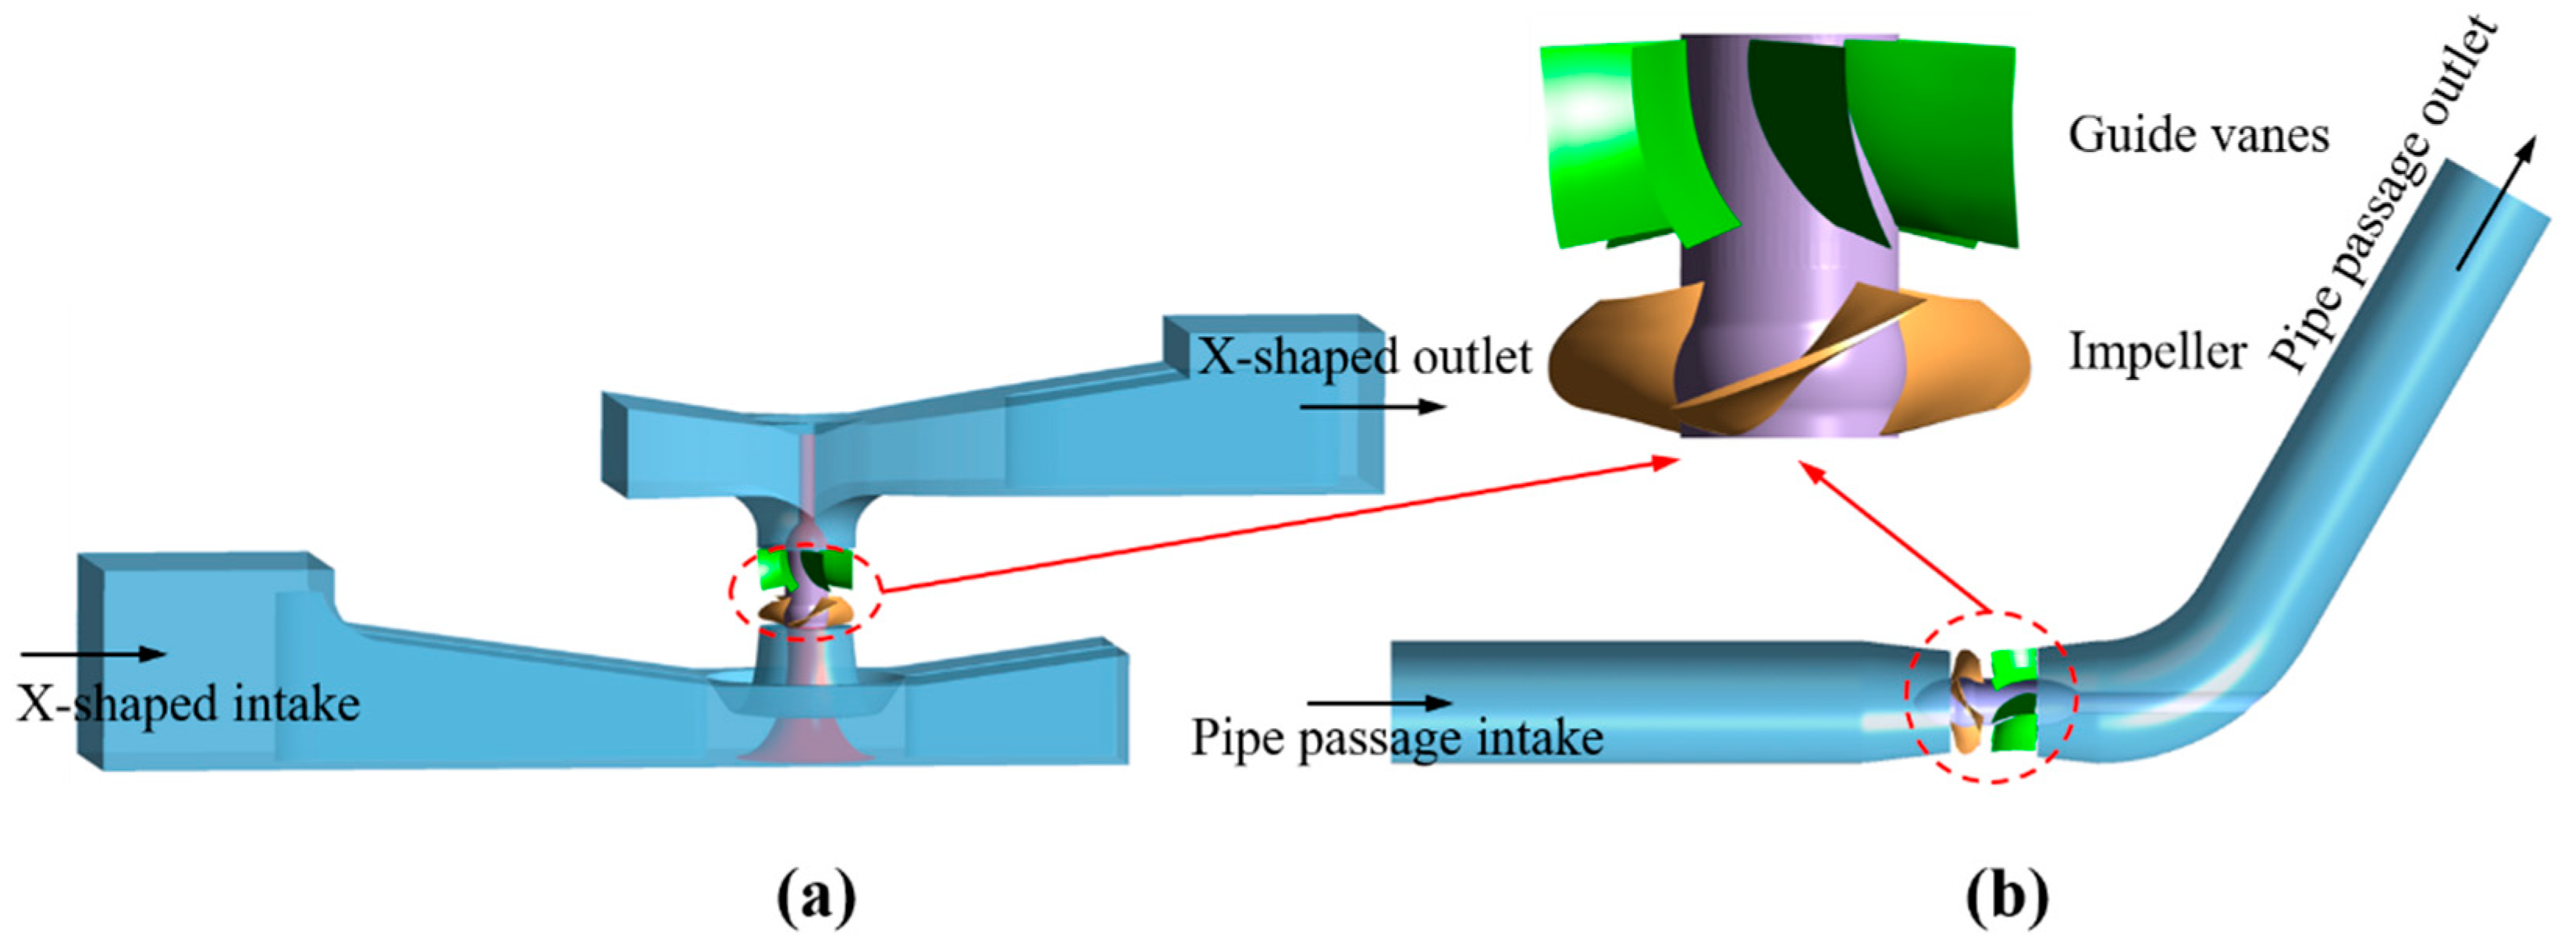
Figure 1. Calculation models: (a) with X-shaped flow channel; (b) with pipe passages.
Machines 10 01014 g001
Figure 2. Meshes of the computational domain: (a) the guide vanes, (b) the impeller, (c) the X-shaped intake, and (d) the X-shaped outlet passage.
Machines 10 01014 g002
Figure 3. Distribution of Y+ value for the impeller and guide vanes.
Machines 10 01014 g003
Figure 4. Schematic of the closed test bench.
Machines 10 01014 g004
Figure 5. Comparison of hydraulic performance between test and CFD results.
Machines 10 01014 g005
Figure 6. Comparison of head and efficiency between uniform and non-uniform inflow.
Machines 10 01014 g006
Figure 7. Axial velocity of impeller inlet for each case with different flow rates.
Machines 10 01014 g007
Figure 8. TEP distribution for Cases 1 and 2 with different flow rates.
Machines 10 01014 g008
Figure 9. Total entropy production rate of the inflow passage for each case with different flow rates: (a) 0.8Qdes, (b) 1.0Qdes, and (c) 1.2Qdes.
Machines 10 01014 g009
Figure 10. Velocity distribution of the inflow passage for each case with different flow rates: (a) 0.8Qdes, (b) 1.0Qdes, and (c) 1.2Qdes.
Machines 10 01014 g010
Figure 11. Total entropy production rate on the turbo surface with Span = 0.5 of impeller for each case with different flow rates: (a) 0.8Qdes, (b) 1.0Qdes, and (c) 1.2Qdes.
Machines 10 01014 g011
Figure 12. Velocity distribution on the turbo surface with Span = 0.5 of impeller for each case with different flow rates: (a) 0.8Qdes, (b) 1.0Qdes, and (c) 1.2Qdes.
Machines 10 01014 g012
Figure 13. Total entropy production on the turbo surface with Span = 0.5 of guide vanes for each case with different flow rates: (a) 0.8Qdes, (b) 1.0Qdes, and (c) 1.2Qdes.
Machines 10 01014 g013
Figure 14. Velocity streamline on the turbo surface with Span = 0.5 of guide vanes for each case with different flow rates: (a) 0.8Qdes, (b) 1.0Qdes, and (c) 1.2Qdes.
Machines 10 01014 g014
Figure 15. The location of the vertical mid-section of the outlet passage in each case.
Machines 10 01014 g015
Figure 16. Total entropy production rate distribution of the outlet passage for each case with different flow rates: (a) 0.8Qdes, (b) 1.0Qdes, and (c) 1.2Qdes.
Machines 10 01014 g016
Figure 17. Velocity streamlined distribution of the outlet passage for each case with different flow rates: (a) 0.8Qdes, (b) 1.0Qdes, and (c) 1.2Qdes.
Machines 10 01014 g017
Table 1. Parameters of bidirectional vertical axial flow pumping station.
ParameterValueUnit
Design operation point
Design flow rate0.324m3/s
Design head6.75m
Rotation speed1409r/min
Specific speed699.03-
Impeller
Number of impeller blade4-
Impeller diameter300mm
Hub diameter145.71mm
Tip clearance0.2mm
Guide vanes
Number of guide vane blades7-
Inlet diameter292mm
Outlet diameter311mm
Hub diameter135.74mm
Table 2. Total entropy production of the whole domain with different flow rates for each case.
Flow Rate Q/Qdes0.80.91.01.11.2
TEP of Case 1 (W/K)9.526.605.696.136.10
TEP of Case 2 (W/K)8.025.314.364.034.71
Increase rate (%)18.6824.3830.5052.1529.67
Publisher’s Note: MDPI stays neutral with regard to jurisdictional claims in published maps and institutional affiliations.