Abstract
Chatter is one of the most deleterious phenomena during the machining process, and leads to a low quality of workpiece surface, a noisy workplace, and decreases in tool and machine life. In order to overcome these limitations and improve the machining performance, various effective methods have been developed for chatter detection. The main shortcoming of such methods is that they require all the data to be labeled. However, the labeled data that accurately reflect the chatter states are hard to collect in practical application. This paper proposes a semi-supervised method to classify chatter states with a small quantity of labeled data and large quantity of unlabeled ones. In order to improve the classification accuracy and generalization ability, ensemble learning is combined with the semi-supervised method, and an EB-SSL model is proposed in this paper. Take the non-stationarity and multiple scaling behaviors of chatter data into consideration, multifractal detrended fluctuation analysis (MF-DFA) is utilized to extract distinguished features from raw chatter detection signals. Experimental results show that this method can identify the chatter states more accurately. The performance analysis indicates that the proposed method is applicable in different milling conditions.
1. Introduction
Chatter brings instability into a system, leads to the poor surface quality of a workpiece, shortens the useful life of cutting tools, and produces harsh noise in high speed milling processes. In order to detect, predict, and avoid chatter, effective methods have been developed in the past several decades [1]. The stability lobe diagram (SLD) has been researched and calculated by various methods, such as full-discretization method (FDM) [2], semi-discretization method (SDM) [3], and differential quadrature method (DQM) [4]. Based on the SLD, conservative cutting parameters are usually chosen in the actual machining process to avoid chatter. However, the conservative choice of cutting parameters will seriously limit the high productivity, and the selected cutting parameters cannot adapt to the constant change in dynamic characteristics. Aiming at satisfying the demand for higher quality and productivity and promoting the development of intelligent manufacturing, many scholars have put great effort in the timely detection of chatter.
Thanks to the development of machine learning and sensor technology, different methods have been devoted to the online monitoring of chatter in both academia and research and industry. In recent years, vibration signals [5], cutting force [6], sound [7], acoustic emission (AE) [8], and motor current [9] have been commonly used for chatter detection. In order to accurately detect chatter states, a multi-sensor system has been developed. Kuljanic et al. [10] compared a single-sensor system with a multi-sensor one in terms of accuracy and robustness, and the results proved that the multi-sensor system performance better in the chatter identification. No matter which signal is utilized for chatter monitoring, the signal-processing method and feature-extraction method, which aim at obtaining the sensitive chatter information, are extremely important. The raw signals captured from various sensors inevitably contain background noise and chatter-irrelevant signals. Therefore, signal-processing methods and feature-extraction methods for eliminating the chatter-irrelevant signal components have been the subject of great effort in recent years. Patwari et al. [11] analyzed the vibration signals with fast Fourier transform (FFT), and then identified the chatter that was generated in titanium machining. Cao et al. [12] utilized wavelet packet transform (WPT) to denoise and reconstruct the measured signals and the Hilbert–Huang transform (HHT) was used for analyzing the reconstructed signals. Li et al. [13] decomposed the vibration signals with empirical mode composition (EMD) and then extracted the features of the chatter symptom. The results showed that the extracted feature vectors based on the EMD can identify the chatter rapidly. Features extracted from the sensor signals are often high dimensional and not all the features can adequately reflect changes in the chatter states. Hence, feature selection or dimensionality-reduction methods are essential for the purpose of improving computational efficiency and identification robustness. Lamraoui et al. [14] selected the best features for chatter detection by ranking the extracted features based on their extropy. Chen et al. [15] ranked the extracted features with the Fisher discriminant ratio (FDR), and features with high FDR were chosen and used for chatter detection. Besides this, feature dimensionality reduction is also used for feature selection, using methods such as principle component analysis [16], stacked denoising autoencoders [17,18], and neural networks [19].
Once the feature extraction and selection are completed, the next task is to identify the chatter states with the selected features. Many researchers have conducted much work on detecting chatter based on the characteristics of sensor signals in recent years. The simplest method for chatter detection is the threshold method, which compares the monitored index with the predefined threshold criterion. However, this method is particularly dependent on machining parameters and individual experience, which results in low robustness in chatter monitoring. To overcome the shortcomings of the threshold method, pattern-recognition methods have been employed in chatter-monitoring systems. Based on the observed vibration signals, Tansel et al. [20] recognized the chatter states with two neural networks. Zhang et al. [21] extracted features with a hidden Markov model (HMM), and then identified chatter with an artificial neural network (ANN). Fu et al. [22] used a Gaussian mixed model to calculate the two indicators that obtained based on the features extracted from the IMFs, and these two indicators quantified the threshold of chatter. In order to monitor chatter online, Liu et al. [9] employed a support vector machine (SVM) based on the energy index and kurtosis index of IMFs in turning.
Although these aforementioned methods appear to be effective in chatter monitoring, they are all supervision-based methods, and they need all the train data to be labeled. In real-world applications, however, it is difficult to obtain an abundance of labeled chatter data. There is no objective evaluation criterion for chatter states, and the subjective judgment of chatter classes is easily affected by materials, lighting, and other circumstances. Therefore, the experimental data contain only a small number of stable data and severe chatter data, whose labels can be easily observed, and the rest is a large amount of unlabeled data, which cannot determine the chatter classes. Making partial use of labeled training data and large amounts of massive unlabeled data, semi-supervised learning (SSL) [23] seems to be a powerful solution to this problem. Grzenda and Bustillo [24] proposed a semi-supervised approach for the prediction of roughness in milling process, which combined the supervised k-nearest neighbors and random forest techniques. Encountering the limitations of labeled data, Razavi-Far et al. [25] developed a semi-supervised deep learning scheme for gearbox diagnosis. So as to diagnose faults of rolling bearings, Yu et al. [26] proposed an efficient semi-supervised learning model and enriched the training dataset with both labeled and unlabeled data. Zhang et al. [27] considered the difficulty in collecting large amounts of labeled data in the practical application of bearing fault diagnosis, and then a deep generative model was proposed under the semi-supervised learning framework.
The above semi-supervised learning studies utilize various machine learning methods as its base learner. However, a single learner usually has the problem of poor adaptability. The purpose of ensemble learning is to improve generalization using several basic learners. Many efficient ensemble methods, such as BOOSTING [28], BAGGING [29], and STACKING [30], have been developed. Based on the above literature review, a novel ensemble-based semi-supervised (EB-SSL) method that can detect the chatter state in a milling process with both small amounts of labeled samples and large quantity of unlabeled ones was developed in this study. Under the framework of SSL, an extreme learning machine (ELM) is used as a base learner. Multiple EMLs were ensembled to improve generalization ability as well as accuracy.
2. Modellings in Milling Chatter Detection
2.1. Motivation
Under a supervision-based learning framework, the training data for chatter detection are all required to be labeled in most existing studies. Nevertheless, in real-world chatter detection, it is hard to collect an abundance of labeled data. Chatter states can only be judged by the machined surface, which heavily depends on expert or empirical knowledge. For most machine operators and researchers, there are no objective evaluation criteria for chatter-state judgment, and the subjective judgment of chatter classes is easily affected by materials, lighting, and other circumstances. It can be seen in Figure 1 that stage A and stage C can be easily identified as stable and chatter states, respectively. However, stage B in Figure 1b, which is hard to decide its labels, widely appears in experiments and actual machining processes.
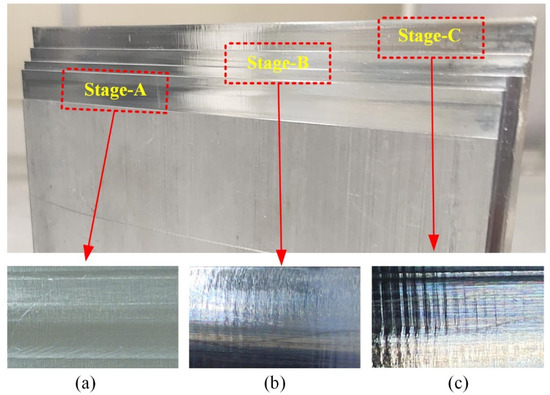
Figure 1.
Surface of milling-machined workpiece. (a) Stable; (b) Unlabeled; (c) Chatter.
Motivated by this phenomenon, a semi-supervised method was proposed in this research, which makes full use of a small quantity of labeled data and a large quantity of unlabeled ones. In order to improve the generalization ability and classification accuracy, ensemble learning is combined with the semi-supervised method using multiple base learners.
2.2. Proposed Method
2.2.1. Multifractal Detrended Fluctuation Analysis
Dynamic signals in chatter-detection processes are usually characterized by non-stationarity and multiple scaling behaviors. In order to uncover the underlying dynamical mechanism of chatter data, a multifractal detrended fluctuation analysis (MF-DFA) [31] is developed to extract the features of chatter data in this study. Supposing is a series of chatter data with length , the process is composed of five steps.
Step 1. Constructing the profile of .
Step 2. Dividing the profile into segments, which is overlapped with the same length .
Step 3. Computing the local trend with the least squares method, and then determining the variance.
where is the fitting polynomial in segment .
Step 4. Averaging segments calculated above to get the -order fluctuation function:
Step 5. Defining the scaling behavior of fluctuation functions for each value of .
where is the generalized Hurst exponent. The multifractality of a series can also be quantified using the multifractal spectrum, and can be derived with:
and then the Legendre transform [32],
2.2.2. Ensemble-Based Semi-Supervised Learning
Take the labeled training dataset with samples and unlabeled training dataset with samples, where is the feature vector and is the corresponding target vector. To fully utilize both labeled and unlabeled chatter data, we propose an ensemble-based SSL method in this research. In the proposed method, ELM is selected as the base classifiers , and base classifiers are ensembled to form a strong classifier . The loss function can be expressed as [33]:
where and indicate the empirical loss trained with labeled data and diversity loss on unlabeled ones, respectively. Furthermore, represents the weighting factor that balances the importance of empirical loss and diversity. The empirical loss function can be formed as:
Suppose that there are number of hidden nodes in ELM [34], the base classifier can be mathematically expressed as:
where is the activation function, is the bias of hidden nodes, and denote the input weights and output weights, respectively. is determined as follows:
is modeled as:
A gradient descent-based method is used to search the target model .
The parameters and in Equation (12) are assigned randomly, and the output weights can be calculated as follows:
where
The training process of ELM is equivalent to find the least square solution of Equation (17):
where is the Moor–Penrose generalized inverse of matrix . The gradients of with respect to the model parameters are determined as follows:
3. Framework of the Proposed Method for Chatter Detection
This section describes the framework of the proposed methodology, the overall structure of which is described in Figure 2. The time domain, frequency domain, and MF-DFA features are first extracted from the raw sensor data (i.e., cutting force and vibration signal). A stacked denoised autoencoder (SDAE) is then used to automatically select the most relevant features. Next, feature vectors are divided into labeled dataset and unlabeled dataset, and set into the proposed EB-SSL for training. The labeled and unlabeled datasets are both utilized to train the base classifiers. After that, the base classifiers are ensembled to form a strong classifier for chatter-state classification.
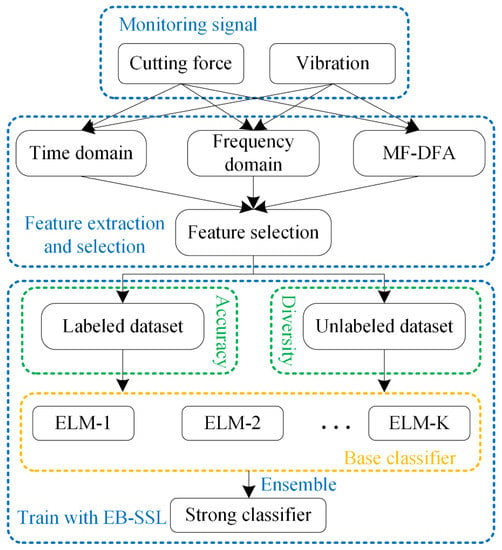
Figure 2.
Overall flowchart of the proposed method for chatter detection.
3.1. Feature Extraction and Selection
The feature extraction is performed to reduce the interference of noise and remove irrelevant signals from the original signals. The statistical features are extracted in the time domain and frequency domain from the force (X, Y, and Z) signals and the vibration (X and Y) signals. According to [35], 91 features in time and frequency domains are extracted from five channels of the sensor signals and are listed in Table 1.

Table 1.
Statistical features in time and frequency domain.
According to Section 2.2.1, multifractal features can be extracted from the spectrum. In this study, the six characteristic parameters include the multifractal spectrum width , minimum singularity exponent (, ), maximum singularity exponent (, ), and extremum value . In total, 91 time- and frequency-domain features and 30 MF-DFA features are extracted in this study, which contains cross correlation and redundancy information. If all 121 features were involved in the computation, the proposed model would suffer a curse of dimensionality. Additionally, high-dimensionality features would increase the computational cost and cause unstable recognition results. SDAE is used for feature dimensionality reduction in this study to deal with these issues.
3.2. Model Parameters Training
In this study, labeled data are first used to initialize the model parameters of the base ELM classifiers. Both the labeled and unlabeled datasets participate in training of the proposed EB-SSL model. We use the labeled data to maximize the accuracy of the base classifiers, while using the unlabeled ones to maximize classifier diversity. After the training process, the parameters of each base classifier can be obtained, and a strong classifier is formed by assembling these trained classifiers.
4. Experimental Study
This section demonstrates the proposed EB-SSL model for chatter detection with practical experimental investigation. The experimental study consists of three parts: (1) experiment setup and data acquisition, (2) signal processing, and (3) results and analysis. The details of these three parts are introduced in Section 4.1, Section 4.2 and Section 4.3, respectively.
4.1. Experiment Setup and Data Acquisition
As shown in Figure 3a, cutting experiments were conducted on a CNC milling machine (DEUSI XK-L540). A coated carbide cutter (Jing Hong) with 75 mm overall length, 30 mm cutting flute length, 50 mm overhang length, and 10 mm diameter was mounted on a BT30 tool holder (SYIC). The cutting tool used was monolithic with three flutes. In order to collect the cutting force signal, a custom three-channel dynamometer, uTekL-YD-F3220, was mounted on the workbench. Two accelerometers, model uTekL-YX-1232, were placed in the directions X and Y of the spindle to measure the vibration signal. The data-acquisition system, which consists of a computer, charge amplifier, and DAQ-uT3408M, is shown in Figure 3b.
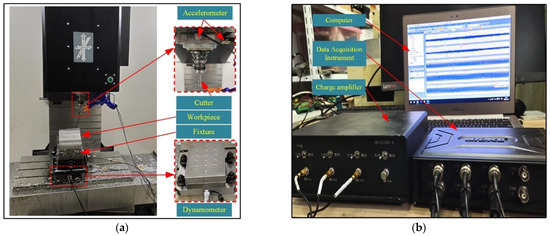
Figure 3.
Experimental setup for chatter detection. (a) Configuration of machine; (b) Data-acquisition and analysis system.
In this research, two types of workpieces with different shapes are used; the material of all the workpieces are 6061 aluminum. The shape and size of these workpieces are shown in Figure 4. It can be seen from Figure 4 that Shape #1, #2, and #3 are belong to one type, and their cutting depth varies with discrete values (0.1 mm, 0.3 mm, 0.5 mm, and so on). It is well known that thin-walled workpieces are prone to chatter in a machining process. To enrich the dataset and ensure that it contains stable, unlabeled, and chatter states, we selected three workpieces (#1, #2, and #3) with different thickness. The cutting depth of Shape #4 changes from 0 mm to 8 mm. When the axial cutting depth increases along the feed direction in Shape #4, the cutting states gradually change from stable to chattering. In order to enrich the dataset and activate different cutting states, different cutting parameters (e.g., spindle speed, feed rate, axial and radial depth of cutting) were selected based on the SLD predicted in our previous research. Therefore, with these two types of workpieces and different cutting conditions, we can obtain enough data, which include stable, unlabeled, and chatter states. In total, 70 groups of experiments were conducted in this research, and the cutting parameters and cutting states are listed in Table 2.
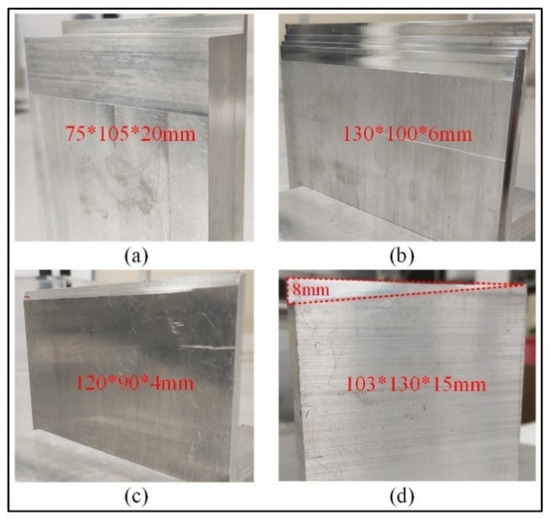
Figure 4.
Workpiece with different shapes. (a) Shape #1; (b) Shape #2; (c) Shape #3; (d) Shape #4.

Table 2.
Chatter states under different cutting conditions.
4.2. Signal Processing
Following Section 2.2.1, we extracted the features with MF-DFA and choose order in this study. The q-order Hurst exponent for different chatter states is shown in Figure 5. From Figure 5, it can be seen that stable series exhibit lower multifractality than chatter series. For a better analysis of multifractal strength for stable, unlabeled, and chatter timeseries, singularity spectra [36] are calculated as depicted in Figure 6. The difference of the spectra can be clearly found for stable, unlabeled, and chattering timeseries. The multifractal spectrum parameters (, , , , , and ) are listed in Table 3. One measure of the degree of multifractality is the width of the multifractal spectra. As you can see from Figure 6 and Table 3, the parameter , , and of stability series are larger chatter ones, while the parameters , , and are the opposite.
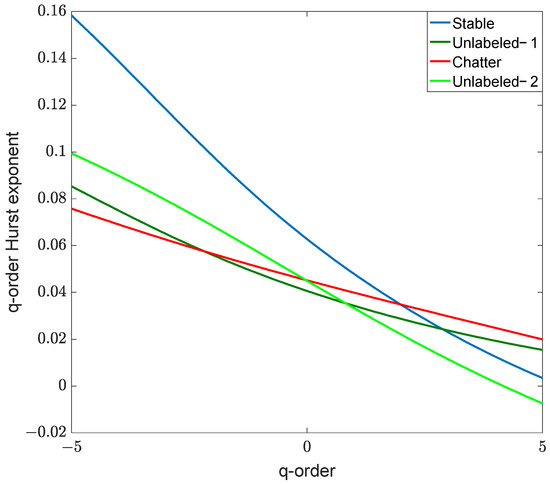
Figure 5.
Generalized Hurst exponent curve of different chatter states.
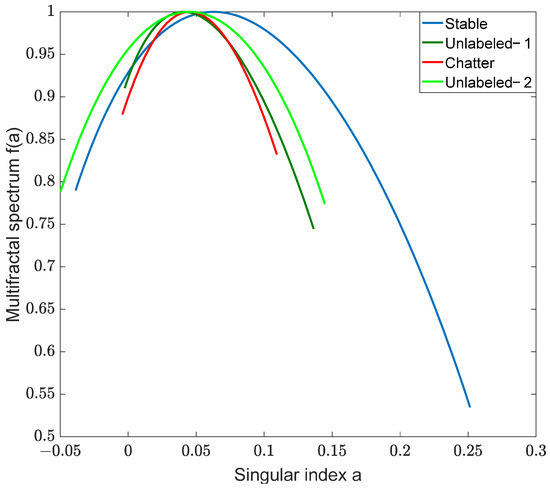
Figure 6.
Multifractal spectrum of different chatter states.

Table 3.
Typical features extracted with MF-DFA.
4.3. Results and Analysis
The signals were captured from experiments No. #1, #14, and #43, which represent the stable, unlabeled, and chatter states, respectively.
The five-channel raw signals captured from experiments No. #1, #14, and #43, which represent the stable, unlabeled, and chatter states, respectively, are shown in Figure 7. It can be seen from Figure 7 that the general trend of signals becomes larger as the machining process goes from stable to chatter states.
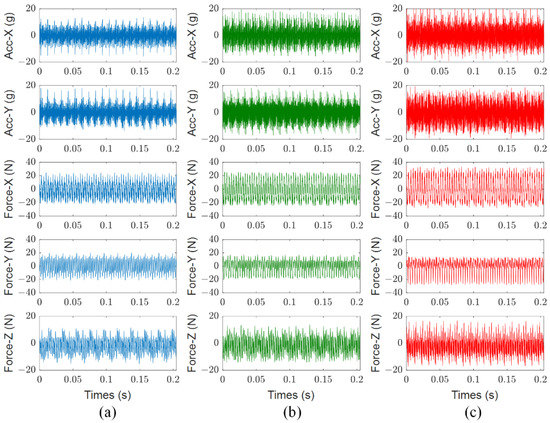
Figure 7.
Raw signals of different chatter states. (a) Stable; (b) Unlabeled; (c) Chatter.
This study sets the extracted features in the time and frequency domains as a group of feature subsets, and sets the features extracted with MF-DFA as another. The classification accuracy of different feature groups is shown in Figure 8. The results show that with the two distinct feature groups, classification accuracies are only 89.47% and 78.95%, respectively. However, with the combination of time- and frequency-domain features and MD-DFA features, the classification accuracy increased significantly to 94.74%, indicating that mixed features are more suitable for chatter detection.
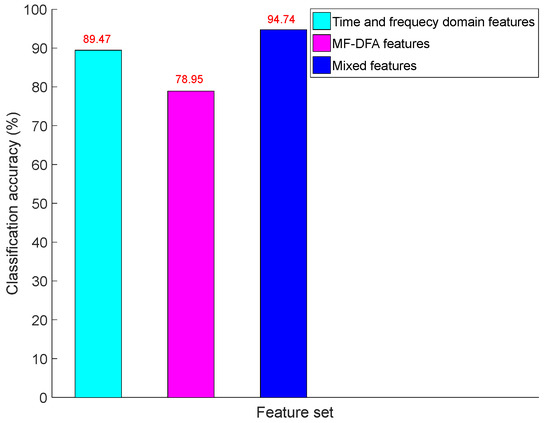
Figure 8.
Classification accuracy with different feature sets.
Figure 9 and Figure 10 show the chatter identification results of the workpiece (shape #4) with different machining parameters. The mixed features extracted from workpieces #1, #2, and #3 are utilized to train the proposed EB-SSL model. The serial sampling data of workpiece #4 was split to different chatter states with 1024 points. For convenience, the stable and chatter state are signed with 1 and −1. The machining parameters in Figure 9 are as follows: spindle speed 4500 rpm, feed rate 400 mm/min, and radial depth of cut 2.5 mm. Results with spindle speed 6800 rpm, feed rate 400 mm/min, and radial depth of cut 2.5 mm are shown in Figure 10. From Figure 9 and Figure 10, it can be observed that the chatter states can be generally classified with mixed characteristics and the proposed EB-SSL model. In addition, we find that there is misclassification in both classification results, especially around the boundary of stable and chatter states. These misclassifications occur at the transition state from stable to chatter, in which the corresponding signal features are hard to recognize. This explains why the difference between stable and chatter is not very clear.
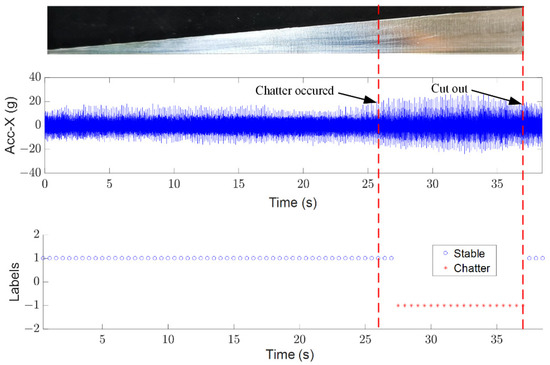
Figure 9.
Chatter identification results with proposed method (spindle speed 4500 rpm, feed rate 400 mm/min, and radial cutting depth 2.5 mm).
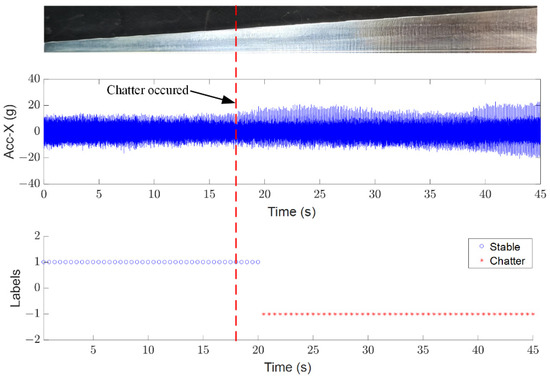
Figure 10.
Chatter identification results with proposed method (spindle speed 6800 rpm, feed rate 450 mm/min, and radial cutting depth 2 mm).
4.4. Comparison and Discussion
The proposed EB-SSL model can be trained with separate labeled data, separate unlabeled data, and mixed data. Table 4 presents the testing results that were trained with a different dataset under different machining conditions (number 61, 63, 65, 67, and 69 in Table 2). It can be observed from Table 4 that the model trained with unlabeled data is generally less accurate, while the accuracy of the model trained with labeled data fluctuates significantly with cutting conditions. When using both labeled and unlabeled data training models, accuracy is maintained at a high level while adapting to different cutting conditions.

Table 4.
Recognition accuracy with different training datasets.
Furthermore, we compared the recognition results of our EB-SSL model with the UDEED method proposed in [33] on the same chatter-detection task, and the recognition results are presented in Table 5. Comparison results indicate that our EB-SSL model performs better than the UDEED model.

Table 5.
Recognition results of different models.
In order to further illustrate the advantages of the methods proposed in this paper, we also compared the recognition results with previous research into chatter detection. First, the proposed EB-SSL method is compared with existing supervised learning methods, i.e., Adaboost-SVM [37] and DCNN [38]. The chatter-recognition accuracy of these supervised learning methods is generally above 96%, and is 2–4% higher than that of our proposed method. However, these supervised learning methods require that all data be labeled, which is difficult to implement in real-world applications. Second, the proposed EB-SSL method is also compared with existing unsupervised learning methods, i.e., hybrid clustering [39] and k-means [40]. The recognition results with these unsupervised learning methods sometimes display large ranges of fluctuations, which means that these existing unsupervised methods are less robust than our method. To summarize, the results signify that the proposed EB-SSL model can accurately identify chatter states, and is applicable for the detection of milling chatter under different milling conditions.
5. Conclusions
In the present work, a methodology is proposed for chatter detection in milling processes. Benefiting from the semi-supervised learning method, both labeled and unlabeled data in the milling process can be fully used for training. With the aim of improving classification accuracy and generalization ability, ensemble learning is combined with semi-supervised method using multiple base classifiers, and an EB-SSL model is proposed in this work. Take the non-stationarity and multiple scaling behaviors of chatter data into consideration, MF-DFA is utilized to extracted the distinguished features. Experimental results show that this method can identify the cutting states with a high accuracy under different milling conditions.
Experimental results show that the proposed model can effectively recognize the cutting state, but some problems still need further study. Firstly, we ignored the influence of many factors in the experiments (i.e., tool wear, workpiece clamping, tool path, and so on). However, all these factors may cause potential errors in the results. Hence, all these factors will be considered when we establish a chatter-detection model in further work. Secondly, we only considered the identification of the chatter state at the current time. However, chatter prediction is essential and necessary. Hence, early chatter prediction also needs to be considered in future work. These issues are worth exploring in the future.
Author Contributions
Conceptualization, W.L. and Y.Y.; Methodology, W.L. and P.W.; Validation, W.L.; Writing—original draft, W.L. and P.W.; Writing—review and editing, W.L. and Y.Y.; Visualization, W.L. and P.W.; Supervision, Y.Y. All authors have read and agreed to the published version of the manuscript.
Funding
This research was funded by the National Keypoint Research and Invention Program of China (2018YFB1309203).
Data Availability Statement
Not applicable.
Conflicts of Interest
The authors declare no conflict of interest.
References
- Zhu, L.; Liu, C. Recent progress of chatter prediction, detection and suppression in milling. Mech. Syst. Signal Process. 2020, 143, 106840. [Google Scholar] [CrossRef]
- Huang, C.; Yang, W.A.; Cai, X.; Liu, W.; You, Y. An efficient third-order full-discretization method for prediction of regenerative chatter stability in milling. Shock Vib. 2020, 9071451. [Google Scholar] [CrossRef]
- Insperger, T.; Stépán, G. Semi-discretization method for delayed systems. Int. J. Numer. Methods Eng. 2002, 55, 503–518. [Google Scholar] [CrossRef]
- Ding, Y.; Zhu, L.; Zhang, X.; Ding, H. Stability analysis of milling via the differential quadrature method. J. Manuf. Sci. Eng. 2013, 135, 044502. [Google Scholar] [CrossRef]
- Pérez-Canales, D.; Vela-Martínez, L.; Jáuregui-Correa, J.C.; Alvarez-Ramirez, J. Analysis of the entropy randomness index for machining chatter detection. Int. J. Mach. Tools Manuf. 2012, 62, 39–45. [Google Scholar] [CrossRef]
- Tangjitsitcharoen, S.; Saksri, T.; Ratanakuakangwan, S. Advance in chatter detection in ball end milling process by utilizing wavelet transform. J. Intell. Manuf. 2015, 26, 485–499. [Google Scholar] [CrossRef]
- Thaler, T.; Potočnik, P.; Bric, I.; Govekar, E. Chatter detection in band sawing based on discriminant analysis of sound features. Appl. Acoust. 2014, 77, 114–121. [Google Scholar] [CrossRef]
- Griffin, J.M.; Chen, X. Multiple classification of the acoustic emission signals extracted during burn and chatter anomalies using genetic programming. Int. J. Adv. Manuf. Technol. 2009, 45, 1152–1168. [Google Scholar] [CrossRef]
- Liu, H.; Chen, Q.; Li, B.; Mao, X.; Mao, K.; Peng, F. On-line chatter detection using servo motor current signal in turning. Sci. China Technol. Sci. 2011, 54, 3119–3129. [Google Scholar] [CrossRef]
- Kuljanic, E.; Sortino, M.; Totis, G. Multisensor approaches for chatter detection in milling. J. Sound Vib. 2008, 312, 672–693. [Google Scholar] [CrossRef]
- Patwari, M.A.U.; Amin, A.N.; Faris, W.F. Influence of chip serration frequency on chatter formation during end milling of Ti6Al4V. J. Manuf. Sci. Eng.-Trans. Asme 2011, 133, 011013. [Google Scholar] [CrossRef]
- Cao, H.; Lei, Y.; He, Z. Chatter identification in end milling process using wavelet packets and Hilbert–Huang transform. Int. J. Mach. Tools Manuf. 2013, 69, 11–19. [Google Scholar] [CrossRef]
- Li, X.; Yao, Z.H.; Chen, Z.C. An effective EMD-based feature extraction method for boring chatter recognition. Appl. Mech. Mater. 2010, 34, 1058–1063. [Google Scholar] [CrossRef]
- Lamraoui, M.; Barakat, M.; Thomas, M.; Badaoui, M.E. Chatter detection in milling machines by neural network classification and feature selection. J. Vib. Control 2015, 21, 1251–1266. [Google Scholar] [CrossRef]
- Chen, Y.; Li, H.; Hou, L.; Wang, J.; Bu, X. An intelligent chatter detection method based on EEMD and feature selection with multi-channel vibration signals. Measurement 2018, 127, 356–365. [Google Scholar] [CrossRef]
- Zhou, J.H.; Pang, C.K.; Zhong, Z.W.; Lewis, F.L. Tool wear monitoring using acoustic emissions by dominant-feature identification. IEEE Trans. Instrum. Meas. 2010, 60, 547–559. [Google Scholar] [CrossRef]
- Huang, W.B.; Sun, F.C. Building feature space of extreme learning machine with sparse denoising stacked-autoencoder. Neurocomputing 2016, 174, 60–71. [Google Scholar]
- Sun, Z.; Sun, H. Stacked denoising autoencoder with density-grid based clustering method for detecting outlier of wind turbine components. IEEE Access 2019, 7, 13078–13091. [Google Scholar] [CrossRef]
- Dong, J.; Subrahmanyam, K.V.R.; Wong, Y.S.; Hong, G.S.; Mohanty, A.R. Bayesian-inference-based neural networks for tool wear estimation. Int. J. Adv. Manuf. Technol. 2006, 30, 797–807. [Google Scholar] [CrossRef]
- Tansel, I.N.; Wagiman, A.; Tziranis, A. Recognition of chatter with neural networks. Int. J. Mach. Tools Manuf. 1991, 31, 539–552. [Google Scholar] [CrossRef]
- Zhang, C.L.; Yue, X.; Jiang, Y.T.; Zheng, W. A hybrid approach of ANN and HMM for cutting chatter monitoring. Adv. Mater. Res. 2010, 97, 3225–3232. [Google Scholar] [CrossRef]
- Fu, Y.; Zhang, Y.; Zhou, H.; Li, D.; Liu, H.; Qiao, H.; Wang, X. Timely online chatter detection in end milling process. Mech. Syst. Signal Process. 2016, 75, 668–688. [Google Scholar] [CrossRef]
- Zhu, X.J. Semi-Supervised Learning Literature Survey; University of Wisconsin-Madison: Madison, WI, USA, 2005. [Google Scholar]
- Grzenda, M.; Bustillo, A. Semi-supervised roughness prediction with partly unlabeled vibration data streams. J. Intell. Manuf. 2019, 30, 933–945. [Google Scholar] [CrossRef]
- Razavi-Far, R.; Hallaji, E.; Farajzadeh-Zanjani, M.; Saif, M.; Kia, S.H.; Henao, H.; Capolino, G.A. Information fusion and semi-supervised deep learning scheme for diagnosing gear faults in induction machine systems. IEEE Trans. Ind. Electron. 2018, 66, 6331–6342. [Google Scholar] [CrossRef]
- Yu, K.; Ma, H.; Lin, T.R.; Li, X. A consistency regularization based semi-supervised learning approach for intelligent fault diagnosis of rolling bearing. Measurement 2020, 165, 107987. [Google Scholar] [CrossRef]
- Zhang, S.; Ye, F.; Wang, B.; Habetler, T.G. Semi-supervised bearing fault diagnosis and classification using variational autoencoder-based deep generative models. IEEE Sens. J. 2020, 21, 6476–6486. [Google Scholar] [CrossRef]
- Freund, Y.; Schapire, R.E. A decision-theoretic generalization of on-line learning and an application to boosting. J. Comput. Syst. Sci. 1997, 55, 119–139. [Google Scholar] [CrossRef]
- Breiman, L. Bagging predictors. Mach. Learn. 1996, 24, 123–140. [Google Scholar] [CrossRef]
- Li, M.; Zhou, Z.H. Improve computer-aided diagnosis with machine learning techniques using undiagnosed samples. IEEE Trans. Syst. Man Cybern. Part A Syst. Hum. 2007, 37, 1088–1098. [Google Scholar] [CrossRef]
- Cheng, Q.; Liu, X.; Zhu, X. Cryptocurrency momentum effect: DFA and MF-DFA analysis. Phys. A Stat. Mech. Appl. 2019, 526, 120847. [Google Scholar] [CrossRef]
- Ghil, M.; Benzi, R.; Parisi, G.; Fisica, S.I. Turbulence and Predictability in Geophysical Fluid Dynamics and Climate Dynamics; Virginia University: Charlottesville, VI, USA, 1985. [Google Scholar]
- Zhang, M.L.; Zhou, Z.H. Exploiting unlabeled data to enhance ensemble diversity. Data Min. Knowl. Discov. 2013, 26, 98–129. [Google Scholar] [CrossRef]
- Huang, G.B.; Zhou, H.; Ding, X.; Zhang, R. Extreme learning machine for regression and multiclass classification. IEEE Trans. Syst. Man Cybern. Part B Cybern. 2011, 42, 513–529. [Google Scholar] [CrossRef] [PubMed]
- Yan, S.; Sun, Y. Early chatter detection in thin-walled workpiece milling process based on multi-synchrosqueezing transform and feature selection. Mech. Syst. Signal Process. 2022, 169, 108622. [Google Scholar] [CrossRef]
- Lin, M.; Yan, S.X.; Zhao, G.; Wang, G. Multifractal detrended fluctuation analysis of interevent time series in a modified OFC model. Commun. Theor. Phys. 2013, 59, 1. [Google Scholar] [CrossRef]
- Wan, S.; Li, X.; Yin, Y.; Hong, J. Milling chatter detection by multi-feature fusion and Adaboost-SVM. Mech. Syst. Signal Process. 2021, 156, 107671. [Google Scholar] [CrossRef]
- Sener, B.; Gudelek, M.U.; Ozbayoglu, A.M.; Unver, H.O. A novel chatter detection method for milling using deep convolution neural networks. Measurement 2021, 182, 109689. [Google Scholar] [CrossRef]
- Dun, Y.; Zhu, L.; Yan, B.; Wang, S. A chatter detection method in milling of thin-walled TC4 alloy workpiece based on auto-encoding and hybrid clustering. Mech. Syst. Signal Process. 2021, 158, 107755. [Google Scholar] [CrossRef]
- Wang, R.; Song, Q.; Liu, Z.; Ma, H.; Gupta, M.K.; Liu, Z. A novel unsupervised machine learning-based method for chatter detection in the milling of thin-walled parts. Sensors 2021, 21, 5779. [Google Scholar] [CrossRef]
Publisher’s Note: MDPI stays neutral with regard to jurisdictional claims in published maps and institutional affiliations. |
© 2022 by the authors. Licensee MDPI, Basel, Switzerland. This article is an open access article distributed under the terms and conditions of the Creative Commons Attribution (CC BY) license (https://creativecommons.org/licenses/by/4.0/).