1. Introduction
When it comes to pumping up abrasive, corrosive or shear sensitive fluids, which is a common challenge in a diverse range of industries such as mining, food manufacturing and petrochemicals manufacturing, the industrial hose pump plays an irreplaceable role due to its great resistance to friction and erosion. Depicted in
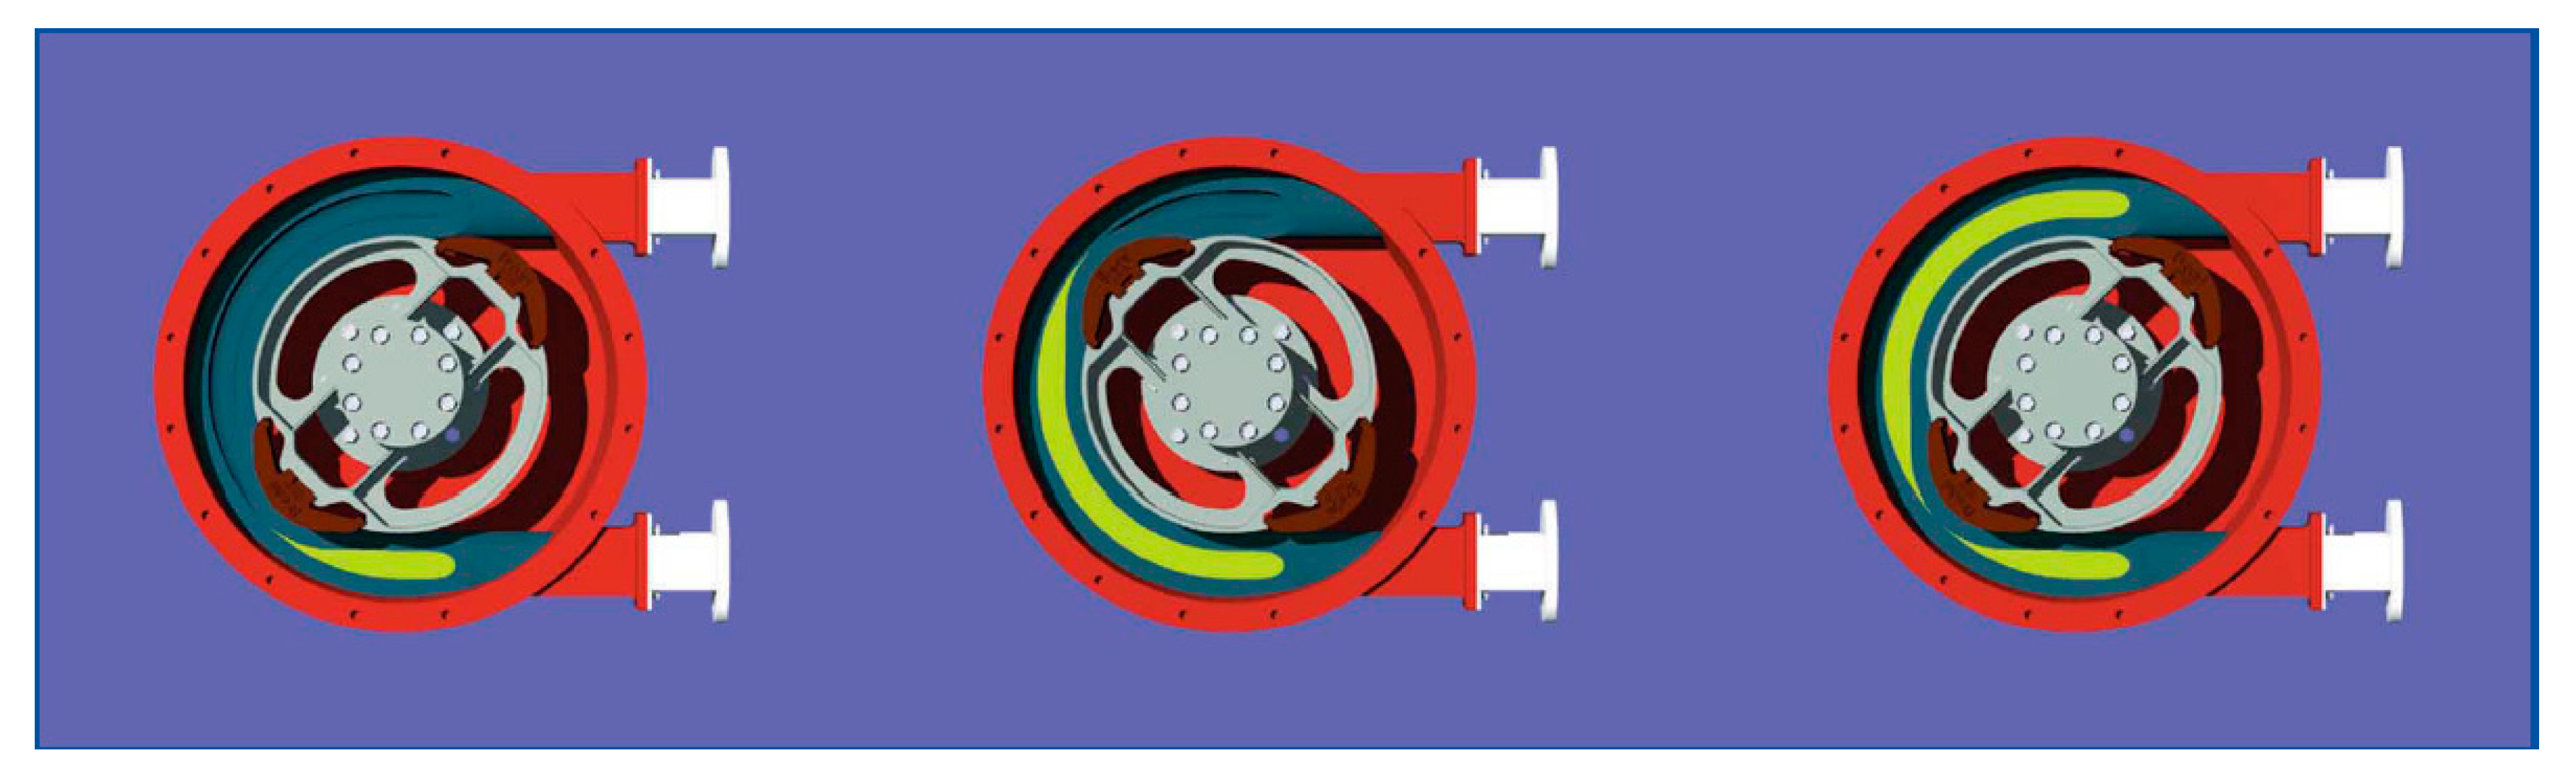
Figure 1 is the operational principle of a typical industrial hose pump. A hose, with one end flanged at the discharge line and the other at the suction line of a pumping system, is compressed to full closure by a pressing shoe, fixed on a rotor. As the rotor turns, the shoe squeezes along the hose, pushing the fluid inside towards the discharge line. Behind the shoe the recovering hose creates a vacuum which enables the pump to suck in a new batch of fluid. Due to the symmetry of the structure, the high-pressure end where the fluid is pumped out and the vacuum end can be easily swapped, with the rotor rotating reversely. Moreover, owing to the non-shear characteristics, shear sensitive fluids such as fruit jam can be conveyed by the industrial hose pump [
1,
2].
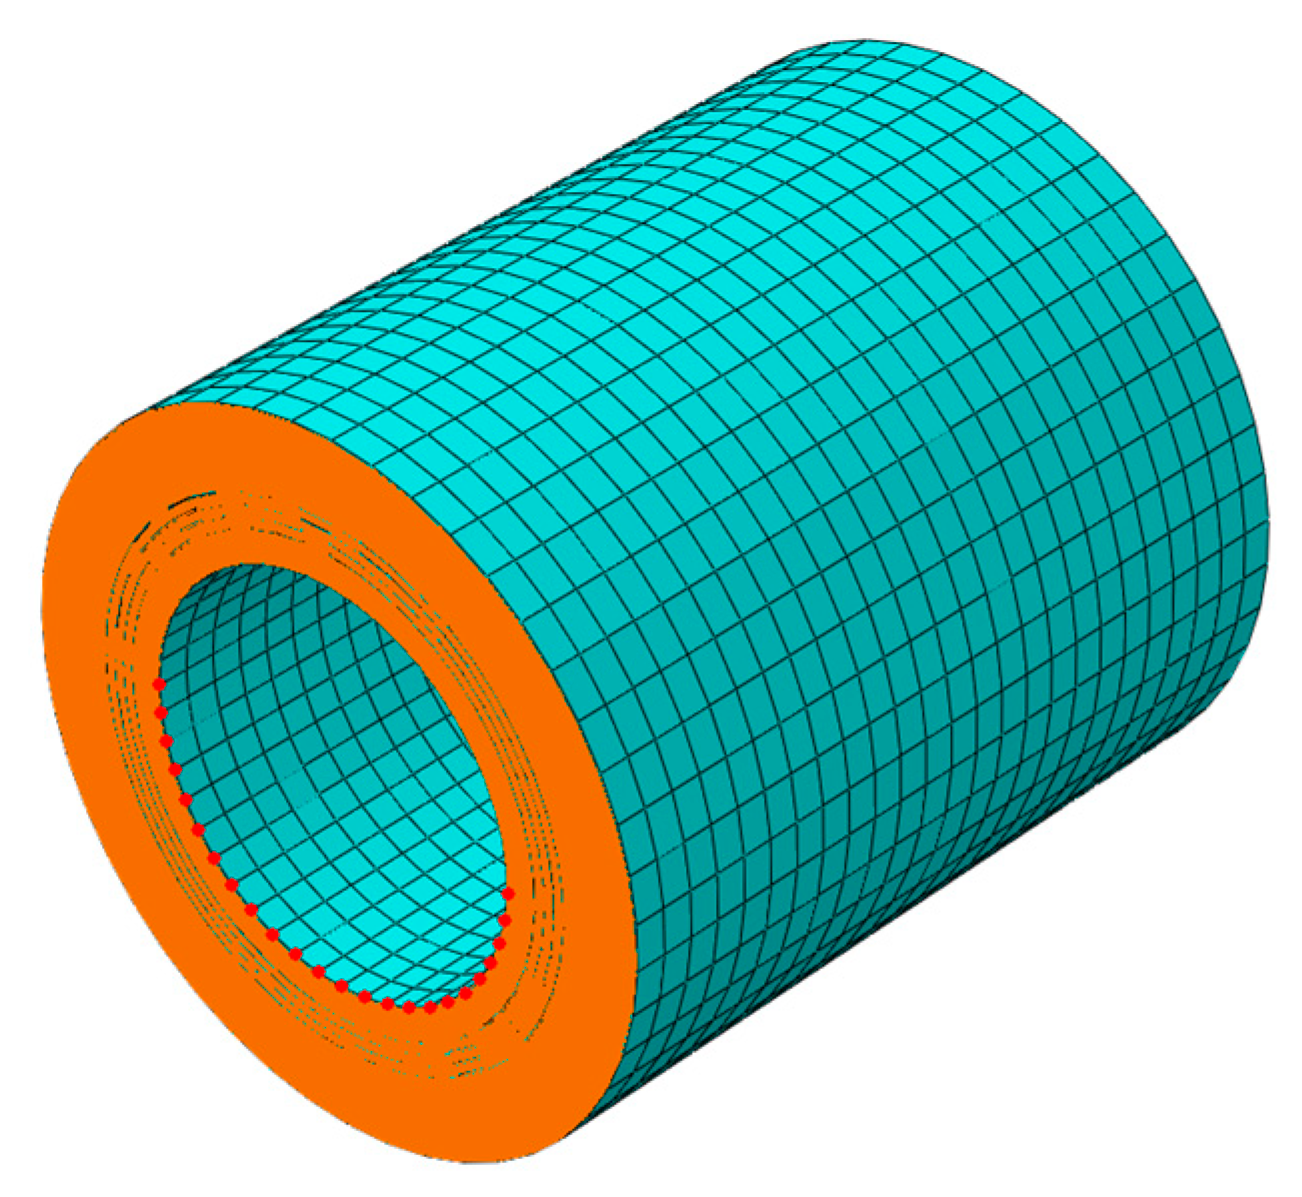
The hose used in a hose pump has three major functions: to rebound and suck in the fluid, to close completely and avoid a high velocity back-flow of the fluid and, finally, to confine the fluid inside the hose so that a catastrophic leakage to the pump will not happen. To achieve these demanding requirements, composite rubber hoses with fabric layers have been widely adopted. Generally, hose pump hoses consist of three layers: the inner rubber layer, the outer rubber layer and the reinforcement consisting of four layers of fabric-rubber composites of different cord orientations [
3]. The inner rubber layer has a good resistance to friction and erosion, while the reinforcement and the outer rubber layer, with good dynamical properties, ensure the recovery of the hose. Natural rubber (NR) is a typical choice for the inner rubber layer, while the other would prefer ethylene propylene diene terpolymer (EPDM). The fabric in the reinforcement tends to be nylon due to its outstanding performance in elasticity and strength. One thing that makes a hose pump hose different from hoses typically applied in hydraulic systems, such as the hydraulic braking hose used in the automobile power braking system [
4,
5], is that the fabric reinforcement tends to be non-braided, as shown in
Figure 2 [
6].
Traditional iterative approaches for the hose pump have long been applied, from which an appropriate design can be obtained; by no means can such a “trial-and-error” process be short and low-cost [
3]. In fact, only explicit results can be obtained, such as the fatigue life of the hose, which makes the designing process empirical and ambiguous. Simulations based on finite element analysis (FEA) can help to reveal the implicit dependencies such as the influence of the pressing displacement of the pressing shoe on the performance of the hose. Finally, all the studies and conclusions based on the finite element (FE) model and the numerical investigations it carries out would be acceptable, if only the model has been verified to be reliable. With good correspondence to the practical test data, an FE model was given in this paper. Implicit dependencies mentioned above were investigated based on the FE model.
There are few examples of convictive studies on non-braided fabric composite rubber hose. However, many studies related to composite reinforcement including rubber-cord composite have been published. Significance was attached to the homogenization of complex periodic composite patterns [
6,
7,
8,
9,
10]. Among them, representative volume element (RVE) was developed and applied to tackle the braided fabric layers used in hydraulic hoses [
6] and a numerical method for obtaining their mechanical properties under finite strains was developed [
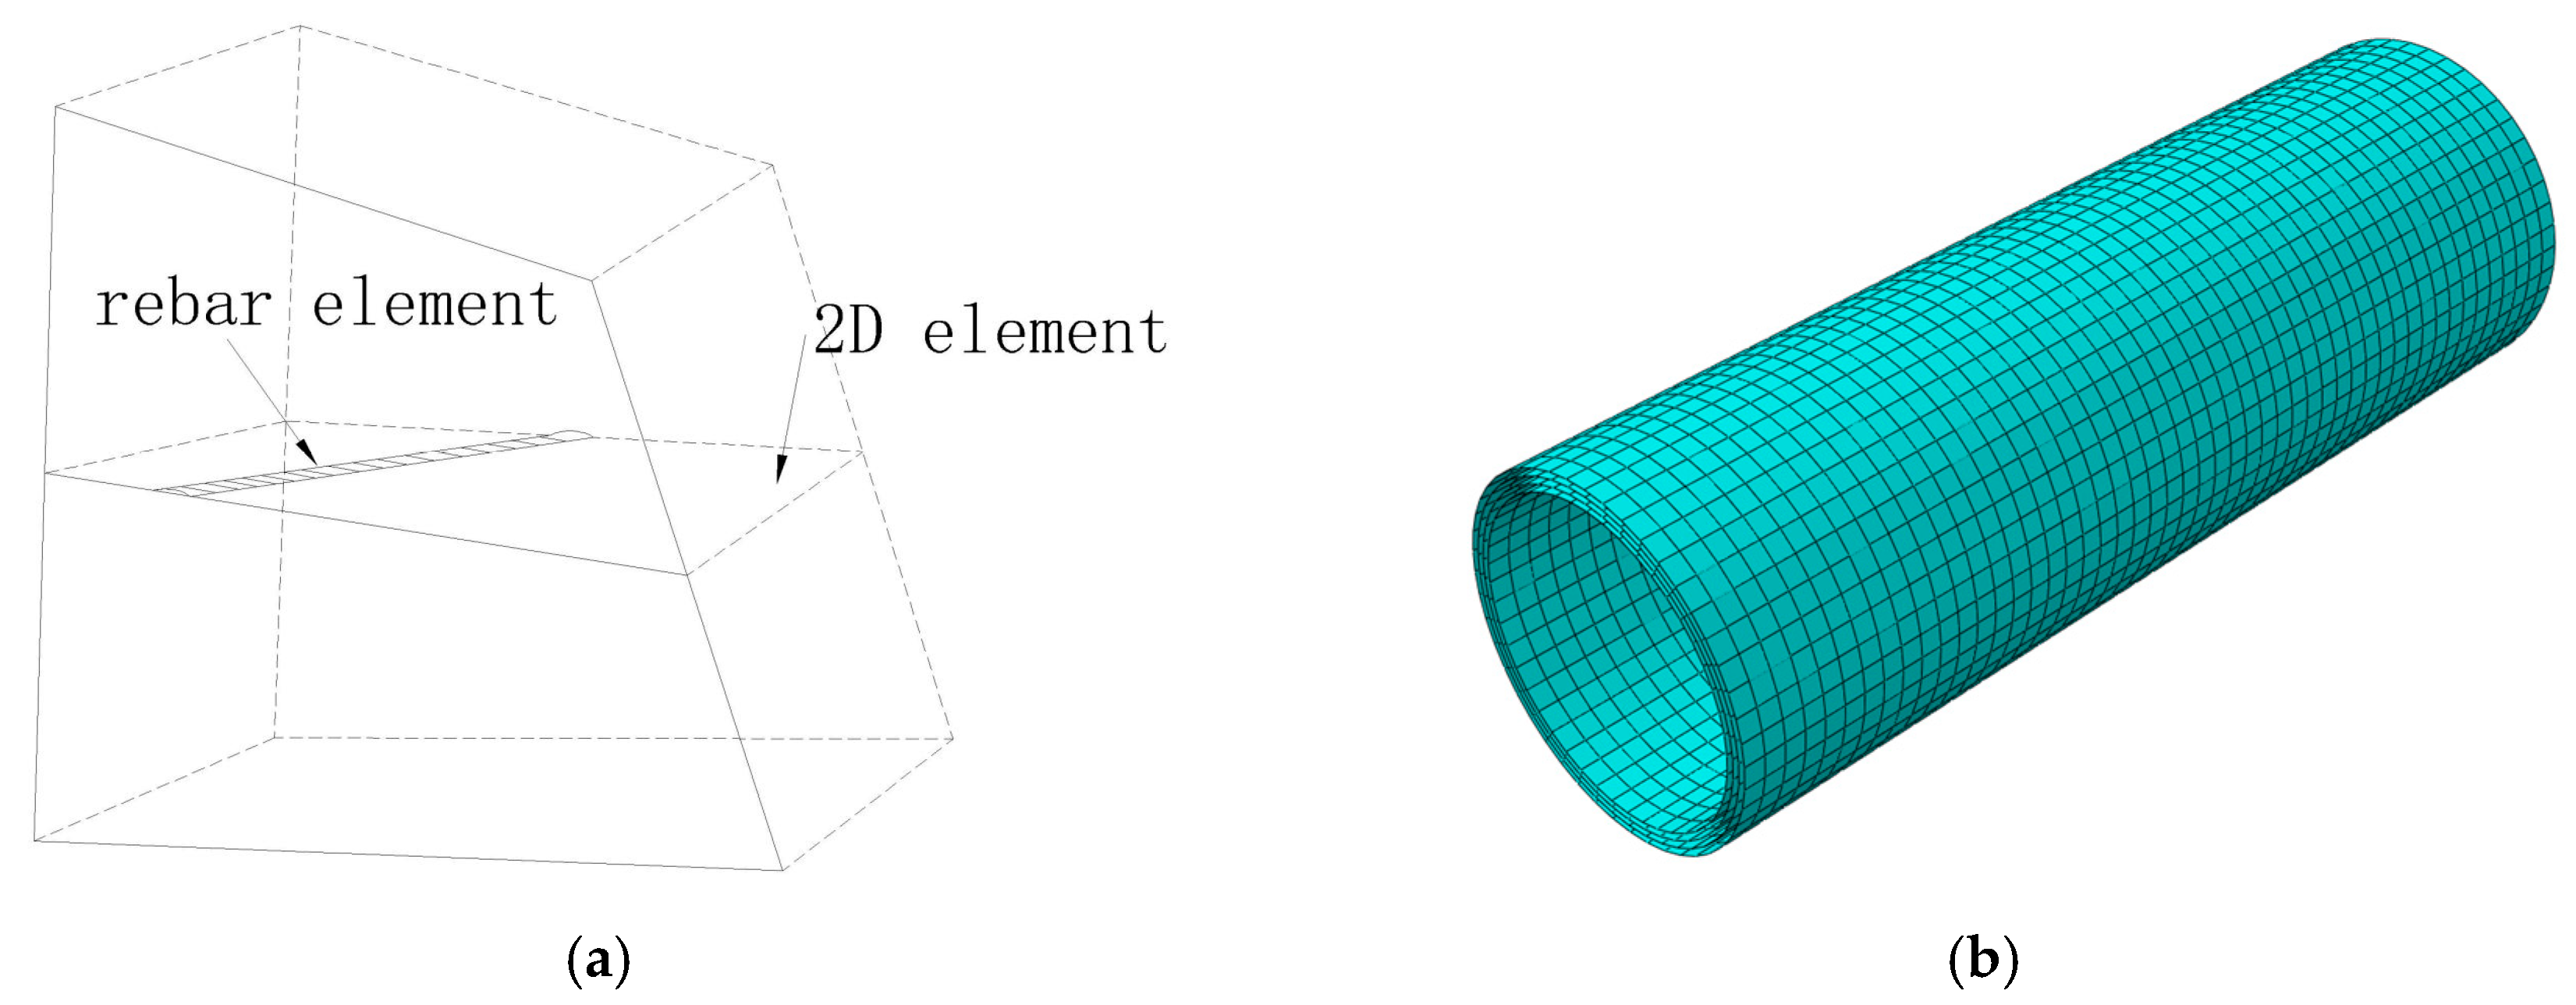
11]. Meanwhile, the rebar element concept [
12], which is in consistency with the RVE method, was widely applied to tire simulation, which shares a similar non-braided rubber-fabrics composite structure. Simulations with rebar elements, such as inflation and burst simulation [
13,
14], tire/terrain interacting simulation [
15] as well as simulation of tire rolling over a cleat [
16] have been published. The FE model presented by this paper adopted the rebar elements to deal with the non-braided fabric layers, not only because of the similarity of the structure between tire composites and hose pump hoses, but also for lower computing costs.
Validations towards the FE models of rubber-related products is always challenging, owing to the large strain under deformation, which makes measurements with strain gage incompatible. Measurements for profile and pressure was always adopted by studies on the tire simulations mentioned above. The illustrative comparison was an alternative, which was conducted by comparing the deformed configurations of the hose and the simulation model [
6]. As for the hose in hose pumps, simulation models of an industrial hose pump [
17,
18] were sort of preliminary and not verified by practical tests.
As can be summarized from the above literature review, rebar elements have been widely adopted in FEA. Nevertheless, the linearization was always used when modeling rubber composite material, leading to huge numerical error under large deformation conditions. Meanwhile, experiment is absent when verifying the correctness of FE models. Therefore, the main goal of this study lies in three aspects:
- (i)
Establishing the FE model of the hose considering the reinforcement composite layer and the constitutive law of rubber based on rebar elements and the Yeoh model, respectively;
- (ii)
Predicting the strength and deformation of the hose under various compressing conditions;
- (iii)
Proposing practical validation methods of the FE model, namely the counter-force test and deformed profile test.
3. Validation Method
Validation of the FE model is of great significance. On the one hand, validations can let the researchers or engineers determine the reliability of their models, thus inaccuracy models can be discarded. On the other, validations can help to understand to what degree the model can be applied, whether it can predict the reality quantitatively or qualitatively, or whether the model is conservative, or in other words, the model is on the safer side.
Due to the great strain of rubber-related products when undergoing a certain amount of stress, which is always beyond the measurement range of a common strain gage, practical tests for rubber related products are always difficult to design. The behaviors of rubber products in some great nonlinear processes such as the swagging process for automobile power steering hose [
5] cannot be evaluated directly due to the short period, small size and large strain characteristics. Additionally, it is regretful that early studies on hose pumps [
17,
18], although making enlightening contributions on basic designing principles and hose failure research, designed no practical tests for validation, making the designing of feasible tests an urgent problem.
There are some similarities in the non-braided fabric composite structure between a tire and a hose pump hose. Traditional tests of tires for model validation include counter force testing [
16] and measurements of profile deformation [
13]. Enlightened by these methods, this paper presented two practical tests: the counter force test and the ink print size test. These two tests can be applied for further studies or designs on non-braided fabric hoses; tips to improve the test accuracy are also given.
3.1. The Counter Force Test
Shown in
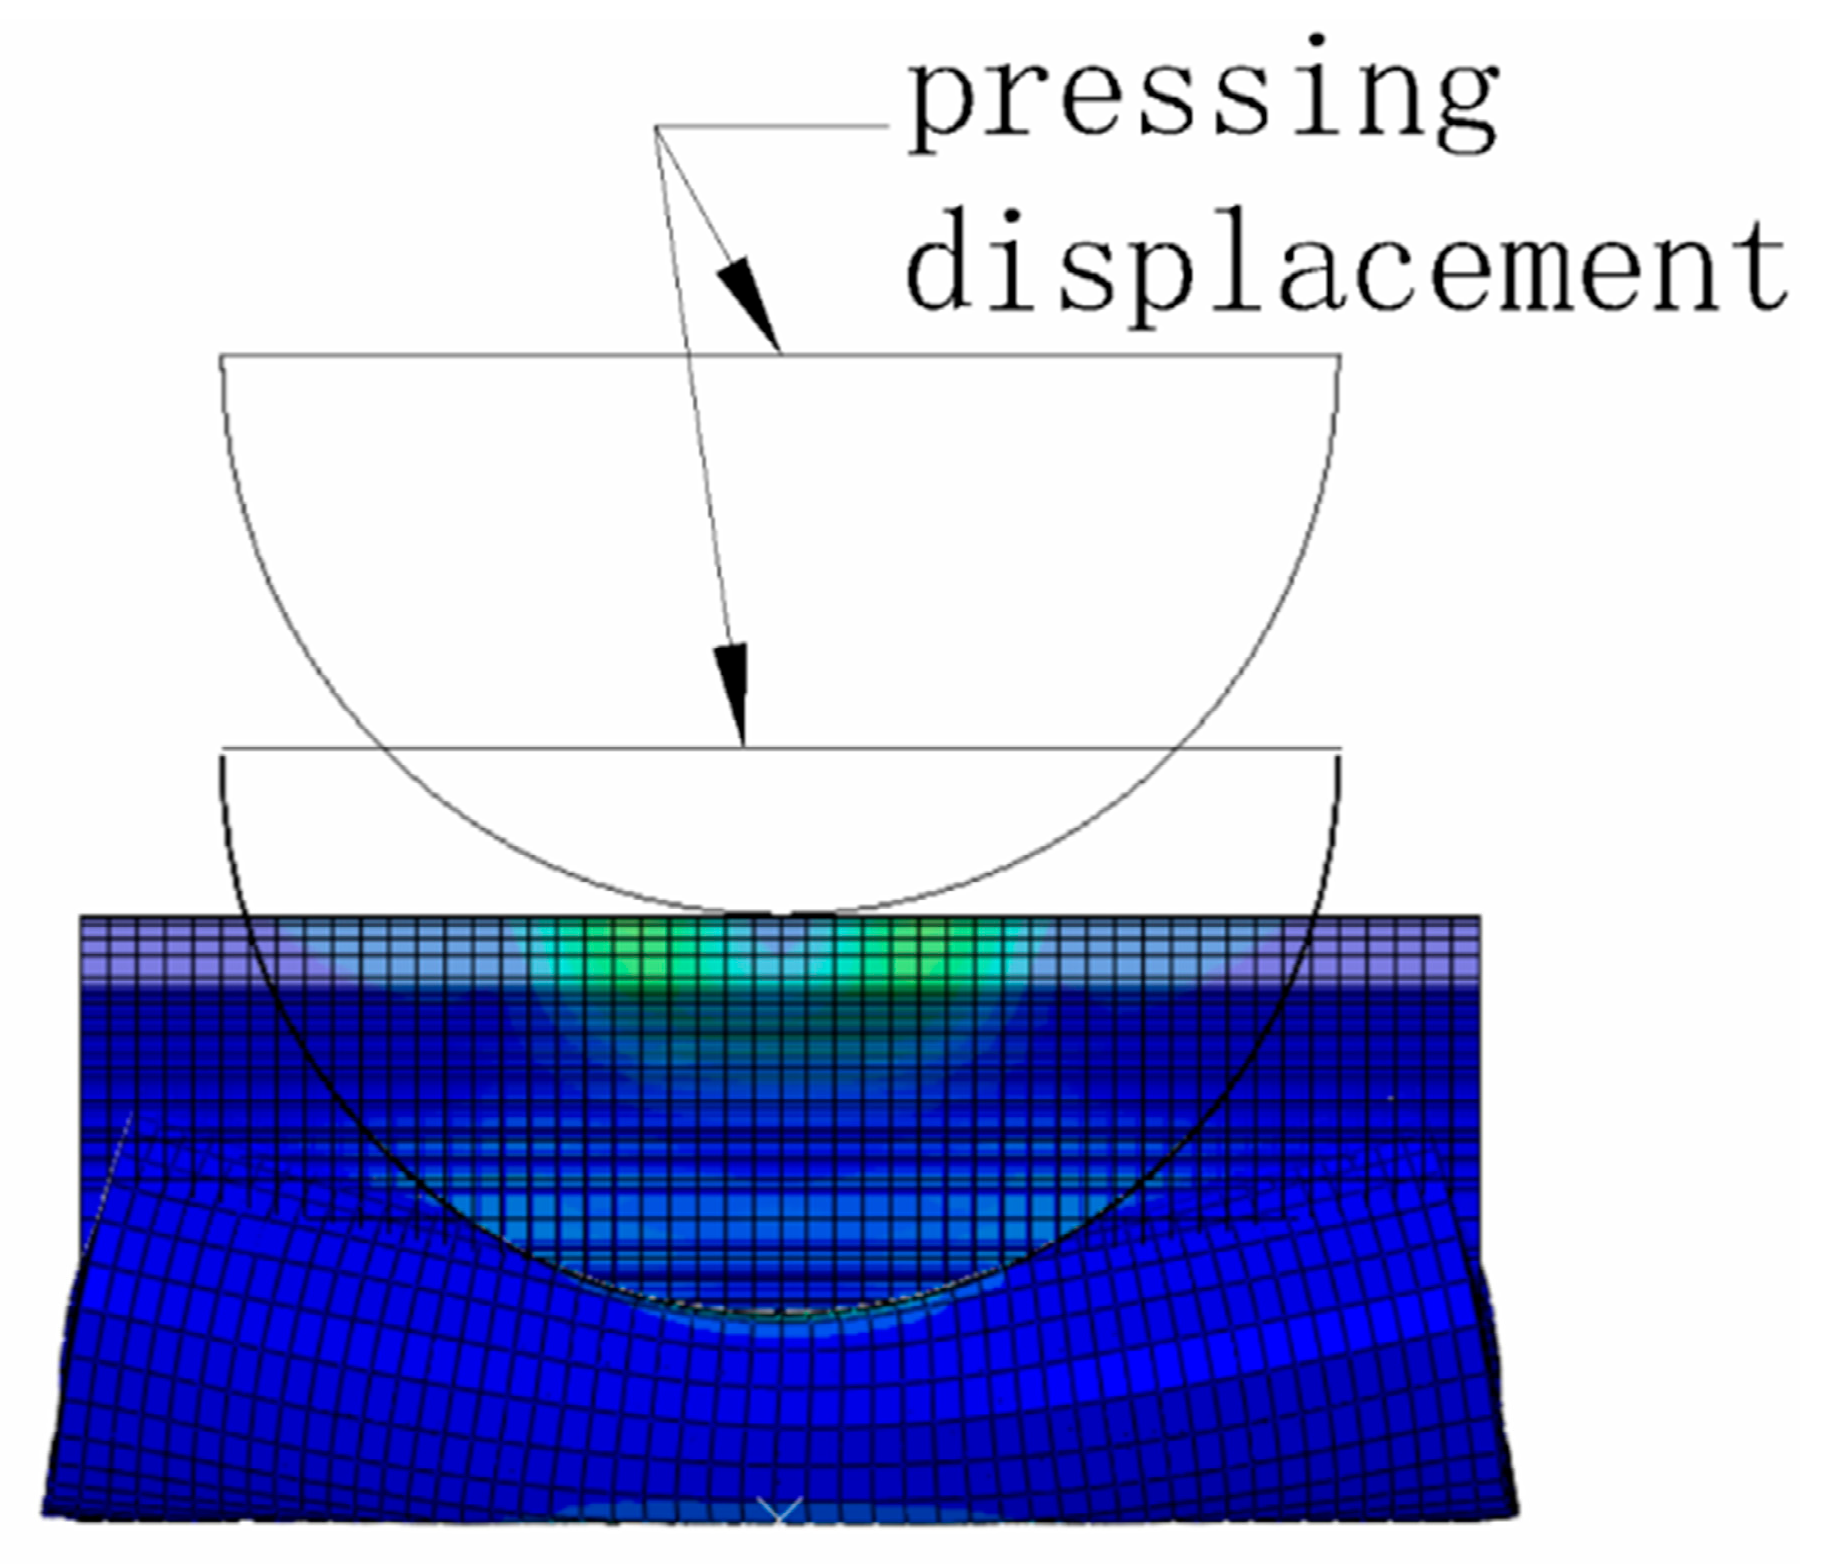
Figure 7 is the setup of the counter force test. A servo universal material test machine was used as the major test equipment. Two steel fixtures: one for imitating the pressing shoe and the other for the pressing plane, shown in
Figure 7, were manufactured and fixed on the servo tester. When the fixtures compress the hose, sensors can give the counter force of the pressing shoe and the total pressing displacement. The pressing shoe fixture was fixed on the mainframe of the servo tester, while the pressing plane fixture can move up and down to press the hose. The speed of the plane fixture was set to be 3000 mm/min, and the total displacement was 42 mm, corresponding to the simulation setup. Though the steel plane fixture cannot stop rightly at the moment when the displacement reaches 42 mm due to the large inertia, the sensors could react fast enough and stop data collecting, ensuring the accuracy of the test.
Made by hyper-elastic materials, the rubber hose would recover when the compression is removed. However, such a recovery would take minutes.
Figure 8 shows the strong inconsistency of the counter force-compression curves obtained in tests that performed in a series pattern, with the same part and same orientation of the hose being pressed in a short period of time. This is because, although the hose would rebound following the loosing fixtures, subtle deformations, which are hard to detect with the naked eye, still need some time to fade out. In order to deal with such a problem, the time span between two consecutive tests for the hose to “relax” should be long enough: set to be 2 min. In
Section 5, curves obtained after the “relaxing” method was adopted will be shown, which are more acceptable than the former ones.
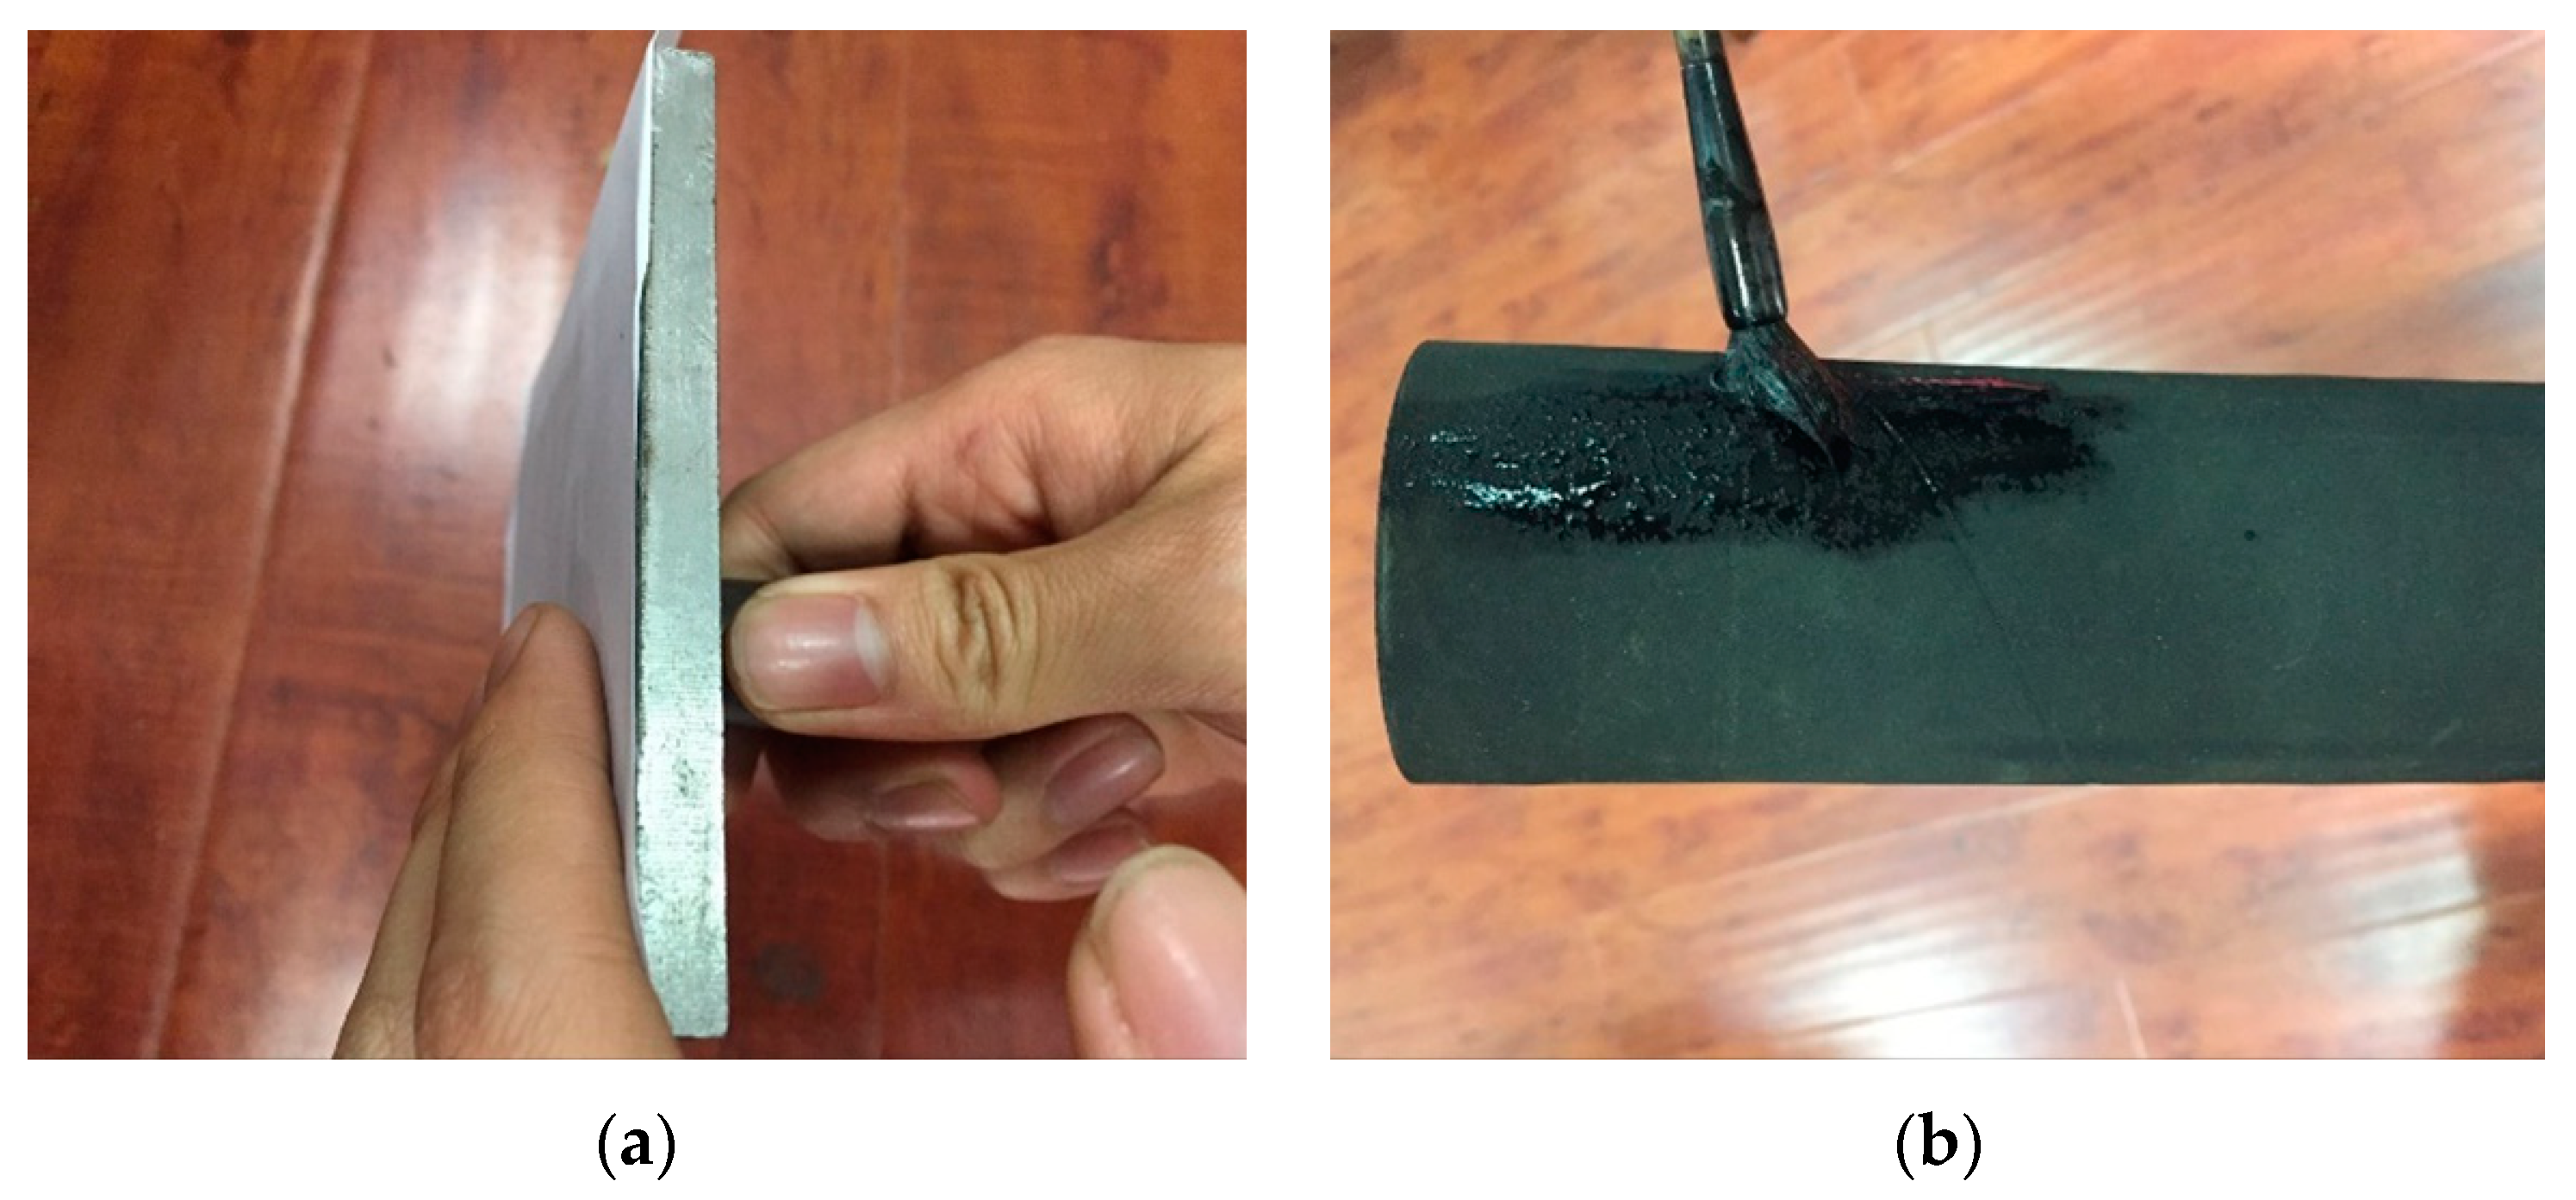
3.2. The Ink Print Test
Owing to the narrow space between the fixtures, measuring the width of the hose during compression would be inconvenient and less accurate. In order to obtain the deformation characteristics of the hose during compressing, an ink print test was designed.
Figure 9 shows the whole process of the test. Firstly, printing paper was pasted on the plane fixture. Secondly, some ink was distributed evenly on the hose. Then, the hose was placed between the two fixtures and pressed. The compression displacement varied from 10 mm, 15 mm, 20 mm, 25 mm, to 30 mm. Finally, in order to avoid subjectivity, the printing paper was torn off and folded up to create a line in the middle of the print, and the length of the line was measured and compared with the simulation results. For every compression, five tests were carried out. The maximum and the minimum value were eliminated to ensure accuracy.
Due to the great inertia of the servo tester mentioned in
Section 3.1, the plane fixture was driven manually at a very low speed so that the plane fixture would stop at the right place with a high accuracy. Furthermore, “relaxing time” for the hose was still 2 min.
4. Numerical Investigations
Determining an appropriate compressing displacement of the pressing shoe is of great significance, since one millimeter more compression after the full closure of the hose would lead to an increase of thousands of Newton of counter force [
3]. However, owing to the complexity of the service conditions where the rotating speed of the rotor, the characteristics of the fluids conveyed by the hose and other conditions can be various, and to the immaturity of the fatigue life predicting theories on rubber materials, numerical optimization of the compression intended for a better performance of the hose, such as a longer fatigue life, can be questionable, fragile and non-universal. In this paper, the numerical investigations were carried out to obtain a series of quantitative dependencies of the hose performance to the compressing displacement. Such dependencies can be referred to by engineers. In addition, the numerical investigations method can be adopted to develop new hose pumps.
Four models with 0 bar, 5 bar, 10 bar and 15 bar pressure applied in the inner surface of the hose models were built up, using the method and the model complexity determined in the former part of the paper. During compressing, the size of the in-contact area, the maximum strain and stress and the counter force beard by the shaft throughout the compressing process can be obtained through the software. Finally, three sets of curves fitted by the data obtained in the numerical investigations were given.
What is more, owing to the subtle variation in the hose thickness during compressing, the compressing displacement under which the hose would be sealed off (the seal-off displacement) did not equal to the inner diameter. However, traditionally, the inner diameter was used as a rough reference for the seal-off displacement. Thus, numerical investigations on the seal-off displacement can be of a great significance to the designer. Through the minimum contact pressure along the inner circumference of the hose middle cross section, the predicted seal off displacements under different inner pressure are obtained. As shown in
Figure 10, the contact pressure on the nodes is collected, and when the minimum contact pressure is bigger than 0, the hose is considered as “sealed off” and the displacement at that moment is the “reference seal off displacement”.
With the “reference seal off displacement” and the hose performance during compressing, designers can easily determine an appropriate pressing displacement.
5. Implementation and Results
In this section, the results of the simulations were studied and verified. The results were introduced in two stages: the compressing simulation and the numerical investigations. In the first stage, models of different mesh sizes were discussed in terms of model accuracy and computing time and an appropriate mesh size was determined. In the second stage, numerical investigations were carried out and the results were analyzed.
5.1. Stage 1: Compressing Simulation
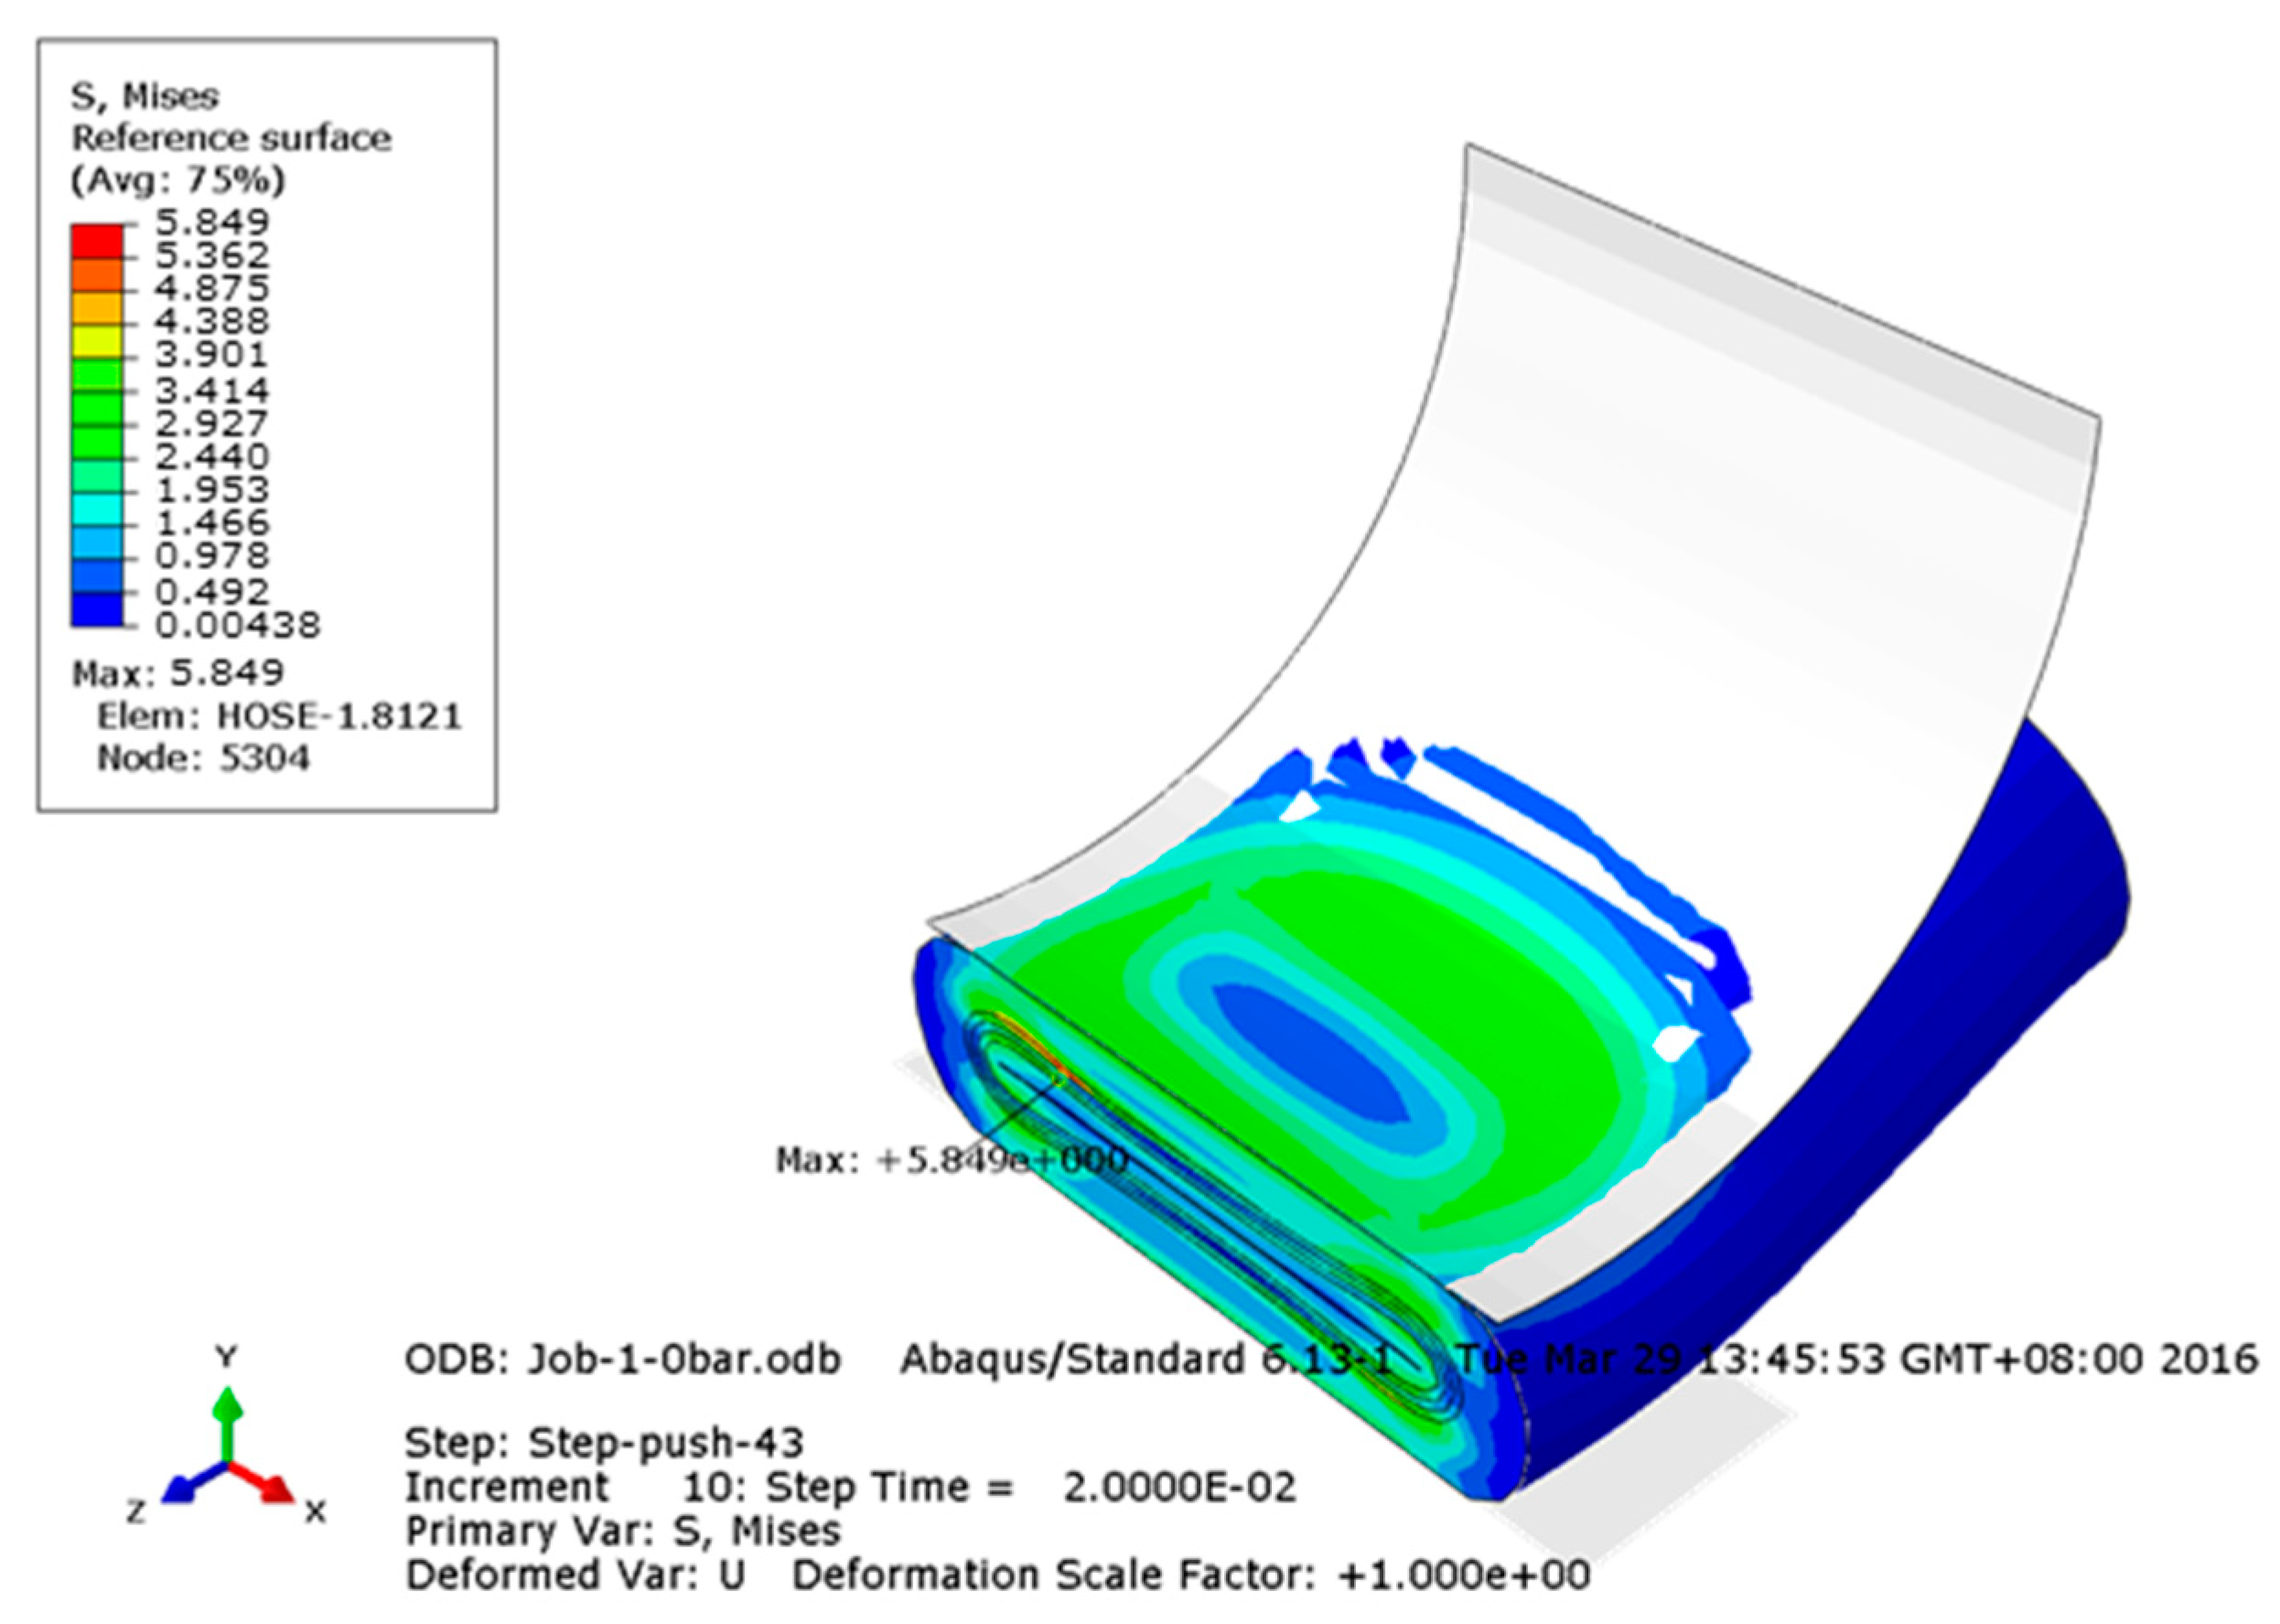
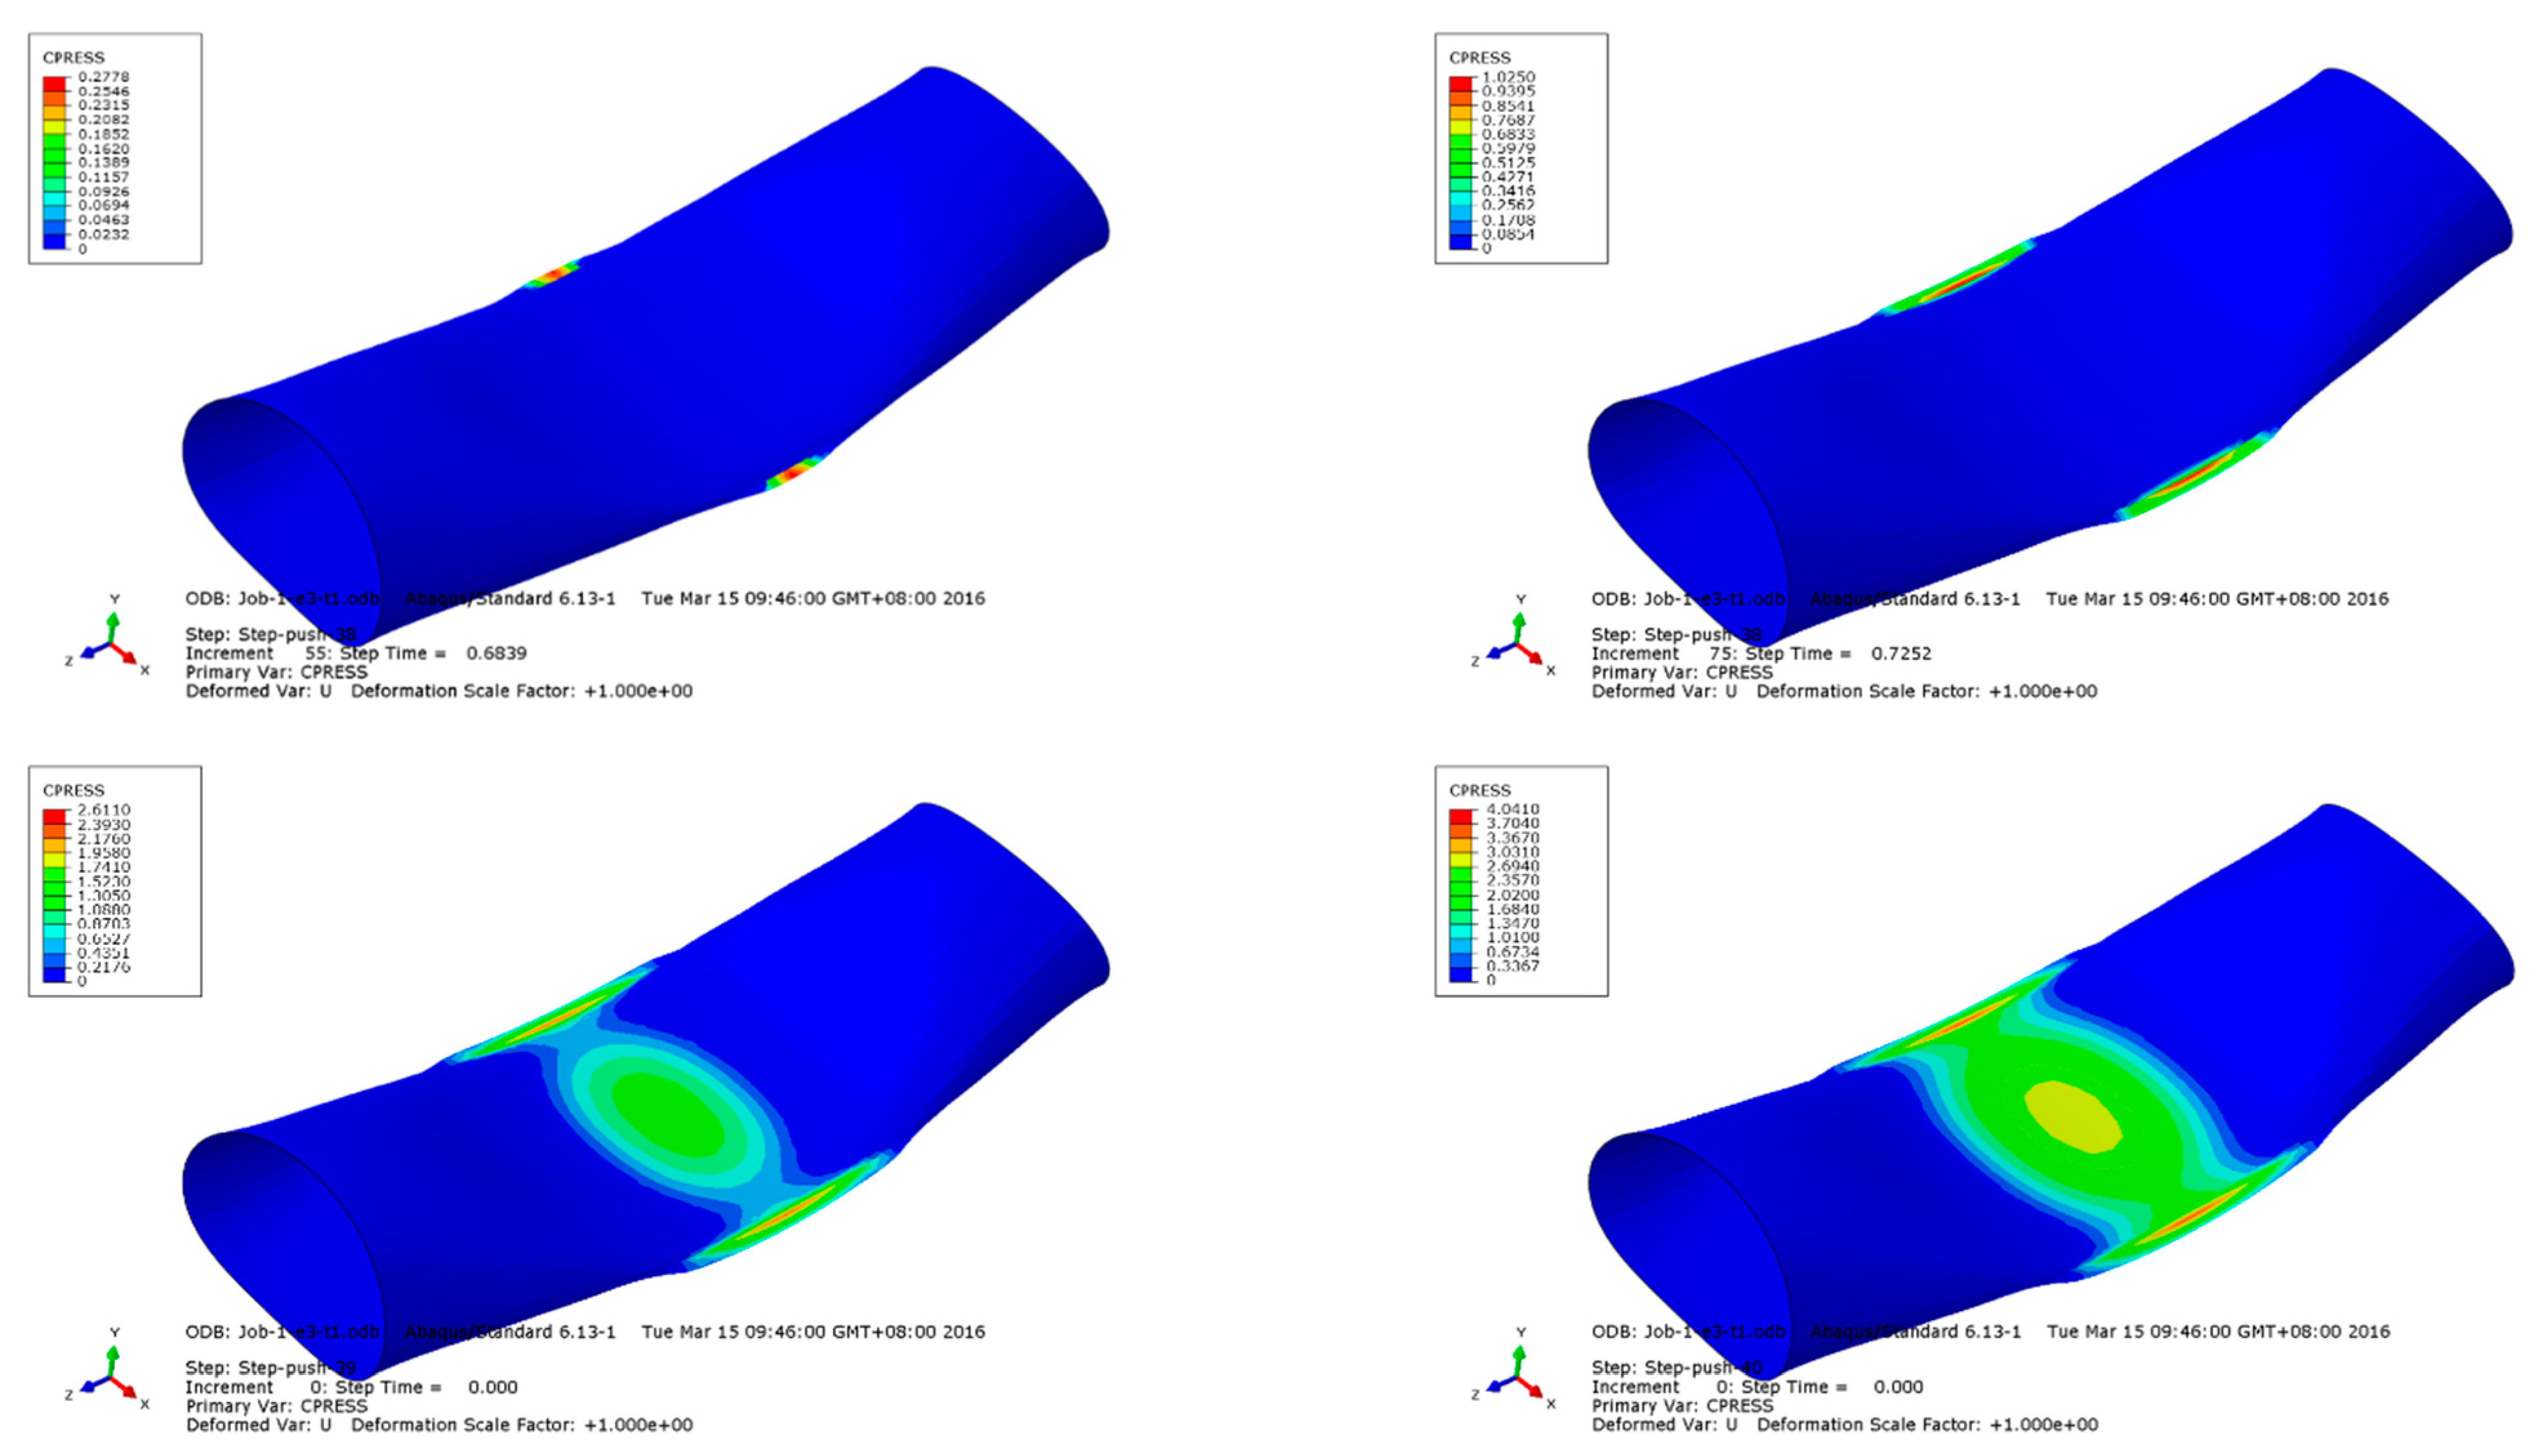
The FE model, as introduced in
Section 2, were brought to Abaqus/standard and computed. Shown in
Figure 11 is the von Mises stress distribution in the hose. The maximum stress can be found at the composite layers, indicating the importance of the appropriate designing of the fabric layers.
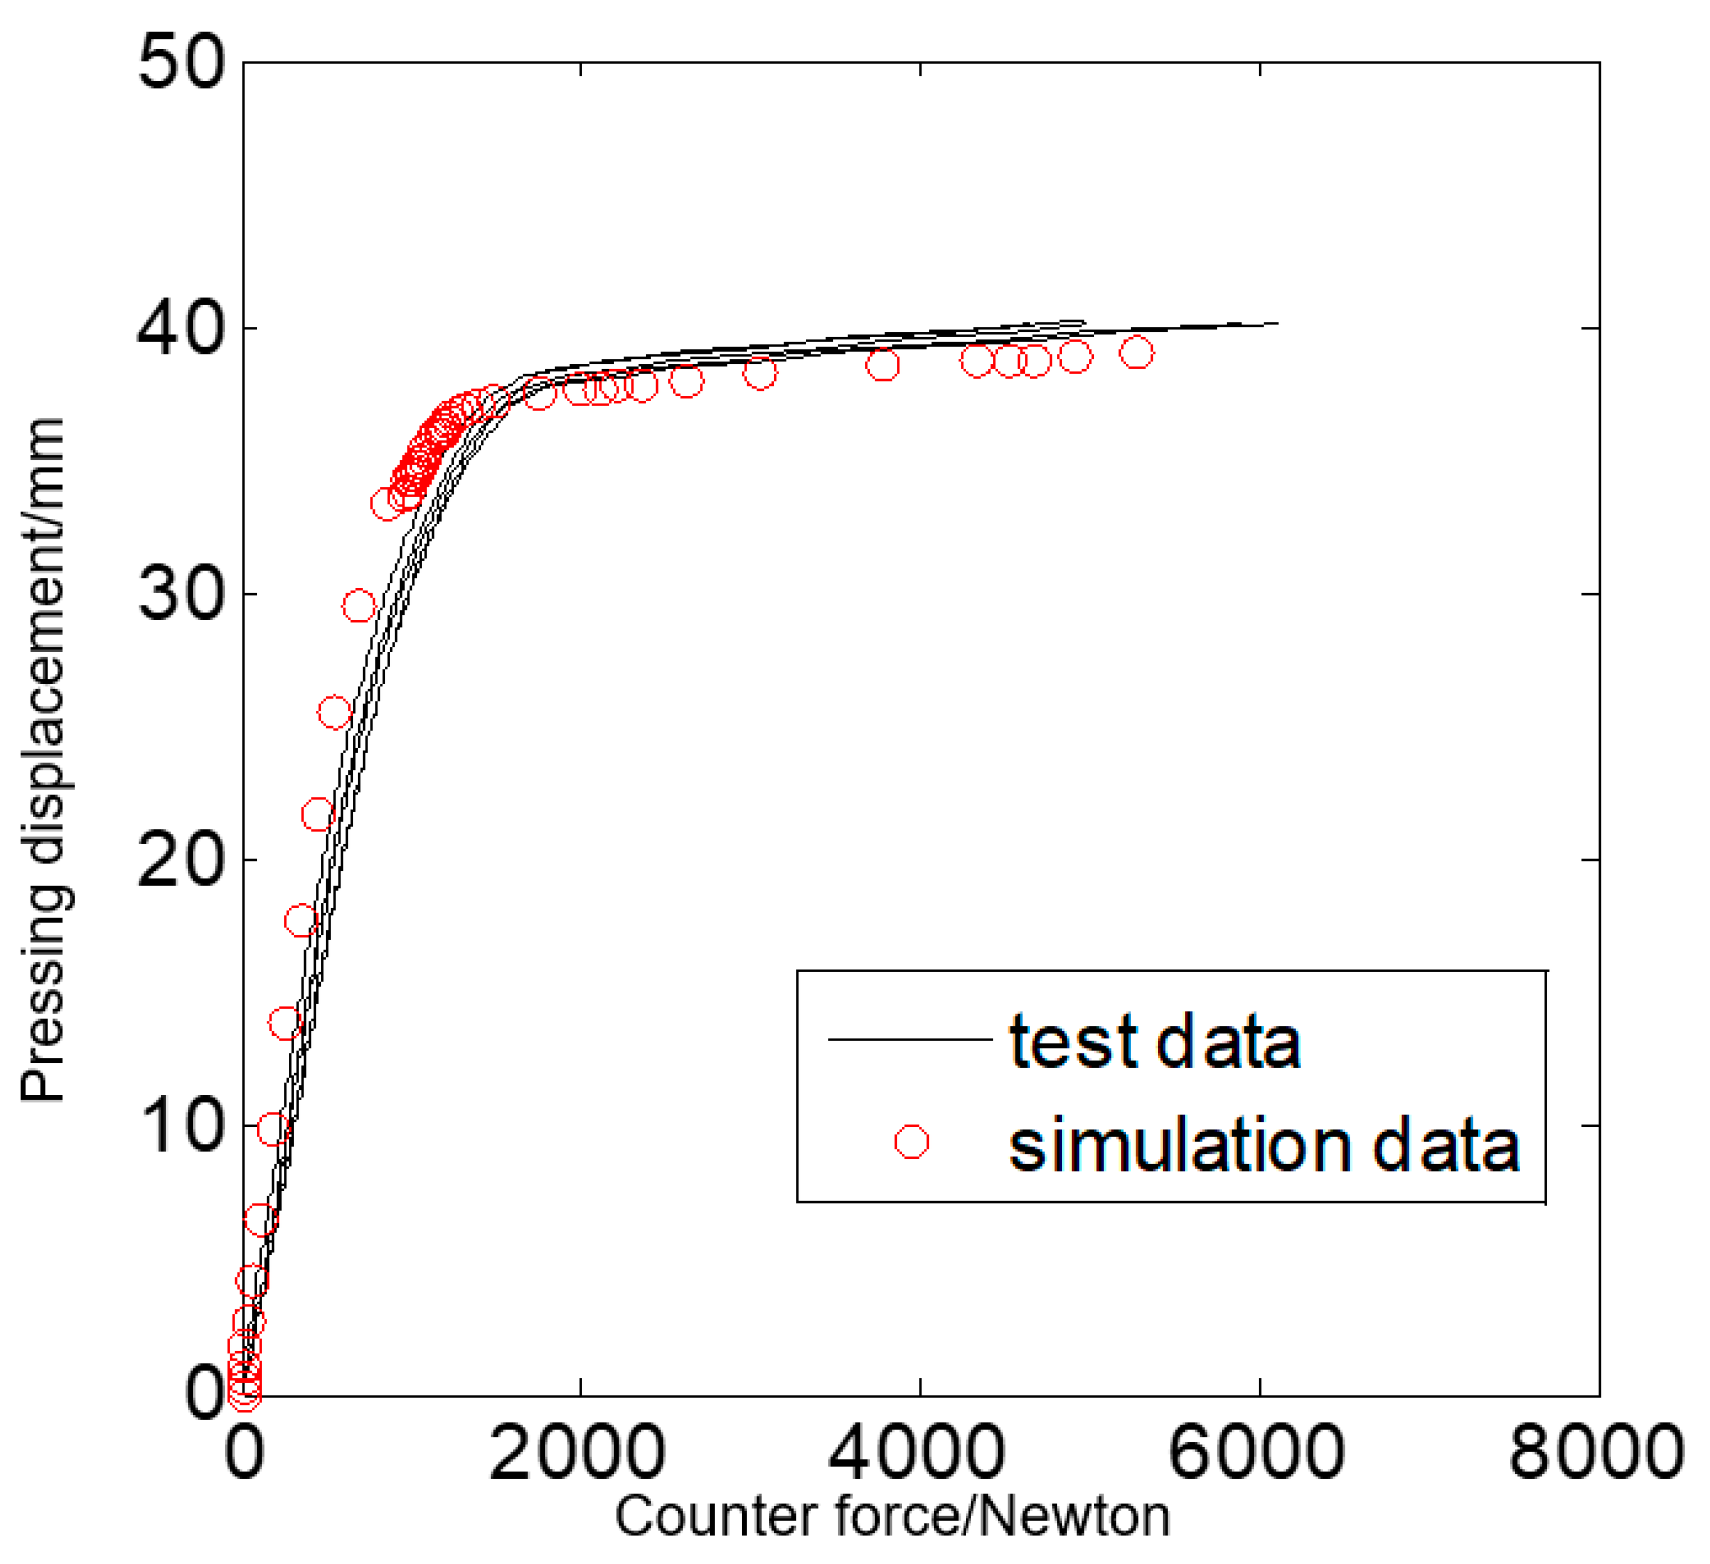
The counter force tests were carried out as described in
Section 3.1.
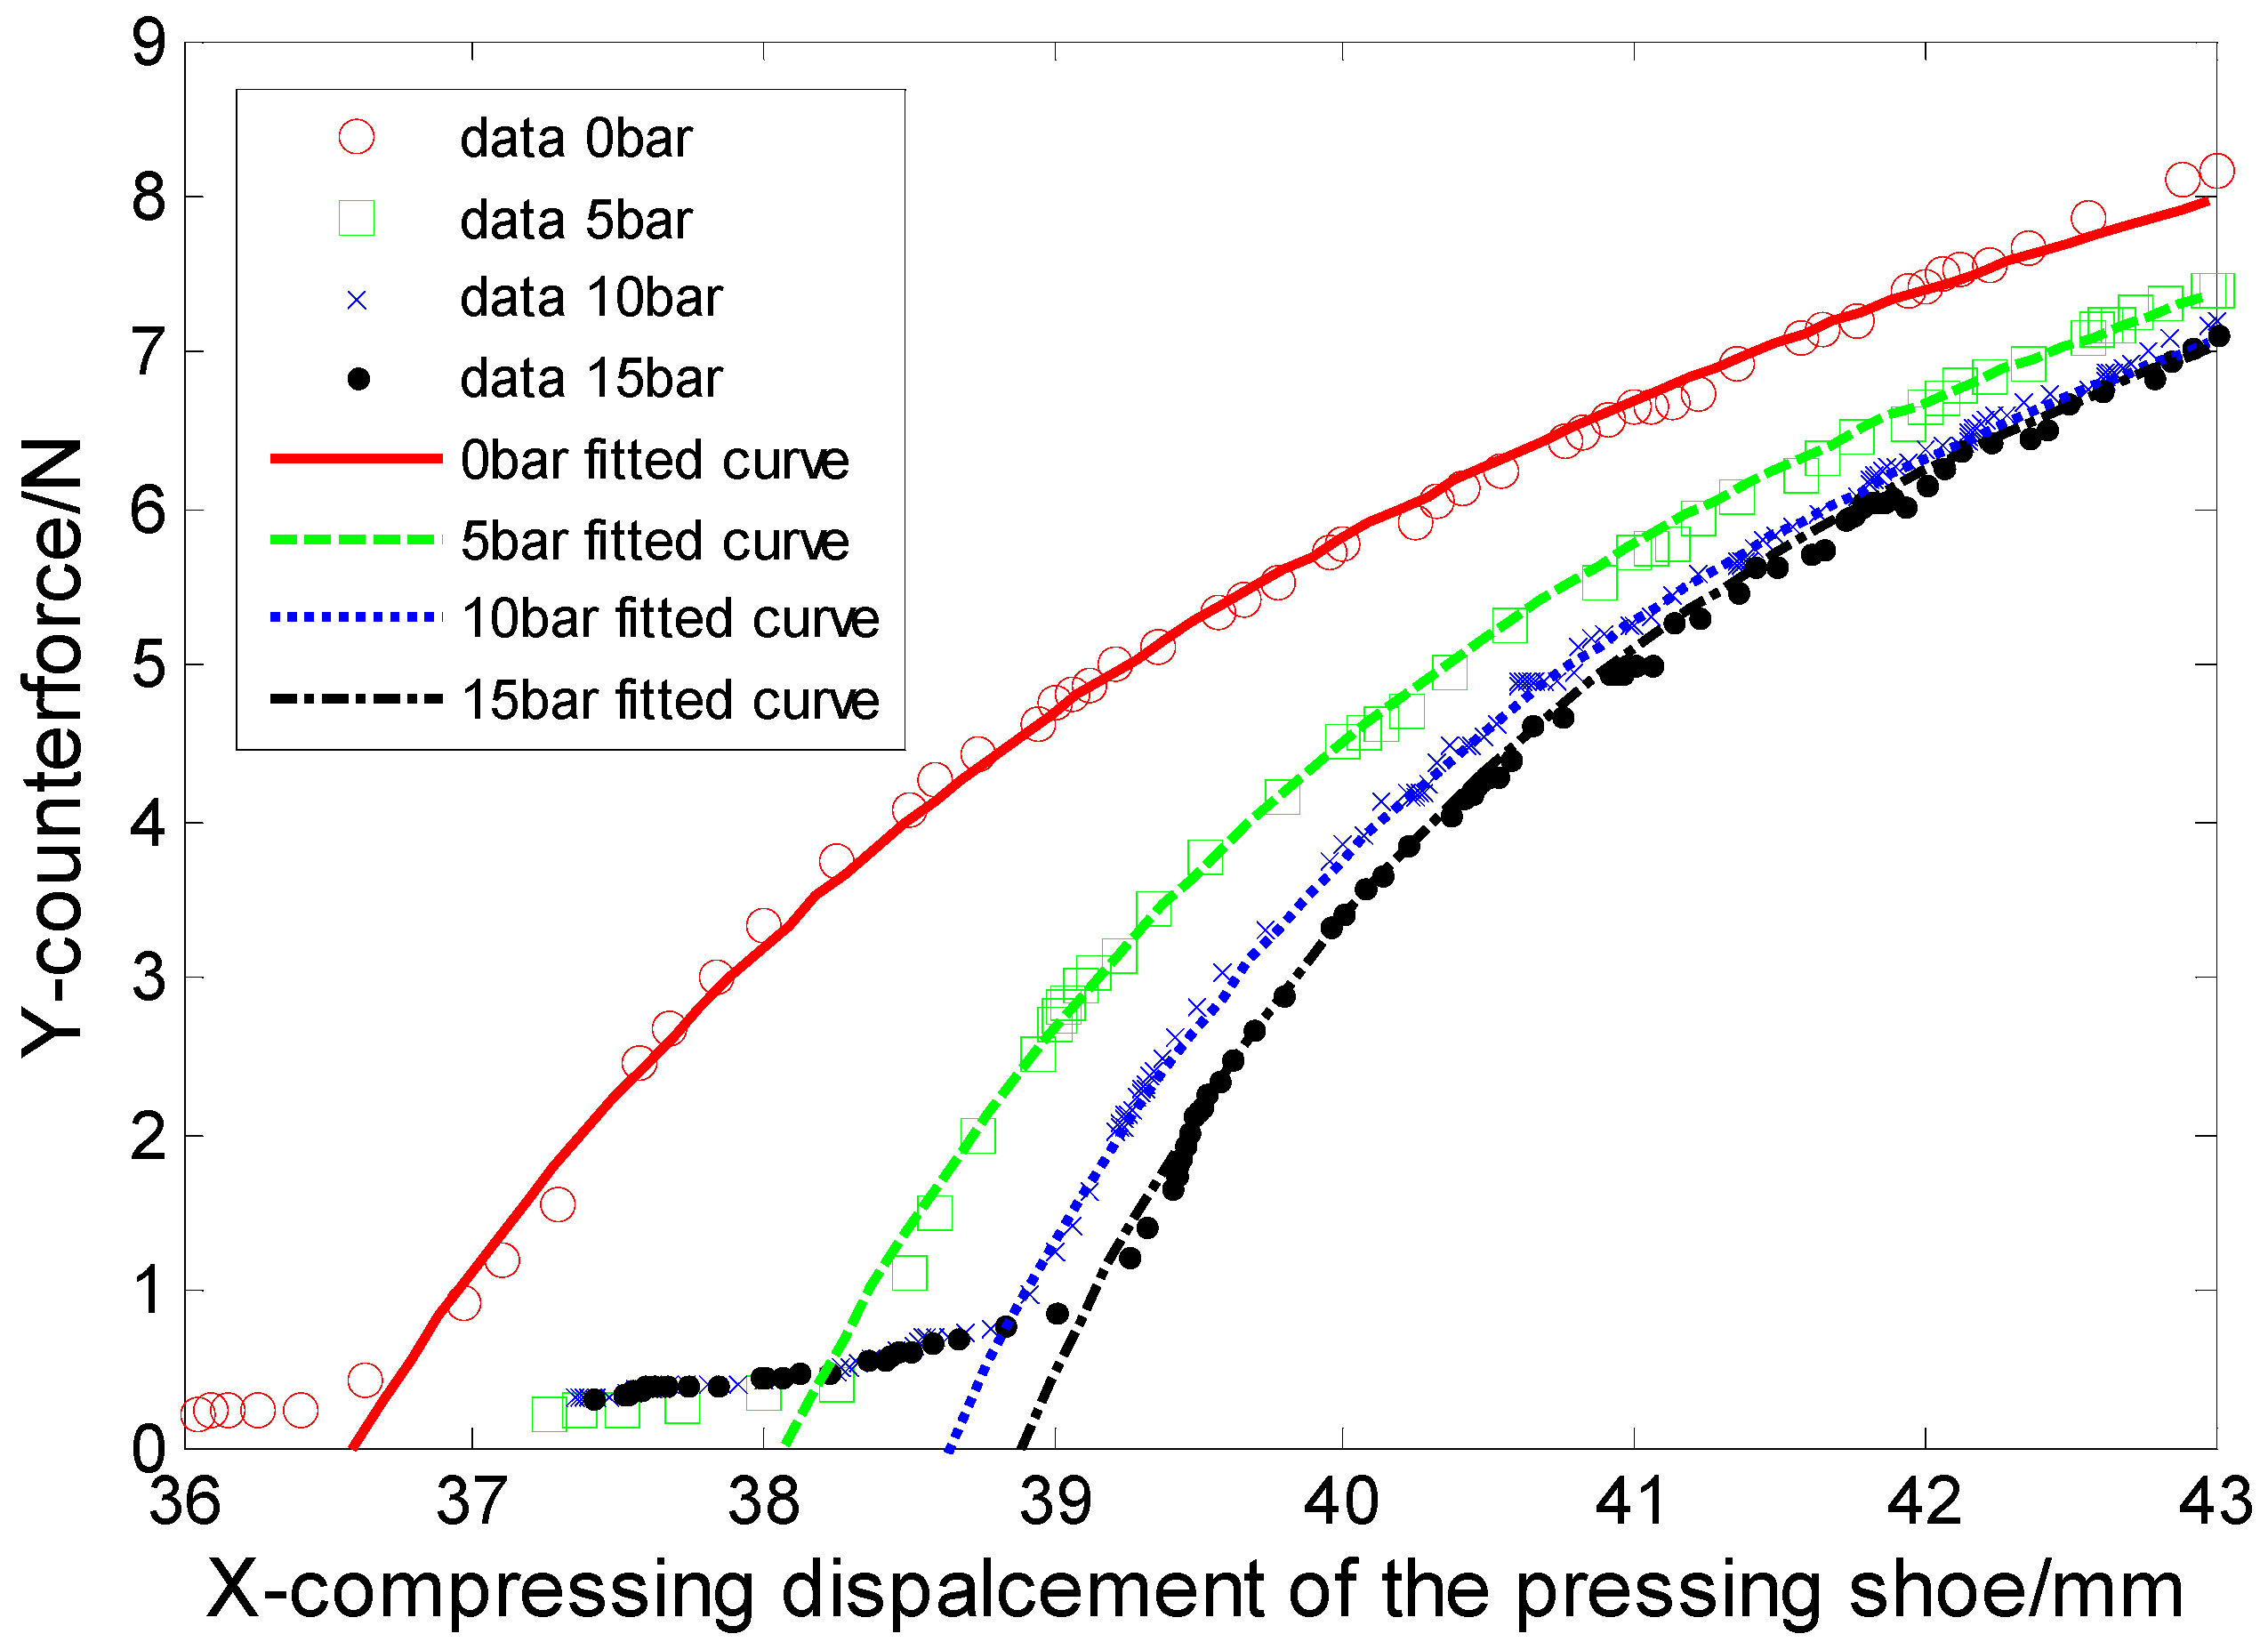
Figure 12 shows the comparison of the practical tests results and the simulation results, in which X and Y represent the counter force in Newton and the displacement of the pressing shoe in millimeter. When the compression is less than 38 mm, which is the inner diameter of the hose, the counter force increases slowly in a linear pattern with the compression. As the compression increases from 38 mm to 40 mm, the increase in the counter force speeds up. After the turning point, the counter force increases much more rapidly: every one-millimeter increase in compression can lead to an increase in thousands of Newton in counter force. Obviously the turning of the counter force-compression curve can be explained by the gradual closing of the hose and the increasing inner contact area, which also indicates the importance of balancing the compression and the insurance of no back flow, since excessive compression would lead to extremely high counter force which would obviously overwhelm bearings and shafts, and lead to a sharp drop in the hose fatigue life.
The simulation results are of good uniformity with the tests results, which indicates the accuracy and feasibility of the models in terms of investigating the counter force of the pressing shoe. However, a certain amount of deviation can be found on the picture. Before the turning around 39 mm of the compression, the simulation data were slightly above the test data, which equals to a smaller counter force predicted. However, predicting the counter force when the hose reaches fully closure would be more meaningful for the engineers. The simulation data turns “earlier” than the tests results so that the simulation data are “lower” on the picture after turning, which means the counter force attained by simulation would be bigger and the results of the FE model is on the safer side.
The deviation between the simulation model and test results can be explained by the inadequate stiffness of the model: smaller stiffness leads to early turning of the compression and counter force curve. The reason for the inadequate stiffness can be many. First of all, as the reinforcements in the hose, the non-braided fabric composites play an important role from the view of hose stiffness. The homogenization of the composites with rebar elements and membrane elements may lead to a smaller stiffness. On the other side, the main problem may stem from the solid elements. The C3D8RH element (linear three dimensional 8 nodes reduced integral hybrid element) was applied to mesh the rubber hose due to its excellent ability to avoid shear locking and good performance in computing time. However, its stiffness tends to be inadequate when dealing with the pure bending load [
12].
Except for the counter force test, ink print tests described in
Section 3.2 were also implemented. Shown in
Table 2 are the results of the ink print tests, with the maximum and minimum value eliminated. A typical ink print is shown in
Figure 13b. In the simulation results, where the clearance of two surfaces is smaller than 0.1 mm is set to be “in contact”, similar “contact prints” were obtained (shown in
Figure 13a) and the middle widths were measured in the software. From the image, one can see that the simulation print is quite similar to the ink print, with wider ends and a slimmer waist. Shown in
Figure 14 is the comparison of the average value from the test results and the simulation values: the maximum deviation is smaller than 7%, which is acceptable for engineering applications.
5.2. Stage 2: Numerical Investigations
Figure 15 shows the dependency of area in contact with the hose surface to the compressing displacement of the pressing shoe. Data points obtained from the four different pressure conditions show a similar tendency that the contact areas rise with the compressing displacement, and it seems like the other three sets of points obtained from under-pressure conditions are shifted from the original non-pressure one, from left to right, with an increase in the pressure. This phenomenon can be explained by the decrease in the hose thickness, owing to the growing inner pressure, which leads to a smaller contact area under the same compression. One can notice that the area in contact grows very slowly before it exceeds a certain value around 1 cm
2. That is because two small contacting areas would first grow slowly at the marginal areas of the squashed inner hose surface, then with the middle of the inner surface become self-contact, the area in contact would grow much faster, as shown in
Figure 16. Four curves were fitted to the data points, and those whose contact was smaller than 1 cm
2 were eliminated. The mathematical forms and the goodness of the forms obtained are listed in
Table 3.
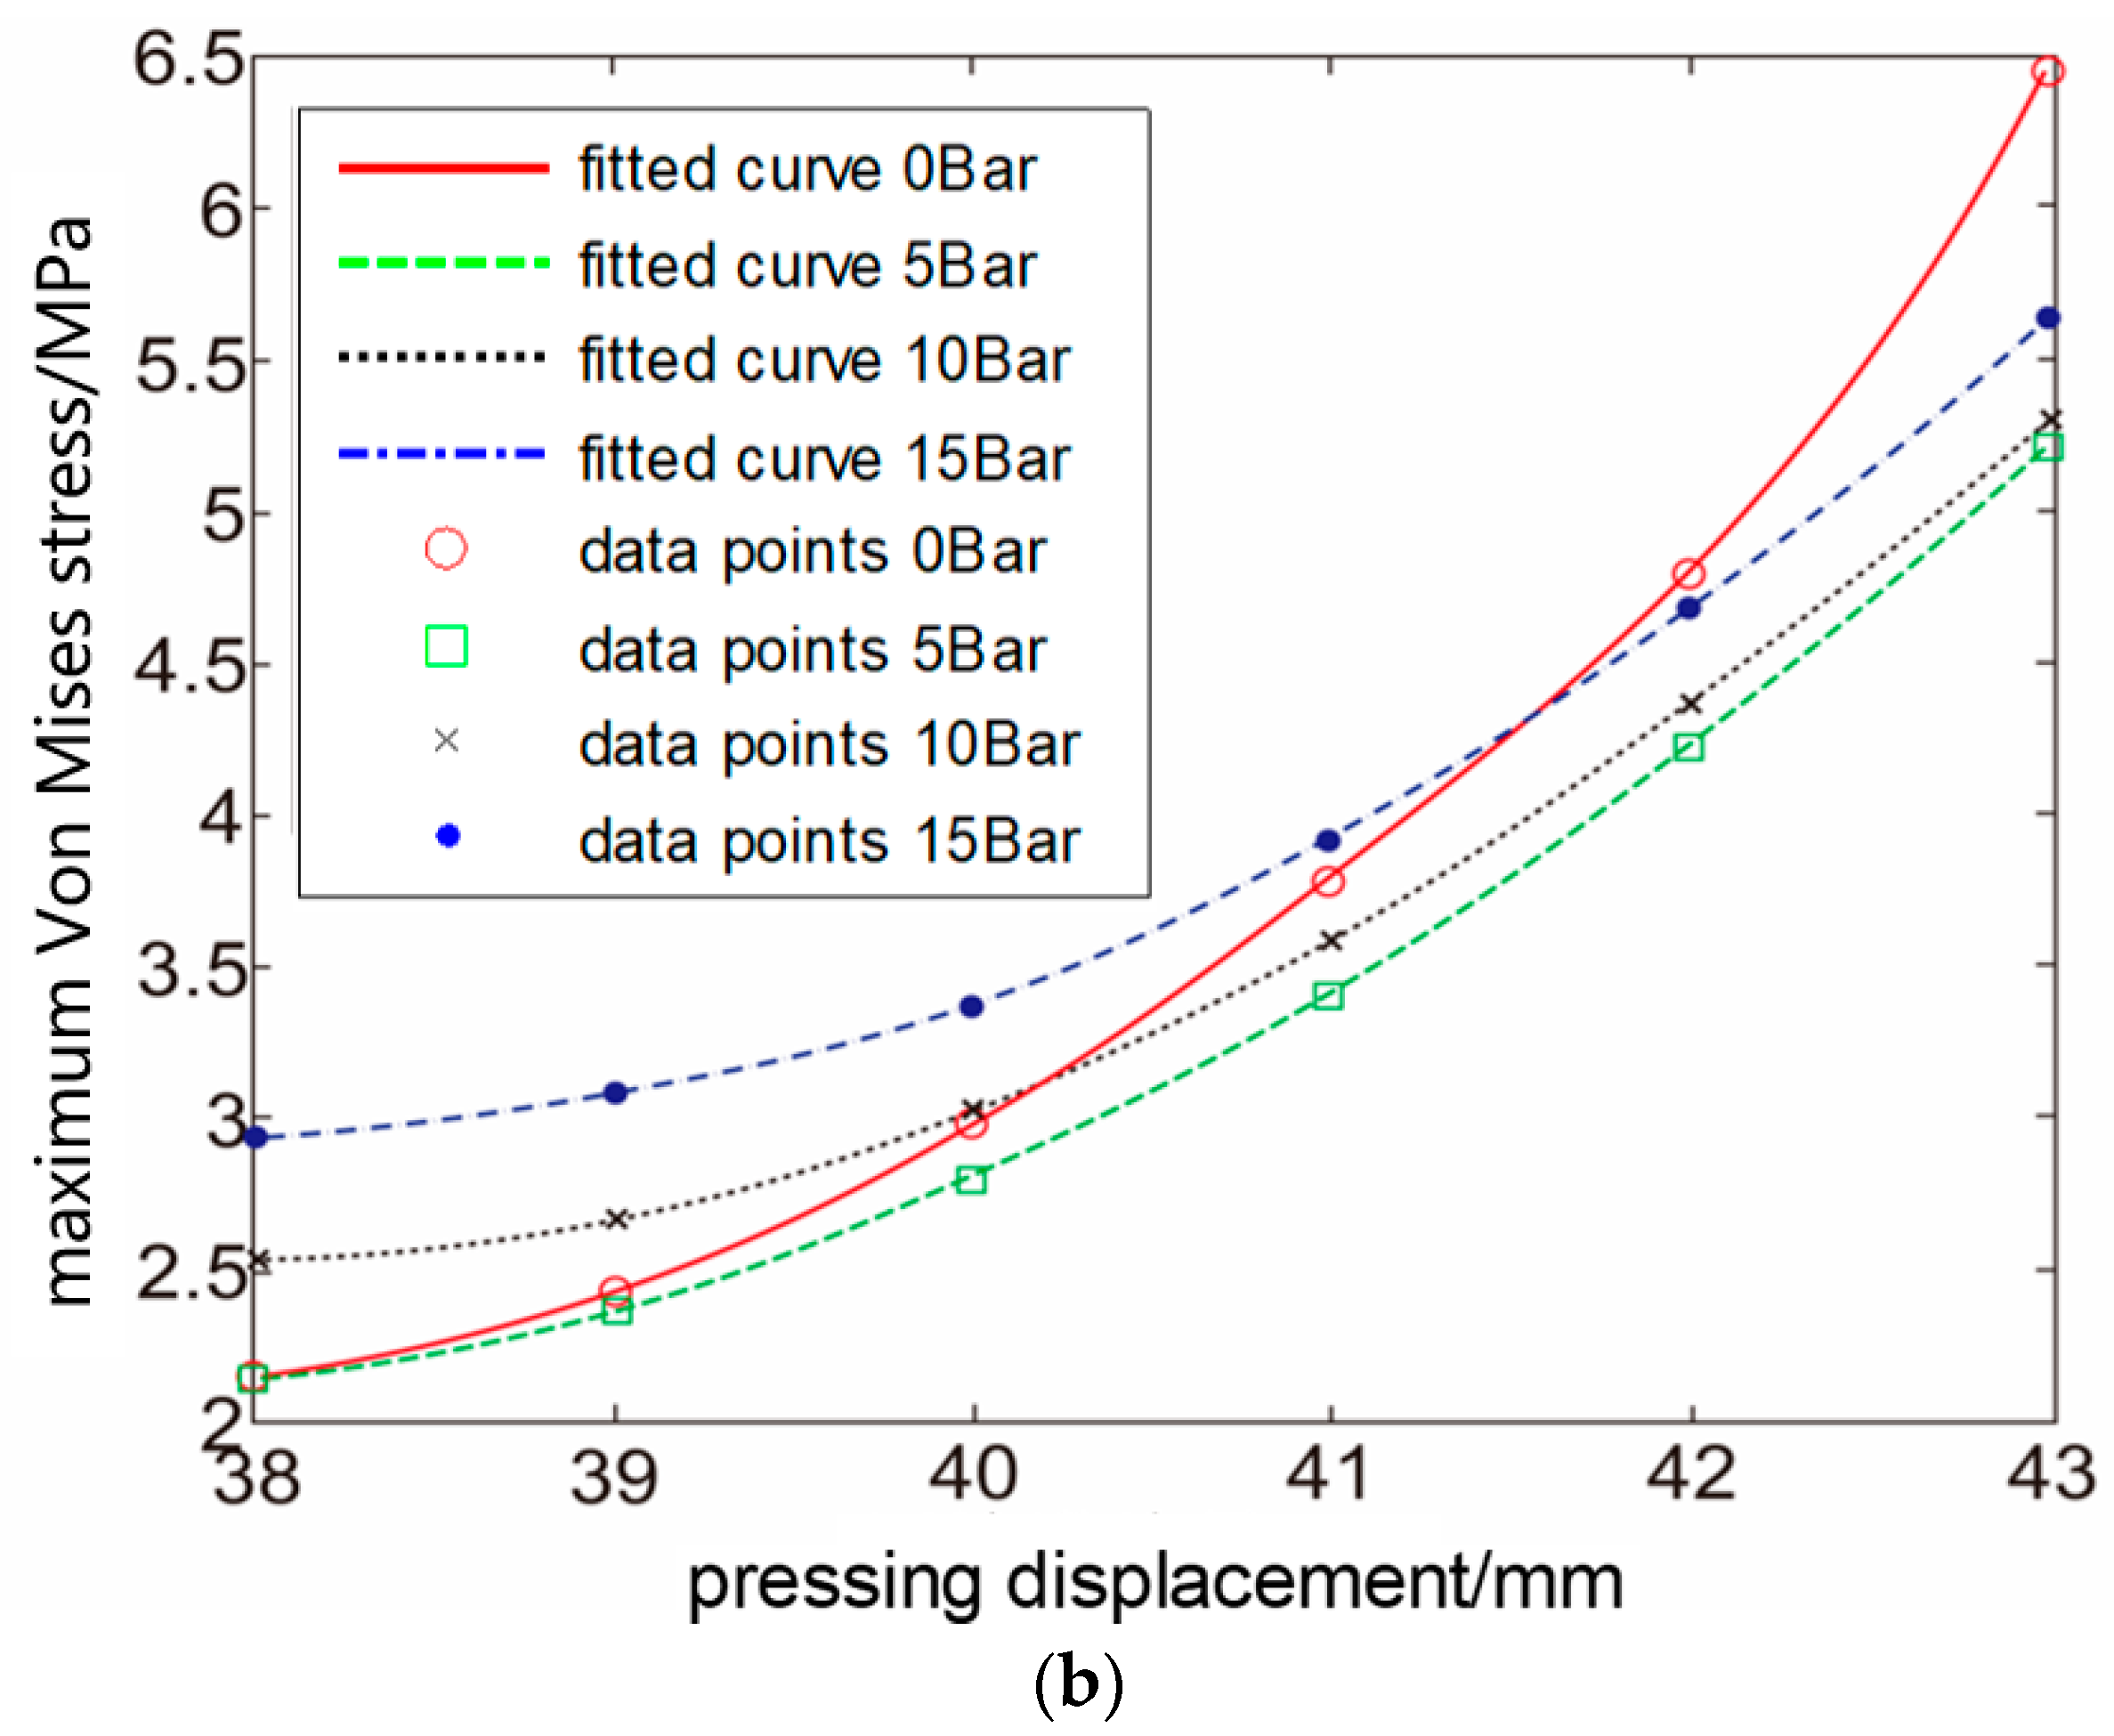
Shown in
Figure 17a,b are the maximum Von Mises stress and the maximum Max principal strain in the model, smoothed with cubic spline curves in MATLAB. Clearly it can be found that the maximum stress and strain rise with the compressing displacement, and curves obtained under 5 bar, 10 bar and 15 bar can be considered as “shifted up” from one another with the rising pressure. However, when it is a non-pressure condition, the maximum stress or strain would rise much more notably. As obviously depicted, the 0-bar curve cut across the other curves. The reason for this phenomenon might be that when the hose is not squeezed by the inner pressure, it would become fully closed at a relatively smaller compressing displacement, which means, when undergoing the same compression, the hose would be compressed more by itself compared with other working conditions with inner pressure.
Figure 18 shows the dependency of the counter force on the pressing displacement when the displacement is bigger than 39 mm. The data points were fitted into curves, whose mathematical forms and goodness of fitting are shown in
Table 4. These curves show similar trends with the maximum stress and strain curves with similar reasons to those mentioned above. So, no load operational condition would be tougher for the hose than high pressure condition if the pressing displacement remained unchanged. Thus, avoiding no load operation is essential for the hose and the bearings according to the maximum stress and strain curve and the counter force curve.
Table 5 shows the predicted seal off displacements together with the counter force, contact area and the maximum strain and stress deduced from the obtained curves.
When designing a hose pump, the pressing displacement should be a little bigger than the predicted seal off displacement in order to avoid back flow, then the size of the contact area in the hose, the maximum stress and strain, and the counter force can be deduced through the three sets of curves, given a certain fluid to be conveyed and working pressure. The counter force is necessary for the design of the shaft and bearing system. With ε-N curves and S-N curves, the fatigue life of the hose can be roughly predicted. Furthermore, a certain amount of area in contact is significant for avoiding back flow.
Owning to the sophisticated multi-field coupling characteristics of the pumping process of a hose pump, building up a versatile FE model which can predict every behavior of the pump might be impossible and overwhelming. However, traditional methods based on a series of practical tests can be quite expensive from the view of time and costs. Moreover, for essential parameters such as contact area, stress and strain cannot be obtained directly by tests, making the current design method speculative. Thus, with the FE model and the modeling method mentioned in this paper, engineers can minimize the number of practical tests. Moreover, more complicated simulation and optimum designing under a specific operational condition can be carried out based on this model.
6. Conclusions
A method of modeling the non-braided fabric composites reinforced hose was proposed in this paper. The composite layer was modeled by rebar elements and the rubber materials were described by the Yeoh model. Two practical tests, including the counter force test and the ink print test, were designed and implemented to quantitatively verify the FE model. The simulation results show good accuracy. Based on the FE model, the performance of hose during compressing was studied. The influence of pressing displacement on the maximum strain and stress, the counter force and the area in contact under different inner pressure were investigated. Furthermore, the predicted seal-off displacements under which the hose would just be sealed off were given.
Major conclusions are summarized below:
- (1)
Physical parameters of the non-braided fabric composites reinforced hose, i.e., the area in contact, stress, strain and counter force, increase with the pressing displacement and pressure after the hose reaches full closure.
- (2)
An exception occurs when the pressure is zero. Under this circumstance, the displacement counter force, displacement maximum strain and displacement maximum stress curves rise more rapidly so that they cut through some other curves under non-zero pressure. Therefore, it is important to avoid non-pressure operational conditions.
- (3)
The displacement counter force, displacement maximum strain and displacement maximum stress curves help engineers to decide an appropriate pressing displacement of the pressing shoe, so as to achieve a reasonable area in contact with the smallest counter force and strain and stress. Moreover, the fatigue life could be roughly predicted through the S-N curve and ε-N curve.
Compared with a traditional design method, only explicit data such as the counter force and fatigue life can be obtained through tests, the time and costs of which would be extremely high. The numerical simulation based on the FE model proposed in this paper would accelerate the design cycle and reduce the costs. Meanwhile, further studies on multi-field coupling operational simulation could be built on this paper.


