Article

Simulation Analysis of Arc Interruption Characteristics in Disconnector

1
School of Electrical Engineering, Xi’an University of Technology, Xi’an 710048, China
2
Zhejiang Tengen Electric Co., Ltd., Yueqing 325604, China
3
State Key Laboratory of Electrical Insulation and Power Equipment, Xi’an Jiaotong University, Xi’an 710049, China
*
Author to whom correspondence should be addressed.
Machines 2022, 10(1), 6; https://doi.org/10.3390/machines10010006
Submission received: 8 November 2021 / Revised: 20 December 2021 / Accepted: 20 December 2021 / Published: 22 December 2021
(This article belongs to the Special Issue Electrical Engineering and Mechatronics Technology)

Abstract

:
Wind and solar energy are examples of clean energy that are widely developed and utilized in order to achieve the goal of carbon neutrality. Higher requirements for the safety and reliability of the power grid are put forward after they are connected to it. In the case of disconnectors, as the power system’s protection equipment, their arc interruption characteristics are closely tied to the safety and reliability of the power system. In addition, a disconnector is required to be able to break the DC arc in the photovoltaic power generation system. Therefore, this paper focuses on the arc evolution characteristics in disconnectors. A magnetohydrodynamics (MHD) model of disconnectors was built. In this model, not only are the coupling of the electromagnetic field and the airflow field considered, but also the characteristics of the external circuit. Therefore, not only can arc evolution characteristics be obtained through this simulation model, but the breaking performance will also be directly obtained. The temperature, pressure and velocity distribution are obtained to analyze the evolution process. The curve of current versus time is calculated to analyze the breaking performance. The evolution characteristics of AC and DC arcs in the disconnector are analyzed by calculation and comparison. This provides theoretical guidance for the optimal design of DC disconnectors through simulation analysis.

1. Introduction

The development and utilization of clean energy has become a focus and key point of energy development under the goal of global carbon neutrality. Photovoltaic and wind power are effective forms of clean energy, and their power generation is increasing year by year [1,2,3]. This provides a challenge for the existing power system to absorb clean energy. Therefore, in energy storage systems, an AC/DC hybrid distribution network will be vigorously developed. Access to clean energy puts forward higher requirements for the safety and reliability of the power system [4,5,6]. As an important safety protection device for power distribution systems, a low-voltage disconnector is required to have a capacity for breaking the load current. Therefore, effectively interrupting the arc is an important capability of the disconnector [7].
AC disconnectors are widely used in the traditional power distribution system, and the rated voltage is lower than 690 V. The rated voltage of disconnectors continues to increase with the development of the power distribution system [8]. In addition, the disconnector is required to be able to break the DC current in the photovoltaic power generation system and increase the rated voltage to 1500 V or even higher. Therefore, the arc-breaking capacity of the disconnector is faced with greater challenges, especially the breaking capacity of high-voltage DC arcs [9,10]. Research on DC disconnectors is usually through optimization and improvement on the basis of existing AC products. With this method, it is difficult to meet the market demand for new DC disconnectors with higher voltages. Moreover, the cost of research is relatively high through these experimental methods. Nowadays, MHD arc simulation technology has become an important aid for the optimization design of switch appliances [11,12,13].
There are many studies on the evolution characteristics of air arcs [14,15,16,17]. However, most of them focus on low-voltage circuit breakers, which rarely involving disconnectors. In addition, the arc evolution process was mainly analyzed by the MHD model in previous studies, and the external circuit equations were ignored [18,19,20,21]. In the simulation, the arc current needs to be known and used as an input parameter. Thus, the arc current and arcing time that characterize interruption characteristics need to be obtained through experiments. Therefore, the interruption characteristics cannot be analyzed by simulation. In this paper, the MHD model and the external circuit equations are coupled and a field–circuit coupling calculation model is established. In the MHD model, the motion process of moving contact is also considered. The evolution characteristics of the AC arc and DC arc are analyzed, respectively.
Through this model, not only is the arc evolution process analyzed, but the interruption performance of the disconnector can also be studied. The arc temperature and pressure can be obtained by simulation. In addition, both the arcing time and arc current can be directly calculated by this model. Based on these parameters, the arc evolution process and interruption characteristics are analyzed. In addition, the interruption capacity of the AC and DC arcs are compared and analyzed. In the end, the programs for improvement of the arc-extinguishing chamber in a high-voltage DC disconnector are proposed. The method established in this paper combines the diagnosis methods of microscopic parameters and macroscopic parameters, which not only provide guidance for the design of the arc-extinguishing chamber, but also provide a theoretical method for the analysis of the interruption performance.

2. Simulation Model and Method

The MHD model and the external circuit equations were coupled and a field-circuit coupling calculation model was established. The arc evolution characteristics were calculated and the interruption capacity of the AC and DC arcs were compared and analyzed.

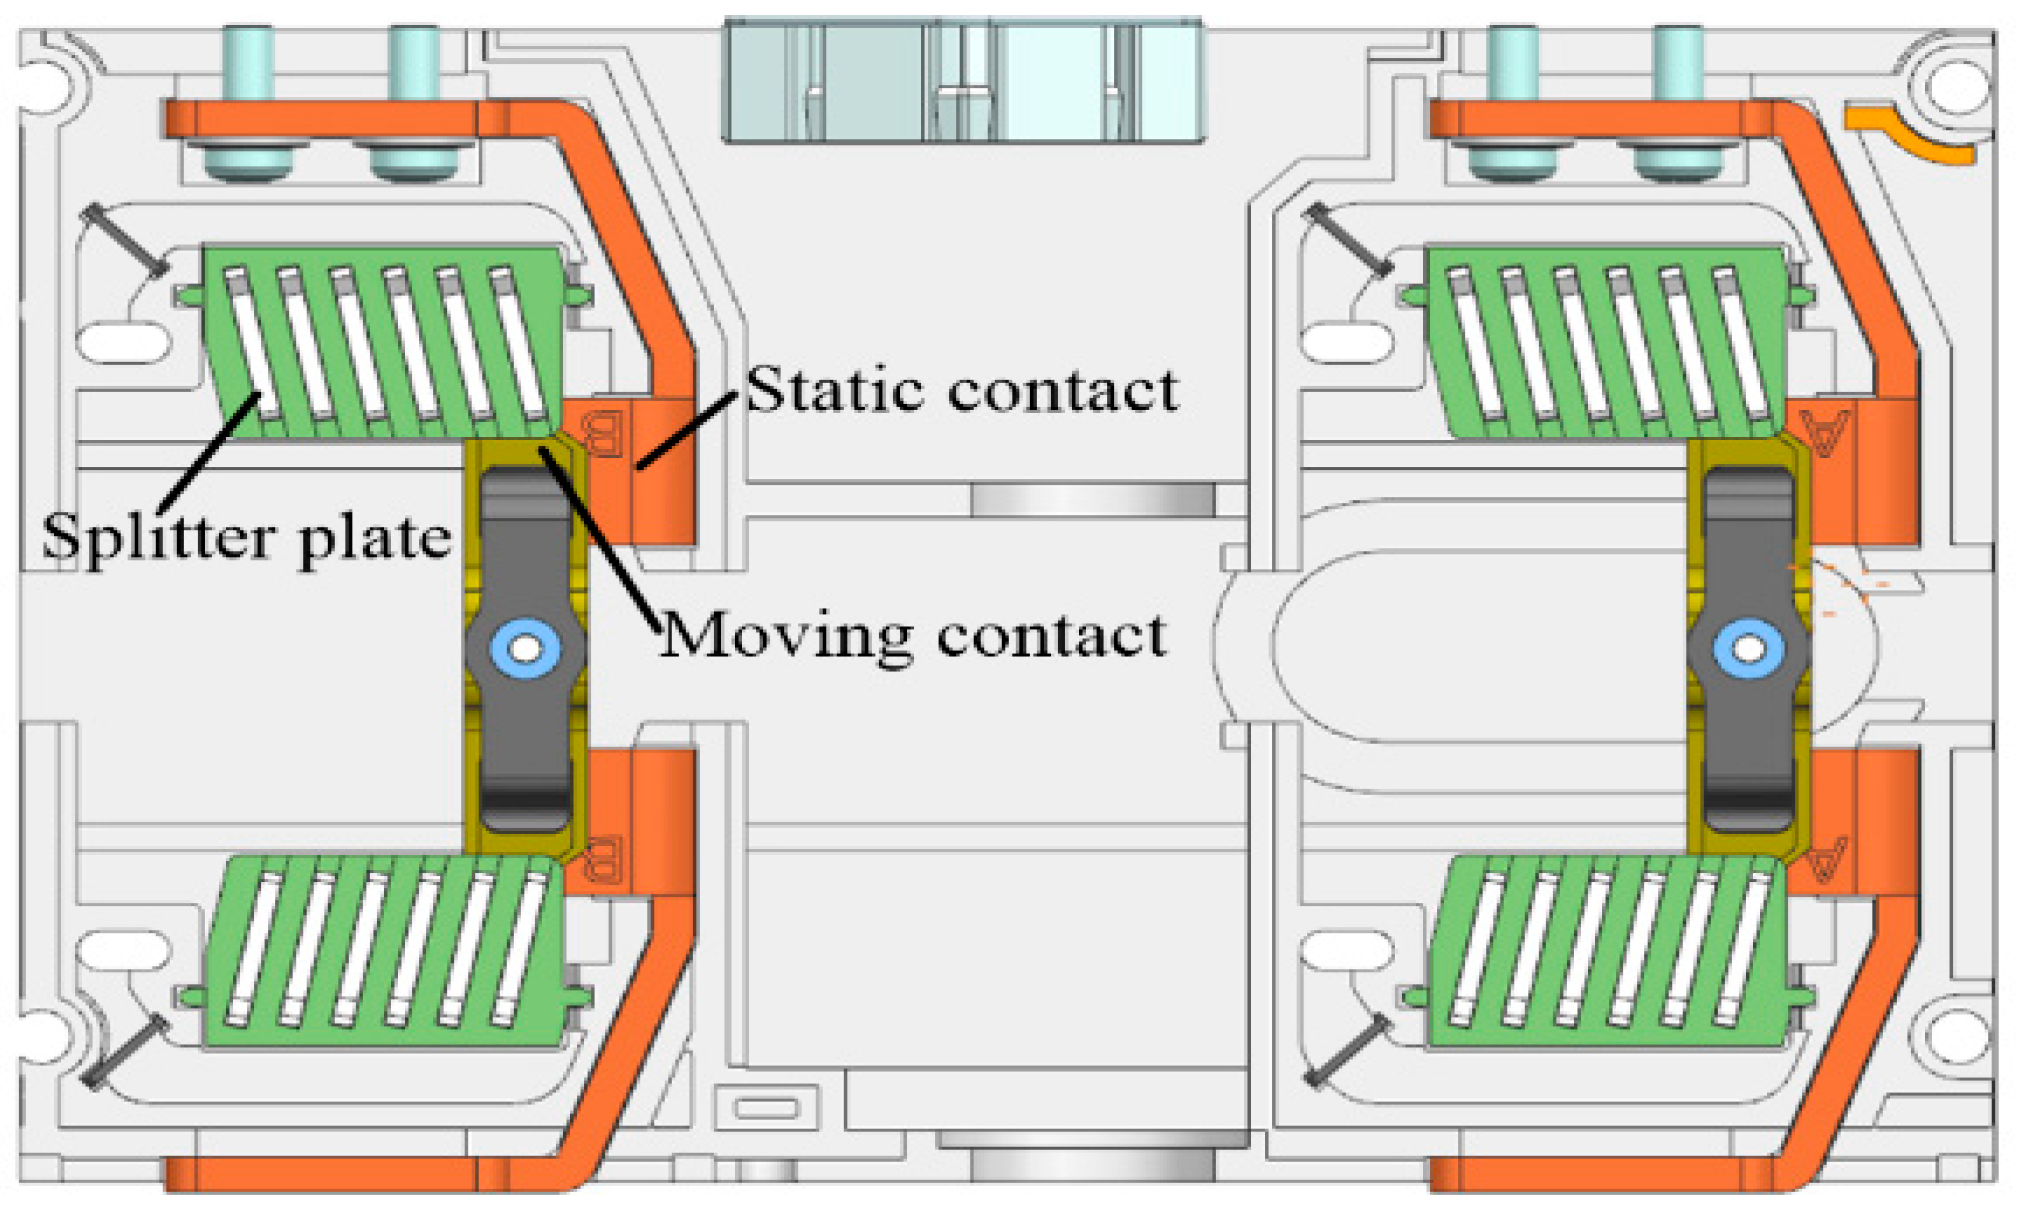
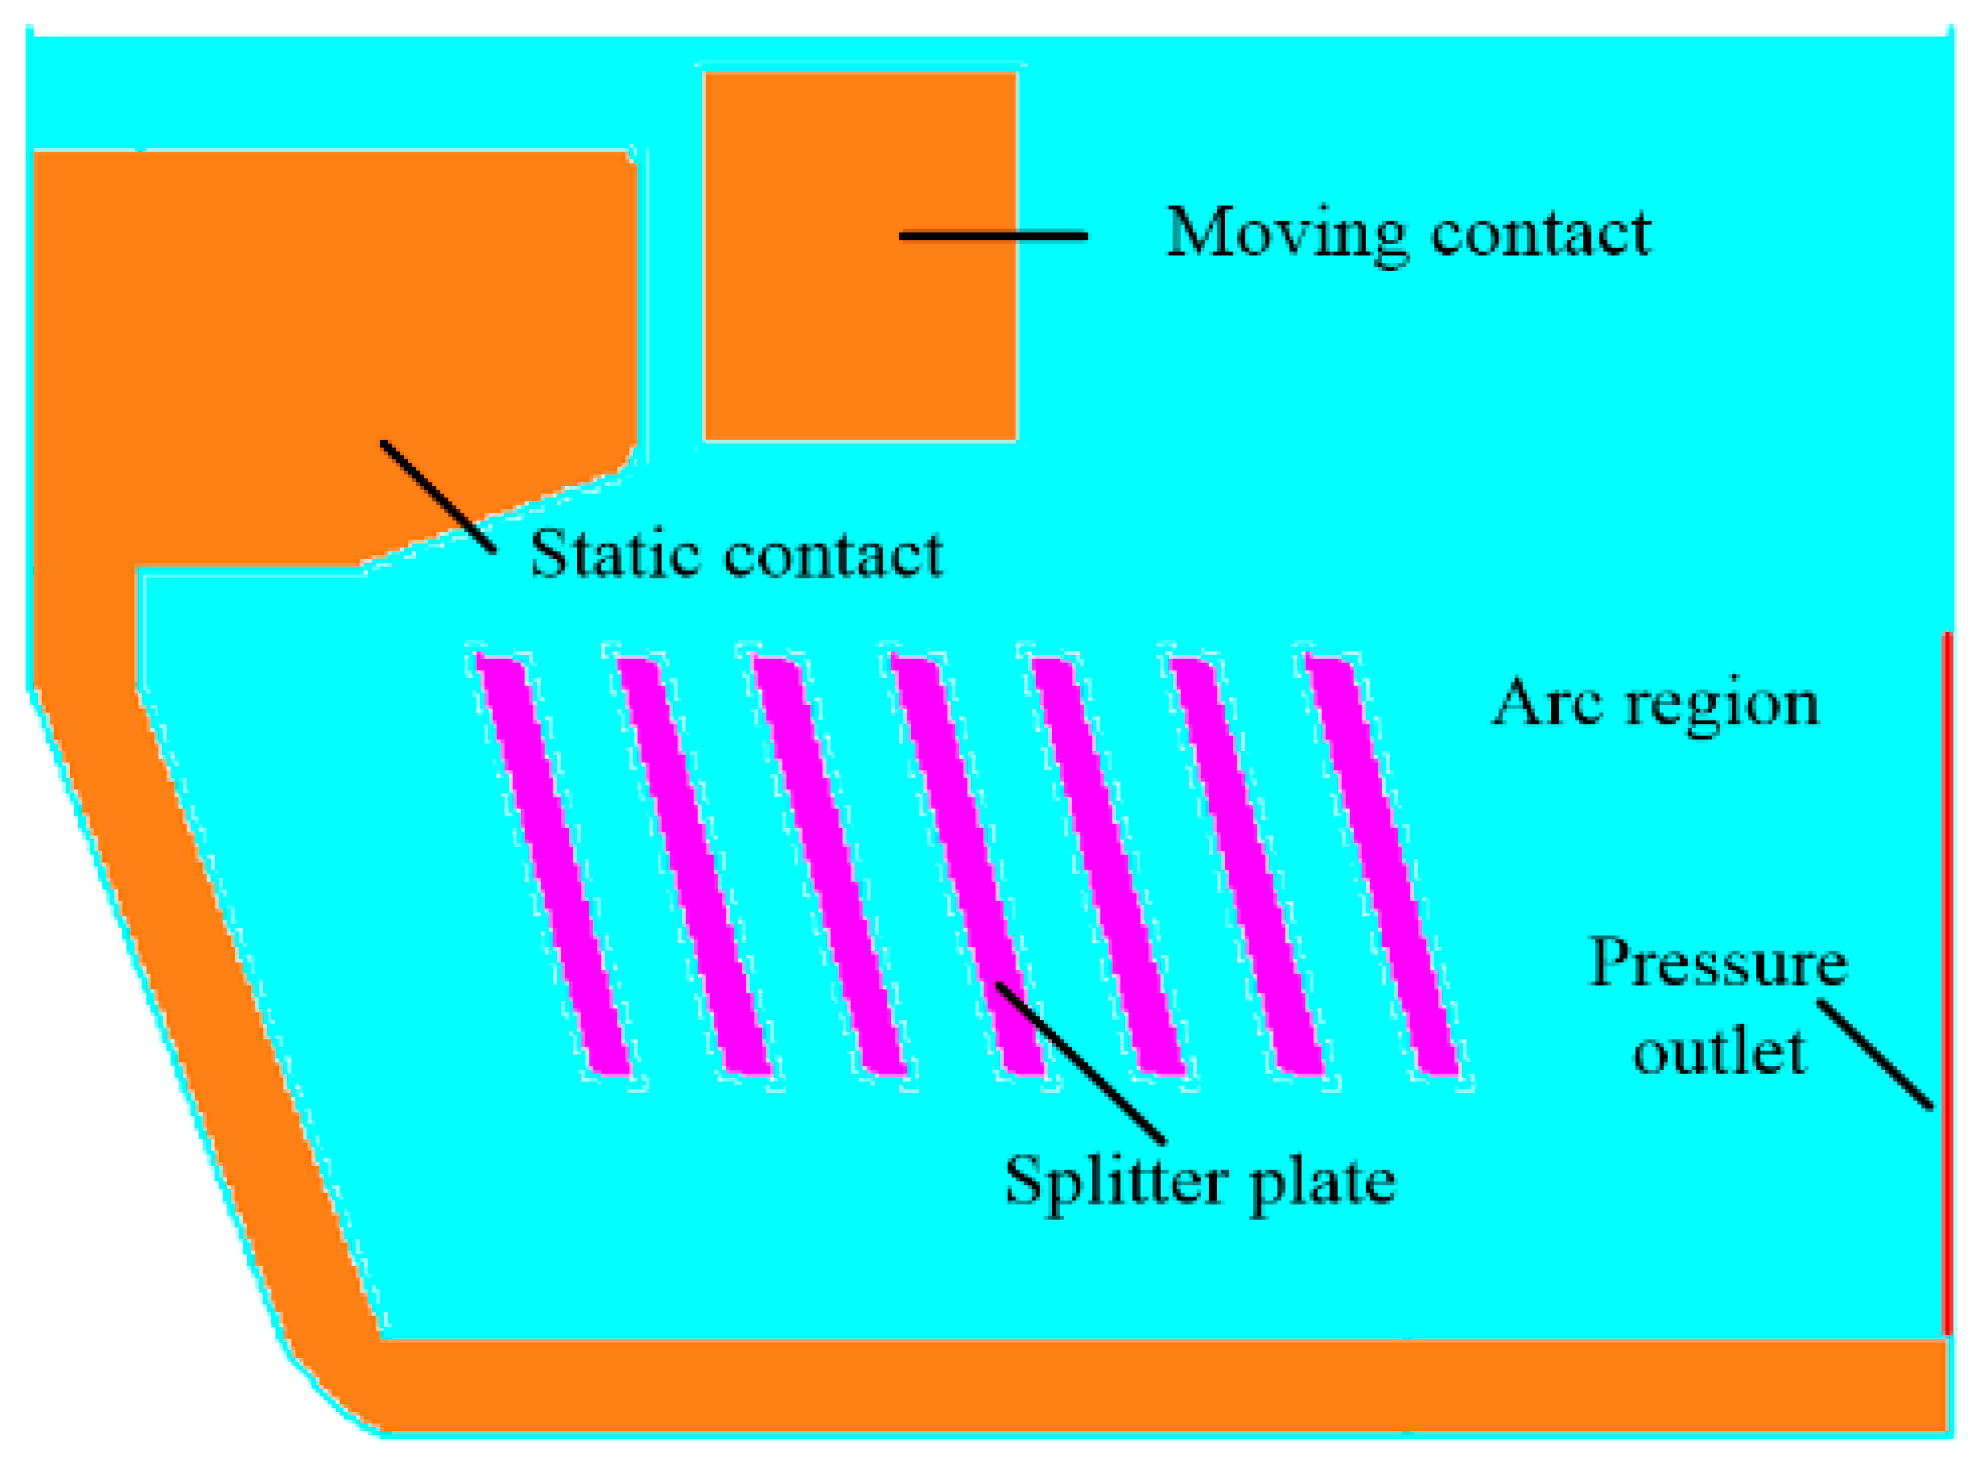
2.1. Simulation Model

A simulation model was built according to the key features of the existing AC disconnector product. The actual arc-extinguishing chamber model of the disconnector product is shown in Figure 1. It can be seen from Figure 1 that multiple basic arc-extinguishing chamber structures were used in series to achieve high-voltage arc interruption. The basic arc-extinguishing chamber was established in simulation. The simulation model is shown in Figure 2.
The size of each structure in the simulation model is consistent with the actual product. The maximum break distance was 22 mm. The motion process of moving contact was simulated by moving mesh technology.

2.2. Simulation Method

The air gap was broken down after the moving contact was opened, and the arc was ignited. The evolution process of the arc is a complex dynamic process coupled with multiple physical fields: electromagnetic field, airflow field, and temperature field [22,23]. The MHD method was used to calculate it. The equations were solved as follows [24]:
Mass balance equation:
ρ t + ( ρ V ) = 0
Momentum balance equation:
( ρ v k ) t + ( ρ v v k ) = ( η v k ) p x k + ( J × B ) k
Energy balance equation:
( ρ h ) t + ( ρ h V ) = ( λ c p h ) + S h
S h = σ E 2 q rad + q η
q rad = 4 π ε n
where ρ is the mass density, t is the time, v is the velocity vector, η is the dynamic viscosity, p is pressure, J is current density, B is magnetic flux density, h is enthalpy, cp is specific heat, λ is thermal conductivity, σ E 2 is Joule heat, and ε n is net emission coefficient.
The electrical field was calculated by user-defined scalar:
( σ ϕ ) = 0
where ϕ is electrical potential.
The physical parameters and transport coefficients of air plasma are functions of temperature and pressure [25,26].
In the calculation, the external circuit was also taken into account. In order to simplify the calculation, the external circuit is equivalent to an RL series circuit. The circuit equation is as follows:
U = R i + L d i d t + U arc
where U is the voltage of system, R is the equivalent resistance of external circuit, L is the equivalent inductance of external circuit, and Uarc is the arc voltage of disconnector.
The simulation software was ANSYS Fluent. Secondary developments were carried out to complete the solution of external circuit equations and electromagnetic field equations. The arc voltage can be calculated by this MHD method. The AC and DC arc evolution processes and interruption characteristics were analyzed by simulation.

3. Analysis of Results

The temperature distribution, pressure distribution, and velocity were obtained by simulation. In addition, the arc current and arc voltage were calculated. The arcing time can be obtained by arc current curve. The arc evolution process was analyzed by the temperature and pressure distribution, and the interruption characteristic was analyzed by arc current and arc voltage curves.

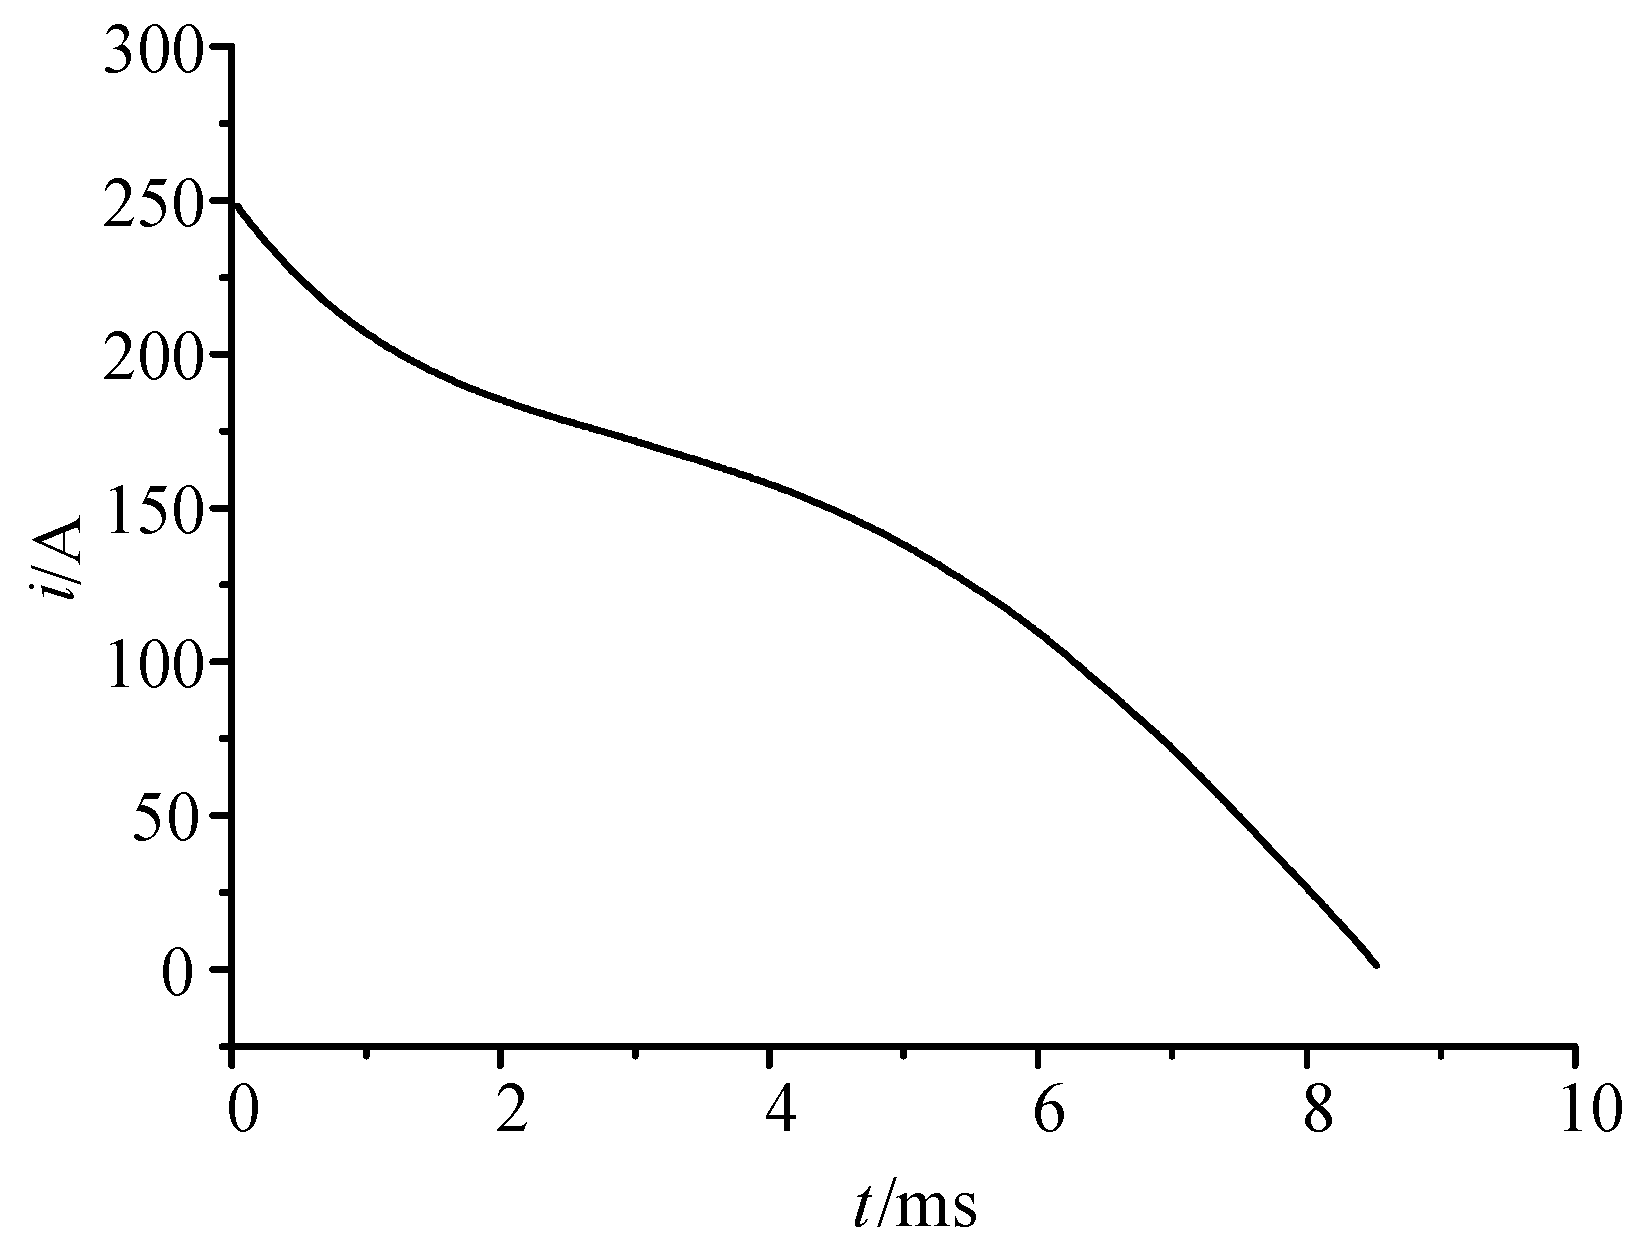
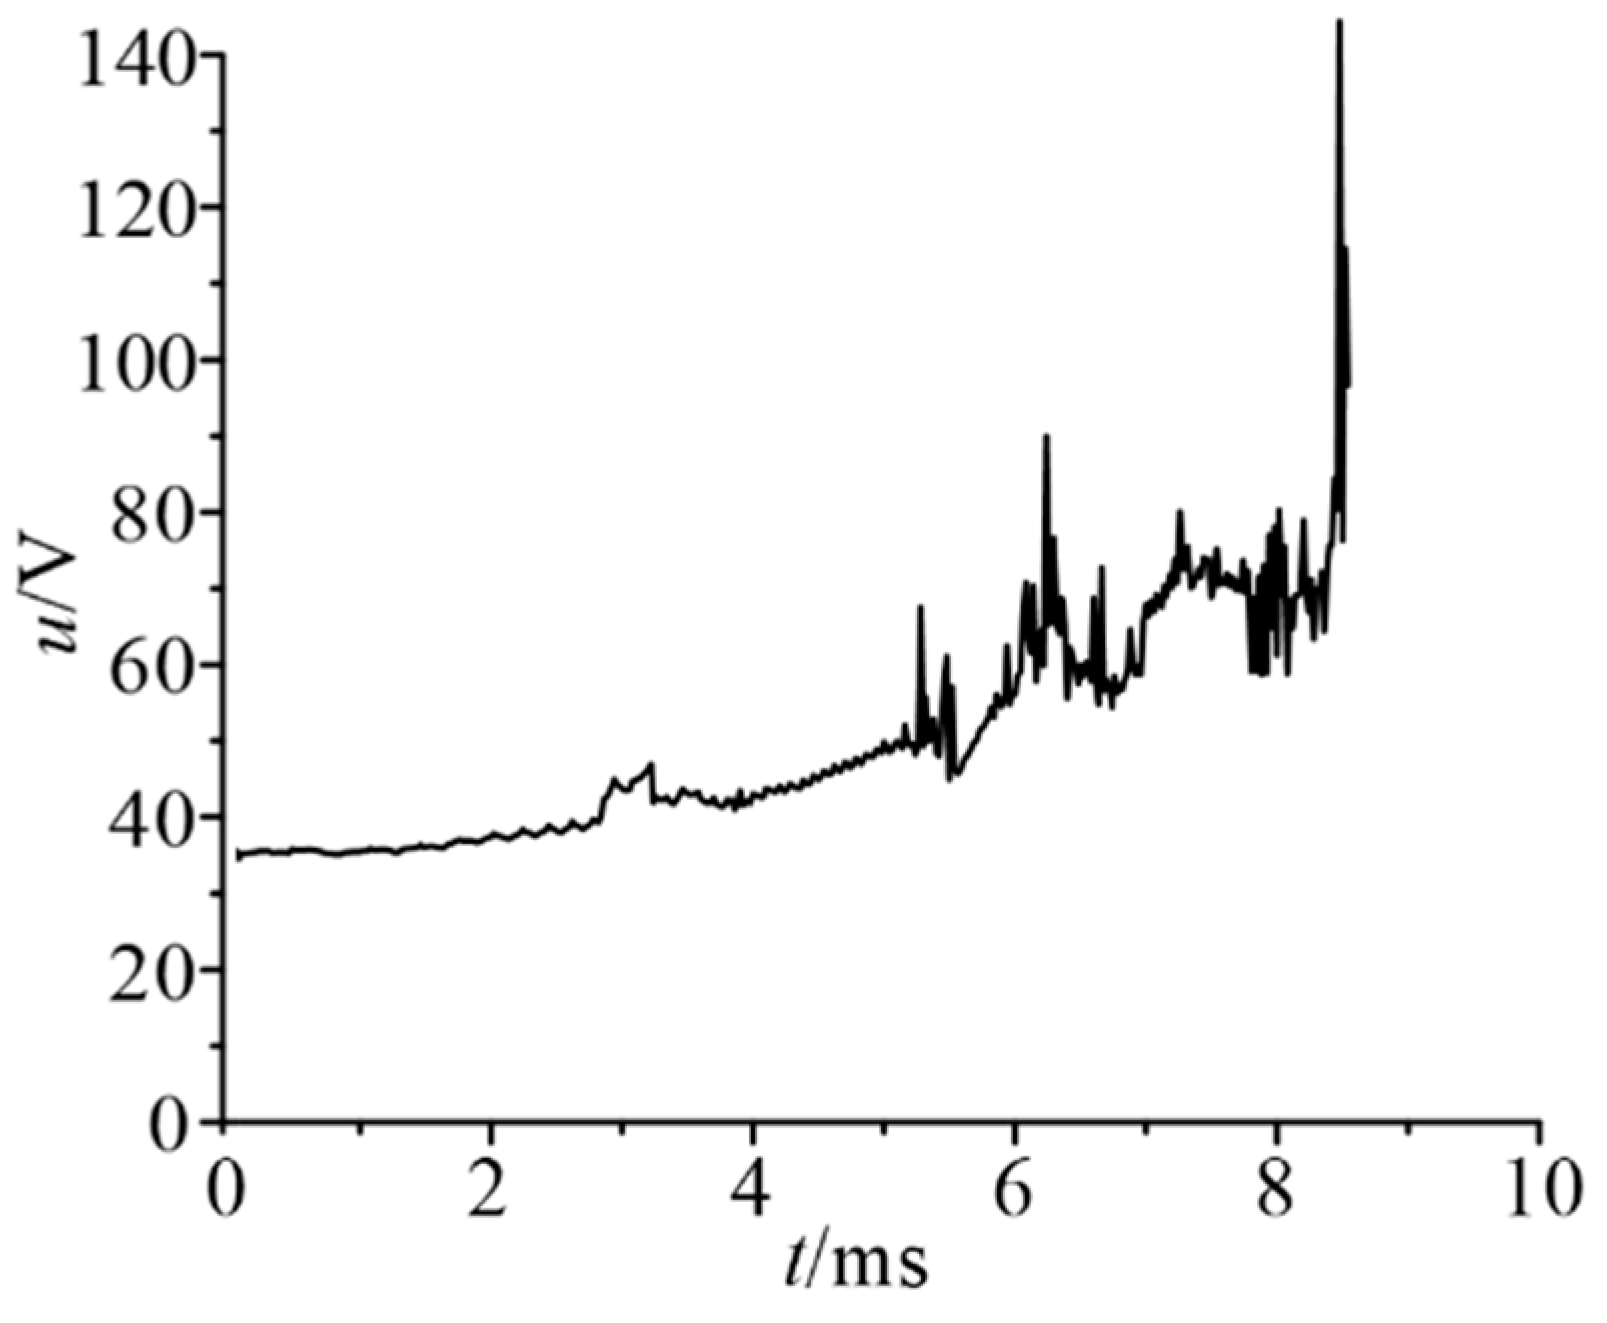
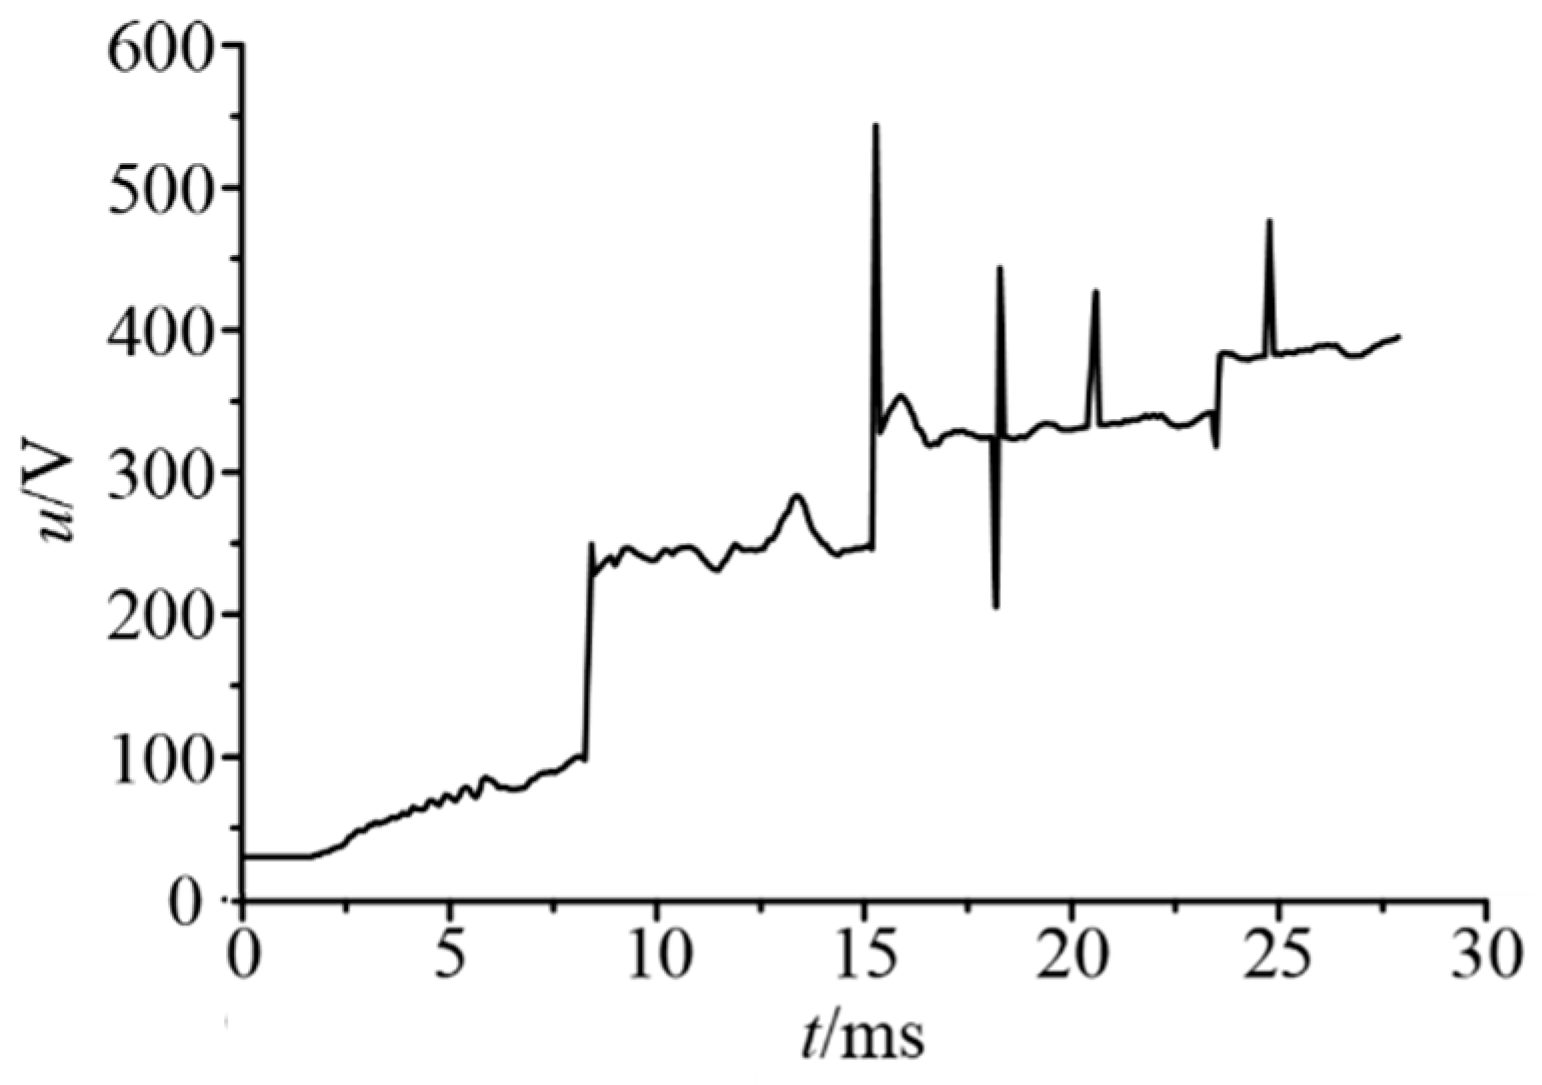
3.1. Arc Interruption Characteristic of AC Current

The system voltage was 1000 V and the rated root-mean-square current was 200 A, according to the performance of the actual product. The power factor was 0.65. The equivalent resistance and inductance of the circuit were 2 Ω and 4.78 mH, respectively.
The temperature distribution is shown in Figure 3. The pressure and the velocity distribution are shown in Figure 4 and Figure 5.
It can be seen from the arc temperature distribution that the arc evolution process can be divided into the following stages: (1) The arc column spreads and elongates with the movement of the moving contact; (2) The arc column is squeezed by the splitter plate; (3) The arc enters the splitter plate region and the arc column is elongated; (4) The arc is cut by the splitter plate and short arcs are formed.
The arc moves to the contact region, especially at t = 2.4 ms and t = 4.8 ms, as shown in Figure 3. The main reason for this is that the pressure near the splitter plate region is higher than the contact region as shown in Figure 4. In addition, the air vortex is formed in the splitter plate region as shown in Figure 5, which leads to the stagnation of the arc. It is not conducive to the cooling of the arc and the increase in the arc voltage. This means that it is difficult for the arc-extinguishing chamber structure to improve the breaking capacity of the disconnector.
The arc current curve and arc voltage curve are shown in Figure 6 and Figure 7. It can be seen that the decrease rate of arc current is small before 5 ms. The main reason is that the arc voltage is lower as shown in Figure 7. The di/dt is positively related to the difference between the system voltage and the arc voltage. Therefore, the higher the arc voltage, the better the current-limiting performance. After 5 ms, the arc enters the splitter plate region, and the arc voltage starts to increase due to the near-electrode voltage drop. Therefore, the arc current drop rate increases according to the Equation (7). The arc voltage dropped repeatedly, which also explains the instability of the arc entering the grid area. The reason for this is that the arc exits the splitter plate and moves to the contact area due to the action of the airflow field. In other words, there is a back-side breakdown phenomenon. The arc temperature gradually decreases due to the decrease in Joule heat (arc current). The arc current crosses zero at 8.52 ms and the arc is extinguished. There is a very obvious sudden increase in arc voltage at 8.52 ms. This is mainly because the arc current crosses zero and the input of Joule heat is 0, but the arc energy is continuously dissipating. Therefore, the arc rapidly cools and the arc resistance increases suddenly.

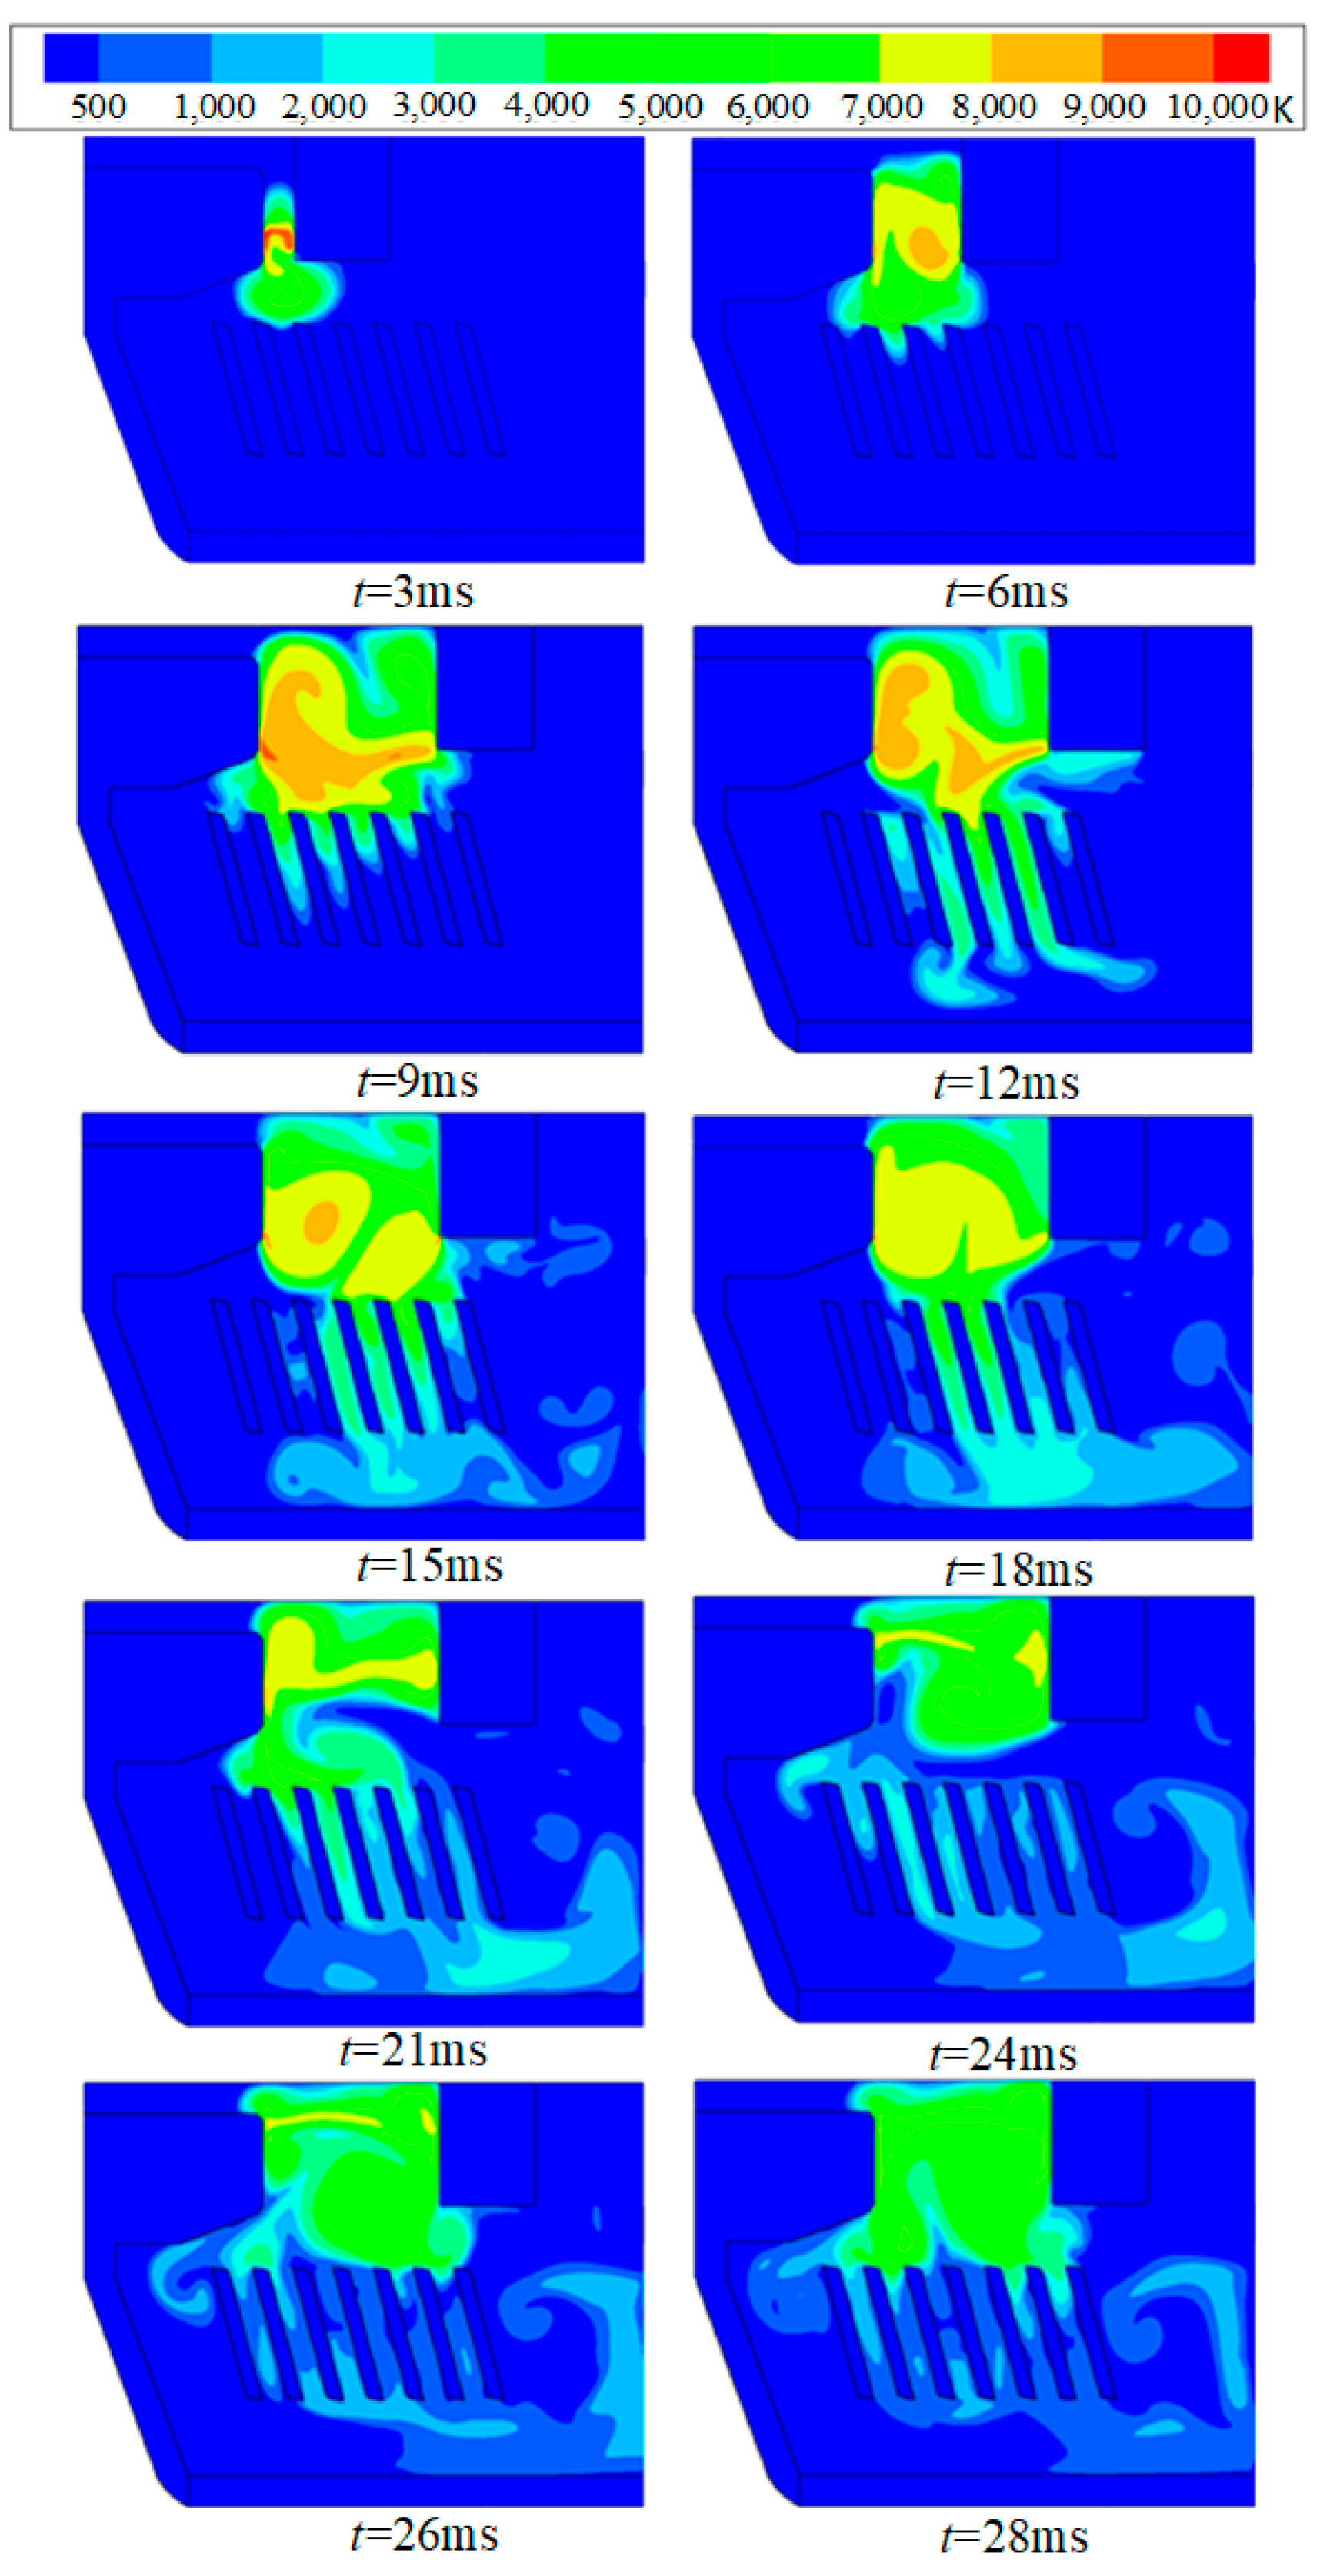
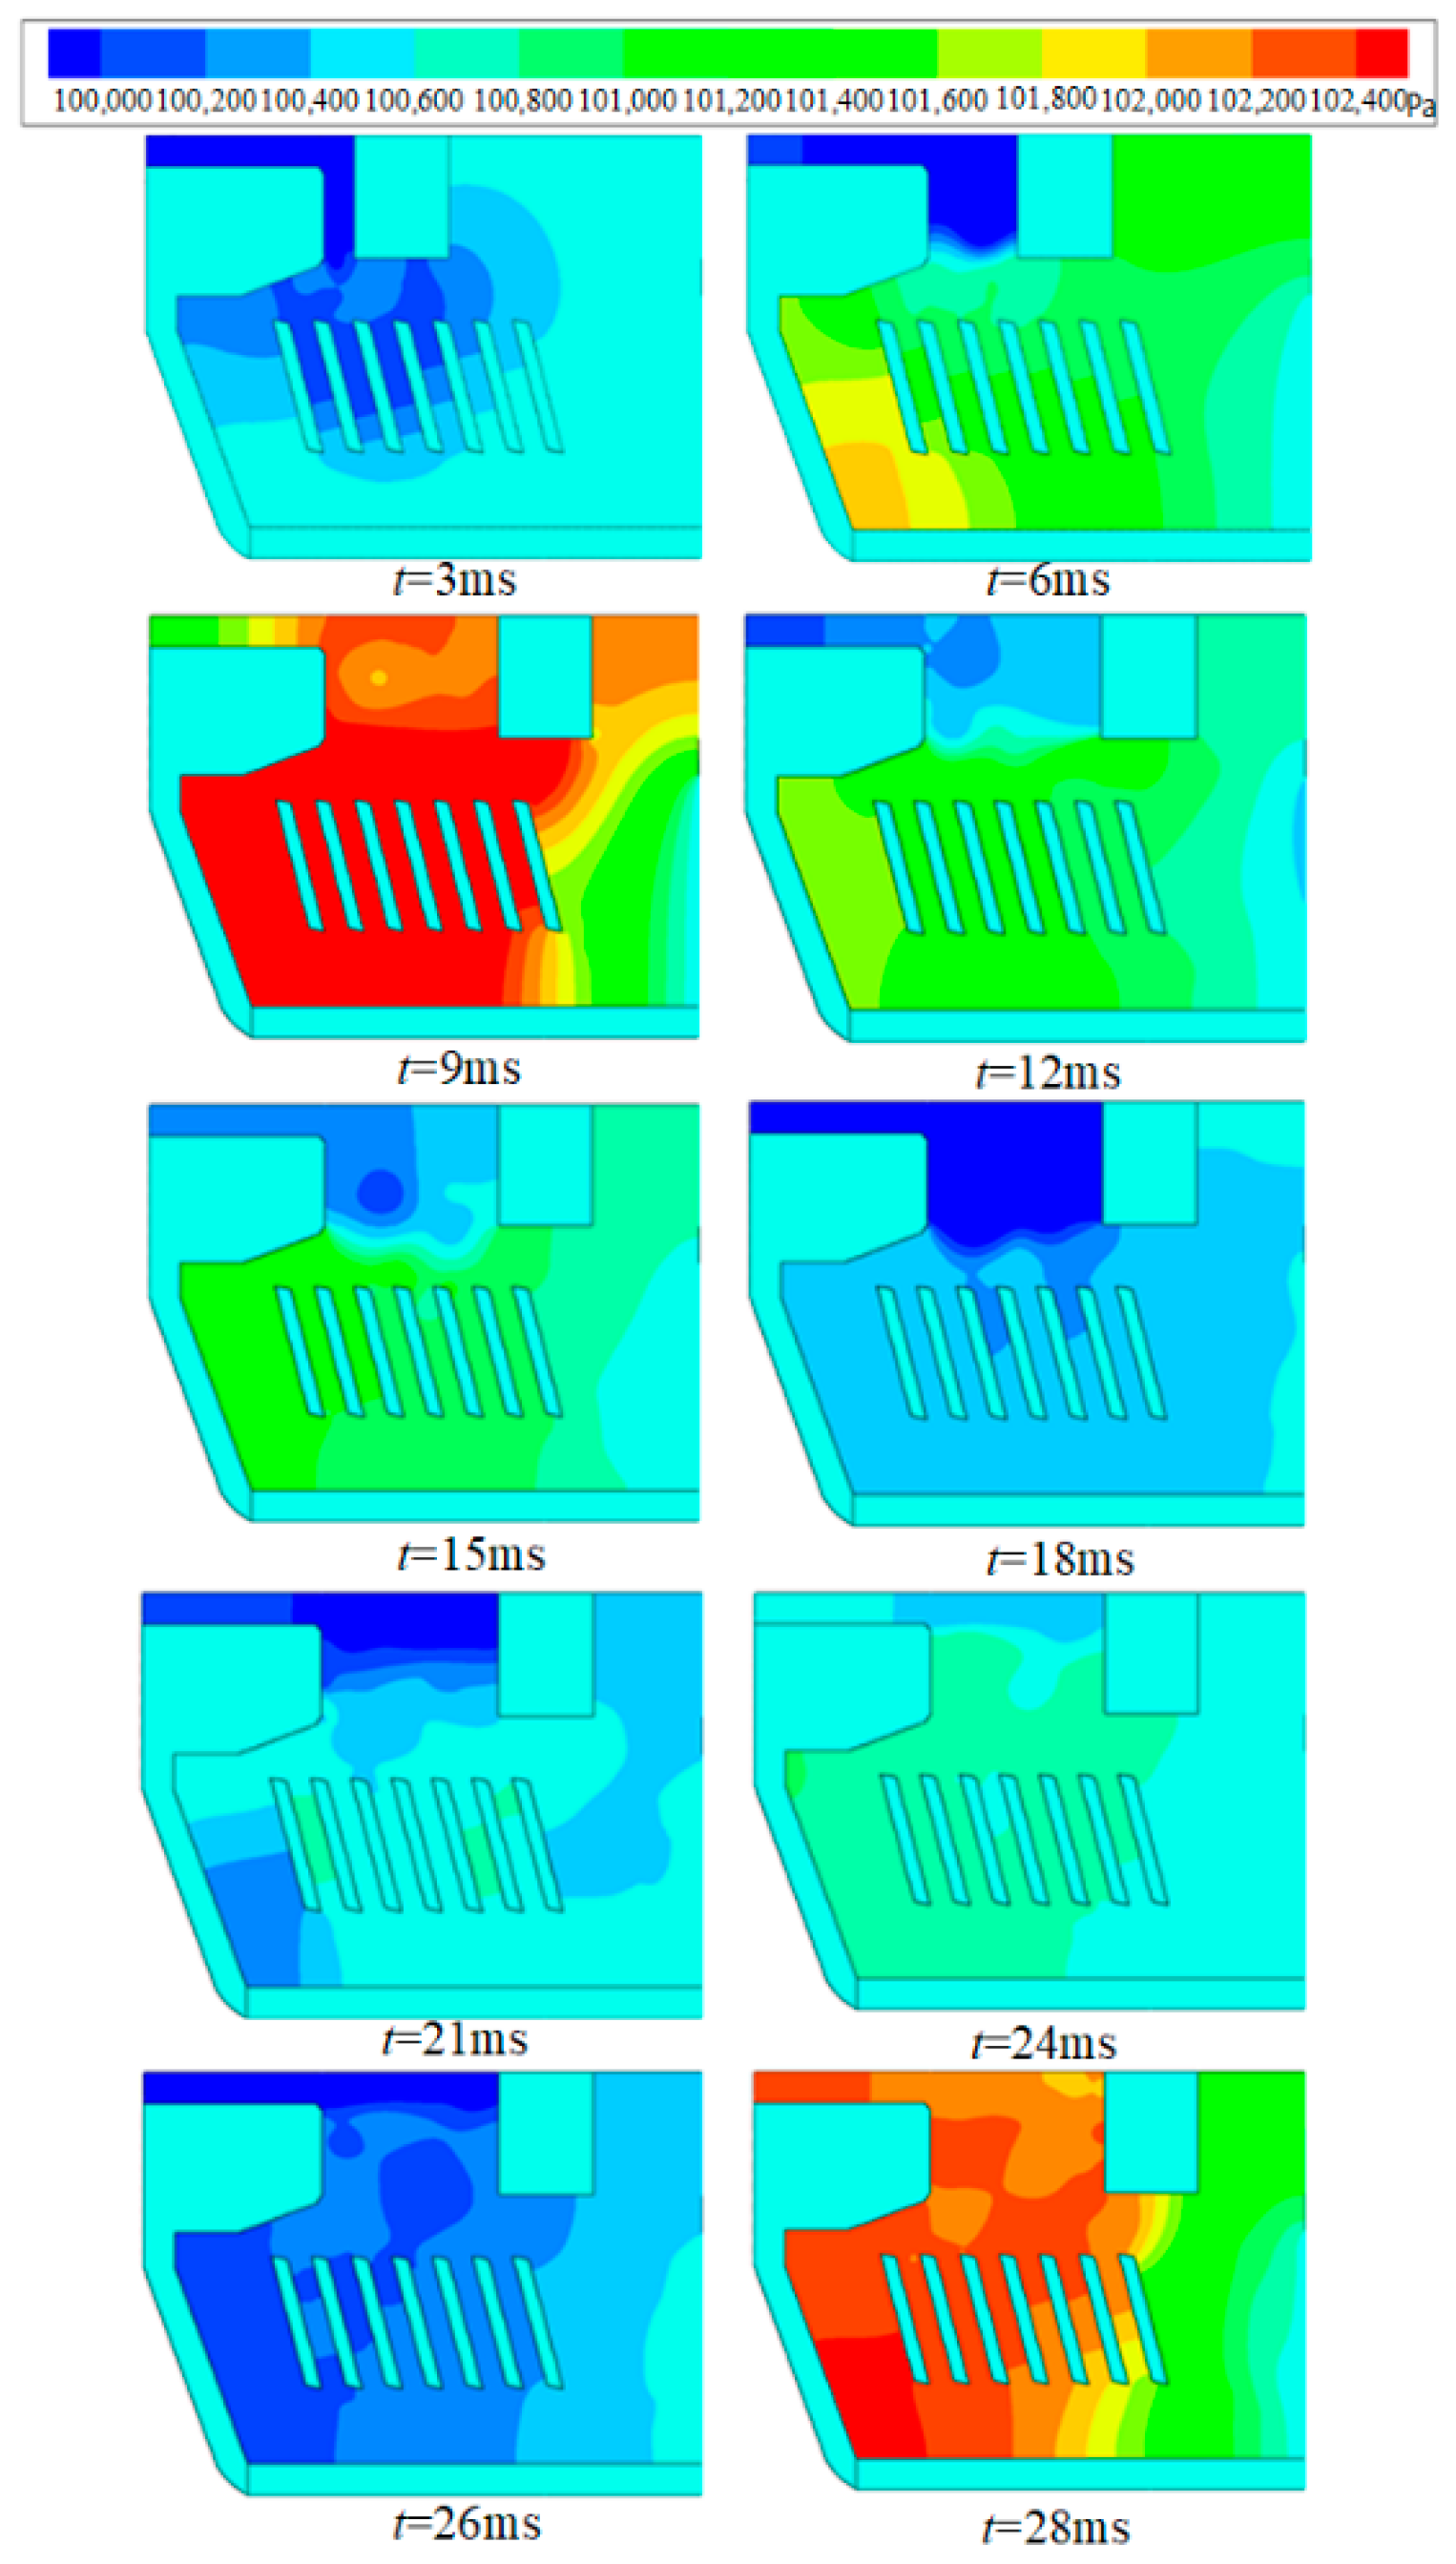
3.2. Arc Interruption Characteristic of DC Current (200 A)

The high-voltage DC interruption requirements were put forward for the disconnector with the development of photovoltaic power generation. The DC arc was more difficult to extinguish than the AC arc due to the fact that the DC arc had no natural zero-crossing point. The DC arc evolution process and interruption performance were analyzed by simulation. Finally, the optimized design scheme of the arc chamber was proposed according to the simulation results.
In this model, the rated voltage is DC 1500 V and the rated current is 200 A. The time constant is 7.5 ms. The equivalent resistance and inductance of the circuit are 3.75 Ω and 28.125 mH, respectively, by calculation.
The temperature, pressure, and velocity distribution were obtained. They are shown in Figure 8, Figure 9 and Figure 10, respectively. It can be seen that the arc stays in the contact region for a long time, and does not enter the splitter plate region until 9 ms. The formation of an air vortex in the contact area, as well as the smaller gas pressure, causes the arc to stagnate in the contact region, as shown in Figure 9 and Figure 10. The pressure in the contact region is small before 9 ms, as shown in Figure 9. Therefore, the direction of the pressure gradient is from the splitter plate region to the contact region, which causes the arc to move to the contact region, as shown in Figure 8. Comparing and analyzing the arc temperature and pressure distribution, it can be seen that the airflow field plays a major role during the arc movement. The main reason for this is that the Lorentz force is small at I = 200 A.
The pressure in the contact region is small during the entire arc movement due to the smaller space in the contact region. The air vortex is easy to form when the break length is small, as shown in Figure 10. The air vortex is also formed near the pressure outlet. This directly leads to the slow speed of the arc as it enters the splitter plate.
The parts of the splitter plates are used to cut the arc when the arc enters the splitter plate region, as shown in Figure 8. The splitter plates on both sides are not effectively used. On the one hand, the distance is small. On the other hand, the airflow is obstructed by static contact. These hinder the increase in arc voltage and extinguishing of the DC arc. The arc current and arc voltage were also calculated, and are shown in Figure 11 and Figure 12.
The arc voltage has a sudden increase at about 9 ms, mainly because the arc enters the splitter plate and is cut by the splitter plate. The near-electrode voltage drop increases. The arc voltage increases by about 120 V. This is because the arc column is effectively cut by four splitter plates, thus increasing to four pairs of near-electrode voltage drops (each pair of near-electrode voltage drops is about 30 V). This result can also be seen from Figure 8. The fluctuation in the value of the arc voltage is mainly due to the phenomenon that the arc exits the splitter plate after the arc enters the splitter plate. This is not positive for the extinguishment of the high voltage DC arc.
It can be seen from the current curve that when the arc current drops to 13 A at 28 ms and the arc temperature drops to 7000 K, the arc tends to be extinguished. However, the arcing time exceeds 28 ms. The DC arc is difficult to extinguish in a short time due to the value of the arc voltage being small. Therefore, the arc chamber needs to be further optimized for the DC disconnector.
Comparing the arc evolution characteristics under AC and DC situation, the arcing time of the DC arc is obviously longer than the AC arc. This is because the AC current has a natural zero-crossing point, and the rate of decrease in the DC current is completely dependent on the ratio of the system voltage to the arc voltage. If the ratio of the system voltage to the arc voltage is less than 1, the smaller current will cross zero faster, and the arc will be easier to extinguish according to the Equation (7). In addition, for the AC situation, the arc is not completely cut by the splitter plate. This is mainly because the current drops faster in AC than in DC, and at the same time, the Lorentz force is smaller. Therefore, the arc moves more slowly.

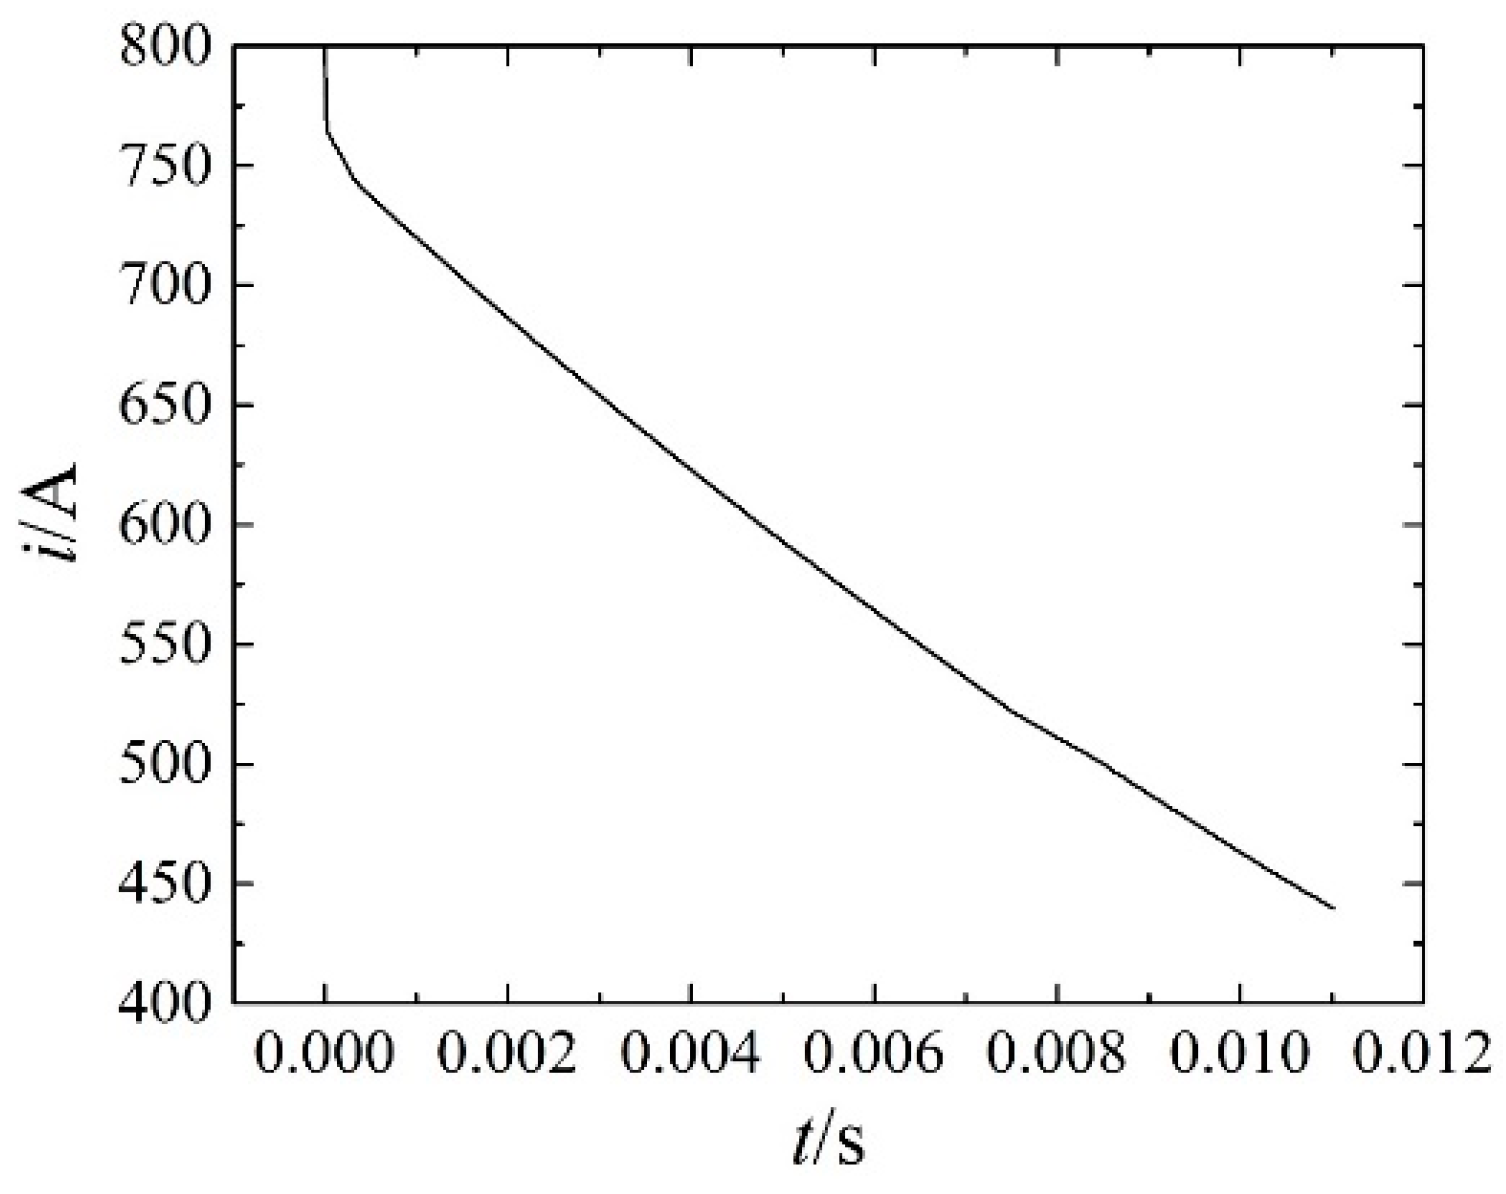
3.3. Arc Interruption Characteristic of DC Current (800 A)

In order to further analyze the interruption characteristics of the arc-extinguishing chamber to the DC high current, the paper calculated the arc motion characteristics at DC 800 A. The time constant was 15 ms. The equivalent resistance and inductance of the circuit were 0.9375 Ω and 14.0625 mH, respectively. The temperature distribution and arc current are shown in Figure 13 and Figure 14.
The arc enters the splitter plate in 3 ms, as shown in Figure 13. The arc current is larger than 200 A. Therefore, the Lorentz force is larger, and the movement of the arc is accelerated. In addition, at the beginning of the arc movement, the tendency of the arc to move towards the contact region is weak. It can be seen that only the middle four splitter plates are effectively used, which is consistent with the result at 200 A. The arc current is 430 A at 11 ms, and the drop rate is 33.6 A/ms. Although the current drop rate is higher than 200 A, the arcing time is longer and the arc energy is larger, which leads to the contacts becoming severely ablated. Therefore, the performance of the arc-extinguishing chamber is destroyed and the disconnector fails to operate reliably. Therefore, the dynamic and static contact structures are redesigned, and the break length is increased in order to realize the interruption of the DC arc. Moreover, the splitter plate should be increased in the DC disconnector, according to the arc chamber of low-voltage circuit breakers [11]. The dynamic and static contact structures can be designed as nozzle structures to accelerate the airflow and reduce air vortices. Thus, the arc quickly enters the splitter plate and the arc voltage is raised, finally achieving the rapid extinguishment of the DC arc.
For the DC arc, the improved contact structure is shown in Figure 15. The contact structure is similar to the nozzle structure. In the nozzle structure, the velocity contour diagram is displayed. It can be seen that the velocity of the airflow field is greatly accelerated through the nozzle structure [27].
In addition, the outgassing material can also improve arc-breaking capacity in a gas switch [28]. Therefore, outgassing materials can be added to the wall of the arc-extinguishing chamber to improve the interruption characteristics of the DC arc.
Through the above comparative analysis, the arc-extinguishing chamber structure can extinguish AC arcs, but for high-voltage DC arcs, it cannot meet the requirements of the product due to the lower arc voltage and longer arcing time. Therefore, in order to realize the interruption of high-voltage DC arcs, rather than meet the requirements by directly using AC products, it is necessary to improve or redesign the AC products.

4. Conclusions

To investigate the arc interruption characteristics of disconnectors in the new energy photovoltaic power generation system, a field–circuit coupling arc simulation model was built and arc evolution characteristics were calculated and analyzed. The interruption characteristics of AC and DC arcs were compared and analyzed. In addition, the improvement measures of the arc-extinguishing chamber were proposed for DC arc breaking. The following conclusions were obtained.
(1)
The arc-extinguishing chamber structure of the disconnector shown in this paper can extinguish the AC arc, and the arcing time of the AC arc is shorter than that of the DC arc, mainly because the AC current has a natural zero-crossing point.
(2)
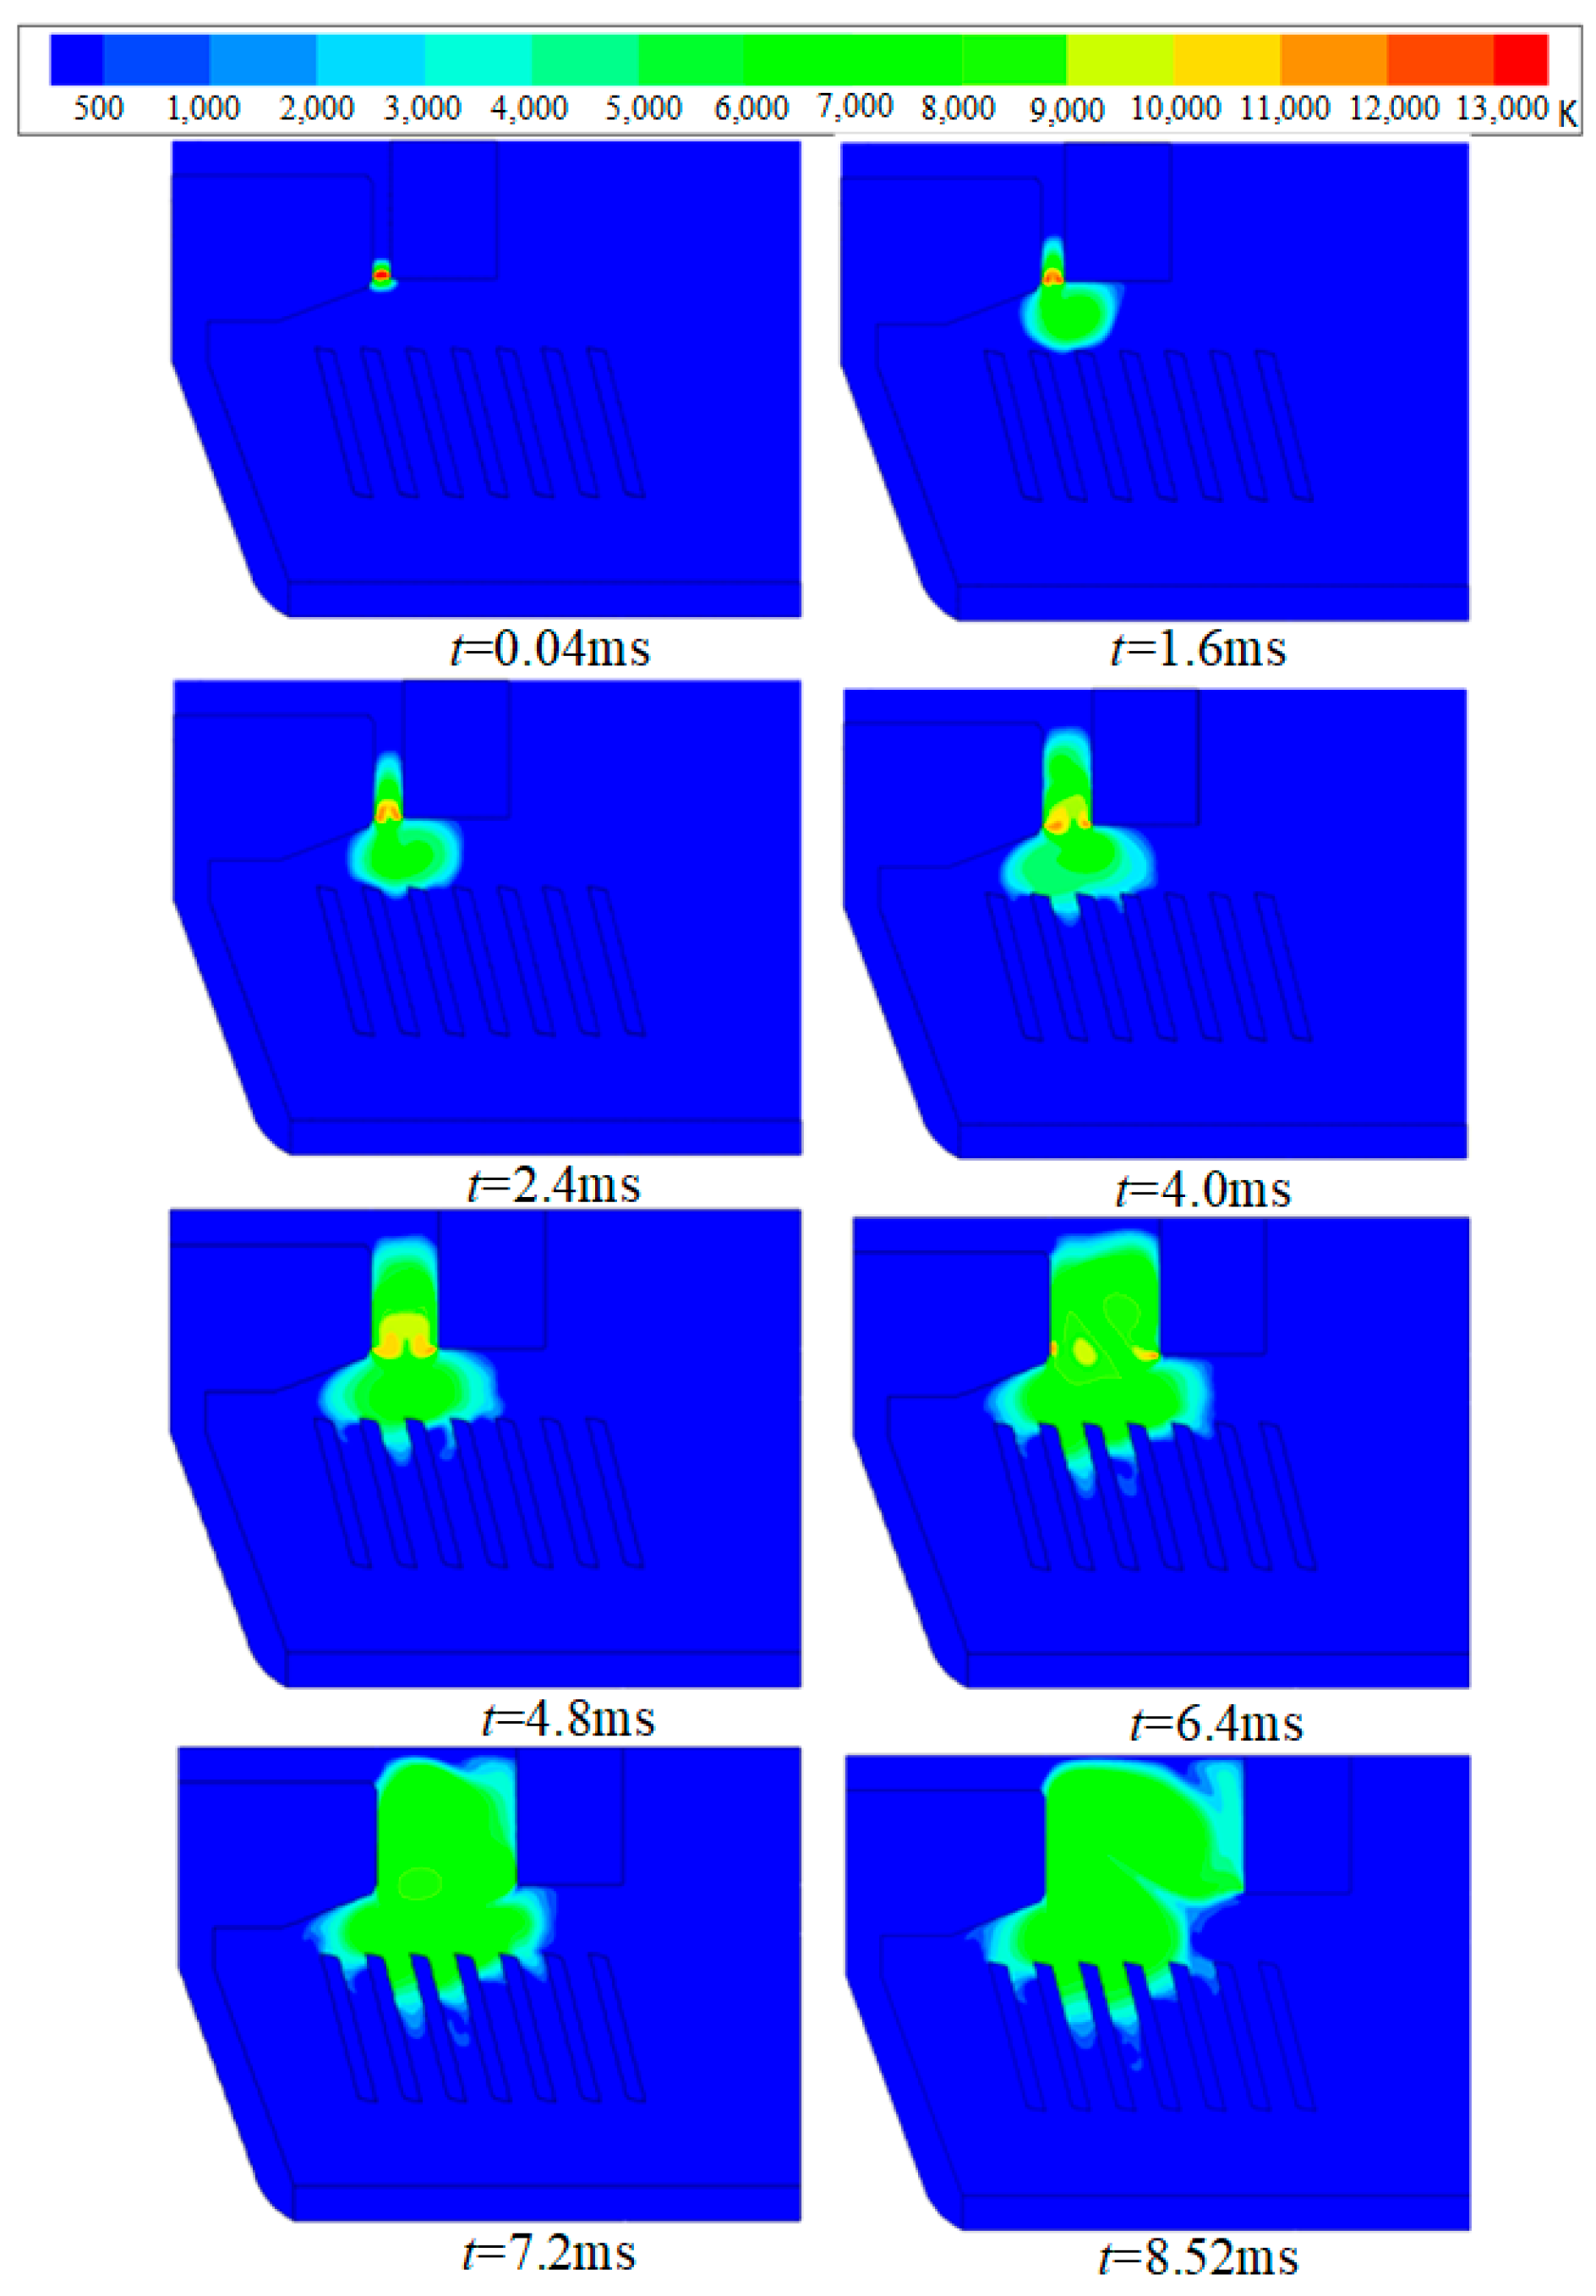
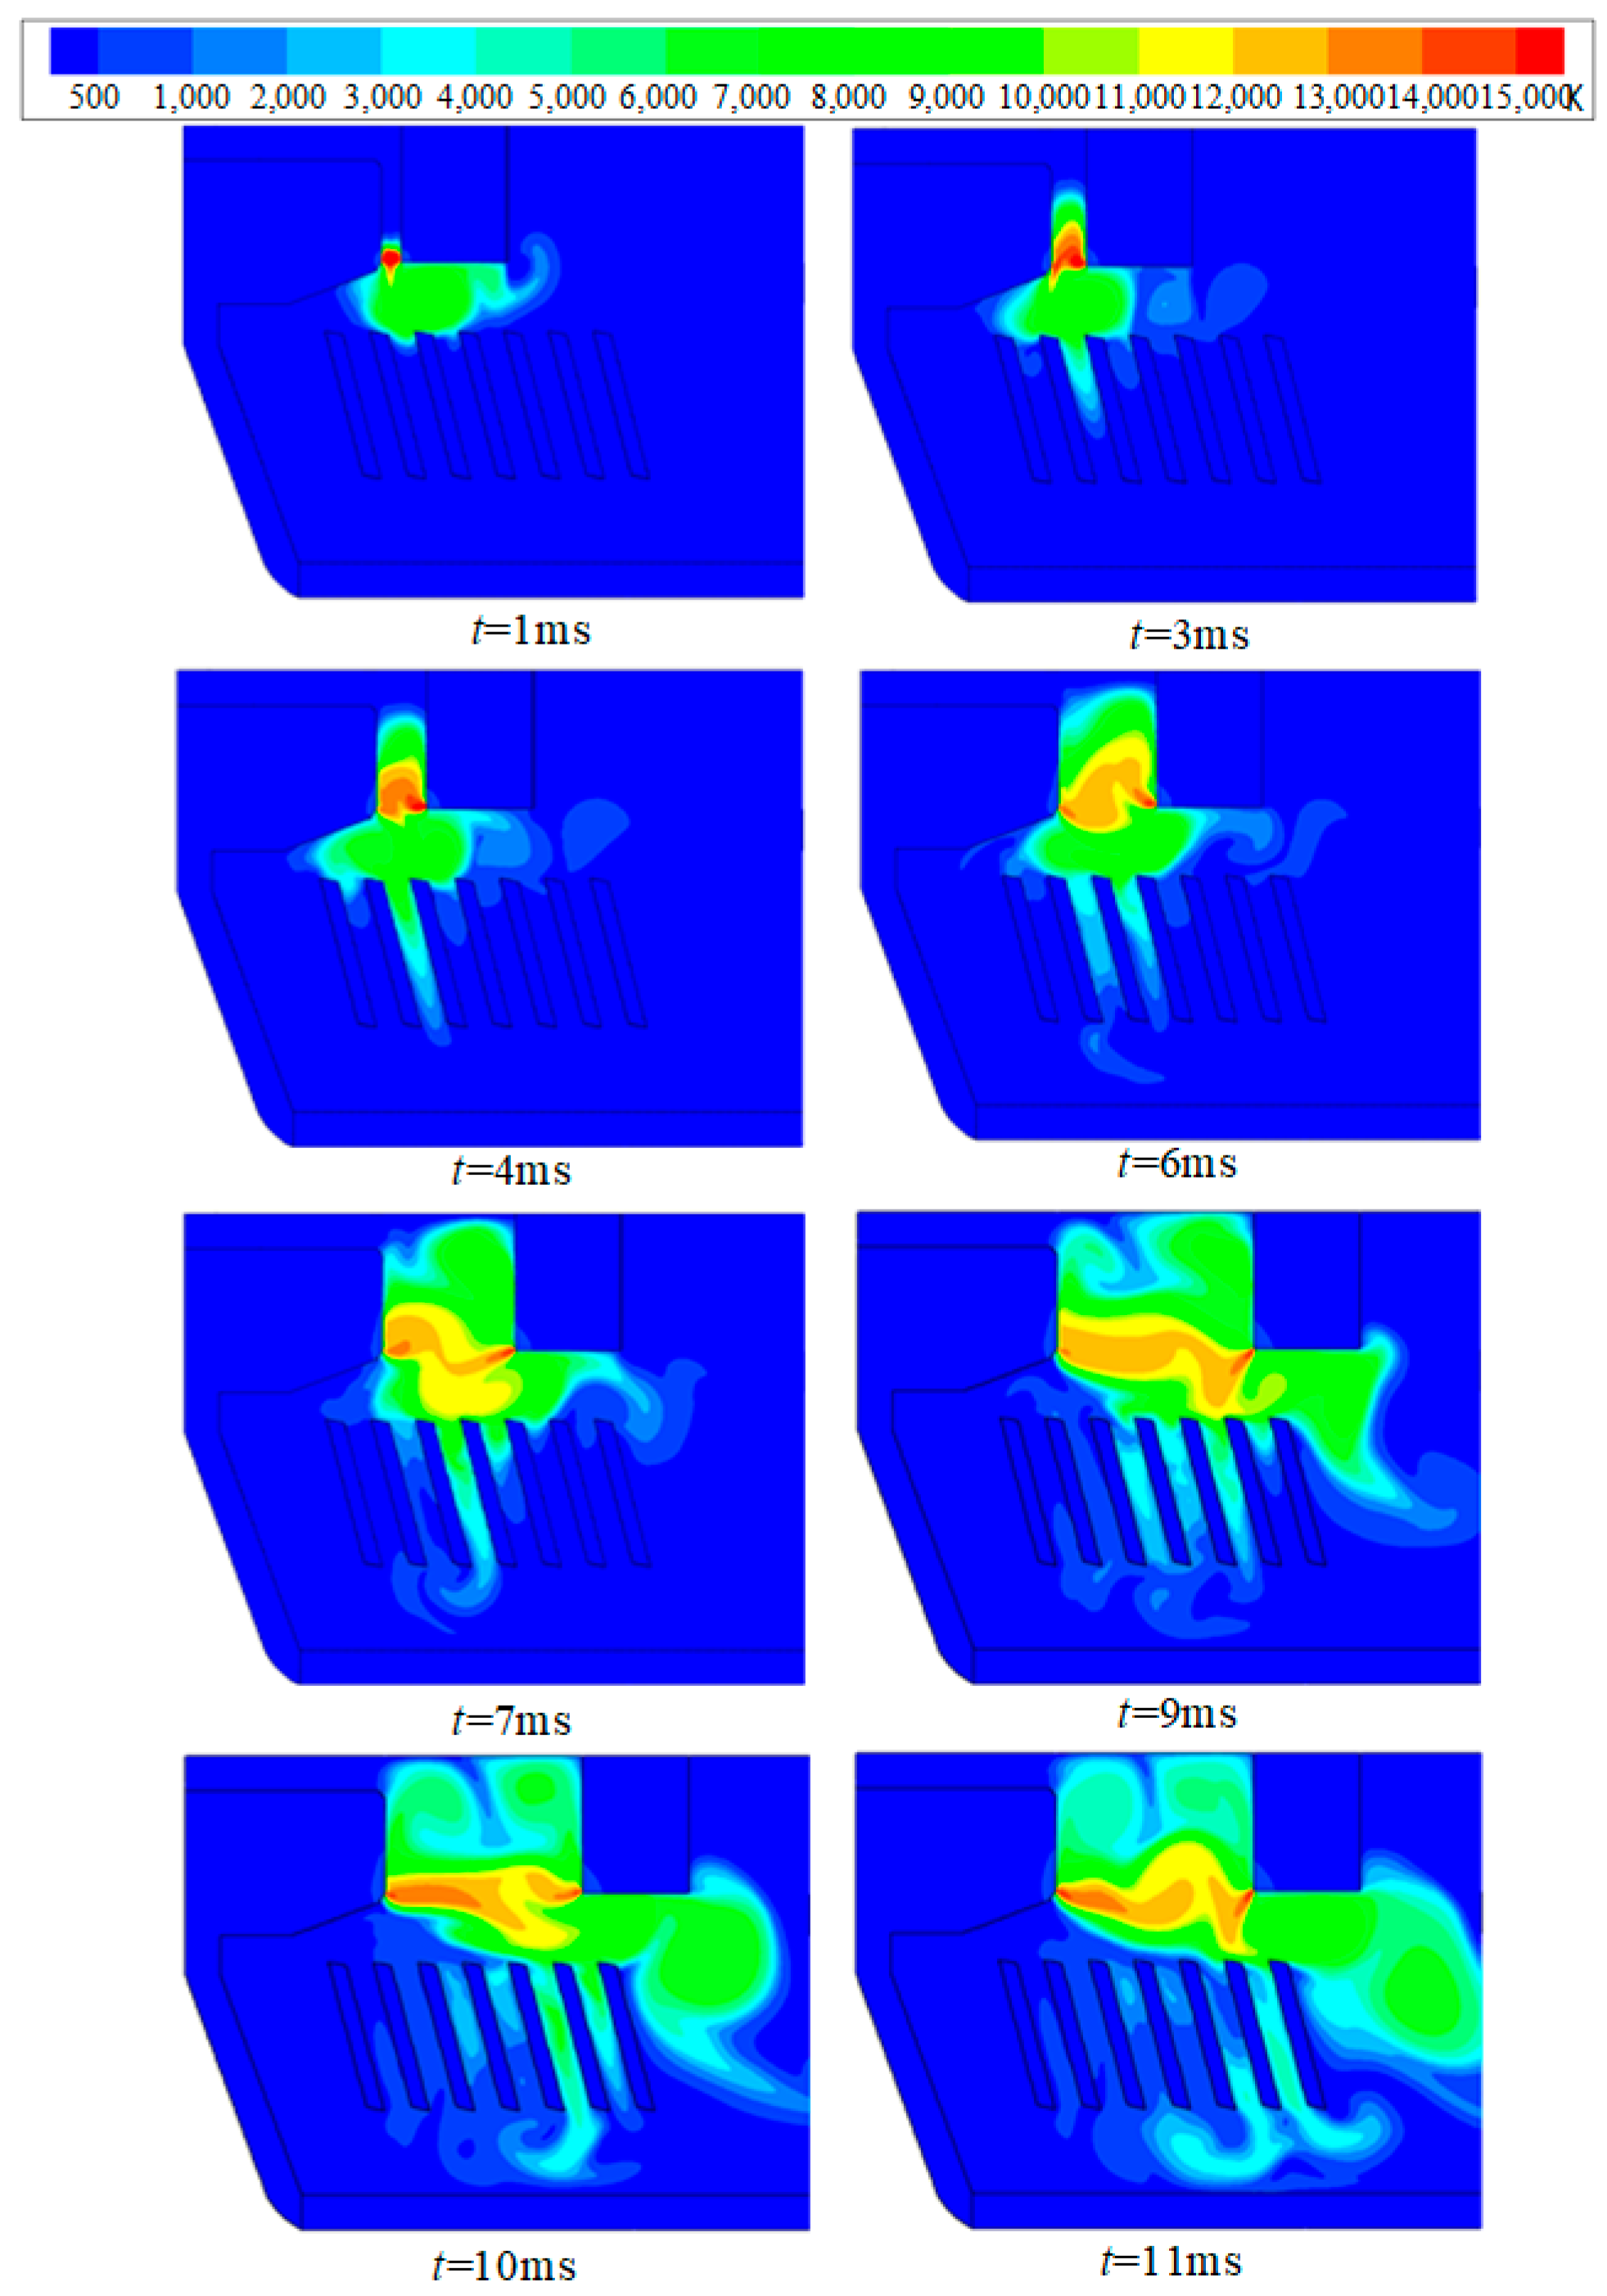
It can be seen from the arc evolution characteristics that the lower utilization rate of splitter plates leads to lower arc voltage, which makes it difficult to extinguish the DC arc. Therefore, the dynamic and static contact structure will be redesigned and the break length will be increased in order to realize the interruption of the DC arc.
(3)
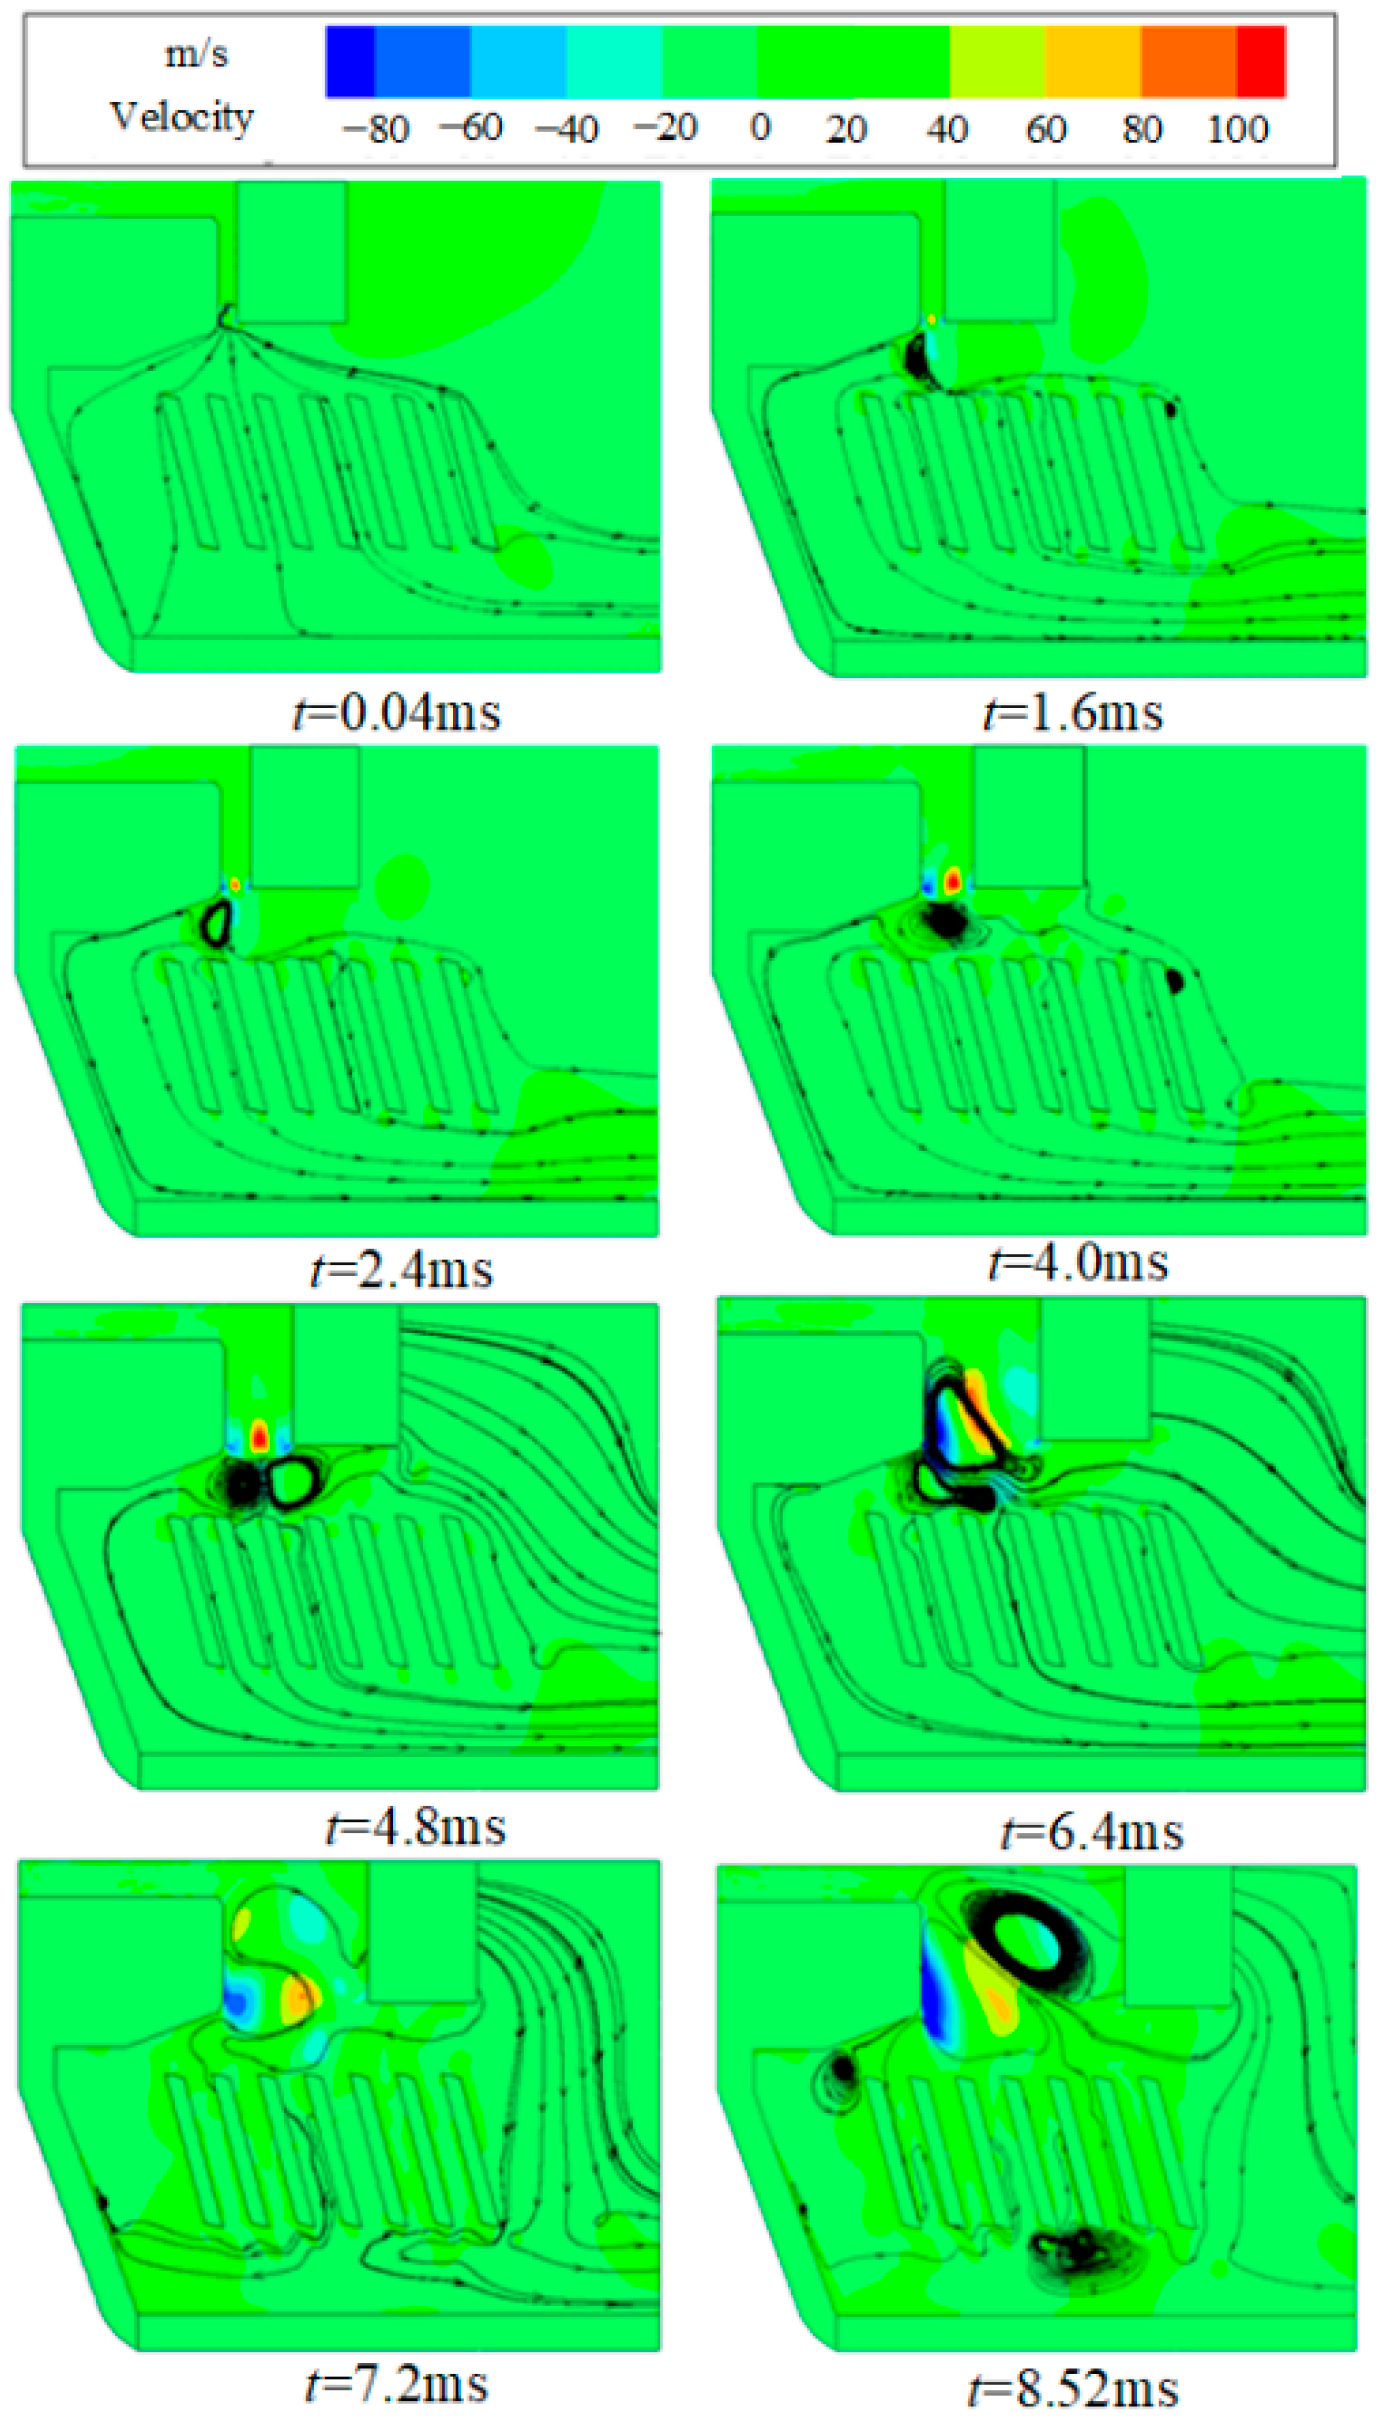
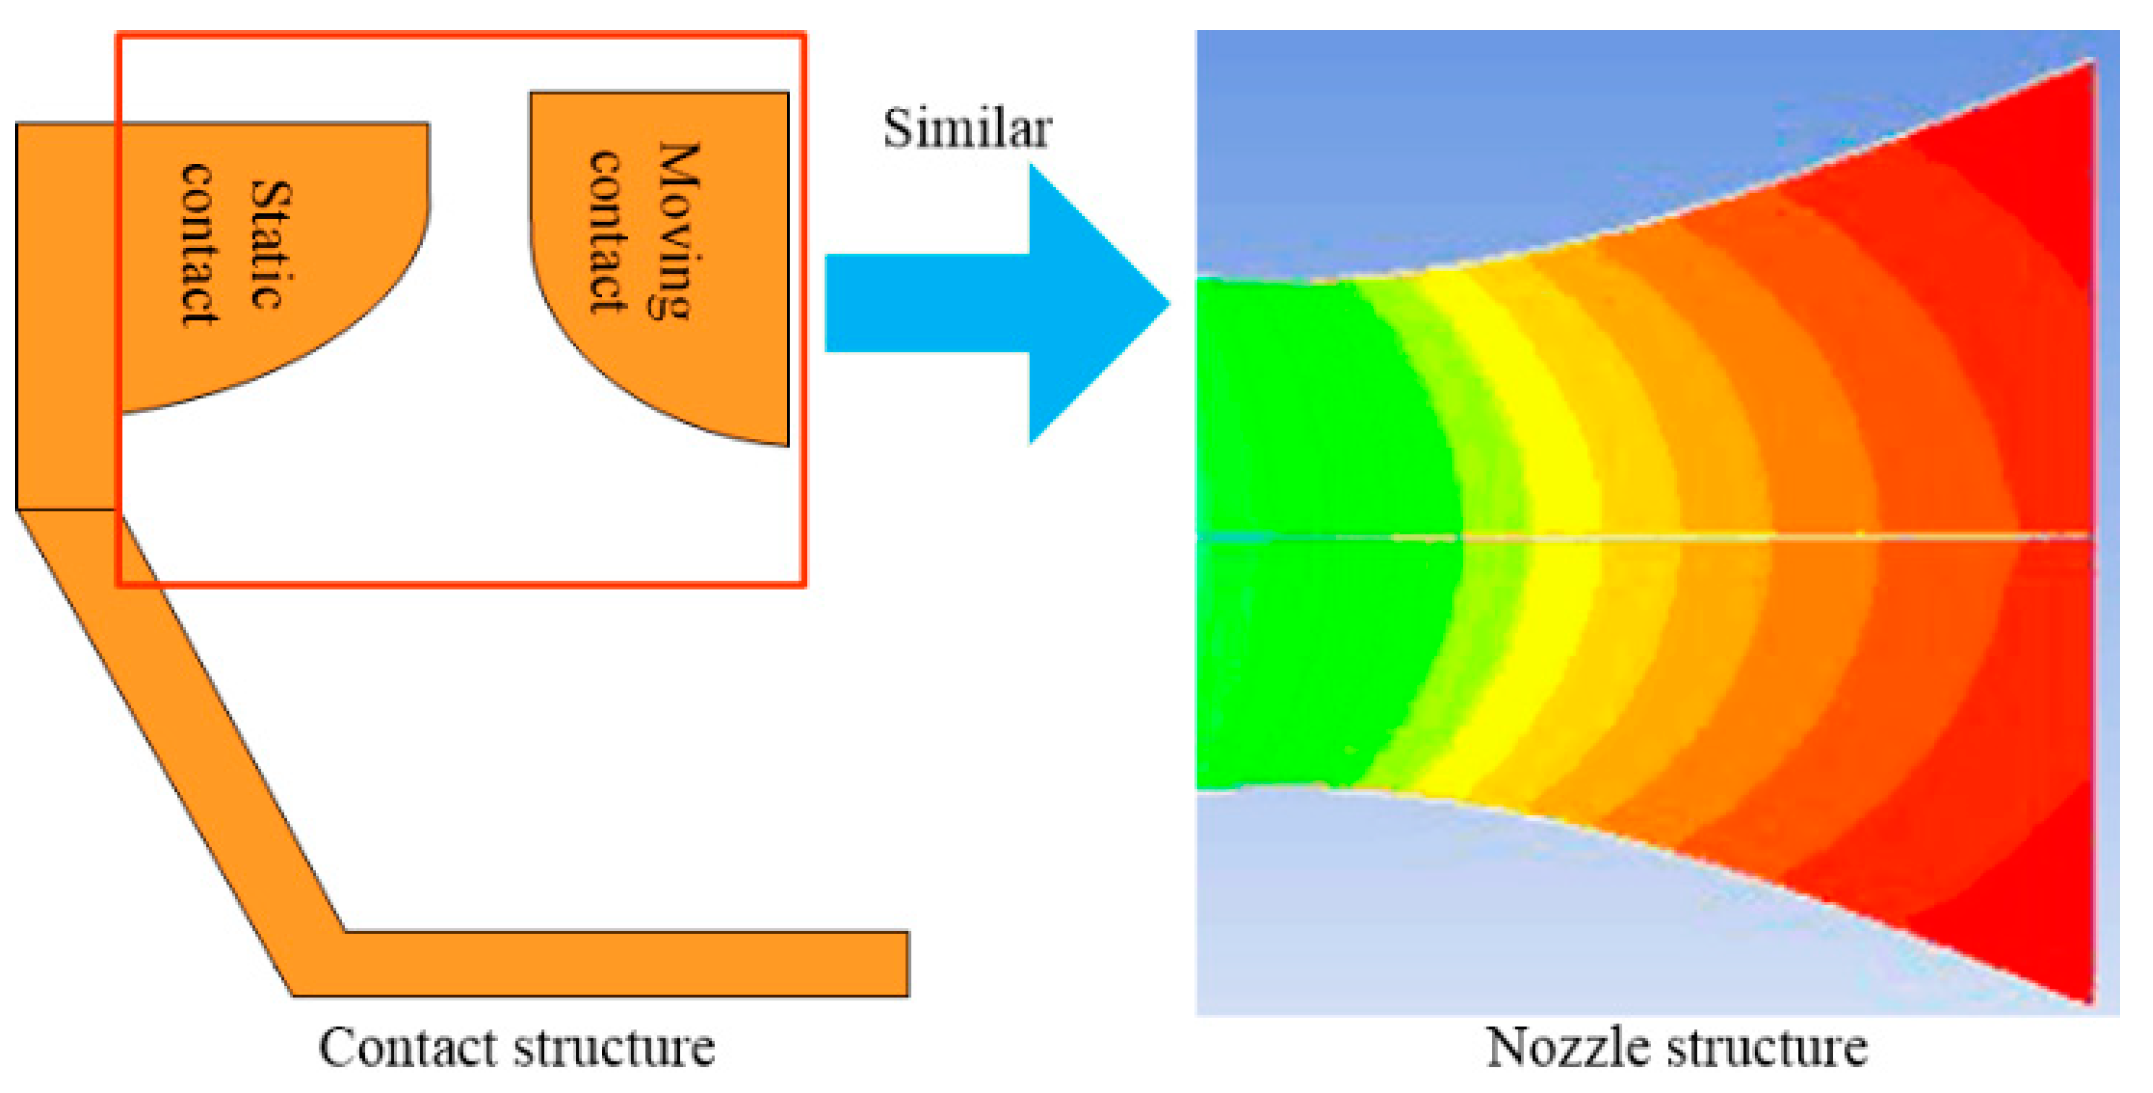
The dynamic and static contact structure can be designed as a nozzle structure to accelerate the airflow and reduce air vortices in order to achieve the rapid extinguishment of the DC high-voltage arc.
(4)
The arc simulation model established in this paper can be extended and applied to analyze the arc characteristics of other gas switching, and it is expected to provide theoretical guidance for the optimal design of switching appliances.
(5)
The breakdown phenomenon cannot be considered in the method proposed in this paper. This work will be researched in future work.

Author Contributions

Data curation, S.Y. and X.L.; Formal analysis, J.Y.; Funding acquisition, J.Y. and S.G.; Investigation, S.Y.; Methodology, X.L.; Project administration, J.Y., S.G. and C.L.; Resources, S.G.; Software, S.Y.; Writing—original draft, J.Y.; Writing—review & editing, S.Y. and C.L. All authors have read and agreed to the published version of the manuscript.

Funding

This work is supported by the National Natural Science Foundation of China (NSFC) (52107167), China Postdoctoral Science Foundation (2021M692877), Basic Research Program of Natural Science in Shaanxi Province (2021JQ-473), Scientific Research Projects of Education Department of Shaanxi Provincial Government (21JK0788), Research Fund of Xi’an University and Technology (104–451119032).

Informed Consent Statement

Informed consent was obtained from all subjects involved in the study.

Data Availability Statement

Not applicable.

Conflicts of Interest

The authors declare no conflict of interest.

References

  1. Yuan, Z.; Guo, P.; Liu, G.; Zhao, Y. Review on control and protection for renewable energy integration through VSC-HVDC. High Volt. Eng. 2020, 46, 1473–1488. [Google Scholar]
  2. Hua, Y.; Wang, N.; Zhao, K. Simultaneous Unknown Input and State Estimation for the Linear System with a Rank-Deficient Distribution Matrix. Math. Probl. Eng. 2021, 2021, 6693690. [Google Scholar] [CrossRef]
  3. Liu, C.; Zhang, Y.; Sun, J.; Cui, Z.; Wang, K. Stacked bidirectional LSTM RNN to evaluate the remaining useful life of supercapacitor. Int. J. Energy Res. 2021, 1–10. [Google Scholar] [CrossRef]
  4. Xingwen, L.; Shenli, J.; Boya, Z. Research and application on physical farameters calculation and behavior simulation of gas switching arc. High Volt. Eng. 2020, 46, 757–771. [Google Scholar]
  5. Liu, C.; Li, Q.; Wang, K. State-of-charge estimation and remaining useful life prediction of supercapacitors. Renew. Sustain. Energy Rev. 2021, 150, 111408. [Google Scholar] [CrossRef]
  6. Wang, K.; Liu, C.; Sun, J.; Zhao, K.; Wang, L.; Song, J.; Duan, C.; Li, L. State of Charge Estimation of Composite Energy Storage Systems with Supercapacitors and Lithium Batteries. Complexity 2021, 2021, 8816250. [Google Scholar] [CrossRef]
  7. Artale, G.; Caravello, G.; Cataliotti, A.; Cosentino, V.; Di Cara, D.; Guaiana, S.; Panzavecchia, N.; Tinè, G. Characterization of DC series arc faults in PV systems based on current low frequency spectral analysis. Measurement 2021, 5, 109770. [Google Scholar] [CrossRef]
  8. Sun, L.; Wu, H.; Lu, X. Study on the Feature Space Detection Method of DC Arc Fault for Photovoltaic system. E3S Web Conf. 2021, 256, 01015. [Google Scholar] [CrossRef]
  9. Kim, H. Aging Characteristics of Contact Electrodes of Low Voltage DC Switches. Energies 2021, 14, 6838. [Google Scholar] [CrossRef]
  10. Hashemi, E.; Niayesh, K. DC Current Interruption Based on Vacuum Arc Impacted by Ultra-Fast Transverse Magnetic Field. Energies 2020, 13, 4644. [Google Scholar] [CrossRef]
  11. Yin, J.; Wang, Q.; Li, X.; Xu, H. Numerical Study of Influence of Frequency and Eddy Currents on Arc Motion in Low-Voltage Circuit Breaker. IEEE Trans. Compon. Packag. Manuf. Technol. 2018, 8, 1373–1380. [Google Scholar] [CrossRef]
  12. Yin, J.; Wang, Q.; Zhang, B.; Zhang, P.; Li, X. Effect of Frequency on Arc Motion in Multiple Parallel Contacts’ System. IEEE Trans. Plasma Sci. 2019, 47, 1957–1963. [Google Scholar] [CrossRef]
  13. Yin, J.; Liu, G.; Tang, F.; Lv, Q.; Li, X. Convection effect on an arc plasma evolution process in a two parallel contact system. Plasma Sci. Technol. 2020, 22, 045401. [Google Scholar] [CrossRef]
  14. Chong, N.I.; Xian, M.E.; Huang, H.; Tao, Z.H.; Surong, S.U.; Haixing, W.A. Numerical simulation of the effects of protrusion on DC arc anode attachment. Plasma Sci. Technol. 2021, 23, 104006. [Google Scholar]
  15. Yokomizu, Y.; Ueda, Y.; Matsumura, T.; Ichikawa, T.; Niwa, Y.; Sakaguchi, W. Electrode fall voltage of arc between deion plates during direct-current interruption period. J. Phys. D Appl. Phys. 2017, 50, 265601. [Google Scholar] [CrossRef]
  16. Chen, Y.; Wang, Y.; Silaen, A.K.; Zhou, C.Q. Numerical Investigation of DC Electric Arc Behavior Under the Consideration of Electrode Movement; AISTech: Cleveland, OH, USA, 2021. [Google Scholar]
  17. Tsusaka, A.; Hasegawa, K.; Matsumura, T.; Yukita, K.; Goto, Y.; Miyamoto, A.; Ito, H.; Yokomizu, Y. A study on estimation of arc parameters for low voltage DC arc breaking process. In Proceedings of the 2019 IEEE Third International Conference on DC Microgrids (ICDCM), Matsue, Japan, 20–23 May 2019; pp. 1–6. [Google Scholar] [CrossRef]
  18. Wang, G.; Wang, Y.; Zhang, L.; Xue, S.; Dong, E.; Zou, J. A Novel Model of Electromechanical Contactors for Predicting Dynamic Characteristics. Energies 2021, 14, 7466. [Google Scholar] [CrossRef]
  19. Smugala, D.; Bonk, M. Study of Arc Parameters of AC Relays Operating under Distorted Supply Voltage Conditions. Energies 2020, 13, 4785. [Google Scholar] [CrossRef]
  20. Najam, A.; Pieterse, P.; Uhrlandt, D. Electrical Modelling of Switching Arcs in a Low Voltage Relay at Low Currents. Energies 2020, 13, 6377. [Google Scholar] [CrossRef]
  21. Kim, W.; Kim, Y.-J.; Kim, H. Arc Voltage and Current Characteristics in Low-Voltage Direct Current. Energies 2018, 11, 2511. [Google Scholar] [CrossRef] [Green Version]
  22. Lindmayer, M. Simulation of Switching Arcs Under Transverse Magnetic Fields for DC Interruption. IEEE Trans. Plasma Sci. 2016, 44, 187–194. [Google Scholar] [CrossRef]
  23. Lindmayer, M. Cooling Mechanisms of Switching Arcs Under Transverse Magnetic Fields in Comparison with Arcs without Magnetic Blast. IEEE Trans. Plasma Sci. 2018, 46, 444–450. [Google Scholar] [CrossRef]
  24. Islam, A.; Birtwhistle, D.; Saha, T.K.; Islam, M.S. Interruption of low-voltage DC arc in air under axial magnetic field. IEEE Trans. Power Deliv. 2020, 35, 977–986. [Google Scholar] [CrossRef]
  25. Murphy, A. Transport coefficients of air, argon-air, nitrogen-air, and oxygen-air plasmas. Plasma Chem. Plasma Process. 1995, 15, 279–307. [Google Scholar] [CrossRef]
  26. Sun, H.; Wu, Y.; Tanaka, Y.; Tomita, K.; Rong, M. Investigation on chemically non-equilibrium arc behaviors of different gas media during arc decay phase in a model circuit breaker. J. Phys. D Appl. Phys. 2019, 52, 075202. [Google Scholar] [CrossRef]
  27. Nan, Y.; Wang, L.; Zhu, J.; Deng, Y.; Liu, F.; Yin, J.; Tian, T.; Li, X. Analysis of interruption characteristics of DC miniature circuit breaker with different structures. In Proceedings of the 2019 IEEE Holm Conference on Electrical Contacts 2019, Milwaukee, WI, USA, 14–18 September 2019. [Google Scholar] [CrossRef]
  28. Yin, J.; Wang, Q.; Li, X.; Tian, T.; Liu, H. Experimental evaluation of outgassing characteristics of polymers on air arc behavior. In Proceedings of the 2020 IEEE 66th Holm Conference on Electrical Contacts and Intensive Course (HLM), San Antonio, TX, USA, 30 September–7 October 2020; pp. 15–19. [Google Scholar] [CrossRef]
Figure 1. Arc-extinguishing chamber structure of disconnector.
Machines 10 00006 g001
Figure 2. Simulation model.
Machines 10 00006 g002
Figure 3. Temperature distribution.
Machines 10 00006 g003
Figure 4. Pressure distribution.
Machines 10 00006 g004
Figure 5. Velocity distribution.
Machines 10 00006 g005
Figure 6. Arc current curve.
Machines 10 00006 g006
Figure 7. Arc voltage curve.
Machines 10 00006 g007
Figure 8. Temperature distribution of arc (DC 1500 V).
Machines 10 00006 g008
Figure 9. Pressure distribution of arc chamber (DC 1500 V).
Machines 10 00006 g009
Figure 10. Velocity distribution (DC 1500 V).
Machines 10 00006 g010
Figure 11. Arc current curve (DC 1500 V).
Machines 10 00006 g011
Figure 12. Arc voltage curve (DC 1500 V).
Machines 10 00006 g012
Figure 13. Temperature distribution of arc (DC 1500 V, I = 800 A).
Machines 10 00006 g013
Figure 14. Arc current curve (DC 1500 V, I = 800 A).
Machines 10 00006 g014
Figure 15. Improved contact structure for DC arcs.
Machines 10 00006 g015
Publisher’s Note: MDPI stays neutral with regard to jurisdictional claims in published maps and institutional affiliations.

