
The Influence of the Material Type and the Placement in the Print Chamber on the Roughness of MJF-Printed 3D Objects


Abstract
:1. Introduction
2. Materials and Methods
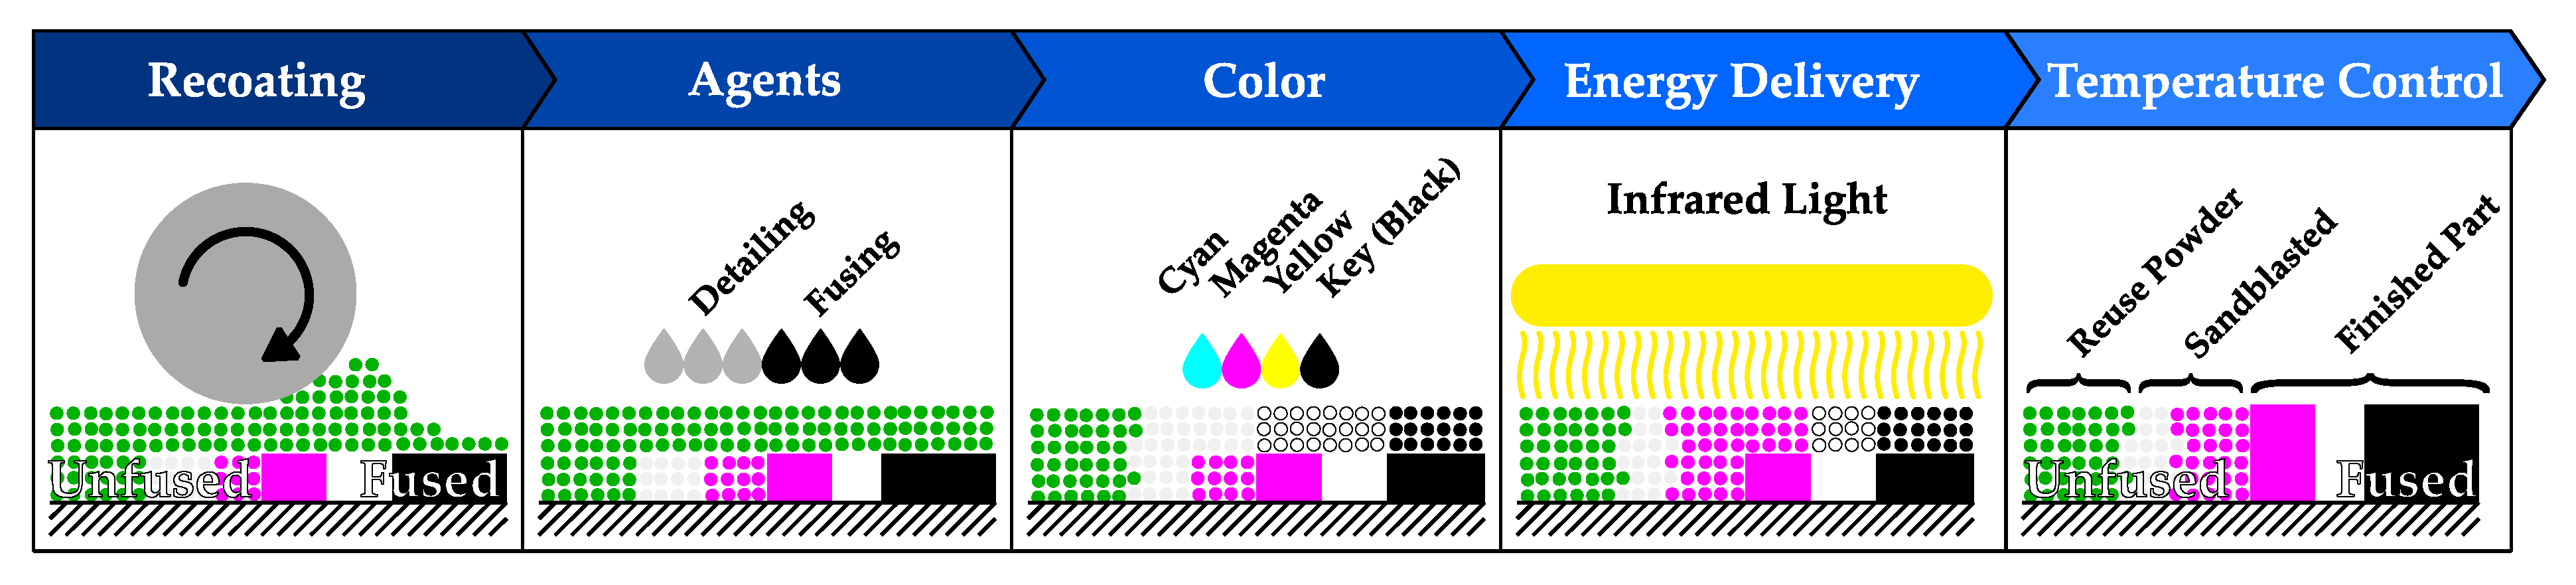
2.1. Print Method
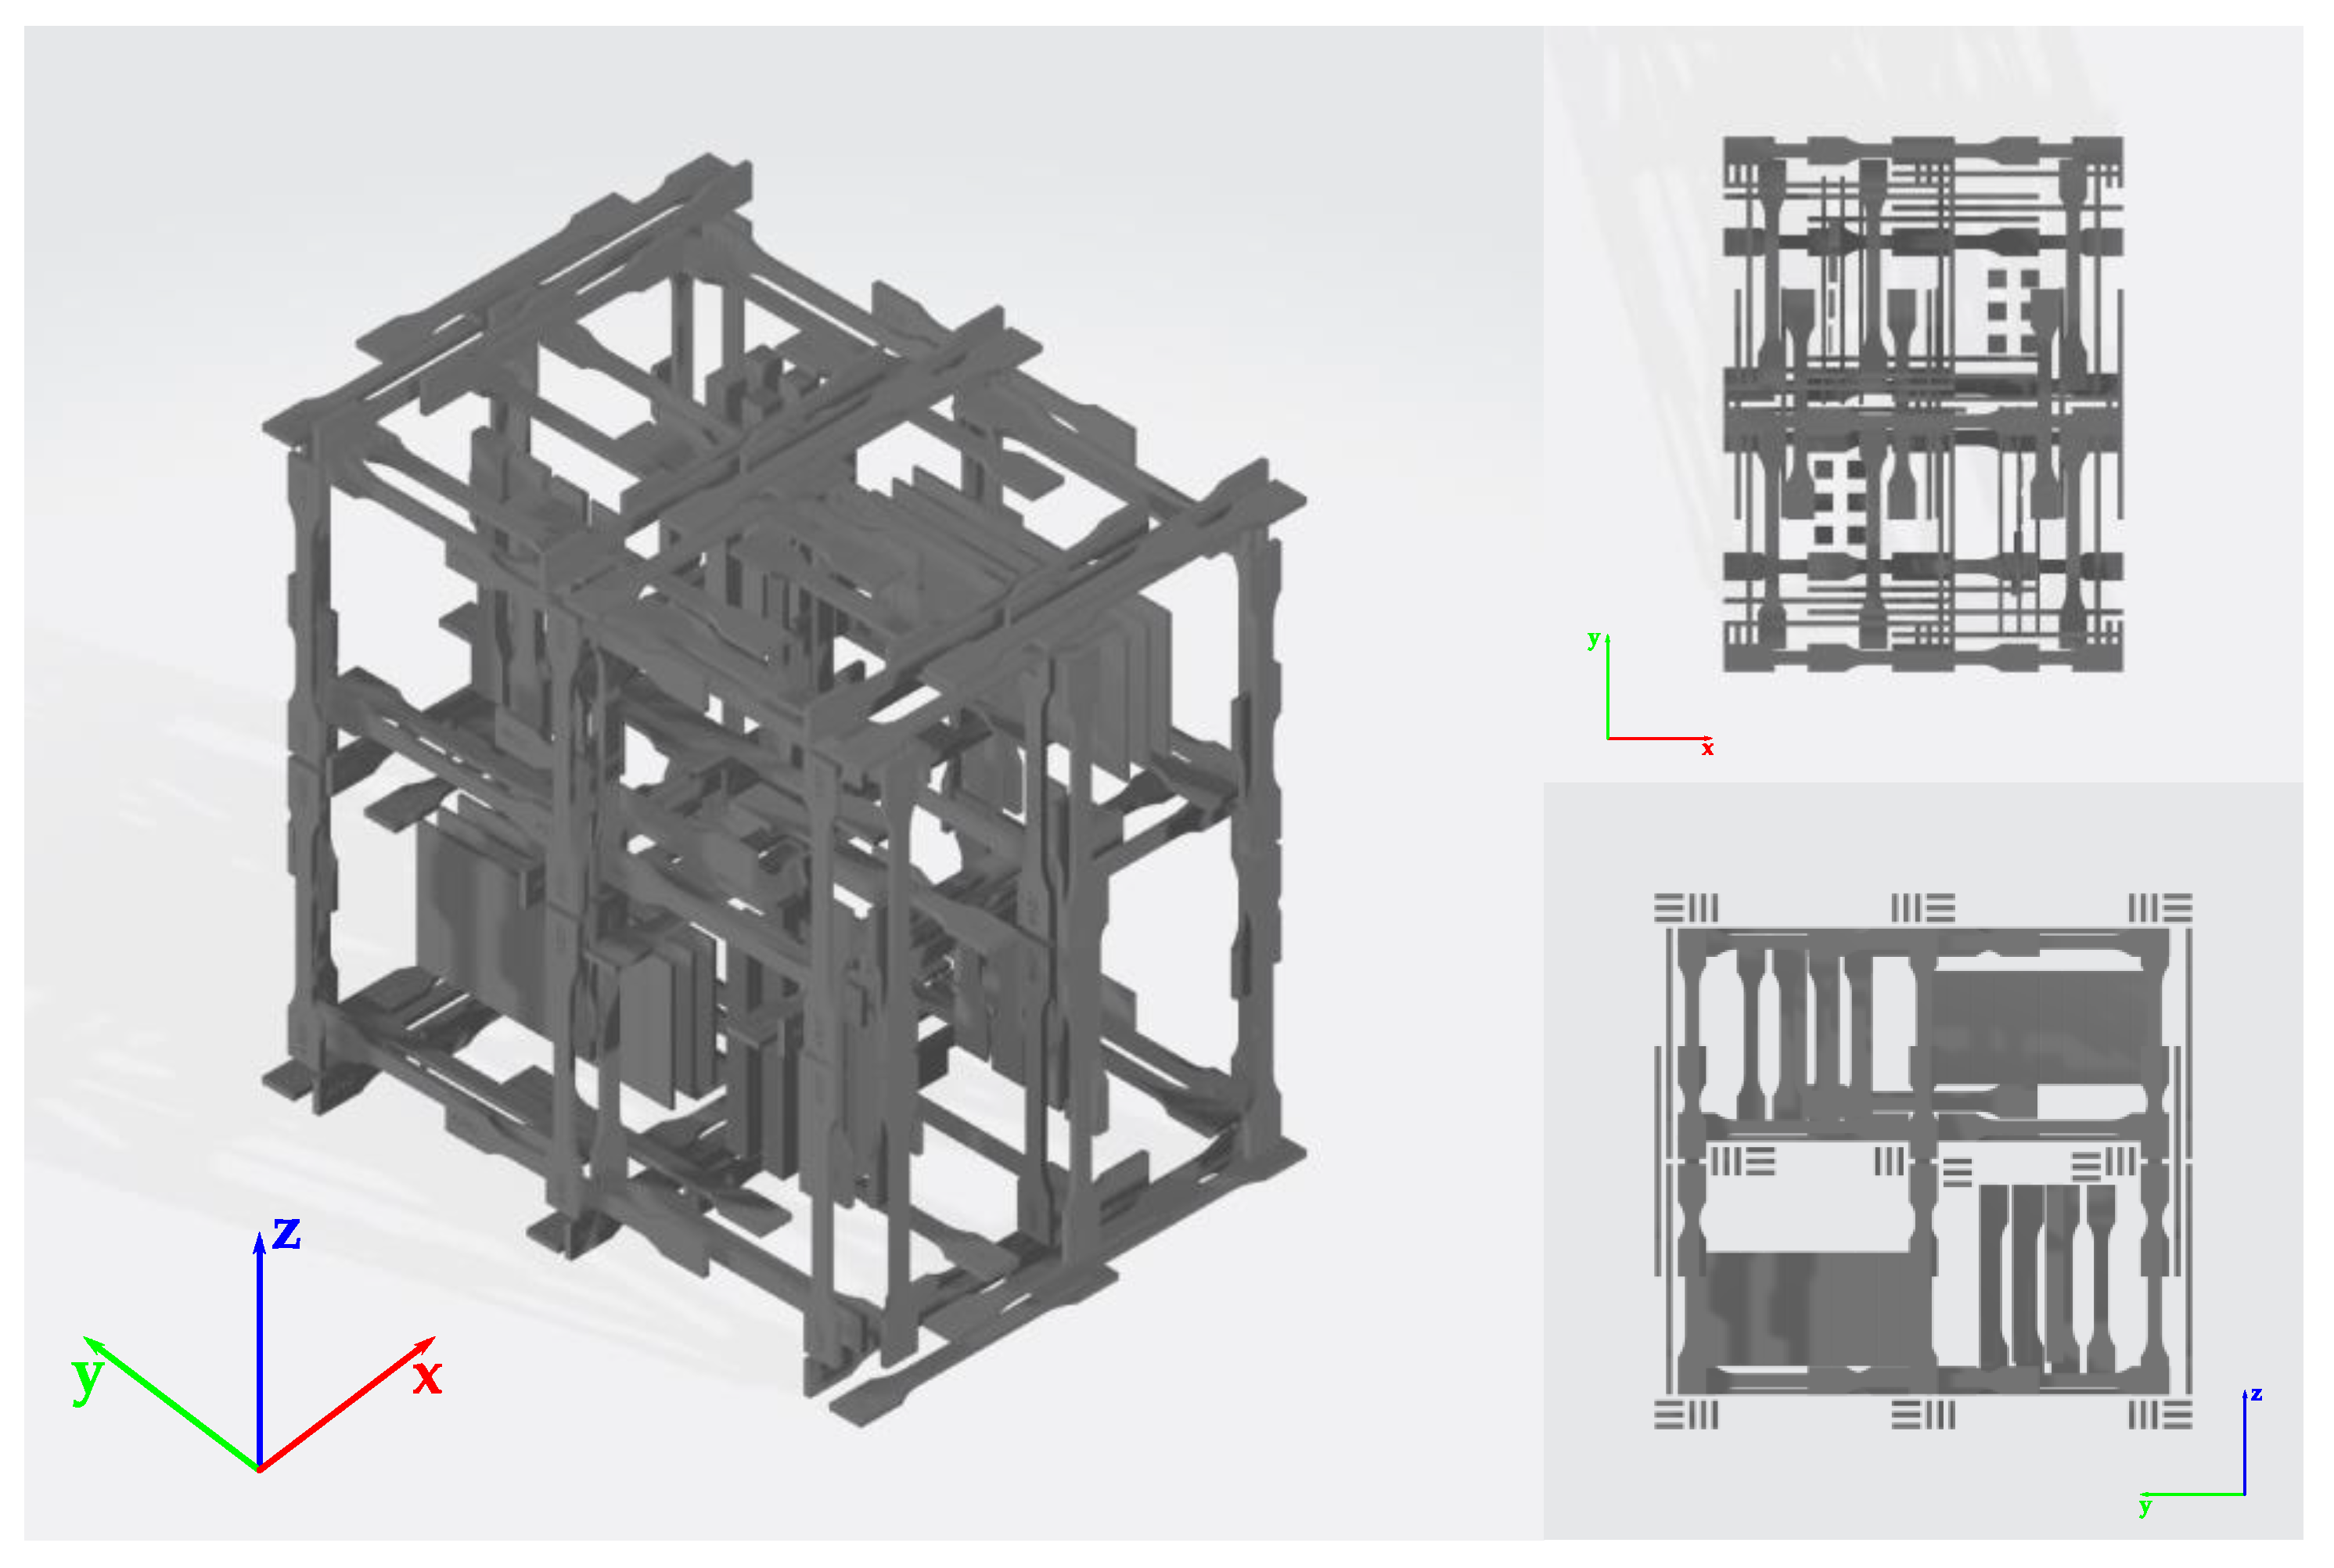
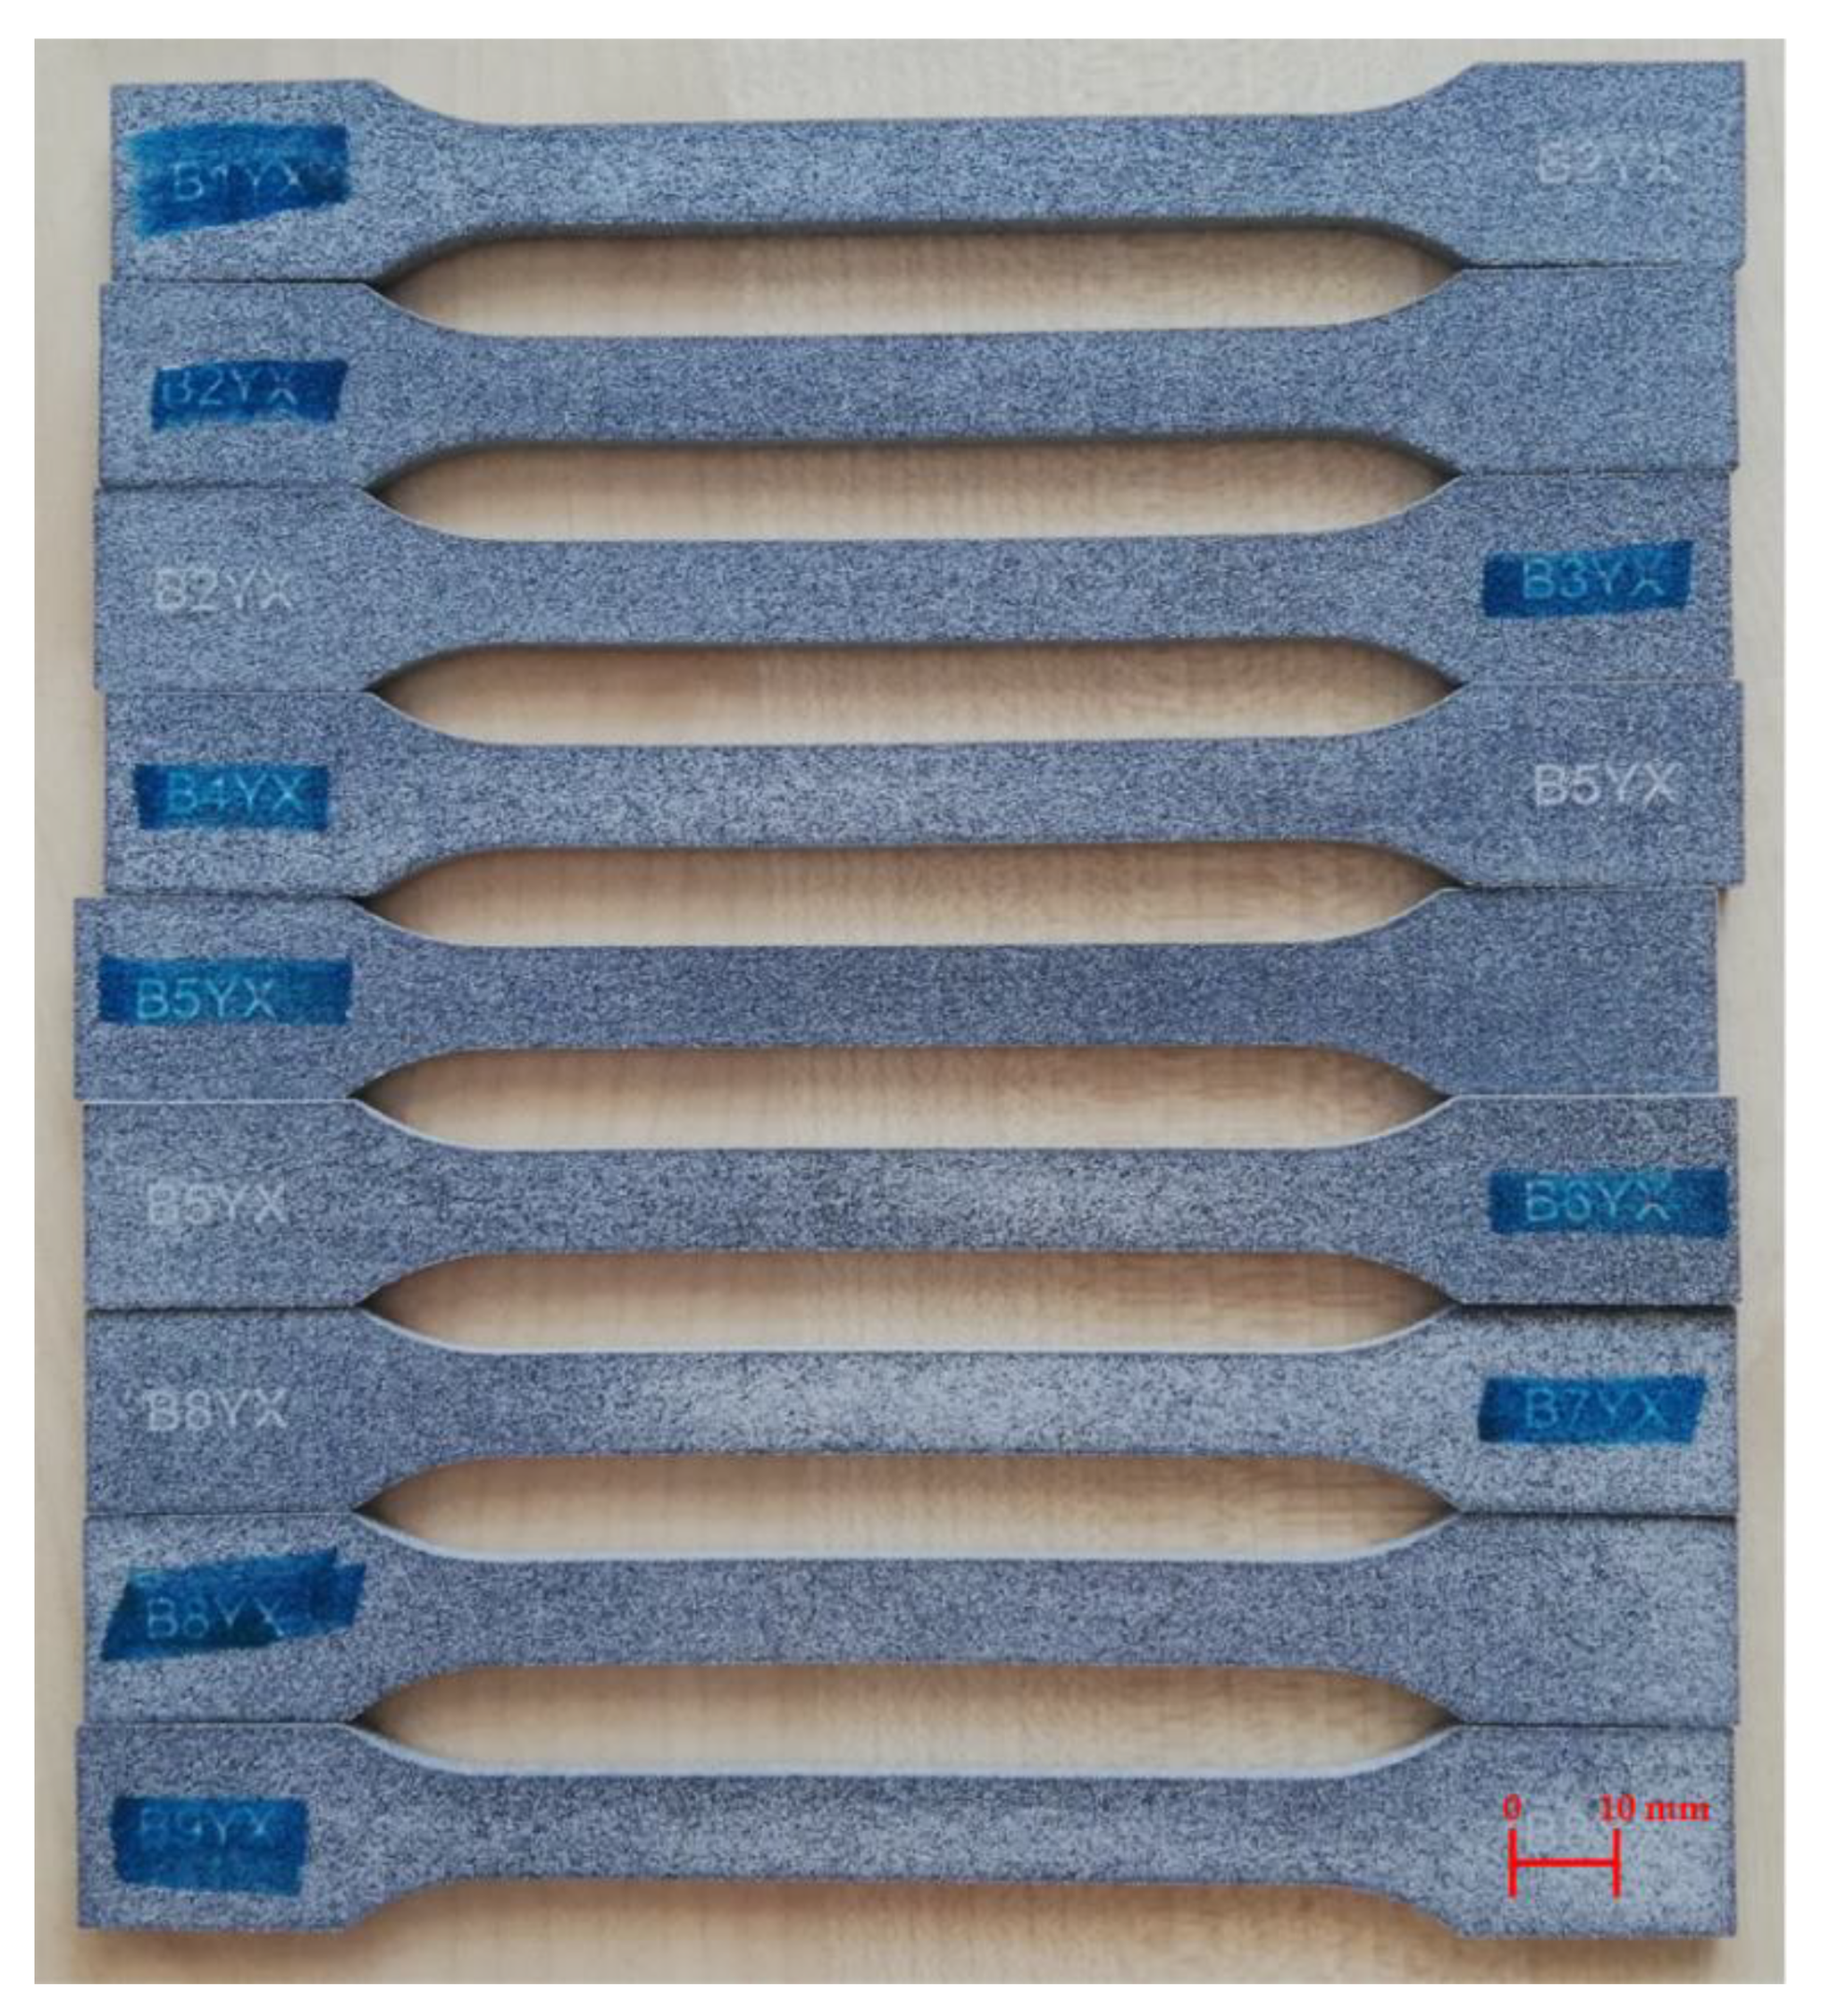
2.2. Samples
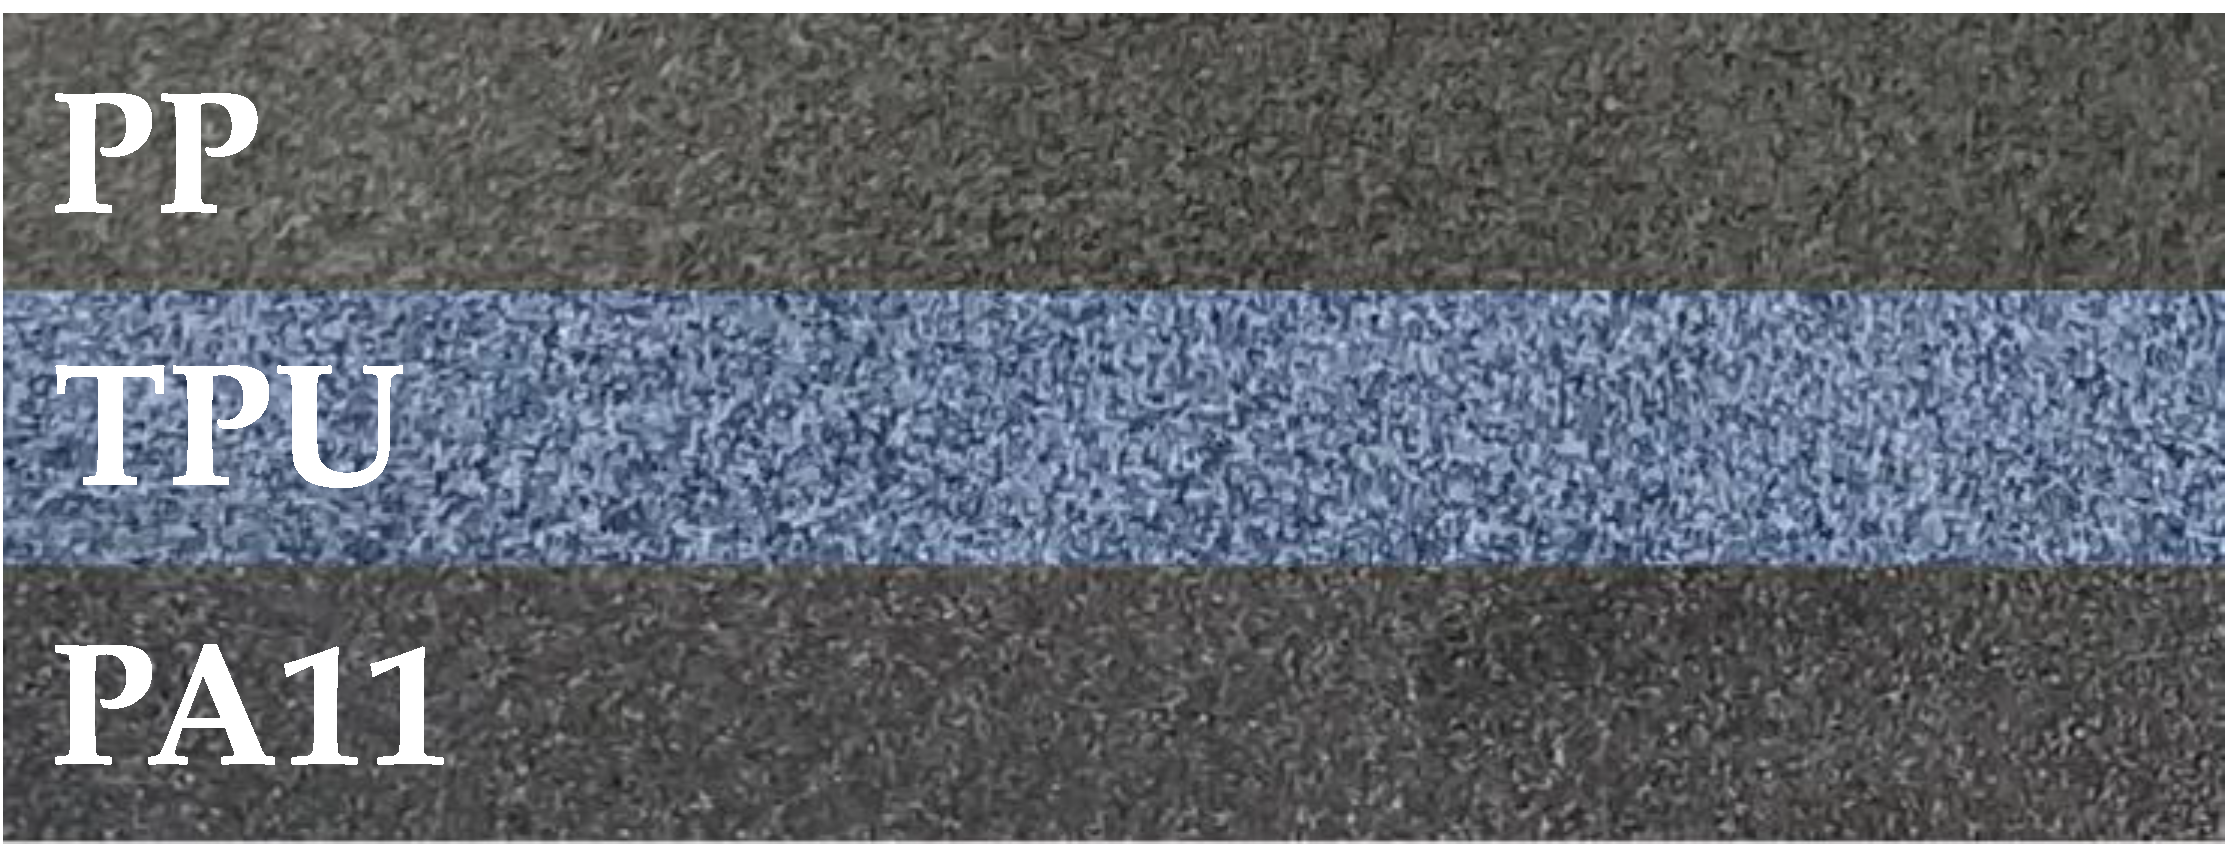
- PP (polypropylene);
- TPU (thermoplastic polyurethane);
- PA11 (polyamide 11).
2.3. Measurements
3. Results and Discussion
4. Conclusions
Funding
Institutional Review Board Statement
Informed Consent Statement
Data Availability Statement
Acknowledgments
Conflicts of Interest
References
- Shahrubudin, N.; Lee, T.C.; Ramlan, R. An overview on 3D printing technology: Technological, materials, and applications. Procedia Manuf. 2019, 35, 1286–1296. [Google Scholar] [CrossRef]
- AL-Hasni, S.; Santori, G. 3D printing of vacuum and pressure tight polymer vessels for thermally driven chillers and heat pumps. Vacuum 2020, 171, 109017. [Google Scholar] [CrossRef]
- Tanikella, N.G.; Wittbrodt, B.; Pearce, J.M. Tensile strength of commercial polymer materials for fused filament fabrication 3D printing. Addit. Manuf. 2017, 15, 40–47. [Google Scholar] [CrossRef] [Green Version]
- Nagendra, J.; Srinath, M.K.; Sujeeth, S.; Naresh, K.S.; Prasad, M.S.G. Optimization of process parameters and evaluation of surface roughness for 3D printed nylon-aramid composite. Mater. Today Proc. 2021, 44, 674–682. [Google Scholar] [CrossRef]
- Msallem, B.; Sharma, N.; Cao, S.; Halbeisen, F.S.; Zeilhofer, H.F.; Thieringer, F.M. Evaluation of the dimensional accuracy of 3D-printed anatomical mandibular models using FFF, SLA, SLS, MJ, and BJ printing technology. J. Clin. Med. 2020, 9, 817. [Google Scholar] [CrossRef] [PubMed] [Green Version]
- Gadagi, B.; Lekurwale, R. A review on advances in 3D metal printing. Mater. Today Proc. 2021, 45, 277–283. [Google Scholar] [CrossRef]
- Murphy, S.V.; Atala, A. 3D bioprinting of tissues and organs. Nat. Biotechnol. 2014, 32, 773–785. [Google Scholar] [CrossRef] [PubMed]
- Goh, G.L.; Zhang, H.; Chong, T.H.; Yeong, W.Y. 3D printing of multilayered and multimaterial electronics: A review. Adv. Electron. Mater. 2021, 7, 2100445. [Google Scholar] [CrossRef]
- Ngo, T.D.; Kashani, A.; Imbalzano, G.; Nguyen, K.T.Q.; Hui, D. Additive manufacturing (3D printing): A review of materials, methods, applications and challenges. Compos. Part B Eng. 2018, 143, 172–196. [Google Scholar] [CrossRef]
- Yang, F.; Zhang, M.; Bhandari, B. Recent development in 3D food printing. Crit. Rev. Food Sci. Nutr. 2017, 57, 3145–3153. [Google Scholar] [CrossRef]
- Jucan, O.D.; Gădălean, R.V.; Chicinaş, H.F.; Hering, M.; Bâlc, N.; Popa, C.O. Study on the indirect selective laser sintering (SLS) of WC-Co/PA12 powders for the manufacturing of cemented carbide parts. Int. J. Refract. Hard. Met. 2021, 96, 105498. [Google Scholar] [CrossRef]
- Wiese, M.; Leiden, A.; Rogall, C.; Thiede, S.; Herrmann, C. Modeling energy and resource use in additive manufacturing of automotive series parts with multi-jet fusion and selective laser sintering. Procedia CIRP 2021, 98, 358–363. [Google Scholar] [CrossRef]
- Rosso, S.; Meneghello, R.; Biasetto, L.; Grigolato, L.; Concheri, G.; Savio, G. In-depth comparison of polyamide 12 parts manufactured by Multi Jet Fusion and Selective Laser Sintering. Addit. Manuf. 2020, 36, 101713. [Google Scholar] [CrossRef]
- Packard, H. A Disruptive 3D Printing Technology for a New Era of Manufacturing. Available online: https://www.cloudpapers.com/a-disruptive-3d-printing-technology-for-a-new-era-of-manufacturing/ (accessed on 3 January 2022).
- Morales-Planas, S.; Minguella-Canela, J.; Lluma-Fuentes, J.; Travieso-Rodriguez, J.A.; García-Granada, A.A. Multi Jet Fusion PA12 manufacturing parameters for watertightness, strength and tolerances. Materials 2018, 11, 1472. [Google Scholar] [CrossRef] [PubMed] [Green Version]
- Cha, Y.H.; Lee, K.H.; Ryu, H.J.; Joo, I.W.; Seo, A.; Kim, D.H.; Kim, S.J. Ankle-foot orthosis made by 3D printing technique and automated design software. Appl. Bionics Biomech. 2017, 2017, 9610468. [Google Scholar] [CrossRef] [Green Version]
- Dal Maso, A.; Cosmi, F. 3D-printed ankle-foot orthosis: A design method. Mater. Today Proc. 2019, 12, 252–261. [Google Scholar] [CrossRef]
- Cai, C.; Tey, W.S.; Chen, J.; Zhu, W.; Liu, X.; Liu, T.; Zhao, L.; Zhou, K. Comparative study on 3D printing of polyamide 12 by selective laser sintering and multi jet fusion. J. Mater. Process. Technol. 2021, 288, 116882. [Google Scholar] [CrossRef]
- Jeon, J.M.; Park, S.J.; Choi, T.R.; Park, J.H.; Yang, Y.H.; Yoon, J.J. Biodegradation of polyethylene and polypropylene by Lysinibacillus species JJY0216 isolated from soil grove. Polym. Degrad. Stab. 2021, 191, 109662. [Google Scholar] [CrossRef]
- Liu, L.C.; Liang, W.C.; Chen, C.M. Manufacture of recyclable thermoplastic polyurethane (TPU)/Silicone blends and their mechanical properties. Manuf. Lett. 2021, 31, 1–5. [Google Scholar] [CrossRef]
- Nagasundaram, N.; Devi, R.S.; Rajkumar, M.K.; Sakthivelrajan, K.; Arravind, R. Experimental investigation of injection moulding using thermoplastic polyurethane. Mater. Today Proc. 2021, 45, 2286–2288. [Google Scholar] [CrossRef]
- Esposito, G.R.; Dingemans, T.J.; Pearson, R.A. Changes in Polyamide 11 Microstructure and Chemistry During Selective Laser Sintering. Addit. Manuf. 2021, 102445. [Google Scholar] [CrossRef]
- Pandelidi, C.; Lee, K.P.M.; Kajtaz, M. Effects of polyamide-11 powder refresh ratios in multi-jet fusion: A comparison of new and used powder. Addit. Manuf. 2021, 40, 101933. [Google Scholar] [CrossRef]
- Sagbas, B.; Gümüş, B.E.; Kahraman, Y.; Dowling, D.P. Impact of print bed build location on the dimensional accuracy and surface quality of parts printed by multi jet fusion. J. Manuf. Process. 2021, 70, 290–299. [Google Scholar] [CrossRef]
- ISO 527-1:2019; Plastics—Determination of Tensile Properties—Part 1: General Principles. International Organization for Standardization: Geneva, Switzerland, 2019.
- Mitutoyo. Dual-Purpose Measurement and Powerful Analysis of Surface Roughness and Contour Combined with High Accuracy, High Drive Speed and Simplified CNC Measurement; Surface Roughness/Contour Measuring System Formtracer SV-C3200/4500 Series; Bulletin No. 2195(2); Mitutoyo: Kawasaki, Japan, 2012; Available online: http://www.farnell.com/datasheets/1929584.pdf (accessed on 3 January 2022).
- ISO 4288:1996; Geometrical Product Specifications (GPS)—Surface Texture: Profile Method—Rules and Procedures for the Assessment of Surface Texture. International Organization for Standardization: Geneva, Switzerland, 1996.
- ISO 3274:1996; Geometrical Product Specifications (GPS)—Surface Texture: Profile Method—Nominal Characteristics of Contact (Stylus) Instruments. International Organization for Standardization: Geneva, Switzerland, 1996.
- Rahim, T.N.A.T.; Abdullah, A.M.; Akil, H.M.; Mohamad, D. Comparison of mechanical properties for polyamide 12 composite-based biomaterials fabricated by fused filament fabrication and injection molding. AIP Conf. Proc. 2016, 1791, 020007. [Google Scholar]
- Dzienniak, D.; Pawlik, J. Analysis of the surface quality of polycaprolactam 3D prints enriched with carbon and glass fiber. MATEC Web Conf. 2021, 338, 01005. [Google Scholar] [CrossRef]
- Lee, K.P.M.; Pandelidi, C.; Kajtaz, M. Build orientation effects on mechanical properties and porosity of polyamide-11 fabricated via multi jet fusion. Addit. Manuf. 2020, 36, 101533. [Google Scholar] [CrossRef]


| Parameter | Value |
|---|---|
| Maximum Build Volume | 332 × 190 × 248 mm3 (15.64 L) |
| Build Rate | 2340 cm3/h |
| Minimum Layer Height | 0.08 mm |
| Resolution | 1200 dpi |
| Parameter | Value |
|---|---|
| Measuring Force | 0.75 mN |
| Stylus Length | 5.2 mm |
| Tip Radius | 1 μm |
| Z1 Axis Measuring Range | 800 μm |
| Z1 Axis Resolution | 0.01 μm |
| Parameter | Value |
|---|---|
| Measurement Length | 48 mm |
| Evaluation Length | 40 mm |
| Sample Length | 8 mm |
| Step Size | 5 μm |
| Stylus Travel Speed | 2 mm/s |
| Processing Type | Expected Ra Value (μm) |
|---|---|
| FDM 3D printing (PA6) | 18–30 |
| UV 3D printing (resin) | 1.5–5 |
| Turning/milling (PA12) | Depending on the processing, very low values possible |
| Injection molding (PA12) [29] | 10–20 |
| Category | DoFs | SS | MSS | F-Value | p-Value |
|---|---|---|---|---|---|
| Material: PP | |||||
| Orientation | 5 | 191.7 | 38.35 | 27 | <2 × 10⁻¹⁶ |
| Residuals | 156 | 221.5 | 1.42 | — | — |
| Material: PA11 | |||||
| Orientation | 5 | 196 | 39.19 | 20.75 | 7.38 × 10⁻¹⁶ |
| Residuals | 156 | 294.7 | 1.89 | — | — |
| Material: TPU | |||||
| Orientation | 5 | 529.7 | 105.93 | 14.01 | 2.61 × 10⁻¹¹ |
| Residuals | 156 | 1179.6 | 7.56 | — | — |
| Category | DoFs | SS | MSS | F-Value | p-Value |
|---|---|---|---|---|---|
| Material: PP | |||||
| Zone | 2 | 1.29 | 0.65 | 0.452 | 0.637 |
| Orientation | 5 | 191.73 | 38.35 | 26.812 | <2 × 10⁻¹⁶ |
| Residuals | 154 | 220.25 | 1.43 | — | — |
| Material: PA11 | |||||
| Zone | 2 | 6.43 | 3.21 | 1.716 | 0.183 |
| Orientation | 5 | 195.97 | 39.19 | 20.940 | 6.21 × 10⁻¹⁶ |
| Residuals | 154 | 288.25 | 1.87 | — | — |
| Material: TPU | |||||
| Zone | 2 | 148.3 | 74.16 | 11.07 | 3.21 × 10⁻⁵ |
| Orientation | 5 | 529.7 | 105.93 | 15.82 | 1.47 × 10⁻¹² |
| Residuals | 154 | 1031.3 | 6.70 | — | — |
Publisher’s Note: MDPI stays neutral with regard to jurisdictional claims in published maps and institutional affiliations. |
© 2022 by the author. Licensee MDPI, Basel, Switzerland. This article is an open access article distributed under the terms and conditions of the Creative Commons Attribution (CC BY) license (https://creativecommons.org/licenses/by/4.0/).
Share and Cite
Dzienniak, D. The Influence of the Material Type and the Placement in the Print Chamber on the Roughness of MJF-Printed 3D Objects. Machines 2022, 10, 49. https://doi.org/10.3390/machines10010049
Dzienniak D. The Influence of the Material Type and the Placement in the Print Chamber on the Roughness of MJF-Printed 3D Objects. Machines. 2022; 10(1):49. https://doi.org/10.3390/machines10010049
Chicago/Turabian StyleDzienniak, Damian. 2022. "The Influence of the Material Type and the Placement in the Print Chamber on the Roughness of MJF-Printed 3D Objects" Machines 10, no. 1: 49. https://doi.org/10.3390/machines10010049
APA StyleDzienniak, D. (2022). The Influence of the Material Type and the Placement in the Print Chamber on the Roughness of MJF-Printed 3D Objects. Machines, 10(1), 49. https://doi.org/10.3390/machines10010049