Article

Correlation between the Internal Flow Pattern and the Blade Load Distribution of the Centrifugal Impeller

Key Laboratory of Fluid Transmission Technology of Zhejiang Province, Zhejiang Sci-Tech University, Hangzhou 310018, China
*
Author to whom correspondence should be addressed.
Machines 2022, 10(1), 40; https://doi.org/10.3390/machines10010040
Submission received: 22 November 2021 / Revised: 17 December 2021 / Accepted: 28 December 2021 / Published: 5 January 2022
(This article belongs to the Special Issue Optimization and Flow Characteristics in Advanced Fluid Machinery)

Abstract

:
The blade load distributions reflect the working characteristics of centrifugal impellers, and the vortexes in the impeller channel affect the blade load distribution, but the mechanism of this phenomenon is still unclear. In this study, particle image velocimetry (PIV) was adopted to clarify the correlation between the internal flow pattern and the blade load distribution. The internal flow pattern and the blade load distribution were presented under different working conditions to study the influence of the internal flow pattern on the blade load. Results showed that the vortexes in the flow channel redistributed the blade load. The clockwise vortex made the position of the maximum blade load closer to the outlet, while the counterclockwise vortex had the opposite effect. Meanwhile, the vortexes caused the blade load distribution to be steeper, which reduced energy conversion efficiency. Moreover, the mean absolute flow angle was introduced to explain the mechanism of the effects of vortexes on blade load. The results can be used as a theoretical basis for the design of high-performance impellers.

1. Introduction

The centrifugal pump is an important energy conversion device. Many researchers adopted various methods to analyze the flow characteristics of the pump and its influence on the pump performance [1,2,3]. The blade load distribution is a main parameter that reflects the working characteristics of centrifugal impellers. The blade load has gradually gained people’s attention [4,5,6]. Studying the correlation between internal flow pattern and blade load will deepen the understanding of impeller flow pattern and stable operation of the pump.
Many studies have been carried out to explain the flow pattern in pumps. Wang et al. [7] adopted the PIV experiment to measure the flow characteristics in the five-blade centrifugal impeller. The results showed that when the flow rate was reduced to the flow rate of 0.8 QBEP, flow separation began to form on the suction side of the flow channel. Atkins et al. [8] applied the PIV technology to measure the velocity fields of the upstream, gap, and downstream areas around five side-by-side cylinders. Zhang et al. [9] used the PIV technology to measure the flow structure in a low-specific-speed centrifugal pump in detail. The results showed that when the flow velocity was lower than the nominal conditions, a typical structure of jet-wake was observed at the blade outlet. Zhang et al. [10] studied the internal flow characteristics and hydraulic performance of the twin-screw pump by CFD. Results showed that the screw pressure gradually increased from the inlet face to the outlet face along the screw axis under different heads. Bennacer et al. [11] applied the PIV technology to conduct an in-depth analysis of the internal flow. They found that the dominant mode accounted for more than half of the total kinetic energy. Guo et al. [12] used an experiment and numerical simulation to characterize the performance of pumps with variable pitch inducers at different speeds. Si et al. [13] adopted the PIV technology to study the influence of internal flow characteristics on the overall pump performance. Results showed that the main loss was occurred inside the vaneless part of the diffuser under the low flow rates. Wu et al. [14] used the PIV technology to measure the internal flow field under design flow working conditions, which revealed the distribution of the principal Reynolds normal stress and the principal Reynolds shear stress. Li et al. [15] studied the influence of internal flow patterns on hydraulic performance and energy conversion characteristics through visual experiments. Detailed studies showed that a counterclockwise vortex would increase energy losses, while a clockwise vortex would have a positive effect on the pump head. Westra et al. [16] used the PIV technology to study the internal velocity field distribution characteristics of centrifugal pumps, especially the secondary flow structure in the impeller flow channel. Yu et al. [17] used a laser doppler anemometer to obtain velocity measurements from a model of bio-centrifugal pump. Almost all the aforementioned studies have focused on the effects of flow rates on the flow pattern. In the present study, the effect of the rotational speeds on internal flow pattern were analyzed. Several researchers have aimed to investigate the internal flow pattern by analyzing the absolute flow angle. Liu et al. [18] applied PIV technology to study the unstable internal flow of a double-blade centrifugal pump impeller at a design flow rate. It focused on the analysis of the change trend of the mean absolute flow angle and the average dynamic pressure. Gaetani et al. [19] studied the pump performance and focused on computing spanwise mean flow angles and velocity distribution. Wang et al. [20] studied the formation mechanism of the reverse flow. Their results showed that the absolute flow angle at the blade inlet nearing the shroud was close to 180° because of the joint action of the leakage flow and blade inlet impact under low flow rates. Poujol et al. [21] tested the centrifugal compressor under the staggered angle of three inlet guide vanes. It showed that the absolute flow angle at the diffuser inlet decreases with the increase of IGV stagger angle near the surge point.
At the same time, many studies have been conducted to explain the effect of blade load on pump performance. Chalghoum et al. [22] analyzed the unsteady value of the strong interaction between the impeller blade and the volute tongue, then studied the correlation between the dynamic load and the unstable radial force. Zhang et al. [23] used a new method to design a new impeller based on the blade load. Li et al. [24] studied the effect of blade load distribution on the head, radial force, and pressure pulsation of a low-specific-speed centrifugal pump with cylindrical impeller blades. It showed that the front-loaded impeller produced a more uniform flow than the rear-loaded impeller. Li et al. [25] discussed the impact of monitoring points and blade load variations on the unstable behavior of the impeller through sensor experiment. Zhang et al. [26] studied the pressure fluctuation characteristics of a reversible pump turbine under various blade load conditions by using pressure signals. They found that pressure fluctuations were very obvious under the low load conditions. Sun et al. [27] revealed the optimal load distribution mechanism of the hub by different methods. Durante et al. [28] introduced a comparison for the analysis of the unsteady loads among different hydrodynamic models. It highlighted the ability to describe high frequency hydrodynamic loads. Li et al. [29] proposed the blade load distribution based on PIV technology to analyze the energy conversion mechanism in the centrifugal pump impeller. Few works have investigated the correlation between the blade load distribution and the flow pattern in the impeller. The current study aimed to clarify the effect of vortexes in the impeller channel on the blade load distribution. In this paper, the correlation between the flow pattern in the impeller and the blade load distribution was further discussed with the help of PIV.The current study aimed to clarify the mechanism of how vortexes in the impeller channel affect the blade load distribution. Results include the theory of blade load, the process of blade load data extraction, the size of vortexes in the flow channel, and the movement laws of the vortex core. Finally, the reasons for the special trend of some blade load distributions were analyzed.

2. Implementation Process Based on PIV

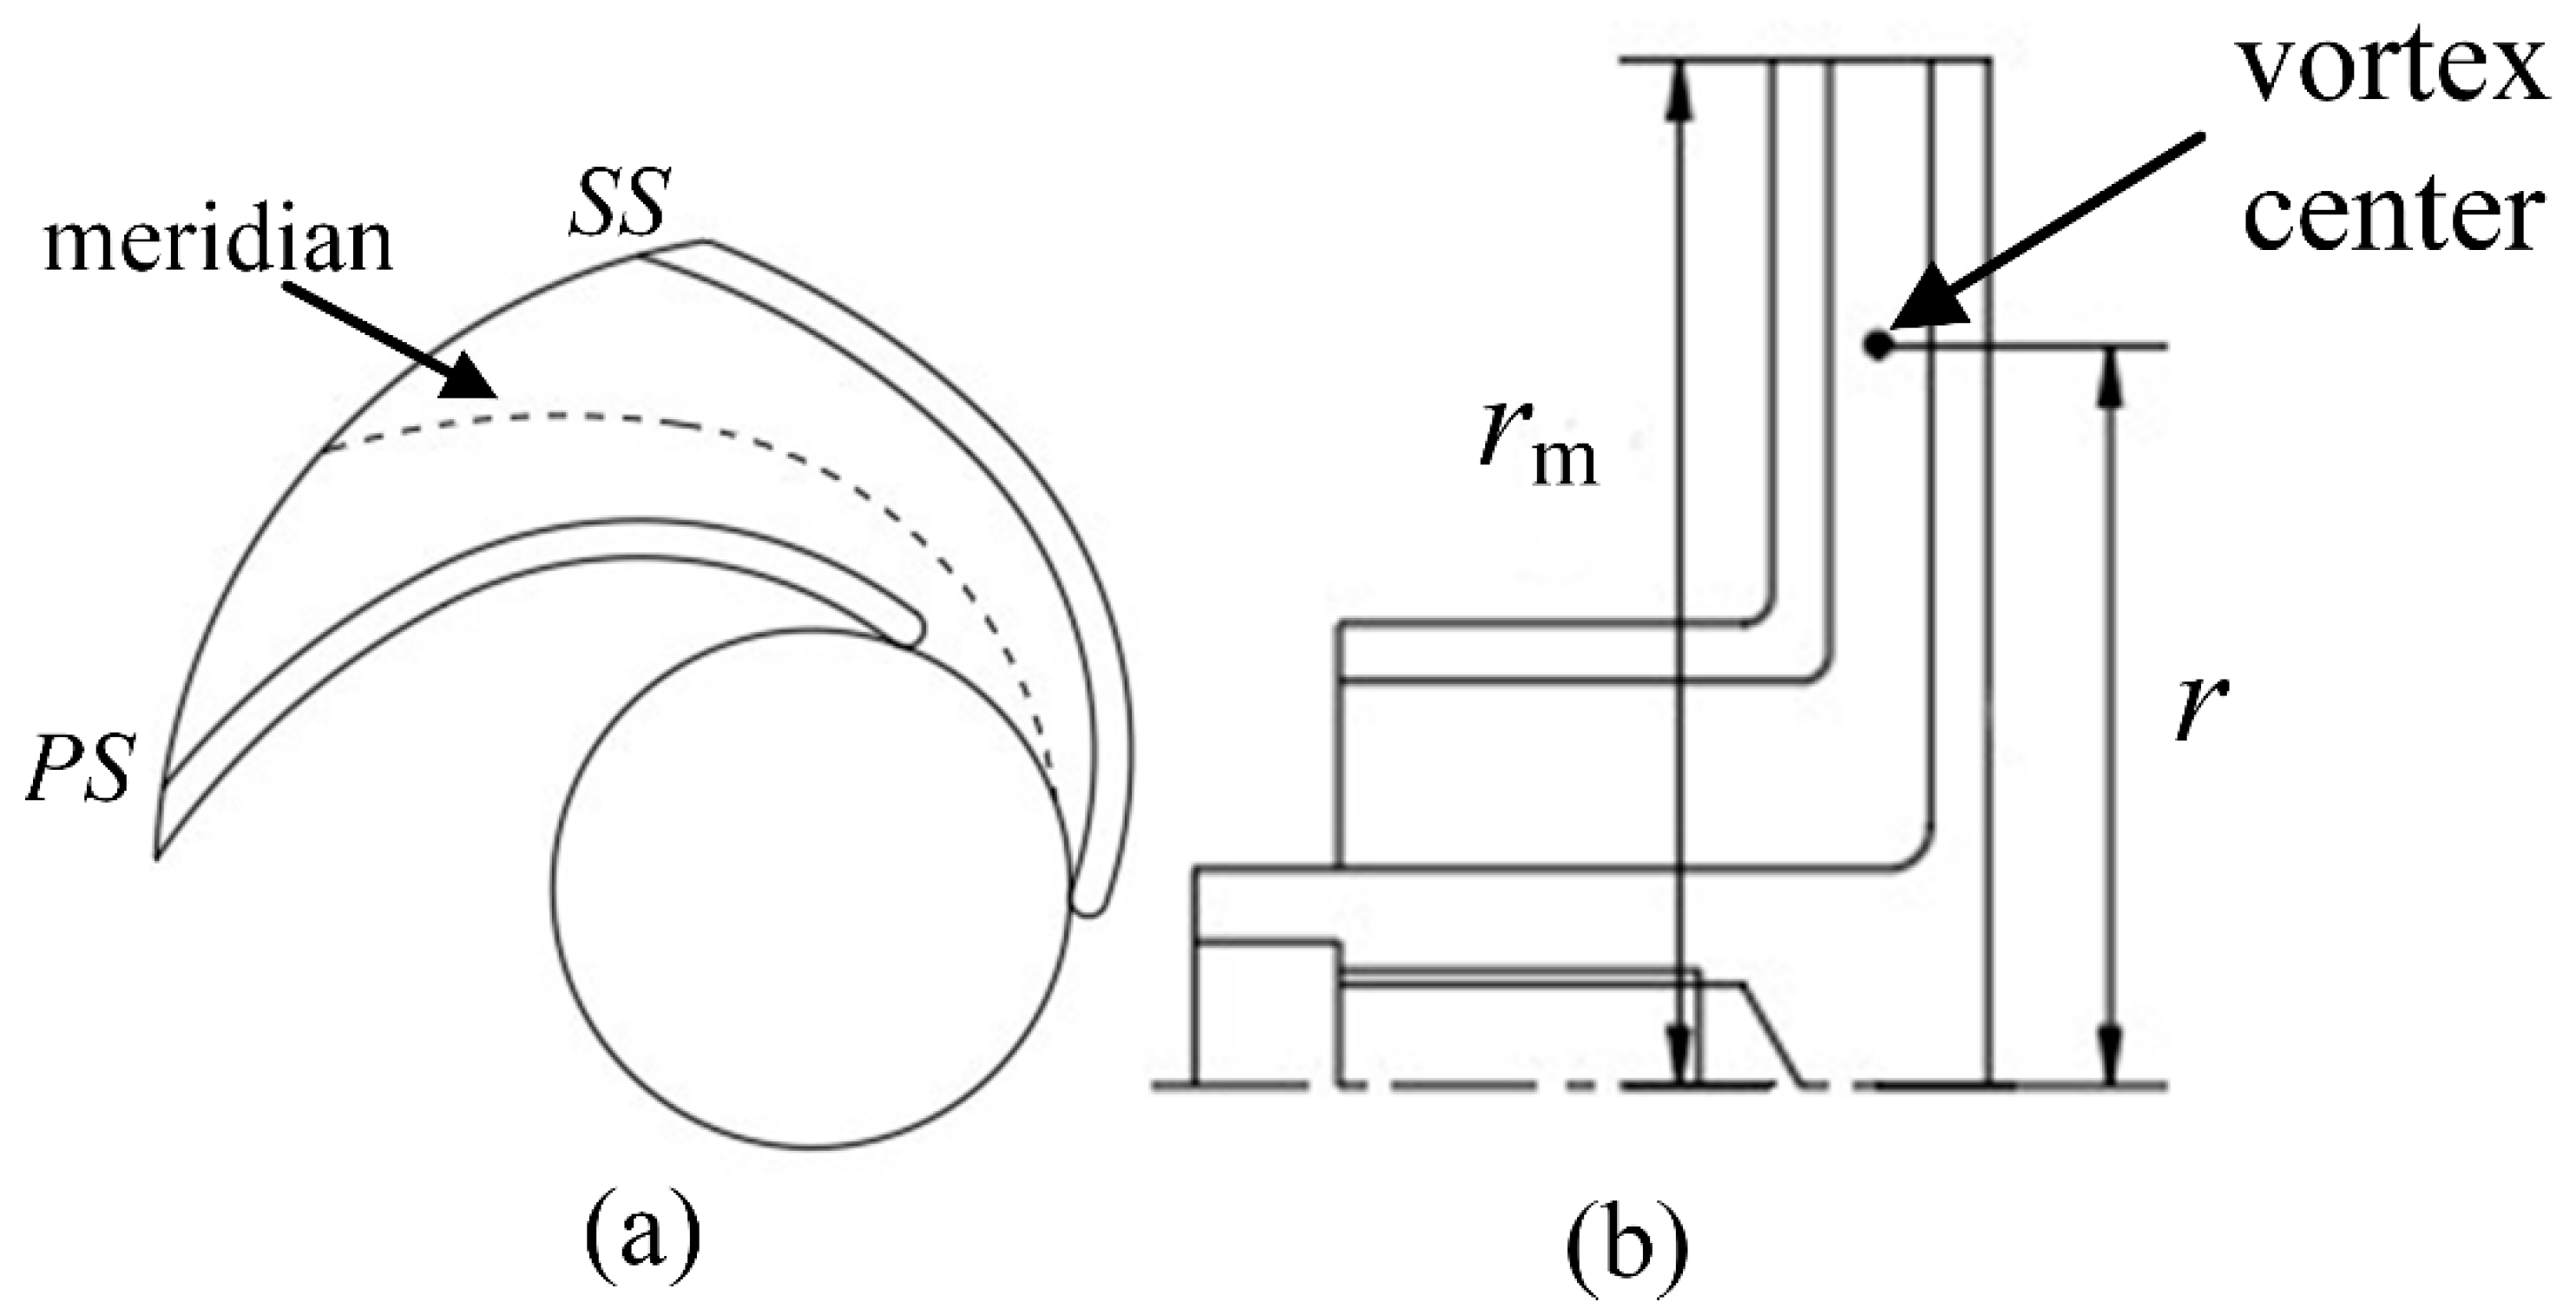
2.1. Theoretical Basis of Blade Load
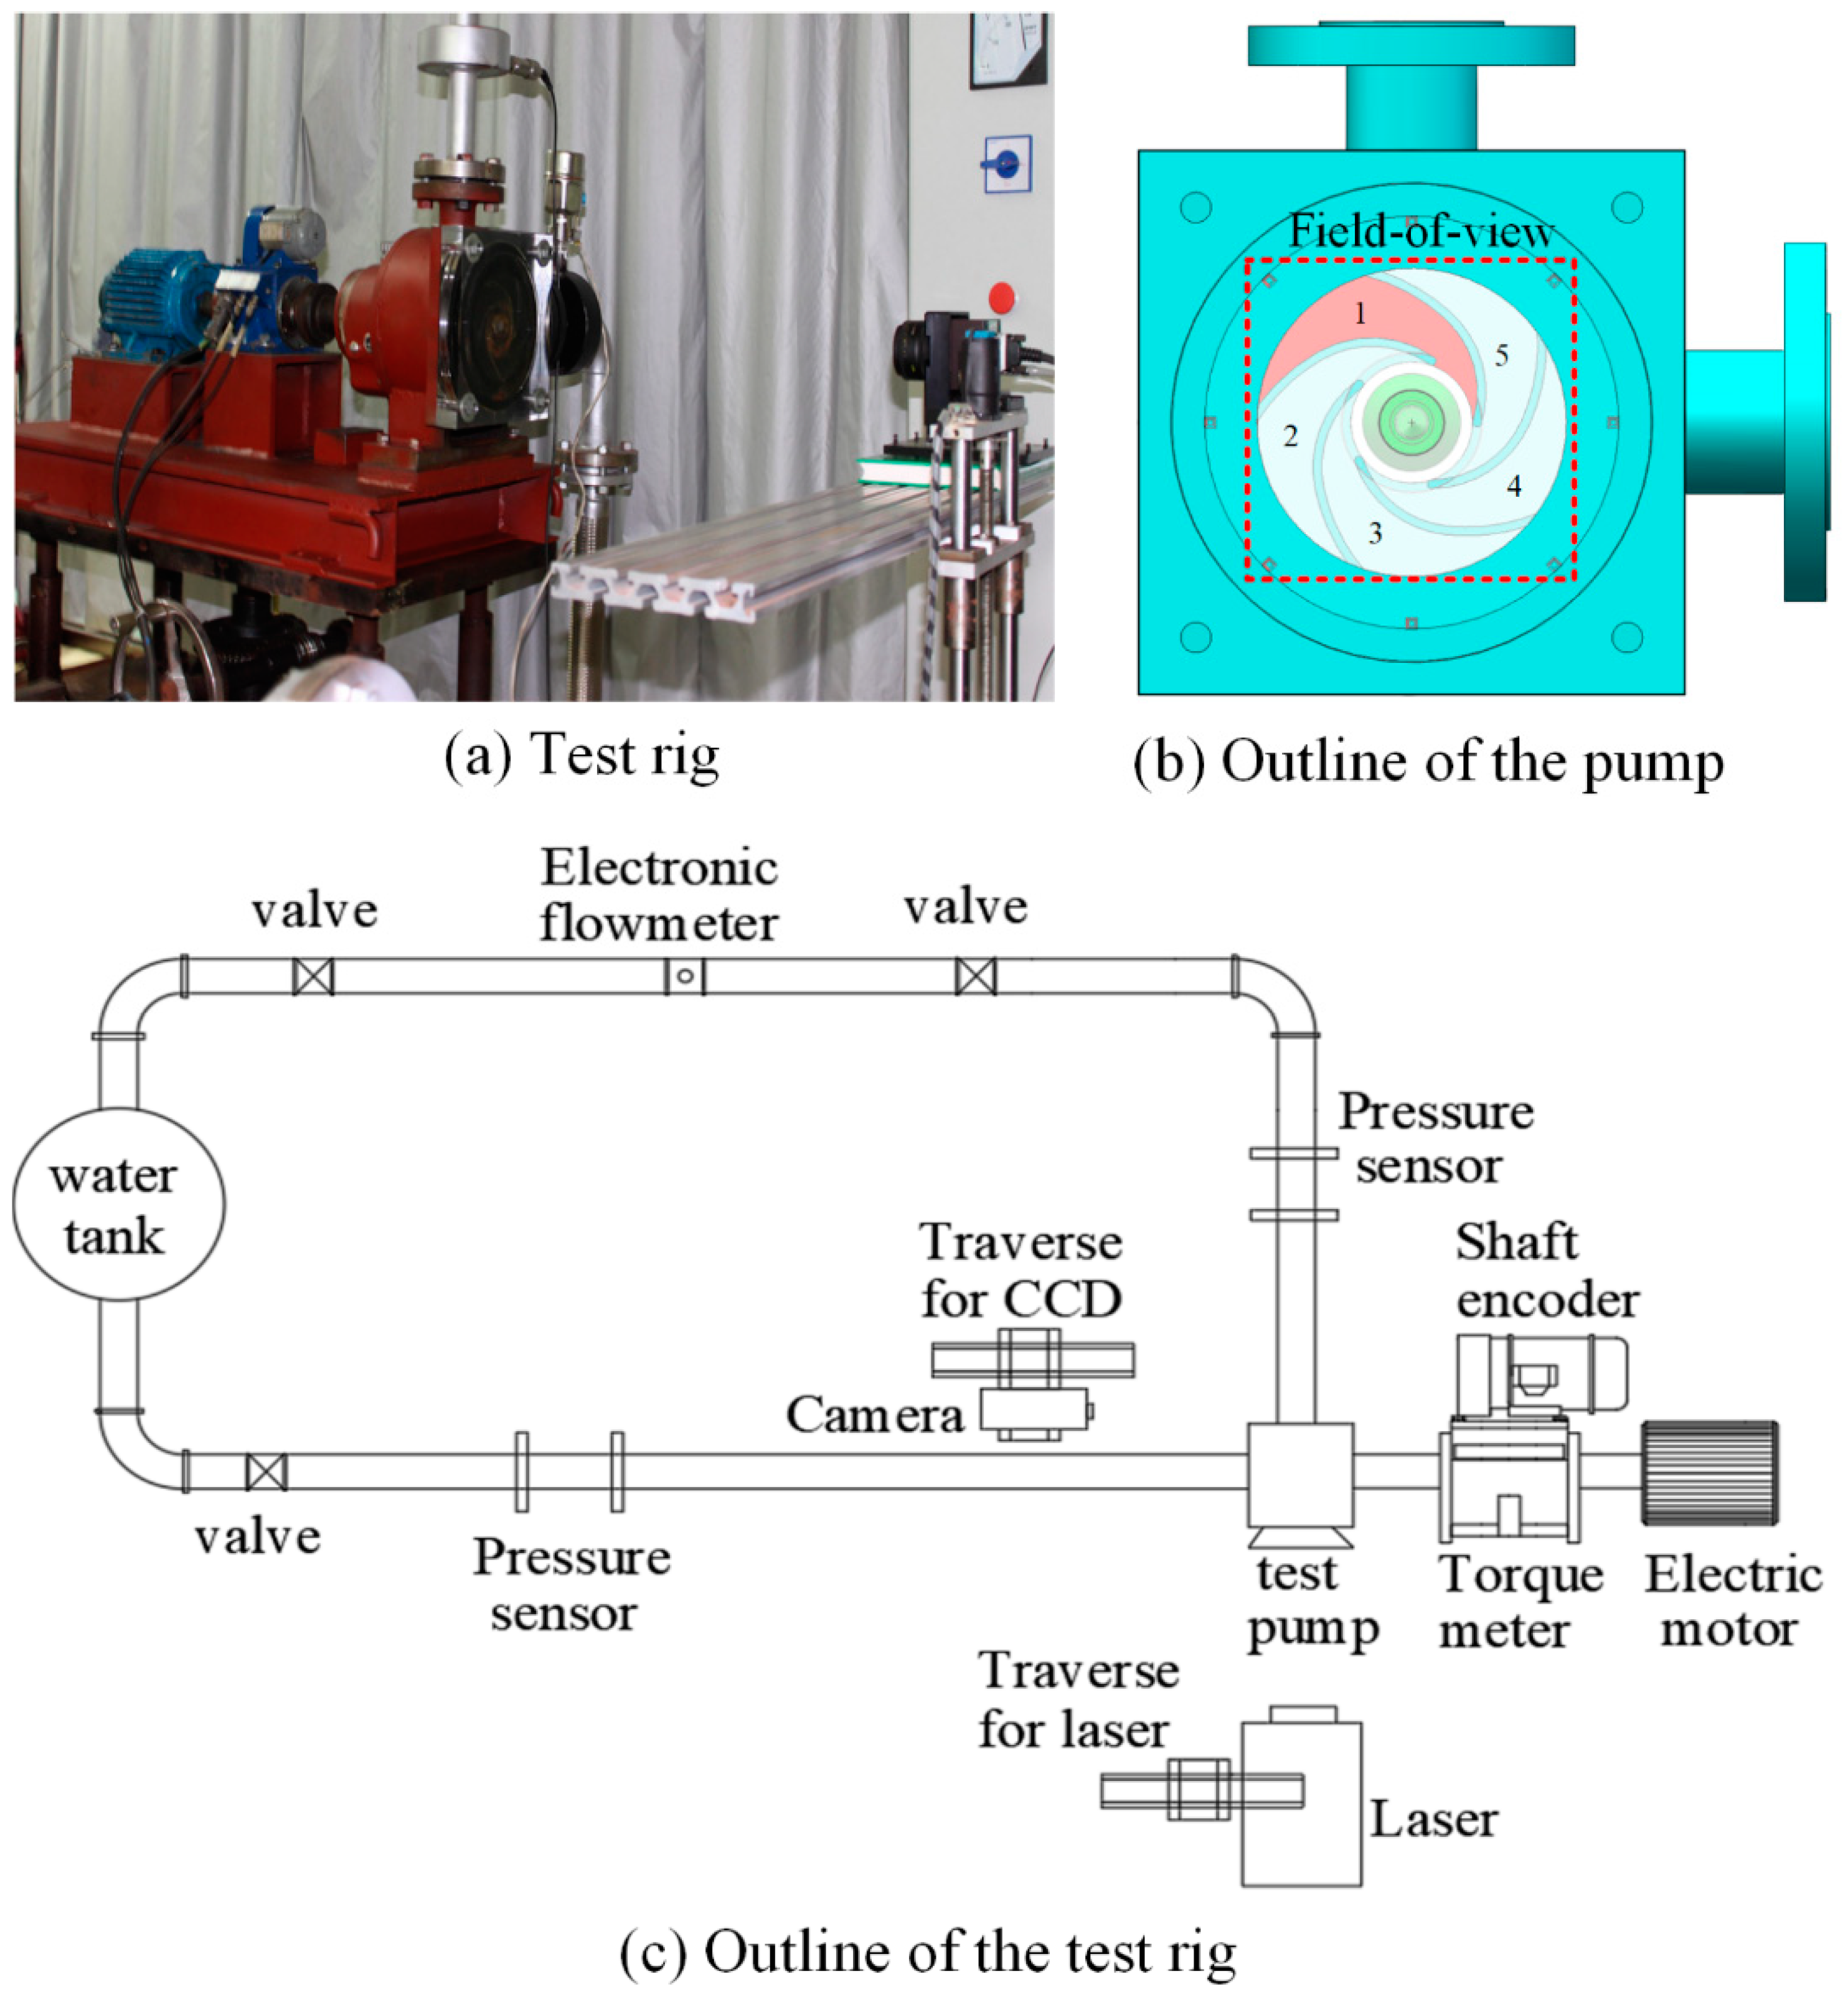
The blade load distribution is an important factor to measure the hydraulic performance of the impeller in blade design. The blade load is defined as the pressure difference between the pressure side and the suction side in the length direction of the blade. By changing the distribution law of the blade load, the pressure difference distribution between the pressure side and the suction side of the blade can be effectively changed. Therefore, the reasonable change of the blade load distribution can improve the performance of the impeller.
As for the inverse design method, the distribution represents the change of the velocity loop r V θ along the streamline. V θ is the circumferential component of the absolute velocity. The distribution of the velocity circulation along the streamline reflects the distribution change of the blade load.
Based on this feature of impeller machinery, the distribution of r V θ ¯ / m along the streamline is used as the flow filed condition in the inverse design method. Therefore, the F (the value of blade load) can be rewritten as Equation (1):
F = p + p = 2 π B ρ W ( r V θ ¯ ) m
p + and p are the pressure at the pressure side and suction side of the blade respectively, B is the number of blades, W is the relative velocity at the blade side, ρ is the density of water, r V θ is the velocity loop quantity, m is the relative axial side flow length.
The blades are represented by vorticity sheets, which depend on the specific distribution of circumferential mean angular momentum r V θ ¯ defined as follows:
r V θ ¯ = Z 2 π 0 2 π Z r V θ d θ
According to the velocity triangle, we have the following conclusions:
V θ = Q A   t a n   α
A = 2 π r b
where, Q is the flow rate through the impeller, A is the cross-sectional area, b is the width of the channel in the cross-section, and α (the absolute flow angle) is the angle between the circumferential direction and the absolute velocity.
In this paper, the blade load distribution was obtained by an experimental method. The data obtained from the PIV test were processed by MATLAB to obtain the relative velocity and absolute velocity in flow field, and then the blade load was obtained based on the blade load Equation (1). The following is an introduction to the experimental device.

2.2. Methodology

In this paper, PIV experimental method was used to extract blade load value after post-processing. Experiments of the test pump were conducted on a closed test rig as shown in Figure 1. The main parameters of the impeller are listed in Table 1. The valves were used to adjust the flow rate of the pump. The flow rate was measured by using an electromagnetic flowmeter. The water head was measured by two pressure sensors. The rotational speed was regulated by a frequency inverter.
The PIV measurement system was described in Li et al. [29]. The PIV system (TSI) consisted of a double-pulsed Nd: YAG laser (λ = 532 nm), a CCD camera (spatial resolution of 2048 px × 2048 px, time delay of 130 μs), a synchronizer, and a data-processing system (Insight 3 G). The image pair’s acquisition was synchronized with the impeller rotation using an optical trigger which was located at the pump shaft. The spatial resolution of the acquired images was 102.38 μm/px. The seeding particles’ (soild alumina particles) diameter was 20–60 μm, and their density was 1050 kg/m3. A multi-pass method with 50% overlap was chosen with a final interrogation region of 32 × 32 px2. According to Li et al. [29], the uncertainty of the phase-averaged velocities was lower than 1–3% of the measured velocity.
Before the PIV experiment, the performance characteristics of the test pump were firstly tested. The optimum flow rates (QBEP) and the corresponding heads at different rotational speeds are listed in Table 2.
Based on these optimum flow rates, the PIV experiments were conducted at flow rates of 1.2 QBEP, 1.0 QBEP, 0.8 QBEP, 0.6 QBEP, 0.4 QBEP, and 0.2 QBEP at different rotational speeds. During the measuring process, the images were acquired at the same section by using a triggering system. The velocity fields were obtained from 300 pairs of images which were obtained at the same blade position. The experimental data were then processed as follows: The velocities are a function of position x, y and time t, including phase average and pulsation, shown in Equation (5):
V ( x , y , t ) = V ¯ ( x , y ) + V ( x , y , t )
Then the velocity field corresponding to each working condition captured in the test was averaged to obtain the mean absolute speed field shown in the following Equation (6):
v ¯ ( x , y ) = 1 n i = 1 n V i ( x , y , t 0 + i Δ t ) ( n = 300 )
The phase-averaged relative velocity field was obtained by subtracting the local circumferential velocity of the impeller from the absolute velocity at each point:
W = V Ω × r a
W is the relative velocity of the particles. Ω is the -rotational speed of the impeller and r a is the local radius.
After the relative velocity field was obtained, the blade load value could be obtained by combining Equation (1).

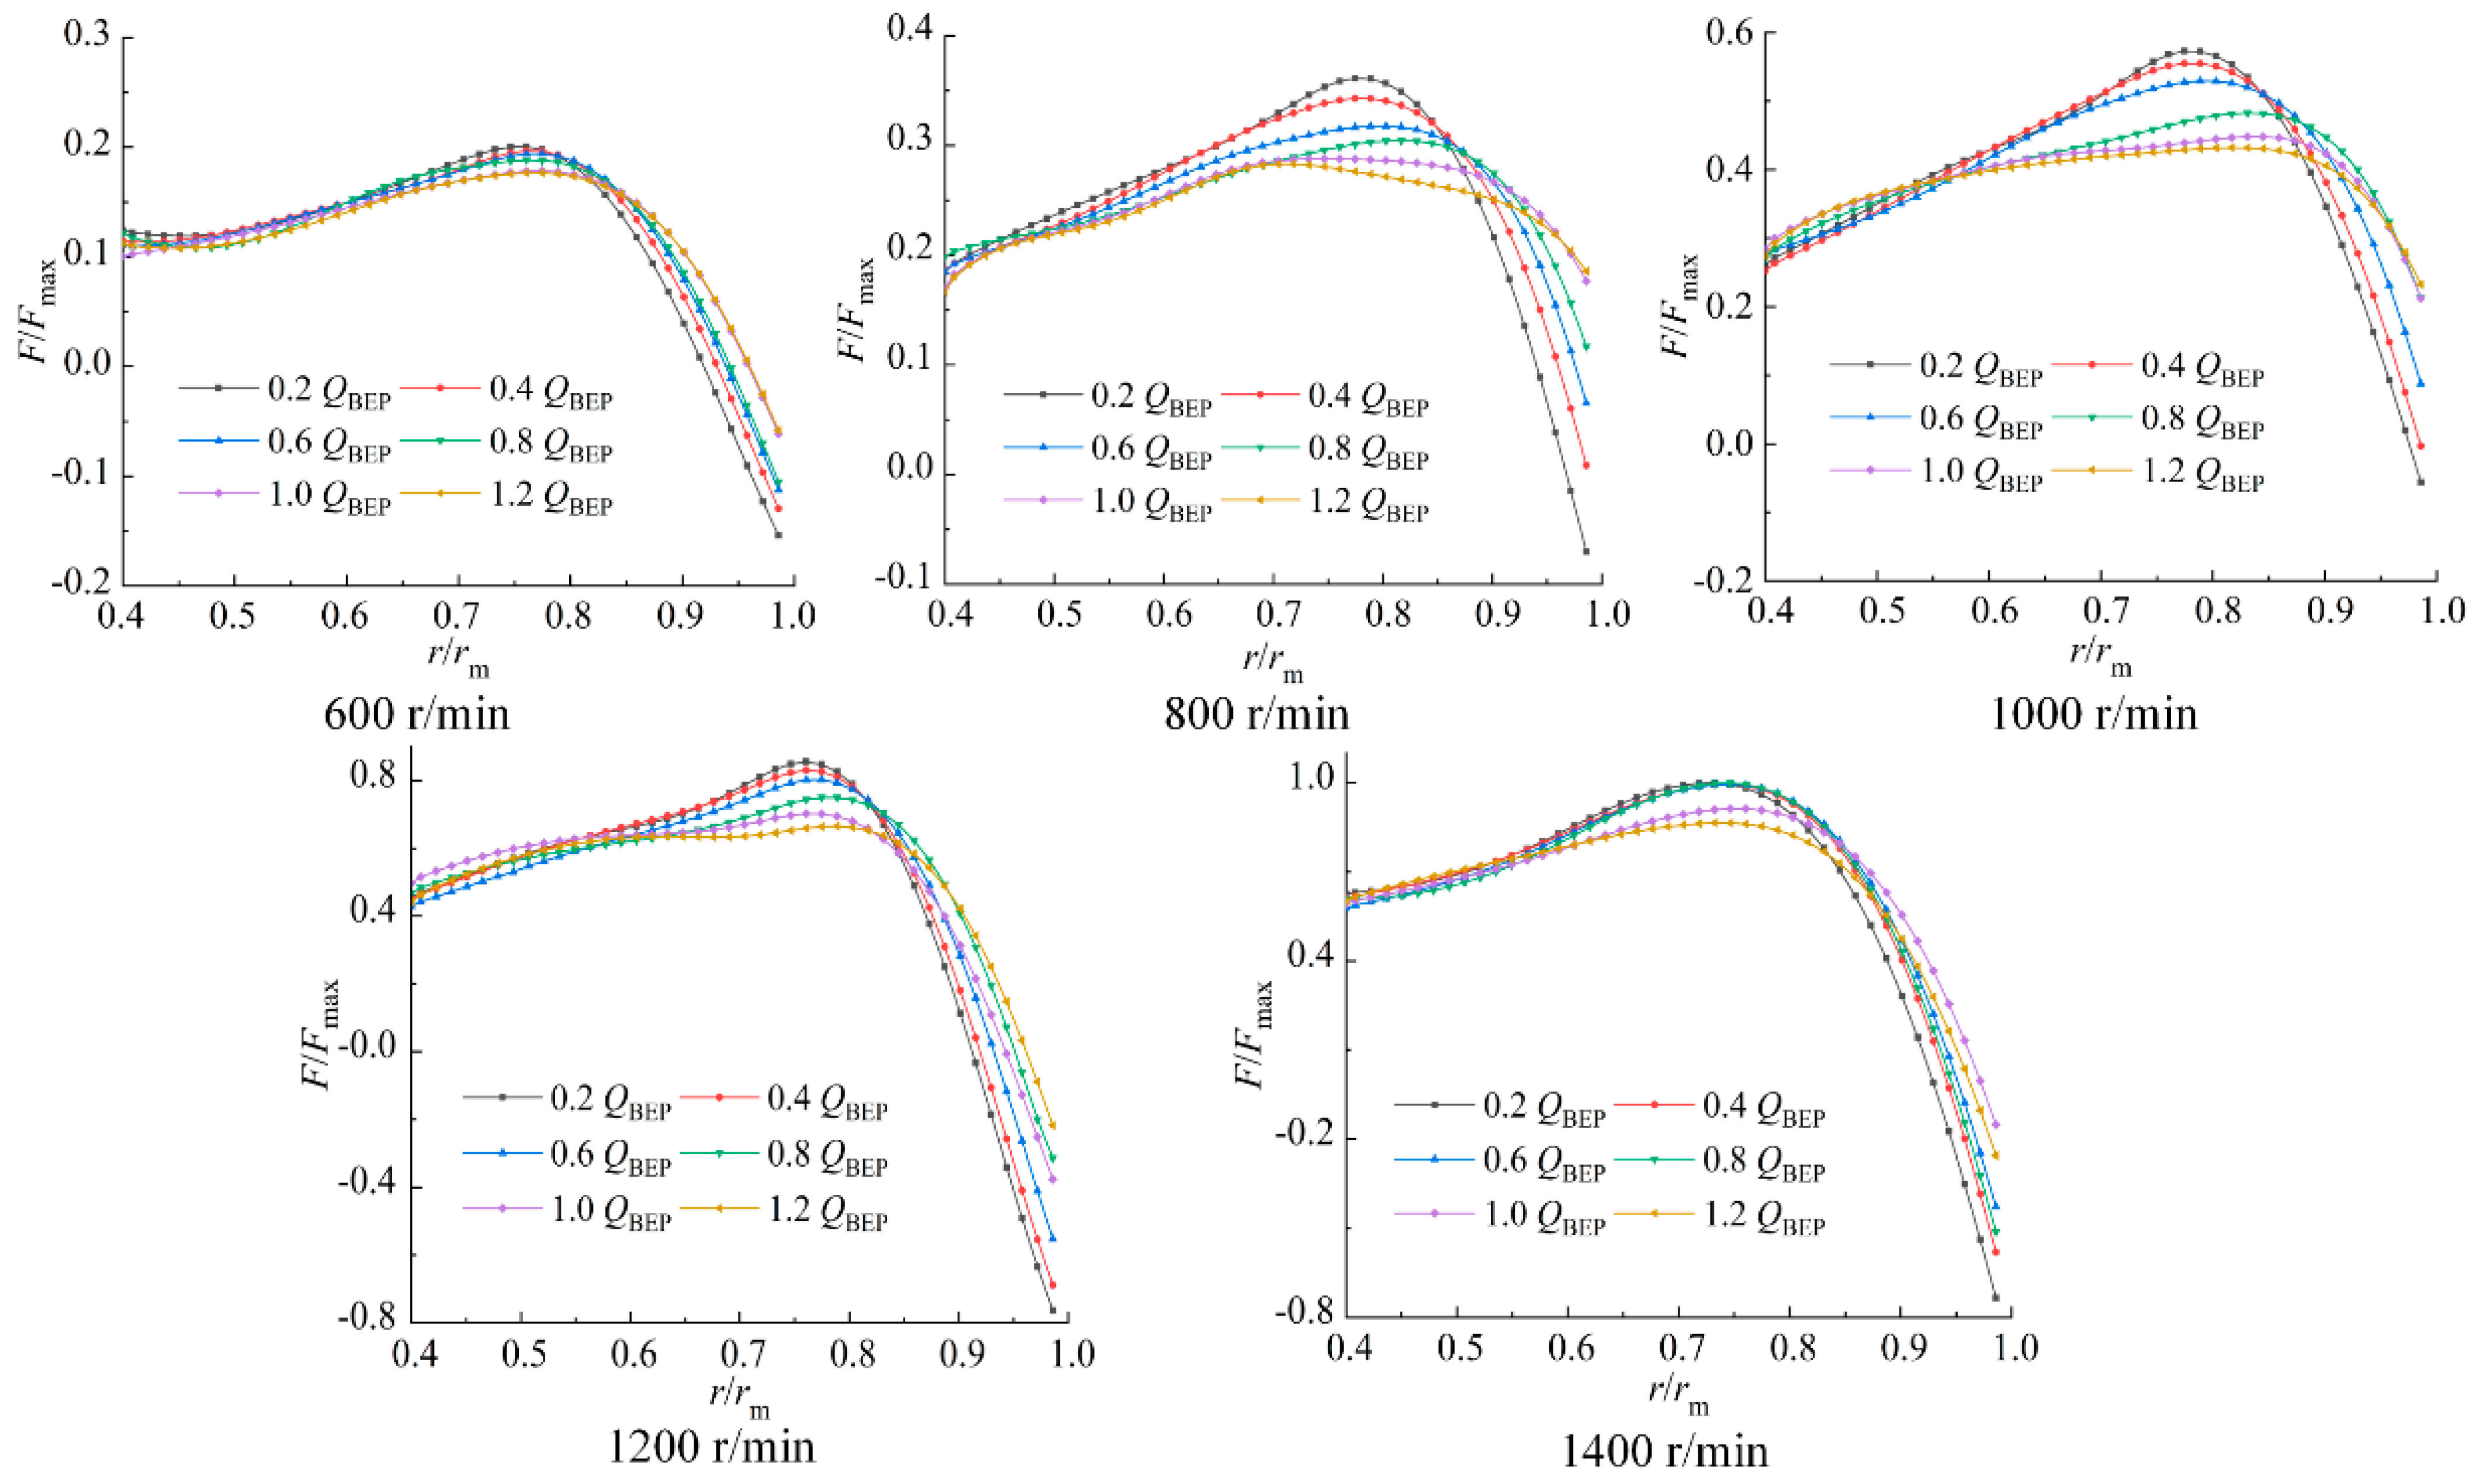
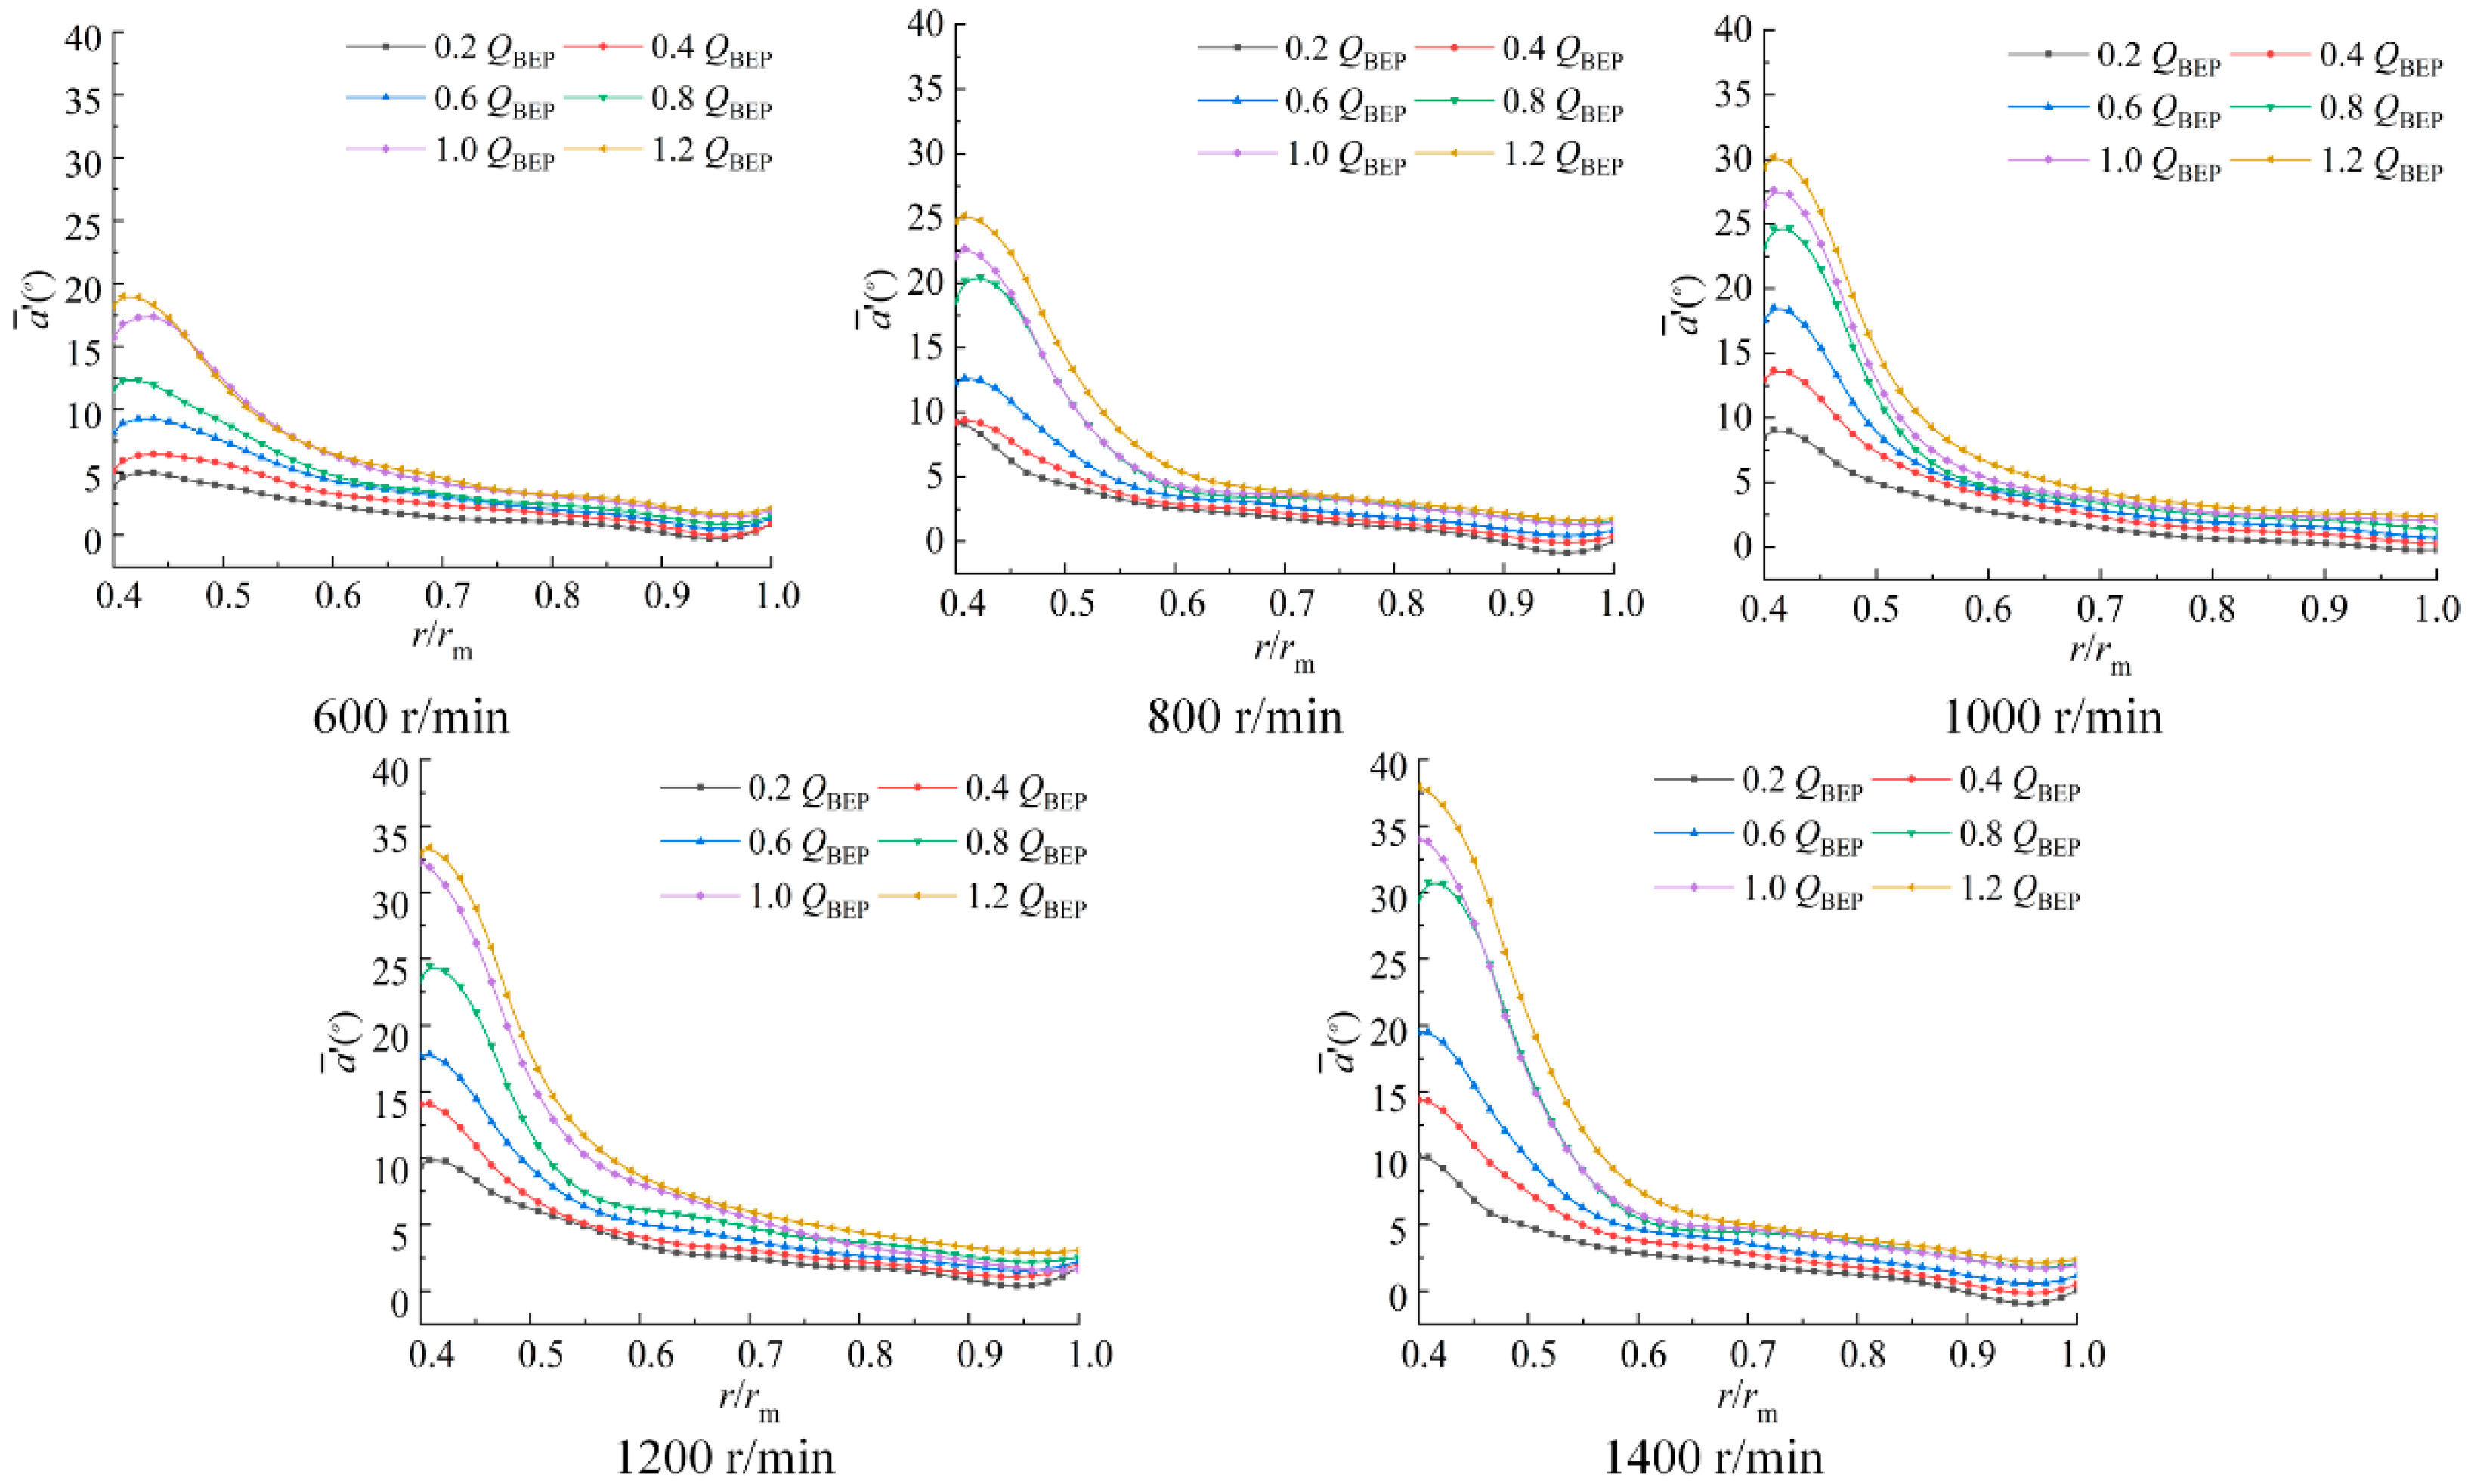
2.3. Results of Blade Load

Figure 2a shows a schematic of the flow channel meridian. The V θ distribution on the same radius in the flow channel was averaged to obtain the mean V θ distribution along the meridian. The channel meridian was consistent with the blade profile. The blade load distribution and the mean absolute flow angle distribution were analyzed along this meridian. Figure 2b shows the side view of the impeller.
Figure 3 shows the distributions of the blade load for different rotational speeds. The blade load distribution curves behaved as an aft-loaded type at each flow rate. At different rotational speeds, the blade load distributions behaved inconsistently. The corresponding blade load value of each flow rate increased accordingly with the increase of rotational speed. Comparing the blade load distributions of the five rotational speeds, it can be found that the load peak area was distributed along r/rm = 0.75–0.85, and then the blade load started to decrease until the impeller outlet.

3. Analysis of Internal Flow Patterns

3.1. Discussion on the Relative Velocity Field

Li et al. [15,29] studied the flow field in the impeller channel at different rotational speeds. At different rotational speeds, their results showed that the developing trend of internal flow pattern with flow rate is consistent. The internal flow pattern behaved steadily near the optimum flow rates, while it vortexes appeared at low flow rates. However, at the same flow rates, the flow field behaved more stably with the increase in the rotational speed. Figure 4 shows the flow streamlines at the flow rate of 0.2 QBEP for five rotational speeds. At the flow rate of 0.2 QBEP, there were two vortexes in the channel for all the five rotational speeds. The clockwise vortex appeared on the suction side, whereas the counterclockwise vortex appeared on the pressure side. The two vortexes occupied almost the entire flow channel. When the rotational speed increased, the zone and intensity of the low-velocity area decreased with the increase of rotational speed. At the rotational speed of 600 r/min, the flow channel was almost completely covered by the low-velocity area. While at the rotational speed of 1200 r/min and 1400 r/min, a secondary vortex appeared at the inlet of suction side. Figure 4 shows that the primary vortex was accompanied by a secondary vortex, which also led to a variation in the radial scale and the position of the vortex center of the primary vortex. On the other hand, for the flow rate of 1.0 QBEP, no separation vortexes were observed on the suction side or pressure side for all the five rotational speeds, and the flow pattern behaved in good condition.

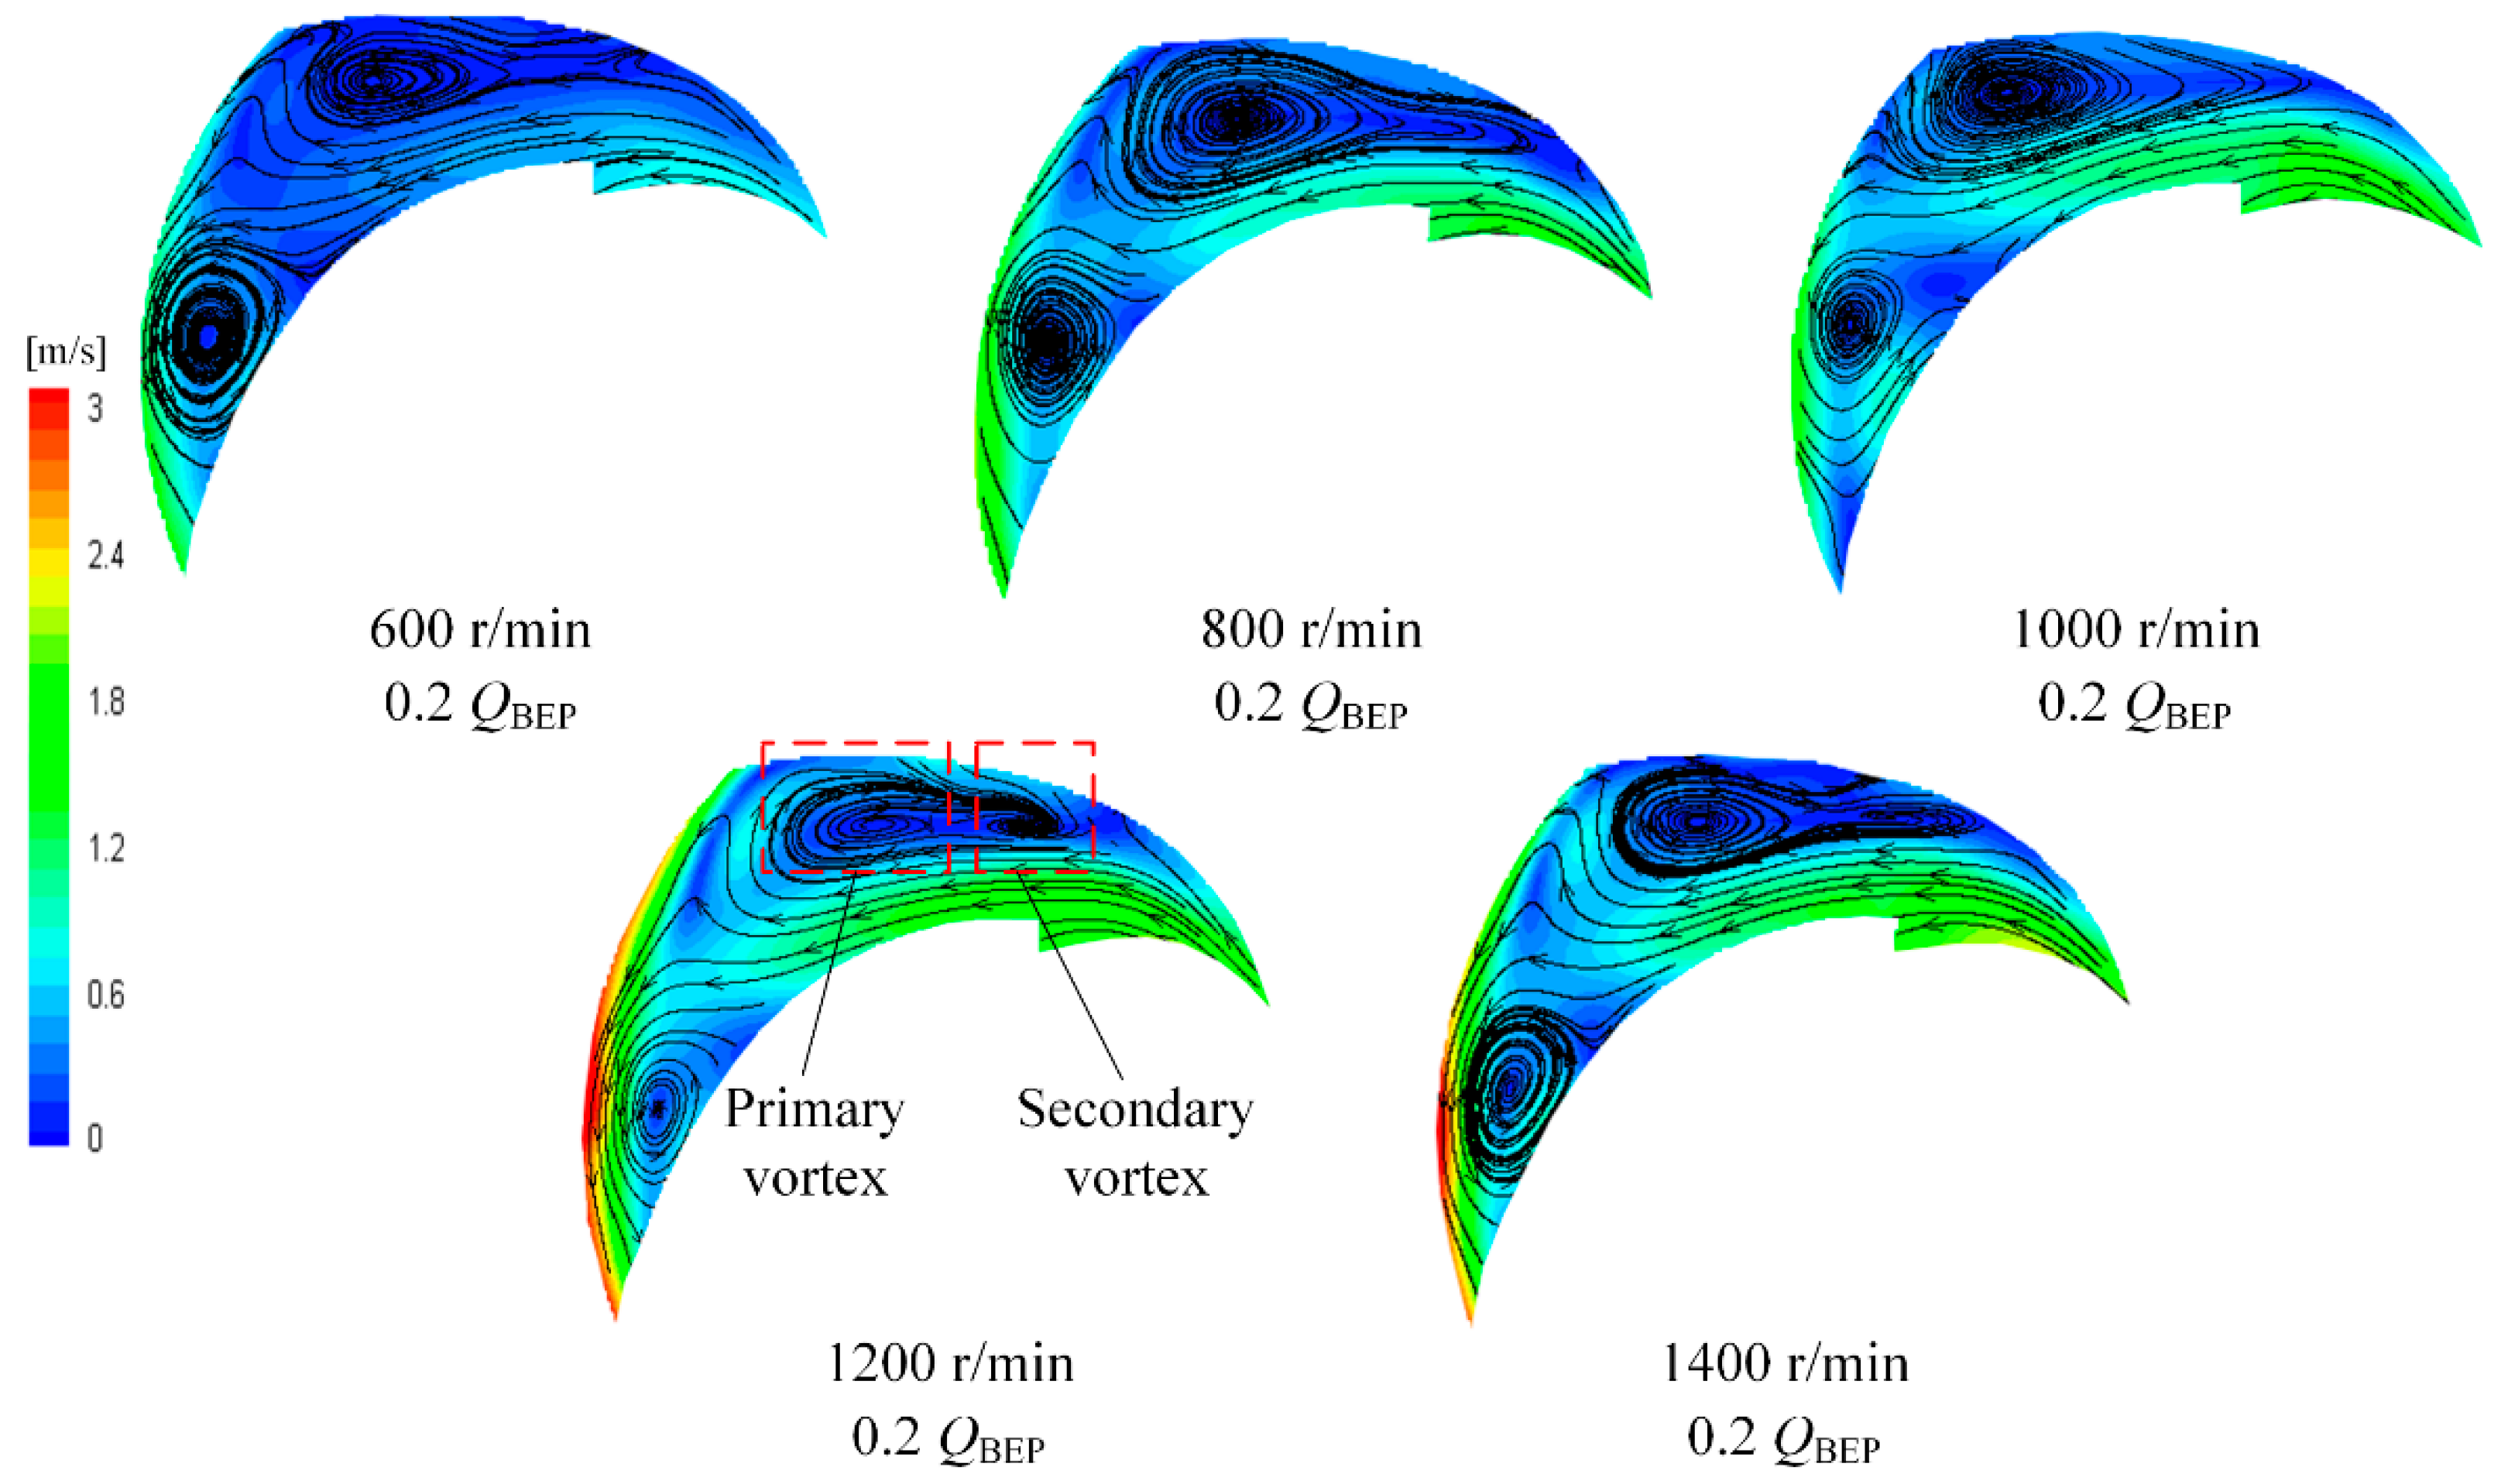
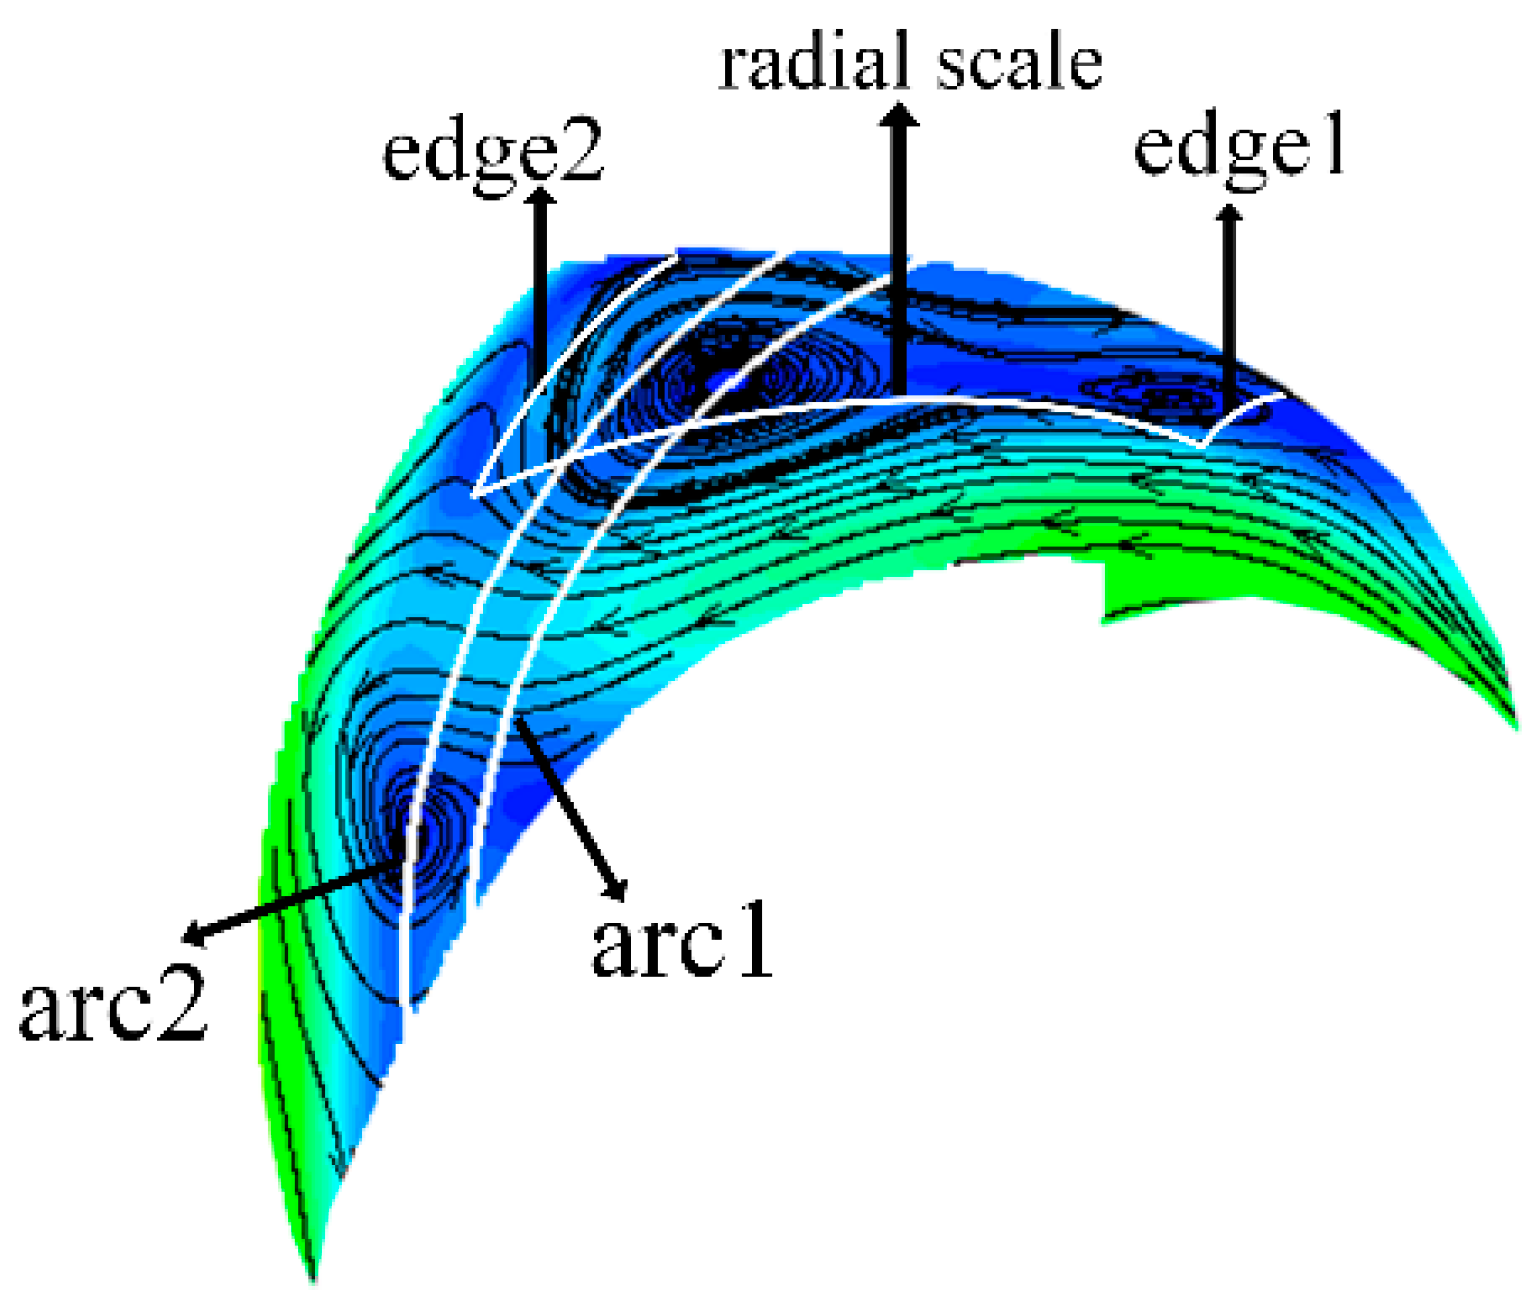
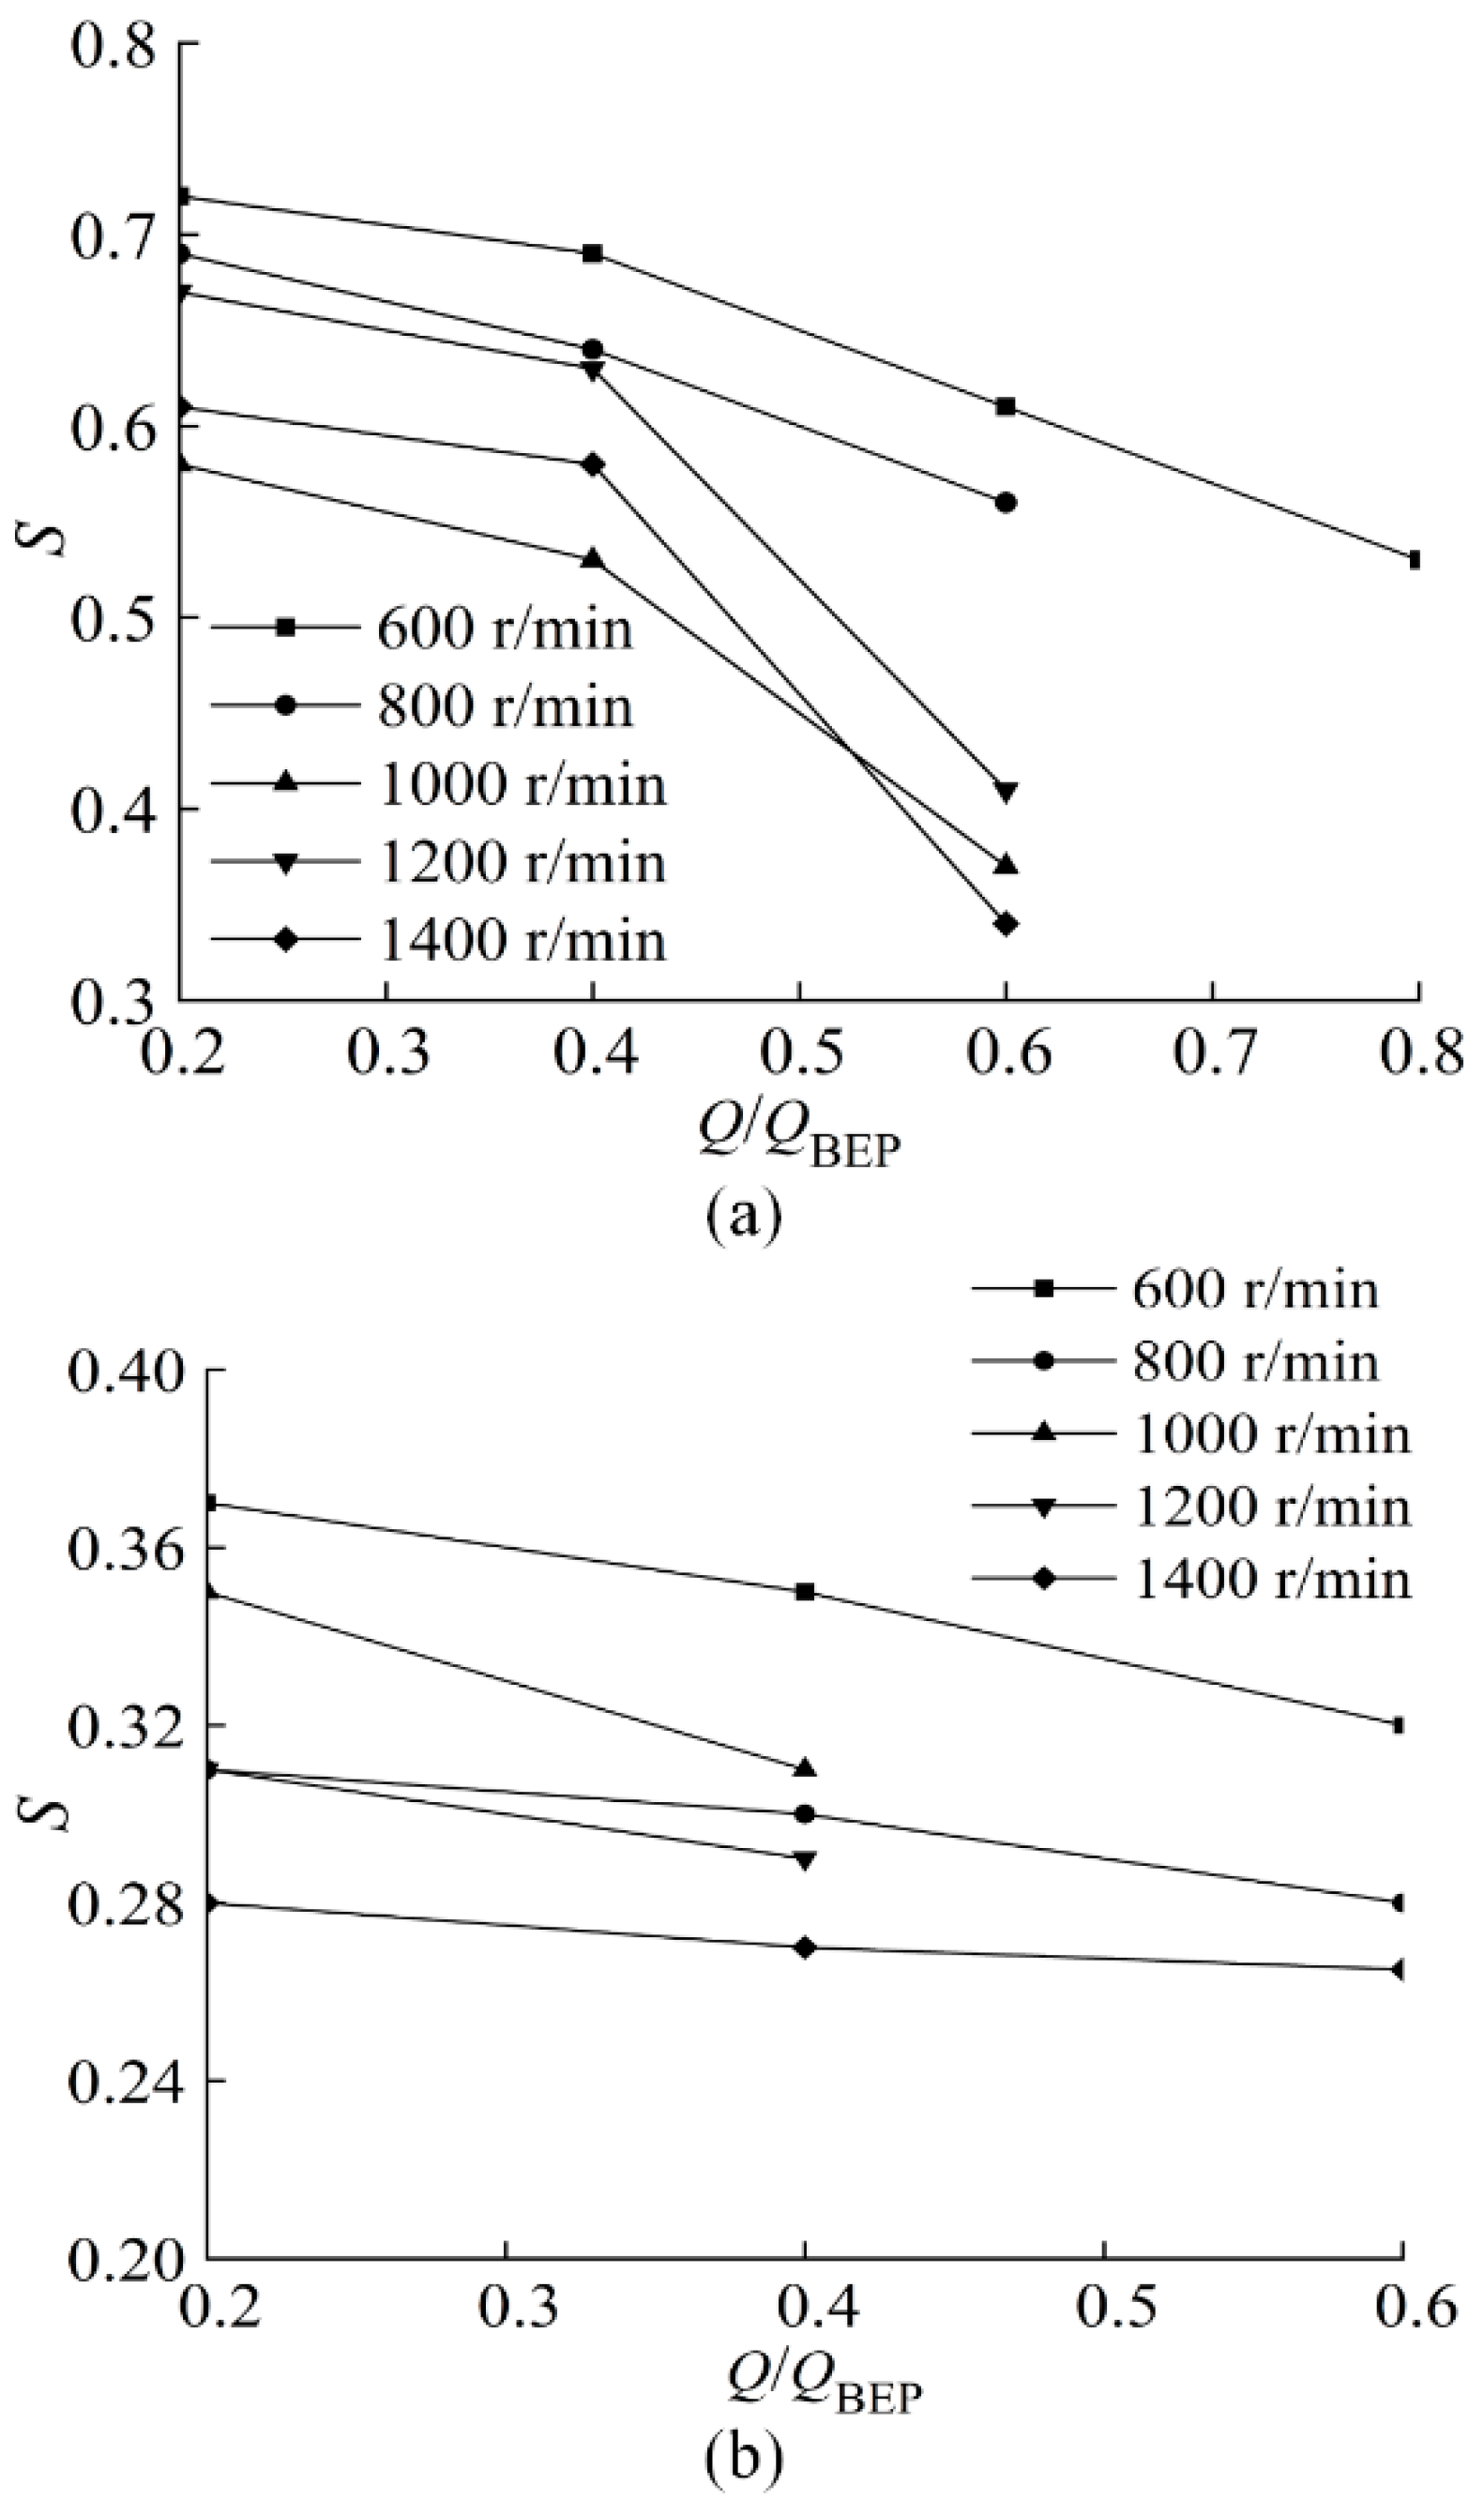
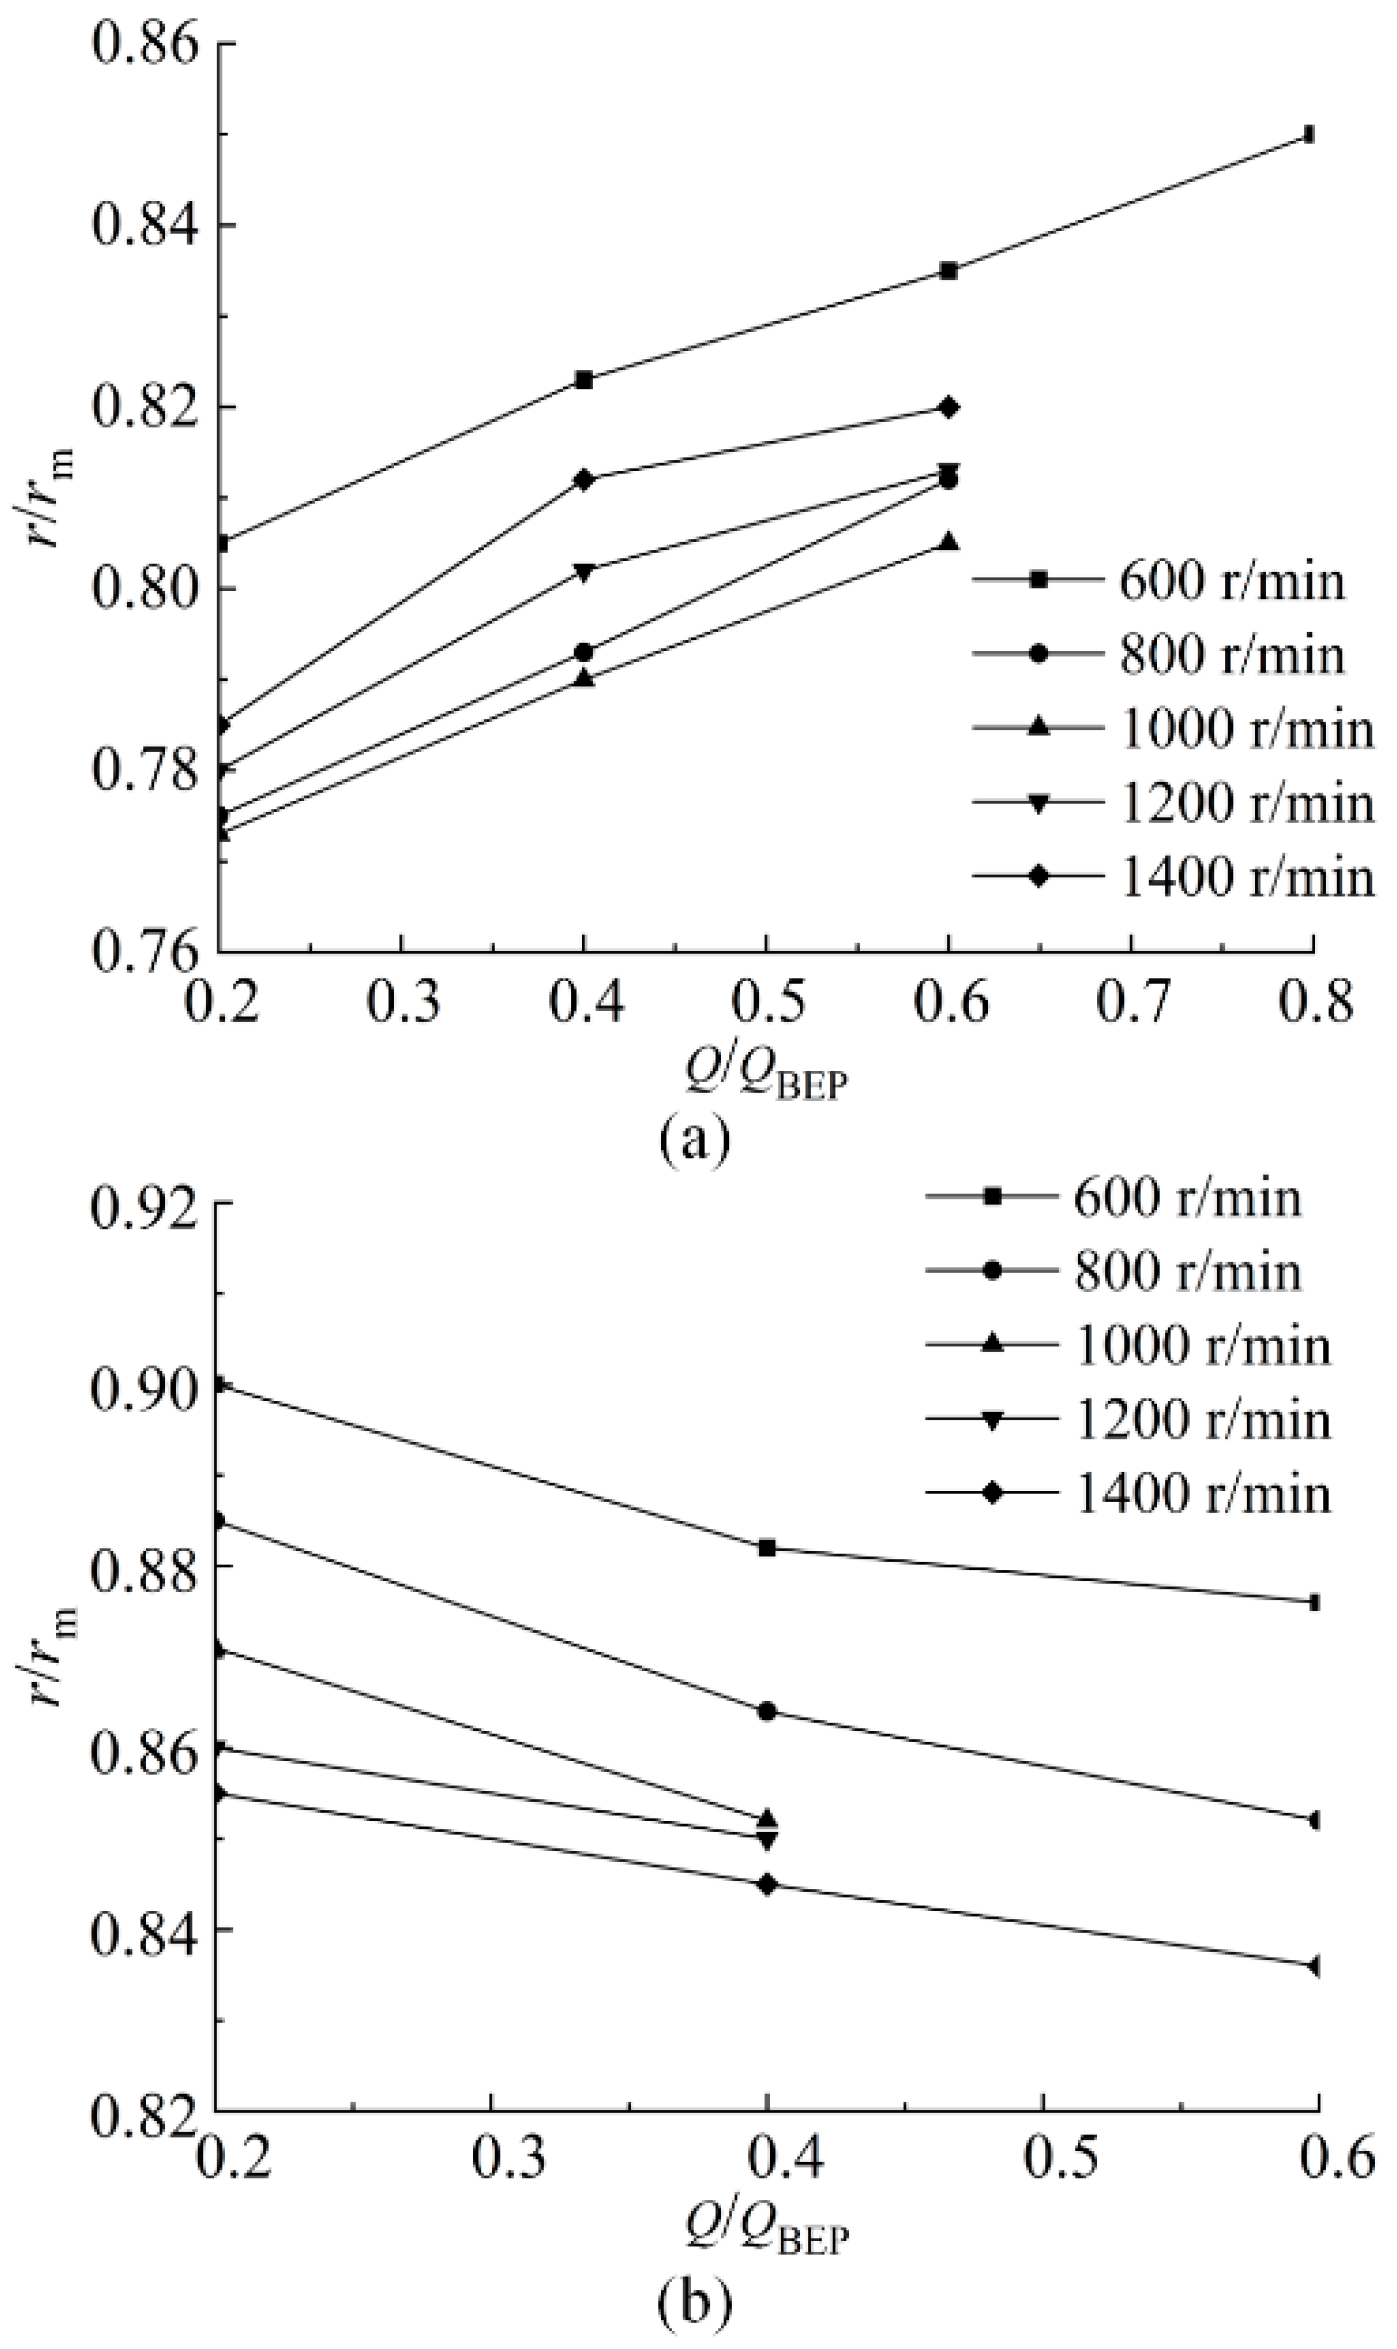
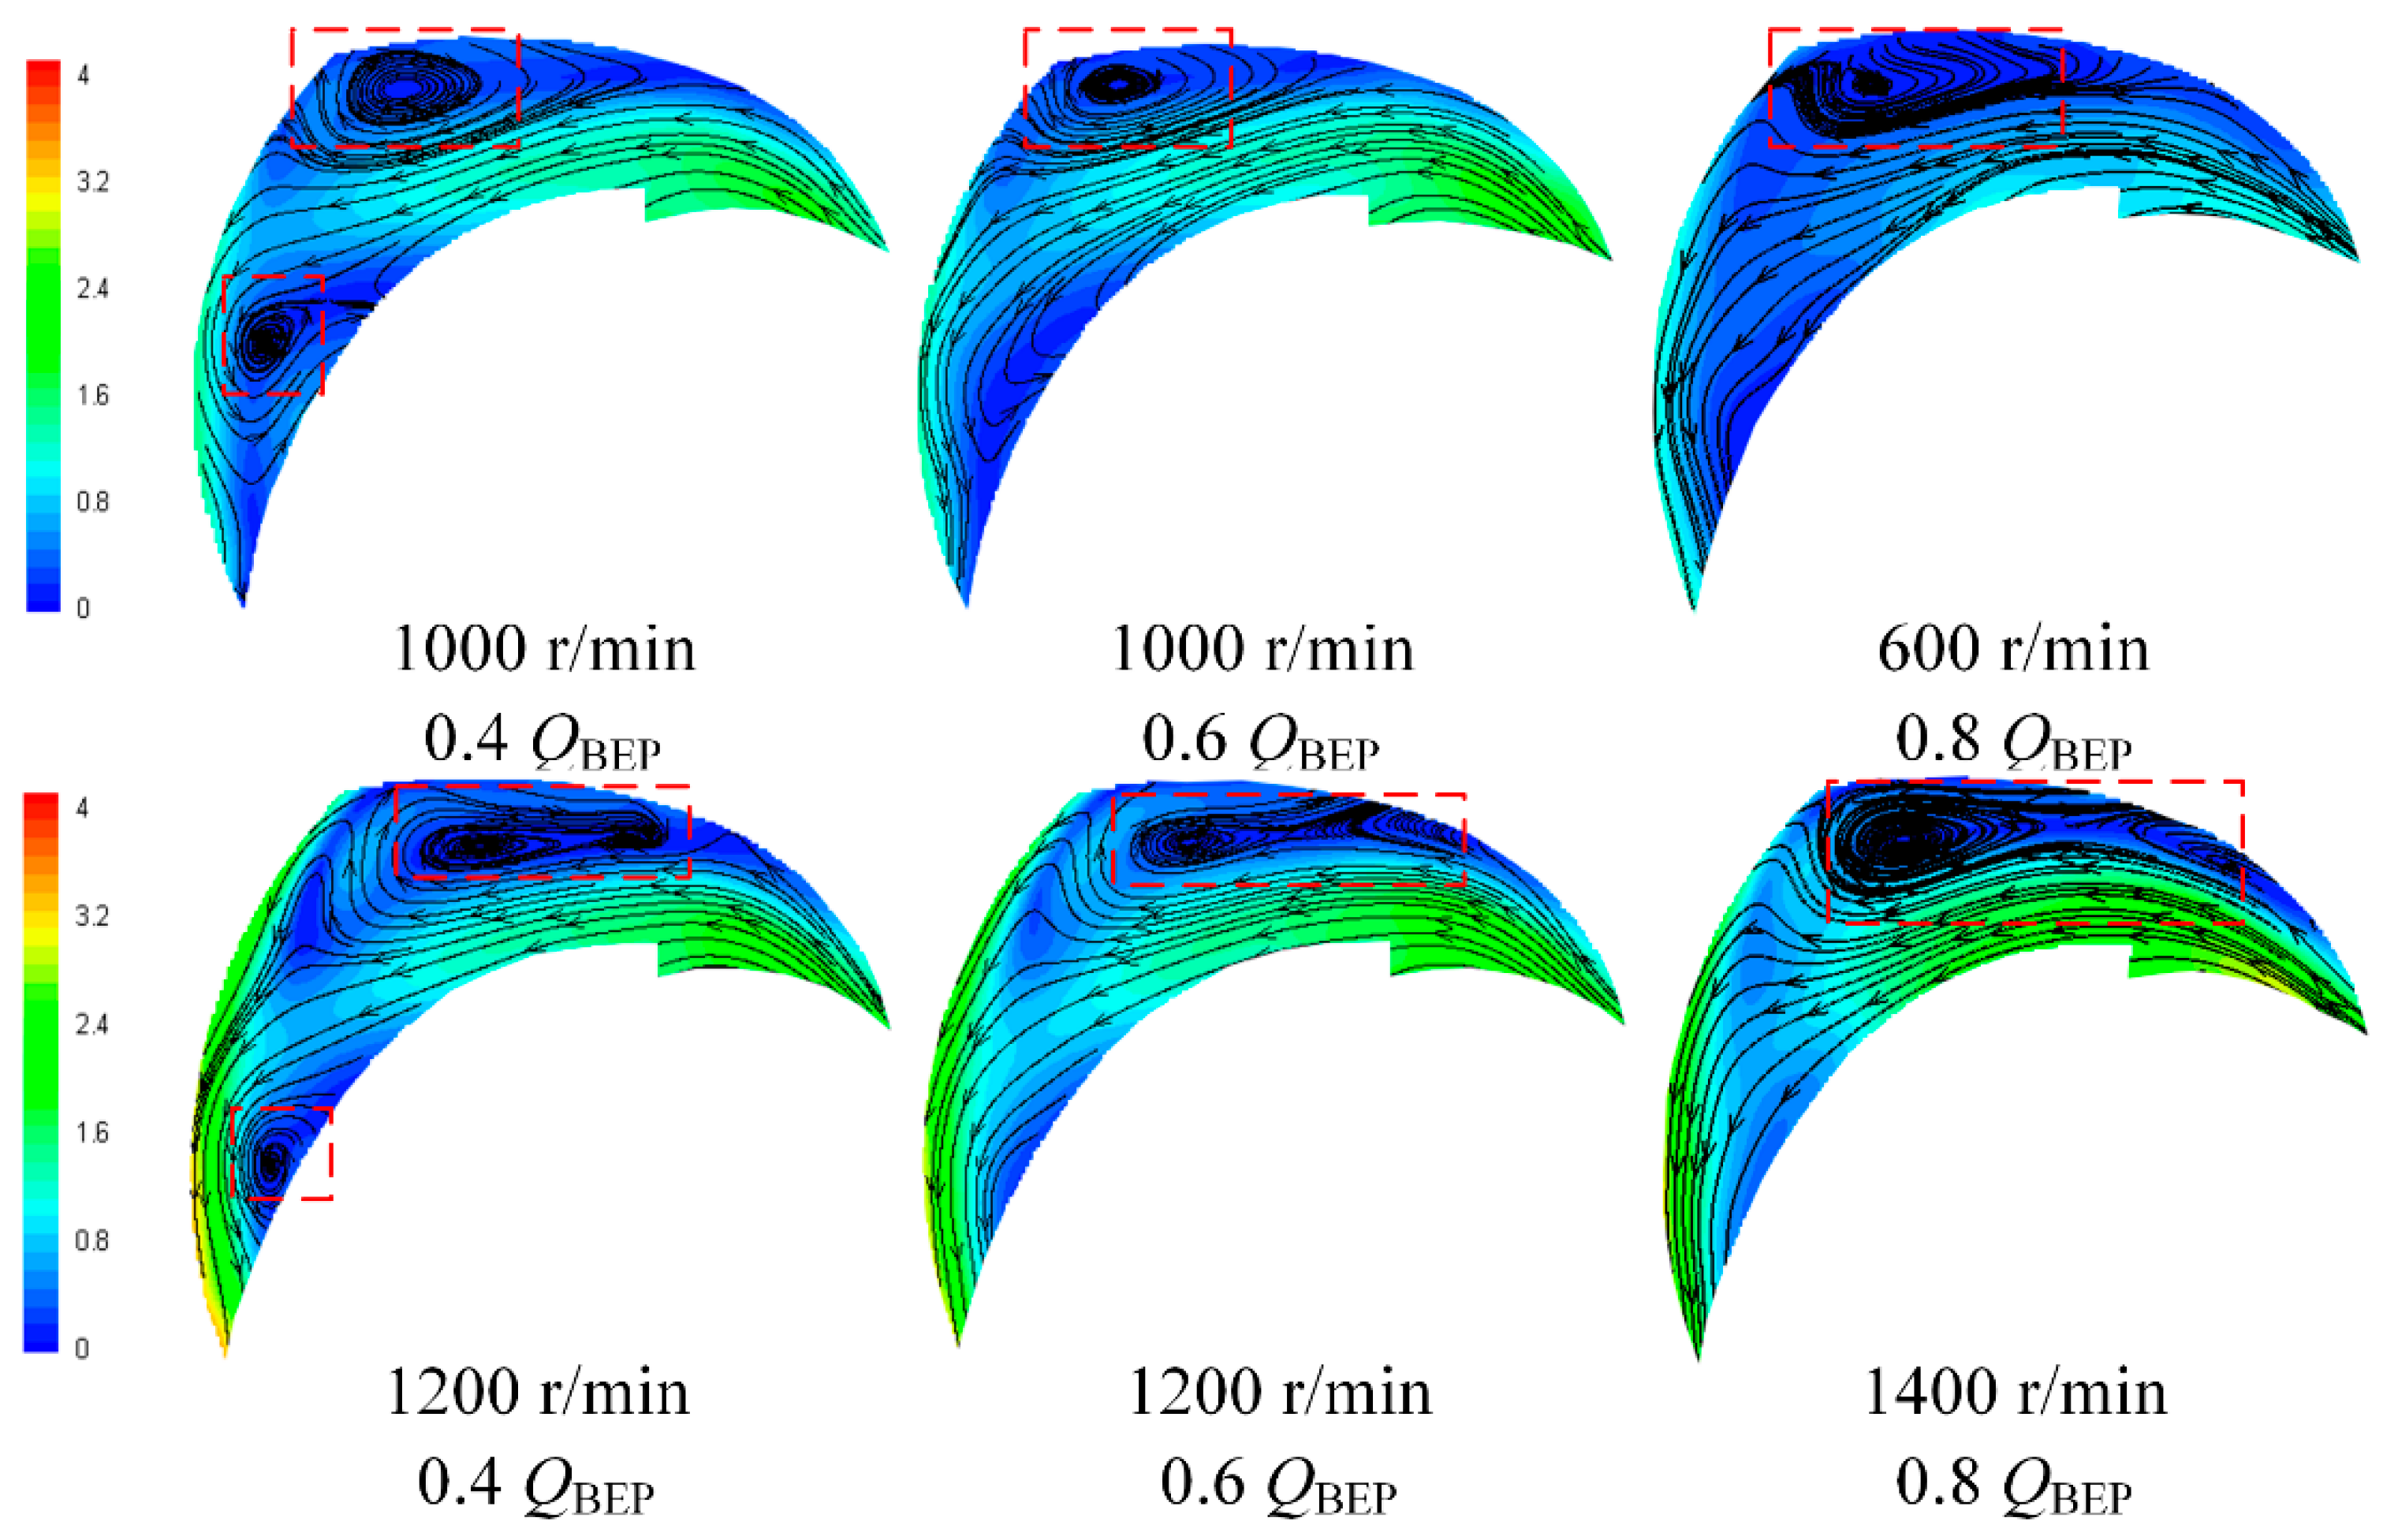
3.2. Discussion on the Vortex in the Flow Channel

Figure 5 shows the position of the arcs over the vortex center and radial area of the vortex: arc 1 represents the position of the arc that through the center of the clockwise vortex, and arc 2 represents the position of the arc that through the center of the counterclockwise vortex. The radial scale is the length of the meridian between edge 1 and edge 2 [30]. Edge 1 and edge 2 represent the initial and end radial position of the vortexes, respectively.
Figure 6 shows the radial scales of the clockwise vortex and the counterclockwise vortex under the five rotational speeds. It can be seen that the clockwise vortex was larger in scale than the counterclockwise vortex in the radial direction. The clockwise vortex was caused by the increase of the incidence impulse angle, while the counterclockwise vortex was generated by the blocking effect of the clockwise vortex [7]. The clockwise vortex and counterclockwise vortex tended to increase in scale with the decrease of the flow rates. The scale of counterclockwise vortex behaved more consistently and increased slowly with the decrease of flow rates.
The relationship between the distance from the vortex center to the impeller rotation axis (r) under different flow rates and rotational speeds is shown in Figure 7. The diagram of r and rm is shown in Figure 2b. For the clockwise vortex, r decreased with the decrease in the flow rate, and vice versa for the counterclockwise vortexes. At the same time, it can be seen that the position of clockwise vortex center showed a tendency to move toward the impeller inlet with the decrease of the flow rate at different rotational speeds. For the rotational speed of 600 r/min, 800 r/min, and 1000 r/min, it appears that the position of the clockwise vortex center was closer to the impeller outlet with the decrease of rotational speed. Compared with other rotational speeds, the position of the clockwise vortex center was closer to the impeller outlet under the rotational speed of 1200 r/min and 1400 r/min. This is due to the appearance of the secondary vortex at the rotational speed of 1200 r/min and 1400 r/min. The position of the counterclockwise vortex center gradually moved toward the impeller inlet with the increase of rotational speed. At the rotational speed of 600 r/min, the counterclockwise vortex center appeared much closer to the impeller outlet than that at other rotational speeds.
In this paper, we focused on the effect of rotational speeds and flow rates on the internal flow pattern inside the impeller. Additionally, we concentrated on the analysis of the scale size of the vortex and position of the vortex center in the flow channel, and specifically analyzed how vortexes affect the blade load distribution.

4. Effect of Flow Pattern in the Flow Channel on the Blade Load Distribution

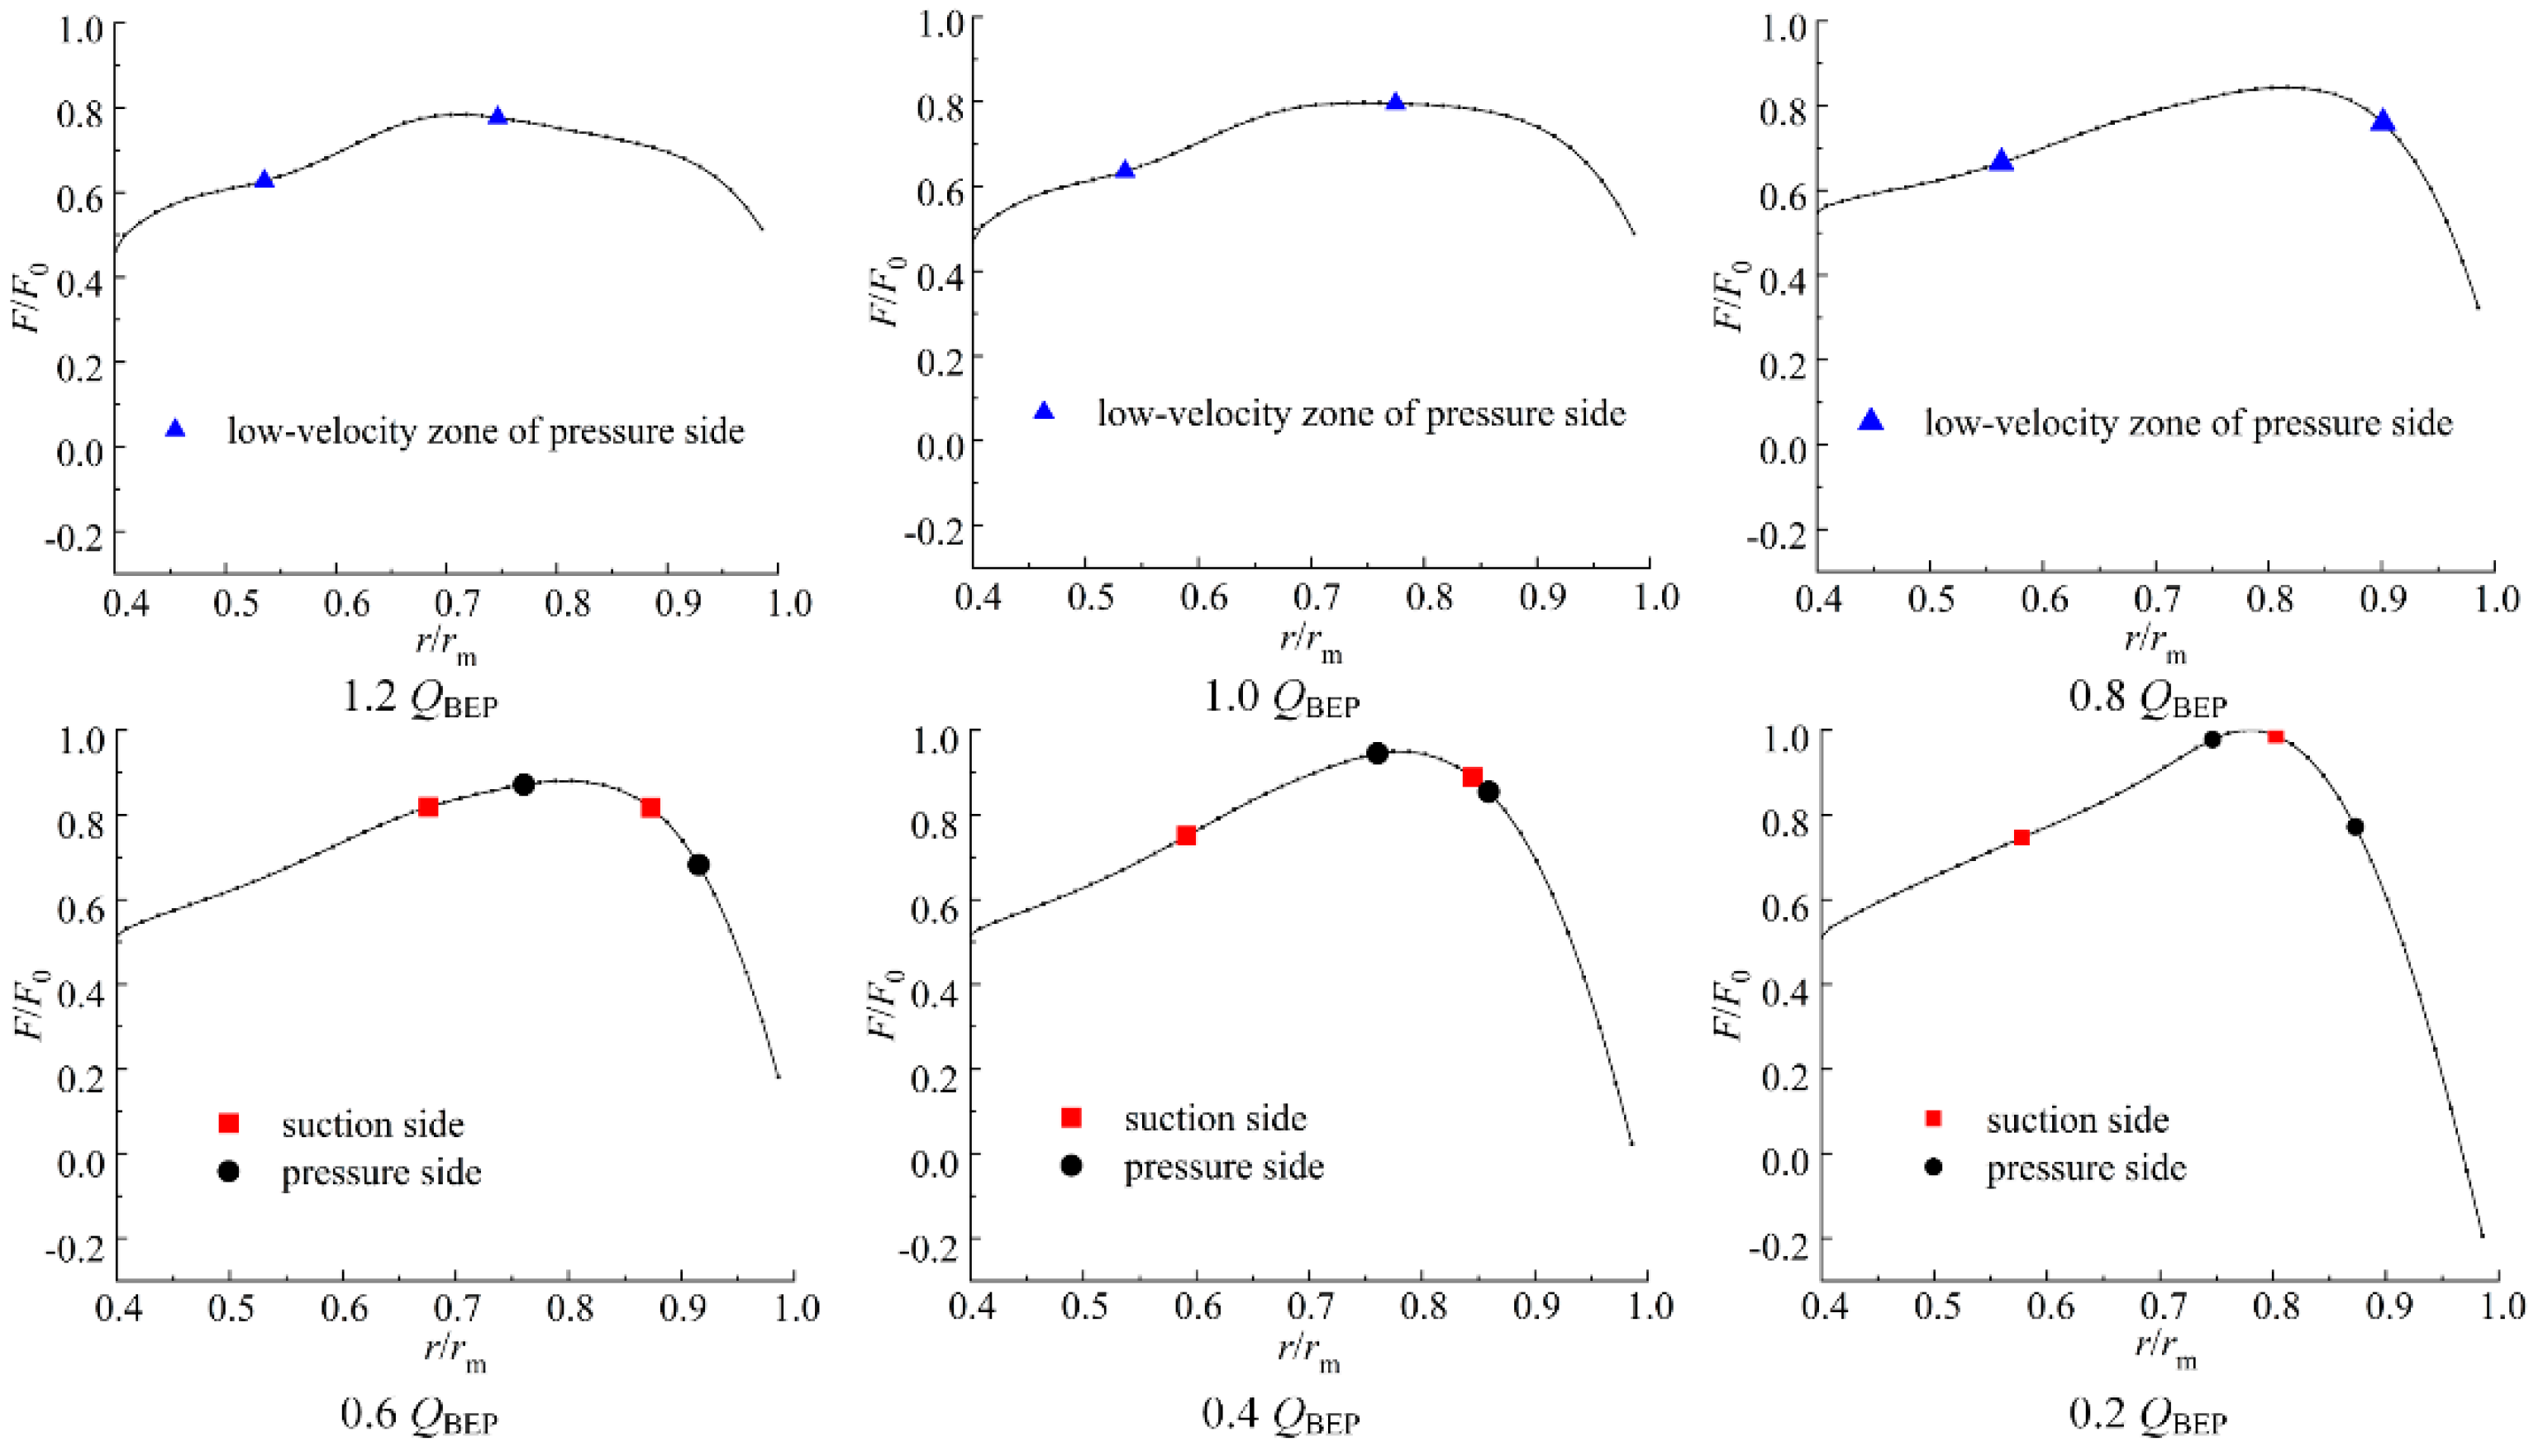
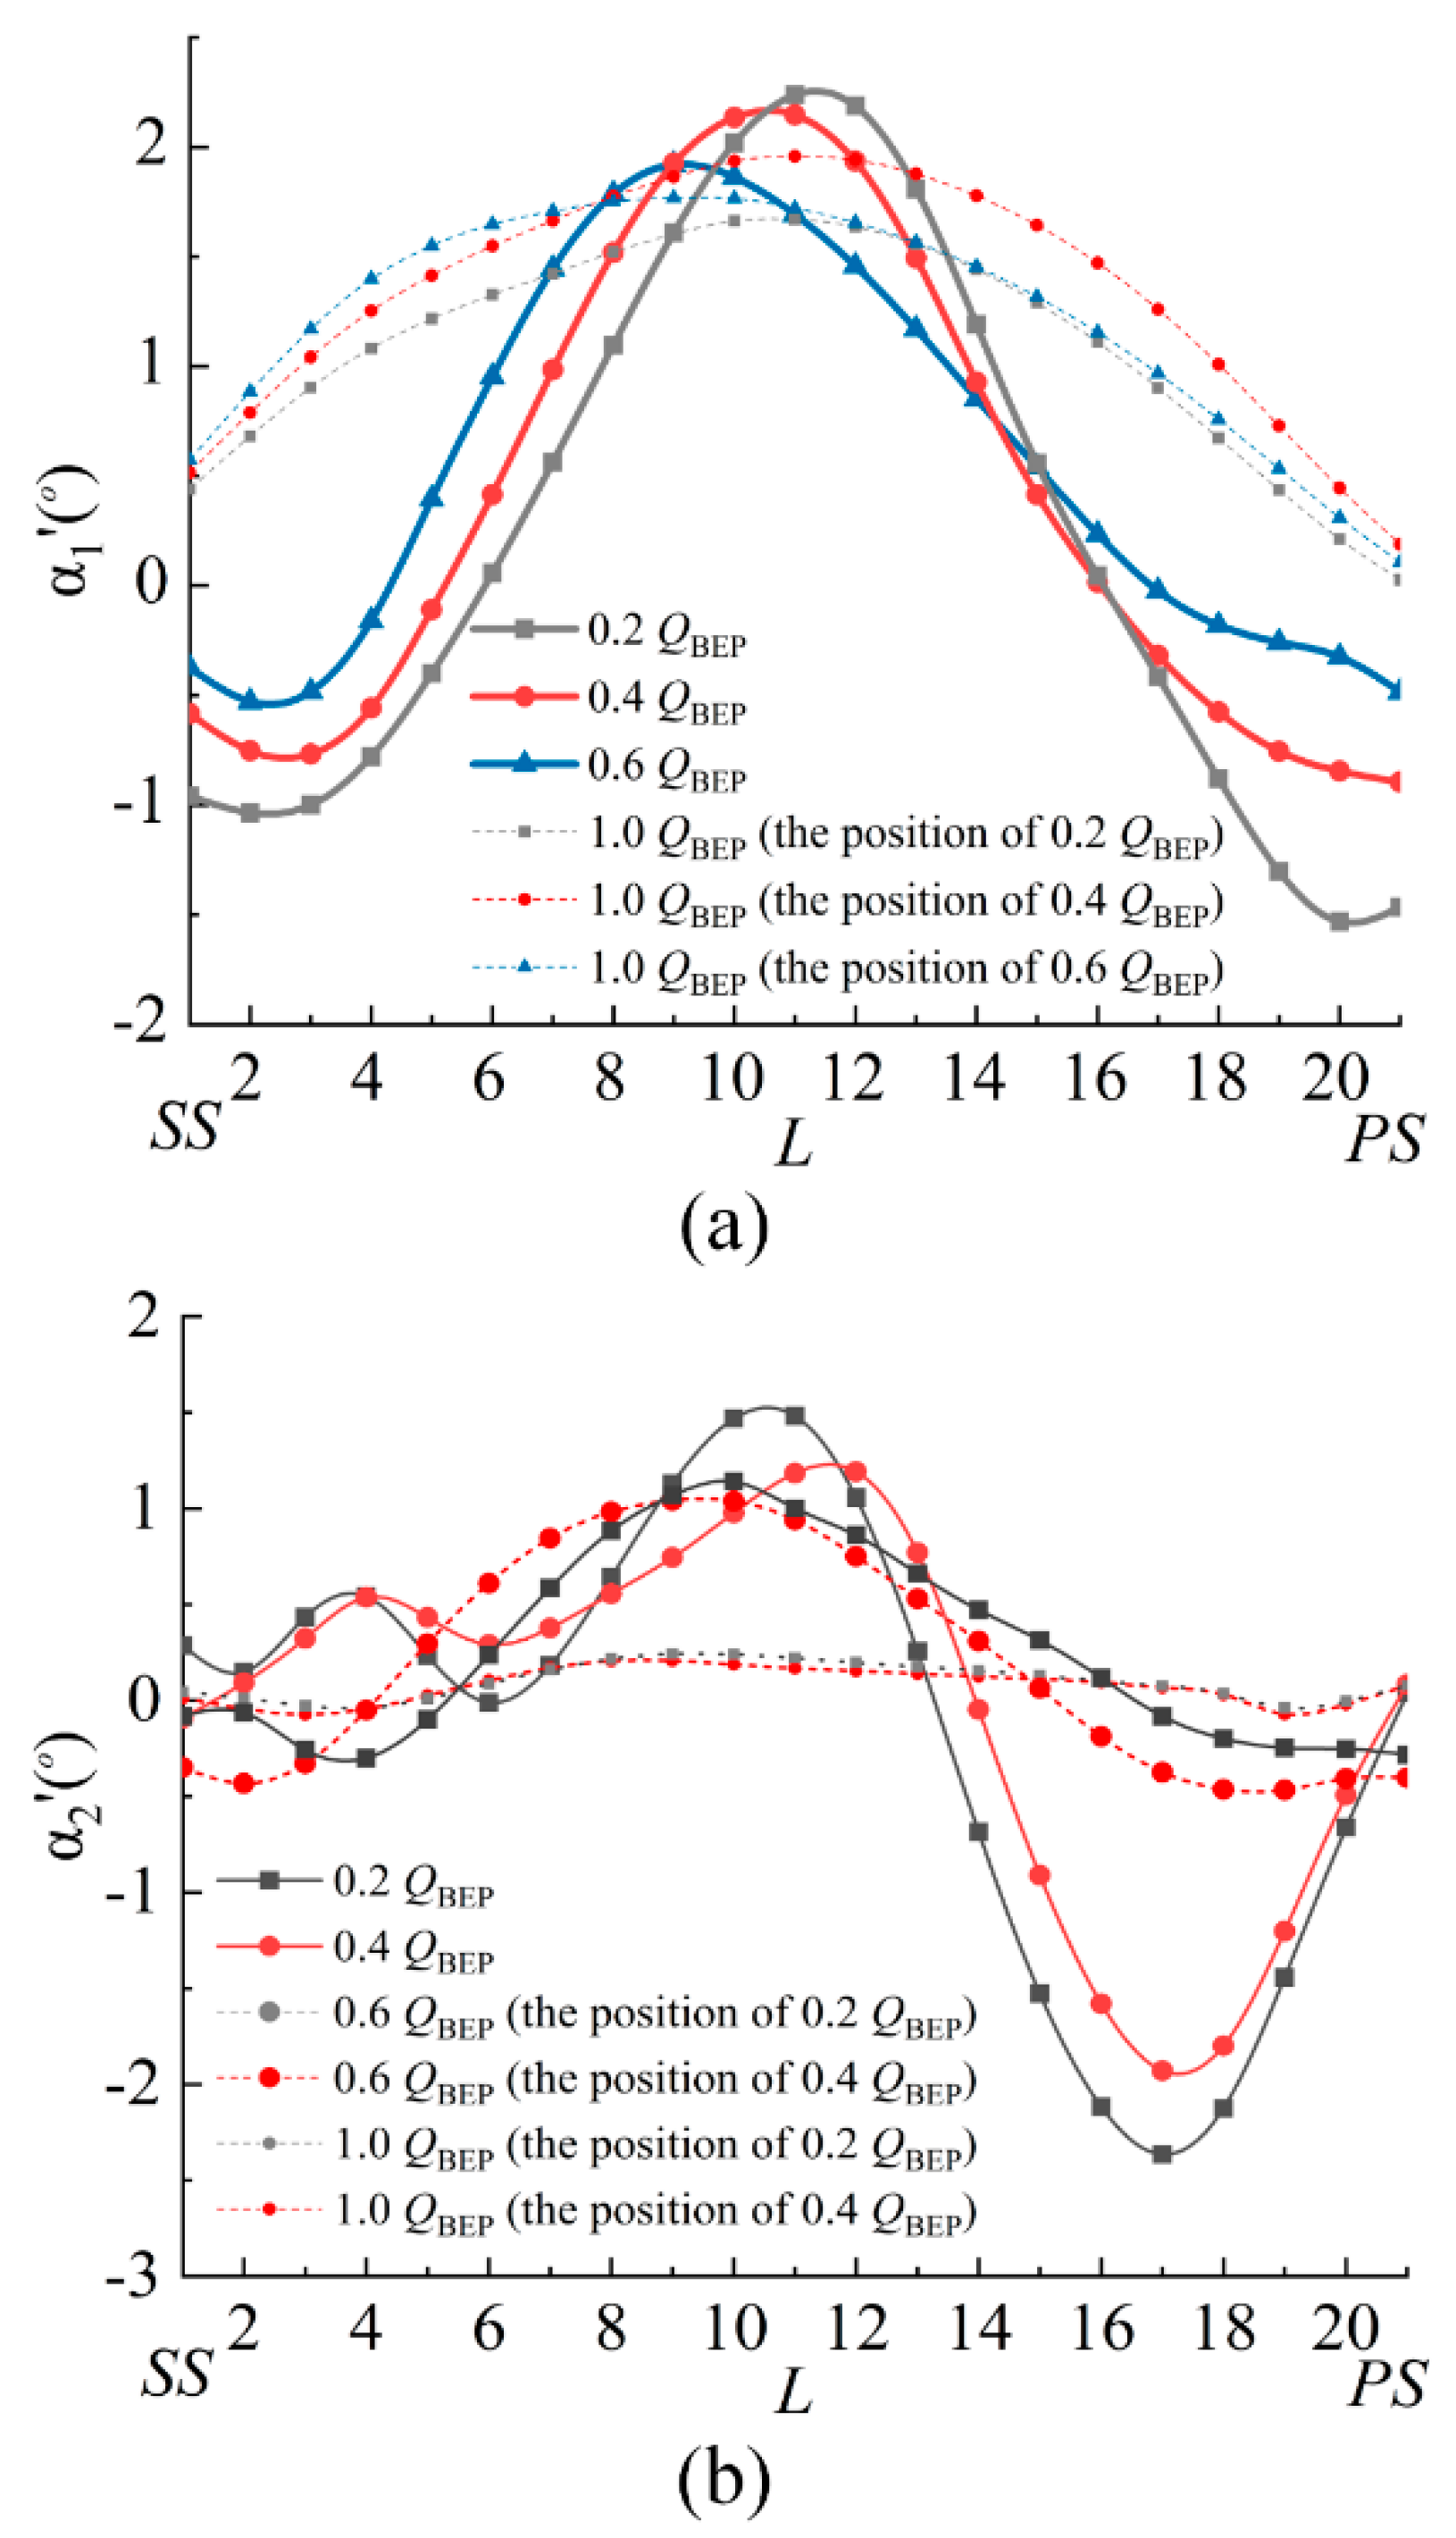
4.1. Correlation of Internal Flow Pattern and Blade Load

From the above analysis, it can be seen that the internal flow patterns were basically the same with the variation of flow rates for different rotational speeds. Therefore, the flow patterns at the rotational speed of 800 were selected as examples for analysis. The correlation between the internal flow pattern and the blade load distribution is shown in Figure 8. For the flow rates of 0.2 QBEP, 0.4 QBEP, and 0.6 QBEP, the distribution curves can be divided into two sections: the first section of the blade load distribution curves was in the rising stage, which manifested as a slow increase, and then it started to reach the highest point linearly and rapidly. The second section decreased until the outlet. While, for the flow rates of 0.8 QBEP to 1.2 QBEP, the first section of the blade load curves increased slowly with a smaller slope, and the second section of the blade load curves decreased slightly until the outlet. This is also consistent with the conclusion mentioned in the paper by Li et al. [24]: the higher slope of the load curve, the lower pump efficiency. This indicates that the flow blockage and hydraulic losses in the impeller channel will increase when the slope of the blade load curve increases.
To analyze the correlation between the flow pattern inside the impeller and the blade load, the location of low-velocity-zone of pressure side, the vortex leading edge (the front point) and the vortex center (the latter point) are also shown in Figure 8. It can be seen that for the flow rates of 0.8 QBEP to 1.2 QBEP, the position where the blade load distribution curve began to increase rapidly coincided with the position where the low-velocity-zone started to appear on the pressure side. The peak position coincided with the end of the low-velocity zone. For the flow rates from 0.2 QBEP to 0.6 QBEP, the position of the blade load distribution curve began to increase rapidly, coincided with the initial position of the clockwise vortex on the suction side, and the peak position coincided with the position of core area of the clockwise vortex. The position where the blade load starts to decrease coincided with the initial position of the counterclockwise vortex on the pressure side. The blade load kept increasing when the clockwise vortex appeared. When the counterclockwise vortex appeared, the blade load increased a little, and at this time the strength of the clockwise vortex was greater than that of the counterclockwise vortex. When the strength of counterclockwise vortex was greater than that of the clockwise vortex, the blade load curve started to decrease rapidly at core area of the counterclockwise vortex. It is inferred that the vortex on the suction side increases the blade load, while the vortex on the pressure side decreases the blade load.
Combining Equations (1)–(4), the blade load is related with the absolute flow angle. Therefore, the absolute flow angle was used as an intermediate medium to correlate the flow pattern with the blade load. Figure 9 shows the mean absolute flow angle distribution along the meridian. It can be seen that the overall trends of the mean absolute flow angle distribution behaved similarly under different rotational speeds. When the rotational speed increased, the curve became steeper under the same flow rates. For the flow rates of 0.2 QBEP to 0.6 QBEP, the mean absolute flow angle curve dropped slowly from the inlet to the outlet. After the position of r/rm = 0.8, the mean absolute flow angle’s behavior was almost unchanged. For the flow rates from 0.8 QBEP to 1.2 QBEP, the mean absolute flow angle curve decreased more rapidly than that at the flow rates from 0.2 QBEP to 0.6 QBEP. In addition, combined with the analysis of the blade load curve, it can be seen that the blade load curve had an upward trend in the first half of the curve, which was opposite to the distribution trend of the mean absolute flow angle. This is because that as the decrease of absolute flow angle α , the tan α decreases, resulting in the increase of V θ , which coincides with Equation (1). The mean absolute flow angle decreased slowly near the trailing edge of the blade. As a result, the mean absolute flow angle had little effect on the blade load near the impeller outlet. Therefore, the blade load was mainly affected by the variation of the blade profile near the impeller outlet.
In addition, it was found that the blade load distribution trends for some flow rates and some rotational speeds were different from the overall distribution trend. At the rotational speeds of 600 r/min and 1400 r/min, the blade load distribution curves for the flow rate of 0.8 QBEP were closer to the flow rate of 0.6 QBEP compared with the situation at other rotational speeds. For the rotational speeds of 1000 r/min and 1200 r/min, at flow rate of 0.6 QBEP, the development trend of the first half blade load distribution curves were consistent with that at the flow rate of 0.2 QBEP and 0.4 QBEP. However, the latter half of the curves began to move away from that at the flow rates of 0.2 QBEP and 0.4 QBEP, and the positions of the maximum values were significantly closer to the impeller outlet. The specific values are shown in Table 3.

4.2. Reasons for the Difference in Blade Load

The blade load is related with the absolute flow angle, which related to the flow pattern in turn. Therefore, it is necessary to describe how the vortexes affect the distribution of the absolute flow angle. Figure 10a shows the distributions of the absolute flow angle along arc 1 (across the position of the clockwise vortex center) at the flow rates of 0.2 QBEP, 0.4 QBEP, 0.6 QBEP, and 1.0 QBEP under the rotational speed of 1000 r/min, respectively. Arc 1 and arc 2 are shown in Figure 5. When the vortex appears on the suction side (at flow rates of 0.2 QBEP, 0.4 QBEP, 0.6 QBEP), the absolute flow angle curves decreased slightly at first, then increased rapidly, and then decreased until the outlet. An interesting phenomenon was also found: the first half of the curve basically coincided with the spanwise area of the clockwise vortex. At the flow rate of 1.0 QBEP, it can be seen that the absolute flow angle distribution curve was much flatter. In addition, when the vortex appeared, the sharp increase and decrease process occurred for the absolute flow angle. Although the maximum value of the absolute flow angle was larger than that without vortex, the growth gradient was so large that the average value was smaller than that without vortex. Therefore, the overall blade load was increased. Figure 10b shows the distribution of the absolute flow angle along arc 2 (across the position of the counterclockwise vortex center). When the counterclockwise vortex appeared (0.2 QBEP, 0.4 QBEP), the absolute flow angle fluctuated along the curve at first. Then, in the region corresponding to the counterclockwise vortex, it became negative, decreased sharply, and rose again after reaching the minimum value. At the flow rate of 0.6 QBEP, only the clockwise vortex appeared, and the position of arc 2 could not be determined. For comparison, the positions of arc 2 at the flow rates of 0.2 QBEP and 0.4 QBEP were selected for the flow rate of 0.6 QBEP. It can be seen that their distribution trend was consistent with that along arc 1 when the clockwise vortex appeared. When the flow rate was 1.0 QBEP, the absolute flow angle distribution changed a little, and the value remained around zero. From the above analysis, it can be seen that the appearance of the counterclockwise vortex causes the absolute flow angle to become negative and make the overall blade load become negative, resulting in the unloading of the blade load.
Figure 11 shows the flow patterns of the flow rates of 0.4 QBEP, 0.6 QBEP, and 0.8 QBEP at the rotational speeds of 600 r/min, 1000 r/min, 1200 r/min, and 1400 r/min. At the rotational speeds of 600 r/min and 1400 r/min, for the flow rate of 0.8 QBEP, it can be seen that the clockwise vortex appeared, which caused the blade load distribution curve to be closer to the curve at flow rate of 0.6 QBEP. At the rotational speeds of 1000 r/min and 1400 r/min, only the clockwise vortex appeared, while at the flow rate of 0.4 QBEP, both vortexes appeared. For the flow rate of 0.6 QBEP, the unloading effect of the counterclockwise vortex disappeared, which made the blade load curve smoother and the length of its growth section longer than that at the flow rate of 0.4 QBEP.
According to the previous analysis, the vortex in the channel affected the absolute flow angle distribution and redistributed the blade load. The clockwise vortex made the position of maximum blade load move toward the blade outlet. It also made the value of the maximum blade load become larger. The counterclockwise vortex made the position of maximum blade load move toward the blade inlet, and caused the unloading of the blade load.

5. Conclusions

In this paper, the blade load distribution in the pump was obtained through a PIV experiment. The characteristics of blade load were analyzed, and the specific correlation between blade load distribution and internal flow pattern were discussed.
(i)
Based on the PIV method, the images taken in the test were converted into usable relative velocity field data through a series of post-processing. On this basis, the concept of the circumferential mean angular momentum was innovatively used to obtain the blade load value.
(ii)
The scale of counterclockwise vortex was smaller than that of clockwise vortex. In general, the scale of both type vortexes increased with the decrease of rotational speed. The positions of the vortex centers were distributed in the range of r/rm = 0.77–0.9, and the peak blade loads were located at the position of r/rm = 0.75–0.85.
(iii)
The blade load distribution along the impeller channel was interrelated with the flow pattern. The vortexes redistributed blade load by changing the absolute flow angle of the flow. Additionally, the clockwise vortex made the position of the maximum blade load closer to the outlet, while the counterclockwise vortex had the opposite effect. Additionally, the number of vortexes in the flow channel influenced the blade load distribution.

Author Contributions

Conceptualization, B.C. and Z.Z.; methodology, X.L.; validation, B.C. and Z.Z.; investigation, X.C.; data curation, X.C.; writing—original draft preparation, X.C.; writing—review and editing, B.C.; visualization, X.C.; funding acquisition, B.C., Z.Z. and X.L. All authors have read and agreed to the published version of the manuscript.

Funding

Project supported by the National Natural Science Foundation of China (Grant Nos. 51806197, 51976202), the Natural Science Foundation of Zhejiang Province (Grant No. LY20E060006) and the Key Research and Development Program of Zhejiang Province (Grant No. 2021C05006), Top-notch Talent Support Program of Zhejiang Province (2019R51002), the Fundamental Research Funds of Zhejiang Sci-Tech University (2021Q017).

Informed Consent Statement

Informed consent was obtained from all individual participants included in the study.

Data Availability Statement

The data used to support the findings of this study are included within the article.

Conflicts of Interest

The authors declare that they have no conflict of interest.

Ethical Approval

This article does not contain any studies with human participants or animals performed by any of the authors.

References

  1. Shigemitsu, T.; Ogawa, Y.Y.; Nakaishi, E. PIV Measurement of Internal Flow in Mini Centrifugal Pump. Int. J. Fluid Mach. Syst. 2019, 12, 251–260. [Google Scholar] [CrossRef]
  2. Zhang, L.; Wang, C.; Zhang, Y.C.; Xiang, W.; He, Z.M.; Shi, W.D. Numerical study of coupled flow in blocking pulsed jet impinging on a rotating wall. J. Braz. Soc. Mech. Sci. Eng. 2021, 43, 508. [Google Scholar] [CrossRef]
  3. Zhou, J.R.; Zhao, M.M.; Wang, C.; Gao, Z.J. Optimal design of diversion piers of lateral intake pumping station based on orthogonal test. Shock Vib. 2021, 5, 6616456. [Google Scholar] [CrossRef]
  4. Wang, H.L.; Hu, Q.X.; Yang, Y.; Wang, C. Performance differences of electrical submersible pump under variable speed schemes. Int. J. Simul. Model. 2021, 20, 76–86. [Google Scholar] [CrossRef]
  5. Shi, L.J.; Zhu, J.; Tang, F.P.; Wang, C. Multi-Disciplinary optimization design of axial-flow pump impellers based on the approximation model. Energies 2020, 13, 779. [Google Scholar] [CrossRef] [Green Version]
  6. Zhu, Y.; Li, G.P.; Wang, R.; Tang, S.N.; Su, H.; Cao, K. Intelligent fault diagnosis of hydraulic piston pump combining improved LeNet-5 and PSO hyperparameter optimization. Appl. Acoust. 2021, 183, 108336. [Google Scholar] [CrossRef]
  7. Wang, Y.P.; Yang, H.; Chen, B.; Gao, P.L.; Zhu, Z.C. Analysis of vortexes formed in flow channel of a five-bladed centrifugal water pump by means of PIV method. AIP Adv. 2019, 9, 075011. [Google Scholar] [CrossRef] [Green Version]
  8. Atkins, M.D.; Kim, T. Isotropic-planar illumination for PIV experiments. Exp. Fluids 2015, 56, 63. [Google Scholar] [CrossRef]
  9. Zhang, N.; Gao, B.; Li, Z.; Daisy, N. Unsteady flow structure and its evolution in a low specific speed centrifugal pump measured by PIV. Exp. Therm. Fluid Sci. 2018, 97, 133–144. [Google Scholar] [CrossRef]
  10. Zhang, D.; Cheng, L.; Li, Y.Y.; Jiao, W.X. The hydraulic performance of twin-screw pump. J. Hydrodyn. 2020, 32, 605–615. [Google Scholar] [CrossRef]
  11. Bennacer, R.; Sefiane, K. Proper orthogonal decomposition (POD) analysis of flow structure in volatile binary droplets. Int. Commun. Heat Mass Transf. 2016, 71, 172–175. [Google Scholar] [CrossRef]
  12. Guo, X.M.; Zhu, Z.C.; Shi, G.P.; Huang, Y. Effects of rotational speeds on the performance of a centrifugal pump with a variable-pitch inducer. J. Hydrodyn. 2017, 29, 854–862. [Google Scholar] [CrossRef]
  13. Si, Q.R.; Dupont, P.; Dazin, A.; Roussette, O.; Yuan, S.Q.; Bayeul, A. An Experimental Study of the Flow Field Inside the Diffuser Channel of a Laboratory Centrifugal Pump. J. Fluids Eng. 2015, 137, 061105. [Google Scholar] [CrossRef]
  14. Wu, Y.L.; Liu, S.H.; Yuan, H.J.; Shao, J. PIV measurement on internal instantaneous flows of a centrifugal pump. Sci. China Technol. Sci. 2011, 54, 270–276. [Google Scholar] [CrossRef]
  15. Li, X.J.; Chen, H.; Chen, B.; Luo, X.W.; Yang, B.F.; Zhu, Z.C. Investigation of flow pattern and hydraulic performance of a centrifugal pump impeller through the PIV method. Renew. Energ. 2020, 162, 561–574. [Google Scholar] [CrossRef]
  16. Westra, R.W.; Broersma, L.; Kruyt, N.P.; Van, K. PIV Measurements and CFD Computations of Secondary Flow in a Centrifugal Pump Impeller. J. Fluids Eng. 2010, 132, 061104. [Google Scholar] [CrossRef]
  17. Yu, S.C.M.; Chua, L.P.; Leo, H.L. The angle-resolved velocity measurements in the impeller passages of a model bio-centrifugal pump. Proc. Inst. Mech. Eng. Part C J. Mech. Eng. Sci. 2001, 215, 547–568. [Google Scholar] [CrossRef]
  18. Liu, H.L.; Wang, K.; Kim, H.B.; Tan, M.G. Experimental investigation of the unsteady flow in a double-blade centrifugal pump impeller. Sci. China Technol. Sci. 2013, 56, 812–817. [Google Scholar] [CrossRef]
  19. Gaetani, P.; Boccazzi, A.; Sala, R. Low field in the vaned diffuser of a centrifugal pump at different vane setting angles. J. Fluids Eng. 2012, 134, 031101. [Google Scholar] [CrossRef]
  20. Wang, L.K.; Lu, J.L.; Liao, W.L.; Wang, W. Numerical analysis of the formation mechanism and suppression method of the reverse flow in a semi-open centrifugal pump. J. Mech. Sci. Technol. 2020, 34, 3667–3678. [Google Scholar] [CrossRef]
  21. Poujol, N.; Trébinjac, I.; Duquesne, P. Effects of inlet guide vanes on the performance and stability of an aeronautical centrifugal compressor. J. Turbomach. 2020, 143, 101010. [Google Scholar] [CrossRef]
  22. Chalghoum, I.; Elaoud, S.; Kanfoudi, H.; Akrout, M. The effects of the rotor-stator interaction on unsteady pressure pulsation and radial force in a centrifugal pump. J. Hydrodyn. 2018, 30, 672–681. [Google Scholar] [CrossRef]
  23. Zhang, R.H.; Guo, R.; Yang, J.H.; Luo, J.Q. Inverse Method of Centrifugal Pump Impeller Based on Proper Orthogonal Decomposition (POD) Method. Chin. J. Mech. Eng. 2017, 30, 1025–1031. [Google Scholar] [CrossRef]
  24. Li, X.J.; Gao, P.L.; Zhu, Z.C.; Li, Y. Effect of the blade loading distribution on hydrodynamic performance of a centrifugal pump with cylindrical blades. J. Mech. Sci. Technol. 2018, 32, 1161–1170. [Google Scholar] [CrossRef]
  25. Li, J.W.; Zhang, Y.N.; Yu, J.X. Experimental investigations of a prototype reversible pump turbine in generating mode with water head variations. Sci. China Technol. Sci. 2018, 61, 604–611. [Google Scholar] [CrossRef]
  26. Zhang, Y.N.; Chen, T.; Li, J.W.; Yu, J.X. Experimental Study of Load Variations on Pressure Fluctuations in a Prototype Reversible Pump Turbine in Generating Mode. J. Fluids Eng. 2017, 139, 074501. [Google Scholar] [CrossRef]
  27. Sun, W.Y.; Huang, G.F. Integrated lifting line/surface panel method for optimal propeller design with consideration of hub effect. J. Hydrodyn. 2019, 31, 1218–1230. [Google Scholar] [CrossRef]
  28. Durante, D.; Dubbioso, G.; Testa, C. Simplified hydrodynamic models for the analysis of marine propellers in a wake-field. J. Hydrodyn. 2013, 25, 954–965. [Google Scholar] [CrossRef]
  29. Li, X.J.; Chen, B.; Luo, X.W.; Zhu, Z.C. Effects of flow pattern on hydraulic performance and energy conversion characterisation in a centrifugal pump. Renew. Energy 2020, 151, 475–487. [Google Scholar] [CrossRef]
  30. Fujiwara, K.; Sriram, R.; Kontis, K. Experimental investigations on the sharp leading-edge separation over a flat plate at zero incidence using particle image velocimetry. Exp. Fluids 2020, 61, 205. [Google Scholar] [CrossRef]
Figure 1. Outline of the test rig.
Machines 10 00040 g001
Figure 2. Schematic of flow channel meridian (a) and side view of the impeller (b); r is the distance from the vortex center to the origin of the impeller, rm is the distance from the impeller outlet to the origin of the impeller.
Machines 10 00040 g002
Figure 3. Blade load distribution curve under the five rotational speeds.
Machines 10 00040 g003
Figure 4. Flow streamlines for the five rotational speeds at the flow rate of 0.2 QBEP.
Machines 10 00040 g004
Figure 5. Radial scale of the vortex and the arc that through the vortex center.
Machines 10 00040 g005
Figure 6. Radial scales of the clockwise vortex (a) and the counterclockwise vortex (b) at the five rotational speeds.
Machines 10 00040 g006
Figure 7. Movement of the clockwise vortex center (a) and the counterclockwise vortex (b) at different rotational speeds.
Machines 10 00040 g007
Figure 8. Blade load distribution and the position of the vortexes under different flow rates. For 0.2–0.6 QBEP: the front point is the position of the leading edge of vortex, the back point is the position of the vortex center. For 0.8–1.2 QBEP: the two points are the position of the leading edge and back edge of low-velocity-zone in the pressure side, respectively.
Machines 10 00040 g008
Figure 9. The mean absolute flow angle distribution curve under the five rotational speeds.
Machines 10 00040 g009
Figure 10. Absolute flow angle distributions along arc 1 and arc 2 under the rotational speed of 1000 r/min. Suction side (a) and pressure side (b).
Machines 10 00040 g010
Figure 11. Flow streamlines.
Machines 10 00040 g011
Table 1. Main design parameters of the impeller.
Parameter NameValue
Inlet diameter D1 (mm)56
Outlet diameter D2 (mm)142
Inlet angle of blade β1 (°)28
Outlet angle of blade β2 (°)34
Blade width (mm)7
Blade thickness (mm)4
Wrap angle of blade φ (°)96
Specific speed ns23.8
Blade number Z5
Table 2. Optimum flow rates and the corresponding heads for different rotational speeds.
Rotational Speeds
(r/min)
Optimum Flow Points
(m3/h)
Corresponding Heads
(m)
600 r/min1.01.0
800 r/min1.71.5
1000 r/min1.82.67
1200 r/min2.33.7
1400 r/min2.55.05
Table 3. The position of the maximum blade load and the vortex centers.
Rotational SpeedFlowPosition
(Suction Side)
Position
(Pressure Side)
Position
(Maximum Load)
600 r/min0.20.8050.90.76
0.40.8230.8820.775
0.60.8350.8760.785
800 r/min0.20.7750.8850.78
0.40.7930.8640.785
0.60.8120.8520.79
1000 r/min0.20.7730.8710.785
0.40.790.8520.8
0.60.805 0.81
1200 r/min0.20.7820.860.785
0.40.80.850.79
0.60.813 0.805
1400 r/min0.20.7850.8550.74
0.40.8120.8450.745
0.60.820.8360.75
Publisher’s Note: MDPI stays neutral with regard to jurisdictional claims in published maps and institutional affiliations.

