Article

Simulation and Optimization of the Nozzle Section Geometry for a Suspension Abrasive Water Jet

College of Mechanical Electronical and Engineering, Harbin Engineering University, Harbin 150001, China
*
Authors to whom correspondence should be addressed.
Machines 2022, 10(1), 3; https://doi.org/10.3390/machines10010003
Submission received: 5 November 2021 / Revised: 10 December 2021 / Accepted: 17 December 2021 / Published: 21 December 2021
(This article belongs to the Section Advanced Manufacturing)

Abstract

:
In order to improve the life cycle and cutting ability of a suspension abrasive water jet nozzle at the same time, hydrodynamics technology, an enumeration method and multiparameter orthogonal optimization are used to optimize the nozzle section geometry, taking the inlet diameter coefficient of the nozzle, the axial length coefficient of the contraction section and the contraction section curve as optimization variables, and selecting the peak velocity and the unit flow erosion rate as the indicators, it is concluded that the optimal contraction section curve is a Widosinski curve, the optimal inlet diameter coefficient of the nozzle is 0.333 and the optimal axial length coefficient of the contraction section is 2.857. Compared with the commercial product single cone nozzle, the performance of the optimal section nozzle improves by 5.64% and the life cycle increases by 43.2%. On this basis, the effects of operating parameters, including inlet pressure, abrasive particle flow rate and abrasive particle size, are further studied. It is determined that the optimal section nozzle has the best performance under the above operating parameters. It is demonstrated that by optimizing the nozzle section geometry, the cutting capacity and life cycle of the nozzle are improved, the performance of the nozzle can be significantly improved and the optimization of the performance of the nozzle is realized.

1. Introduction

The suspension abrasive water jet cutting system is mainly composed of a booster pump, an abrasive water jet nozzle, an abrasive tank, an abrasive concentration regulator, etc. Among them, the abrasive water jet nozzle is the one of the critical components in the water jet machine, which determines the abrasive water jet cutting ability and the life cycle of the system. Compared with the post-mixed abrasive water jet, the suspension abrasive water jet has the same speed for the abrasive and the water, and produces fewer and smaller local vortices. The runner erosion is basically dominated by small-angle erosion [1,2,3]. However, because the movement of abrasive particles in the fluid in the nozzle is disordered and the density is much higher than that of the medium (water), although the water is highly pressured, its flow performance is still better than that of the abrasive particles. The abrasive particles are subjected to the combined effects of inertial force, causing the abrasive particles to collide with the runner, which is the main cause of nozzle wear.
At this stage, there are two methods to improve the life cycle of the nozzle. The first one is to change the material of the nozzle, using hard materials to make the nozzle, and the second is change the axial section geometry of the nozzle to improve the life cycle of the nozzle. When the jet flow and pressure are determined, the jet power is more sensitive to changes in the nozzle sectional geometry than to change in the water pressure [1], so optimizing the nozzle axial section geometry not only increases the nozzle life cycle, but also improves the cutting ability.
In recent years, water jet theory and techniques have been extensively studied and explored by a wide range of scholars. Oka, Y. and Okamura, K. et al. studied the impact damage of abrasive particles on materials, systematically analyzed the effects of abrasive particle properties, impact parameters, physical and chemical characteristics on erosion and established relevant prediction equations for subsequent studies of nozzle runner erosion [4,5,6,7,8]. On this basis, the nozzle runner erosion was studied extensively. Bozzini, B. et al. used numerical simulation methods for four-phase flow analysis of curved pipes to study wall washout erosion phenomena in multiphase flows consisting of gas and solid abrasive particles and created erosion models [9]. Stack, M.M. et al. studied material erosion and discussed the relative advantages and limitations of CFD modeling with erosion mapping to model the erosion behavior of pure metals [10]. Long, X. et al. numerically simulated the internal flow and particle motion of an abrasive jet nozzle based on the Euler Lagrange method, and calculated the motion trajectory of abrasive particles by using DPM. It was concluded that a longer focusing tube can reduce the circumferential motion of particles, so as to ensure that particles leave the nozzle without large circumferential velocity, and reducing the particle shape factor will improve the particle acceleration process [11]. In research by Kartal, F., the effects of different processing parameters on the surface roughness and the macro and micro surface characteristics were studied by turning AA5083 aluminum alloy workpiece with different diameters by abrasive water jet. It was concluded that turning speed and abrasive flow rate have the greatest influence on surface roughness; when the lathe chuck rotational speed increases, the nozzle forward speed is low, the abrasive flow rate speed is high, and the nozzle approach distance is low, and a smoother macro surface will be obtained [12]. Ma, Q. et al. studied the abrasive recycling of abrasive suspension water jet, and concluded that the recycled abrasive with only large particle impurities being sieved out still has strong cutting ability, and the performance does not decrease significantly after multiple cycles, and the abrasive particle size is controlled at 90 to 180 μM; the quality control of surface roughness is ideal [13]. Anand, U. used a thin oil film on the nozzle runner for a porous nozzle to protect the runner from the impact and shear caused by abrasive particles and prolong the life cycle of the nozzle, but the fabrication process is complicated and the stability needs to be improved [14]. Hashish, M. designed a nozzle runner erosion accelerated wear test to screen different materials of abrasive grains and nozzles to analyze the wear mechanism of nozzles and the main factors affecting the life cycle, and concluded that the erosion mechanism of nozzle runners and the hardness and toughness of nozzle materials had big effects on nozzle life [15]. Nanduri M et al. designed regular wear and accelerated wear test procedures to study the wear under actual and simulated conditions, respectively. The relationship between nozzle wear and abrasive water jet system parameters and nozzle geometry were studied, and an empirical model of nozzle weight loss rate was established [16,17]. Chen, X. et al. optimized the structure of single cone nozzle by simulation and experiments to design a double cone nozzle with longer service life [18]. Zuo, W.Q. et al. established the abrasive particle velocity model of a suspension abrasive jet and solved the problem of the variable drag coefficient by using a real-time contrast interpolation method. The abrasive velocity at the nozzle outlet is determined by factors such as nozzle structure, average abrasive diameter, abrasive density and jet. The high-pressure pipe and nozzle were divided into several sections along the axis, and the numerical solution of abrasive velocity was obtained. The accuracy of the abrasive velocity model of premixed abrasive jet was demonstrated by experiments [19]. In order to study the motion characteristics of abrasive particles and the wear mode of nozzle, Du, MM et al. established the whole process simulation model from high-pressure water and abrasive particles entering the nozzle to the impact of mixed abrasive jet on the workpiece based on SPH-DEM-FEM method. It was found that there was a velocity difference between water and abrasive particles after spraying from the nozzle, and the most serious part of the nozzle wear was the connection between the mixing chamber and focusing tube. The focusing tube was worn unevenly and diffused downward [20].
In order to expand the scope and depth of research on suspension abrasive water jet nozzles, this paper uses CFD software as a simulation tool and optimizes the nozzle section geometry by combining the enumeration method and multiparameter orthogonal optimization, with the minimum runner erosion and maximum peak velocity as the dual optimization objectives.

2. Suspension Abrasive Water Jet Nozzle

In a suspension abrasive water jet, the abrasive laden flow is supplied by a steel pipe to the nozzle with a high pressure and pressed through the nozzle with high speed into the environment with a relative pressure of 0 MPa. This high-speed abrasive laden flow can be used to cut a work piece or open/cut windows or holes on it. The nozzle section needs to be modeled and parameterized for investigation.

2.1. Nozzle Section Geometry

The suspension abrasive water jet nozzle is mainly composed of the contraction section and the focusing section, as shown in Figure 1. In the contraction section the flow velocity is increased as the diameter decreases gradually; in the focus section the flow path is a straight hole and the abrasive particles can be reflected on the wall to make it concentrated around the central line.
In Figure 1, D1 is the pipe diameter, D2 is the inlet diameter of the nozzle, D3 is the diameter of the focusing section, A is the axial length of the contraction section, L is the total length of the nozzle and Sc is the profile of the contraction section.
In order to investigate the relation of geometrical parameters, this paper defines the axial length coefficient of the contraction section λC as the ratio of the axial length of the contraction section A to the difference between the inlet diameter D2 and the diameter of the focusing section D3, and the inlet diameter coefficient λi, as the ratio of the inlet diameter D2 to the pipe diameter D1.
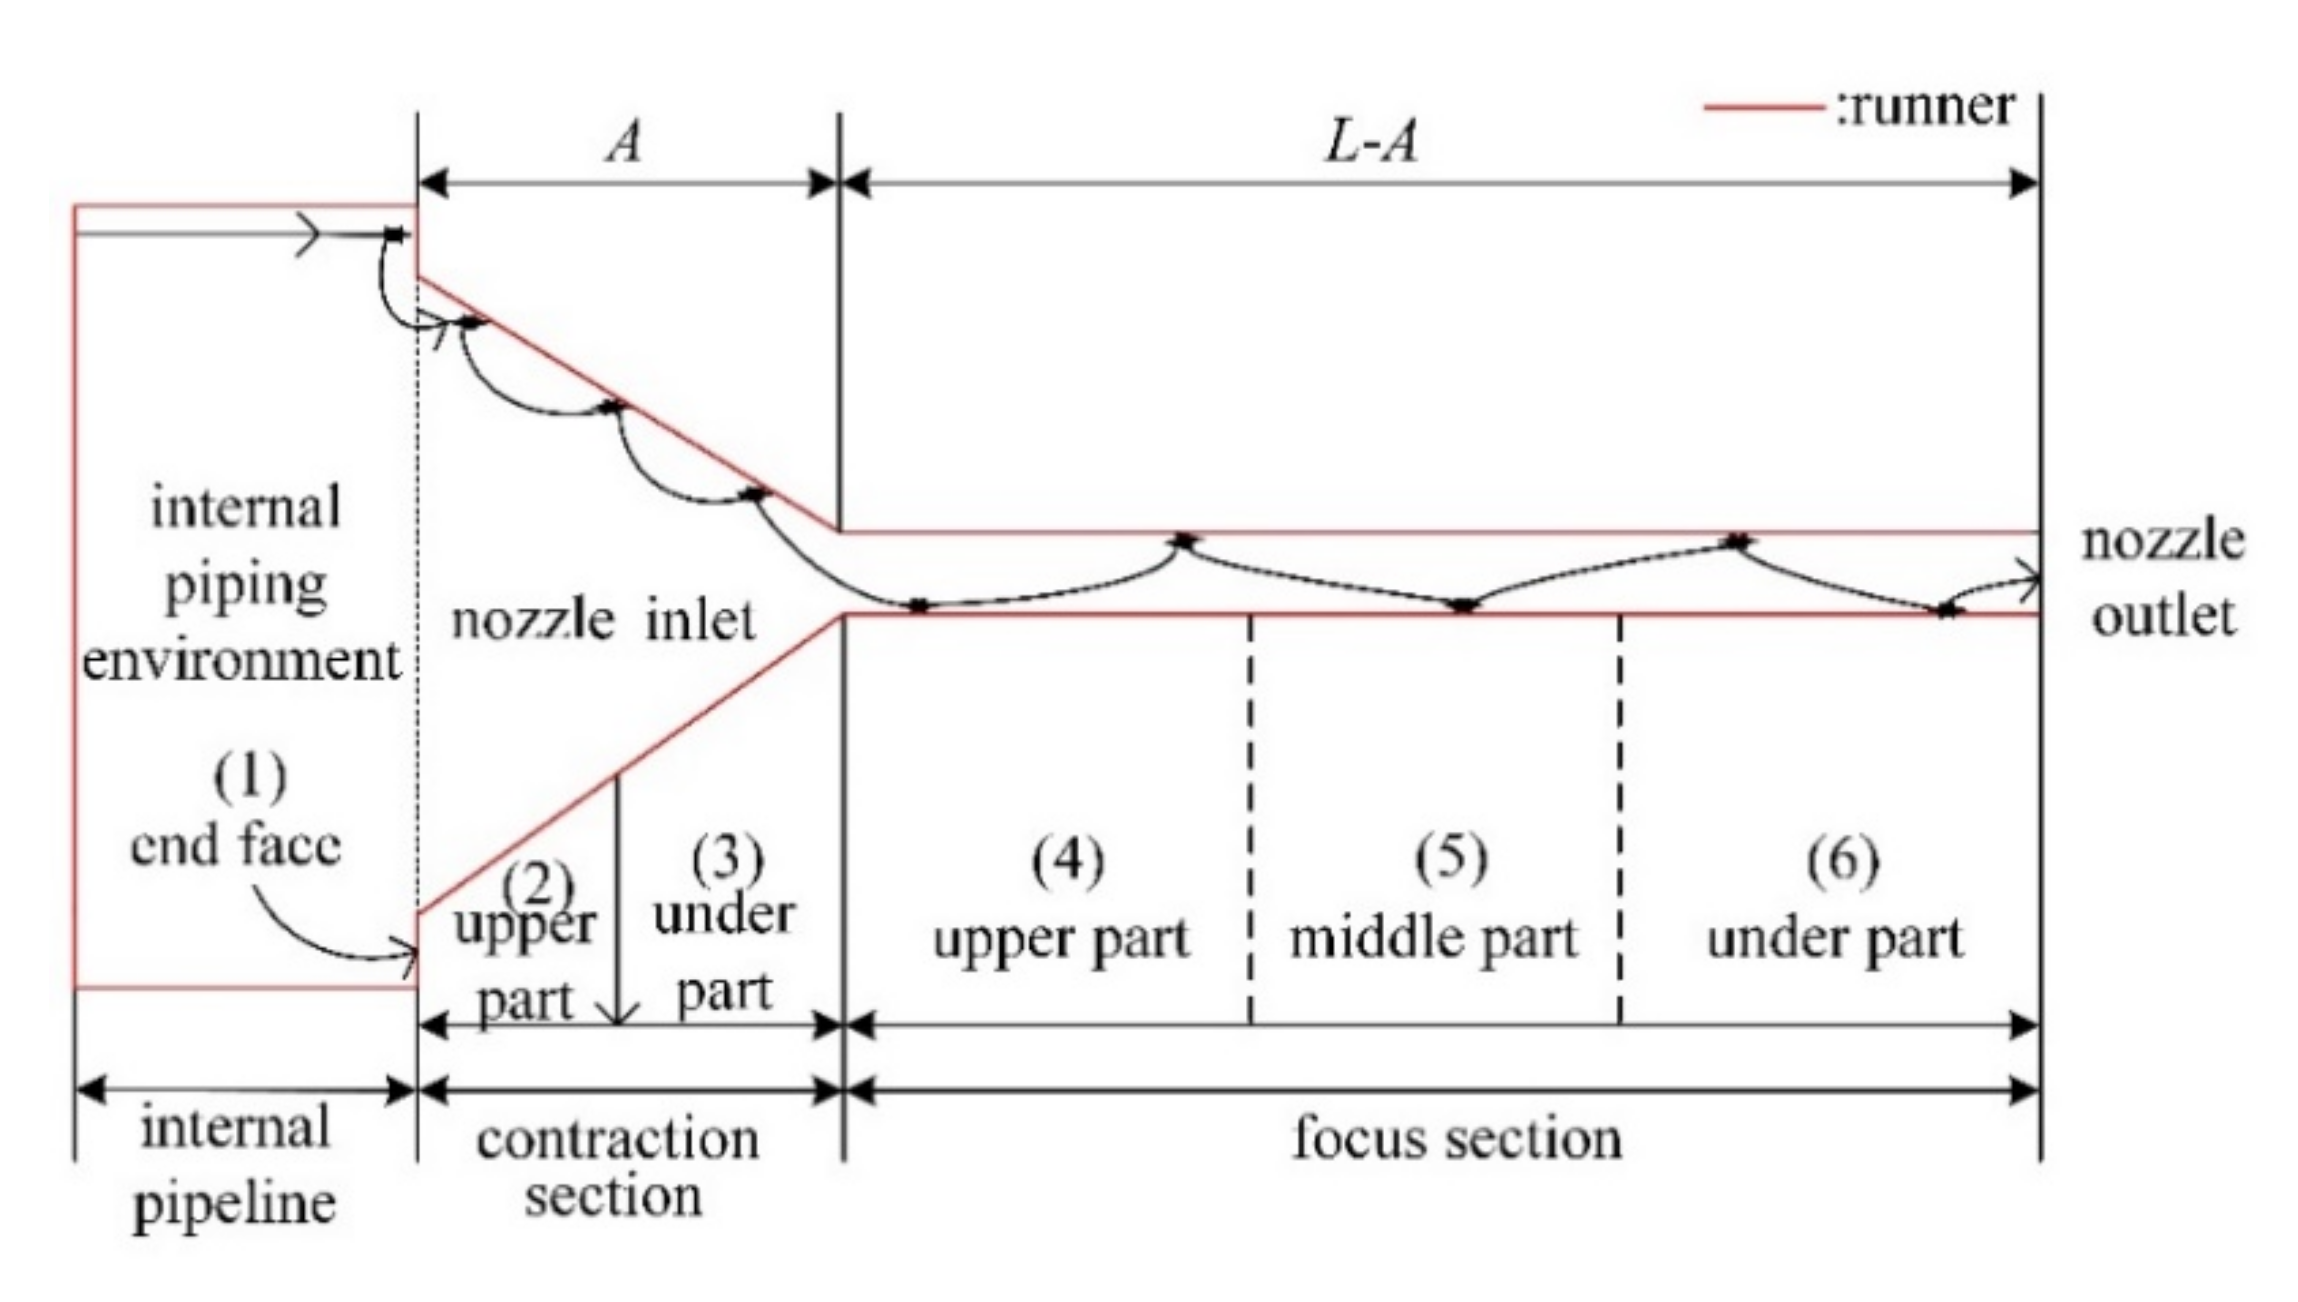
To study the wear location on the nozzle, this paper divides the geometric section into three areas: the internal pipeline, the contraction section and the focus section, as shown in Figure 2. The vertical interface between the internal pipeline and the nozzle is the end surface, Area 1; the contraction section is divided into two areas, Area 2 and 3, as shown in Figure 2 and the focusing section is divided into three areas, Area 4, 5 and 6), where A is the axial length of the contraction section, the length of the focusing section is the difference between the total length of the nozzle and the axial length of the contraction section, L-A.

2.2. Geometry for CFD Simulation

For simulating the motion of the liquid and particle mixture, the calculation domain is created, as shown in Figure 3. To ensure the effects of the flow field in front of the nozzle are involved, a section of the internal piping environment is added in the geometry model, while at the nozzle outlet, the external environment is added to ensure the flow develops fully.
According to the symmetrical nature of the nozzle runner, the 3D flow can be simplified as 2D axisymmetric to minimize the computation load, as shown in Figure 3. The simulation model is mainly composed of the supply pipe, the nozzle and the external environment.
The discrete phase model (DPM) is selected for these simulations, taking into account the turbulent flow of the abrasive water jet, and the standard turbulence model is also selected. The supply inlet, AB, is set as the pressure inlet; GH and FG are set as the pressure outlet; AH is set as the symmetry axis; BCDEF is set as the stationary wall and the simulation is based on pressure. The SIMPLE algorithm is used to achieve the coupling of pressure and velocity.

2.3. Mesh and Independence

The structural mesh is created by ICEM, as shown in Figure 4.
The mesh of the contraction section is enlarged, as shown in Figure 5.
The element number effects are compared to ensure the simulation quality. The simulation results with coarse, medium and fine meshes are listed in Table 1. The element-number-produced variation is less than 3% for peak velocity and 2% for the erosion rate. The results with the coarse mesh are closest to the average values for both peak velocity and erosion rate. The coarse mesh is satisfactory for these simulations.

3. CFD Simulation Method

The abrasive and water mixture flow can be calculated and the nozzle wear can be visualized [21,22]. By combining a turbulence model with an erosion model, the erosion produced by abrasive particles can be calculated and analyzed [23,24,25,26,27,28]. Using the DPM model to solve the N-S equation in Eulerian coordinates for continuous phase and water, and the particle orbit equation in Lagrangian coordinates for the phase of abrasive particles, the collision of the particles on the wall can be calculated and the effect of the nozzle geometries on nozzle wear can be obtained by applying the collision state to the wear/erosion model.
In this paper, the following assumptions are made in the CFD simulation.
  • Fluid flow within the nozzle is stable and the medium is incompressible.
  • No heat transfer occurs between the water and the surroundings.
  • The particle size of the abrasive particles is uniform with the same physical and chemical properties.
  • The roughness of the runner surface is uniform and ideal.
  • The effect of buoyancy can be ignored.

3.1. Governing Equations

The incompressible mass conservation equation and momentum equation in steady-state are considered in the field of calculation. The mass conservation equation is:
ρ v   =   S m
where ∇ is the differential sign, ρ is the density, v is the velocity and Sm is the mass added from the dispersed second phase to the continuous phase. The momentum equation is:
ρ v v   =   p   +   τ   +   F
where p is the pressure of the element, τ is the stress tensor and F is the force generated by the interaction of the dispersed phase. According to the standard k-ε model, the turbulent kinetic energy (k) equation is:
( ρ k u i ) x i   =   x j μ   +   μ i δ k k x j   +   G k     ρ ε
The dissipation rate equation (ε) is expressed as:
( ρ ε u i ) x i   =   x i μ   +   μ i δ k k x j   +   C 1 ε ε k G k     C 2 ε ρ ε 2 k
where ui is the velocity in the i direction, xi and xj are the distance coordinates in the directions of i and j, μ is the molecular dynamic viscosity, Gk represents the turbulent kinetic energy due to the average velocity gradient, C1ε and C2ε are constants, (C1ε =1.44, C2ε =1.92), δk and δε are the turbulent Prandtl numbers of k and ε, respectively, where δk = 1.0 and δε = 1.3. For more details, please refer to [29].

3.2. Discrete Phase Model

Based on Newton’s second law, the Discrete Phase Model (DPM) uses the Lagrangian coordinate system and calculates the particle trajectory to solve the motion equation of the discrete phase within the continuous phase. The local continuous phase condition is used to solve the force balance equation on the abrasive particles as:
d u p d t   =   F D ( u f     u p )   +   g ( ρ p     ρ f ) ρ p   +   F other
where up and uf are the velocities of abrasive particles and fluid, ρp and ρf are the densities of abrasive particles and fluid, respectively, g is the gravitational acceleration, Fother is the term for calculating the additional force, including mass force, thermal force, Brownian force, etc. and FD(uf − up) is the unit mass force of abrasive particles, and
F D   =   18 μ ρ p D p 2 C D R e 24
where Re is the Reynolds number of the abrasive particles with reference to the relative speed, and CD is the drag coefficient,
R e   =   ρ f v f v p D p μ f
and,
C D   =   a 1   +   a 2 R e   +   a 3 R e 2
Equation (5) needs to be coupled with the trajectory equation, ds/dt = up, in the Lagrangian coordinate system, where s is the abscissa of the trajectory to close the set of equations to be solved and gives the velocity and position of the abrasive particles.
Since the abrasive particle size is 0.16 mm and the density difference between the two phases is large, the effect of other forces can be ignored.
In order to combine the influence of discrete phase trajectory on the continuum, it is necessary to calculate the phase-to-phase exchange of momentum from abrasive particles to continuous phase. This exchange is calculated by checking the momentum change of abrasive particles through each control volume in the calculation field. This momentum change, M, is calculated as:
M   =   18 μ ρ p D p 2   *   C D Re 24 u     u p   +   g x ( ρ p     ρ f ) ρ p   +   F x m p Δ t

3.3. Coefficient of Elastic Recovery

Because the abrasive particles will rebound when they collide with the nozzle runner, in order to accurately describe the motion trajectory of abrasive particles it is necessary to establish an appropriate collision rebound model to describe the interaction between abrasive particles and the runner. Because momentum exchange occurs when abrasive particles collide with the runner, the velocity of abrasive particles after collision is always less than that before collision. This characteristic can be expressed by the elastic recovery coefficient, that is, the momentum change of abrasive particles before and after collision is divided into two components: normal elastic recovery coefficient en and tangential elastic recovery coefficient et. Assuming that the abrasive particle mass remains unchanged before and after collision, the normal and tangential elastic recovery coefficients represent the ratios of the normal and tangential velocity components before and after collision. In this paper, the commonly used Grant recovery coefficient equation is selected [30].
e n   =   0.993     3.072   ×   10 2 θ   +   4.752   ×   10 4 θ 2     2.605   ×   10 6 θ 3 e t   =   0.988     2.897   ×   10 2 θ   +   6.427   ×   10 4 θ 2     3.562   ×   10 6 θ 3

3.4. Erosion Rate Model

The erosion of the nozzle runner is the mixing effect of high-pressure water and abrasive particles, and the abrasive particles play the major role. At this stage, there is no clear theoretical calculation model. It is mainly based on the semi-empirical model combining theoretical mechanism assumptions, analysis, derivation and experimental research, and the empirical model obtained from the analysis of experimental data. Due to the different properties of abrasive particles, runner material properties, abrasive particle motion parameters and research and analysis methods, there are various erosion models. This paper selects the semi-empirical E/CRC model,
E R   =   C ( d p ) v b ( v ) f θ
where ER is the ratio of the mass of the material that is eroded away from the runner to the mass of the abrasive particles in the impact runner; v is the impact velocity of the abrasive particles; θ is the impact angle in rad. When using Fluent for numerical calculation, it is necessary to transform the E/CRC model to suit the finite element solution. After the transformation, the wear calculation expression is
R E R   =   i   =   1 N m p C d p f θ v b ( v ) / A f
where RER is the erosion rate (kg/(m2s)), N is the number of abrasive particles on the unit area, mp is the abrasive particle mass flow (kg/s) and C(dp) is the abrasive particle diameter coefficient (taken as 1.8 × 10⁻⁹) [9,10,31], θ is the impact angle, v is the abrasive particle velocity (m/s), b(v) is the velocity exponential function, with a value of 2.6 [32] and Af is the unit area (m2);

4. Optimization of the Nozzle Geometry

4.1. Parameter Planning

When the diameters of the supply pipe and nozzle outlet are constants, the nozzle section profile can be defined by three variables: the nozzle inlet diameter coefficient, the length coefficient of the contraction section and the profile of the contraction section. The optimization is to find out the best combination of the above three variables.
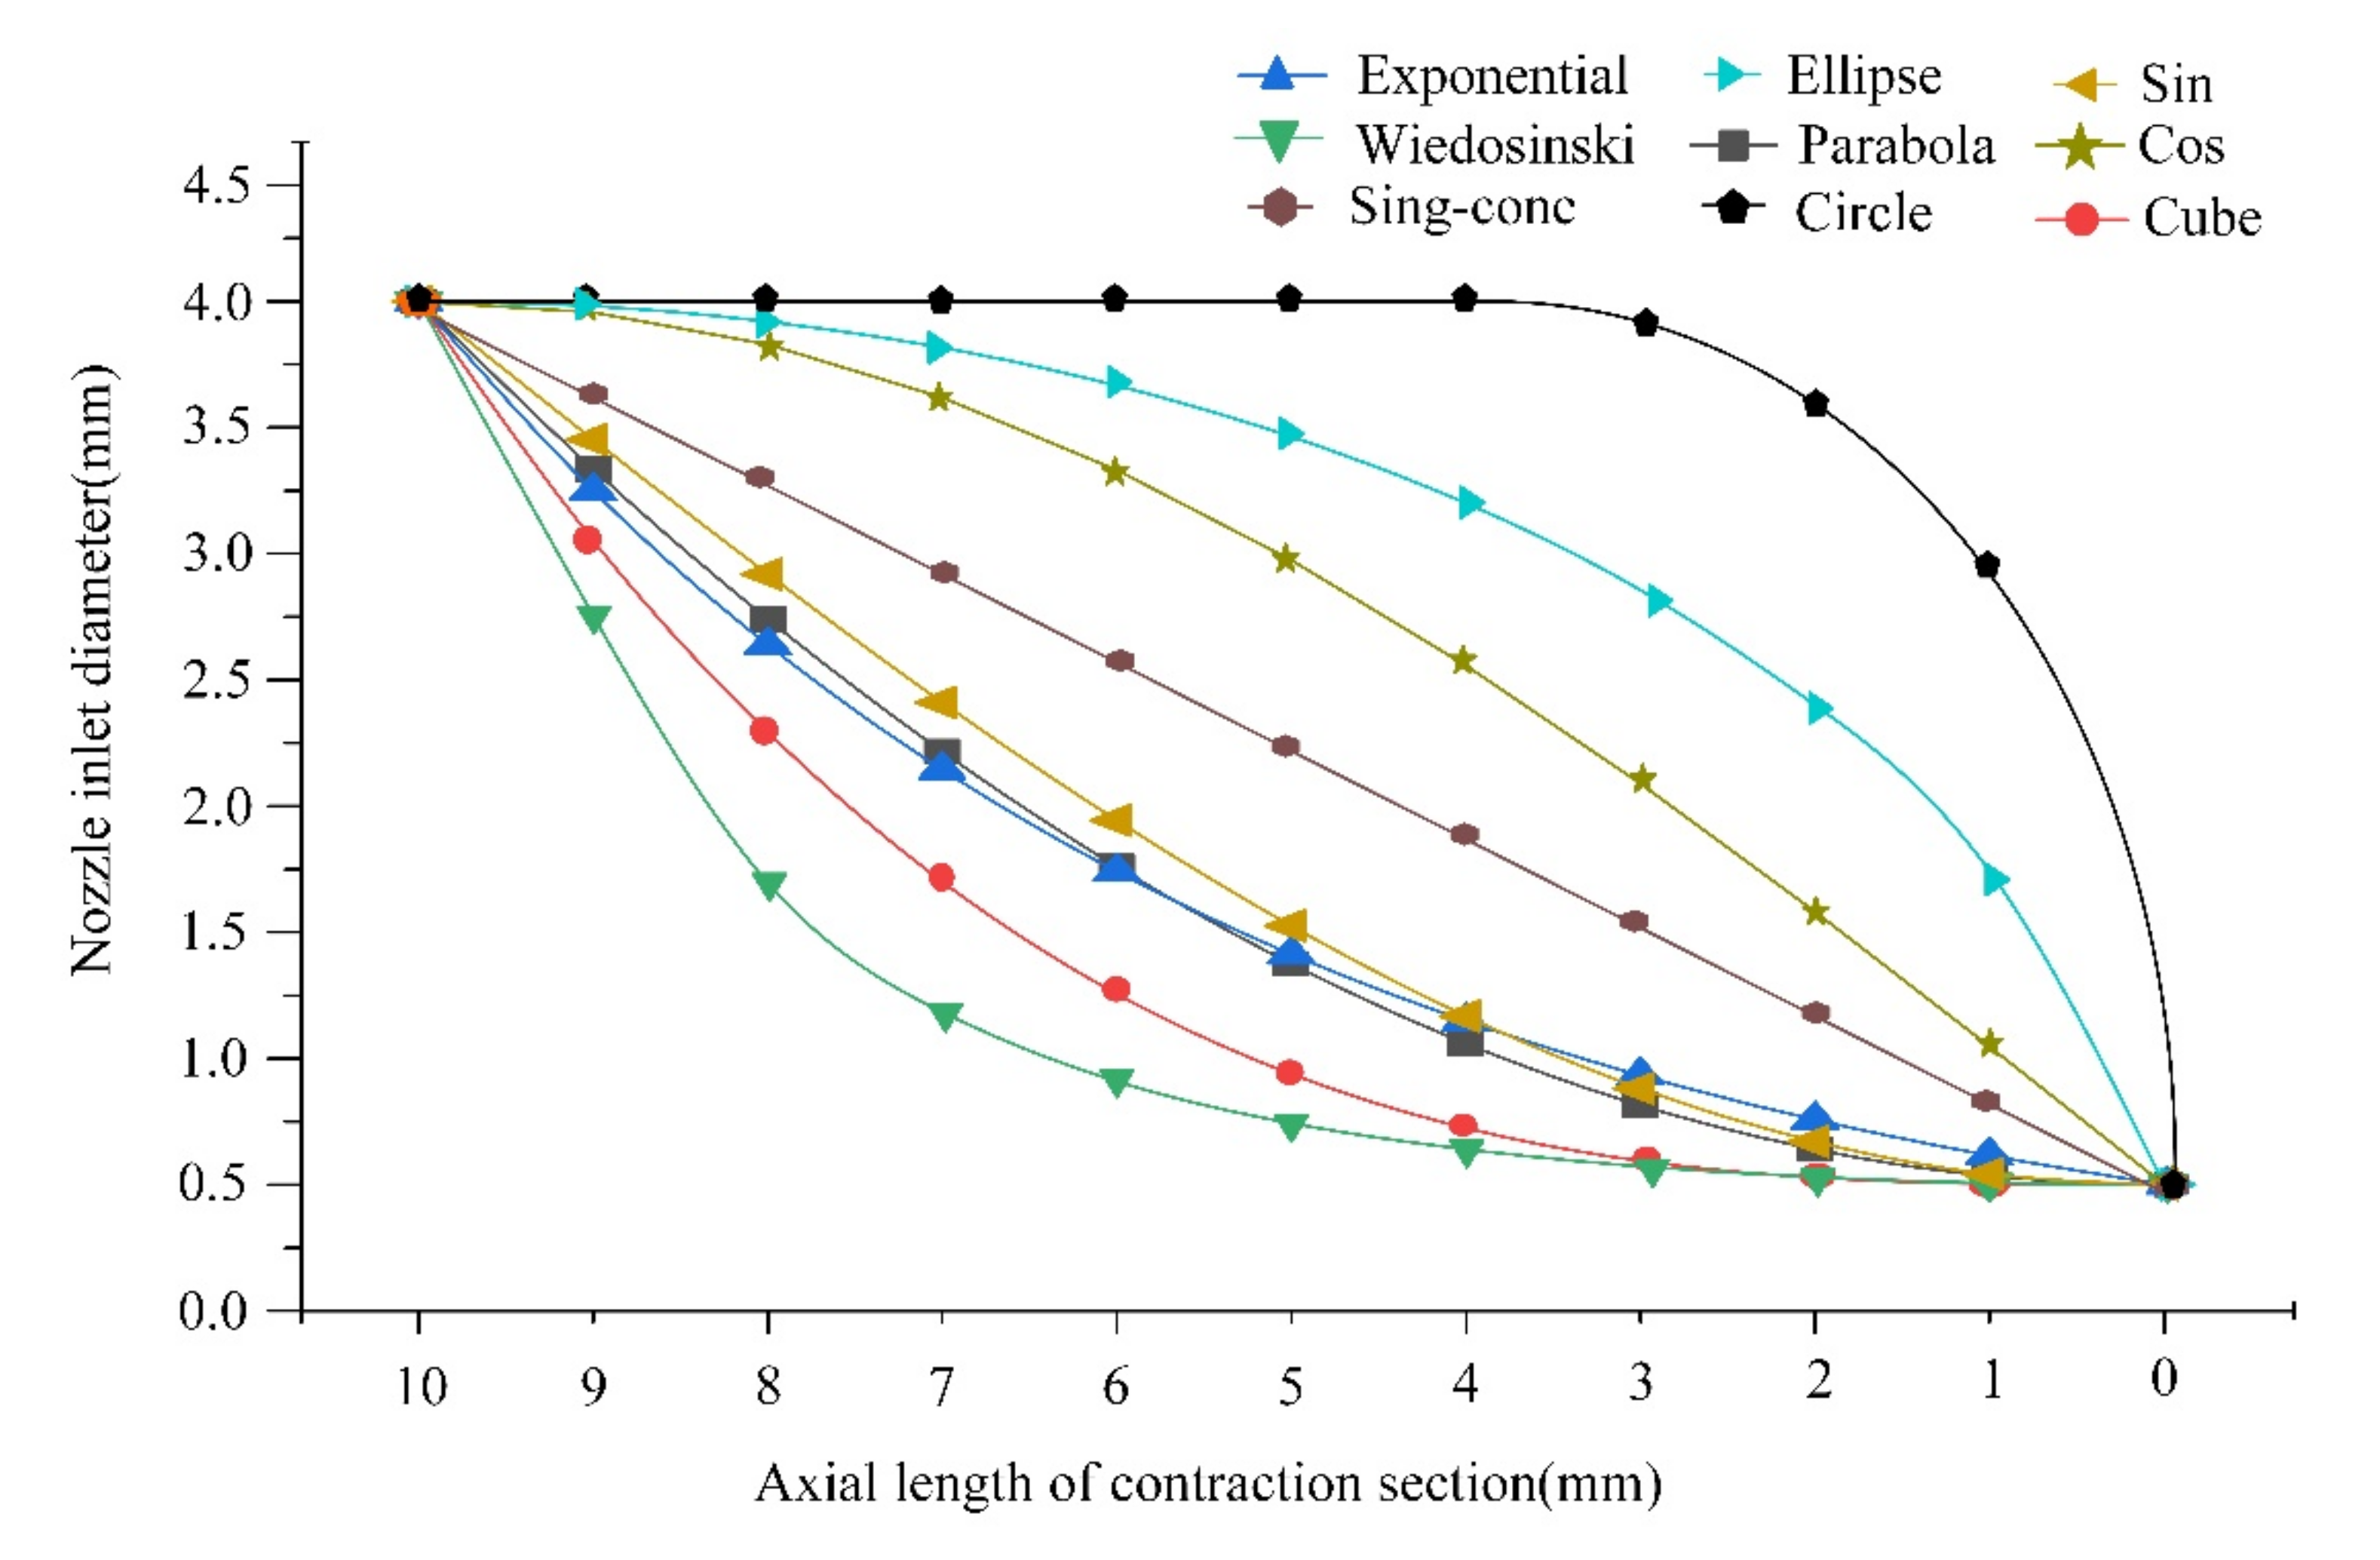
Nine typical curves are selected for this optimization. The curve types mainly include three types as shown in Figure 6: a concave nozzle (S1–5), a convex nozzle (S6–8) and a single-cone nozzle (S9).
The section curve functions of nine contraction sections are listed in Table 2.
The specific mathematical expressions are as shown in Equation (13).
f D 2 , D 3 , A , x   =   S 1 : D 2     D 3 2 A 2 x 2   +   D 3 2 , S 2 : D 3 2 e cx , C   =   1 A ln D 2 D 3 , S 3 : D 2 D 3 2 sin π x 2 A   +   3 2 π   +   1   +   D 3 2 , S 4 : D 2     D 3 2 A 3 x 3   +   D 3 2 , S 5 : D 2 2 1 1 D 2 D 3 2 1 x A 2 2 1   +   1 3 x A 2 3 , 0 < x < A . S 6 : D 2     D 3 2 A 2 A x     x 2   +   D 3 2 , S 7 : D 2     D 3 x     x 2   +   D 3 2 , 0   <   x   <   D 2     D 3 2 ; D 2 2 , D 2     D 3 2   <   x   <   A . S 8 : D 2     D 3 2 cos π A     x 2 A   +   D 3 2 , S 9 : D 2     D 3 2 A x   +   D 3 2 ,
when the inlet diameter of the nozzle is 8 mm, the outlet diameter is 1 mm and the axial length of the contraction section is 10 mm, the section shapes are as shown in Figure 7.
The range of the inlet diameter is 1.0–10.0 mm with a step of 1 mm and corresponding coefficients listed in Table 3. The range of the contraction section length is 6.0–20 mm with a step of 2 mm and corresponding length coefficients also listed in Table 3. The typical commercial product nozzle is used as the baseline and parameters are listed in Table 4.
Under the condition that the geometrical parameters of the nozzle section are determined, the operating parameters of the system are listed in Table 5.

4.2. Nozzle Performance and Variable Effects

CFD simulation is used to investigate the effects of nozzle variables on the performance, including the inlet diameter coefficient, contraction length coefficient and contraction section shape.
The peak erosion rate per unit flow is used as the nozzle comprehensive performance for comparison instead of the erosion rate and/or flow rate.

4.2.1. Influence of the Contraction Section Shape

The contraction section shape is considered as one of the variables to be optimized. As the section shape is a discrete variable, the enumeration method is suitable for the search of the optimal. The supply pipe inner diameter is 12 mm and nozzle outlet diameter is 1 mm as constants. The nozzle inlet diameter coefficient is 0.667 (inlet diameter 8 mm), the contraction length coefficient is 1.429 (contraction section length 10 mm). The simulation results of nine contraction section shapes are listed in Table 6. The lower the erosion, the better, therefore the relative performance improvement is the percentage of the reduction in the erosion of unit flow, comparing to the baseline, S9.
The best curve is S5, the Wiedosinski curve, which reduces the erosion of unit flow by 63.0% and the erosion happens in Areas 3–4; the second is S8, the Cosine curve, which reduces the erosion of unit flow by 53.3% and the erosion in Areas 2–3. The worst one is S6, the Ellipse curve, which increases the erosion of unit flow by 77.2% and the erosion happens in Areas 3–5.
It can also be concluded from the data in Table 5 that erosion Area 3 is the main erosion area of the nozzle. The main reason is that in the contraction section, with the reduction of the radial size of the contraction section, due to the effect of inertia, the abrasive particles frequently collide with the runner at a high radial speed, resulting in concentration of abrasive particles at the junction of the contraction section and the focus section, and the wear of the runner happens.

4.2.2. Effect of the Inlet Diameter Coefficient on Nozzle Performance

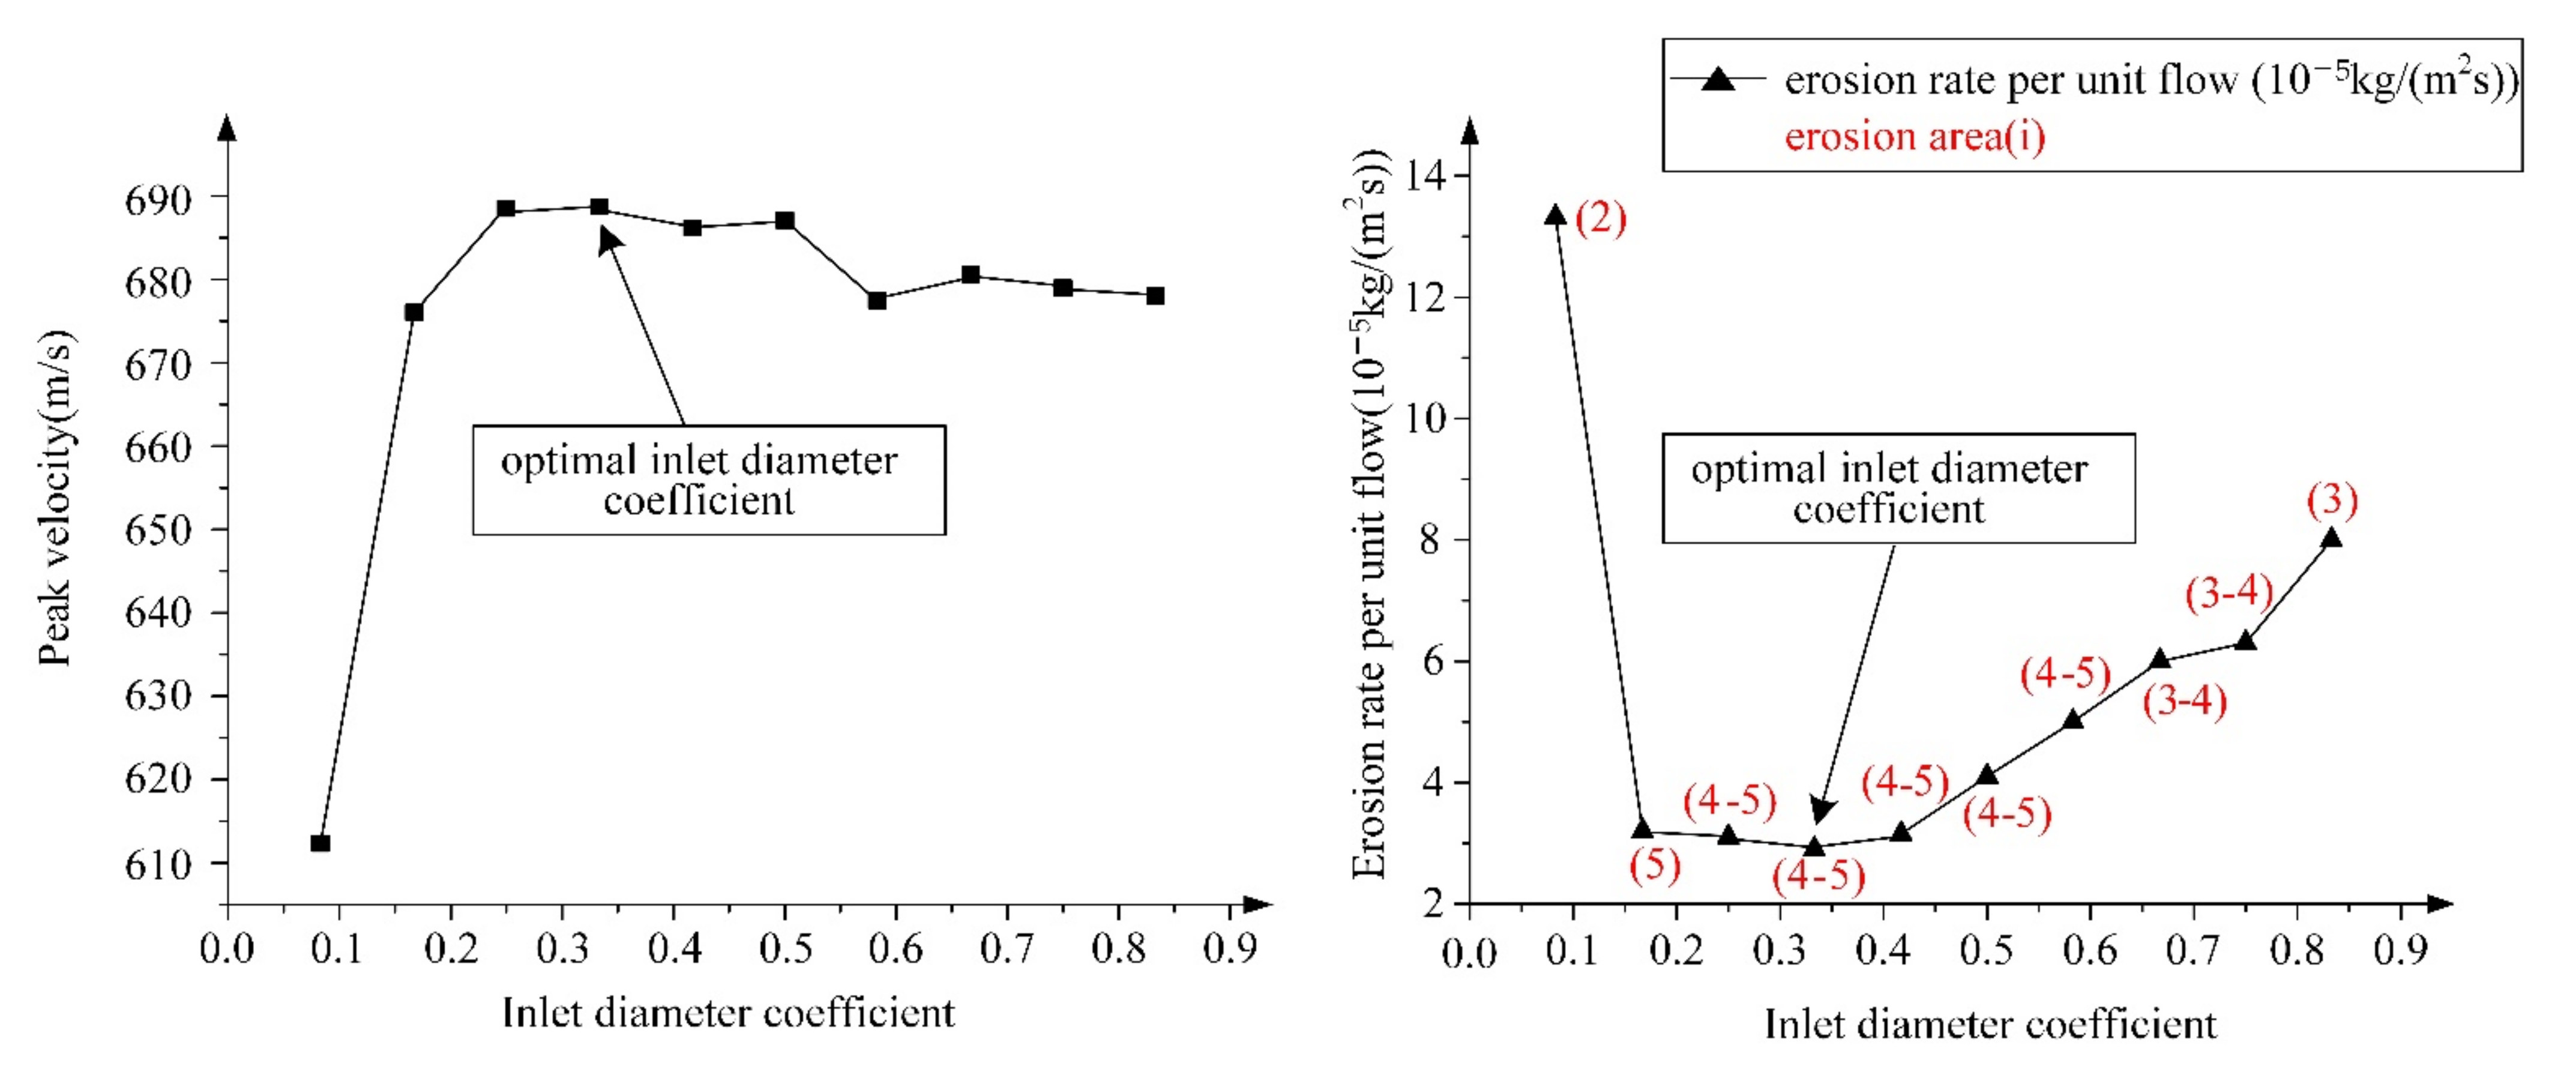
It can be seen from Figure 8 and Table 6 that the inlet diameter coefficient has a direct impact on the main erosion position and erosion rate of the nozzle.
When the inlet diameter coefficient is 0.083, the nozzle is a stepped nozzle. At this time, when abrasive particles and high-pressure water enter the nozzle from the internal pipe, there is a sudden change in the streamline. Large disturbances cause severe erosion in Area 1. With the increase in the inlet diameter coefficient, the main erosion area moves downstream. This is mainly because the increase in the inlet diameter coefficient improves the tangent slope of the nozzle runner function, enhances the probability of collision between abrasive particles and runner and increases the angle of initial collision between abrasive particles and the runner of the contraction section.

4.2.3. Effect of the Axial Length Coefficient of the Contraction Section on Nozzle Performance

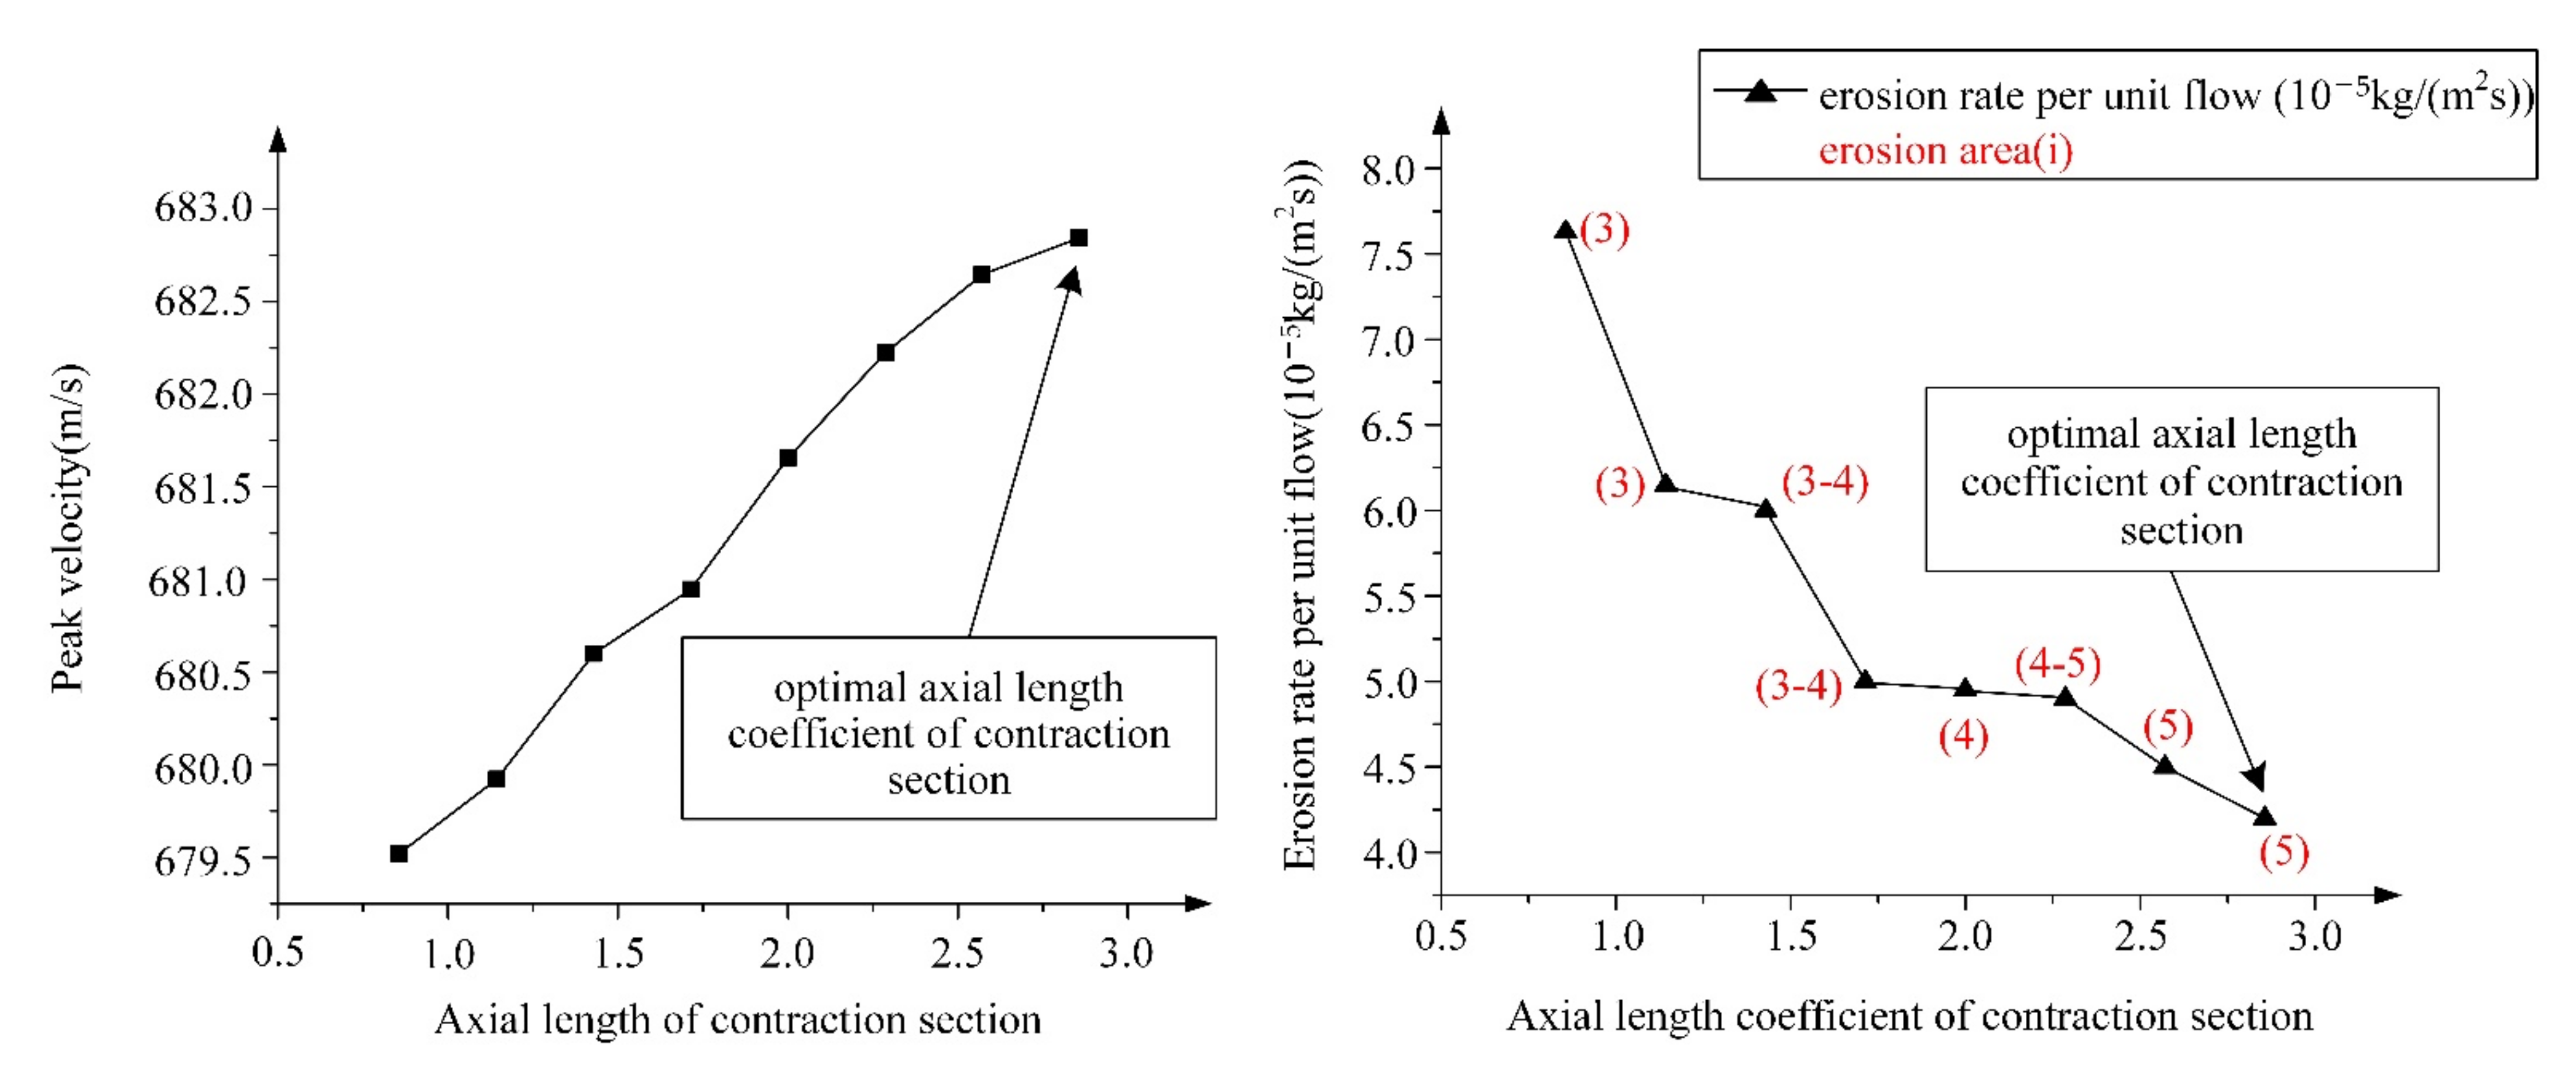
The effect of the axial length coefficient on the peak velocity and erosion rate of per unit flow are plotted, as shown in Figure 9. The increase in the axial length coefficient of the contraction section slightly increases the peak velocity from 679.5 to 682.8 m/s, by 0.49%.
The increase in the axial length coefficient of the contraction section considerably improves the erosion of the nozzle runner from 7.63 to 4.22, by 44.6%, and the main erosion area gradually moves downstream of the nozzle.

4.3. Optimization Method for the Optimal Section Nozzle

The optimal section nozzle should not only have the best cutting ability (maximum velocity) but also the longest life cycle (minimum erosion rate). Therefore, this paper establishes the following objective function.
m a x i m u m : G 1 ( λ i , λ c , S ) m i n i m u m : G 2 ( λ i , λ c , S )       . S u b j e c t t o 0.083   <   λ i   <   0.833 0.857   <   λ c   <   2.857 S 9 sec t i o n - s h a p e s
Among them, G1 is the function of the peak velocity in the nozzle and G2 is the function of the peak erosion rate in the nozzle. When the peak velocity in the nozzle is the maximum and the peak erosion rate is the minimum, it is regarded as the optimal section nozzle.
The nozzle geometry optimization in this paper involves three variables: the axis length coefficient of the contraction section, the coefficient of the inlet diameter and the section curve shape of the contraction section. If 10 steps/points are used for every dimension, then 1000 simulations are required for the full variable space search.
Therefore, it is necessary to find an efficient optimization method to ensure that the simulation can be completed with an affordable workload, and the approximate optimal results can be obtained. Compared with other optimization methods [33,34,35], orthogonal optimization technology can be a suitable method to minimize errors and obtain the optimal results efficiently, quickly and economically.
Assume that the objective functions G1 and G2 are the peak velocity and the peak erosion rate per unit flow rate of the nozzle, respectively, which are functions of the inlet diameter coefficient, the axial length coefficient of the contraction section and the section curve shape of the contraction section as optimization parameters,
G 1   =   g 1 ( λ i , λ c , S c ) , G 2   =   g 2 ( λ i , λ c , S c )
where λi, λc, Sc are independent variables,
2 λ i λ c g 1 ( λ i , λ c , S c )   =   0 2 λ i S c g 1 ( λ i , λ c , S c )   =   0 2 λ c S c g 1 ( λ i , λ c , S c )   =   0 , 2 λ i λ c g 2 ( λ i , λ c , S c )   =   0 2 λ i S c g 2 ( λ i , λ c , S c )   =   0 2 λ c S c g 2 ( λ i , λ c , S c )   =   0
Therefore, the objective functions G1 and G2 are orthogonal functions about λi, λc, and Sc, which can be optimized independently.
In most cases, the orthogonal optimization technology is approximately valid within the small parameter variation range.

4.4. The Optimal Contraction Section

Base on the objective function, with regards to both the life cycle and cutting ability, according to the simulation results in Section 4.2, the optimal curve shape of the nozzle contraction section is a Widosinski curve.
In the range of the inlet diameter coefficient from 0.083 to 0.833, the optimal inlet diameter coefficient is as 0.333; in the range of 0.857–2.857, the bigger the axial length coefficient of the contraction section is, the better. Therefore, the optimal axial length coefficient of the contraction section is 2.857; the optimal curve of the contraction section is
y   =   2 1   +   15 1     x 2 400 2 1   +   x 2 1200 3 , 0     x     20 , 0     y     2
the nozzle runner sections of the optimal nozzle and commercial product nozzle (S9, Single cone) are compared as shown in Figure 10.

4.5. Simulation Analysis of the Optimal Nozzle

For comparison of the effects of the operation parameters on erosion, define the logarithm unit flow erosion rate, ELR, as:
E L R   =   Lg ( E R )   +   15 ,
where ER is the unit flow erosion rate.
Based on the parameters of the optimal section nozzle, the FEA model can be created. Under the conditions of pressure of 250 MPa and abrasive particle flow of 0.101 kg/s, the simulation analysis of the optimal section nozzle is carried out and simulation results and the performance comparison with the product nozzle are listed in Table 7.
From the data in Table 7, the peak velocity of the nozzle with the optimal section improves to 706 m/s; compared with the product nozzles, the peak flow rate increases by 5.64%, better than the above 27 nozzles without optimization with the maximum speed of 680 m/s. Taking ELR as the index, the performance of the optimal nozzle is improved by 43.2% of that of the product nozzle.
The main erosion area is located at the step change of the section at the end surface of the nozzle with a low impact on the life cycle, rather than in the nozzle runner, and meanwhile the value is relatively small.
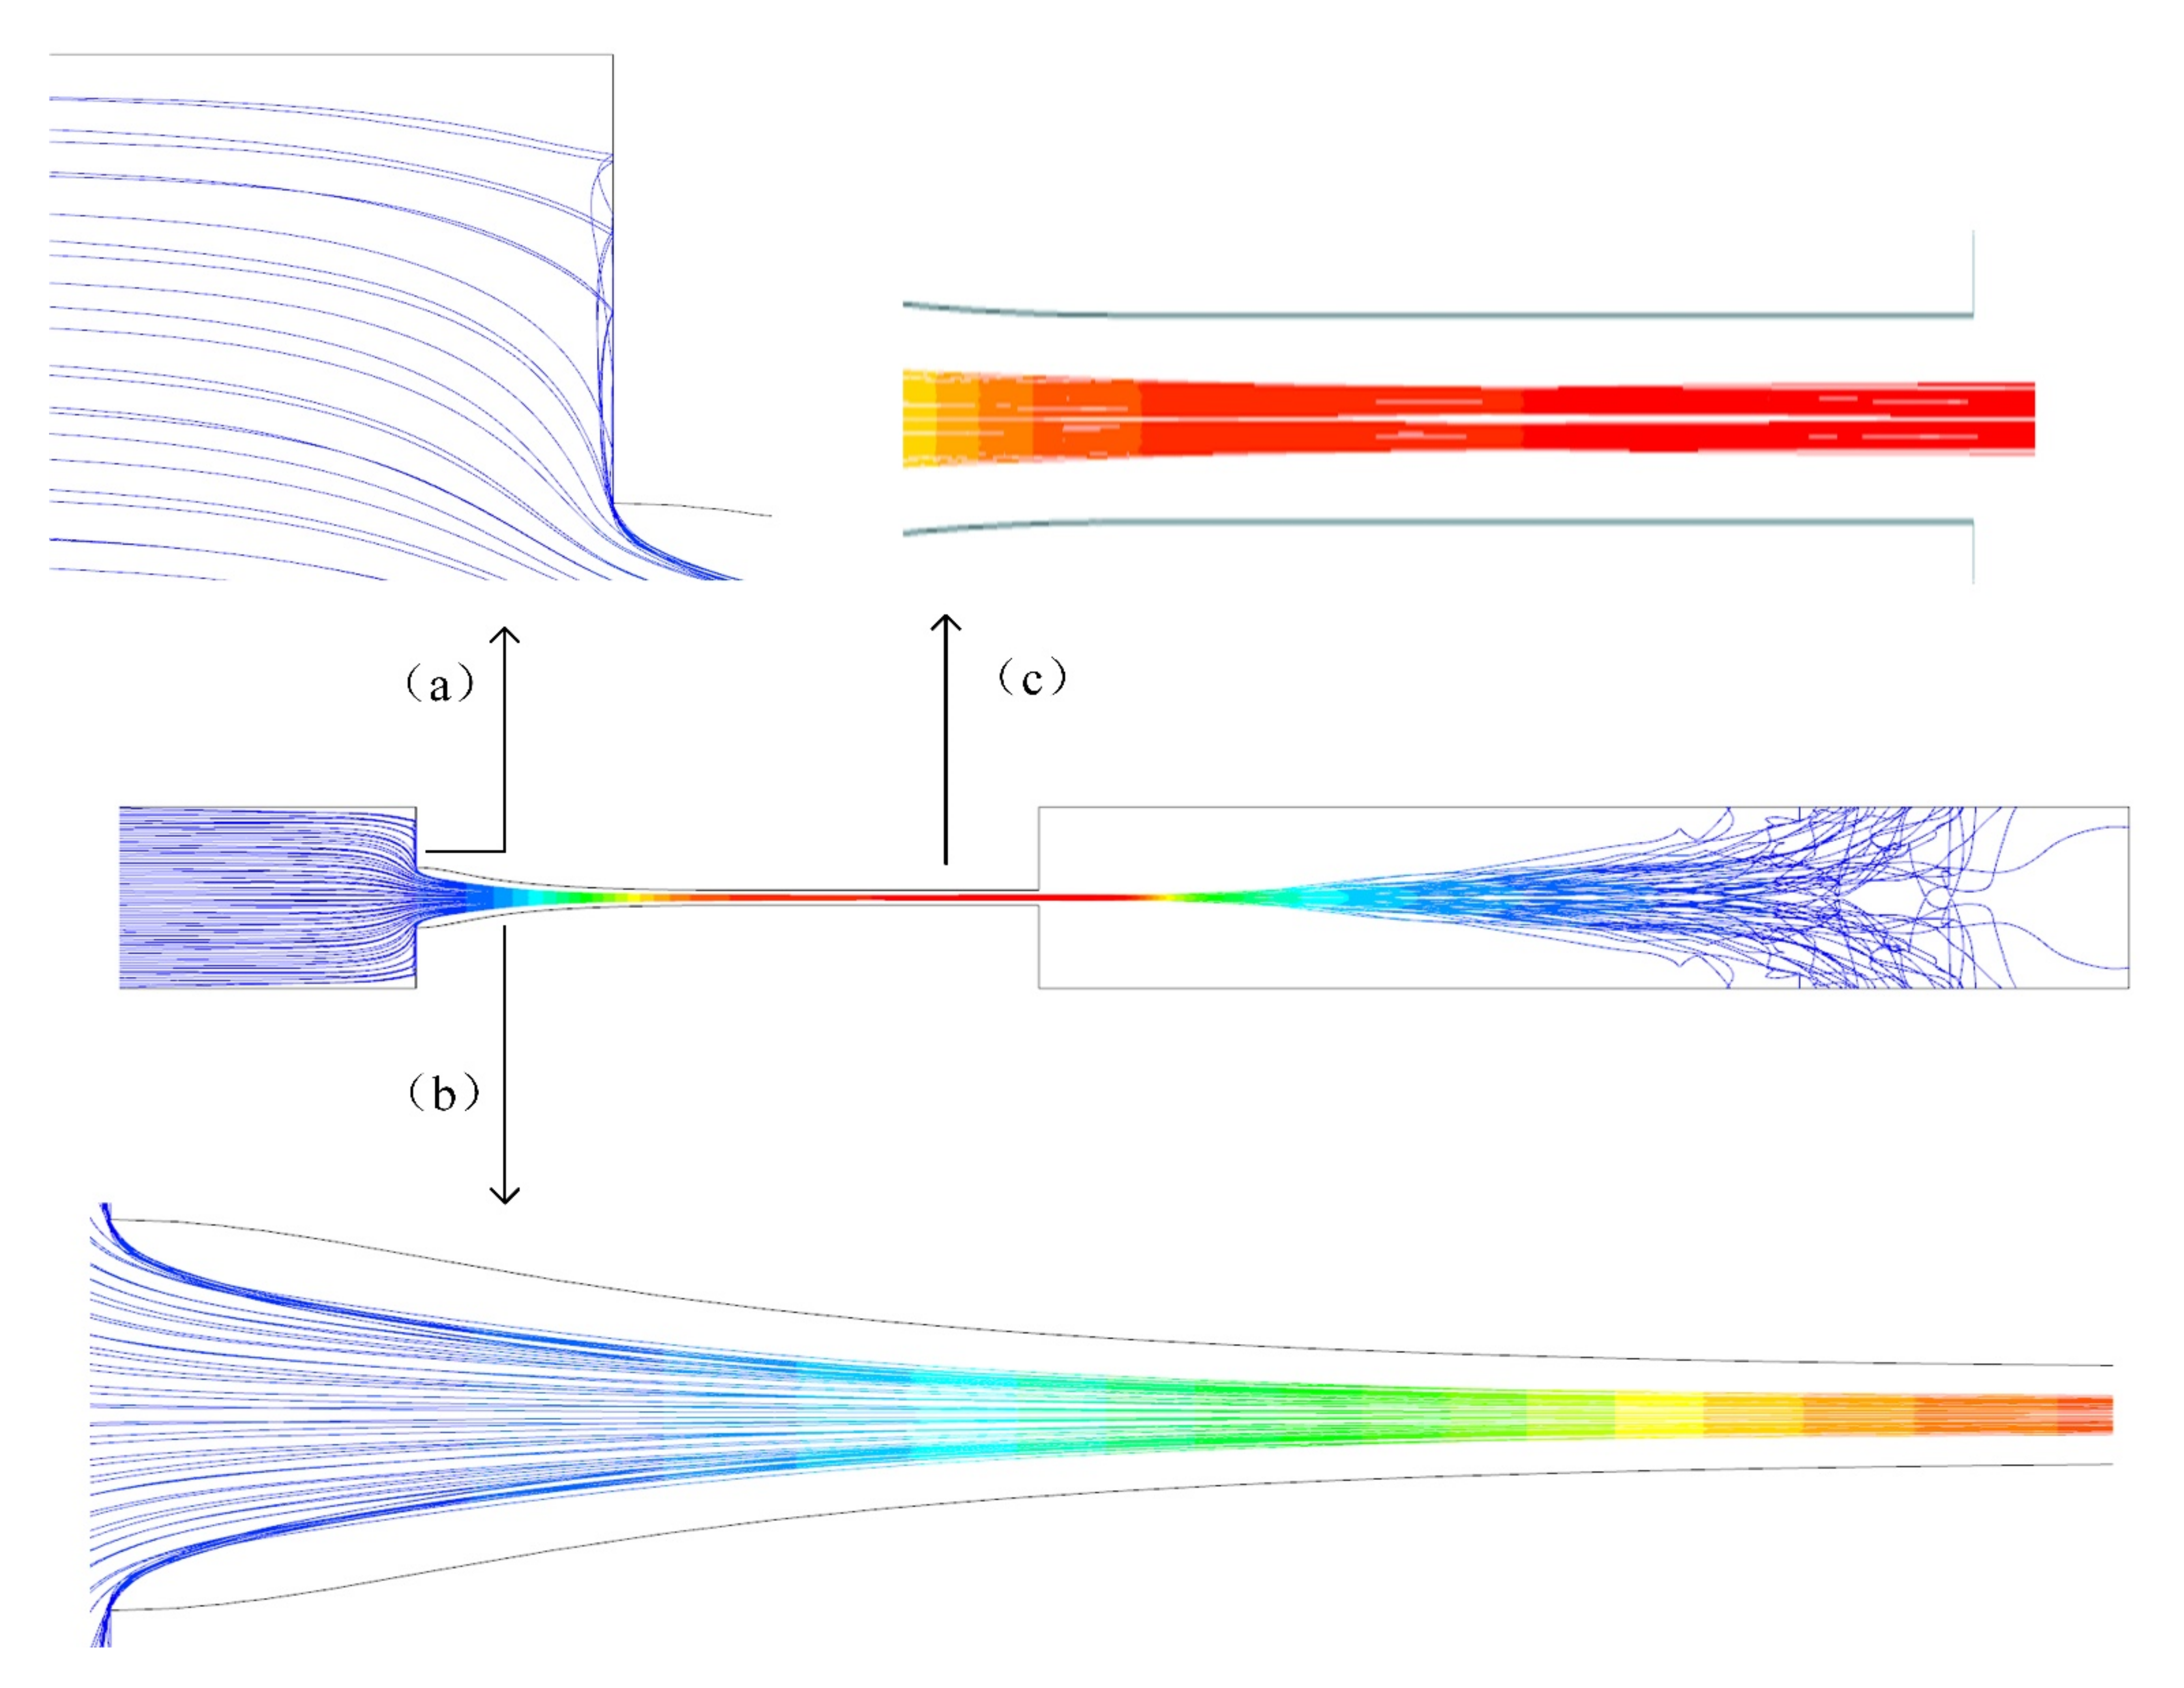
The velocity distribution and abrasive particle trajectory are plotted as shown in Figure 11 and Figure 12.
As shown in Figure 11, the mixture is accelerated in the contraction section, and the velocity tends to be stable in the focusing section and reaches the peak velocity at the outlet.
As shown in Figure 12a–c, the trajectory of the abrasive particles does not come into contact with the nozzle runner, and some of the impact of the abrasive particles with the runner mainly occurs at the end surface of the nozzle, rather than inside the nozzle runner, where wear has less impact on the nozzle life cycle.

5. Analysis of the Influence of Operation Parameters

The optimal geometry parameters are listed in Table 8. The main operation parameters include supply pressure, particle size and abrasive flow rate. The effects of the supply pressure, particle size and abrasive flow rate on the performance of the optimal nozzle can be investigated. The selected parameters are listed in Table 9.

5.1. Operation Parameter Effects on the Peak Velocity

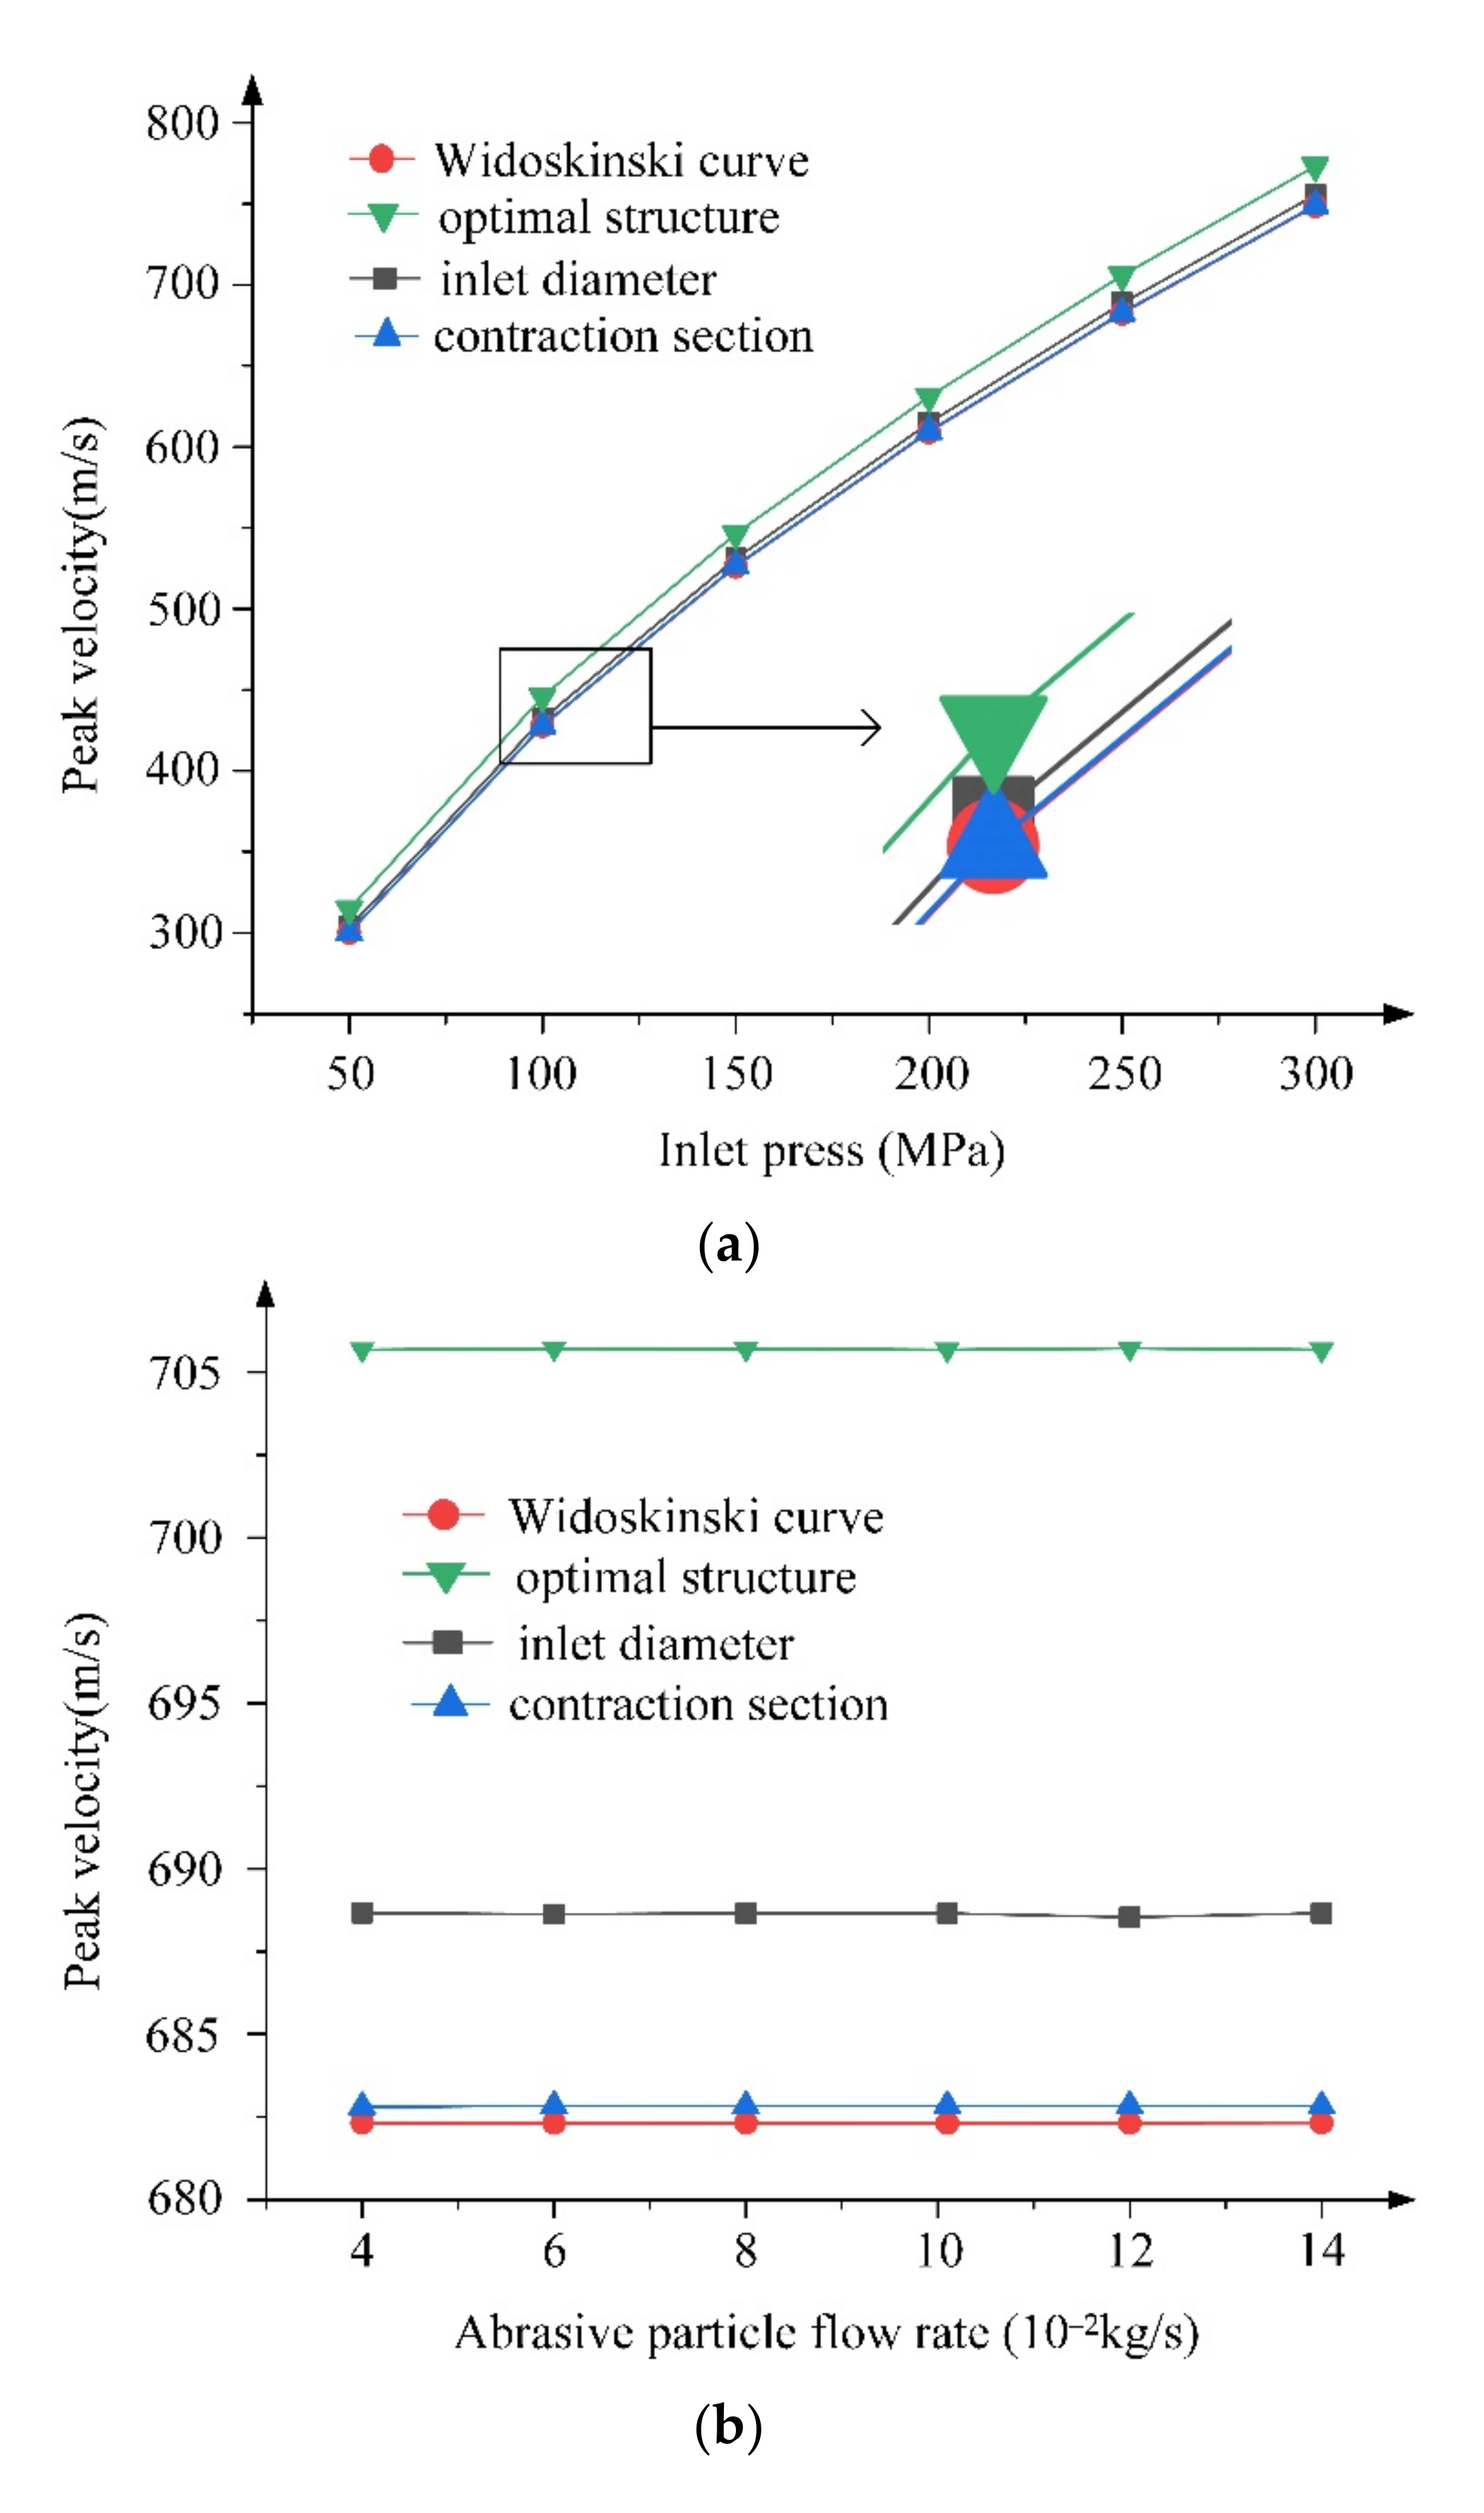
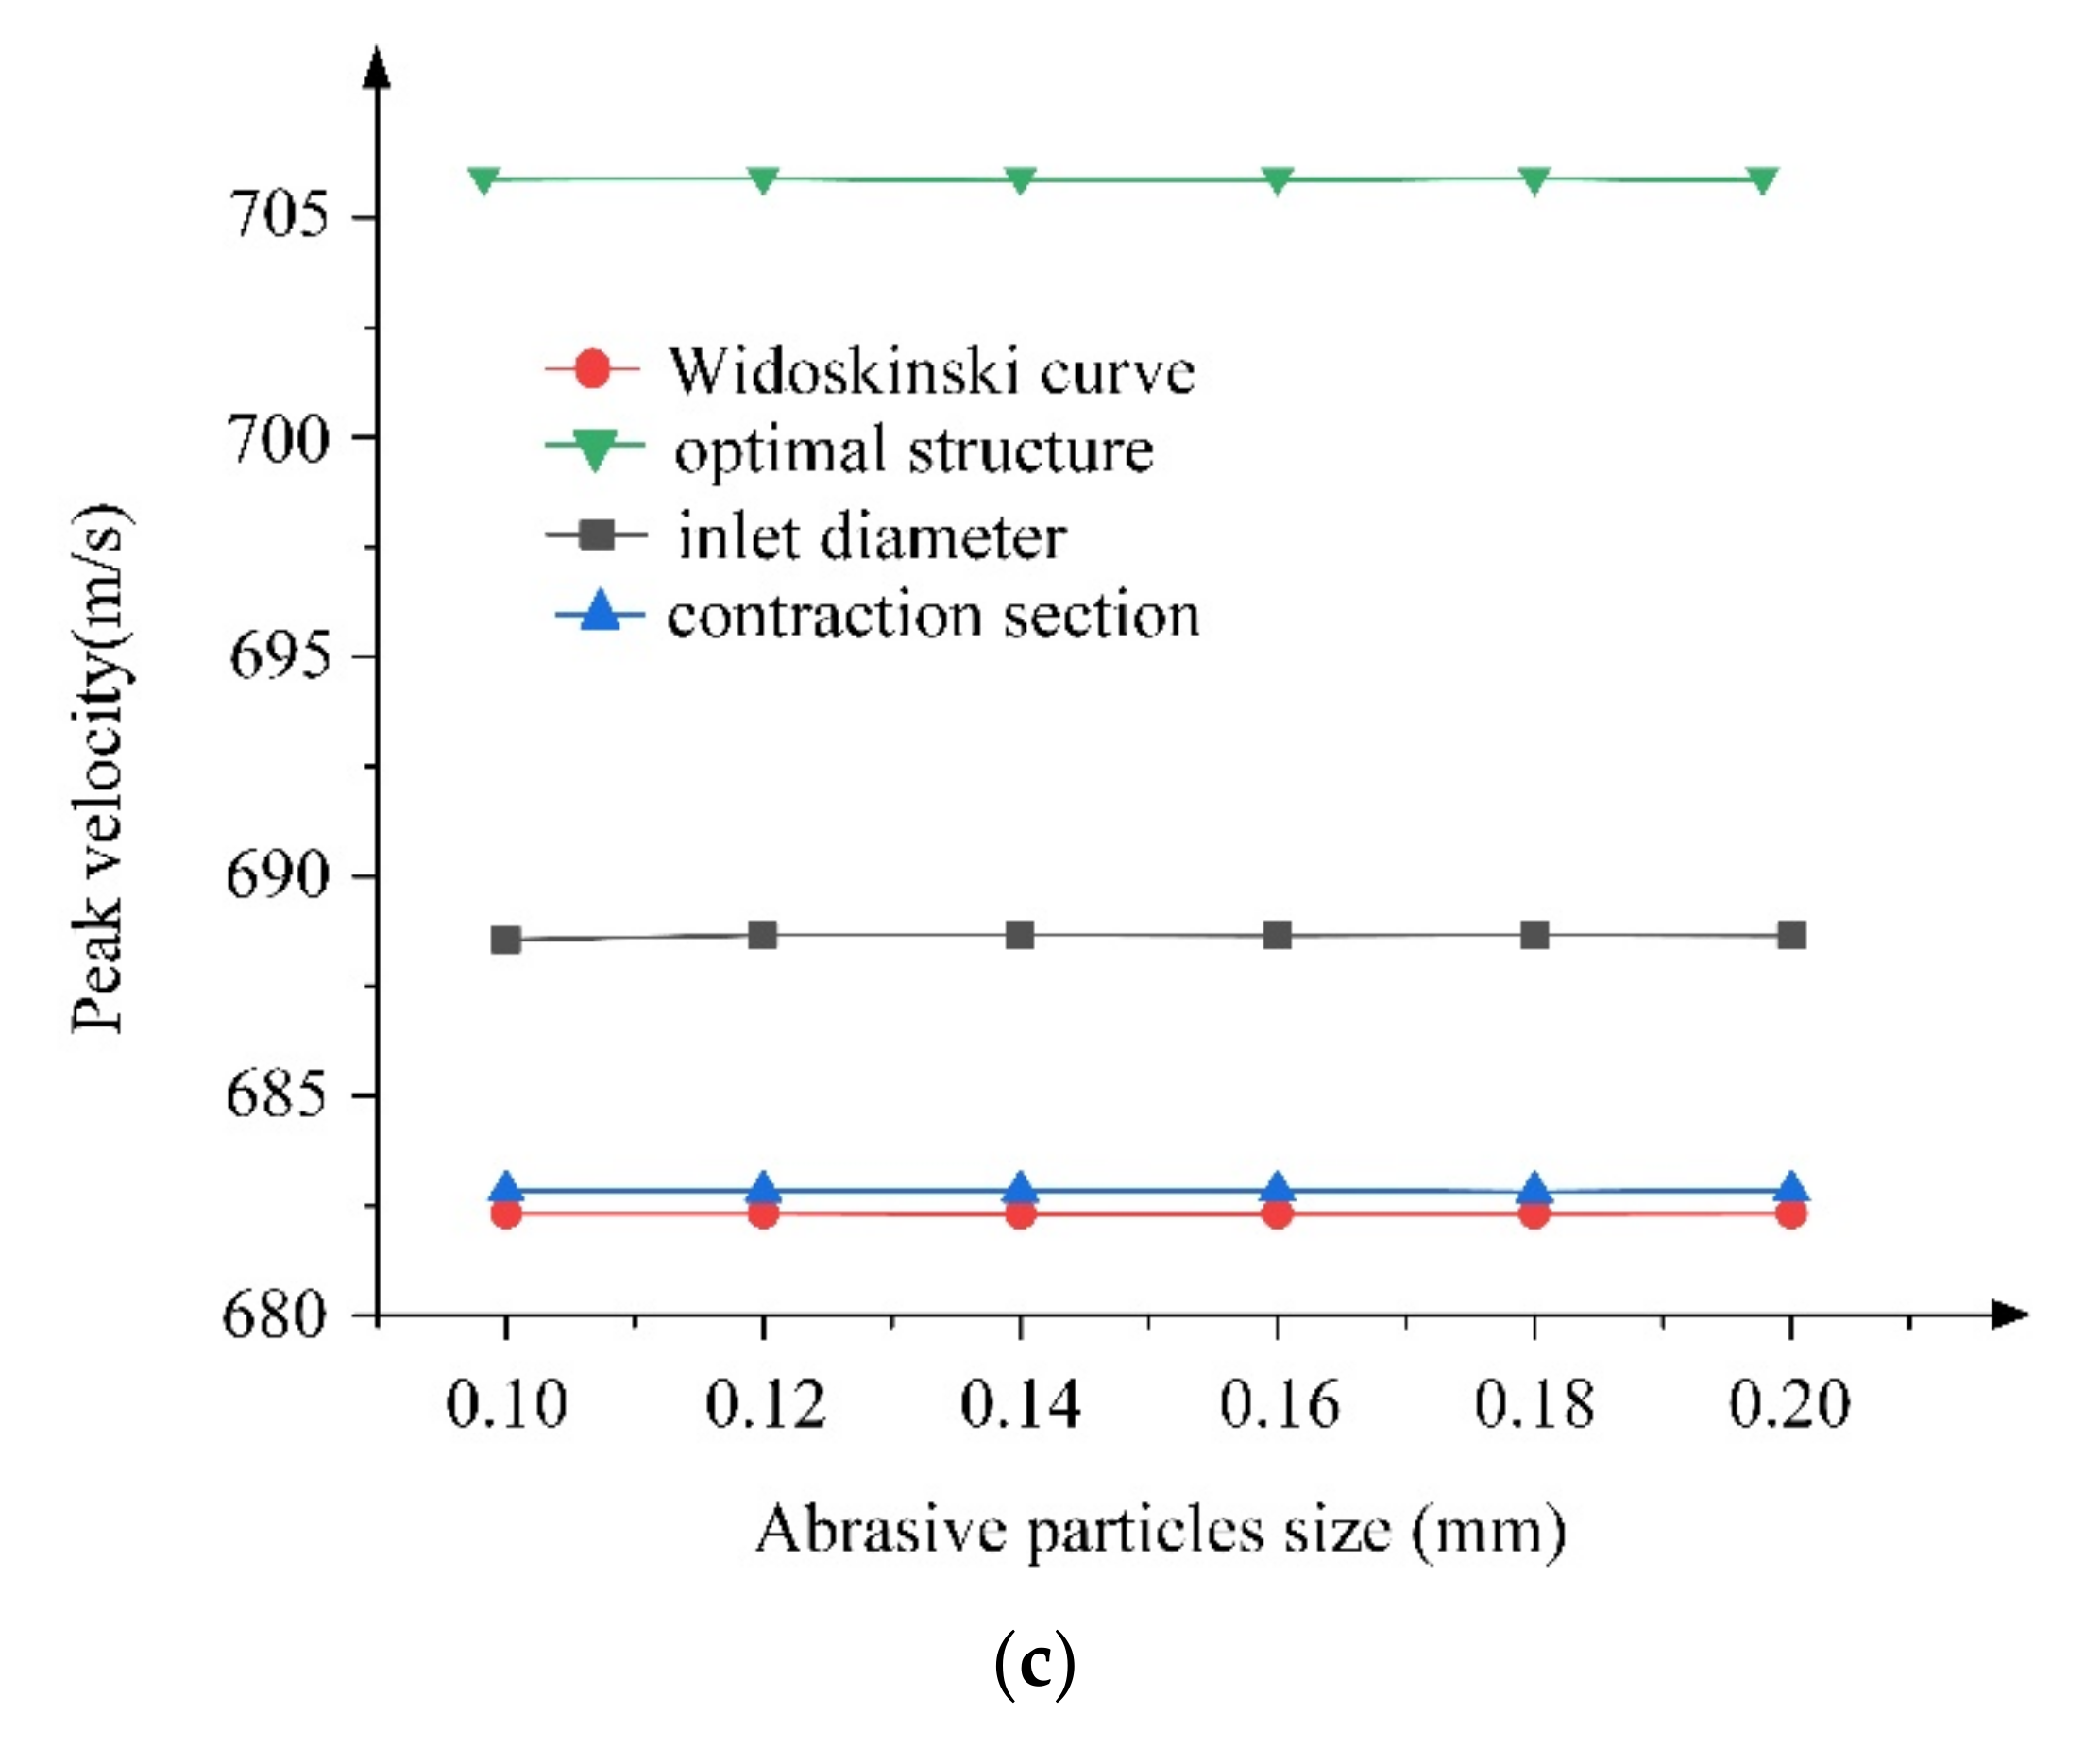
The effects of the operation parameters on the peak velocity are plotted in Figure 13a–c.
The inlet pressure is the main factor affecting the peak velocity in the nozzle. The high inlet pressure produces a high peak velocity for the four cases of the nozzles with the optimal inlet diameter (presented as Inlet Diameter), the optimal contraction section length (presented as Contraction section), the optimal contraction section profile (presented as a Widoskinski curve) and the fully optimized section (presented as Optimal structure), as shown in Figure 13a. However, the increment rate is slightly reduced when the inlet pressure is high. The optimized nozzle produces the highest peak velocity in the four cases regardless of the inlet pressure.
The effects of the abrasive flow rate and particle size on the peak velocity are negligible, as shown in Figure 13b,c for the four cases. The optimized nozzle produces the highest peak velocity in the four cases.

5.2. Effects of Operation Parameters on the Erosion Rate of Unit Flow

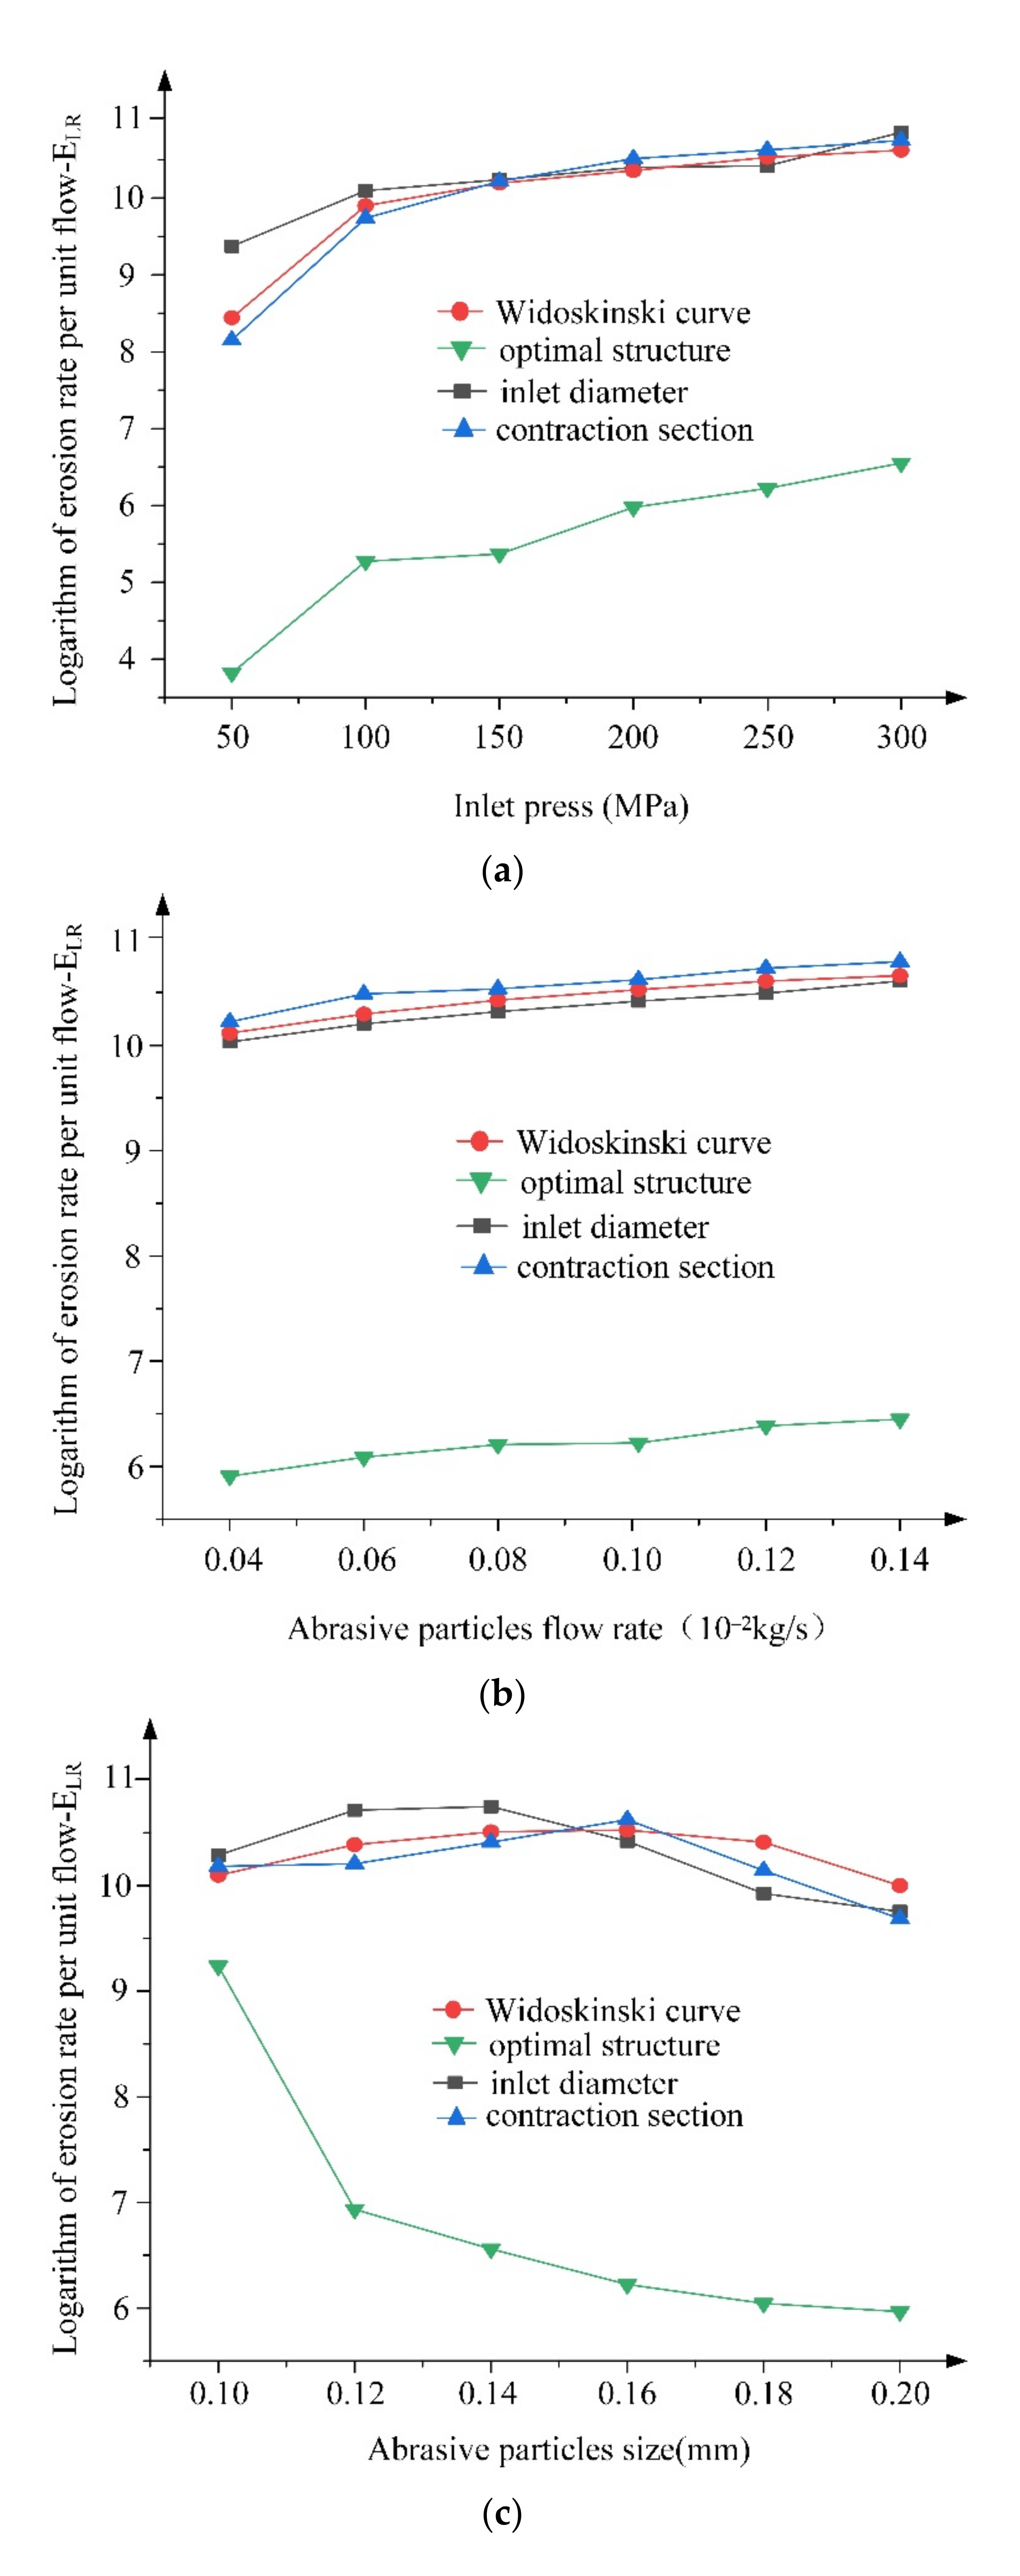
The effects of inlet pressure on the logarithm unit flow erosion rate in four nozzle cases are plotted as shown in Figure 14a. The increase in inlet pressure enhances the erosion in the four nozzle cases and the fully optimized nozzle produces the minimum erosion in the four nozzle cases in the full range of the inlet pressure.
The erosion is increased by increasing abrasive flow rate and the fully optimized nozzle produces the minimum erosion in the four nozzle cases in the full abrasive flow rate range, as shown in Figure 14b.
The particle size effects on the erosion of the four nozzle cases are plotted as shown in Figure 14c. In the four cases, the fully optimized nozzle produces the minimum erosion in the full range of the particle size. For the fully optimized nozzle, the erosion can be reduced by increasing the particle size, particularly in the range of (0.1, 0.12 mm). For the other three cases with single optimal parameters, the erosion is increased at the beginning by increasing the particle size and decreased after that.
Compared with the other three single-factor optimal nozzles, the fully optimized nozzle has the best performance in cutting ability and life cycle. The main erosion position also moves from the inside of the nozzle runner to the end surface of the nozzle, where the erosion has a low impact on the life cycle of the nozzle. Meanwhile, the unit flow erosion rate is also the lowest one. It shows that good nozzle section geometry can significantly improve the overall performance of the nozzle with regards to both cutting ability and life cycle. Further, it also proves that the orthogonal optimization technique is suitable for the optimization of the nozzle section geometry.

6. Conclusions

This paper proposed an optimization method for the nozzle geometry of a suspension water jet on the basis of the enumeration method and multiparameter orthogonal optimization. The CFD simulation is used to calculate the velocity field, particle trajectory and abrasive erosion rate. Three variables are optimized, including the inlet diameter coefficient, the axial length coefficient of the contraction section and the section curves of the contraction section, with the objective of the combined optimization of the minimum erosion and maximum peak velocity. The following conclusions can be drawn:
(1)
Regarding the life cycle and cutting ability, the axial length coefficient of the optimal nozzle contraction section is 2.857, the inlet diameter coefficient is 0.333 and the optimal contraction section curve is a Widosinski curve.
(2)
The inlet diameter coefficient has a low impact on the peak velocity, but has a big effect on the peak erosion rate and the main erosion position.
(3)
The axial length coefficient of the contraction section has a big effect on the erosion rate of the nozzle. The unit flow erosion rate can be reduced by increasing the axial length coefficient and the erosion position moves downstream.
(4)
The optimal nozzle produces the minimum unit flow erosion rate in all cases and the main erosion happens at the end surface of the nozzle, which has a low impact on the life cycle of the nozzle. Changing the operation parameters, including inlet pressure, abrasive particle size and abrasive particle flow rate does not affect the optimal results. The optimal nozzle has gained a significantly improved performance compared with the nozzles with single-optimized parameters, including the inlet diameter coefficient, contraction length coefficient and contraction section curve.
This paper only studies the influence of nozzle section geometric characteristics on erosion. In future work, the experimental comparison of water jets will be considered, especially the influence and weight of wear of different parts on nozzle life, as well as the influence of abrasive hardness, size, geometric shape, source and mechanical properties on erosion.

Author Contributions

Writing—original draft preparation, Z.L.; data curation, X.W.; software, Z.L. and Y.W.; writing—review and editing, Z.L.; supervision, S.Y. and L.W.; funding acquisition, F.Y. All authors have read and agreed to the published version of the manuscript.

Funding

This research was funded by the National Natural Science Foundation of China, grant number 52001089”; the China Postdoctoral Science Foundation, grant number 2020M670889; the Heilongjiang Provincial Natural Science Foundation of China, grant number LH2021E046.

Institutional Review Board Statement

Not applicable.

Informed Consent Statement

Not applicable.

Data Availability Statement

The study did not report any data.

Conflicts of Interest

The authors declare no conflict of interest.

References

  1. Xiong, X.S. High Pressure Waterjet Technology & Engineering; Hefei University of Technology Press: Hefei, China, 2006; pp. 30–56. [Google Scholar]
  2. Junlong, S.; Changxia, L.; Hongqi, L.; Bin, L. Effect of mechanical properties and impact angles on erosion behavior of B4C/TiB2 matrix ceramic nozzle materials. Ceram. Int. 2016, 42, 8826–8832. [Google Scholar] [CrossRef]
  3. Deng, J.X. Wear behaviors of ceramic nozzles with laminated structure at their entry. Wear 2009, 266, 30–36. [Google Scholar] [CrossRef]
  4. Oka, Y.; Hutchings, I.M. Dependence of Material Hardness on Erosion by Solid Particle Impact. Corros. Eng. 2009, 39, 610–616. [Google Scholar] [CrossRef]
  5. Oka, Y.I.; Okamura, K.; Yoshida, T. Practical estimation of erosion damage caused by solid particle impact—Part 1: Effects of impact parameters on a predictive equation. Wear 2005, 259, 95–101. [Google Scholar] [CrossRef]
  6. Tilly, G.P.; Sage, W. The interaction of particle and material behaviour in erosion processes. Wear 1970, 16, 447–465. [Google Scholar] [CrossRef]
  7. Oka, Y.I.; Yoshida, T. Practical estimation of erosion damage caused by solid particle impact—Part 2: Mechanical properties of materials directly associated with erosion damage. Wear 2005, 259, 102–109. [Google Scholar] [CrossRef]
  8. Finnie, I. The Mechanism of Erosion of Ductile Metals. In Proceedings of the 3rd U.S. National Congress of Applied Mechanics, Providence, RI, USA, 11–14 June 1958. [Google Scholar]
  9. Bozzini, B.; Ricotti, M.E.; Boniardi, M.; Mele, C. Evaluation of erosion-corrosion in multiphase flow via CFD and experimental analysis. Wear 2003, 255, 237–245. [Google Scholar] [CrossRef]
  10. Stack, M.M.; Abdelrahman, S.M.; Jana, B.D. A new methodology for modelling erosion-corrosion regimes on real surfaces: Gliding down the galvanic series for a range of metal-corrosion systems. Wear 2010, 268, 533–542. [Google Scholar] [CrossRef] [Green Version]
  11. Long, X.; Ruan, X.; Liu, Q.; Chen, Z.; Xue, S.; Wu, Z. Numerical investigation on the internal flow and the particle movement in the abrasive waterjet nozzle. Powder Technol. 2017, 314, 635–640. [Google Scholar] [CrossRef]
  12. Kartal, F. Study and evaluation of abrasive water jet turning process performance on AA5083. Materialwissenschaft und Werkstofftechnik 2020, 51, 212–220. [Google Scholar] [CrossRef]
  13. Ma, Q.; Lin, J.; Yang, K.; Xie, H.; Guo, C. Experimental study on abrasive recycling in cutting with abrasive suspension water jet. Int. J. Adv. Manuf. Technol. 2021, 114, 969–979. [Google Scholar] [CrossRef]
  14. Anand, U.; Katz, J. Prevention of nozzle wear in abrasive water suspension jets (AWSJ) using porous lubricated nozzles. J. Tribol. 2003, 125, 168–180. [Google Scholar] [CrossRef]
  15. Hashish, M. Observations of Wear of Abrasive-Waterjet Nozzle Materials. J. Tribol. 1994, 116, 439–444. [Google Scholar] [CrossRef]
  16. Nanduri, M.; Taggart, D.G.; Kim, T.J. The effects of system and geometric parameters on abrasive water jet nozzle wear. Int. J. Mach. Tools Manuf. 2002, 42, 615–623. [Google Scholar] [CrossRef]
  17. Nanduri, M.; Taggart, D.G.; Kim, T.J. A Study of Nozzle Wear in Abrasive Entrained Water Jetting Environment. J. Tribol. 2000, 122, 465–471. [Google Scholar] [CrossRef]
  18. Chen, X.C.; Deng, S.S.; Guan, J.F.; Hua, W.X. Experiment and simulation research on abrasive water jet nozzle wear behavior and anti-wear structural improvement. J. Braz. Soc. Mech. Sci. Eng. 2017, 39, 2023–2033. [Google Scholar] [CrossRef]
  19. Zuo, W.; Huang, C.; Liu, Y.; Han, H.; Hao, F.; Zhao, F.; Huang, F. Analysis and Modeling of Particle Velocities in Premixed Abrasive Water Jets. Geofluids 2020, 2020, 1–9. [Google Scholar] [CrossRef]
  20. Du, M.M.; Wang, H.J.; Dong, H.Y.; Guo, Y.J.; Ke, Y.L. Numerical research on multi-particle movements and nozzle wear involved in abrasive waterjet machining. Int. J. Adv. Manuf. Technol. 2021, 117, 2845–2858. [Google Scholar] [CrossRef]
  21. Gavrilov, I.Y.; Popov, V.V.; Sorokin, I.Y.; Tishchenko, V.A.; Khomyakov, S.V. A contactless technique for determining the average sizes of erosion-hazardous droplets in polydisperse wet steam flow. Therm. Eng. 2014, 61, 577–584. [Google Scholar] [CrossRef]
  22. Mostofa, M.G.; Kil, K.Y.; Hwan, A.J. Computational fluid analysis of abrasive waterjet cutting head. J. Mech. Sci. Technol. 2010, 24, 249–252. [Google Scholar] [CrossRef]
  23. Wang, R.H.; Wang, M.B. A two-fluid model of abrasive waterjet. J. Mater. Process. Technol. 2010, 210, 190–196. [Google Scholar] [CrossRef]
  24. Kowsari, K.; Nouraei, H.; Samareh, B.; Papini, M.; Spelt, J.K. CFD-aided prediction of the shape of abrasive slurry jet micro-machined channels in sintered ceramics. Ceram. Int. 2016, 42, 7030–7042. [Google Scholar] [CrossRef]
  25. Kim, J.H.; Joo, H.G.; Lee, K.Y. Simulation of solid particle erosion in WC-Ni coated wall using CFD. J. Mater. Process. Technol. 2015, 224, 240–245. [Google Scholar] [CrossRef]
  26. Parsi, M.; Najmi, K.; Najafifard, F.; Hassani, S.; McLaury, B.S.; Shirazi, S.A. A comprehensive review of solid particle erosion modeling for oil and gas wells and pipelines applications. J. Nat. Gas Sci. Eng. 2014, 21, 850–873. [Google Scholar] [CrossRef]
  27. Nguyen, V.B.; Nguyen, Q.B.; Liu, Z.G.; Wan, S.; Lim, C.Y.H.; Zhang, Y.W. A combined numerical-experimental study on the effect of surface evolution on the water-sand multiphase flow characteristics and the material erosion behavior. Wear 2014, 319, 96–109. [Google Scholar] [CrossRef]
  28. Jafari, M.; Mansoori, Z.; Avval, M.S.; Ahmadi, G.; Ebadi, A. Modeling and numerical investigation of erosion rate for turbulent two-phase gas-solid flow in horizontal pipes. Powder Technol. 2014, 267, 362–370. [Google Scholar] [CrossRef]
  29. Zhang, J.Q.; Han, Z.W.; Yin, W.; Wang, H.Y.; Ge, C.; Jiang, J.L. Numerical Experiment of the Solid Particle Erosion of Bionic Configuration Blade of Centrifugal Fan. Acta Metall. Sin. 2013, 26, 16–24. [Google Scholar] [CrossRef] [Green Version]
  30. Grant, G.; Tabakoff, W. Erosion prediction in turbomachinery due to environmental solid particles. In Proceedings of the 12th Aerospace Sciences Meeting, Washington, DC, USA, 30 January–1 February 1974. [Google Scholar]
  31. Campos-Amezcua, A.; Gallegos-Munoz, A.; Romero, C.A.; Mazur-Czerwiec, Z.; Campos-Amezcua, R. Numerical investigation of the solid particle erosion rate in a steam turbine nozzle. Appl. Therm. Eng. 2007, 27, 2394–2403. [Google Scholar] [CrossRef]
  32. Haugen, K.; Kvernvold, O.; Ronold, A.; Sandberg, R. Sand erosion of wear-resistant materials: Erosion in choke valves. Wear 1995, 186, 179–188. [Google Scholar] [CrossRef]
  33. Safikhani, H.; Abbassi, A.; Khalkhali, A.; Kalteh, M. Multi-objective optimization of nanofluid flow in flat tubes using CFD, Artificial Neural Networks and genetic algorithms. Adv. Powder Technol. 2014, 25, 1608–1617. [Google Scholar] [CrossRef]
  34. Manshadi, M.D.; Aghajanian, S. Computational aerodynamic optimization of wing-design concept at supersonic conditions by means of the response surface method. J. Braz. Soc. Mech. Sci. Eng. 2018, 40, 1–15. [Google Scholar] [CrossRef]
  35. Uebel, K.; Rossger, P.; Prufert, U.; Richter, A.; Meyer, B. CFD-based multi-objective optimization of a quench reactor design. Fuel Process. Technol. 2016, 149, 290–304. [Google Scholar] [CrossRef]
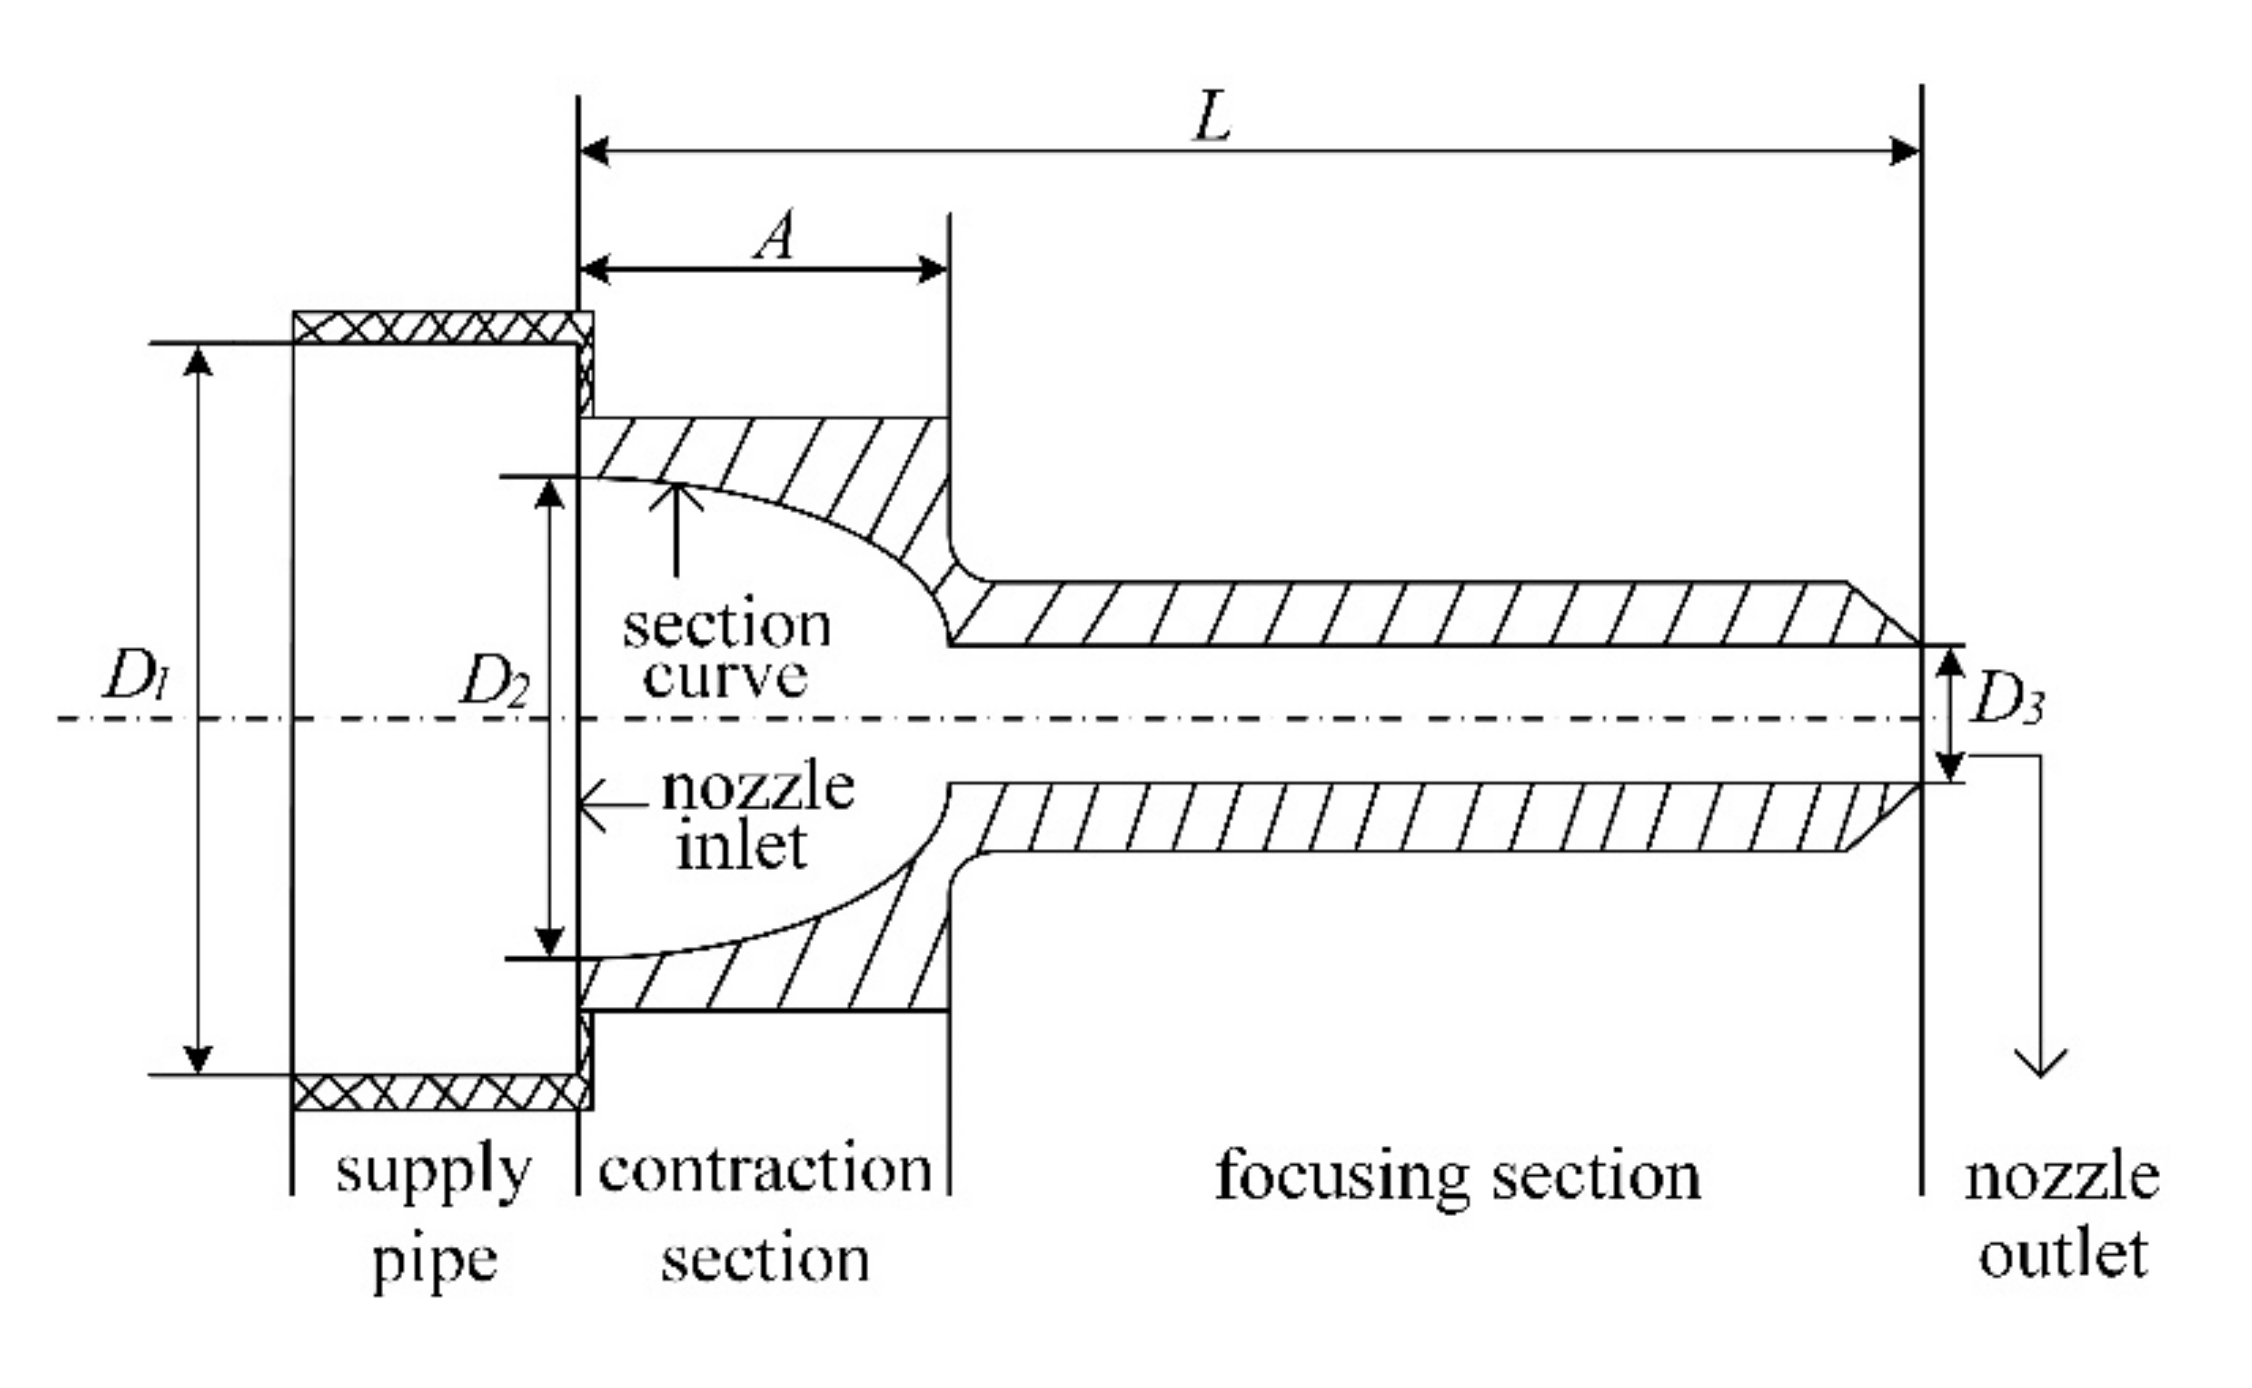
Figure 1. Section geometry of suspension abrasive water jet nozzle and pipeline.
Machines 10 00003 g001
Figure 2. Schematic diagram of erosion areas.
Machines 10 00003 g002
Figure 3. Simulation model.
Machines 10 00003 g003
Figure 4. The overall mesh of the simulation model.
Machines 10 00003 g004
Figure 5. The finite element mesh of the contraction section.
Machines 10 00003 g005
Figure 6. The curves of the contraction section.
Machines 10 00003 g006
Figure 7. Section curve of nozzle contraction section.
Machines 10 00003 g007
Figure 8. Effect of the inlet diameter coefficient on nozzle performance.
Machines 10 00003 g008
Figure 9. Effect of axial length of contraction section on nozzle performance.
Machines 10 00003 g009
Figure 10. Comparison of the geometry between the optimal and product nozzles.
Machines 10 00003 g010
Figure 11. Velocity distribution of optimal cross-section nozzles.
Machines 10 00003 g011
Figure 12. Abrasive particle trajectory of nozzle with optimal configuration. (a) Trajectory of abrasive particles at nozzle end surface; (b) Trajectory of abrasive particles in contraction section; (c) Trajectory of abrasive particles in focusing section.
Machines 10 00003 g012
Figure 13. Operation parameter effects on the peak velocity: (a) Inlet pressure effects of the peak velocity; (b) abrasive particle flow rate effects on peak velocity; (c) abrasive particle size effects on peak velocity.
Machines 10 00003 g013aMachines 10 00003 g013b
Figure 14. Logarithmic diagram of peak erosion rate per unit flow of various nozzles under different system parameters: (a) inlet pressure effects on the logarithm unit flow erosion rate; (b) abrasive flow rate effects on the logarithm unit flow erosion rate; (c) particle size effects on the logarithm unit flow erosion rate.
Machines 10 00003 g014
Table 1. Convergence study of the mesh model.
Mesh ConfigurationsCell NumbersPeak Velocity
(m/s)
Variation
(%)
Erosion AreaPeak Erosion Rate
10−5 (kg/(m2s))
Variation
(%)
Coarse13,720683.69−0.0023–41.4910.13
Medium23,450682.25−0.2123–41.5071.21
Fine42,240685.160.2143–41.469–1.34
Average-683.70--1.489-
Table 2. Shape functions of section curves for contraction sections.
CurveS1S2S3S4S5S6S7S8S9
TypeParabolaExponentialSinCubeWiedosinskiEllipseCircleCosSingle cone
Table 3. Test parameters and values.
ParameterValues TestedSimulation Initial Value
ScS1 S2 S3 S4 S5 S6 S7 S8 S9S2
A (mm)6 8 10 12 14 16 18 2010
λc0.857 1.143 1.429 1.714 2.000 2.286 2.571 2.8571.429
D2 (mm)1 2 3 4 5 6 7 8 9 108
λi0.083 0.167 0.250 0.333 0.417 0.500 0.583 0.667 0.75 0.8330.667
Table 4. Parameters of commercial product nozzle.
D1 (mm)D2 (mm)D3 (mm)ScA (mm)L (mm)
1281S91040
Table 5. Operating parameters.
Inlet PressAbrasive SizeTotal Flow RateD1 (mm)D2 (mm)D3 (mm)
250 MPa0.16 mm0.101 kg/s1281
Table 6. Effect of section curves on nozzle performance.
Section CurveS1S2S3S4S5S6S7S8S9
Peak velocity (m/s)680679679678683642680663668
Erosion rate per unit flow (10−5 kg/(m2s))8.410.18.47.93.416.38.94.39.2
Performance improvement (%)8.7−9.88.714.163.0−77.23.353.3-
Erosion area3–44–543–43–43–53–52–33–5
Table 7. Flow state parameters of nozzle with optimum section.
TypePeak Velocity
(m/s)
Erosion AreaELR
Optimal nozzle70616.23
Product nozzle6683–510.96
Performance Improvement (%)5.64-43.2
Table 8. Optimal parameters of the nozzle.
ParameterλiλcSc
Optimal0.3332.857Widosinski curve
Table 9. Levels of system operating parameters.
Parameter123456
Abrasive particle flow rate (kg/s)0.040.060.080.100.120.14
Abrasive particle size (mm)0.100.120.140.160.180.20
Inlet press (MPa)50100150200250300
Publisher’s Note: MDPI stays neutral with regard to jurisdictional claims in published maps and institutional affiliations.