Article

Kinematic Analysis of V-Belt CVT for Efficient System Development in Motorcycle Applications

by
Vincenzo La Battaglia
1,
Alessandro Giorgetti
1,2,*,
Stefano Marini
1,
Gabriele Arcidiacono
2 and
Paolo Citti
2
1
Department of Industrial, Electronic and Mechanical Engineering, Roma Tre University, 00146 Rome, Italy
2
Department of Engineering Science, Guglielmo Marconi University, 00193 Rome, Italy
*
Author to whom correspondence should be addressed.
Machines 2022, 10(1), 16; https://doi.org/10.3390/machines10010016
Submission received: 16 November 2021 / Revised: 14 December 2021 / Accepted: 22 December 2021 / Published: 24 December 2021
(This article belongs to the Section Vehicle Engineering)

Abstract

:
Continuous variable transmission (CVT) is a widely used technology for two-wheeler applications due to its cost-effectiveness, lightweight, and reduced size. This kind of transmission involves the accurate matching of the system with the engine characteristics. This paper analyzes the typical design procedure used to develop the transmission system and evaluates the current approach’s critical issues. The paper aims to identify a possible path to improve the system and its customization capacity. It is identified that the critical design stage is the identification of the correct sliding profile for the half pulley of the front assembly of the system. Then, the geometrical parameters of the transmission are accurately identified through a detailed kinematic analysis. The presented kinematic analysis is propaedeutic for developing a mathematical model that defines the rollers’ sliding profile according to the vehicle’s performance.

1. Introduction

Urban traffic is one of the main causes contributing to global pollution [1,2]. The introduction of low emission or zero-emission vehicles contributes to solving this issue [3]. In particular, the use of two-wheeled vehicles, as an alternative to cars, helps to limit pollution considerably [4,5] thanks to their lower fuel consumption, comparing the same route (lighter vehicle). The better handling and the smaller vehicle dimensions allow staying less time in city traffic, limiting the emissions due to traffic queues [6]. This aspect is particularly true for daily journeys (e.g., travel to and from work) for which a two-wheeled vehicle is an alternative to the car.
Moreover, it is easier to find parking for smaller vehicles, reducing emissions due to movements necessary to find parking [7,8,9].
These reasons result in time savings for drivers, making two-wheeled vehicles a significant player in urban traffic. Motorbikes and small scooters are particularly popular and used due to their maneuverability and low purchase and use cost.
These vehicles are usually equipped with rubber V-belt continuously variable transmission (CVT) characterized by the following essential features:
  • The continuous variation of the speed ratio allows the engine working at a nearly constant speed to optimize the endothermic engine efficiency;
  • This kind of transmission is an automatic one, thus simplifying the driving so that even non-expert two-wheeled drivers can use these vehicles easily;
  • The constructive simplicity of the transmission makes it cost-effective for production and maintenance;
  • The lightweight and the high efficiency (near 80% at the full operating speed [10]) of transmission positively affect the fuel consumption;
  • The transmission can absorb sudden change in the torque (it works as a flexible coupling joint).
These features promote wide use of the CVTs on motorcycles and scooters with power up to 25 kW. Higher power engines require metal belts CVT or different kinds of transmission.
However, on the CVT design process, there are present restrictions that could become important improvement opportunities. In particular, selecting the best design solutions for CVT is a challenge for design teams because defining the critical functions by matching customer satisfaction with the system’s technical performance is a critical activity. This issue is crucial for a system such as CVT, characterized by high standards requirements, the need to satisfy the customers, and accurate cost control. From this point of view, consumption reduction can be a driver to optimize the design process of the CVT. The impact of CVT optimization, considering the wide diffusion of vehicles equipped with CVT, could significantly impact air quality in urban environments and CO2 emission.
The rubber V-belt CVT has been studied by some authors [11,12,13,14] to develop a model that could be used in the design phase. The system analysis results in a very complex issue due to the complexity of the behavior of the components (e.g., belt flexibility, rubber hysteresis, friction coefficient) and to external influence (e.g., engine vibration). The analysis carried out by the authors is specific to the coupling between the belt and the pulleys during transmission operation and can be summarized in three types of approach: complex theoretical models [15,16], simplified semi-experimental models [17,18,19,20], and numerical models [21].
In the authors’ opinion, validated by a dialogue with various industrial manufacturers of this type of vehicle, the approaches currently described in the literature are difficult to adopt in real industrial application for the specificity of the product development phases.
Identifying the limitation in the current design approach of this system is the starting point to introduce a possible path for developing an accurate but efficient mathematical model capable of defining the sliding profile of the rollers according to the performance required of the vehicle. For this reason, this paper analyzes the typical design procedure used to develop the CVT system and highlights the current approach’s critical issues. Finally, the first step of the proposed path (i.e., the kinematic study of the transmission) is described in detail.

2. Materials and Methods

2.1. Analysis of Typical CVT Design Procedure

The CVT aims to vary the speed ratio between the driveshaft and the driven shaft to best adapt the engine’s characteristics to the user requests in different operating conditions. The CVT (Figure 1) consists of a front group (a) directly connected to the drive shaft and a rear group (b) that gives the rear wheel motion. The two groups are connected by the V-belt (5), transmitting the power from the front to the rear group.
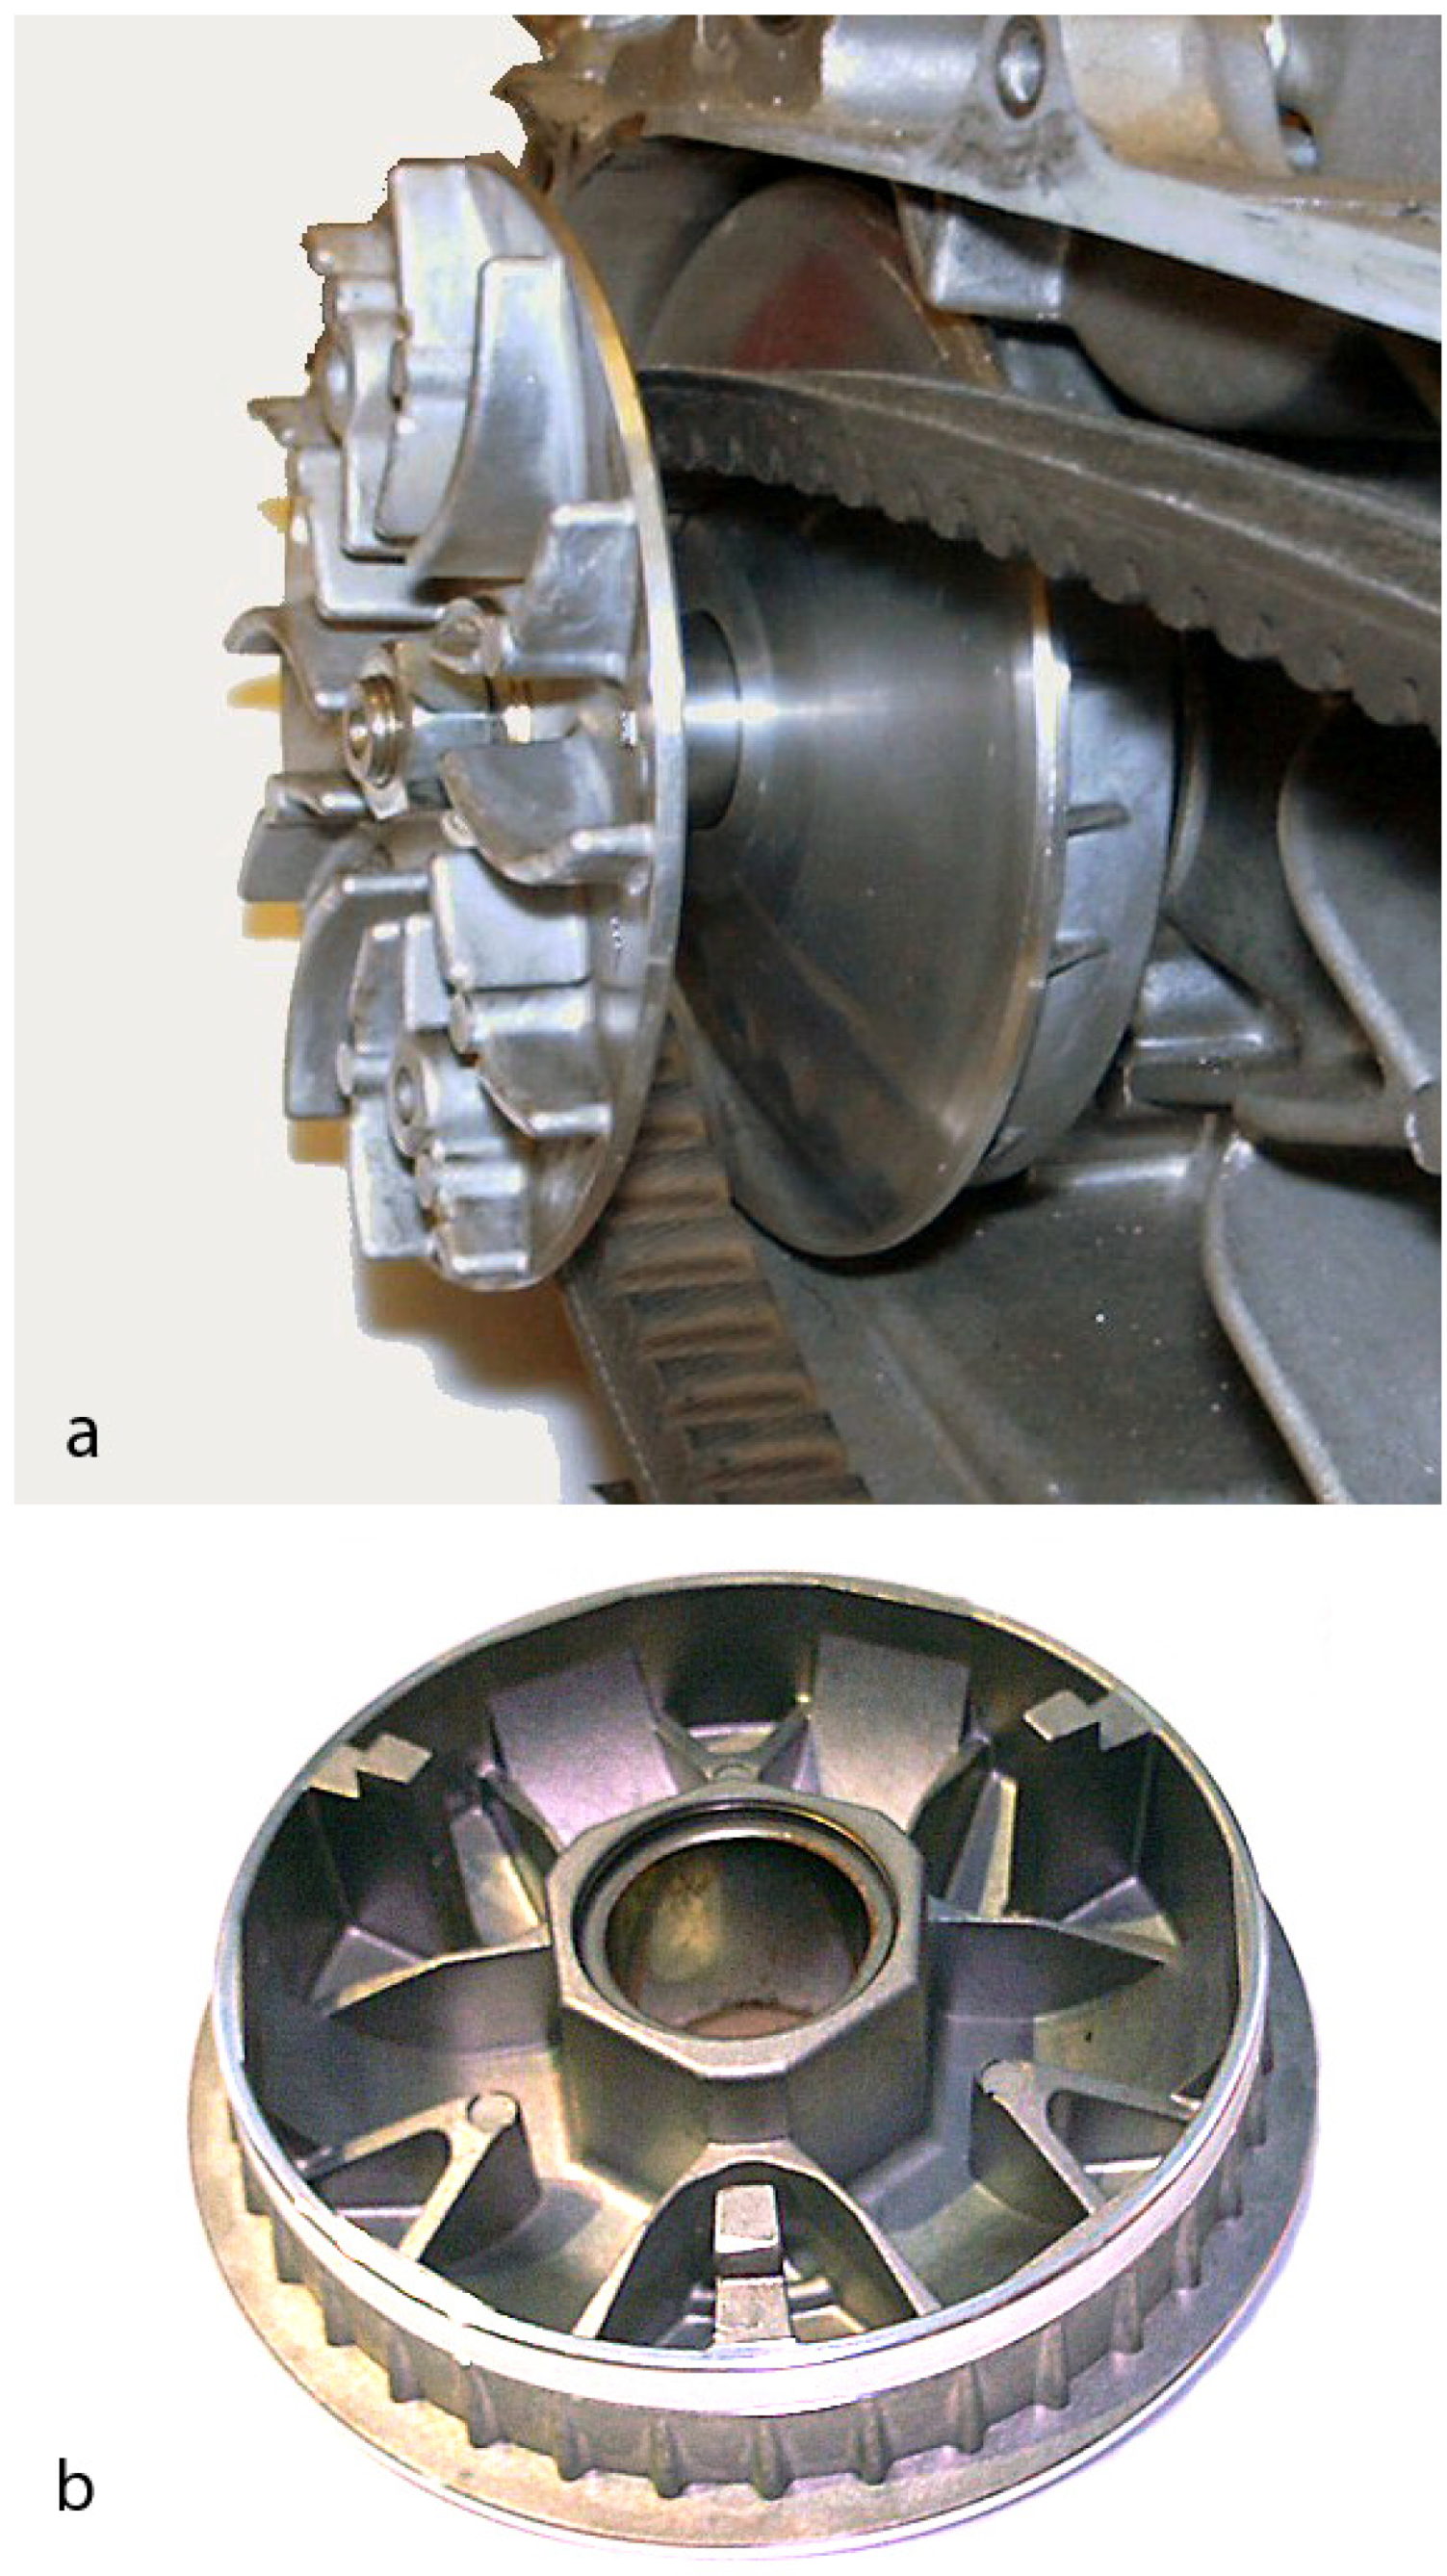
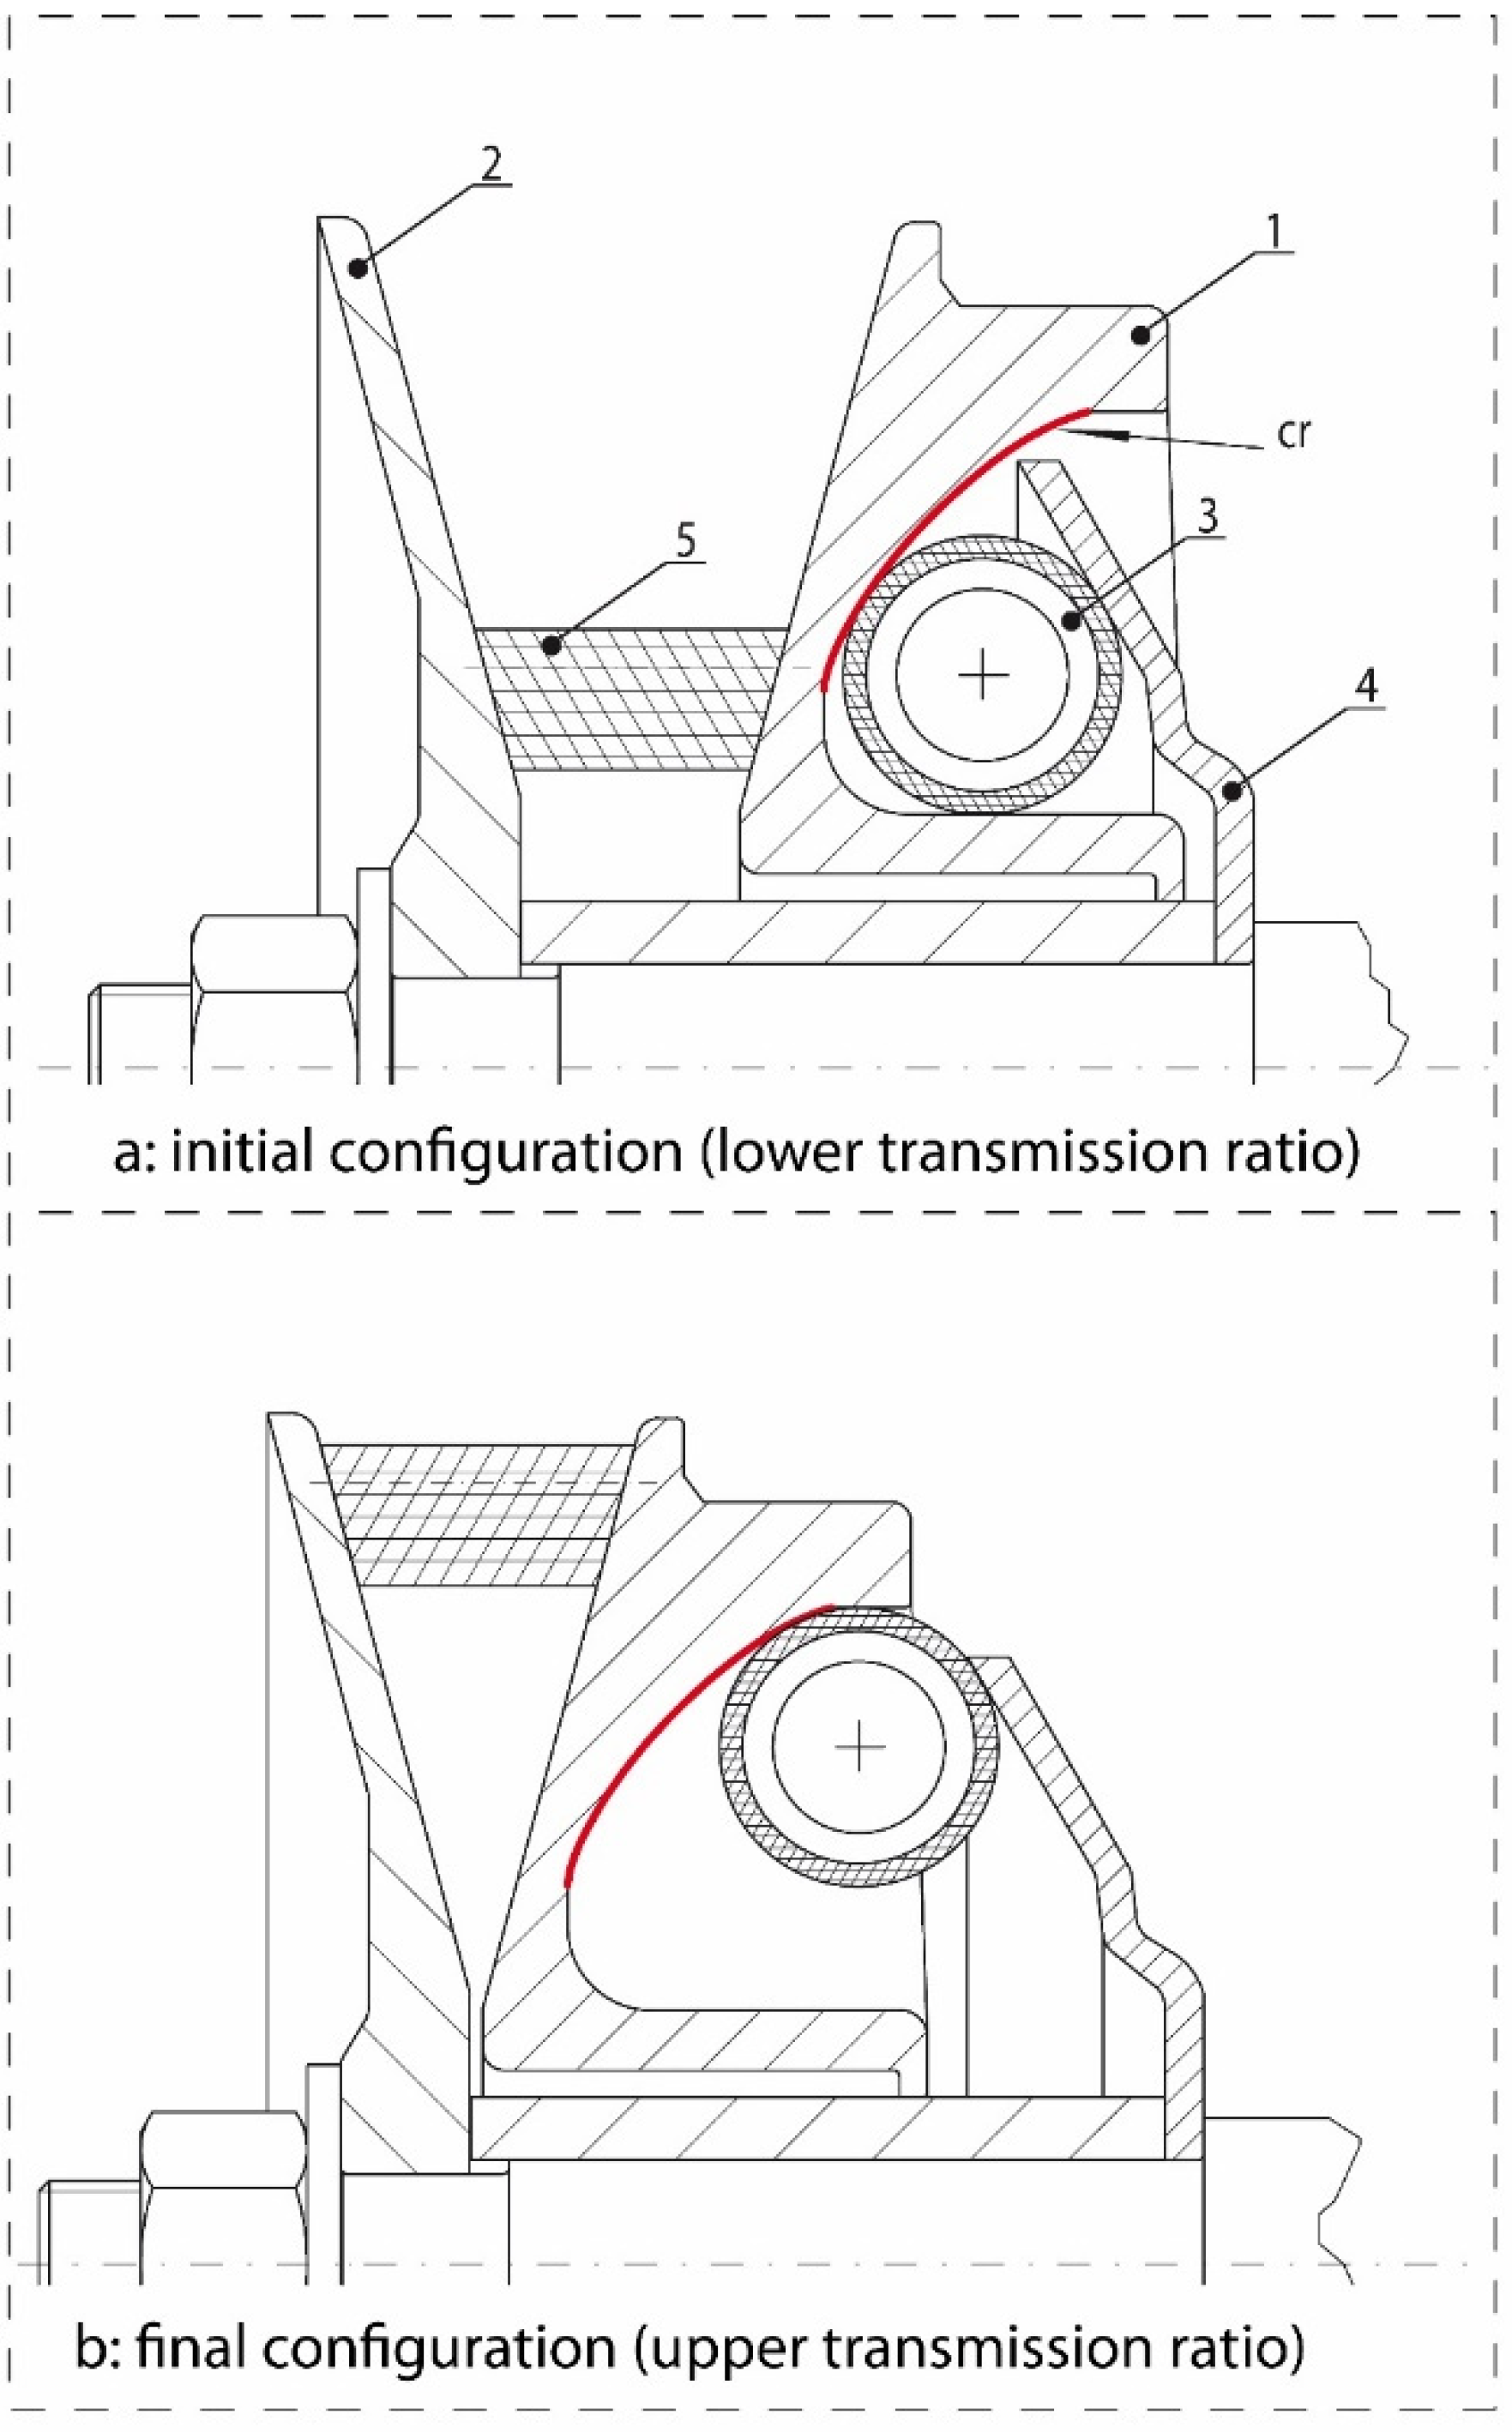
The front group (Figure 2) is also known as the driver pulley actuator or primary actuator, and its configuration depends on engine shaft speed; the result is a speed-sensing actuator. It is made up of two half-pulleys (1 and 2), one axially movable (1), the other axially fixed (2) and connected, generally using a splined profile, to the drive shaft.
The half pulley (1), which can move axially, holds inside some rollers (3) that are positioned between an axially fixed plate (4) and the half pulley itself. The half pulley has functional profiles (curved ramps-cr) on which the rollers can slide. Under the action of centrifugal force, the rollers are forced by the fixed plate to move on the curved ramp generating an axial force that moves the movable half-pulley along its axis towards the fixed one (Figure 3 shows the initial and the final configuration that the system can reach).
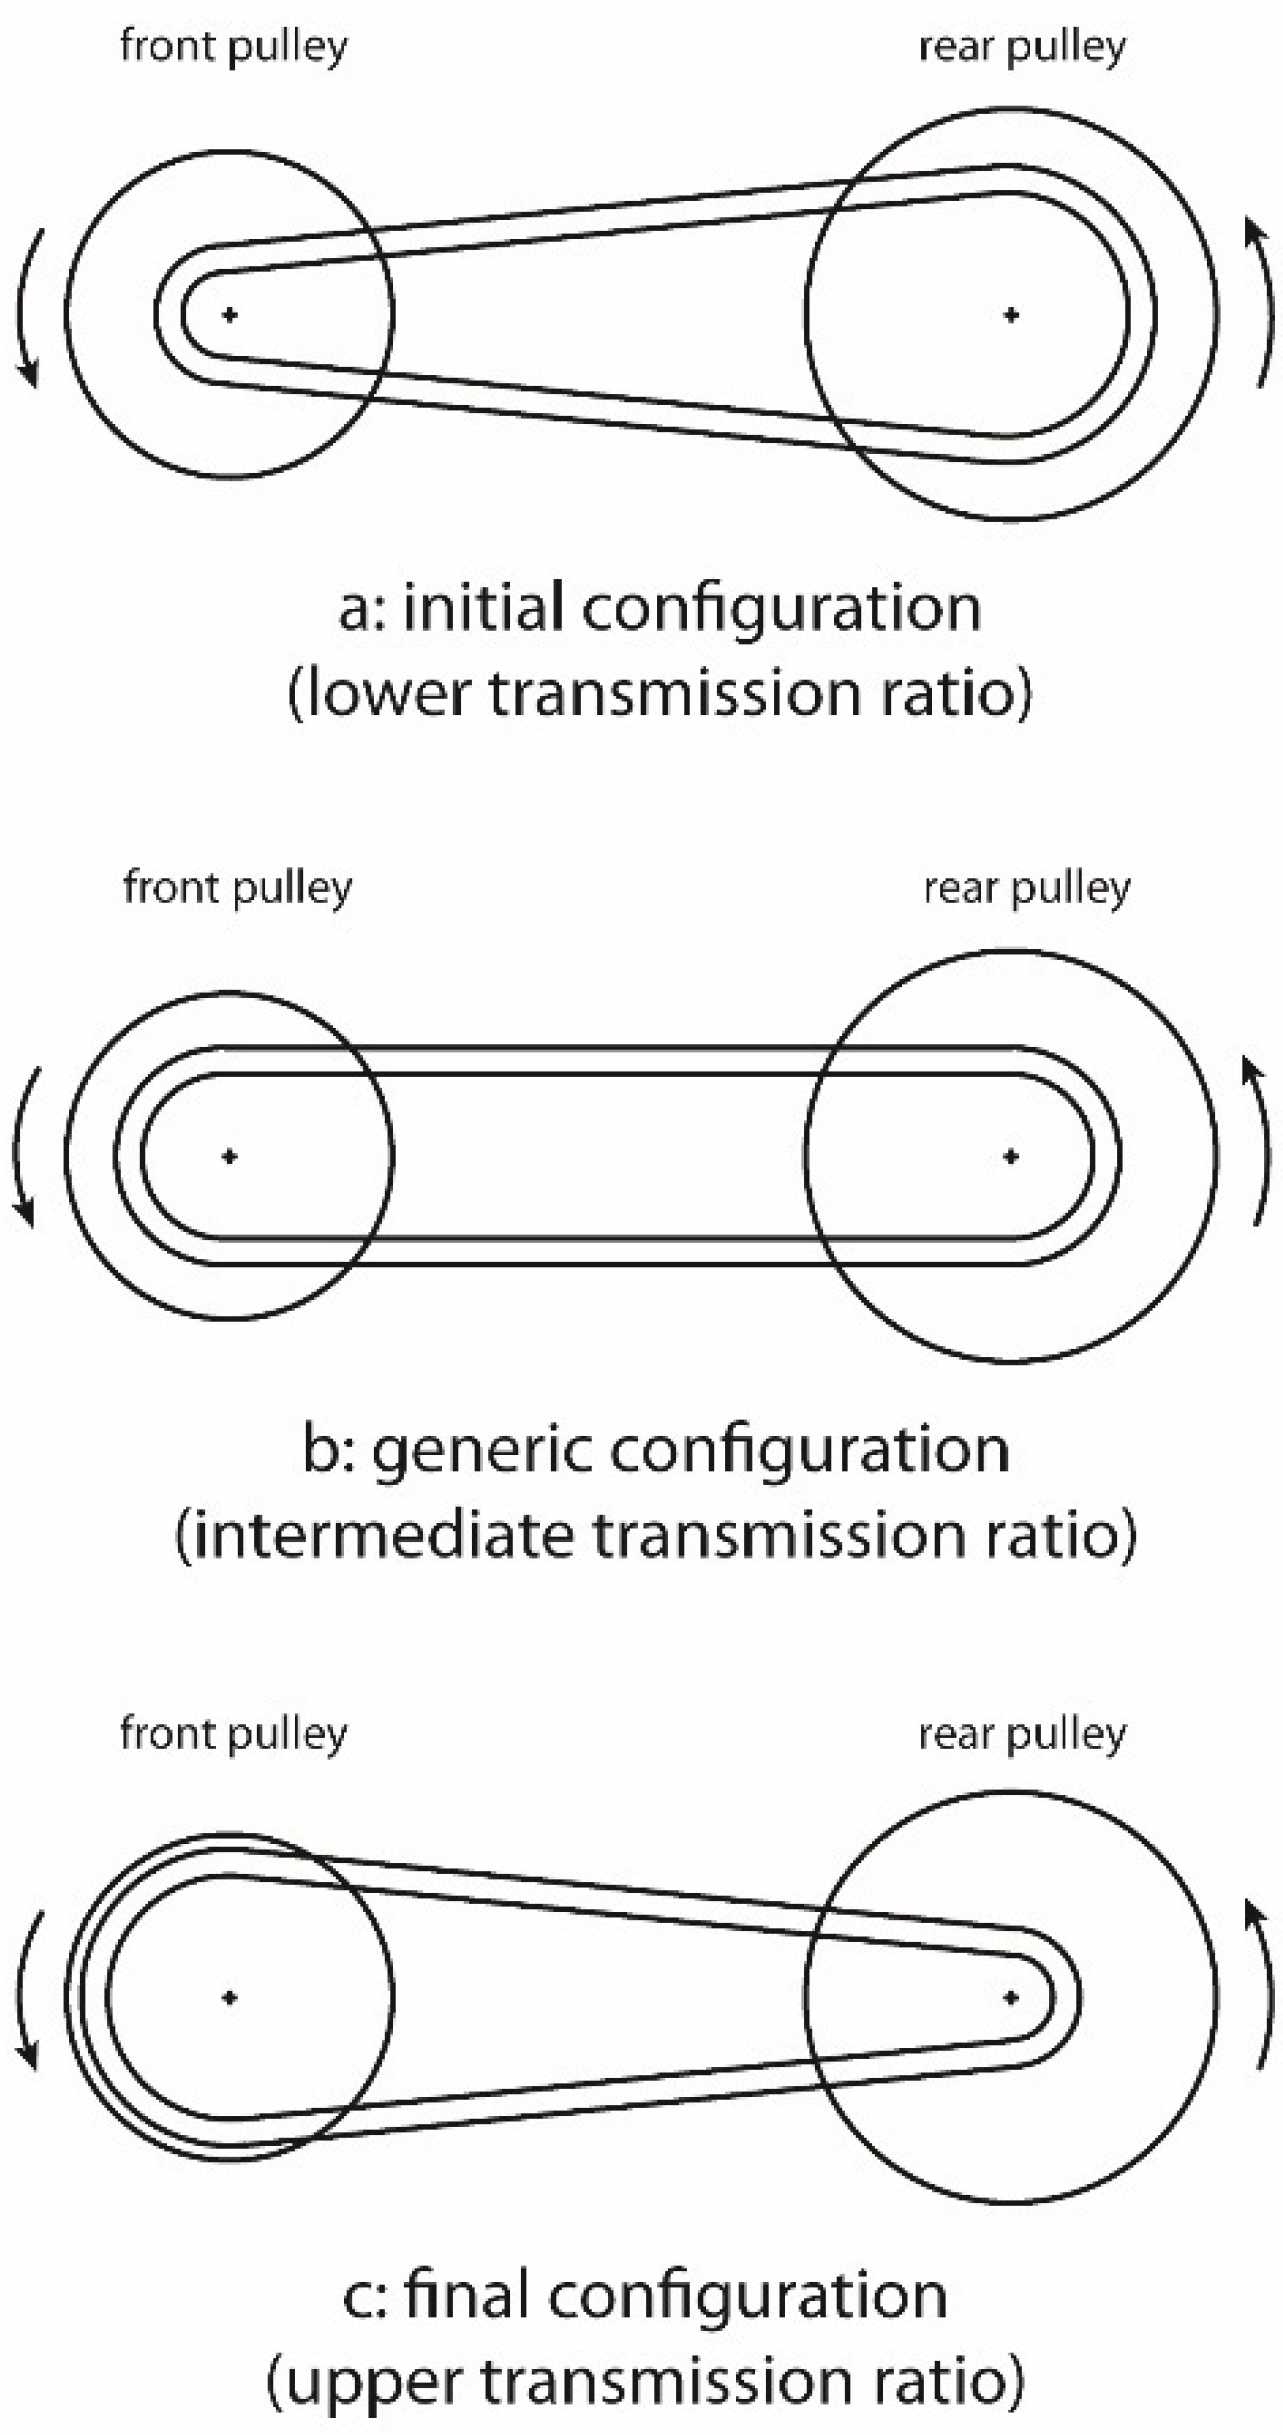
Due to the movable half-pulley axial movement toward the fixed one, the belt is forced to move towards the pulley’s upper edge, covering growing pitch diameters. The increment of the wrapping diameter in the front group entails the resulting reduction of the pitch diameter in the rear group producing the speed ratio variation. Figure 4 shows the positions assumed by the belt in the three different configurations:
  • The pitch diameter in the transmission’s initial setup is the smaller the belt can occupy on the front pulley. This condition corresponds to the lower transmission ratio reachable.
  • The engine speed increases and the centrifugal force acting on the rollers is enough to move the half pulley along its axis; the belt reaches a pitch diameter on the front pulley depending on the vehicle’s operating condition. This configuration is the work area of continuous transmission ratio variation from the lower to the upper.
  • The upper ratio is reached, the belt is on the bigger pitch diameter on the front pulley and any other movement is impossible for the half front pulley.
With reference to Figure 1, the rear assembly (b) (the driven pulley actuator, Figure 5) is composed of two half-pulley, one axially fixed (6) and the other axially movable (7). The axial movement of the half-pulley is controlled by the sliding of a definite number of pivots (8) on their guide or cam (9), suitably oriented, and by the compression force applied by a helical spring (10).
The rear group is also known as a driven pulley actuator or secondary actuator. Its structure is designed to work according to the effect of torque variation; the result is a torque-sensing actuator. When the output torque increases, the movable half-pulley is forced to move axially towards the fixed one, generating the pitch diameter’s increment.
The balance between the forces established at any given time in front and rear assembly, transferred by the V-belt, defines the transmission ratio. The forces equilibrium is strictly dependent on the operative condition of the transmission itself (motor vehicle speed, engine torque, engine revolution speed) and the load condition (driver and passenger weight, the slope of the road, required acceleration, etc.). This equilibrium determines the v-n curve (velocity of the vehicle vs. engine speed).
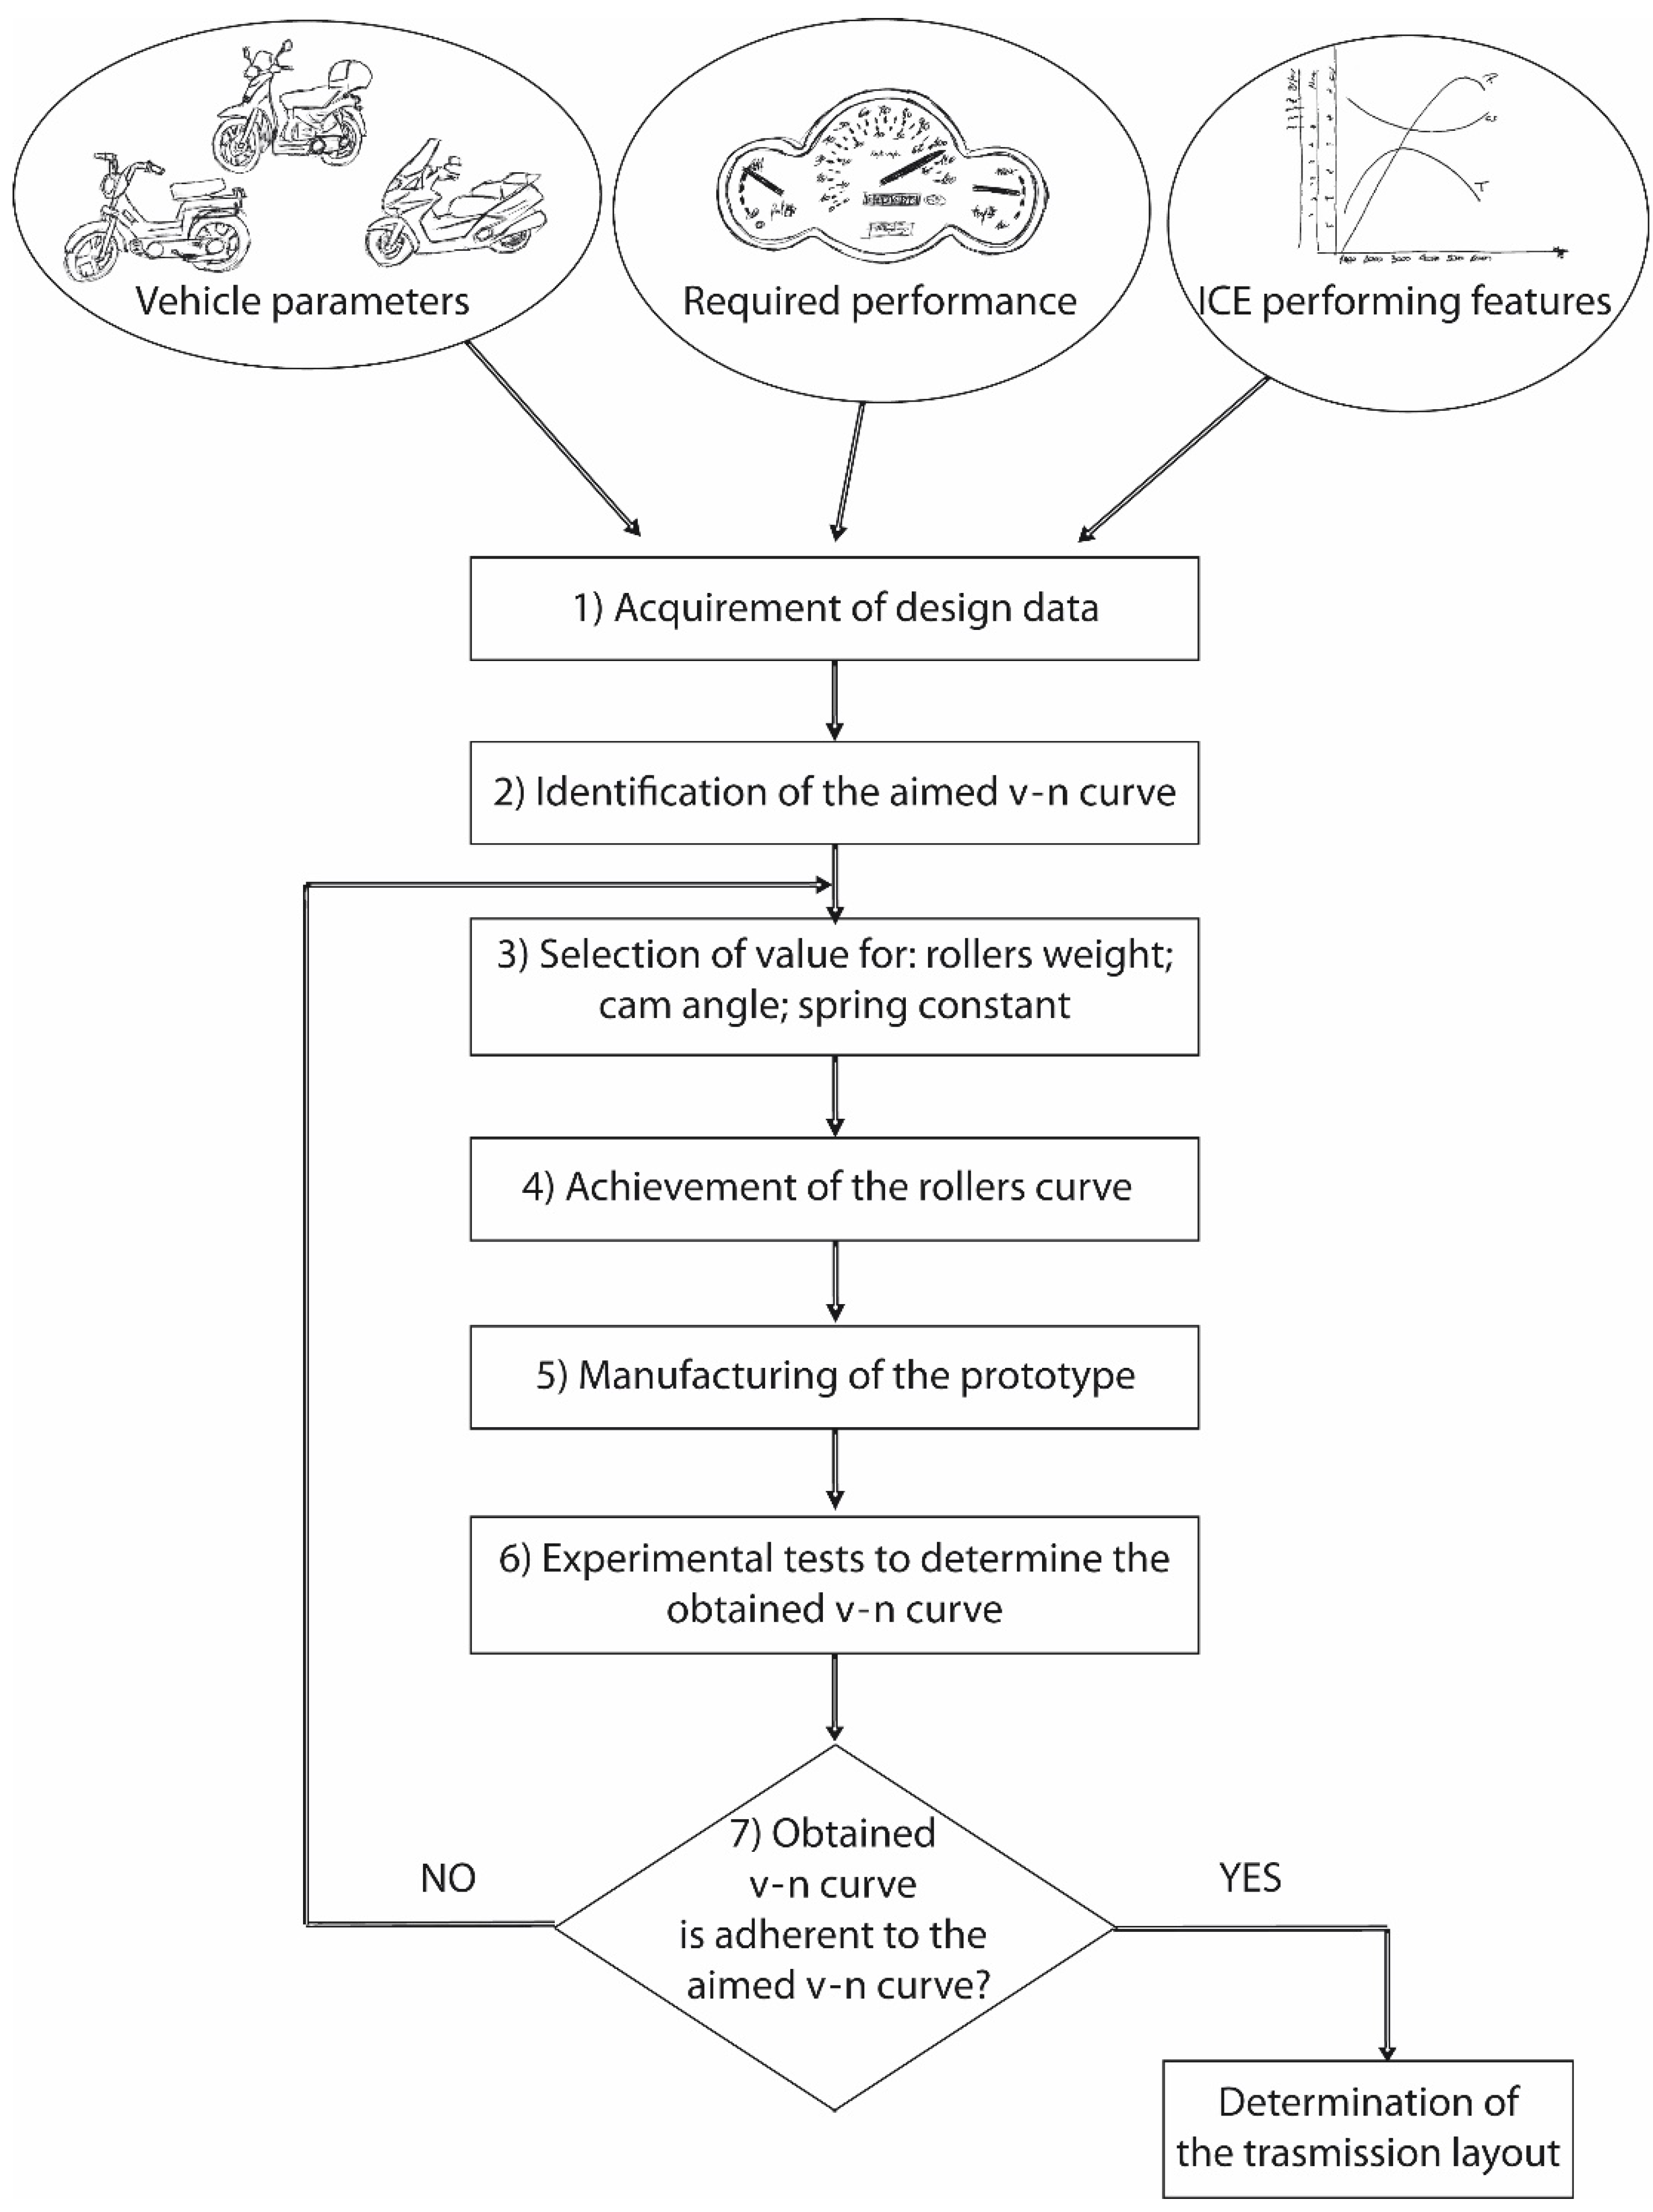
The design process of a CVT (Figure 6) is composed as follows:
  • Acquirement of design data: required performances; internal combustion engine (ICE) performing features, vehicle parameters;
  • Identification of the target v-n curve;
  • Selection of values for rollers weight, cam angle, spring constant;
  • Use of the mathematical model for the design of the curved ramp of the rollers;
  • Manufacturing of the prototype;
  • Experimental test of the obtained v-n curve.
An iterative calculation is applied to modify the curved ramps if the tested curve is not close to/differs from the aimed curve.
Motor vehicle manufacturing companies use different theoretical-experimental approaches to design the rollers curved ramp and, consequently, the CVT. An essential role in this process is the experimental activities that result in highly burdensome time and money.

2.2. Critical Issue of the Current Design Approach

In a vehicle equipped with traditional manual transmissions, it is possible to act on the engine electronics to set and optimize the vehicle performance [16]. In this way, it is possible to obtain better optimizations in the case of automatic transmission [22] or servo actuated transmission vehicles [23]. In contrast, V-belt CVT motor vehicles cannot affect shift since the transmission component forces’ balance determines the transmission ratio. As a result, the CVT performance in the different use conditions is strictly defined by design (Figure 6). The consequence is that the target’s selection deeply affects the transmission and is a crucial design element.
Consider, for example, that in the design phase, the chosen objective is to achieve minimal consumption; this choice leads to developing less-performing vehicles lacking the needed agility in the urban traffic.
On the other hand, selecting a fast-responding transmission leads to a vehicle not being easily controlled by some users, especially in particular grip conditions (e.g., rain, snow). From this point of view, it is important to consider that users’ class is fundamental to obtain a user-friendly performance. In this way, the inexperienced users can manage the vehicle and contain any driving risks, even at the expense of performance.
In other words, in the current framework, it is essential to choose from the beginning of the design which features we want to use in CVT planning. In general, the feature could be related to handling, fast response, maneuverability in urban traffic, and comfortable driving in unvaried speed travel (e.g., extra-urban route, ring road–beltway), low-cost maintenance, top speed, and vehicle weight. Due to system development constraints, the current design method is strictly constrained to choose a common design range [24,25] among several missions, users, and vehicle profiles. This aspect leads to the choice of a compromise solution that results in under-optimization in the different uses.
The most significant phase of the design process is determining the optimum roller sliding profile according to the required operating characteristics for the CVT. This phase of the design process (as in Section 2.1) is time-consuming and costly, not least because of the need for the experimental fine-tuning phase.
Therefore, it is not uncommon to find the same CVT used on different engines (e.g., a 125 cc engine and a 150 cc engine) or different motor scooters without the transmission being optimized for these different uses. This means that the vehicle often does not perform as well as it could with a dedicated transmission, negatively impacting performance, fuel consumption, and pollutant emissions.
In the design process, if the shift curve experimentally verified on the prototype differs significantly from the desired one, it is a sign that the mathematical model applied presents excessive inaccuracies, linked both to the complexity of the system and to the approximations assumed.
In particular, the use of highly complex mathematical models means that many parameters have to be considered [15,16]. However, not all of these can always be known a priori with sufficient accuracy. For others, the variability of the values due to other system parameters is not known with sufficient reliability. The practical application of these models is, therefore, usually problematic.
On the other hand, other mathematical models are more elementary [17,18,19,20] but, considering a smaller number of factors, provide results that are less adherent to reality. Many parameters are set as constants or not even considered in these cases, causing an important lack of accuracy in the results.
The last approach consists of numerical models [21] that are complex to implement in real applications. Overall, the evaluation of the current methods shows that they cannot permit economical and straightforward customization and adaptation of the system to specific customer needs.
Therefore, thanks to his own experience, the designer acts on the most critical parameters for the applied model. In this way, he optimizes the roller sliding profile and carries out further experimental verification. This is an iterative process that can be time-consuming and expensive.
Having a complete and reliable mathematical model that is also easy for the designer to manage would make it possible to reduce optimization iterations and, consequently, project times and costs. This would consequently make it possible to envisage greater customization of the product.

2.3. Development of an Efficient and Accurate Mathematical Model

Developing an efficient and accurate mathematical model for the definition of the roller curve is a key factor in overcoming the issue currently present in the CVT design method.
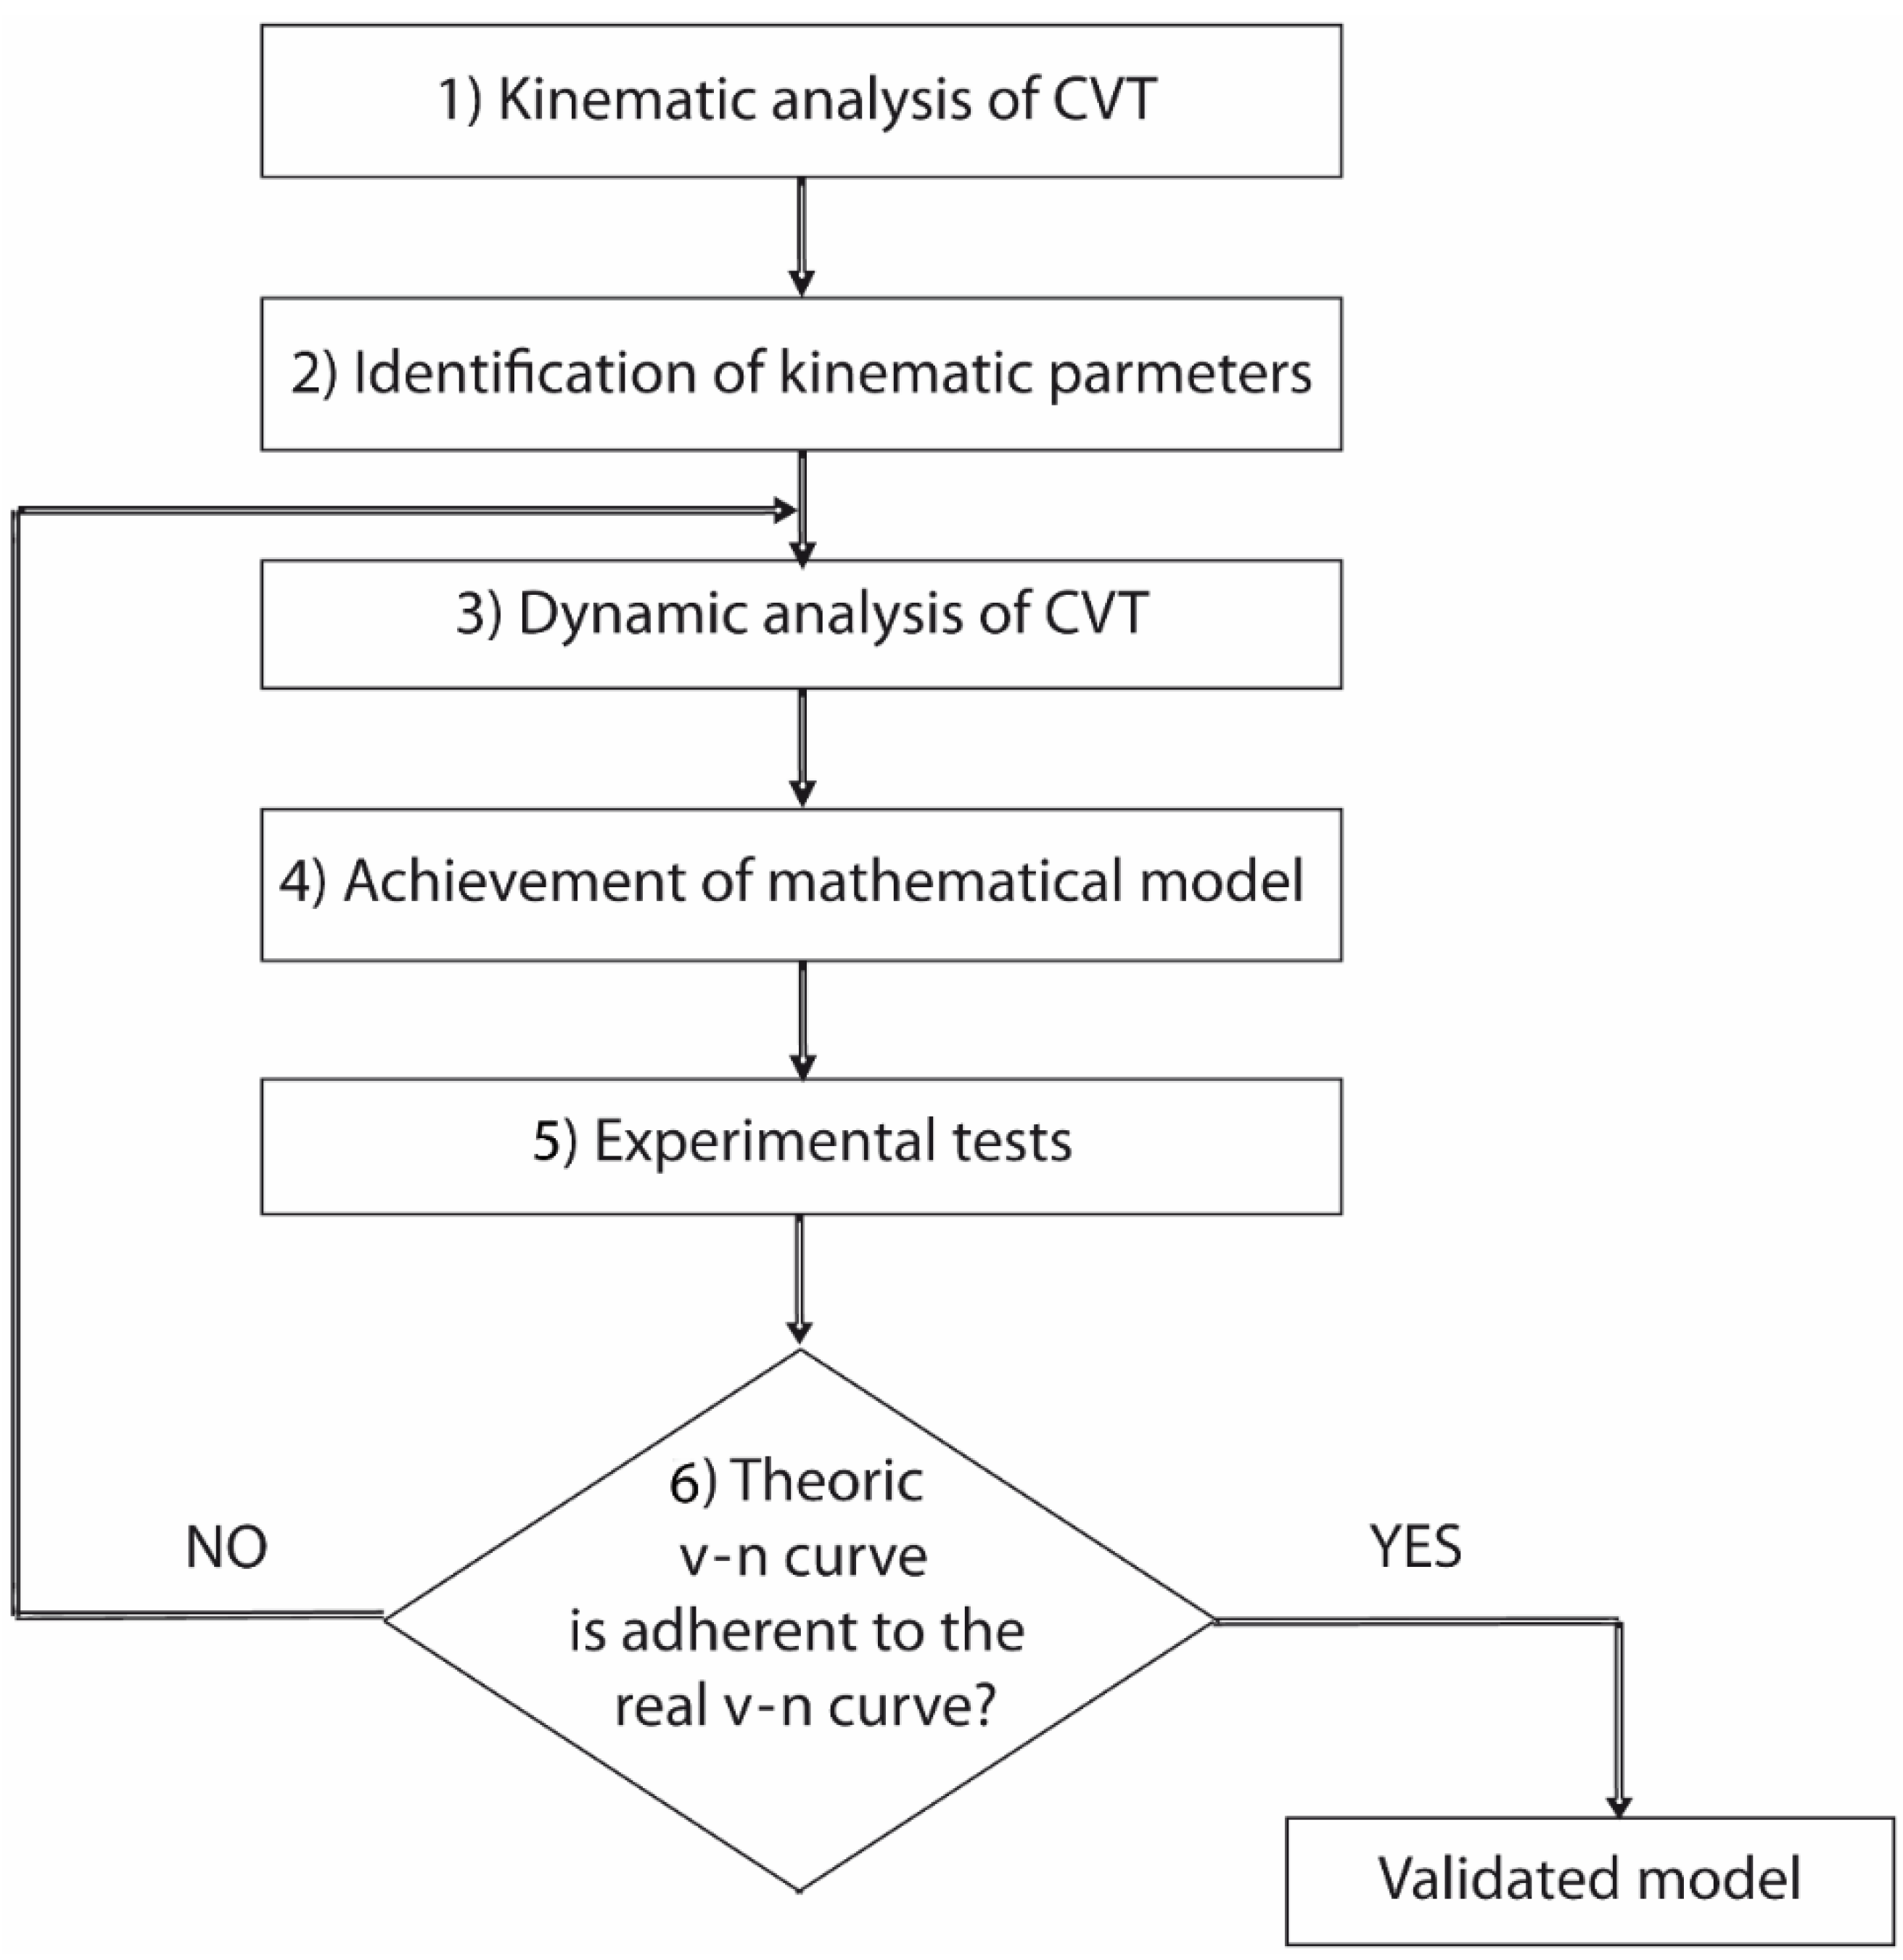
This development path is composed of the steps represented in Figure 7.
The first step concerns the development of the kinematic analysis of the CVT. Through this analysis, all kinematic parameters are derived (step 2), such as the relationship between the position of the belt and the position of the roller weights inside the front mobile half-pulley, the transmission ratio as a function of the position of the rollers, etc. These parameters will be used to develop the dynamic analysis (step 3).
Once the dynamic analysis has been completed, it will be possible to implement a mathematical model for the design of CVT transmissions (step 4). Given all the criticalities previously illustrated, validating the model through experimental tests will be necessary. This is also to determine the value of some factors in the model, such as the friction coefficient between the pin and the slot in the torque corrector (rear group), the belt deformation factor under various operating conditions.
In order to validate the model, a known transmission will be tested on a test bench (step 5). The sliding profile of the rollers detected on this transmission is implemented in the mathematical model. The model will be used to derive different results (torque curves, shift curves, transmission ratios, etc.) as the operating conditions change.
Experimental tests are carried out under the model’s same operating conditions, and the results obtained are verified. If the results are sufficiently close to the real ones, the mathematical model is validated (step 5); otherwise, the parameters used in the dynamic analysis (step 3) or the definition of the model (step 4) must be optimized and the validation procedure repeated.
Once the model has been verified in this way, further verification must be carried out. A different shift curve is set in the mathematical model (e.g., optimized for a particular class of user), and the roller curve is obtained, which, according to the model, determines the desired shift curve. A prototype will then be built and subjected to experimental tests. Comparing the experimental results with the expected ones will allow further refinement of the mathematical model.
The contribution of this paper is focused on the first two steps of the approach.

3. Kinematic Analysis of the CVT Transmission

As described in Section 2.3, in order to develop a model that would be easy to apply, it is necessary to carry out a kinematical analysis of the transmission system. This system analysis can be a robust starting point for subsequent model development. Design geometrical parameters need to be set as well as their interaction and variability according to transmission operating conditions.

3.1. Identification of Design Parameters

As described in Section 2.1, the aimed v-n curve is identified by knowing vehicle characteristics, required performance, and ICE performing features.
Parameters’ relationships are identified to set up a model that can be efficiently utilized for different CVTs of the type mentioned above.
To fully describe the transmission characteristic, the relation between the following parameters needs to be determined in all the operating conditions:
  • Center distance (I);
  • Driver pulley rotational speed;
  • Driven pulley rotational speed;
  • Transmission ratio;
  • Driver pulley pitch diameter;
  • Driven pulley pitch diameter;
  • Belt wrap angle on the pulleys;
  • Axial displacement of the driver half-pulley;
  • Axial displacement of the driven half-pulley;
  • Rollers curved ramps; and
  • Correlation between rollers’ and belt’s position as a function of the engine’s rotation speed.
The center distance is given data once the vehicle geometry has been established. The driver pulley’s rotational speed is connected to the vehicle engine’s characteristics. The driver pulley is directly connected to the engine shaft.
The driven pulley’s rotation speed can be derived from the aimed v-n curved for the studied vehicle; thus, it is a function of the driver pulley’s rotational speed and transmission ratio.
Driver pulley pitch diameter (dpc) can be derived once the transmission ratio τ and the driven pulley’s pitch diameter (dpm) are known; the latter can be obtained from geometrical relationships with Equation (1)
{ τ = d p m d p c L p = 2 I + π ( d p m + d p c ) 2 + ( d p m d p c ) 2 4 I
where I is the distance between pulleys and L p is the belt length on its pitch line.
Resolving Equation (1), we can express L p with Equation (2)
L p = 2 I + π ( τ d p c ) 2 + ( τ d p c d p c ) 2 4 I
and then obtain the Equation (3)
d p c 2 ( τ 1 ) 2 + d p c [ 2 π ( τ + 1 ) ] + 8 I 2 4 I L p = 0
Solving Equation (3) by d p c permits to obtain Equation (4).
d p c = { [ 2 π I ( τ + 1 ) ] 2 4 ( τ 1 ) ( 8 I 2 4 I L p ) } 1 2 2 π I ( τ + 1 ) 2 ( τ 1 ) 2
Geometrical relations can determine the belt’s wrap angles on the pulleys.

3.2. Half-Pulley’s Axial Displacement Calculation

Knowing the pitch diameters and the related wrap angles on the pulley, axial displacements of the movable half-pulleys (the inner one in the front assembly, the outer one in the rear assembly) are determined.
In the case of the driver pulley, according to Figure 8, during the acceleration phase, the belt pitch diameter increases, gradually going from the generic dpm1 to the generic dpm2.
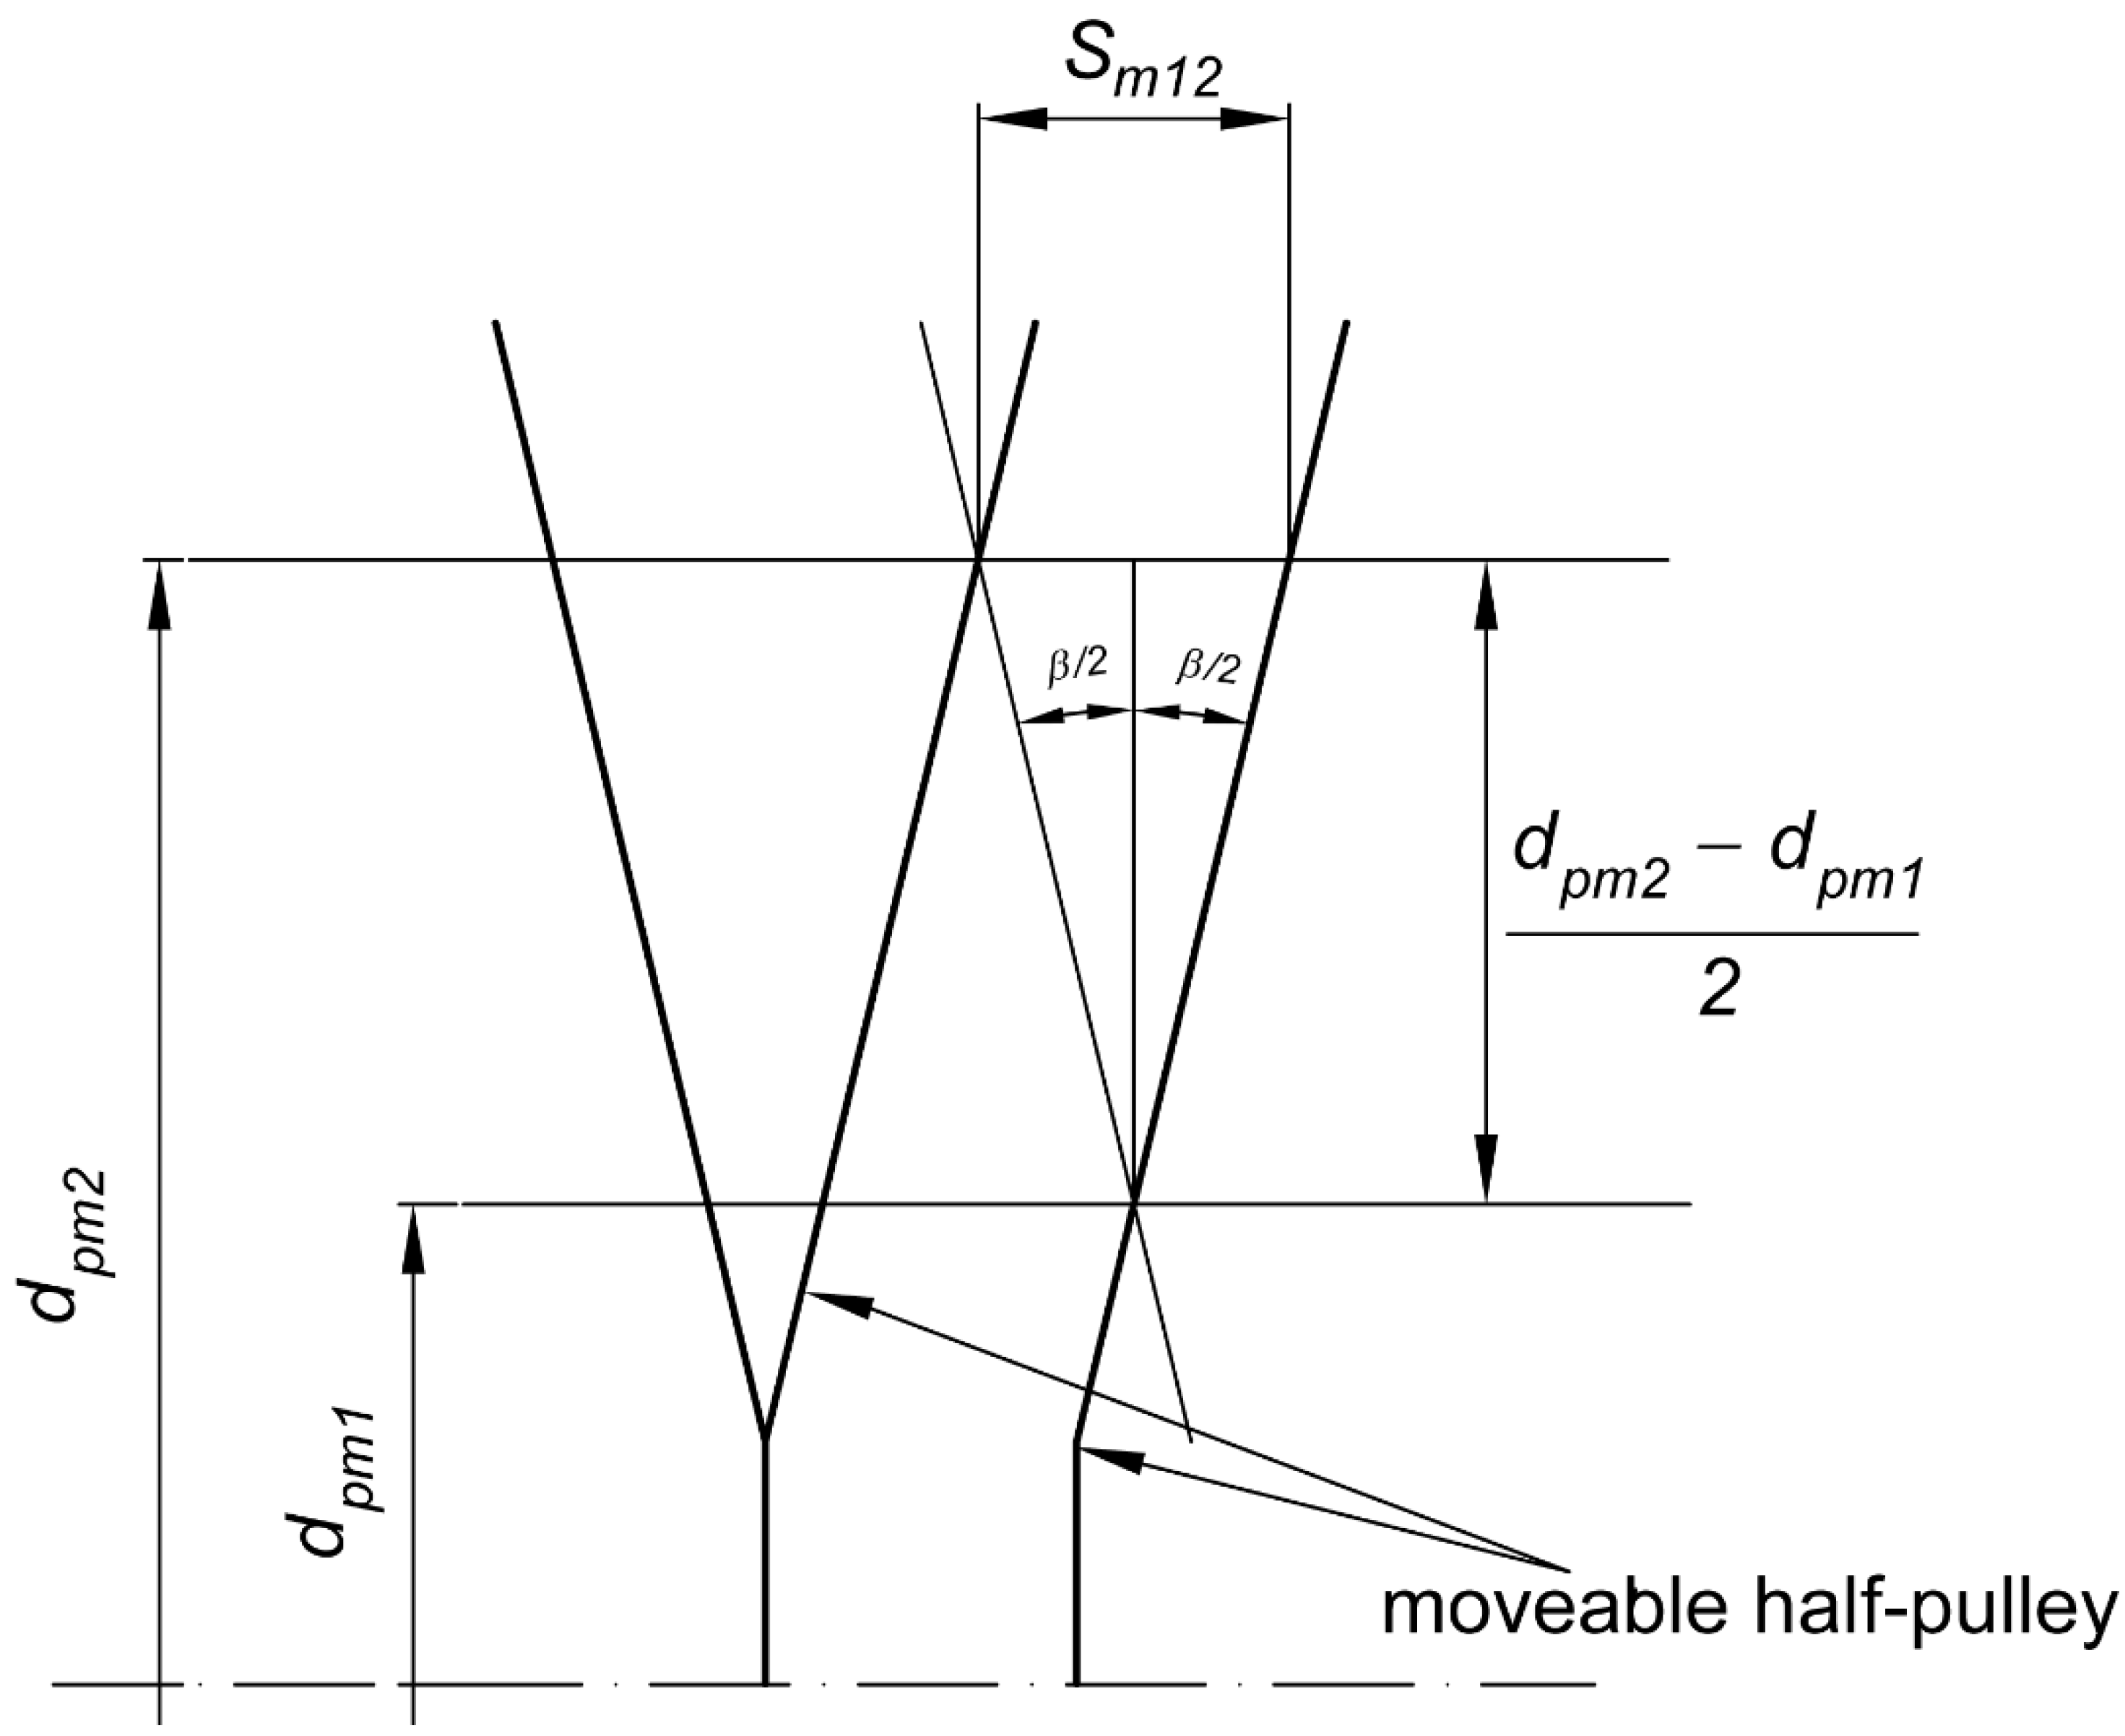
As shown in Figure 9, the value of the axial displacement Sm12, generated by the variation of the belt position from the pitch diameter dpm1 to dpm2, can be determined as follows:
S m 12 = 2 · ( d p m 2 d p m 1 ) 2 · tan β 2 = ( d p m 2 d p m 1 ) · tan β 2
In Equation (5), substituting the value of the dpm max to the dpm2 and the generic pitch diameter dpmi to the value of dpm1, the trend of the axial displacement during the acceleration phase is obtained, as shown in Equation (6).
S m = ( d p m   m a x   d p m i ) · tan β 2
Expression similar to Equation (6) is valid for the axial displacement of the driven pulley Sc.
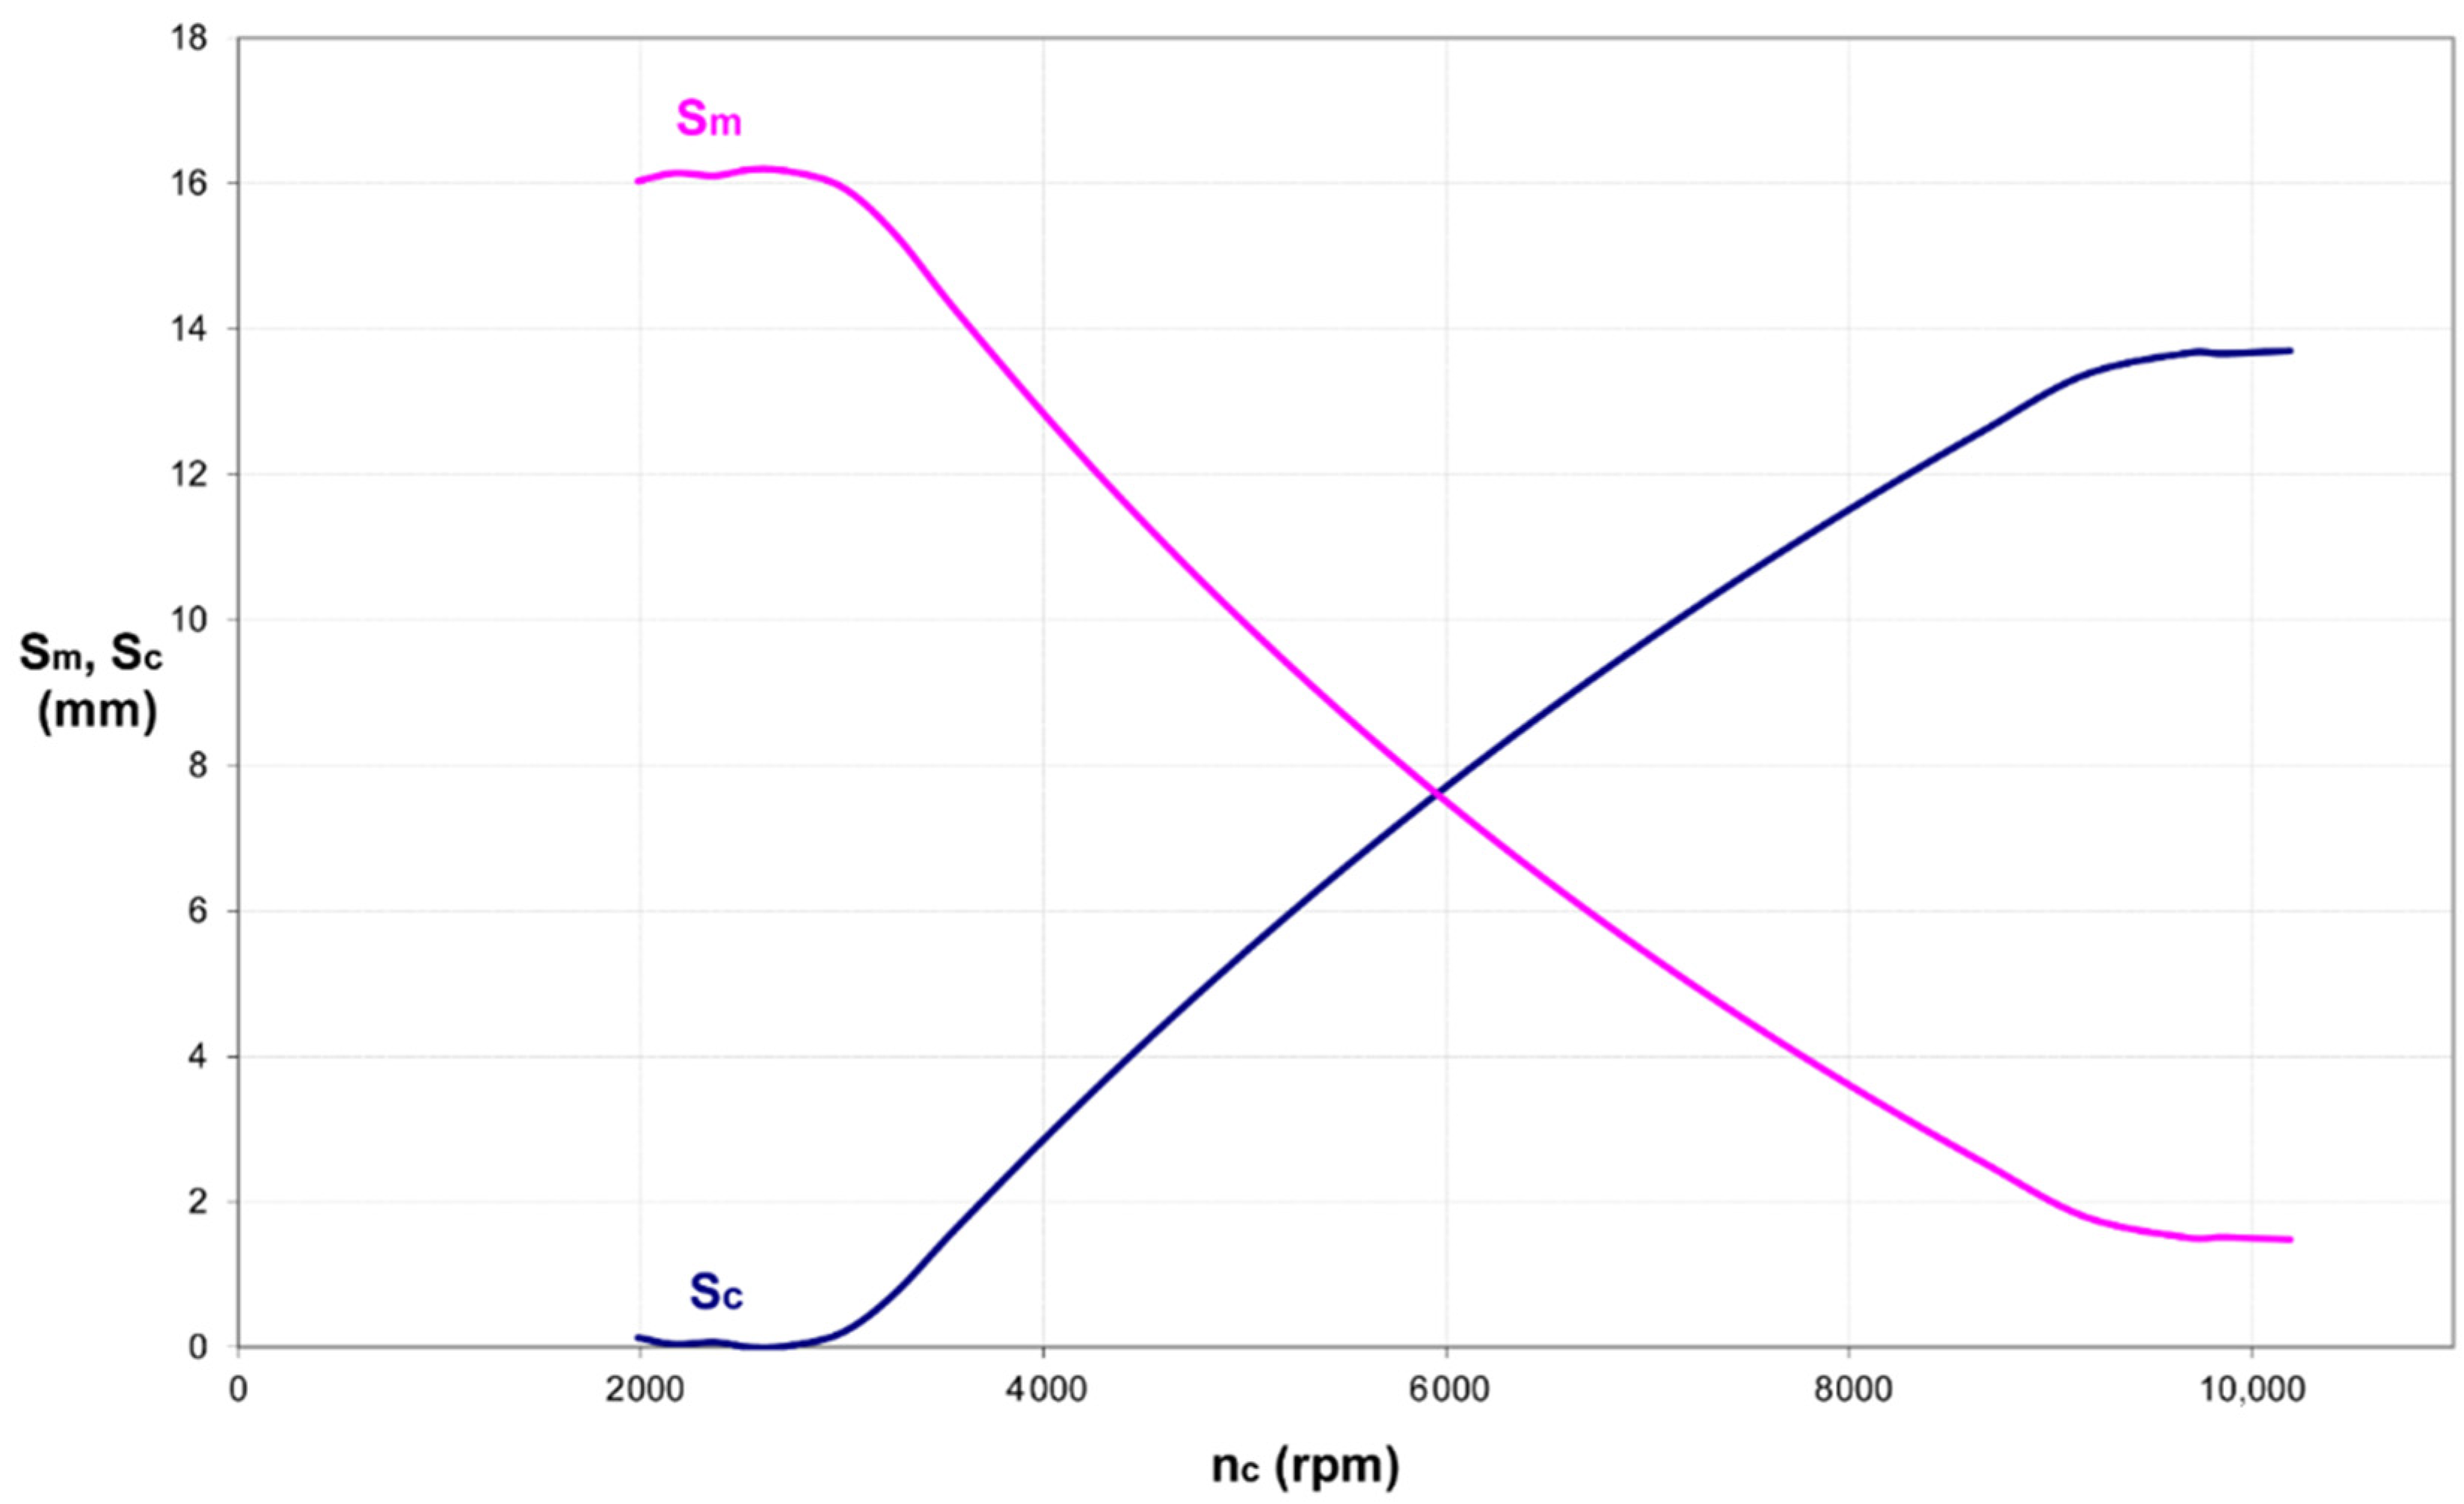
During the acceleration phase, the axial displacement of the movable half-pulley has an increasing trend (Figure 10) for the driven pulley (Sc) and a decreasing trend for the driver one (Sm). This is because the driver pulley’s pitch diameter increases while the driven pulley’s one decreases.
In this way, the instantaneous transmission geometry is described for each driver pulley rotation speed.

3.3. Kinematic Analysis of the Transmission

As known, driver half-pulley’s axial displacement is determined by centrifugal forces acting on rollers; the rollers, moving on the ramps (which are carved on the driver movable half-pulley itself) determine the half-pulley axial displacement.
Therefore, belt position needs to be correlated to the rollers’ position as a function of the engine’s rotational speed.
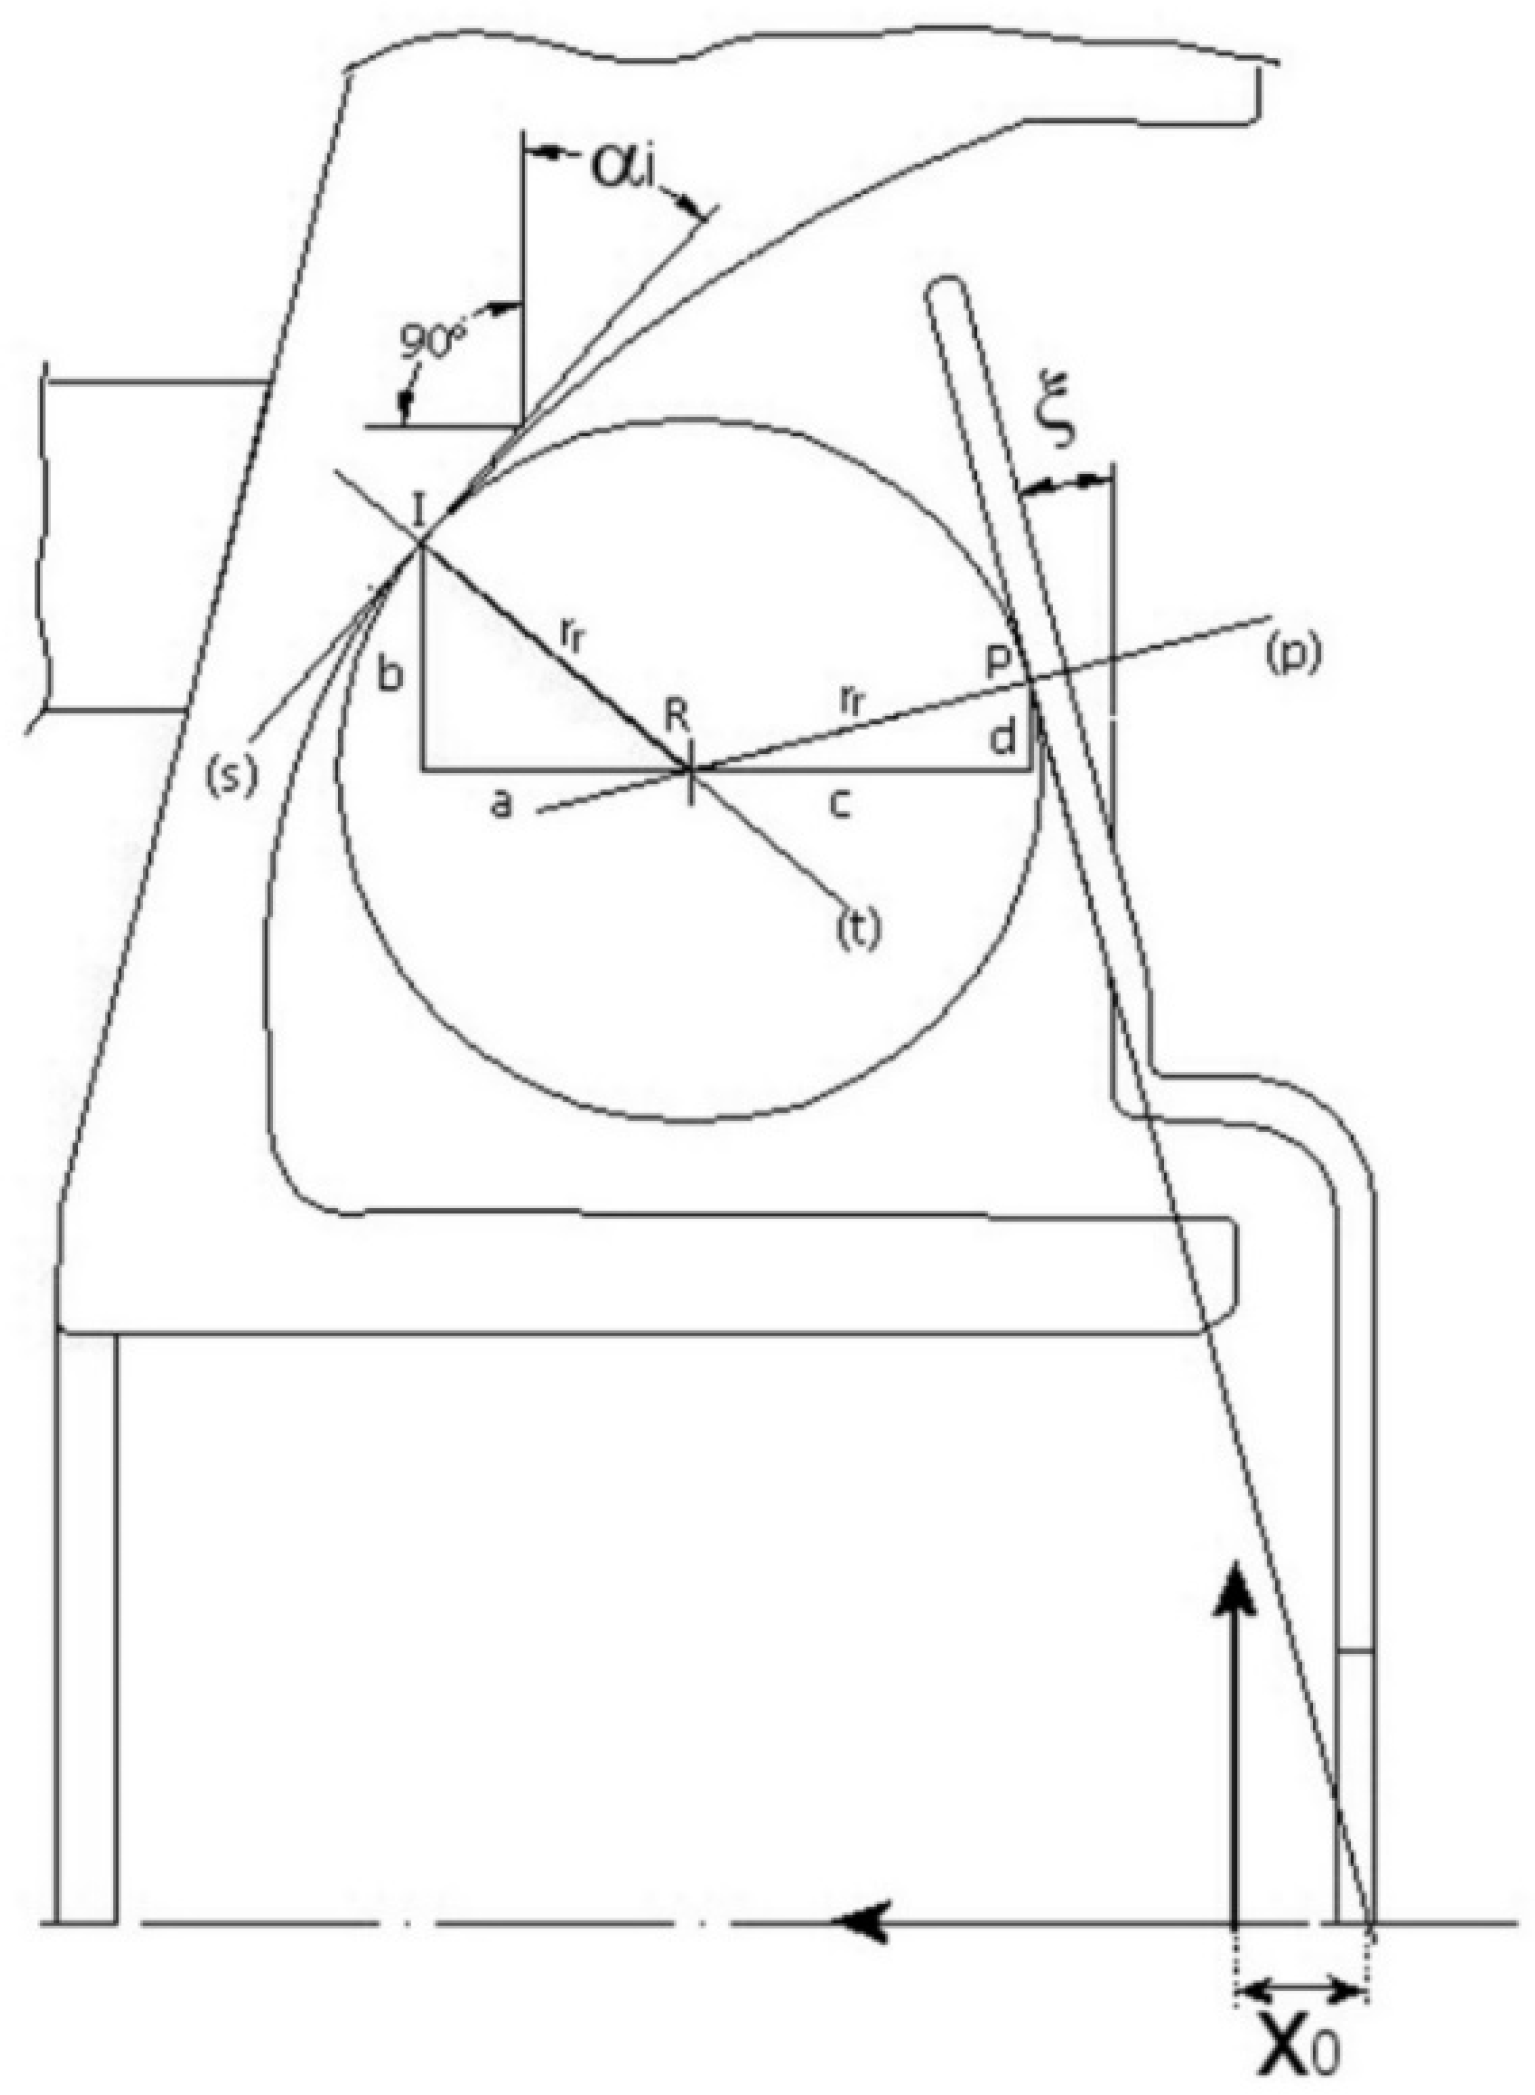
In order to achieve this, a coordinated system is defined as given in Figure 11. The origin is set on the movable half-pulley rotation axis. The x-axis coincides with the pulley rotation axis and points towards the half-pulley displacement starting from the initial pulley’s position. The y-axis is orthogonal to the previous one and points up.
Considering a generic roller’s curve carved on the moveable driver half-pulley, (xi; yi) represent the coordinates of the contact point I between the roller and the curve profile. α i is the angle defined by the tangent to the profile in I and the line parallel to y-axis passing through the point I.
The equation of the line tangent to the profile to the point I is given by the equation:
y y i = m i · ( x x i )
where, in the abovementioned coordinated system (Figure 11), the angular coefficient mi is defined as:
m i = tan ( 90 + α i )
Therefore, the equation of the line t passing through point I and orthogonal to line s can be written as:
y y i = 1 m i · ( x x i )
Considering on this line a segment starting from the contact point I, of the same length of the radius rr of the roller and pointing towards it, the center of the roller has the following coordinates:
{ x R = x i a y R = y i b
a and b being the projections of the segment on the x and y-axis, respectively; using simple trigonometric relations:
b = a · tan α i
Substituting in the rr expression:
r r = a 2 + b 2 = a 2 + ( a · tan α i ) 2 = a · 1 + ( tan α i ) 2
Then follows:
{ a = r r 1 + ( tan α i ) 2 b = r r · tan α i 1 + ( tan α i ) 2
Therefore, substituting Equation (13) into Equation (9), the coordinates of point R are:
{ x R = x i r r 1 + ( tan α i ) 2 y R = y i r r · tan α i 1 + ( tan α i ) 2
The angular coefficient of line p, passing through point R and orthogonal to fixed plate (Figure 11) can be written in the considered coordinate system as:
m p f = tan ( 90 ξ )
The angle ξ is defined between the direction parallel to the fixed plate and the positive direction of the y-axis.
y y R = 1 m p f · ( x x R )
Considering on that line a segment of the same length of the roller’s radius rr and pointing from point R and pointing towards the fixed plate, point P (xP;yP) is identified having the following coordinates:
{ x P = x R c y P = x R + d
a and b being the projections of the segment on the x and y-axis, respectively; as done for the point R it is possible to write:
d = c · tan ξ
Substituting in the rr expression:
r r = c 2 + d 2 = c 2 + ( c · tan ξ ) 2 = c · 1 + ( tan ξ ) 2
Then follows:
{ c = r r ( 1 + tan ξ 2 ) d = r r · tan ξ ( 1 + tan ξ 2 )
Therefore, substituting Equation (20) into Equation (17), the coordinates of point P are:
{ x P = x R r r 1 + ( tan ξ ) 2 = x i r r 1 + ( tan α i ) 2 r r 1 + ( tan ξ ) 2 y P = y R + r r · tan ξ 1 + ( tan ξ ) 2 = y i r r · tan α i 1 + ( tan α i ) 2 + r r · tan ξ 1 + ( tan ξ ) 2
Writing the equation of the line passing through point P and parallel to the fixed plate (Figure 10) that is straight and has a constant slope:
y y P = m p f · ( x x P )
its intersection with x-axis is:
{ y = 0 y y P = m p f · ( x x P ) y P = m p f · ( x x P )
Then follows
x 0 = x P y P m p f
The value x0 in Equation (24) allows correlating the roller’s position to the axial displacement of the moveable half-pulley. This correlation is valid in the various engine rotational speeds. Therefore, having determined a relationship between the belt position and the moveable half-pulley, it is possible to relate the roller’s position to the belt’s one, deploying Equation (6).
According to the coordinate system, the absolute value of x0 increases with increasing transmission ratio, while in the case of Equation (6), the axial displacement Sm decreases with increasing transmission ratio (see Figure 9).
To make the two systems coherent, Equation (25) is set.
S m * = S m   M a x S m
SmMax is the maximum value of moveable half-pulley axial displacement.
In order to relate the roller’s position to the belt’s one, Equation (24) is equated to Equation (25):
| x 0 | = S m   M a x S m
This relationship makes it possible to determine the axial displacement of the semi-pulley. The displacement is expressed as a function of the position assumed by the roller in its movement along with the slide profile. The results obtained are a starting point for developing a mathematical model that can be applied to the design of V-belt CVT.

4. Conclusions

This paper analyzes the current design procedure used to develop a CVT system largely used in motorcycles and scooters with power up to 25 kW. The CVT system is used for its cost-effectiveness, lightweight, and reduced size. The paper shows that the CVT design presents important issues related to under-optimization in the different utilization scenarios that cause deterioration in efficiency or performance in use for different users’ classes. In particular, it is necessary to select a unique design configuration of the system among several missions, users, and vehicle profiles due to its development’s high time and cost. An accurate kinematic analysis of the transmission system has been developed in this paper to allow the development of a mathematical model that can be applied to speed up the design of V-belt CVT. The analysis presented shows the geometric design parameters, their interaction, and their variability as a function of the conditions of use of the transmission. Following this study, the dynamic analysis of the system can be developed, and finally, it will be necessary to carry out an in-depth experimental campaign to determine the values of the parameters to be included in the mathematical model to complete the dynamic analysis, according to the most varied operating conditions.

Author Contributions

Conceptualization, V.L.B., S.M. and A.G.; methodology, V.L.B., A.G. and S.M.; formal analysis, V.L.B., S.M. and A.G.; writing—original draft, V.L.B., S.M. and A.G.; writing—review and editing, G.A. and S.M.; supervision, P.C. All authors have read and agreed to the published version of the manuscript.

Funding

This research received no external funding.

Institutional Review Board Statement

Not applicable.

Informed Consent Statement

Not applicable.

Data Availability Statement

Not applicable.

Conflicts of Interest

The authors declare no conflict of interest.

References

  1. Xie, R.; Wei, D.; Han, F.; Lu, Y.; Fang, J.; Liu, Y.; Wang, J. The effect of traffic density on smog pollution: Evidence from Chinese cities. Technol. Forecast. Soc. Chang. 2019, 144, 421–427. [Google Scholar] [CrossRef]
  2. Rakowska, A.; Wong, K.C.; Townsend, T.; Chan, K.L.; Westerdahl, D.; Ng, S.; Močnik, G.; Drinovec, L.; Ning, Z. Impact of Traffic Volume and Composition on the Air Quality and Pedestrian Exposure in Urban Street Canyon. Atmos. Environ. 2014, 98, 260–270. [Google Scholar] [CrossRef]
  3. Liberto, C.; Valenti, G.; Orchi, S.; Lelli, M.; Nigro, M.; Ferrara, M. The Impact of Electric Mobility Scenarios in Large Urban Areas: The Rome Case Study. IEEE Trans. Intell. Transp. Syst. 2018, 19, 3540–3549. [Google Scholar] [CrossRef]
  4. Murena, F.; Prati, M.V.; Costagliola, M.A. Real driving emissions of a scooter and a passenger car in Naples city. Transp. Res. Part D Transp. Environ. 2019, 73, 46–55. [Google Scholar] [CrossRef]
  5. Adak, P.; Sahu, R.; Elumalai, S.P. Development of emission factors for motorcycles and shared auto-rickshaws using real-world driving cycle for a typical Indian city. Sci. Total Environ. 2016, 544, 299–308. [Google Scholar] [CrossRef] [PubMed]
  6. Piantini, S.; Giorgetti, A.; Baldanzini, N.; Monti, C.; Pierini, M. Design of a Motorcycle Steering Damper for a Safer Ride. Machines 2020, 8, 24. [Google Scholar] [CrossRef]
  7. Mannini, L.; Cipriani, E.; Crisalli, U.; Gemma, A. FCD data for on-street parking search time estimation. IET Intell. Transp. Syst. 2018, 12, 664–672. [Google Scholar] [CrossRef]
  8. Hoang, P.H.; Zhao, S.; Houn, S.E. Motorcycle Drivers’ Parking Lot Choice Behaviors in Developing Countries: Analysis to Identify Influence Factors. Sustainability 2019, 11, 2463. [Google Scholar] [CrossRef] [Green Version]
  9. Pérez-Fernández, O.; García-Palomares, J.C. Parking Places to Moped-Style Scooter Sharing Services Using GIS Location-Allocation Models and GPS Data. ISPRS Int. J. Geo-Inf. 2021, 10, 230. [Google Scholar] [CrossRef]
  10. Chen, T.F.; Lee, D.W.; Sung, C.K.L. An experimental study on transmission efficiency of a rubber V-belt CVT. Mech. Mach. Theory 1998, 33, 351–363. [Google Scholar] [CrossRef]
  11. Grzegozek, W.; Dobaj, K.; Kot, A. Experimental Verification and Comparison of the Rubber V- Belt Continuously Variable Transmission Models. IOP Conf. Ser. Mater. Sci. Eng. 2016, 148, 012005. [Google Scholar] [CrossRef] [Green Version]
  12. Arango, I.; Muñoz Alzate, S. Numerical Design Method for CVT Supported in Standard Variable Speed Rubber V-Belts. Appl. Sci. 2020, 10, 6238. [Google Scholar] [CrossRef]
  13. Grzegozek, W.; Kot, A. The experimental analysis of the slip in the rubber belt CVT. In IOP Conference Series: Materials Science and Engineering; IOP Publishing: Bristol, UK, 2016; Volume 148. [Google Scholar]
  14. Singh, T.; Nair, S.A. Mathematical Review and Comparison of Continuously Variable Transmissions. In Proceedings of the SAE Passenger Car Conference and Exposition, Dearborn, MI, USA, 1–4 September 1992. [Google Scholar]
  15. Gerbert, G.B. Force and Slip Behaviour in V-belt Drives. Acta Politech. Scand. Mech. Eng. Ser. 1972, 67, 1–101. [Google Scholar]
  16. Ashok, B.; Denis Ashok, S.; Ramesh Kumar, C. A Review on Control System Architecture of a SI Engine Management System. Annu. Rev. Control. 2016, 41, 94–118. [Google Scholar] [CrossRef]
  17. Dittrich, O. Theorie des Umschlingungstriebes Mit Keilförmigen Reibscheibenflanken. Ph.D. Thesis, Technische Hochschule, Karlsruhe, Germany, 1953. [Google Scholar]
  18. Gerbert, G. Belt slip—A unified approach. ASME J. Mech. Des. 1996, 118, 432–438. [Google Scholar] [CrossRef]
  19. Kim, K.; Kim, H. Axial Forces of a V-Belt CVT. KSME J. 1989, 3, 56–61. [Google Scholar] [CrossRef]
  20. Cammalleri, M. A new approach to the design of speed-torque-controlled Rubber V-belt Variator. Inst. Mech. Eng. Part D J. Automob. Eng. 2005, 219, 1413–1427. [Google Scholar] [CrossRef]
  21. Julió, G.; Plante, J.S. An experimentally-validated model of rubber-belt CVT mechanics. Mech. Mach. Theory 2011, 46, 1037–1053. [Google Scholar] [CrossRef]
  22. Ranogajec, V.; Ivanović, V.; Deur, J.; Tseng, H.E. Optimization-based Assessment of Automatic Transmission Double-transition Shift Controls. Control. Eng. Pract. 2018, 76, 155–166. [Google Scholar] [CrossRef]
  23. Kahlbau, S.; Bestle, D. Optimal Shift Control for Automatic Transmission. Mech. Based Des. Struct. Mach. 2013, 41, 259–273. [Google Scholar] [CrossRef]
  24. Ceccanti, F.; Giorgetti, A.; Cavallini, C.; Arcidiacono, G.; Citti, P. Comparative evaluation of fuzzy axiomatic design and IAMS comprehensive VIKOR approaches for material selection in mechanical design. Int. J. Eng. Res. Technol. 2020, 13, 80–87. [Google Scholar] [CrossRef]
  25. Giorgetti, A.; Girgenti, A.; Citti, P.; Delogu, M. A Novel Approach for Axiomatic-Based Design for the Environment. Axiomatic Design in Large Systems: Complex Products, Buildings and Manufacturing Systems; Springer: Cham, Switzerland, 2016; pp. 131–148. [Google Scholar]
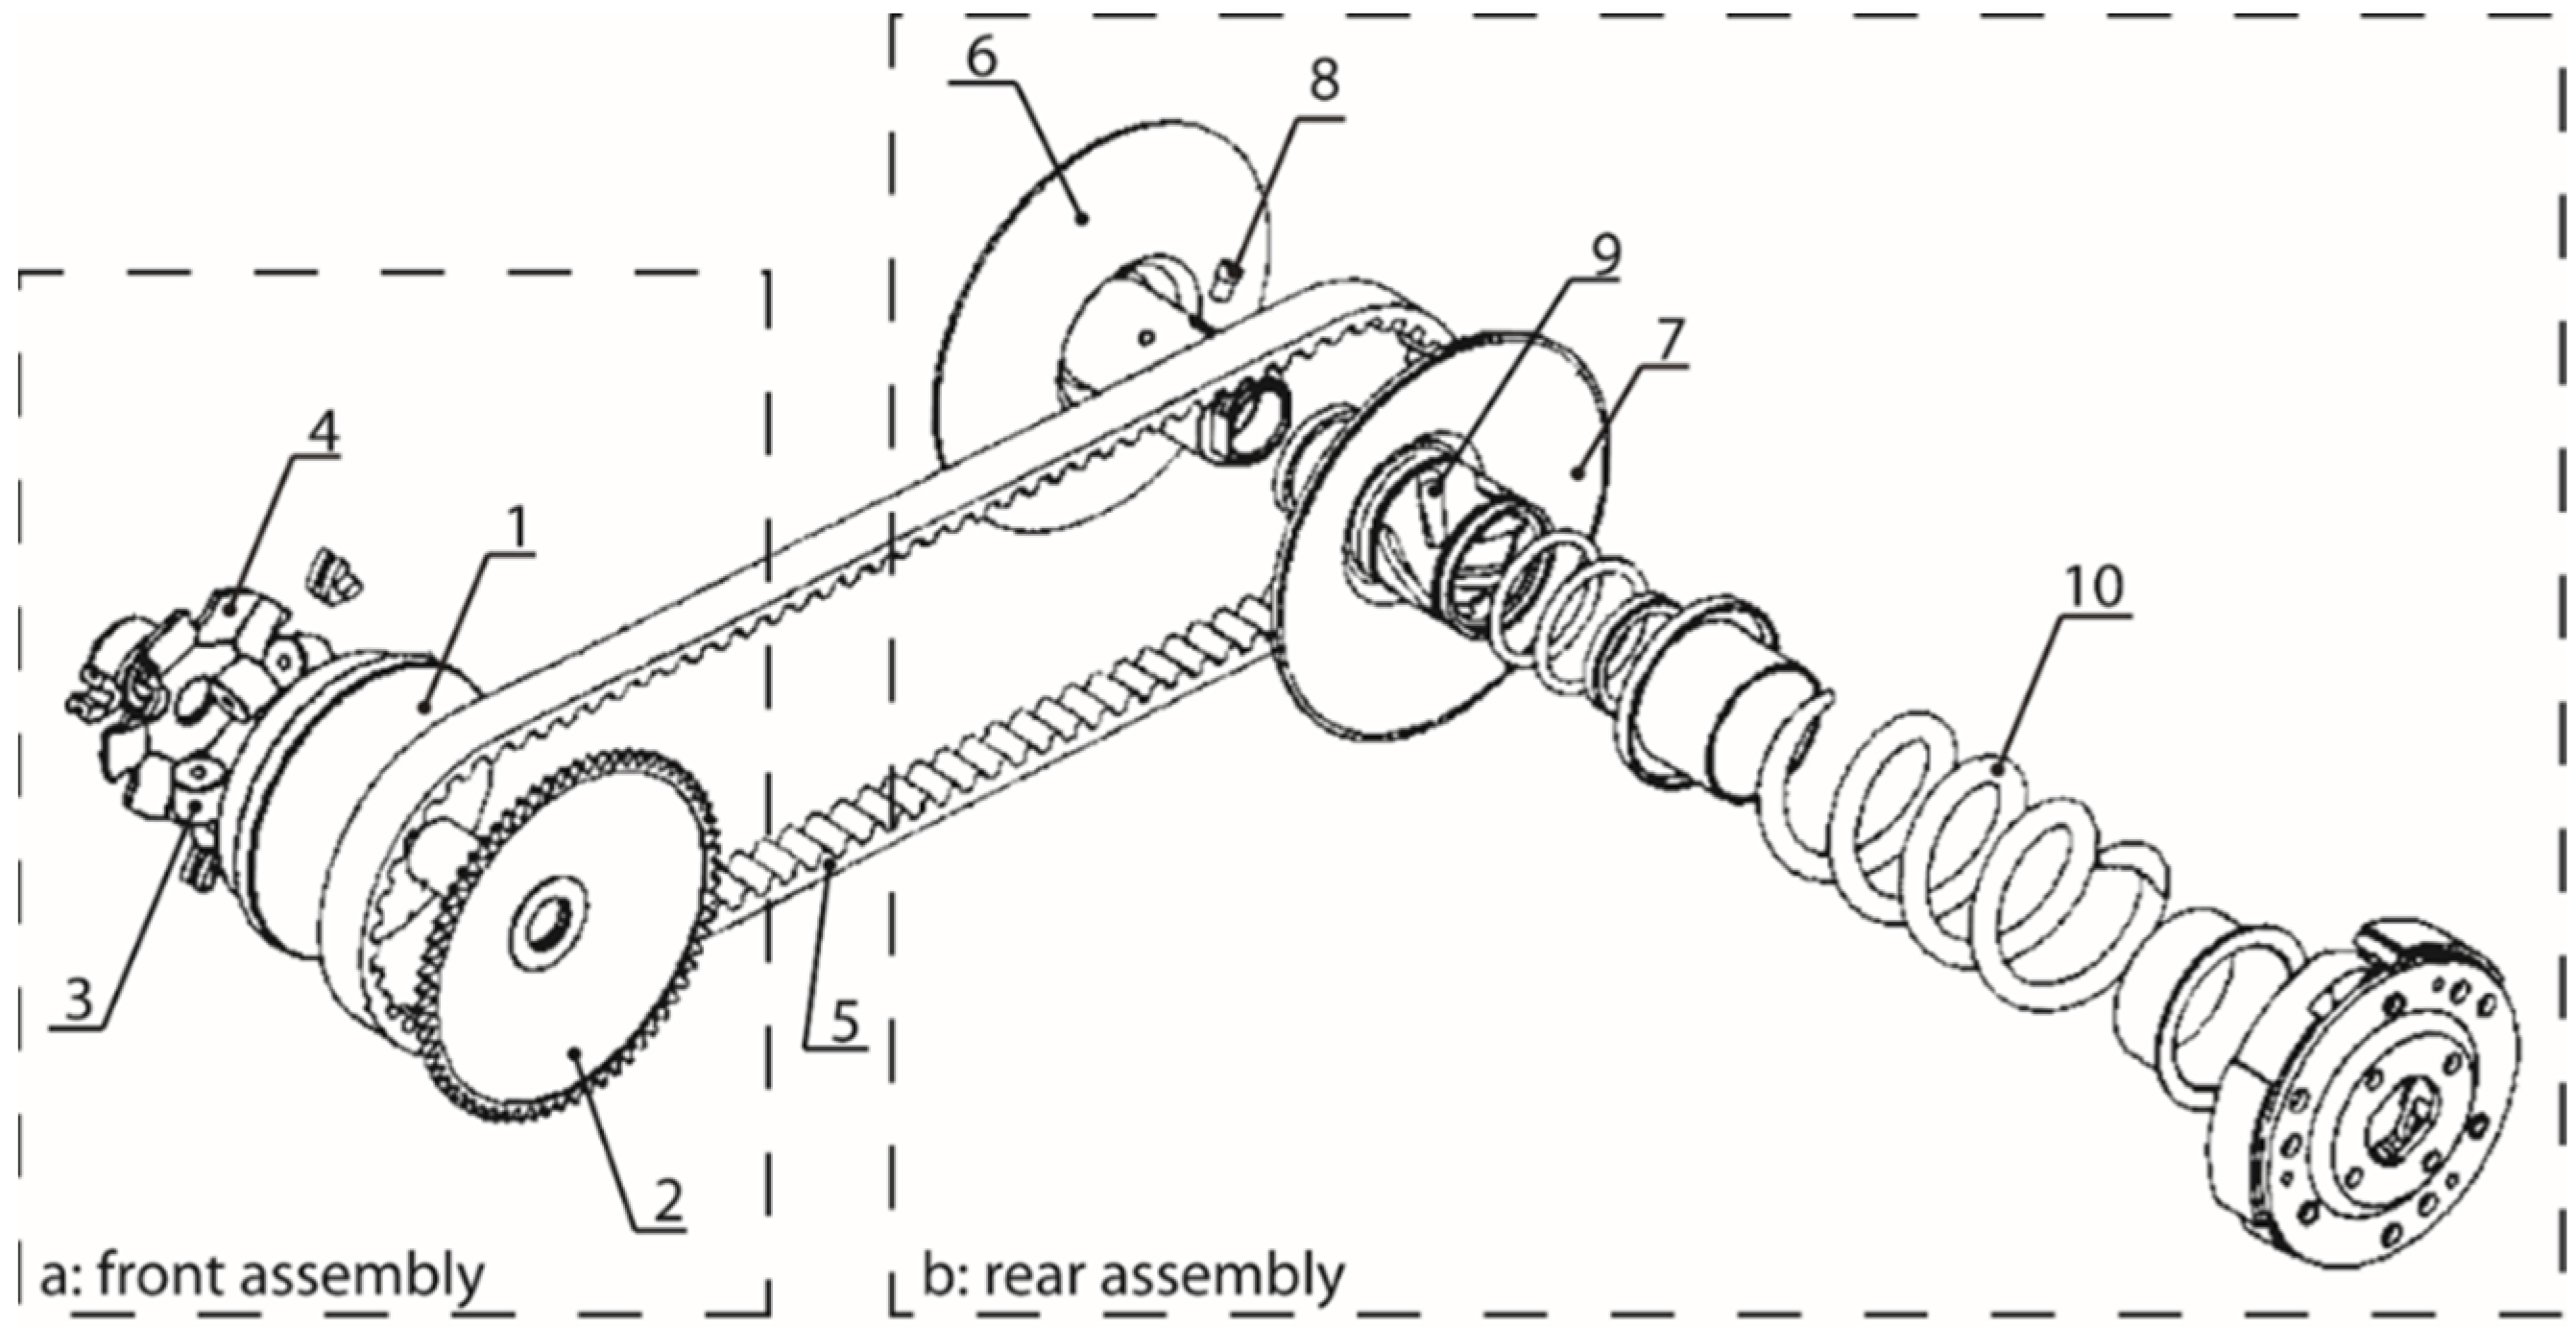
Figure 1. CVT main components.
Machines 10 00016 g001
Figure 2. Images of the two half-pulleys and V-belt (a) and the front half movable pulley inner part (b).
Machines 10 00016 g002
Figure 3. Front assembly initial/starting configuration (a) and final configuration (b).
Machines 10 00016 g003
Figure 4. Front assembly configurations: initial/starting (a), intermediate (b), final (c).
Machines 10 00016 g004
Figure 5. The driven actuator.
Machines 10 00016 g005
Figure 6. CVT design flow chart.
Machines 10 00016 g006
Figure 7. The development path of the mathematical model for the roller curve design.
Machines 10 00016 g007
Figure 8. Axial displacement of the half-pulley.
Machines 10 00016 g008
Figure 9. Axial shift.
Machines 10 00016 g009
Figure 10. Typical movable half-pulleys axial displacement trend (Sc-driven one and Sm driver one).
Machines 10 00016 g010
Figure 11. The coordinate system adopted.
Machines 10 00016 g011
Publisher’s Note: MDPI stays neutral with regard to jurisdictional claims in published maps and institutional affiliations.