Abstract
This article presents an empirical comparative assessment of the measurement quality of two instruments commonly used to measure fuzzy characteristics in computer-assisted questionnaires: a graphic scale (a line production scale using a slider bar) and an endecanary scale (a 0–10 rating scale using radio buttons). Data are analyzed by means of multitrait–multimethod models estimated as structural equation models with a mean and covariance structure. For the first time in such research, the results include bias, valid variance, method variance, and random error variance. The data are taken from a program that assesses entrepreneurial competences in undergraduate Economics and Business students by means of questionnaires administered on desktop computers. Neither of the measurement instruments was found to be biased with respect to the other, meaning that their scores are comparable. While both instruments achieve valid and reliable measurements, the reliability and validity are higher for the endecanary scale. This study contributes to the still scarce literature on fuzzy measurement instruments and on the comparability and relative merits of graphic and discrete rating scales on computer-assisted questionnaires.
1. Introduction
Given a set of objects or individuals, the assumption that each of them may partially fulfill a certain property lies at the grounds of fuzzy set theory. Following the conception of said theory [1], the necessary foundations were developed for solving problems under this new paradigm in order to make it possible to find better solutions to many common modeling problems under the condition of uncertainty [2,3,4].
Much research has been conducted on the degree to which an object fulfills a property [5,6], and using rating response scales may become essential in determining said degree of fulfillment, for instance in the definition of fuzzy numbers [7,8,9,10] or linguistic variables [11,12], in graph theory [13,14,15], in determining the intervals resulting in an experton [16,17], or in determining the levels of truth in the forgotten effects theory [18].
Although there is no consensus on the ideal number of response alternatives that a response scale should have, it has been demonstrated that solutions to certain problems may depend on this number, which is used to measure the input variables [19]. Although it would seem reasonable to expect more response alternatives to lead to better solutions, there are indications that the practical number of response alternatives is limited by our cognitive abilities [20,21], even if it is possible to find solutions to some cognitive limitations [22,23]. Comparing response scales still constitutes an open research problem [24], and evidence that takes into account the multiple facets of their measurement quality (e.g., reliability, validity, and bias) is still lacking [25]. In respect of this, it must also be taken into account that answering questions on a screen, as opposed to using a paper and pencil, tends to change the rules of the game, and that computer-assisted questionnaires are extremely diverse in nature [25,26].
The aim of this article is to compare a graphic scale (a line production scale using a slider bar) and an endecanary scale (a 0–10 rating scale using radio buttons) on a questionnaire administered using desktop computers. The slider-bar method is the standard measurement scale for the self-evaluation of entrepreneurial competences, and the endecanary scale is a standard measurement scale within fuzzy measurement.
This empirical study is based on a sample of 500 students enrolled in three undergraduate economic or management programs run by the School of Economics and Business Studies at the University of Girona (Spain). These students participated in an entrepreneurial competence assessment program during the 2017–2018 academic year. The sample constituted 33.7% of the total number of students enrolled for that academic year, and it was taken into account that students should be evenly distributed among the three programs. The obtained data were analyzed by means of multitrait–multimethod models, which were estimated as structural equation models with a mean and covariance structure. This type of analysis makes it possible to simultaneously obtain results on the bias, valid variance, invalid variance, and reliability of the fuzzy truth values for both response scales over a range of entrepreneurial competences. Neither of the measurement instruments was found to be biased with respect to the other, meaning that their scores are comparable if combined in the same study or in several studies. While both instruments achieved valid and reliable measurements, reliability and validity were higher for the endecanary scale. This study contributes to the still scarce literature on the quality of fuzzy measurement instruments and the comparability and relative merits of graphic and discrete rating scales on computer-assisted questionnaires.
The structure of the article is as follows. Section 2 presents the measurement scales being compared. In Section 3, we discuss the data collection design, the statistical analysis method, and the descriptive statistical results. Section 4 shows the results on bias, reliability, and validity. The final section concludes and highlights the limitations of the study and further research opportunities.
2. Measurement Scales
When reflecting on the level or degree to which a person possesses a property or characteristic, there is usually a scale of possibilities [27] between possession and non-possession, which means that this can be considered a fuzzy characteristic [1]. Many scholarly articles use fuzzy truth values to address uncertainty in the data they use [28,29,30,31,32].
In the business field, it is common to find applications of fuzzy sets and fuzzy logic that employ a 0–10 rating scale with verbal labels attached to the 11 categories [33,34]. These linguistic endecanary scales have labels such as: “completely false”, “virtually false”, “almost false”, “quite false”, “more false than true”, “neither true nor false”, “more true than false”, “quite true”, “almost true”, “virtually true”, and “completely true”. From the seminal works [35,36], it has long been known that finding category labels with shared meanings can prove difficult [37], especially if the number of labels with gray meanings increases, which is unavoidable when large numbers of categories are used. It is for this reason that a trend of labeling only the two endmost categories emerged [38]: e.g., “completely” and “not at all”; “never” and “always”, etc. In the present article, when working with scales to measure fuzzy characteristics, we follow this tendency of only labeling the end values.
Although other options exist for choosing the number of items on a rating scale (see examples of pentanary or heptanary scales in [23]), in this article, we have chosen to work with an 11-point scale. The reason for this preference is associated with the fact that the 11-point scale is both related to our numbering base and offers a good measurement of degree of truth in practice. What is more, since in the general literature on survey questionnaire design it is considered easier and far more common to use consecutive integer response options [39,40], we have preferred to reformulate the fuzzy endecanary response scale from {0, 0.1, 0.2, 0.3, 0.4, 0.5, 0.6, 0.7, 0.8, 0.9, 1} to {0, 1, 2, 3, 4, 5, 6, 7, 8, 9, 10}, thus resulting in the classic 0–10 discrete rating scale.
Having discussed the appearance of the first and most common of the scales, we now introduce the graphic slider-bar scale, which we used to perform the comparative measurement quality study. Continuous response scales based on drawing lines have long been known [37,38,41,42] and advocated for on the basis of their roots in the psychophisics literature and theory [37] and the statistical attractiveness of continuous data. With paper-and-pencil questionnaires, the need to measure lines by hand in order to encode the responses makes them rather unpractical [26], and some of the earliest computer-assisted questionnaire software already included continuous response scales as an option [43]. Nowadays, the most common computer-assisted variant is the slider-bar scale. Responses are potentially continuous, although they are normally discretized, for instance between 0 and 100, which poses no problem when re-expressing them in the 0 to 10 interval by multiplying the appropriate constant. This is a standard measurement scale for self-evaluating entrepreneurial competences.
We conclude this section by showing the different open hypotheses related to both scales in computer-assisted questionnaires, which justifies the fact that in this article, we compare a 0 to 10 discrete rating scale with a graphic slider-bar scale. Since the very first research, empirical comparison of the relative merits of discrete rating scales and line-production and similar scales have yielded controversial findings, even sometimes within the same study [44]. Some studies advocate for slider bars [45], some advocate for radio buttons [46], and some present them as having equally good characteristics [42]. Finally and most importantly, some scholars have argued that their relative merits depend on the circumstances, including, for instance, questionnaire topic or screen size, which demands a case-per-case assessment of measurement quality [25]. This is what we have done in the present article, based on the topic of entrepreneurial competences and desktop computers.
3. Method
3.1. Measurement of Entrepreneurial Competences
Entrepreneurial competences constitute a good example of fuzzy characteristics that one may possess to a varying degree. Despite the term “entrepreneur” having been in constant evolution since it was first introduced in the 18th century, all definitions agree on characterizing entrepreneurial competences as a combination of talents [47], such as the ability to manage, work in a team, identify and create opportunities, take risks, and so on. More recently, due to the need to identify scenarios and resolve emerging problems deriving from economic and technological progress, the concept of entrepreneurial competence has been further modified to now include a distinction between the intrapreneur (who applies his/her talent within an organization) and the entrepreneur (who develops a market opportunity in the form of a new venture, which is usually their own company) [48]. The true entrepreneur does not focus only on the momentary creation of a business, but also on proactivity and constant innovation, which suggests that being an entrepreneur is not only a learned behavior but is developed and perfected over time [49].
The present article uses the entrepreneurial competence model taken from the Evolute system [50], which is a platform that integrates different tools based on a generic fuzzy network with a good reasoning capacity for decision making. This allows the imprecision of the linguistic descriptors used to be converted to a numerical scale.
When the European Higher Education Area was founded, a set of skills that students must call on and put into practice when they join the labor market were incorporated into the university curricula. In this context, competence models have played an increasingly important role in analyzing entrepreneurial skills among Bachelor’s and Master’s Degree students, mapping individual perceptions to identify requirements for personal competence, knowledge, and improvement. The results of these studies generally uncover students’ strengths and weaknesses in certain entrepreneurial talents, helping teachers design and implement corrective actions for future activities.
The available data on entrepreneurial competences was taken from the sample group of students’ self-assessment [51] using the tool Tricuspoid [52], which originated in Tampere University of Technology (Tampere, Finland). This tool is specifically designed to self-assess entrepreneurial skills and provide immediate feedback, with participants required to assess both their current and desired perception of a total of 99 questions formulated as statements related to entrepreneurial situations in daily life using a slider-bar scale ranging from “never” to “always”. The 99 questions are associated with 33 competences, which are grouped into six higher-level competences (self-control, self-knowledge, self-motivation, cognitive capacity, empathy, and social ability) that measure the skill status of each individual, comparing present awareness with desired future objectives. Thus, they capture not only the individuals’ capacities but also their gaps (or creative tension) in order to create strategies for personal improvement.
In this article, the assessment process took place during regular one-and-a-half-hour class sessions during the 2017–2018 academic year with students enrolled on the Bachelor’s Degrees run by the School of Economics and Business Studies at the University of Girona. The teaching staff responsible for the project conducted the process in a room equipped with desktop computers and Internet access. At the beginning of the session, students received information on the importance of competences, the Evolute system in general, and the Tricuspoid application in particular. Each student accessed the system with an individual user name and password. Despite it being a self-assessment tool, professors were available to solve any technical problems or answer questions emerging from the students’ interpretation of statements. At the end of the evaluation, each student was able to access his/her individual competence report at the desired level of detail, 33 competences or six competence groups. The support documentation provided at the beginning of the session included a list of competences, each with a definition to facilitate the interpretation of the final competence report. Participation was voluntary and free of any incentive, beyond the appeal of raising awareness on the importance of entrepreneurial skills and generating a certain curiosity and motivation toward participation. The sample was distributed among students of Accounting and Finance (22%), Business Administration and Management (36.3%), Economics (20.4%), and dual degrees (21.3%). Regarding gender, 56.1% were men and 43.1% were women, while 56.4% were only studying and 43.6% studying and working. Most (86.5%) had started university after finishing their baccalaureate and 13.5% started after vocational training. Less than one quarter (22.9%) were actively studying foreign languages. Nearly one-third (32.6%) were in the first academic year of their degree, 34.8% were in the second year, and 32.6% were in the third year (average age 20 years—SD 1.87).
3.2. Measurement Quality Assessment
In this article, we study three key aspects of the measurement quality of selected Tricuspoid measurements (bias, reliability, and method effects) by means of multitrait–multimethod (MTMM) models as suggested by [53]. MTMM designs [44,54] consist of multiple measures of a set of factors (traits) with the same set of measurement procedures (methods). Therefore, these designs include txm measurements; that is, the number of methods (m) times the number of traits (t). The differences between methods can be any questionnaire design characteristic, such as different response scale lengths or category labels, different data collection procedures, etc. (see [24] for a recent review). In our case, the methods are the m = 2 different response scales (slider-bar and endecanary scales) and the traits are t = 6 selected Tricuspoid questions.
The philosophy behind MTMM designs and models is that the quality of measurement obtained from a given measurement method can only be assessed by comparing it with other methods. This makes it possible not only to evaluate the quality of actual data but also to choose better alternative methods in the future.
The original Tricuspoid questionnaire has a slider scale and respondents move the mouse along a line with end points labeled “never” and “always” (see Figure 1). Each question is presented on a separate screen (henceforth m1). A follow-up questionnaire presents the second method, which is an endecanary radio-button scale labeled from 0 = “never” to 10 = “always” (see Figure 2) and all questions are presented on the same screen (henceforth m2).
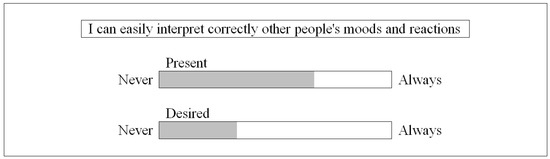
Figure 1.
Graphic slider-bar scale.
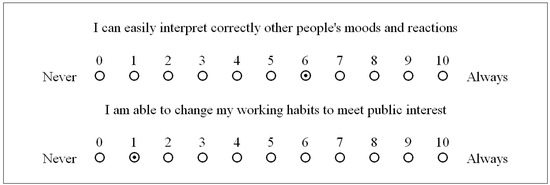
Figure 2.
Endecanary radio-button scale.
A frequent criticism of MTMM designs is that under repeated questioning, respondents remembering their previous answers may lead to biased reliability and method effect estimates. [55] shows that respondents do not remember their previous answers if many similar questions are asked and there are at least 15 min between repetitions. For this purpose, the 198 questions on the Tricuspoid questionnaire (three items for each of the 33 competencies, asked twice regarding their perceived present level of competence and the level they would desire to achieve) were administered in random order with the standard Tricuspoid slider scale. Following a 15-min coffee break, the respondents were presented with the follow-up questionnaire, which included questions on their background and a few selected questions on the endecanary radio-button scale (corresponding with higher-level competences within parentheses):
- t1: I can easily interpret correctly other people’s moods and reactions (empathy).
- t2: I am able to change my working habits to meet public interest (self-control).
- t3: I wish to repeatedly perform a task forcing me to strive to succeed (self-motivation).
- t4: I act quickly and determinedly whenever opportunities and crises appear (self-motivation).
- t5: I aim to analyze and correct my mistakes in order to improve my performance in the future (cognitive capacity).
- t6: One must take immediate action when perceiving a possibility for success (self-motivation).
In the follow-up questionnaire, respondents were only required to give their perception of their present level of competence, which is what the measurement quality assessment in this article is based on.
Method effects can often be viewed as a form of systematic error variance connected to the method. Therefore, in addition to trait or error-free variance (related to measurement quality), MTMM measurements have two sources of error variance: the usual random error variance (related to the concept of lack of reliability) and method variance (related to the concept lack of validity).
Data from MTMM are usually analyzed by means of confirmatory factor analysis models, which is a particular case of structural equation models in the many variants suggested in the literature. In this basic form, MTMM models enjoy a long tradition of reliability and validity assessment [24,25,44,56,57].
Besides variance, method effects can also be viewed as a form of bias, yielding measurements whose mean values differ from those of other methods. MTMM models can be extended to bias assessment by means of specifying a mean and covariance structure [53]. This makes it possible to estimate reliability, validity, and bias in the same comparative study of measurement methods. In this article, we have used the specification known as the constant method bias [53]. The corresponding confirmatory factor analysis model with a mean and covariance structure is specified as follows:
where xij is the measurement of trait i with method j, in which δij is the random measurement error for xij, and it is assumed to have a zero mean, and with variance θij; ti are the trait factors, with means κi, covariances ϕii’, and variances ϕii; mj are the method factors with zero mean and variances ϕMjj. The following parameters are related to method bias: λj is the factor loading of xij on ti; τj is the intercept term associated to mj.
xij = τj + λj ti + mj + δij ∀ i,j
The model’s assumptions are:
cov(δij ti’ ) = 0 ∀ ij,i’
cov(δij mj’) = 0 ∀ ij,j’
cov(δij δi’j’) = 0 if i ≠ i’ or j ≠ j’
cov(ti mj) = 0 ∀ i, j
cov(mj mj’) = 0 if j ≠ j’
where i, i’, ... identify the traits and j, j’, ... identify the methods.
These assumptions make it possible to decompose the variance of xij into variance explained:
- by the trait, computed as λ2j ϕii and referred to as valid variance or error-free variance,
- by the method, computed as ϕMjj and referred to as invalid variance or method effect variance,
- and random error variance (θij),
In order to assess measurement quality, the percentage of variance explained by the trait is referred to as the quality of the item [58].
Bias in a method can only be estimated in comparative terms with respect to another particular method. This is because the bias of a measurement using a given method concerns the comparison of the mean of the observed measurement and the mean of the trait factor. The mean of the trait factor is arbitrary and can at most be fixed according to the mean of a measurement using another method. Thus, the researcher assesses whether the means of measurements made with different methods are comparable or not, but cannot decide which, if any, is correct. For this purpose, one λj loading must be constrained to 1 and one τj intercept must be constrained to 0. Let us assume that the constraint is applied to Method 1 so that λ1 = 1 and τ1 = 0. Then, it is possible to evaluate whether Method 2 produces scores that are systematically different from those obtained with Method 1, once random error variance and method variance have been accounted for. Bias is understood as a difference between the scaling of the measurements and the trait factors. If τ2 = 0 and λ2 = 1, then Methods 1 and 2 are unbiased with respect to each other because they yield the same expected measurement for any value of the trait factor ti. It is also possible to statistically test the following statistical hypotheses corresponding to an absence of relative bias:
H0: τ2 = 0
H0: λ2 = 1
It must be noted that these tests are not equivalent to the test that only compares the overall means of responses commonly performed in studies comparing measurement scales [25,42]. The test comparing the means actually tests the null hypothesis H0: τ2 + λ2κi = κi, which may hold for an infinite set of combinations of τ2 and λ2 [53].
As recommended for the purpose of relative bias assessment, prior to their analysis, the data were rescaled to make the permitted response range 0 to 10 for both methods, as in the endecanary scale [53].
3.3. Data Description
In this section, we present some descriptive statistical results for the distribution of responses with both methods. The boxplots in Figure 3 and the descriptive statistics in Table 1 show that the two methods coincide in the fact that the highest level of perceived competence is found in t1 (interpreting other people’s moods), t5 (correcting mistakes in the future), and t6 (taking action for success), while the lowest is found in t3 (repeatedly performing a task until successful).
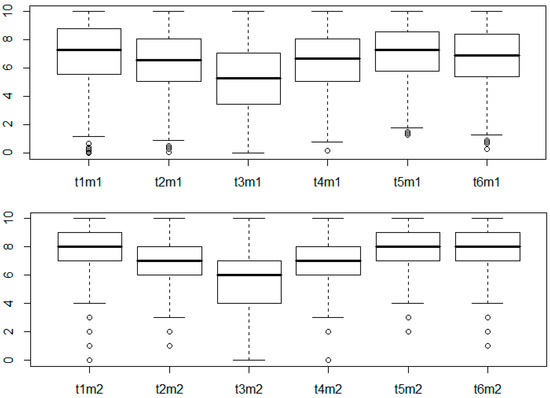
Figure 3.
Box plots.

Table 1.
Descriptive statistics.
The main difference between the two methods is higher dispersion for the slider scale (m1), which is consistent for all six traits. The results of the MTMM analysis will tell us whether this higher dispersion results from a higher error-free variance, from a higher method effect variance, or from a higher random error variance.
4. Results
The MTMM model was estimated by maximum likelihood with missing data, with tests and confidence intervals that were robust to non-normality [59], as implemented in the mlr option in the Mplus 8.20 program [60]. Non-normality was not severe (the maximum absolute skewness in any variable was 1.27 and the maximum absolute kurtosis was 1.90). Missing values were mainly due to attrition between the first and second questionnaires. n = 500 completed the main questionnaire, with no item non-response. n = 394 completed the follow-up questionnaire, with only 0.25% item non-response on average for all questions. All n = 500 cases were taken into account in the analyses.
The goodness-of-fit indices for the model yielded acceptable values for the structural equation modeling practice: Chi-square test of model fit = 95.5 with 47 degrees of freedom and p-value < 0.001; RMSEA = 0.045 (Root Mean Square Error of Approximation; 90% confidence limits: 0.032 and 0.059); CFI = 0.955 (Comparative Fit index); and SRMR = 0.040 (Standardized Root Mean Square Residual).
According to the τ2 and λ2 parameters and their confidence intervals, the hypothesis of no relative bias of one method with respect to the other (τ2 = 0 and λ2 = 1) is tenable (see Table 2). As a result, the trait variance in the two methods (ϕii and λ22 ϕii) is undistinguishable. Thus, the differences in variance observed in Figure 3 and Table 1 can only arise from either of the two sources of error variance. The θij parameters refer to random error variance and show that the endecanary radio-button scale (m2) performs better. The ϕMjj parameters refer to method variance and also show that the radio-button scale performs better. According to the non-overlapping confidence interval limits in Table 2, the method variance ϕM22 is significantly lower than ϕM11. The same occurs for error for variances θi2 and θi1 corresponding to traits t2, t4, t5 and t6, which are also significantly lower for Method 2.
Table 2.
Model parameter 1 estimates and 95% confidence interval limits. (lower limit, LCL; and upper limit, UCL).
The results for error and method variances are confirmed when expressing the three sources of variance as percentages (Table 3). Percentages of trait variance (in other words, item quality [58]) are for the most part high, albeit higher for the endecanary radio-button scale.
Table 3.
Measurement quality. Percentages of explained variance.
As additional evidence for Method 2, in the follow-up questionnaire, respondents were directly asked which question format they liked best. More than half (55.4%) preferred the endecanary radio-button presentation, while 13.8% liked the classic slider presentation, and 30.9% stated that they liked both equally.
5. Discussion
The quality of the original Tricuspoid slider-bar scale receives a favorable judgment overall. With the exception of traits t5 and t6, the largest proportion of variance is valid variance. That said, the Tricuspoid questionnaire would benefit from shifting from the standard slider-bar scale to a radio-button scale, as it would result in an expected reduction in both method variance and error variance. These results add to the still controversial literature on the relative merits of slider and radio-button scales in computerized questionnaires in specific settings. Similar to much previous research, we have found that while differences between the two measurement scales are not substantial [42], all things considered, the balance favors the radio-button alternative (see [25,46,61] and references therein).
Given that no evidence of relative bias was found, data collected with the new format will be comparable to those obtained with the slider-bar version used to date. Thus, in practical terms, shifting to the new method will not prevent comparative studies from being performed that combine Tricuspoid data with the new and old formats.
To the best of our knowledge, this is the first study on slider-bar and radio-button scales that covers bias, validity, and reliability simultaneously. This is made possible by including mean and covariance structures in MTMM models [53]. It is also the first comparative evaluation of measurement scales for the self-assessment of entrepreneurial competences.
One limitation of the study is the fact that the radio-button measurement scale was presented to all respondents last. Thus, the effect of the measurement scale cannot be distinguished from a question-order effect. However, this limitation is common in MTMM studies [62]. It must also be taken into account that all respondents answered the questionnaire in the computer room, and results using smaller screens may make a difference [25,63,64], thus highlighting the importance of a responsive questionnaire design [65].
In this article, we have established that the endecanary scale performs better that the slider-bar scale in the specific context of desktop computers and questionnaires for competence self- evaluation. This confirms the results [46] and much of the literature review, taking into account several contexts [25]. Further research could compare the endecanary scale used in this article (with labels only in the extreme response categories) to the original endecanary scale with linguistic labels for all categories. Further research could also expand the findings to mobile devices, for which a lower relative performance of slider-bars compared to radio buttons was reported [25]. Further studies could also take into account other indicators of quality, such as response latency or eye-tracking [66].
Author Contributions
Conceptualization, S.L.-M. and L.V.-L.; Methodology, S.L.-M., A.B., and G.C.; Software, A.B. and L.V.-L.; Validation, L.V.-L., and G.C.; Formal Analysis, G.C.; Resources, A.B.; Data Curation, L.V.-L.; Writing, all authors; Project Administration, A.B.; Funding Acquisition, G.C. All authors have read and agreed to the published version of the manuscript.
Funding
This research was funded by the Spanish Ministry of Science, Innovation, and Universities and FEDER, grant number RTI2018-095518-B-C21, the Spanish Ministry of Health, grant number CIBERCB06/02/1002 and the Catalan Government, grant numbers 2017SGR656 and 2017SGR386.
Acknowledgments
The authors would like to acknowledge the support received from the developer of the original Tricuspoid instrument, Jussi Kantola, and University of Girona colleagues who assisted with questionnaire translation and data collection: Rudi de Castro, Gemma Renart and Carme Saurina, the Dean of the Faculty of Economics and Business studies at the University of Girona at the time the study was designed. Lastly, we would like to thank the anonymous reviewers for their valuable comments, which have improved the quality of the paper.
Conflicts of Interest
The authors declare no conflict of interest.
References
- Zadeh, L.A. Fuzzy sets. Inf. Control 1965, 8, 338–353. [Google Scholar] [CrossRef]
- Linares-Mustarós, S.; Ferrer-Comalat, J.C.; Cassú-Serra, E. The assessment of cash flow forecasting. Kybernetes 2013, 42, 736–753. [Google Scholar] [CrossRef]
- Jaini, N.; Utyuzhnikov, S. A fuzzy trade-off ranking method for multi-criteria decision-making. Axioms 2017, 7, 1. [Google Scholar] [CrossRef]
- López, C.; Linares, S.; Viñas, J. Evolutionary positioning of outsourcing in the local public administration. Intang. Cap. 2019, 15, 157–170. [Google Scholar] [CrossRef]
- Farrar, J.T.; Young, J.P., Jr.; LaMoreaux, L.; Werth, J.L.; Poole, R.M. Clinical importance of changes in chronic pain intensity measured on an 11-point numerical pain rating scale. Pain 2001, 94, 149–158. [Google Scholar] [CrossRef]
- Riedl, C.; Blohm, I.; Leimeister, J.M.; Krcmar, H. Rating scales for collective intelligence in innovation communities: Why quick and easy decision making does not get it right. In Proceedings of the Thirty First International Conference on Information Systems, St. Louis, MO, USA, 24 November 2010. [Google Scholar]
- Gonzalez Campos, J.A.; Manriquez Penafiel, R.A. A method for ordering of LR-type fuzzy numbers: An important decision criteria. Axioms 2016, 5, 22. [Google Scholar] [CrossRef]
- Hernández, P.; Cubillo, S.; Torres-Blanc, C.; Guerrero, J. New order on type 2 fuzzy numbers. Axioms 2017, 6, 22. [Google Scholar] [CrossRef]
- Piasecki, K. Revision of the Kosiński’s theory of ordered fuzzy numbers. Axioms 2018, 7, 16. [Google Scholar] [CrossRef]
- Tuana, N.A. Developing a generalized fuzzy multi-criteria decision making for personnel selection. Fuzzy Econ. Rev. 2018, 23, 27–41. [Google Scholar]
- Zadeh, L.A. The concept of a linguistic variable and its application to approximate reasoning-I. Inf. Sci. 1975, 8, 199–249. [Google Scholar] [CrossRef]
- Curry, B.; Lazzari, L. Fuzzy consideration sets: A new approach based on direct use of consumer preferences. Int. J. Appl. Manag. Sci. 2009, 1, 420–436. [Google Scholar] [CrossRef]
- Dey, A.; Pradhan, R.; Pal, A.; Pal, T. The fuzzy robust graph coloring problem. In Proceedings of the 3rd International Conference on Frontiers of Intelligent Computing: Theory and Applications (FICTA) Paniora, Odisha, India, 14 November 2014; Springer: Cham, Switzerland, 2015; pp. 805–813. [Google Scholar]
- Dey, A.; Pal, A.; Pal, T. Interval type 2 fuzzy set in fuzzy shortest path problem. Mathematics 2016, 4, 62. [Google Scholar] [CrossRef]
- Dey, A.; Son, L.H.; Kumar, P.K.; Selvachandran, G.; Quek, S.G. New concepts on vertex and edge coloring of simple vague graphs. Symmetry 2018, 10, 373. [Google Scholar] [CrossRef]
- Ferrer-Comalat, J.C.; Linares-Mustarós, S.L.; Corominas-Coll, D. A formalization of the theory of expertons. Theoretical foundations, properties and development of software for its calculation. Fuzzy Econ. Rev. 2016, 21, 23–39. [Google Scholar] [CrossRef]
- Linares-Mustarós, S.; Ferrer-Comalat, J.C.; Corominas-Coll, D.; Merigó, J.M. The ordered weighted average in the theory of expertons. Int. J. Intell. Syst. 2019, 34, 345–365. [Google Scholar] [CrossRef]
- Alfaro-Calderón, G.G.; Godínez-Reyes, N.L.; Gómez-Monge, R.; Alfaro-García, V.; Gil-Lafuente, A.M. Forgotten effects in the valuation of the social well-being index in Mexico’s sustainable development. Fuzzy Econ. Rev. 2019, 24, 67–81. [Google Scholar]
- Linares-Mustarós, S.; Ferrer-Colomat, J.C. Teoría de conjuntos clásica versus teoría de subconjuntos borrosos. Un ejemplo elemental comparativo. Tribuna Plural: La Revista Científica 2014, 2, 485–500. [Google Scholar]
- Miller, G.A. The magical number seven, plus or minus two: Some limits on our capacity for processing information. Psychol. Rev. 1956, 63, 81–97. [Google Scholar] [CrossRef]
- Baddeley, A. The magical number seven: Still magic after all these years? Psychol. Rev. 1994, 101, 353–356. [Google Scholar] [CrossRef]
- Gil-Aluja, J. Fuzzy Sets in the Management of Uncertainty; Springer Science & Business Media: Berlin, Germany, 2004. [Google Scholar]
- Linares-Mustaros, S.; Cassu-Serra, E.; Gil-Lafuente, A.M.; Ferrer-Comalat, J.C. New practical tools for minimizing human error in research into forgotten effects. In Computational Data Analysis Techniques in Economics and Finance; Doumpos, M., Zopounidis, C., Eds.; Nova: Hauppauge, NY, USA, 2015; pp. 231–248. [Google Scholar]
- DeCastellarnau, A. A classification of response scale characteristics that affect data quality: A literature review. Qual. Quant. 2018, 52, 1523–1559. [Google Scholar] [CrossRef]
- Bosch, O.J.; Revilla, M.; DeCastellarnau, A.; Weber, W. Measurement reliability, validity, and quality of slider versus radio button scales in an online probability-based panel in Norway. Soc. Sci. Comput. Rev. 2019, 37, 119–132. [Google Scholar] [CrossRef]
- Cook, C.; Heath, F.; Thompson, R.L.; Thompson, B. Score reliability in web- or Internet-based surveys: Unnumbered graphic rating scales versus Likert-type scales. Educ. Psychol. Meas. 2001, 61, 697–706. [Google Scholar] [CrossRef]
- Gartner, W.B. What are we talking about when we talk about entrepreneurship? J. Bus. Ventur. 1990, 5, 15–28. [Google Scholar] [CrossRef]
- Dey, A.; Pradhan, R.; Pal, A.; Pal, T. A genetic algorithm for solving fuzzy shortest path problems with interval type-2 fuzzy arc lengths. Malays. J. Comput. Sci. 2018, 31, 255–270. [Google Scholar] [CrossRef]
- Dey, A.; Pal, A.; Long, H.V. Fuzzy minimum spanning tree with interval type 2 fuzzy arc length: Formulation and a new genetic algorithm. Soft Comput. 2019, 2019, 1–12. [Google Scholar] [CrossRef]
- Moayedi, H.; Tien Bui, D.; Gör, M.; Pradhan, B.; Jaafari, A. The feasibility of three prediction techniques of the artificial neural network, adaptive neuro-fuzzy inference system, and hybrid particle swarm optimization for assessing the safety factor of cohesive slopes. ISPRS Int. J. Geo-Inf. 2019, 8, 391. [Google Scholar] [CrossRef]
- Polishchuk, V.; Kelemen, M.; Gavurová, B.; Varotsos, C.; Andoga, R.; Gera, M.; Christodoulakis, J.; Soušek, R.; Kozuba, J.; Hospodka, J.; et al. A fuzzy model of risk assessment for environmental start-up projects in the air transport sector. Int. J. Environ. Res. Public Health 2019, 16, 3573. [Google Scholar] [CrossRef]
- Castillo, O.; Valdez, F.; Soria, J.; Amador-Angulo, L.; Ochoa, P.; Peraza, C. Comparative study in fuzzy controller optimization using bee colony, differential evolution, and harmony search algorithms. Algorithms 2019, 12, 9. [Google Scholar] [CrossRef]
- Kaufmann, A. Expert appraisements and counter-appraisements with experton processes. In Proceedings of the First International Symposium on Uncertainty Modeling and Analysis, College Park, MD, USA, 3 December 1990; IEEE Computer Society Press: Washington, DC, USA, 1990; pp. 619–624. [Google Scholar]
- Vizuete Luciano, E.; Gil-Lafuente, A.M.; García González, A.; Boria-Reverter, S. Forgotten effects of corporate social and environmental responsibility. Kybernetes 2013, 42, 736–753. [Google Scholar] [CrossRef]
- Bass, B.M.; Cascio, W.F.; O’Connor, E.J. Magnitude estimations of expressions of frequency and amount. J. Appl. Psychol. 1974, 59, 313–320. [Google Scholar] [CrossRef]
- Osgood, C.E.; Suci, G.J.; Tannenbaum, P.H. The Measurement of Meaning; University of Illinois Press: Chicago, IL, USA, 1975. [Google Scholar]
- Lodge, M.; Tursky, B. On the magnitude scaling of political opinion in survey research. Am. J. Political Sci. 1981, 25, 376–419. [Google Scholar] [CrossRef]
- Saris, W.E. Variation in Response Functions: A Source of Measurement Error in Attitude Research; Sociometric Research Foundation: Amsterdam, The Netherlands, 1988. [Google Scholar]
- Fowler, F.J., Jr. Survey Research Methods; Sage: Thousand Oaks, CA, USA, 2013. [Google Scholar]
- Groves, R.M.; Fowler, F.J., Jr.; Couper, M.P.; Lepkowski, J.M.; Singer, E.; Tourangeau, R. Survey Methodology; Wiley: Hoboken, NJ, USA, 2011. [Google Scholar]
- Saris, W.E. Continuous Scales in the Social Sciences: An Attractive Possibility; Sociometric Research Foundation: Amsterdam, The Netherlands, 1987. [Google Scholar]
- Couper, M.P.; Tourangeau, R.; Conrad, F.G.; Singer, E. Evaluating the effectiveness of visual analog scales: A web experiment. Soc. Sci. Comput. Rev. 2006, 24, 227–245. [Google Scholar] [CrossRef]
- De Pijper, W.M.; Saris, W.E. The Formulation of Interviews Using the Program INTERV; Sociometric Research Foundation: Amsterdam, The Netherlands, 1986. [Google Scholar]
- Saris, W.E.; Munnich, Á. The Multitratit-Multimethod Approach to Evaluate Measurement Instruments; Eötvös University Press: Budapest, Hungary, 1995. [Google Scholar]
- Cape, P. Slider scales in online surveys. In Proceedings of the CASRO Panel Conference, New Orleans, LA, USA, 2 February 2009. [Google Scholar]
- Sikkel, D.; Steenbergen, R.; Gras, S. Clicking vs. dragging: Different uses of the mouse and their implications for online surveys. Public Opin. Q. 2014, 78, 177–190. [Google Scholar] [CrossRef]
- Aramo-Immonen, H.; Bikfalvi, A.; Mancebo, N.; Vanharanta, H. Project managers’ competence identification. Int. J. Hum. Cap. Inf. Technol. Prof. 2011, 2, 37–51. [Google Scholar] [CrossRef]
- Shapero, A.; Sokol, L. The social dimensions of entrepreneurship. In Encyclopedia of Entrepreneurship; Kent, C.A., Sexton, D.L., Vesper, K.H., Eds.; Prentice Hall: Englewood Cliffs, NJ, USA, 1982; pp. 72–90. [Google Scholar]
- Ajzen, I. The theory planned behavior. Organ. Behav. Hum. Decis. Process. 1991, 50, 179–211. [Google Scholar] [CrossRef]
- Kantola, J.; Karwowski, W.; Vanharanta, H. Managing managerial mosaic: The Evolute methodology. In Electronic Globalized Business and Sustainable Development through IT Management: Strategies and Perspectives; Ordóñez de Pablos, P., Lytras, M.D., Karwowski, W., Lee, R.W.B., Eds.; IGI Global: Hershey, PA, USA, 2006; pp. 77–89. [Google Scholar]
- Peterman, N.; Kennedy, J. Enterprise education: Influencing students’ perceptions of entrepreneurship. Entrep. Theory Pract. 2003, 28, 129–144. [Google Scholar] [CrossRef]
- Palolen, E. Tricuspoid-The Competence Evaluation Application for Entrepreneurs; Tampere University of Technology: Tampere, Finland, 2005. [Google Scholar]
- Coenders, G.; Saris, W.E. Systematic and random method effects. Estimating method bias and method variance. In Developments in Survey Methodology; Ferligoj, A., Mrvar, A., Eds.; Metodološki Zvezki 15, FDV: Ljubljana, Slovenia, 2000; pp. 55–74. [Google Scholar]
- Campbell, D.T.; Fiske, D.W. Convergent and discriminant validation by the multitrait multimethod matrices. Psychol. Bull. 1959, 56, 81–105. [Google Scholar] [CrossRef]
- Van Meurs, A.; Saris, W.E. Memory effects in MTMM studies. In Multitrait Multimethod Approach to Evaluate Measurement Instruments; Saris, W.E., Munnich, A., Eds.; Eötvös University Press: Budapest, Hungary, 1995; pp. 89–103. [Google Scholar]
- Andrews, F.M. Construct validity and error components of survey measures. A structural modeling approach. Public Opin. Q. 1984, 48, 409–442. [Google Scholar] [CrossRef]
- Coenders, G.; Saris, W.E. Testing nested additive, multiplicative and general multitrait-multimethod models. Struct. Equ. Model. 2000, 7, 219–250. [Google Scholar] [CrossRef]
- Saris, W.E.; Gallhofer, I.N. Design, Evaluation, and Analysis of Questionnaires for Survey Research; Wiley: Hoboken, NJ, USA, 2014. [Google Scholar]
- Yuan, K.H.; Bentler, P.M. Three likelihood-based methods for mean and covariance structure analysis with nonnormal missing data. In Sociological Methodology; Sobel, M.E., Becker, M.P., Eds.; American Sociological Association: Washington, DC, USA, 2000; pp. 165–200. [Google Scholar]
- Muthén, L.K.; Muthén, B.O. Mplus User’s Guide, 8th ed.; Muthén & Muthén: Los Angeles, CA, USA, 2017. [Google Scholar]
- Roster, C.A.; Lucianetti, L.; Albaum, G. Exploring slider vs. categorical response formats in webbased surveys. J. Res. Pract. 2015, 11, 1–16. [Google Scholar]
- Saris, W.E.; Oberski, D.L.; Revilla, M.; Zavala Rojas, D.; Gallhofer, L.; Lilleoja, I.; Gruner, T. Final Report about the Project JRA3 as Part of ESS; RECSM Working Paper, No. 24; RECSM/UPF: Barcelona, Spain, 2011. [Google Scholar]
- Toninelli, D.; Revilla, M. How mobile device screen size affects data collected in web surveys. In Advances in Questionnaire Design, Development, Evaluation and Testing; Beatty, P., Collins, D., Kaye, L., Padilla, J.L., Willis, G., Wilmot, A., Eds.; Wiley & Sons: Hoboken, NJ, USA, 2020; pp. 349–373. [Google Scholar]
- Höhne, J.K.; Revilla, M.; Lenzner, T. Comparing the performance of agree/disagree and item-specific questions across PCs and smartphones. Methodology 2018, 14, 109–118. [Google Scholar] [CrossRef]
- Couper, M.P.; Antoun, C.; Mavletova, A. Mobile web surveys. In Total Survey Error in Practice; Biemer, P.P., de Leeuw, E.D., Eckman, S., Edwards, B., Kreuter, F., Lyberg, L.E., Eds.; Wiley & Sons: Hoboken, NJ, USA, 2017; pp. 133–154. [Google Scholar]
- Tourangeau, R.; Maitland, A.; Steiger, D.; Yan, T. A framework for making decisions about question evaluation methods. In Advances in Questionnaire Design, Development, Evaluation and Testing; Beatty, P., Collins, D., Kaye, L., Padilla, J.L., Willis, G., Wilmot, A., Eds.; Wiley & Sons: Hoboken, NJ, USA, 2020; pp. 47–73. [Google Scholar]


© 2020 by the authors. Licensee MDPI, Basel, Switzerland. This article is an open access article distributed under the terms and conditions of the Creative Commons Attribution (CC BY) license (http://creativecommons.org/licenses/by/4.0/).