Article

Optimal Genetic Design of Type-1 and Interval Type-2 Fuzzy Systems for Blood Pressure Level Classification

by
Juan Carlos Guzmán
1,
Ivette Miramontes
1,
Patricia Melin
1,* and
German Prado-Arechiga
2
1
Tijuana Institute of Technology, Calzada Tecnologico s/n, Fracc. Tomas Aquino, Baja California, Tijuana 22379, Mexico
2
Cardiodiagnostico Excel Medial Center, Tijuana 22010, Mexico
*
Author to whom correspondence should be addressed.
Submission received: 1 December 2018 / Revised: 4 January 2019 / Accepted: 10 January 2019 / Published: 15 January 2019
(This article belongs to the Special Issue Type-2 Fuzzy Logic: Theory, Algorithms and Applications)

Abstract

:
The use of artificial intelligence techniques such as fuzzy logic, neural networks and evolutionary computation is currently very important in medicine to be able to provide an effective and timely diagnosis. The use of fuzzy logic allows to design fuzzy classifiers, which have fuzzy rules and membership functions, which are designed based on the experience of an expert. In this particular case a fuzzy classifier of Mamdani type was built, with 21 rules, with two inputs and one output and the objective of this classifier is to perform blood pressure level classification based on knowledge of an expert which is represented in the fuzzy rules. Subsequently different architectures were made in type-1 and type-2 fuzzy systems for classification, where the parameters of the membership functions used in the design of each architecture were adjusted, which can be triangular, trapezoidal and Gaussian, as well as how the fuzzy rules are optimized based on the ranges established by an expert. The main contribution of this work is the design of the optimized interval type-2 fuzzy system with triangular membership functions. The final type-2 system has a better classification rate of 99.408% than the type-1 classifier developed previously in “Design of an optimized fuzzy classifier for the diagnosis of blood pressure with a new computational method for expert rule optimization” with 98%. In addition, we also obtained a better classification rate than the other architectures proposed in this work.

1. Introduction

Nowadays the use of artificial intelligence techniques such as fuzzy logic, neural networks and evolutionary computation help to design models with fast and efficient response that can give a precise diagnosis and thus help decision-making based on the experience and rules established by experts in the area in order, it is difficult to determine whether or not we have a high blood pressure level, which is why it is important to check constantly and every 24 h to monitor blood pressure (BP) samples during the course of 24 h and this information will help to have a more accurate analysis of the behavior of BP. That is why this work is based on 24-h monitoring and not on daily, weekly or monthly takes, since the use of information from a single sample could impact the diagnosis, since a single sample can result in high blood pressure because for reasons of everyday life at that time the patient had an action that took him to that state, that is why the effectiveness of using the information of a monitoring, helps to keep track of a whole day and see the behavior that the patient has during day and night and this helps determine if the patient is hypertension or not [1,2,3].
Through the use of 24-h monitoring that throws the pressure device used for this research, we have a total of 45 samples of systolic pressure and 45 samples of diastolic pressure during the course of 24 h, then this information is analyzed by neural networks, which help to model this information and thus obtain a trend which will be the input to the fuzzy classifier, which based on knowledge of an expert and guides already specified by the dependencies of cardiology will give a quick and correct diagnosis [4,5,6].
In this paper we are focused on the design and experimentation of different architectures in order to find the optimal classifier for the classification of BP levels and it is a continuation of previously works done by the authors [7,8,9], since currently there are few works for the diagnosis of the blood pressure using artificial intelligence techniques. This work takes as a basic guide the European guidelines which are classified in the following levels: hypotension, normal, high normal, grade 1, 2, 3 and isolated systolic pressure grade 1, 2, 3, as shown in Table 1 based in the European cardiology society [10,11,12,13,14].
This type of well implemented systems allows cardiologists to give a better diagnosis based on a series of data well analyzed and subsequently classified based on the knowledge of an expert, in this case a medical expert in the area. Nowadays the seriousness of this problem of BP has caused to give a greater importance to this disease since every day increases the number of hypertensive people in the world and a large amount of it does not know that it suffers from this disease until it experiences an event cardiovascular which can lead to death.
The doctors every day rely more on the use of intelligent techniques, which allows them to analyze and know more accurately the past, present and future behavior of each patient and this helps them to have a better diagnosis based on all this data obtained during the time, all this in real life helps to avoid human losses at an early age, that is why the importance of requiring these technologies, which prevent with great precision problems in the future.
The main contribution of this work is the design of the interval type-2 fuzzy system with triangular membership functions, which is better than the design of the type-1 fuzzy system developed previously [15].
The general model to which this fuzzy classifier belongs is composed primarily by a database of real patients [16,17,18,19,20,21], which, with the collaboration of a cardiology has been increased to 200 24-h monitoring, each monitoring contains 45 systolic samples and 45 samples diastolic by patient and each one is independent at the time of classification, this information is modeled by a modular neuronal network which results in the tendency based on this information and this tendency is the input to the fuzzy classifier, to which the parameters and rules were adjusted with genetic algorithms [22,23,24,25,26,27,28]. The parameter adjustment method of the membership functions consists of determining the ranges of each membership function and moving each point within that range and searching for the optimum value. During this process of parameter adjustment different fuzzy classifiers are created that are being tested to determine the best and this is taken as a basis for experiments, currently, there are experiments in type-1 and type-2 fuzzy systems.
This paper is organized as follows: In Section 2 the basic concepts are presented, in Section 3 the problem statement and proposed method are explained, Section 4 outlines the knowledge representation of the optimized type-1 and interval type-2 fuzzy systems, Section 5 describes the results of this work, Section 6 presents the discussion and Section 7 the conclusions are presented.

2. Basic Concepts

Some definitions are fundamental to understand the functioning of blood pressure and this will help to better understand the objective of this work

2.1. Blood Pressure

Blood pressure (BP) is the power that the blood applies against the dividers of the conduits. At the point when the heart thumps, it directs blood to the conduits, this is the point at which its weight is higher and it is called systolic weight. At the point when your heart is very still between one beat and another, the circulatory strain reductions and this is called diastolic weight.
Both systolic and diastolic circulatory strain esteems are utilized as a part of characterizing the pulse. When all is said in done, the systolic weight is specified first and after that the diastolic. A perusing with estimations of:
  • 119/79 or less is considered normal BP
  • 140/90 or higher is considered high BP
In the vicinity of 120 and 139 for the most elevated number or in the vicinity of 80 and 89 for the least number is prehypertension. Prehypertension implies that somebody can grow hypertension except if some move is made.
Hypertension does not more often than not have side effects but rather can cause difficult issues, for example, strokes, heart disappointment, localized necrosis and kidney disappointment.
Somebody can control the pulse with a solid way of life like exercise and DASH slim down and, if vital, solutions.

2.2. Type of Blood Pressures

Hypertension is the most widely recognized illness and increments both the bleakness and mortality from cardiovascular ailments. Distinctive kinds of hypertension can be characterized when the sickness is sub-arranged.
These types are described in Table 1 [29].
In Table 1, a Category (BP) is the highest BP level, either systolic or diastolic. The isolated systolic hypertension is divided as 1, 2 or 3 according to the systolic BP value in the ranges indicated.

2.3. Hypotension

Low BP, otherwise called hypotension, would be thought of as insignificant. Be that as it may, for some individuals, hypotension can cause indications of wooziness and blacking out. In more serious cases, low circulatory strain can be dangerous.
Circulatory strain fluctuates from individual to individual, a pulse perusing of 90 mm Hg or less of systolic pulse (the most elevated number on a pulse perusing) or 60 mm Hg or lower diastolic pulse (The lower number) is generally considered as low circulatory strain.
Reasons for hypotension can run from lack of hydration to genuine restorative or careful issue. Low pulse can be dealt with, yet it is essential to realize what is causing the malady so it can be dealt with legitimately.

2.4. Hypertension

Hypertension is a perpetual condition that includes expanding pulse. One of the qualities of this sickness is that there is no unmistakable introduction of the side effects and that these do not show for quite a while.
Nowadays, cardiovascular infections are the main source of mortality in Spain. Nonetheless, hypertension is a treatable condition. Inability to take after the specialist’s proposals can prompt genuine confusions, for example, a myocardial localized necrosis, draining or cerebral thrombosis, which can be maintained a strategic distance from if legitimately controlled.
The primary outcome of hypertension is endured by the veins that help hypertension consistently and this solidifies, end up thicker and can ruin the section of blood through them. This is known as arteriosclerosis.

2.5. Risk Factors

The risk factors for hypertension are: Sex, genetic elements, liquor consumption, smoking, salt consumption, obesity, age, stress level, lack of activity.

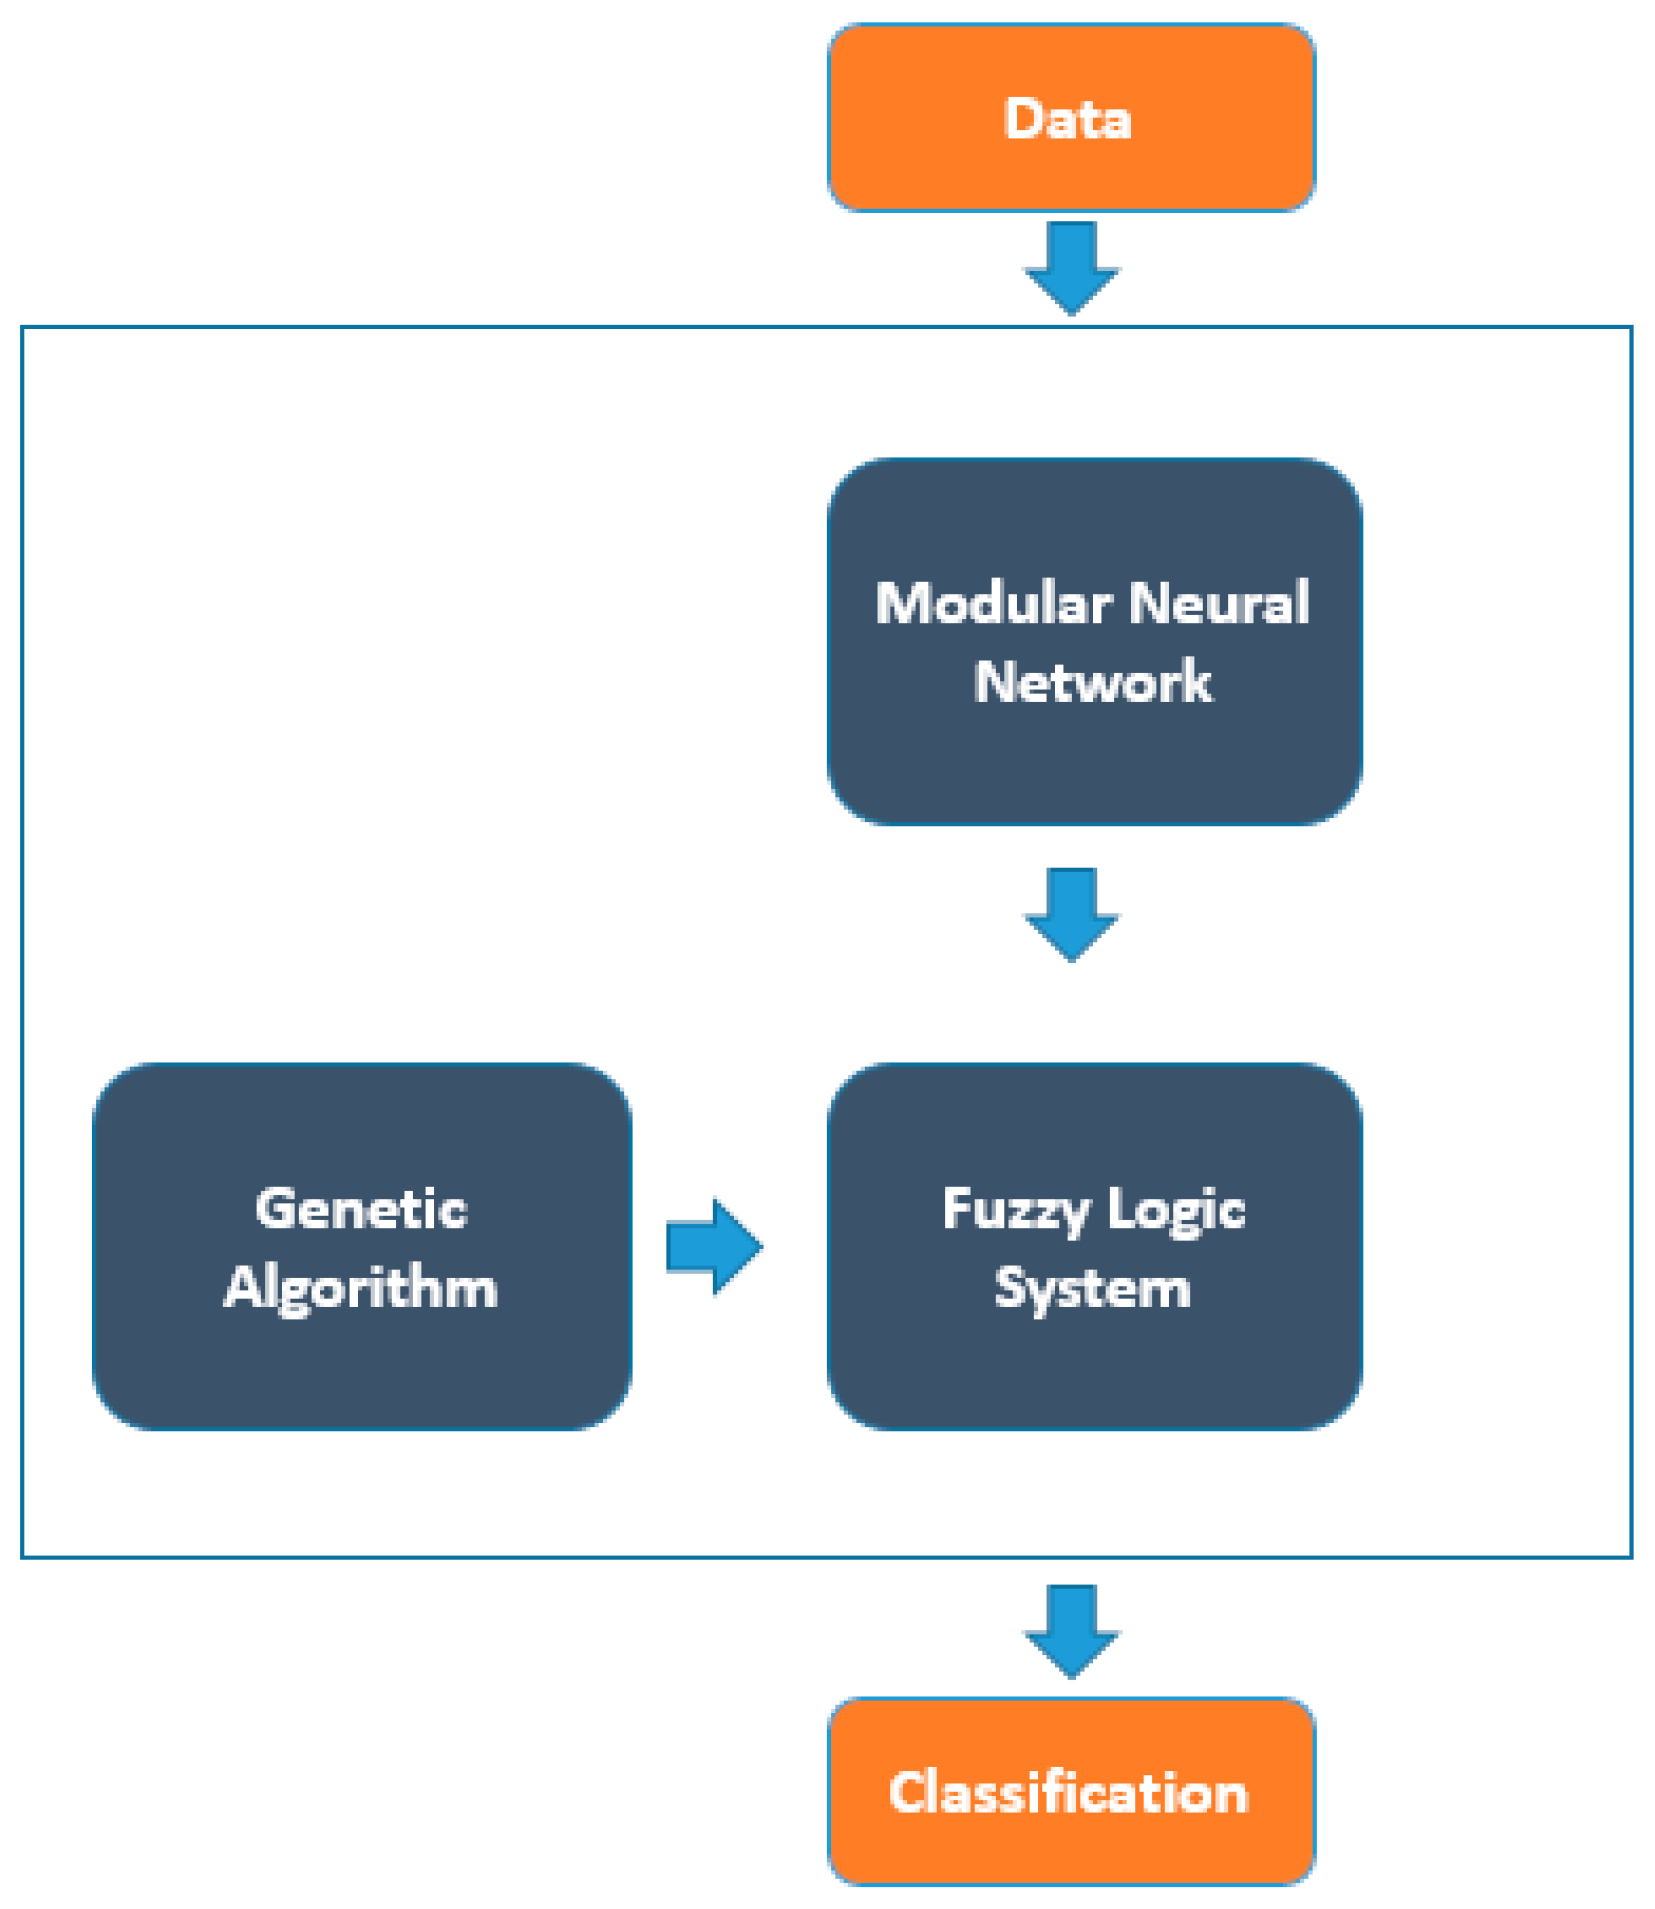
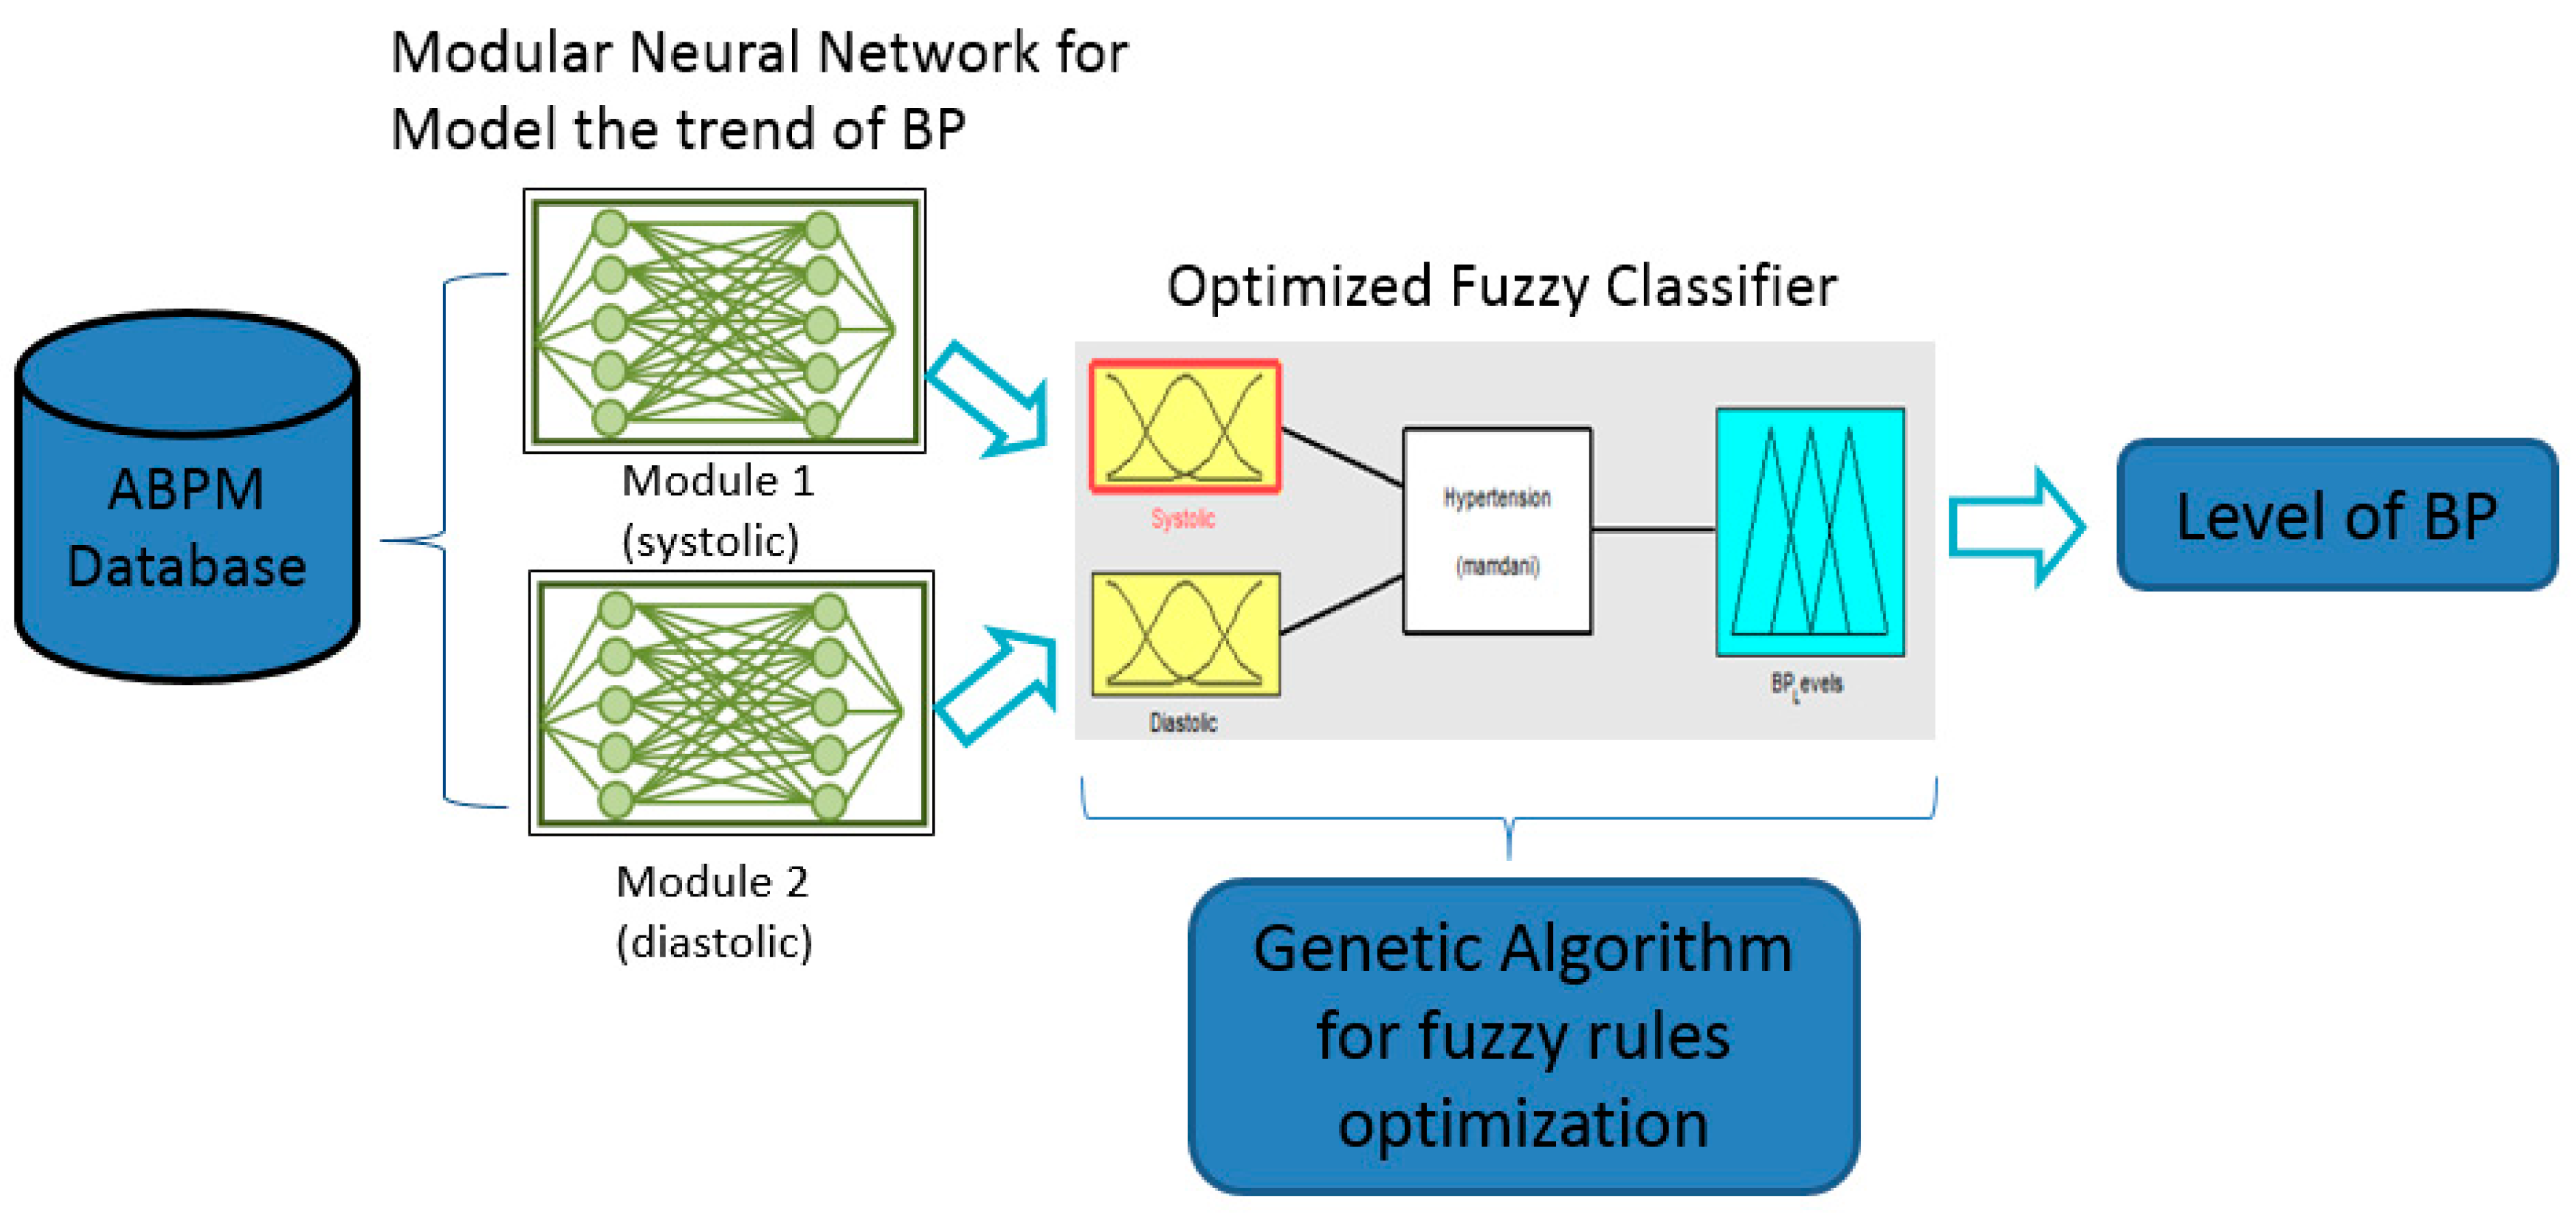
3. Problem Statement and Proposed Method

Accordingly, to this investigation, 30 patients were checked for 24 h monitoring and 45 tests were acquired for the duration of the day, all that is for each patient, every patient has distinctive kinds of exercises in their day by day life and this causes us to have diverse cases for every individual and this gives a superior unwavering quality when we utilize the classifier for the finding that relying upon the level of circulatory strain that every patient has [30].
A particular modular neural network is utilized to give information to the classifier, this information is the systolic and diastolic weights and is given by every patient in the 24 h monitoring and this data are the inputs for the module of the modular neural network. In this phase, the neural network learns and models the data to finally give a result, which will be the inputs to the fuzzy system to classify in the most ideal way and provide a correct analysis and help the cardiologist to the precise control and diagnosis of each patient [31,32,33,34,35].
In the following general model in Figure 1, we have a database, which consists of 200 patients for the fuzzy classifier, it should be noted that first of all, we have a monitoring data that consisting of 45 samples systolic and 45 diastolic samples which enter the modular neural network and these data are modeled and analyzed to finally give a tendency. Then this information is analyzed and classified by the fuzzy system, which is optimized in the membership functions and rules by a genetic algorithm (GA) [36,37,38,39,40].
Figure 2 shows the specific general model, we have a database, which consists of 200 patients, the modular neuronal network models and learns the information processed to finally give a tendency to base on that information given. Then this information is analyzed and classified by the FS, which is optimized by GA.

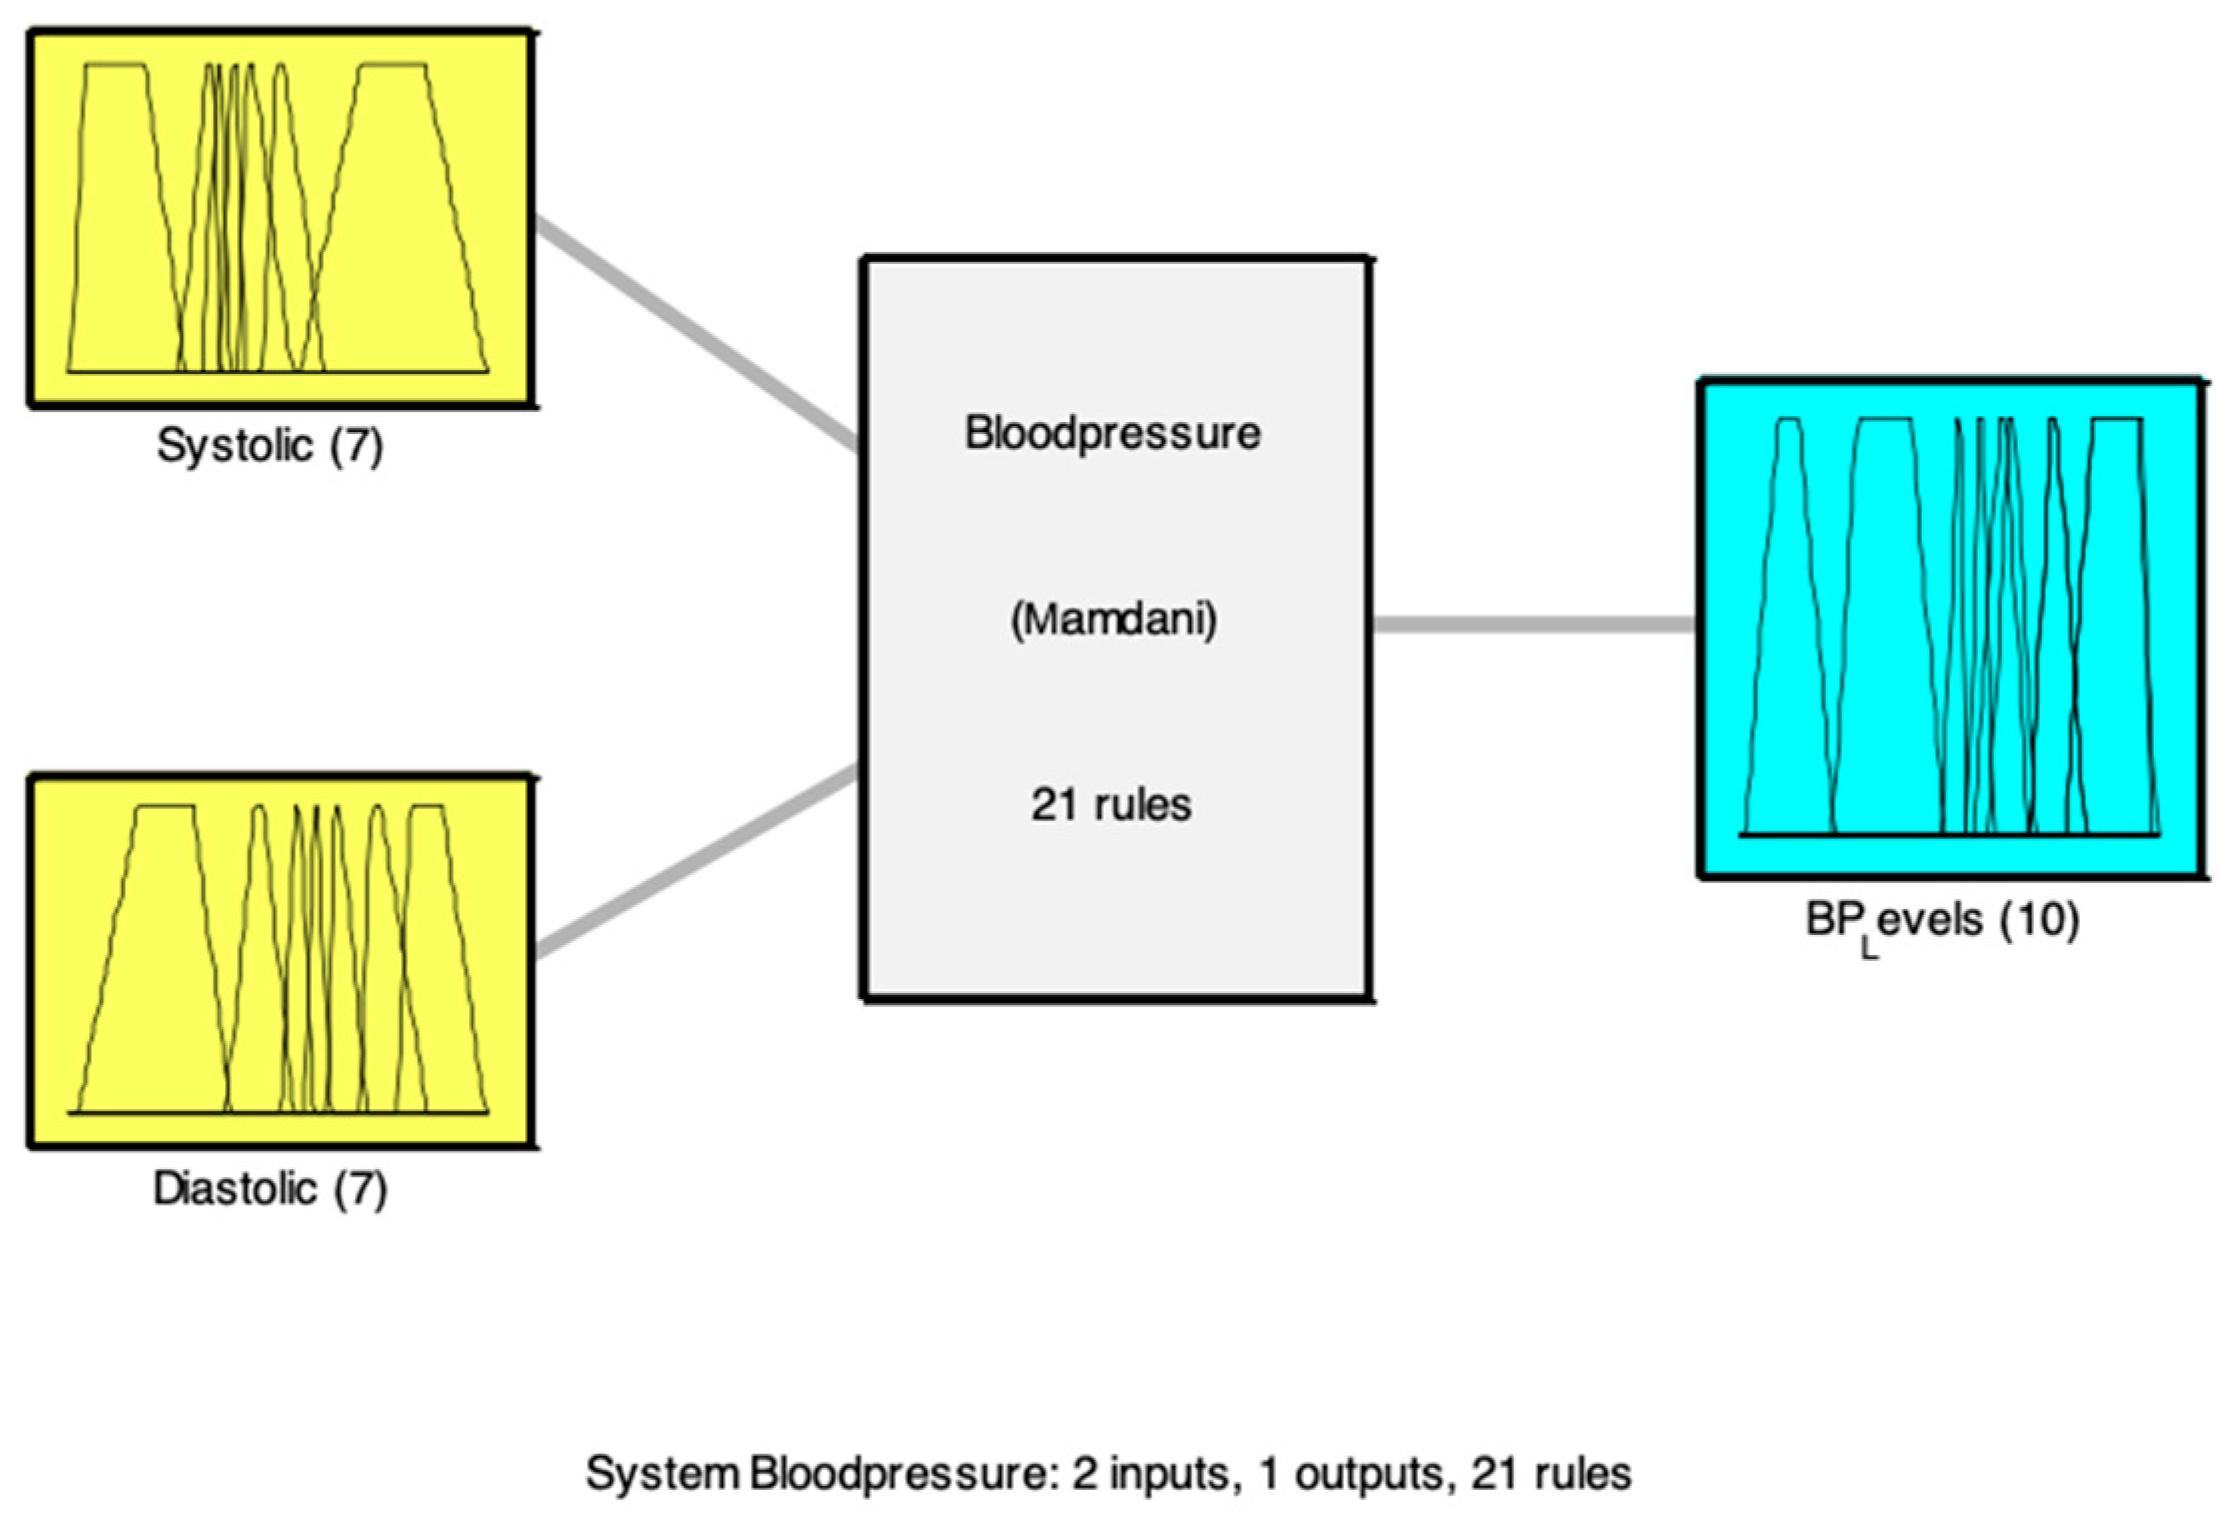
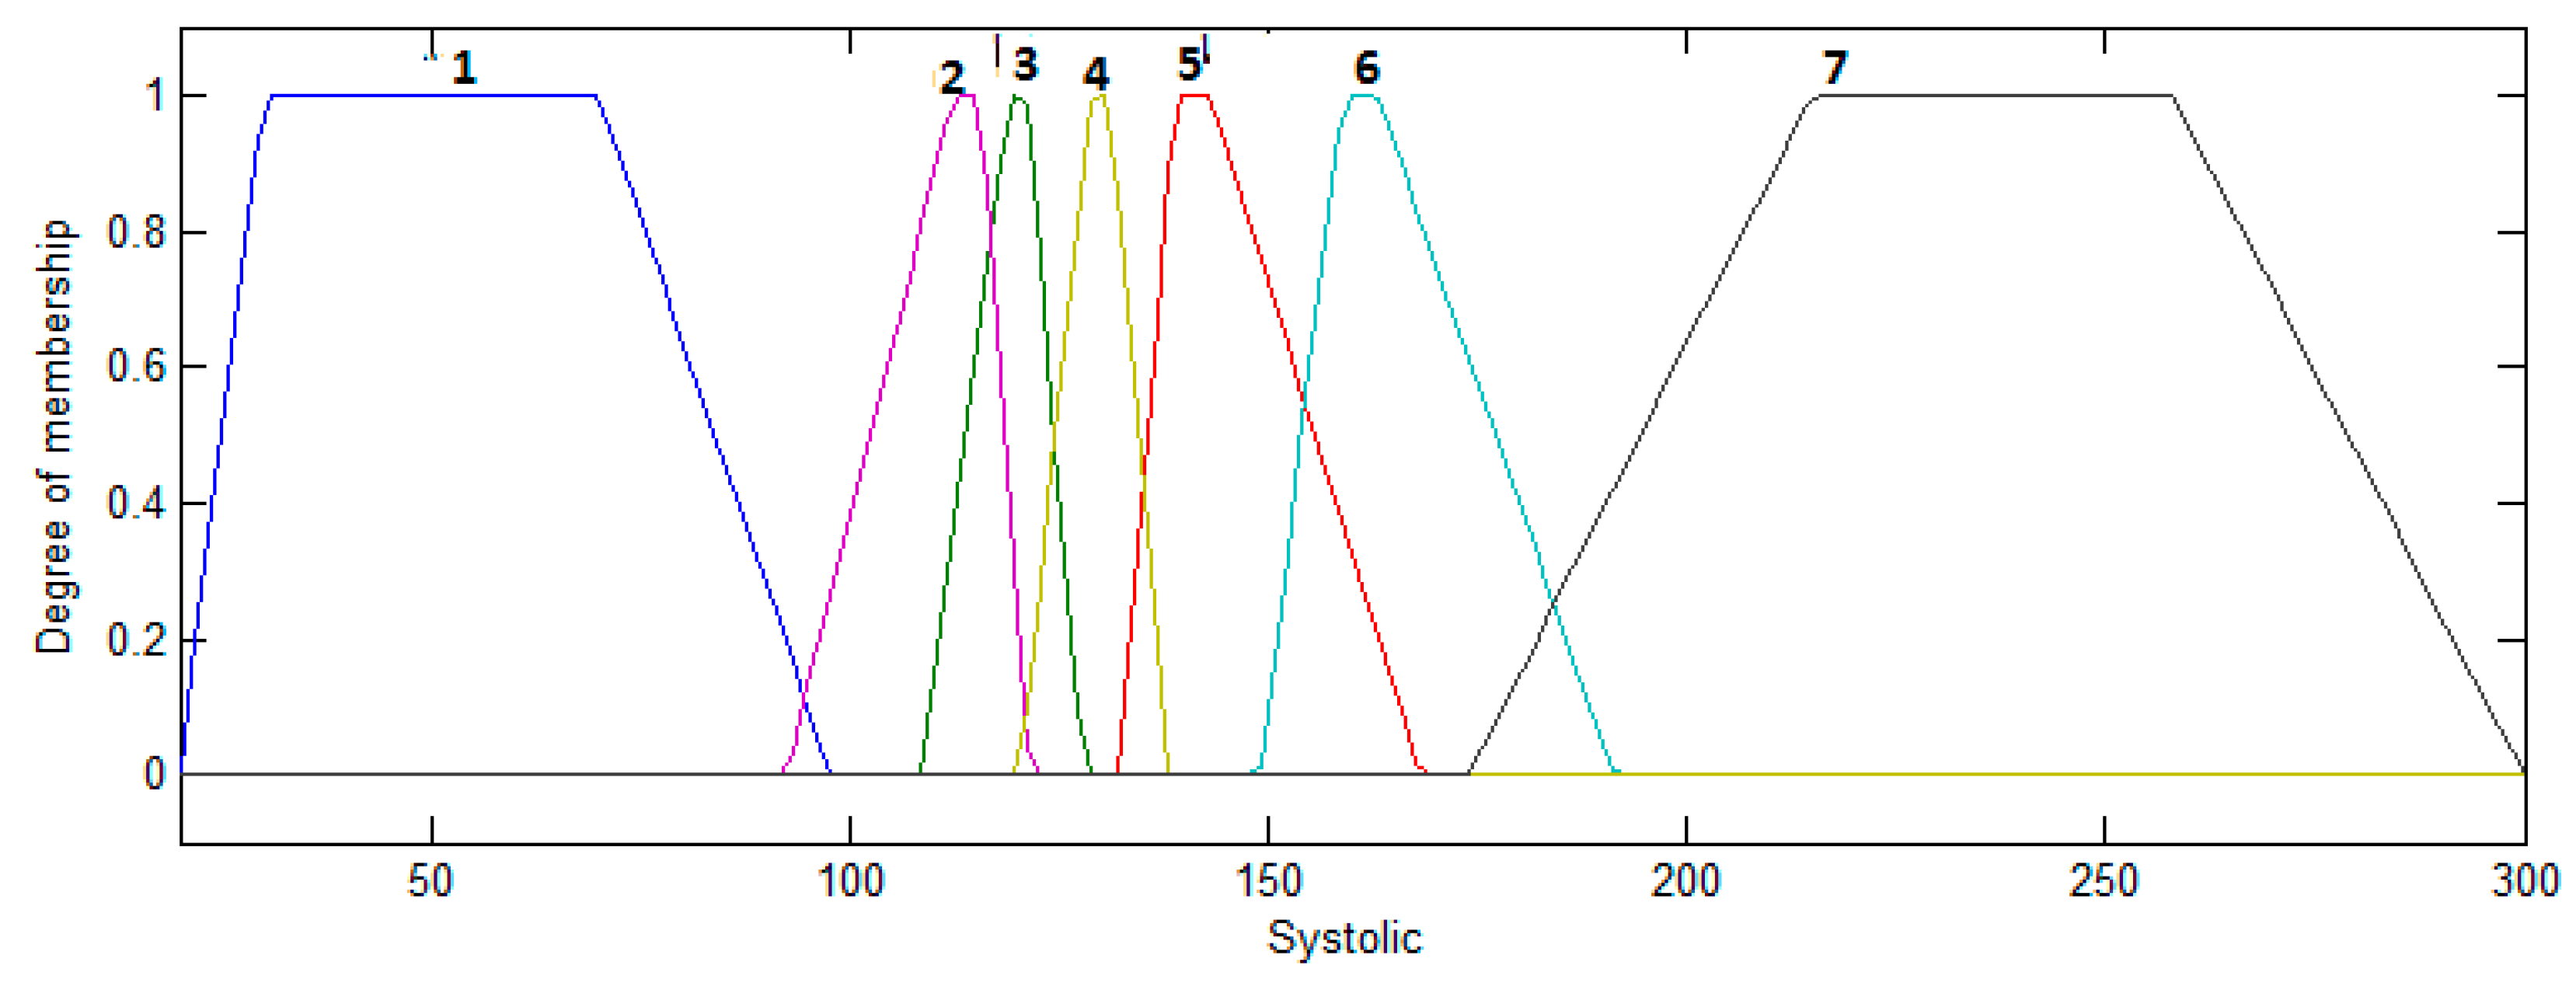
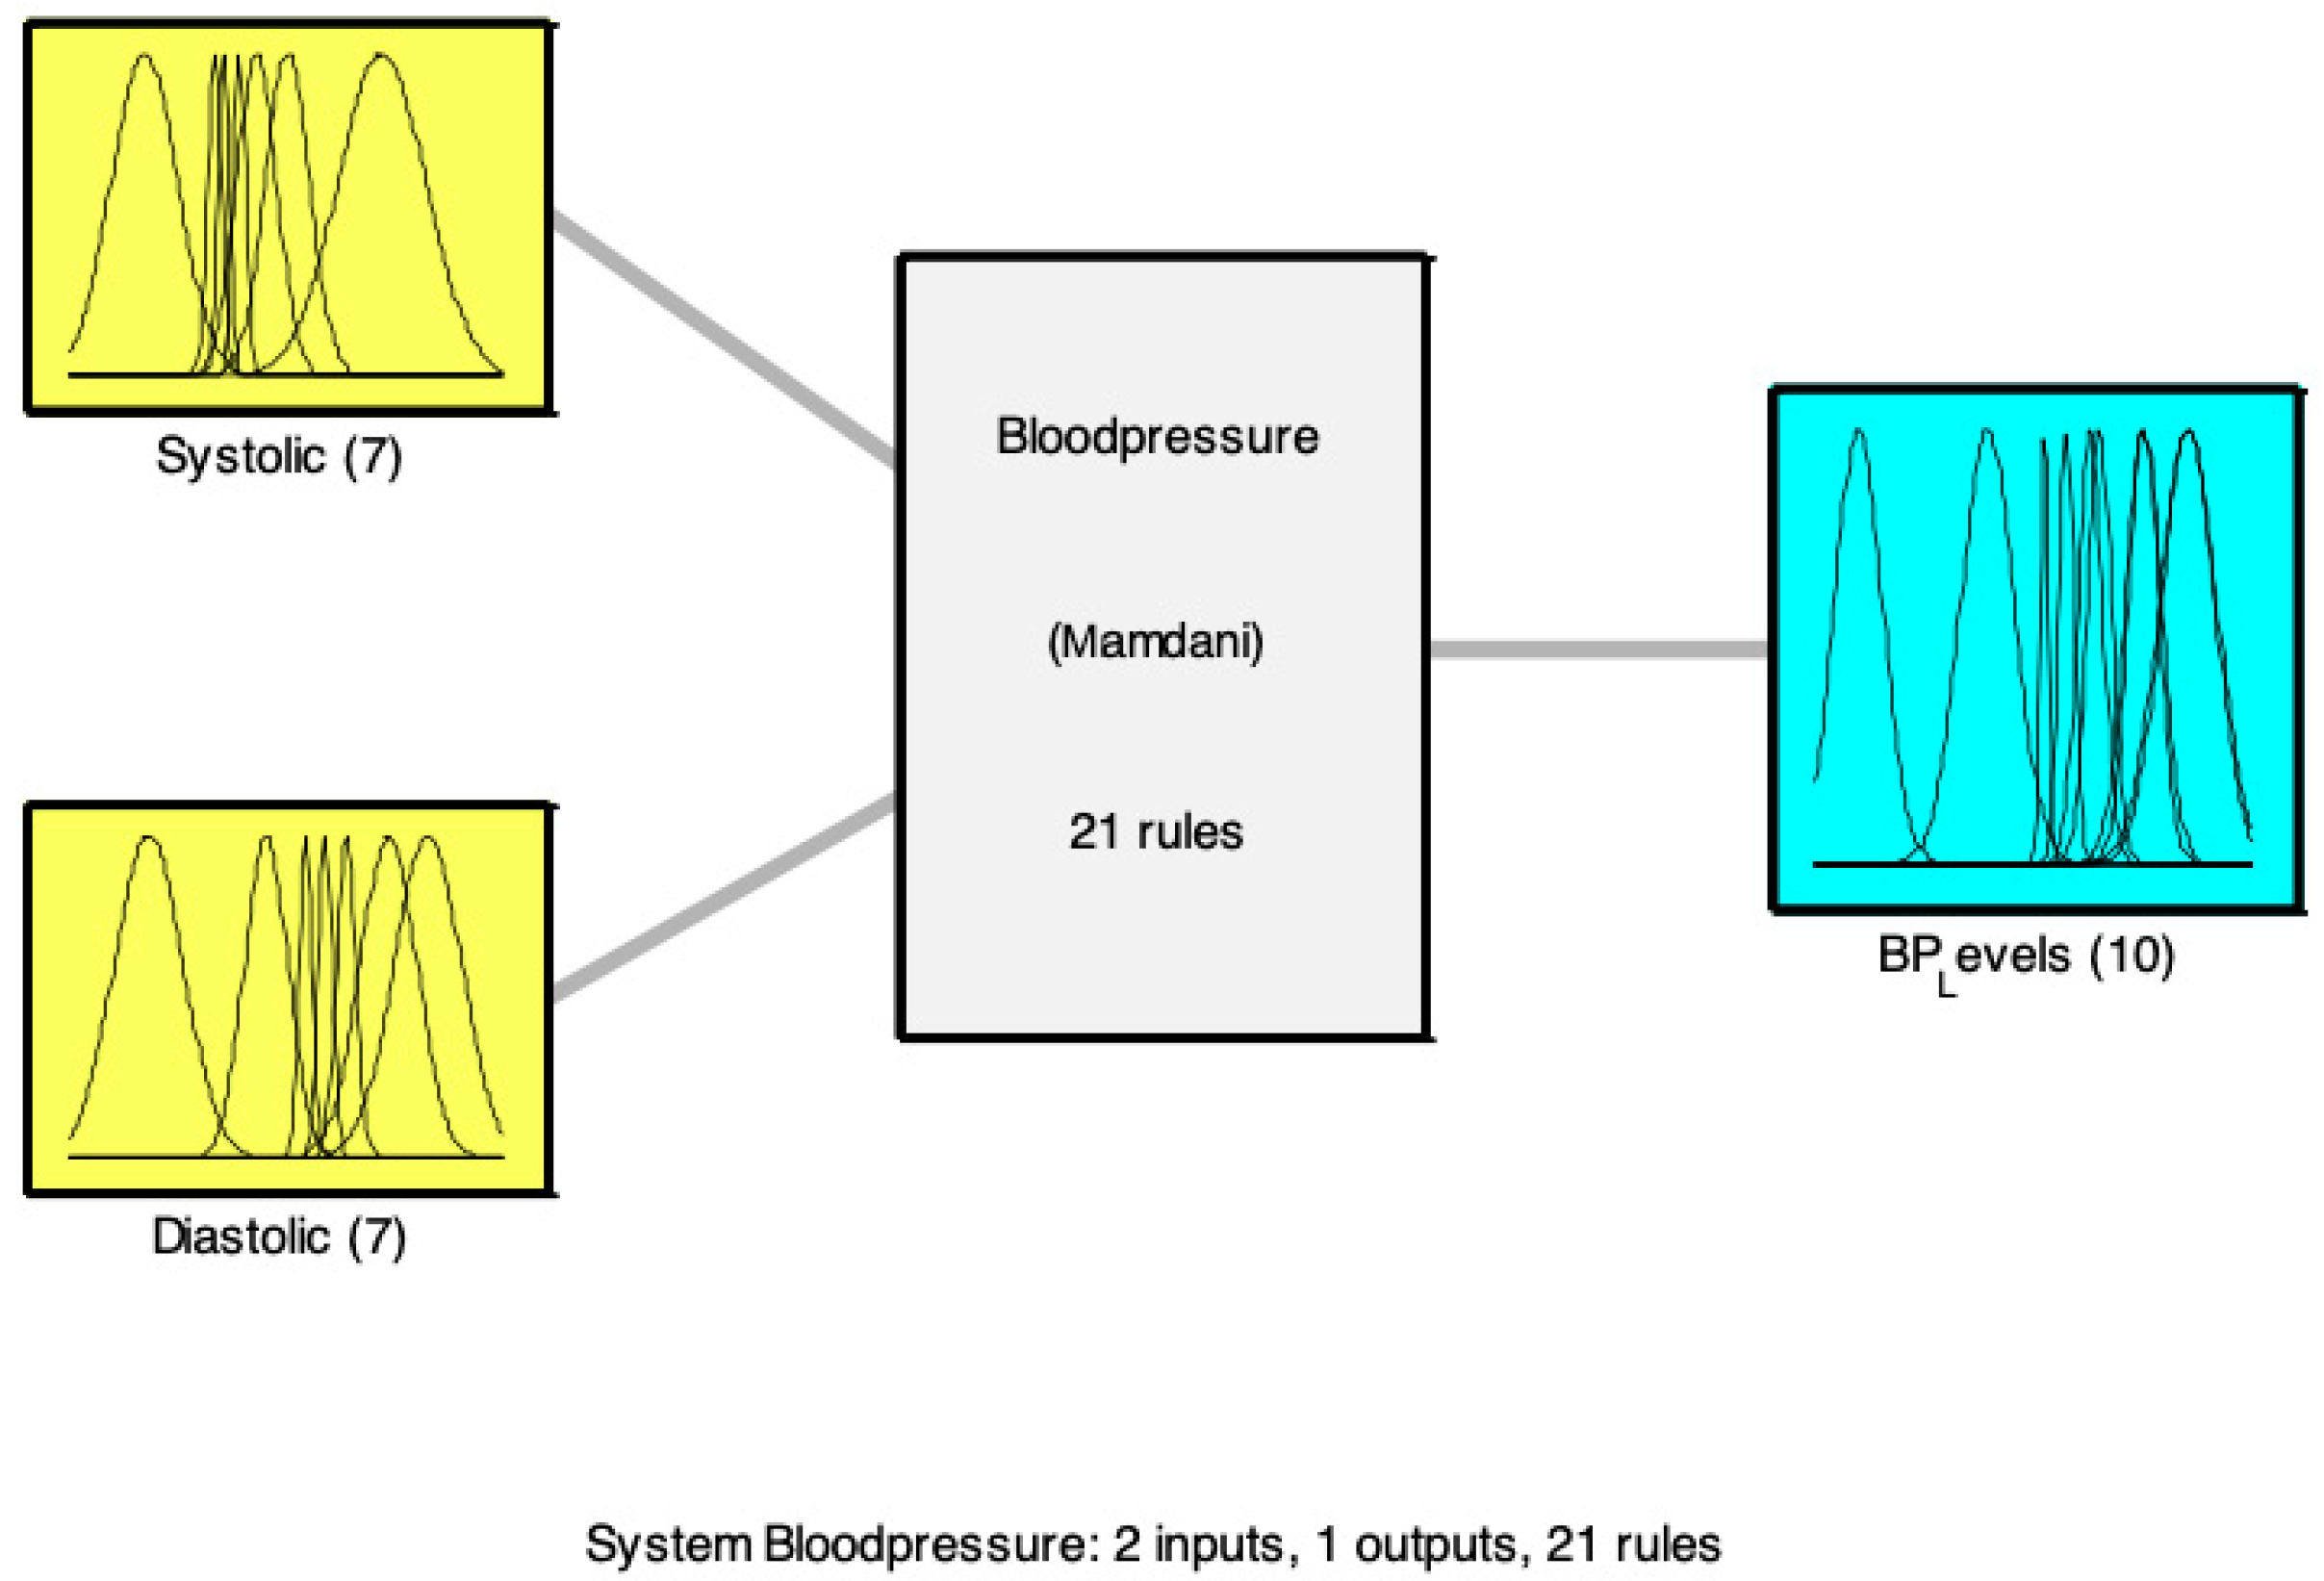
3.1. Design of the Type-1 Fuzzy Systems for Classification with Triangular Membership Functions

The design of this type-1 fuzzy system was made based on previous work where the membership functions and the fuzzy rules are optimized to find the best possible classification architecture, after different experiments were performed it was obtained that the architecture with triangular membership functions produced better results when using type-1 fuzzy systems. The design is similar to works done in other application areas, like in Reference [41].

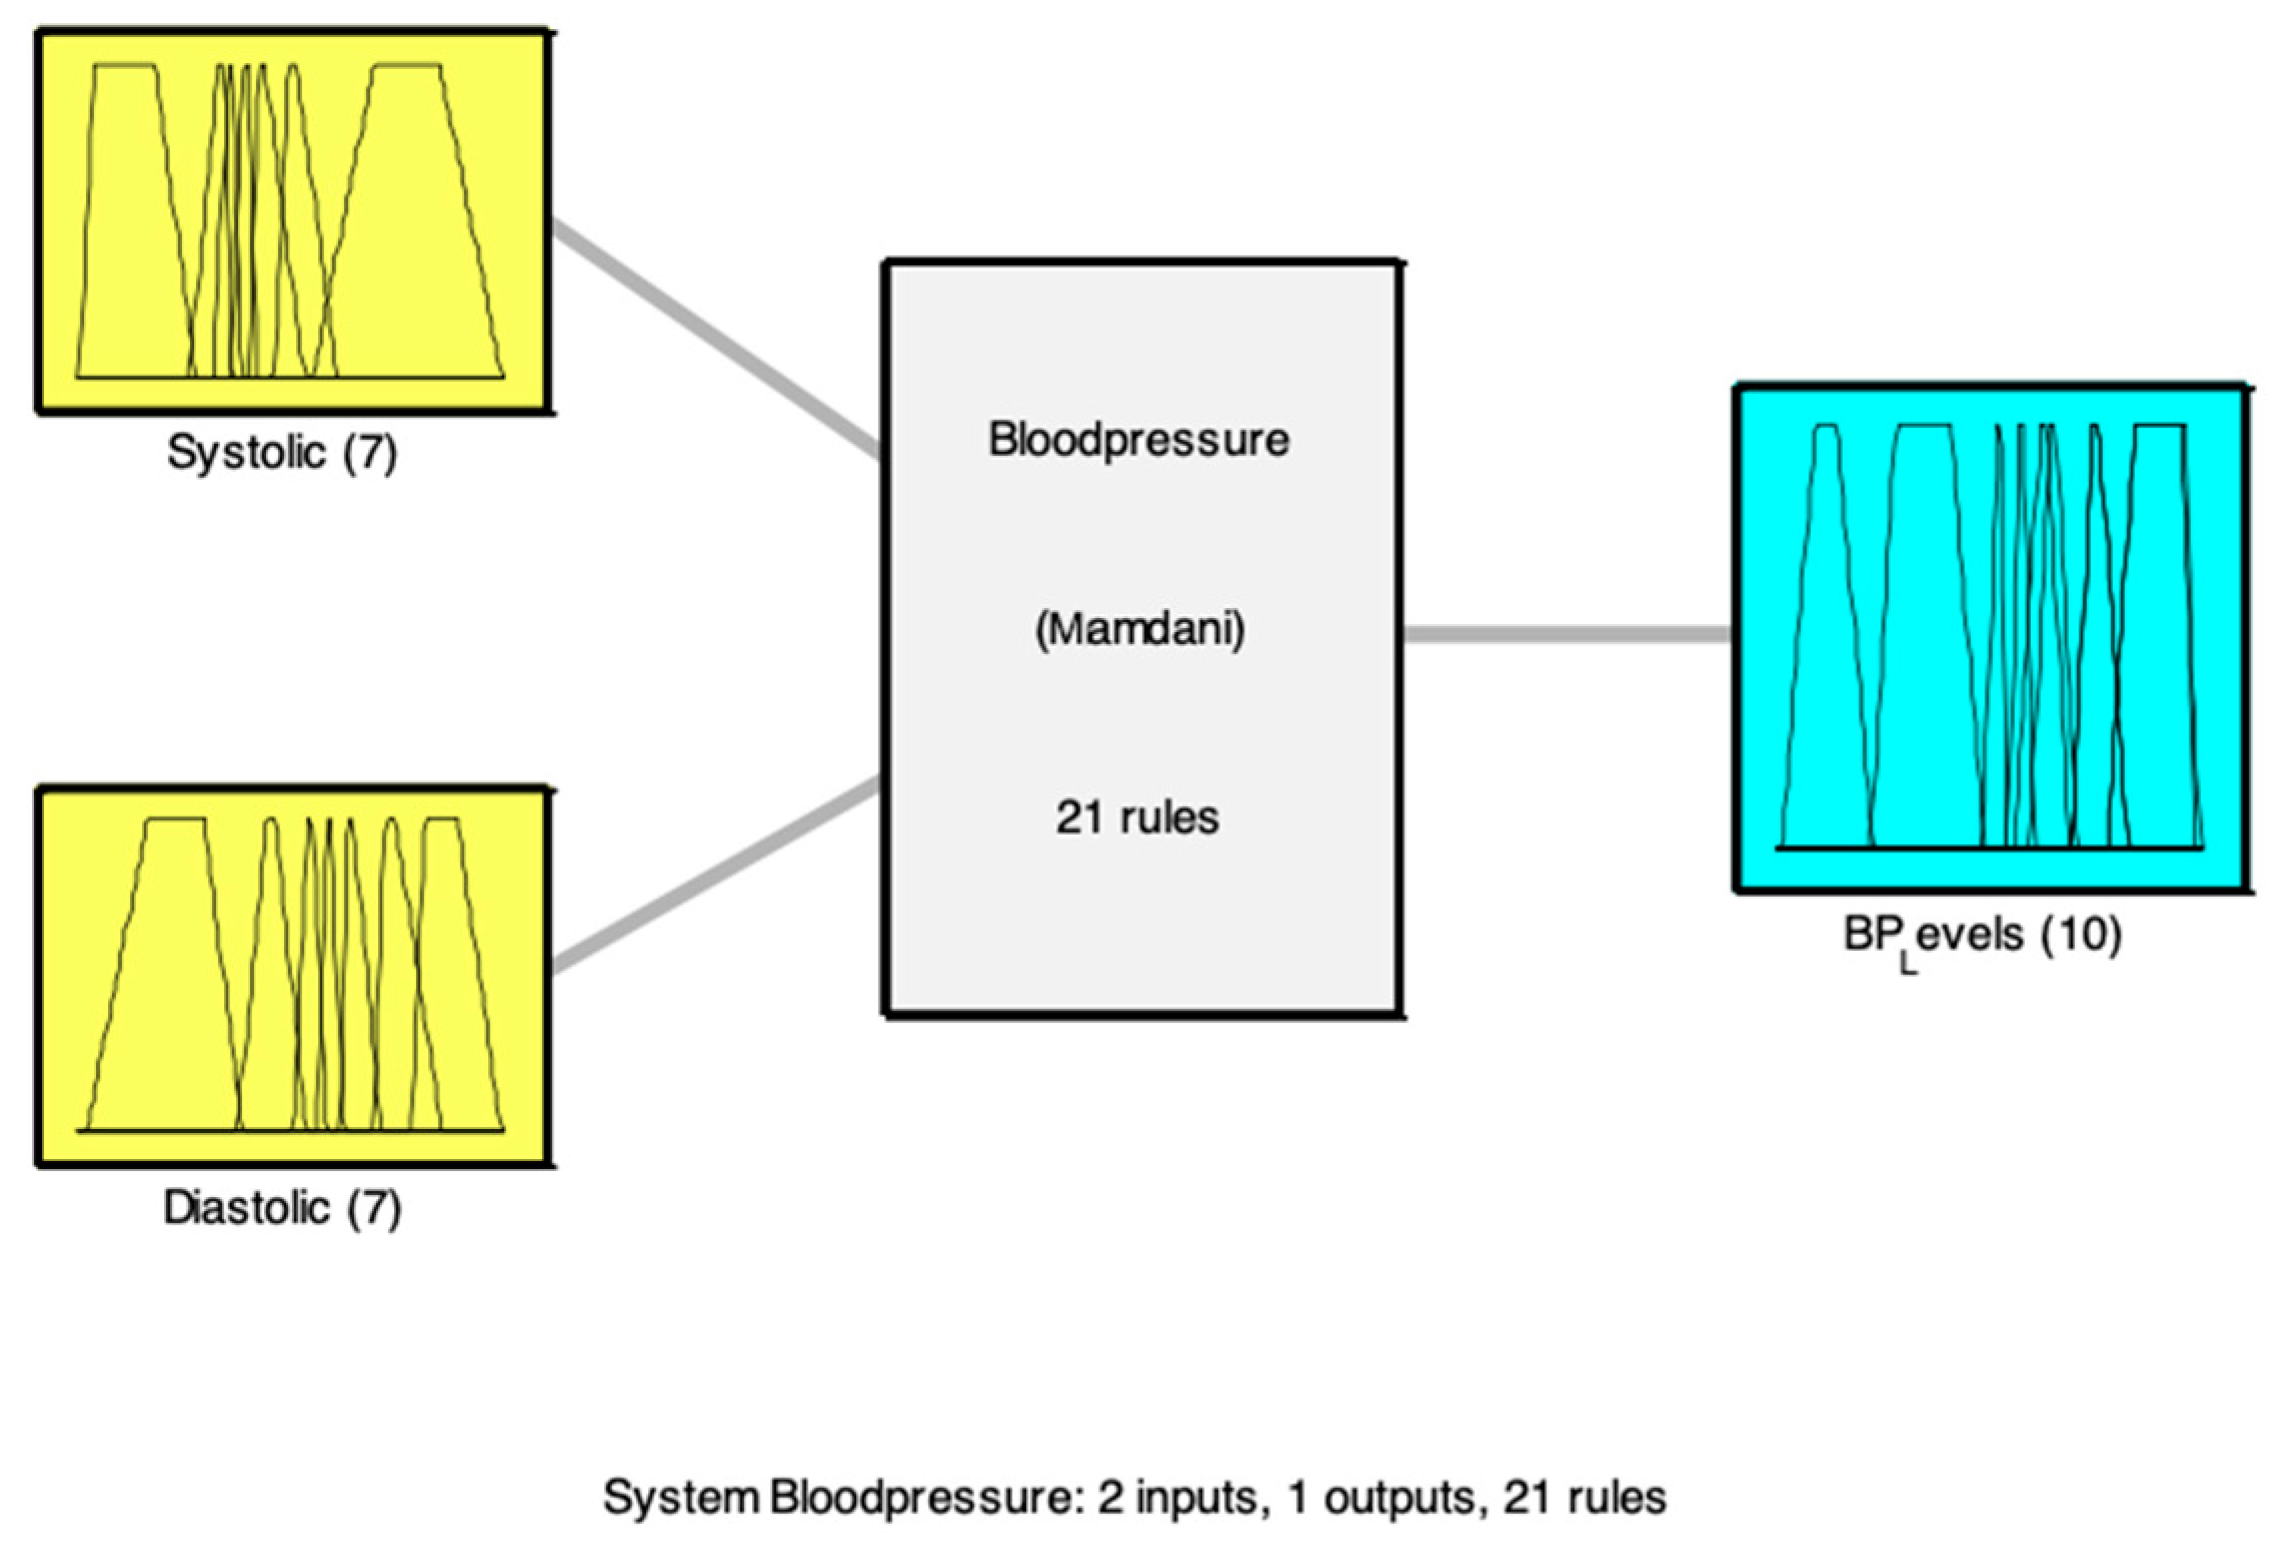
3.2. Design of the Type-1 FS for Classification with Trapezoidal Membership Functions

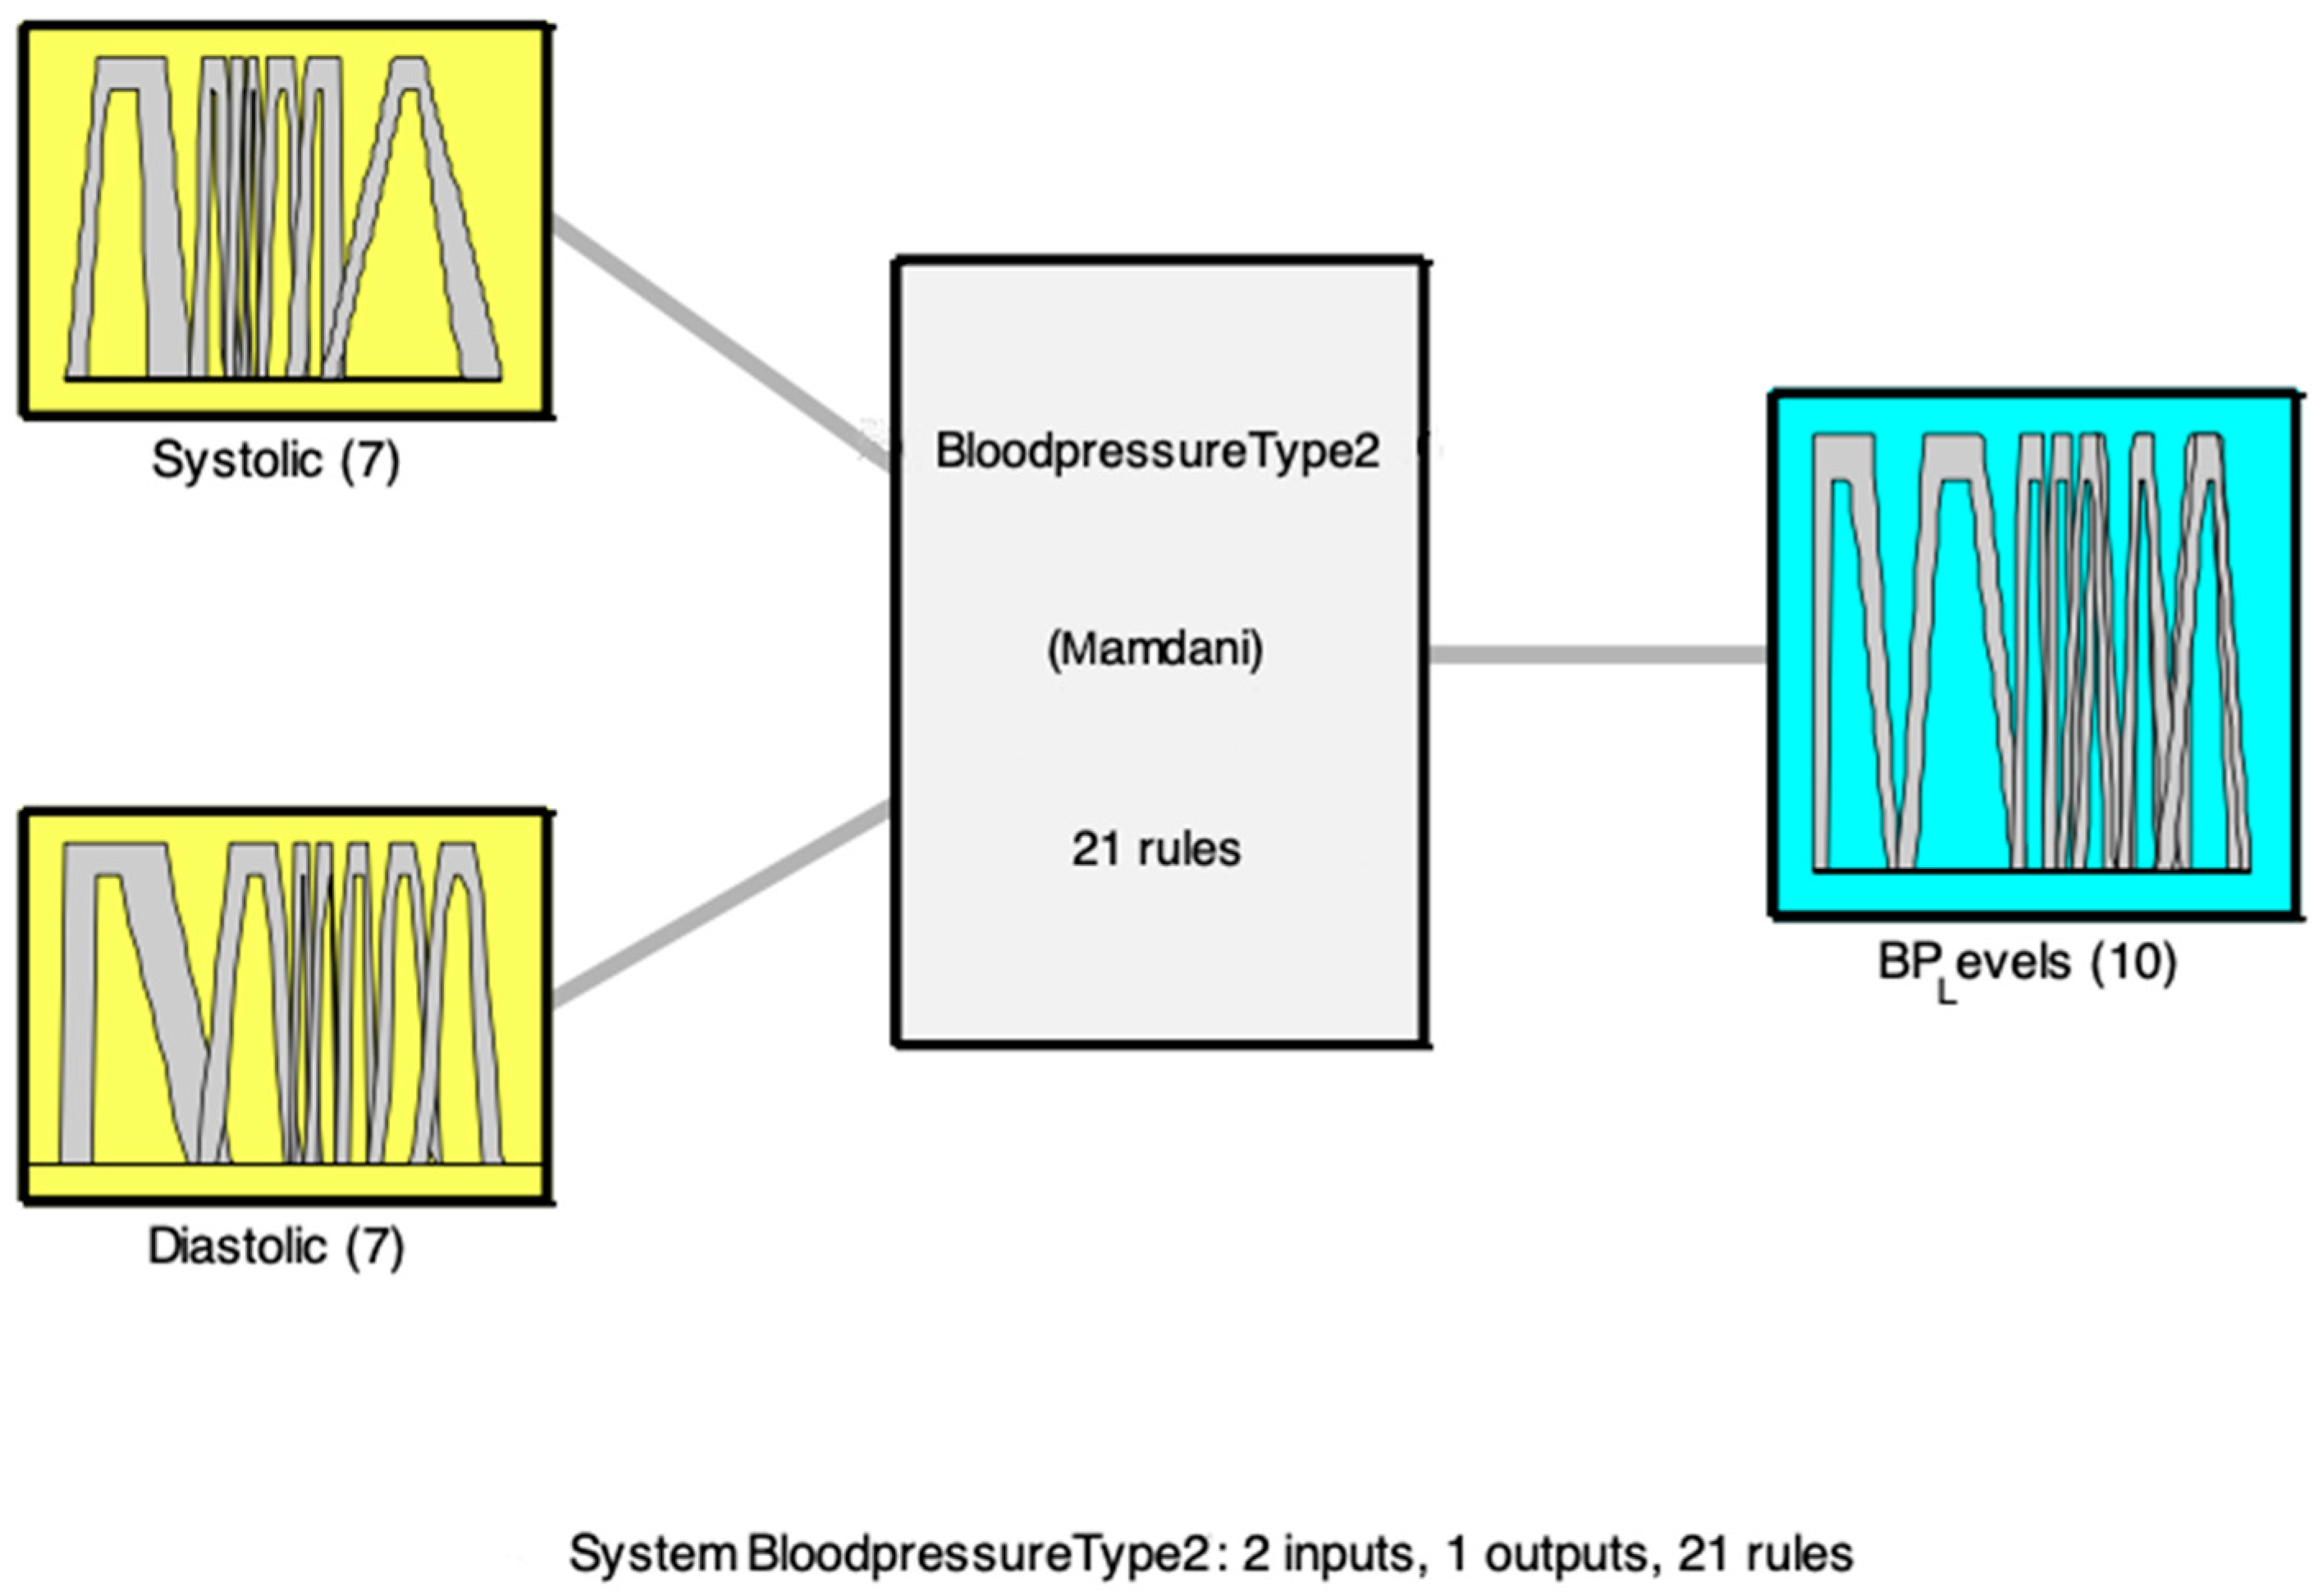
3.2.1. Design of the Second FS for the Classification of BP Levels with Trapezoidal Memberships Functions

The structure of the fuzzy system is shown in Figure 3. The numbers marked in the Figure 4 list each of the MFs for the input systolic and these are: 1—Low, 2—Low_Normal, 3—Normal, 4—High_Normal, 5—High, 6—Very_High, 7—Too_High.
The numbers marked in the Figure 5 list each of the membership functions for the input diastolic and these are: 1—Low, 2—Low_Normal, 3—Normal, 4—High_Normal, 5—High, 6—Very_High, 7—Too_High.
The numbers marked in the Figure 6 list each of the membership functions for the output BP_Levels and these are: 1—Hypotension, 2—Optimal, 3—Normal, 4—High_Normal, 5—ISHGRADE_1, 6—Grade_1, 7—ISHGRADE_2, 8—Grade_2, 9—ISHGRADE_3, 10—Grade_3.

3.2.2. Genetic Type-1 Fuzzy System with Trapezoidal Membership Functions

The fuzzy system(FS) was optimized with GA, in the GA it is necessary a chromosome to optimize the (MFs), as shown in Figure 7 and the chromosome has 96 genes and this help to optimize the MFs, Genes 1–28 (real numbers) allow to manage the parameters of the systolic input, Genes 29–56 (real numbers) allow to manage the parameters of the diastolic input and Genes 57–96 (real numbers) allow to manage the parameters of the BP_Levels output. The following Figure 7 shows the structure of the chromosome:

3.2.3. Design of the Optimized Type-1 FS for Classification with Trapezoidal Membership Functions

The structure of the optimized type-1 fuzzy system is shown in Figure 8. The numbers marked in the Figure 9 list each of the membership functions for the input systolic and these are: 1—Low, 2—Low_Normal, 3—Normal, 4—High_Normal, 5—High, 6—Very_High, 7—Too_High.
The numbers marked in the Figure 10 list each of the membership functions for the input diastolic and these are: 1—Low, 2—Low_Normal, 3—Normal, 4—High_Normal, 5—High, 6—Very_High, 7—Too_High.
The numbers marked in the Figure 11 list each of the membership functions for the output BP_Levels and these are: 1—Hypotension, 2—Optimal, 3—Normal, 4—High_Normal, 5—ISHGRADE_1, 6—Grade_1, 7—ISHGRADE_2, 8—Grade_2, 9—ISHGRADE_3, 10—Grade_3.

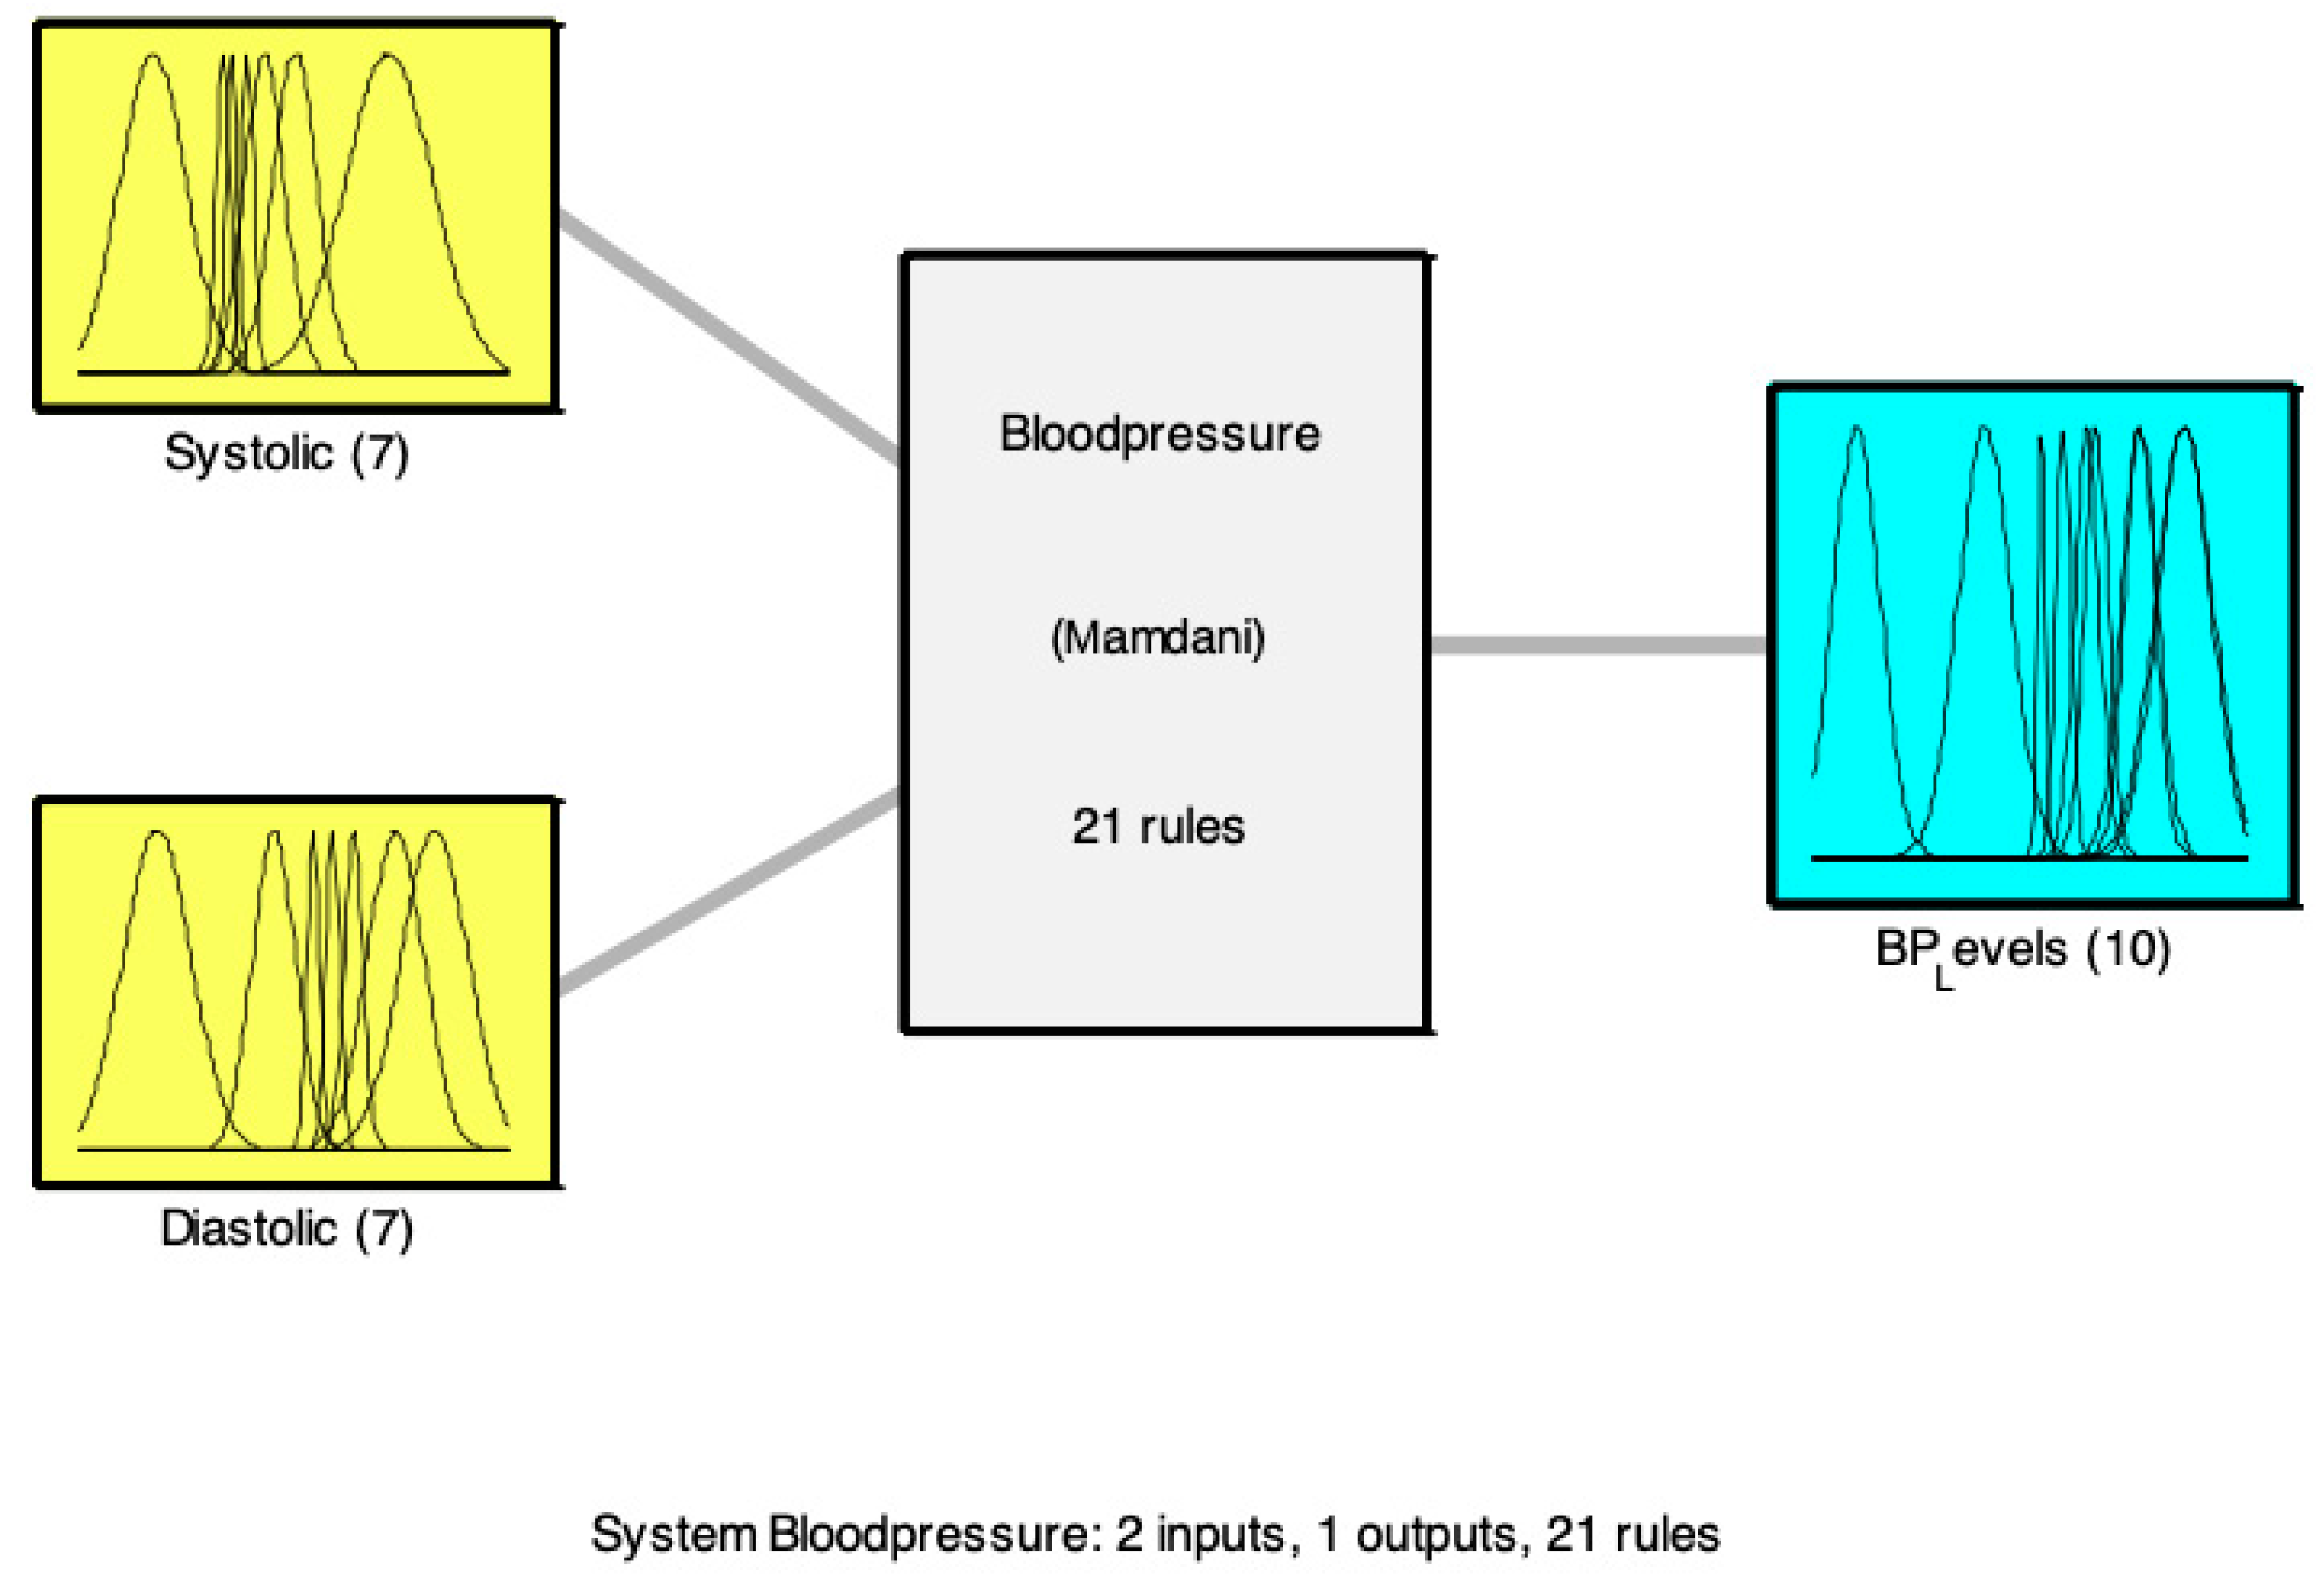
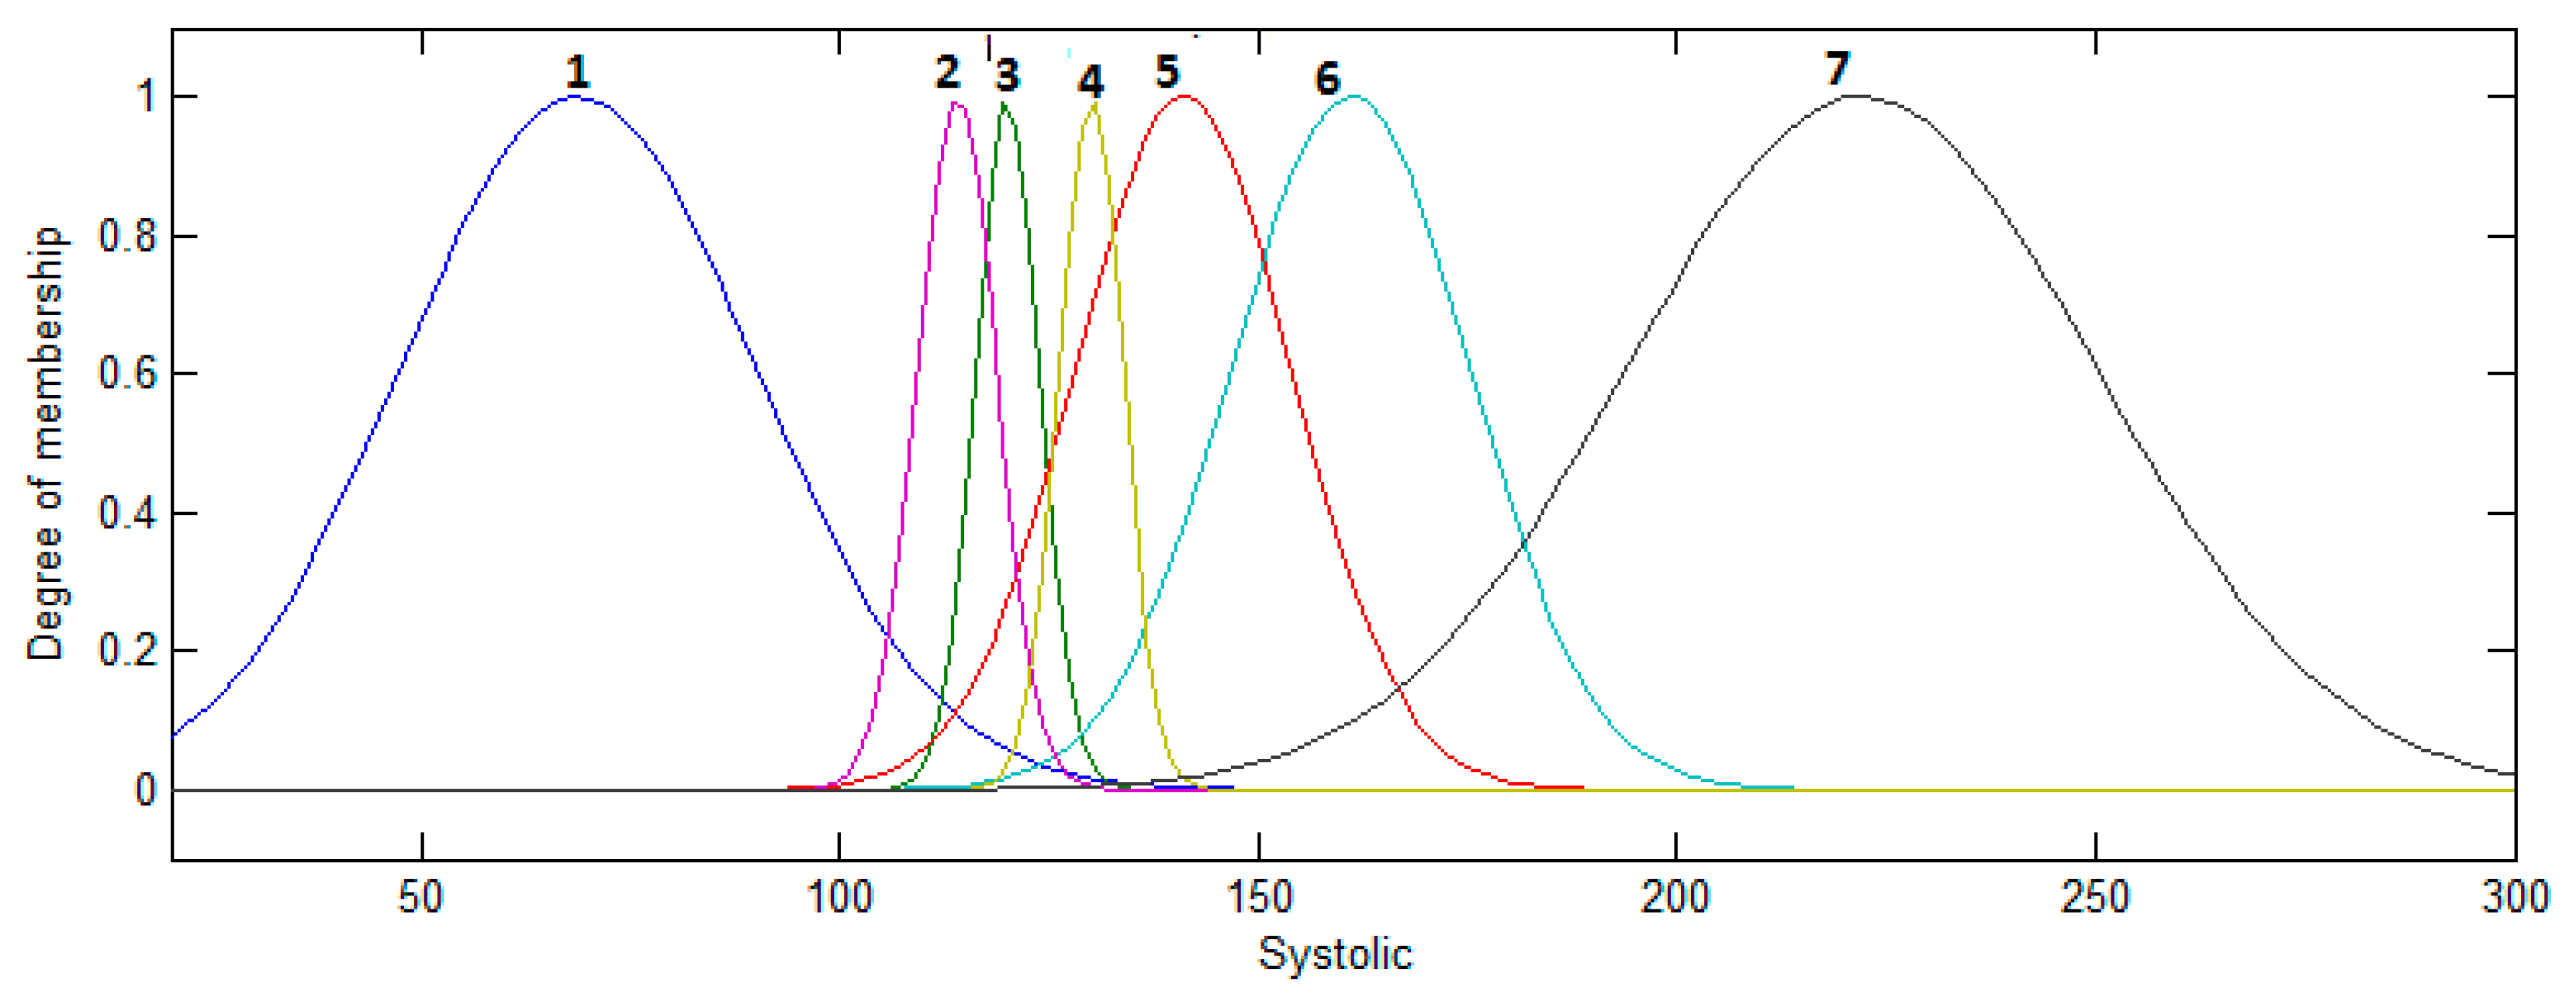
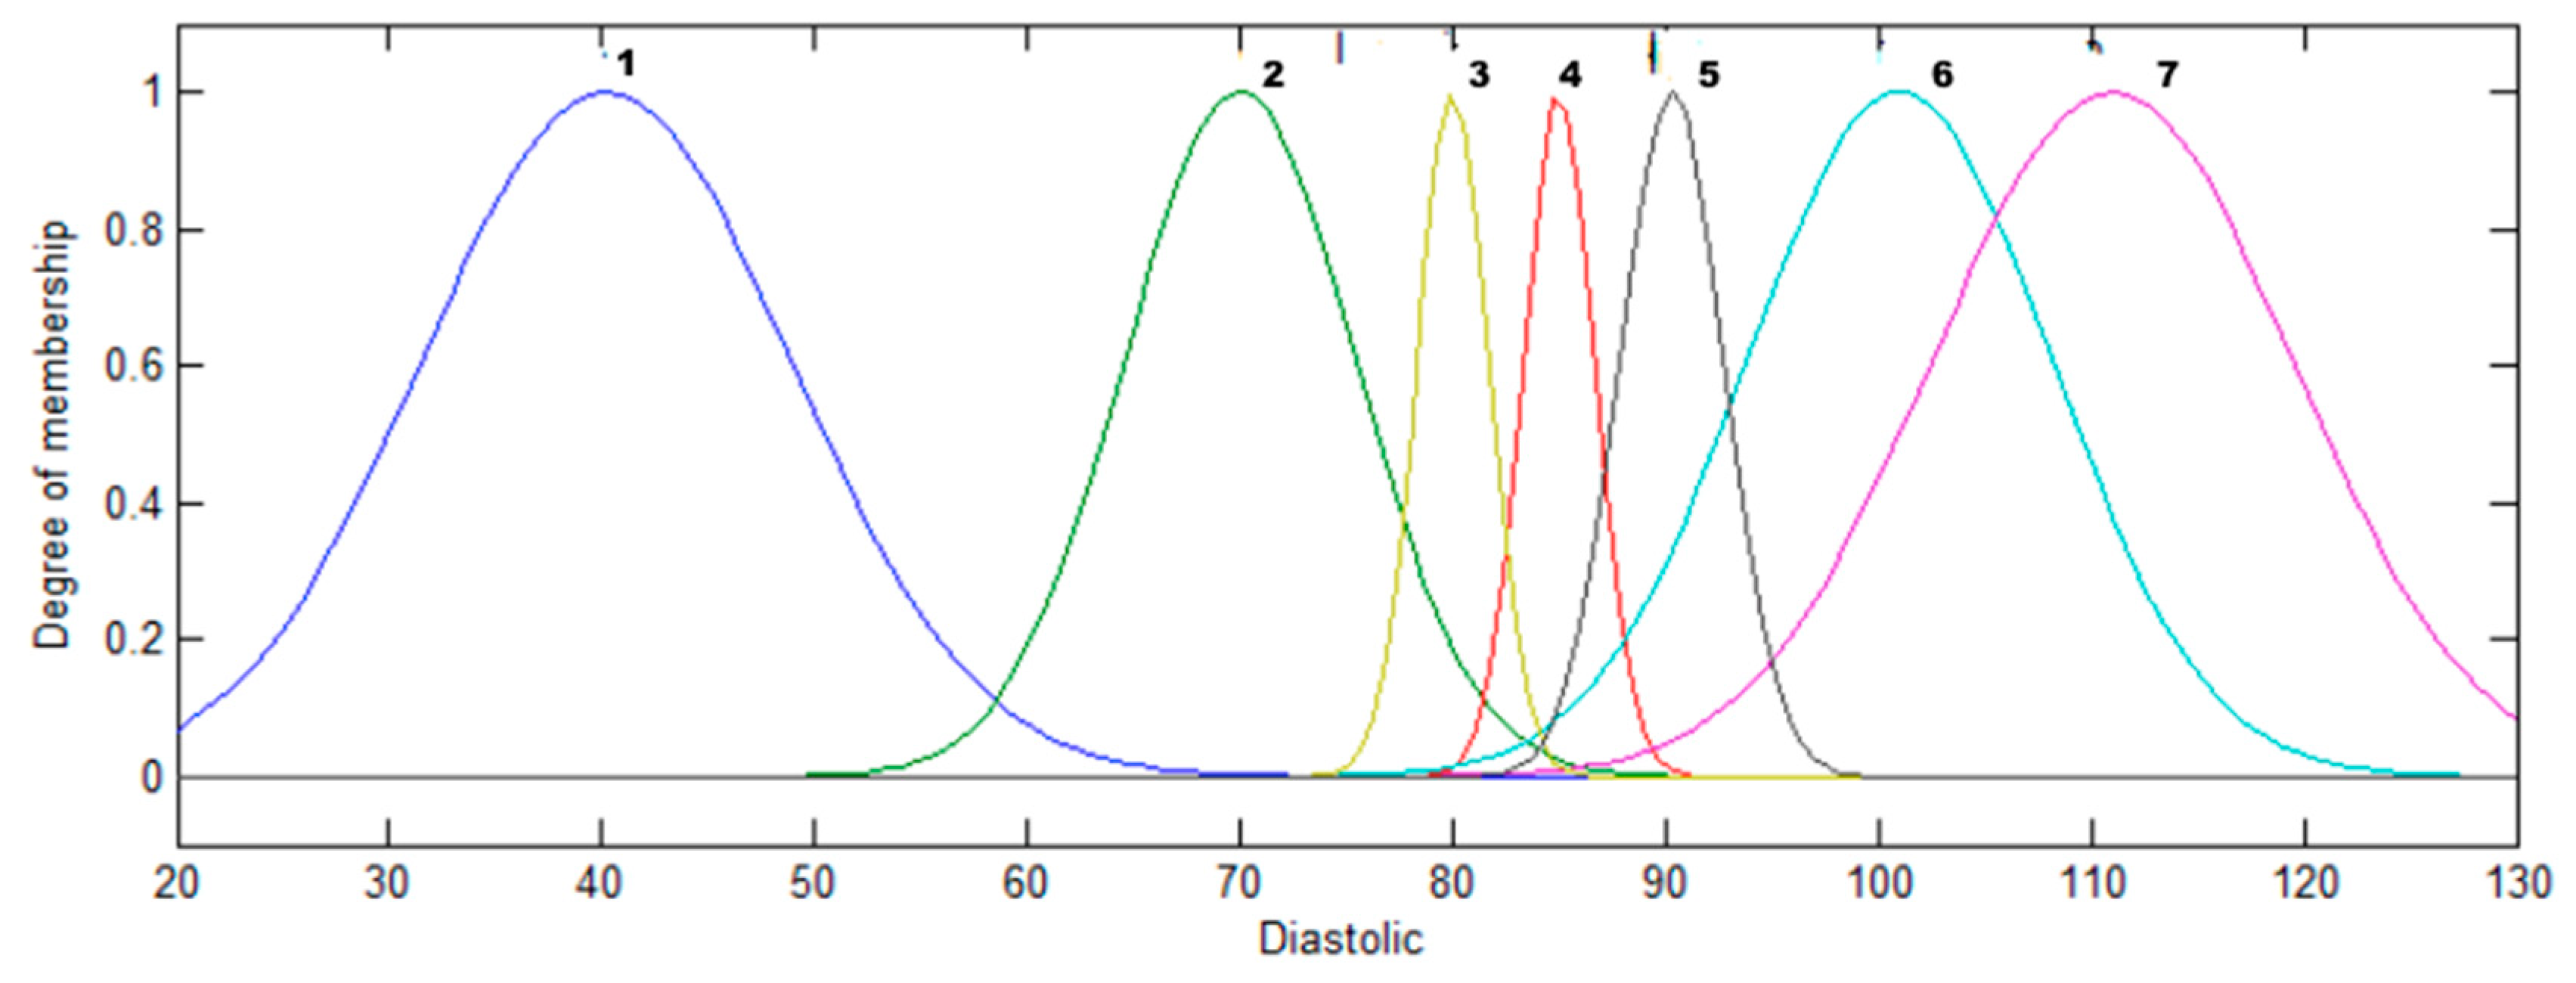
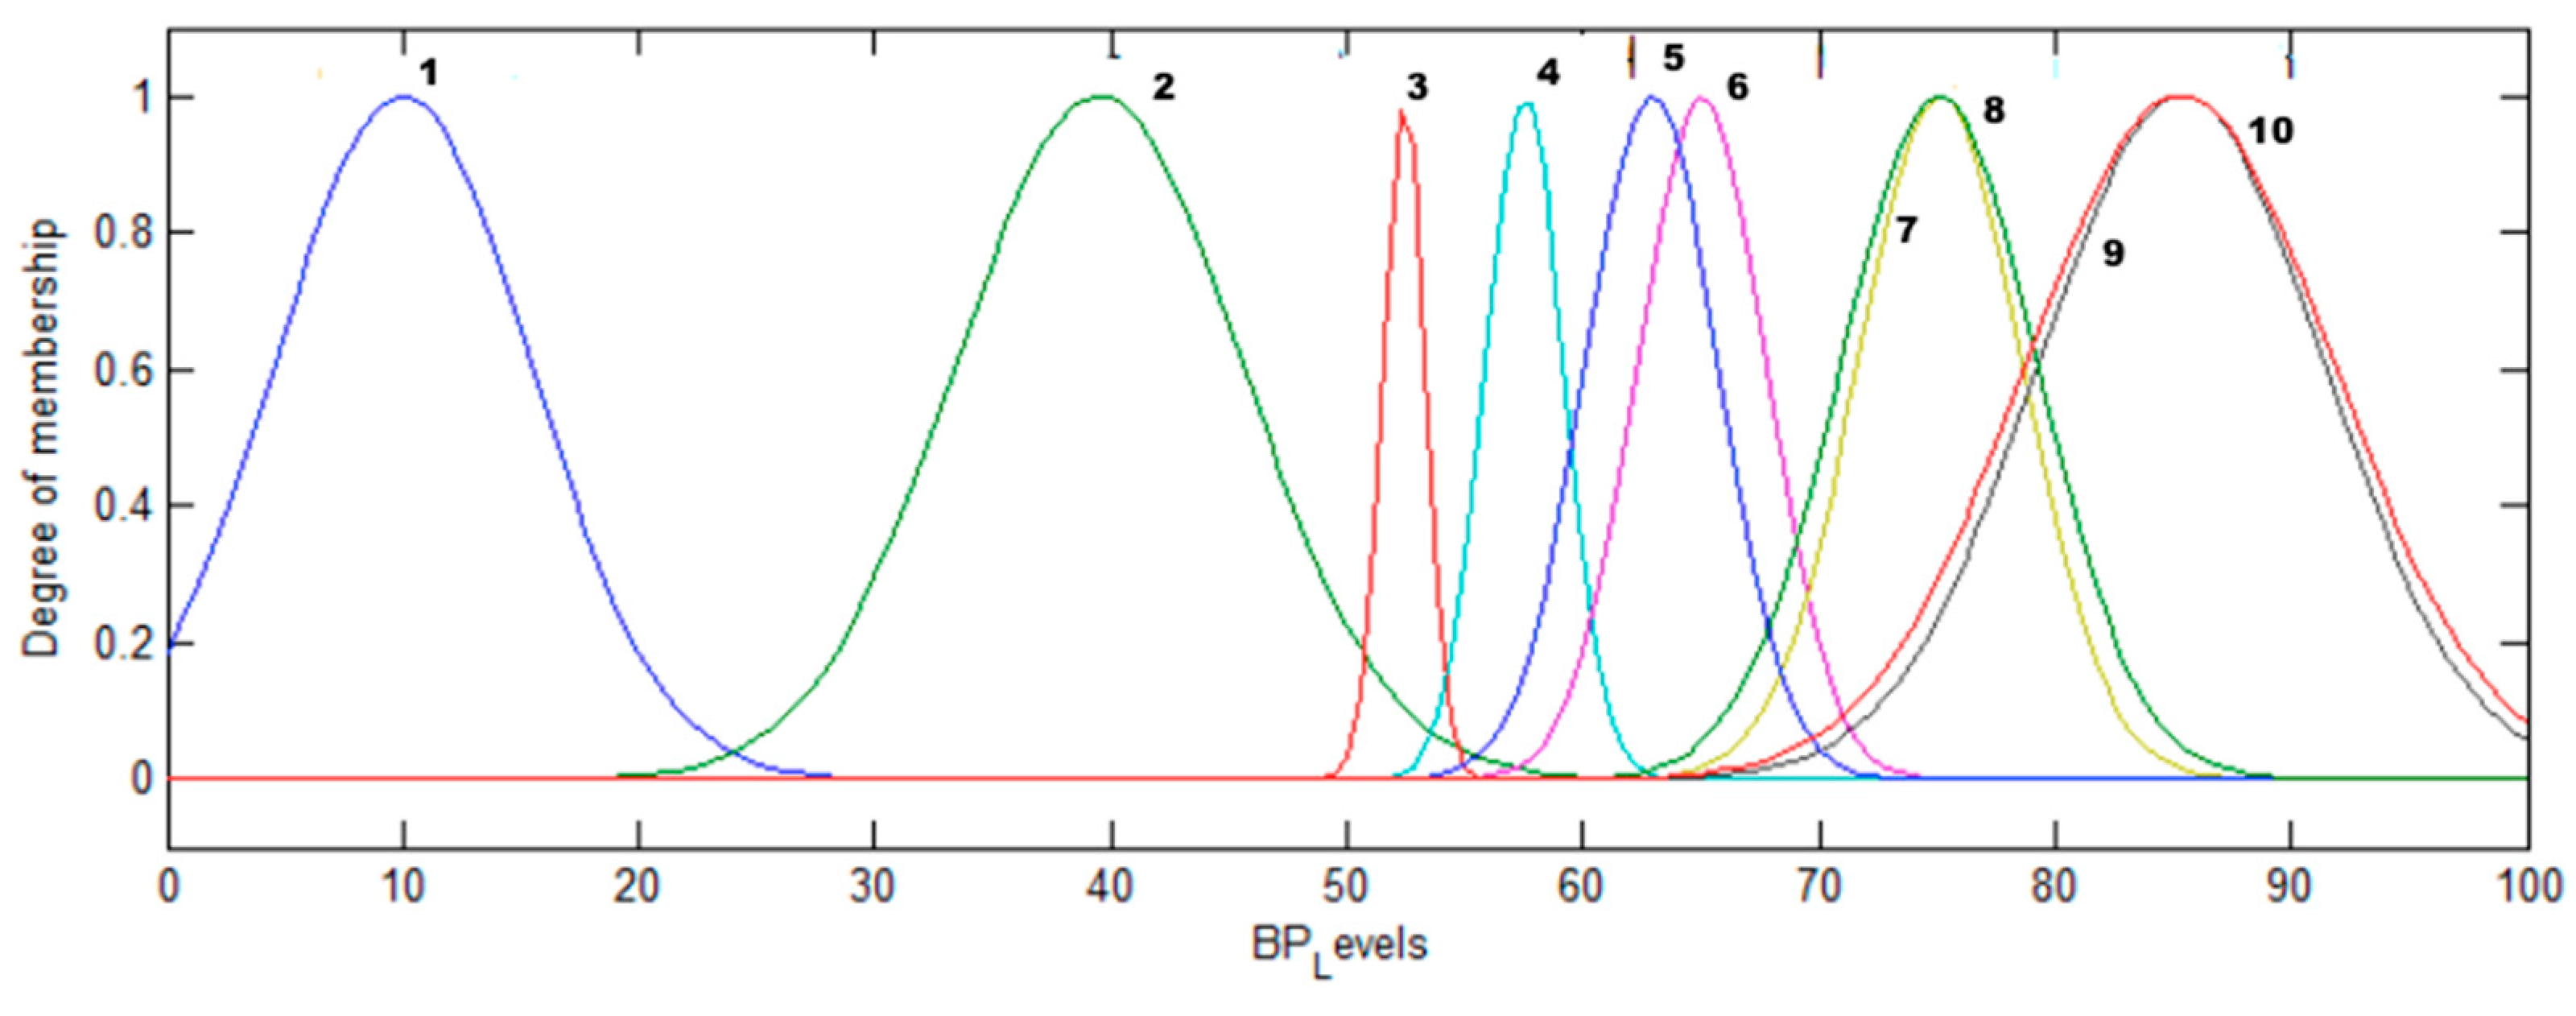
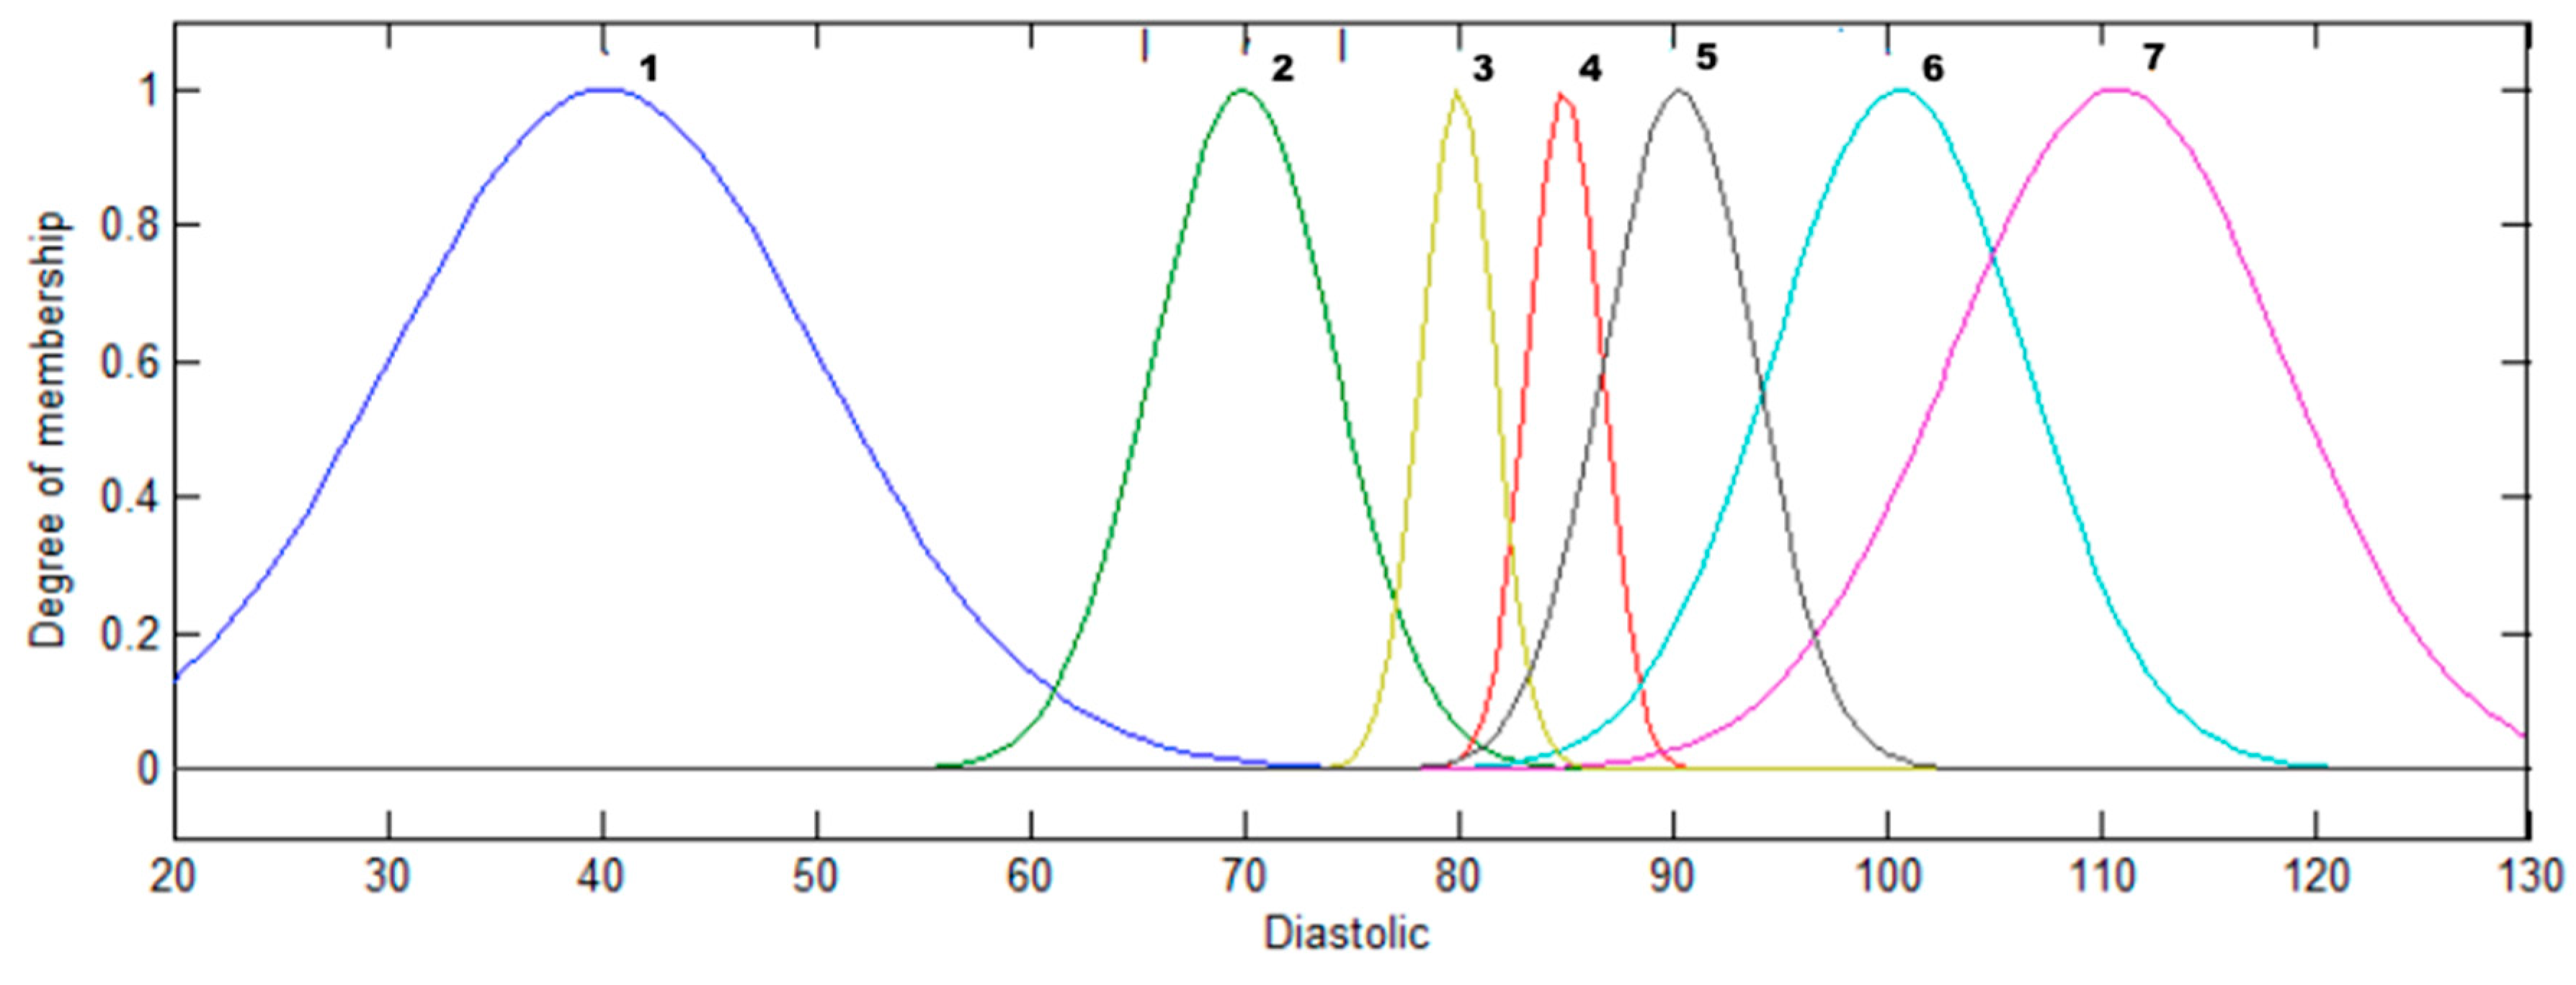
3.3. Design of the Type-1 FS for Classification with Gaussian Membership Functions

3.3.1. Design of the third FS for the Classification of BP Levels with Gaussian Membership Functions

The structure of the fuzzy system is shown in Figure 12. The numbers marked in the Figure 13 list each of the membership functions for the input systolic and these are: 1—Low, 2—Low_Normal, 3—Normal, 4—High_Normal, 5—High, 6—Very_High, 7—Too_High.
The numbers marked in the Figure 14 list each of the membership functions for the input diastolic and these are: 1—Low, 2—Low_Normal, 3—Normal, 4—High_Normal, 5—High, 6—Very_High, 7—Too_High.
The numbers marked in the Figure 15 list each of the membership functions for the output BP_Levels and these are: 1—Hypotension, 2—Optimal, 3—Normal, 4—High_Normal, 5—ISHGRADE_1, 6—Grade_1, 7—ISHGRADE_2, 8—Grade_2, 9—ISHGRADE_3, 10—Grade_3.

3.3.2. Genetic Type-1 Fuzzy System with Gaussian Membership Functions

The fuzzy system was optimized with GA, in the GA it is necessary a chromosome to optimize the membership functions (MFS), as shown in Figure 16 and the chromosome has 42 genes and this information help to optimize the membership functions, Genes 1–14 (real numbers) allow to manage the parameters of the systolic input, Genes 15–28 (real numbers) allow to manage the parameters of the diastolic input and Genes 29–42 (real numbers) allow to manage the parameters of the BP_Levels output. The following Figure 16 shows the structure of the chromosome:

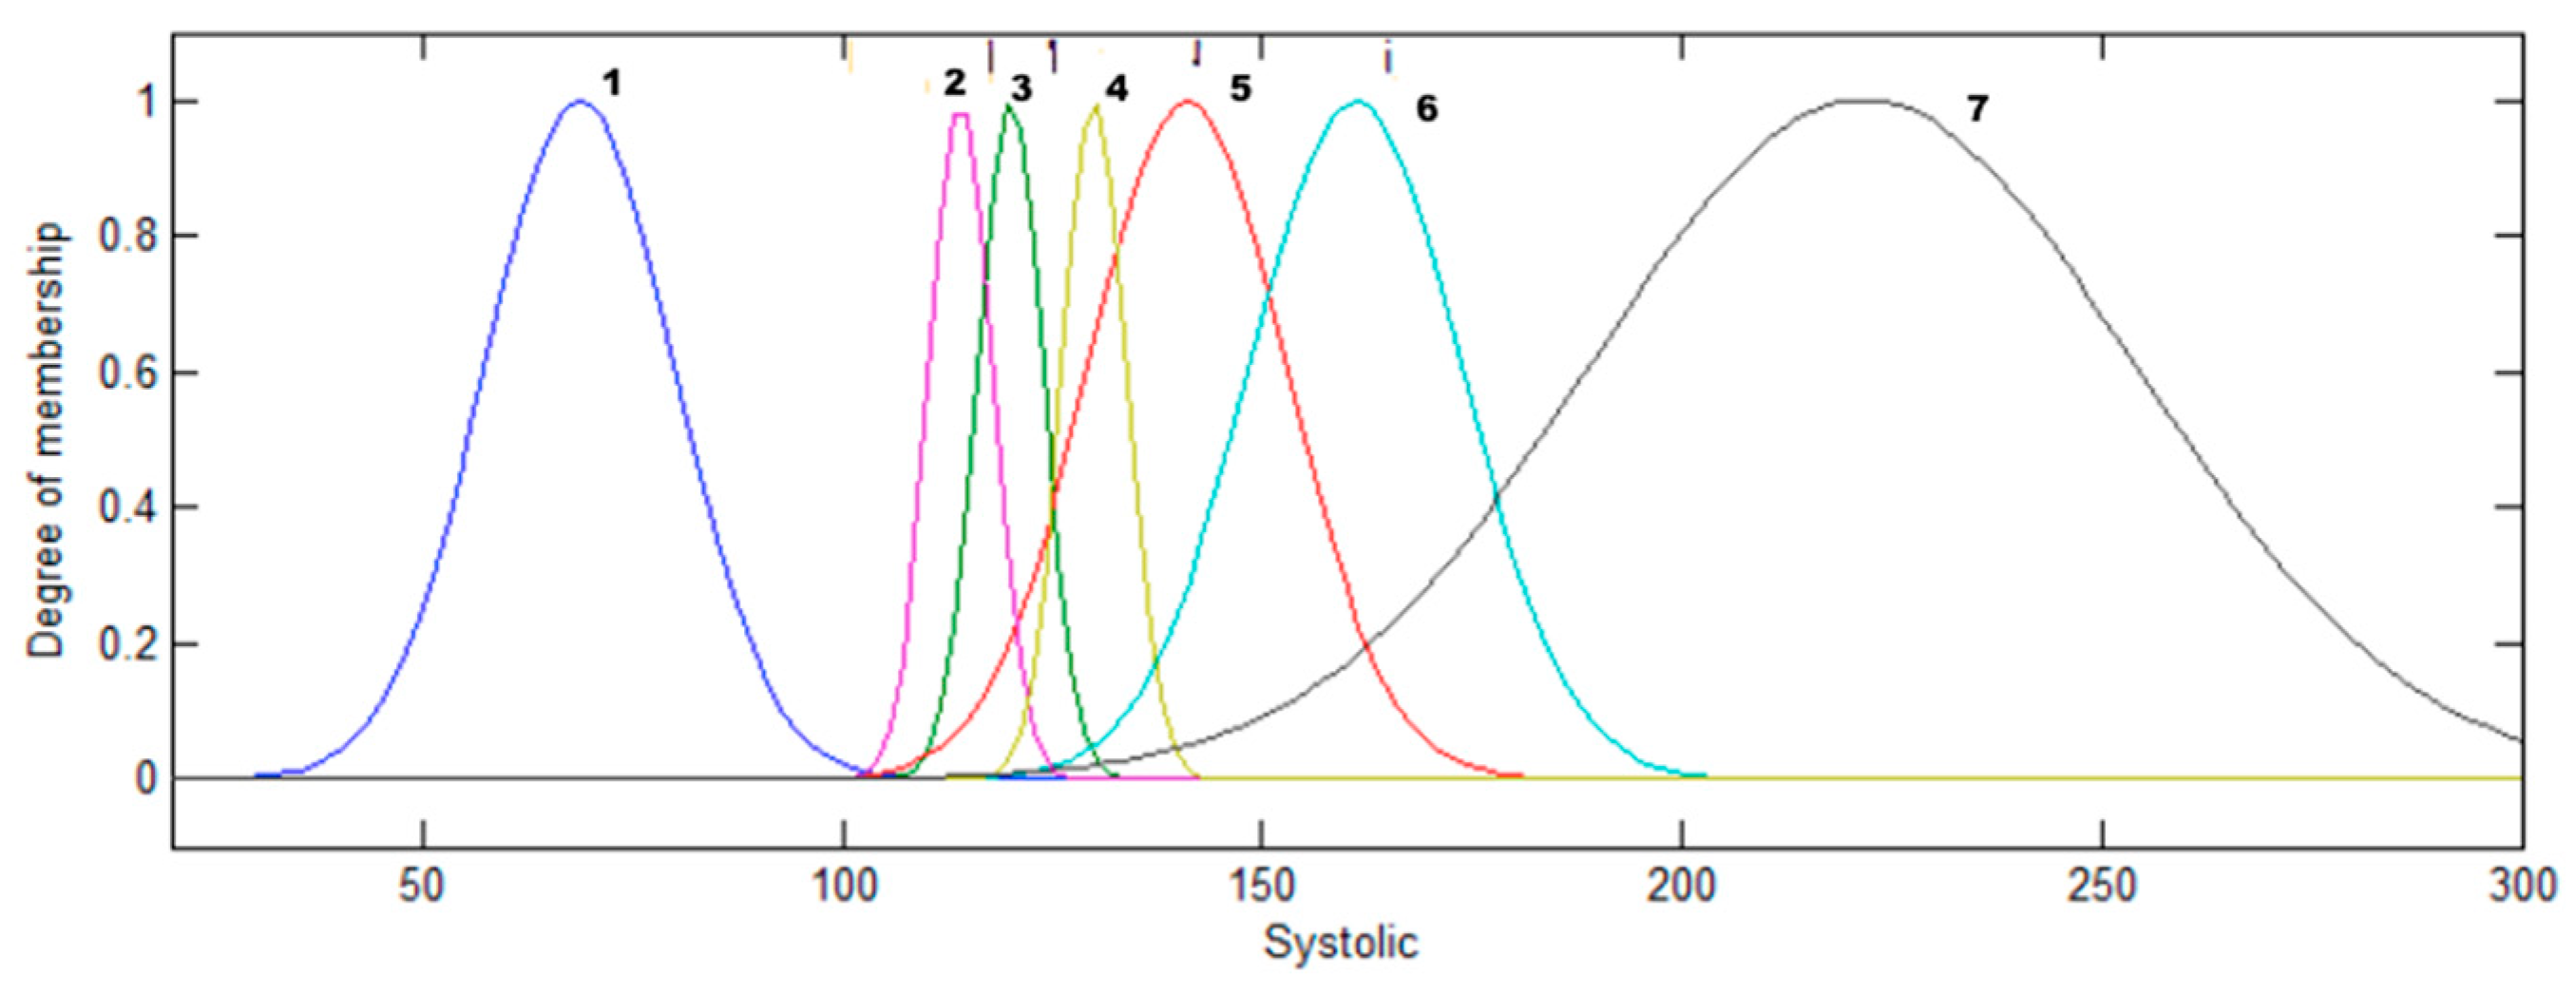
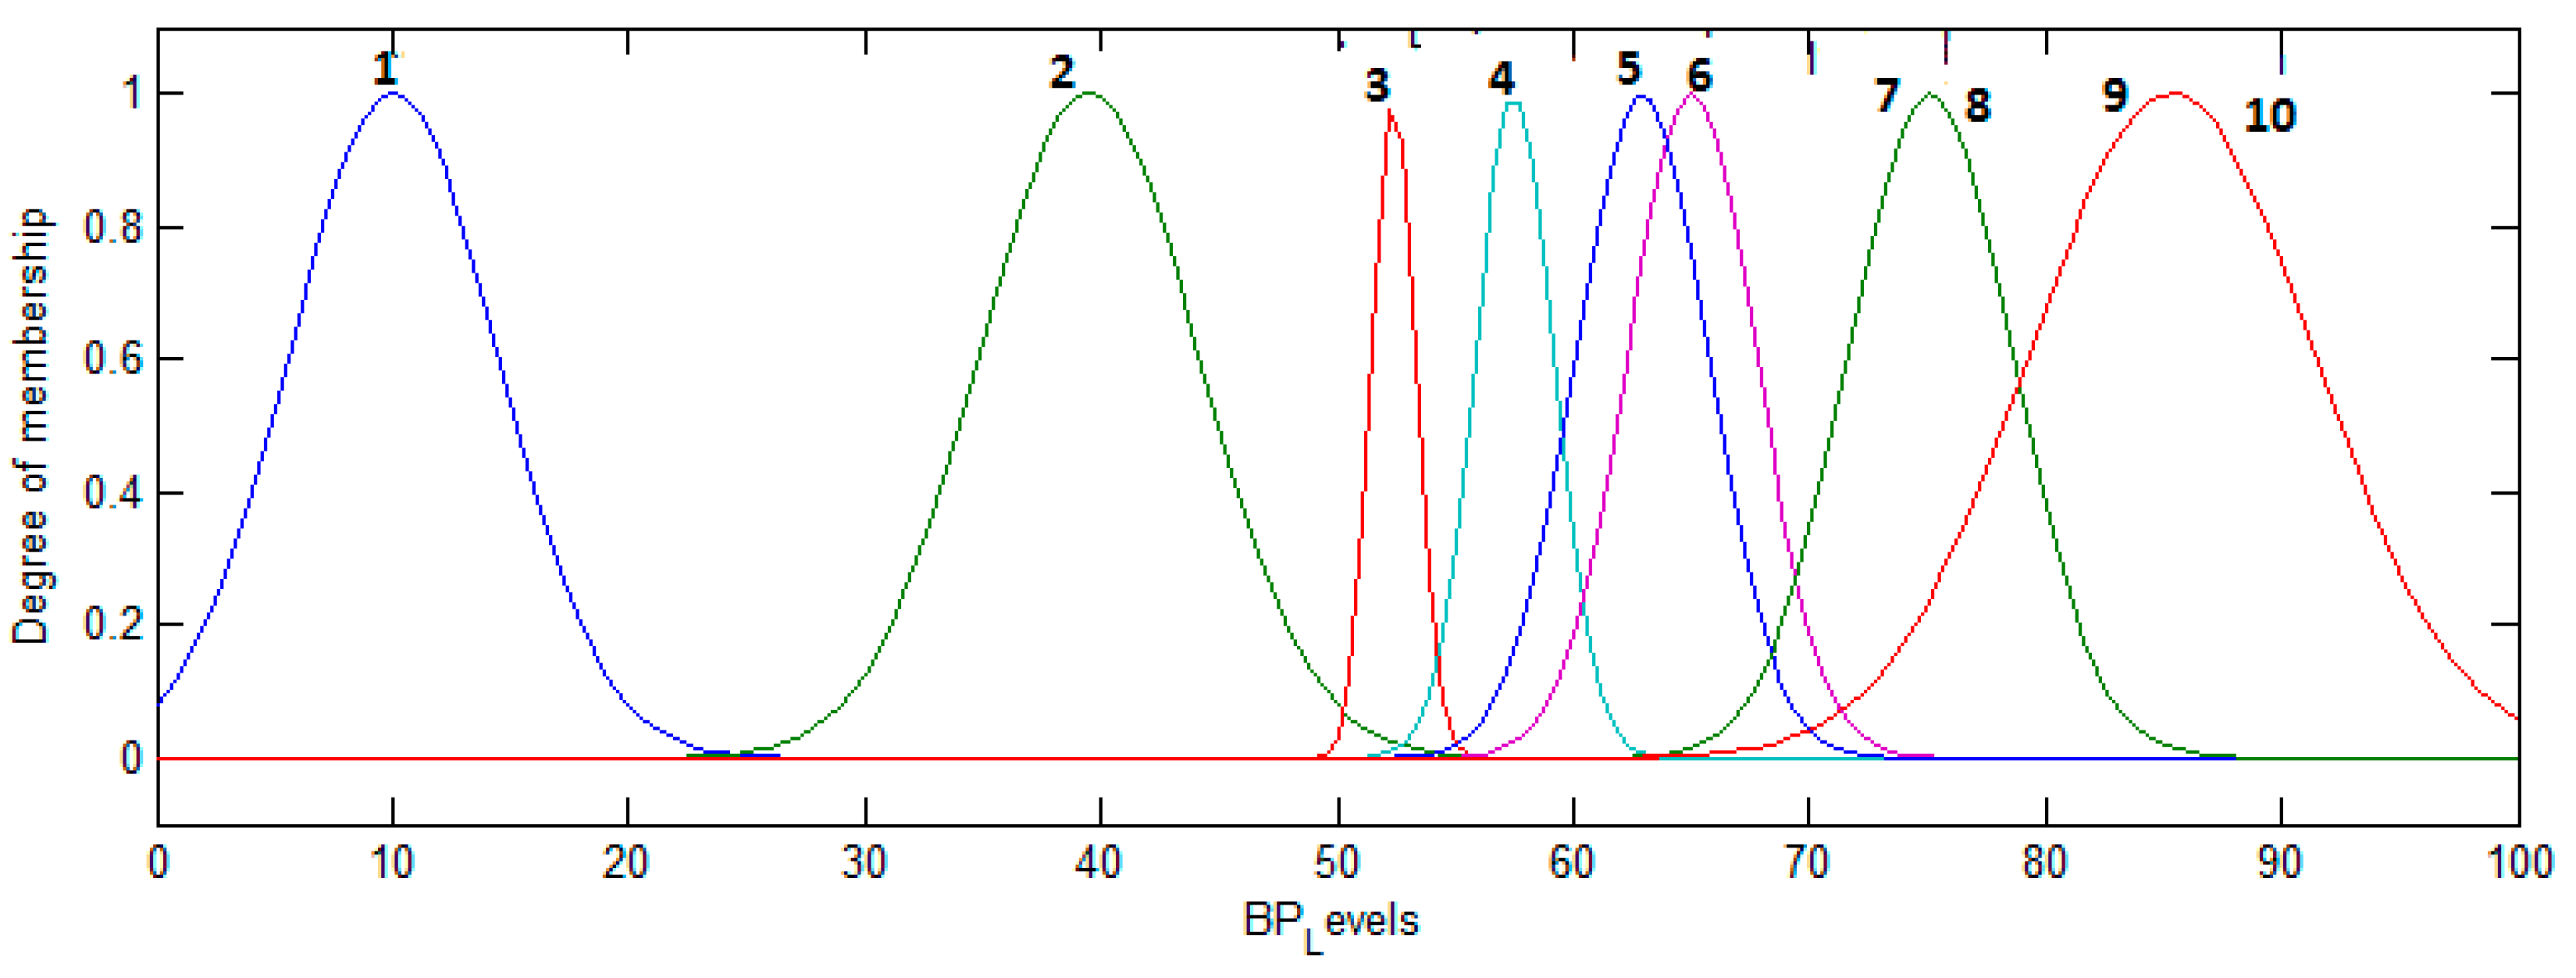
3.3.3. Design of the Optimized Type-1 FS for Classification with Gaussians Membership Functions

The structure of the fuzzy system with two inputs and one output is shown in Figure 17. The numbers marked in the Figure 18 list each of the membership functions for the input systolic and these are: 1—Low, 2—Low_Normal, 3—Normal, 4—High_Normal, 5—High, 6—Very_High, 7—Too_High.
The numbers marked in the Figure 19 list each of the membership functions for the input diastolic and these are: 1—Low, 2—Low_Normal, 3—Normal, 4—High_Normal, 5—High, 6—Very_High, 7—Too_High.
The numbers marked in the Figure 20 list each of the membership functions for the output BP_Levels and these are: 1—Hypotension, 2—Optimal, 3—Normal, 4—High_Normal, 5—ISHGRADE_1, 6—Grade_1, 7—ISHGRADE_2, 8—Grade_2, 9—ISHGRADE_3, 10—Grade_3.

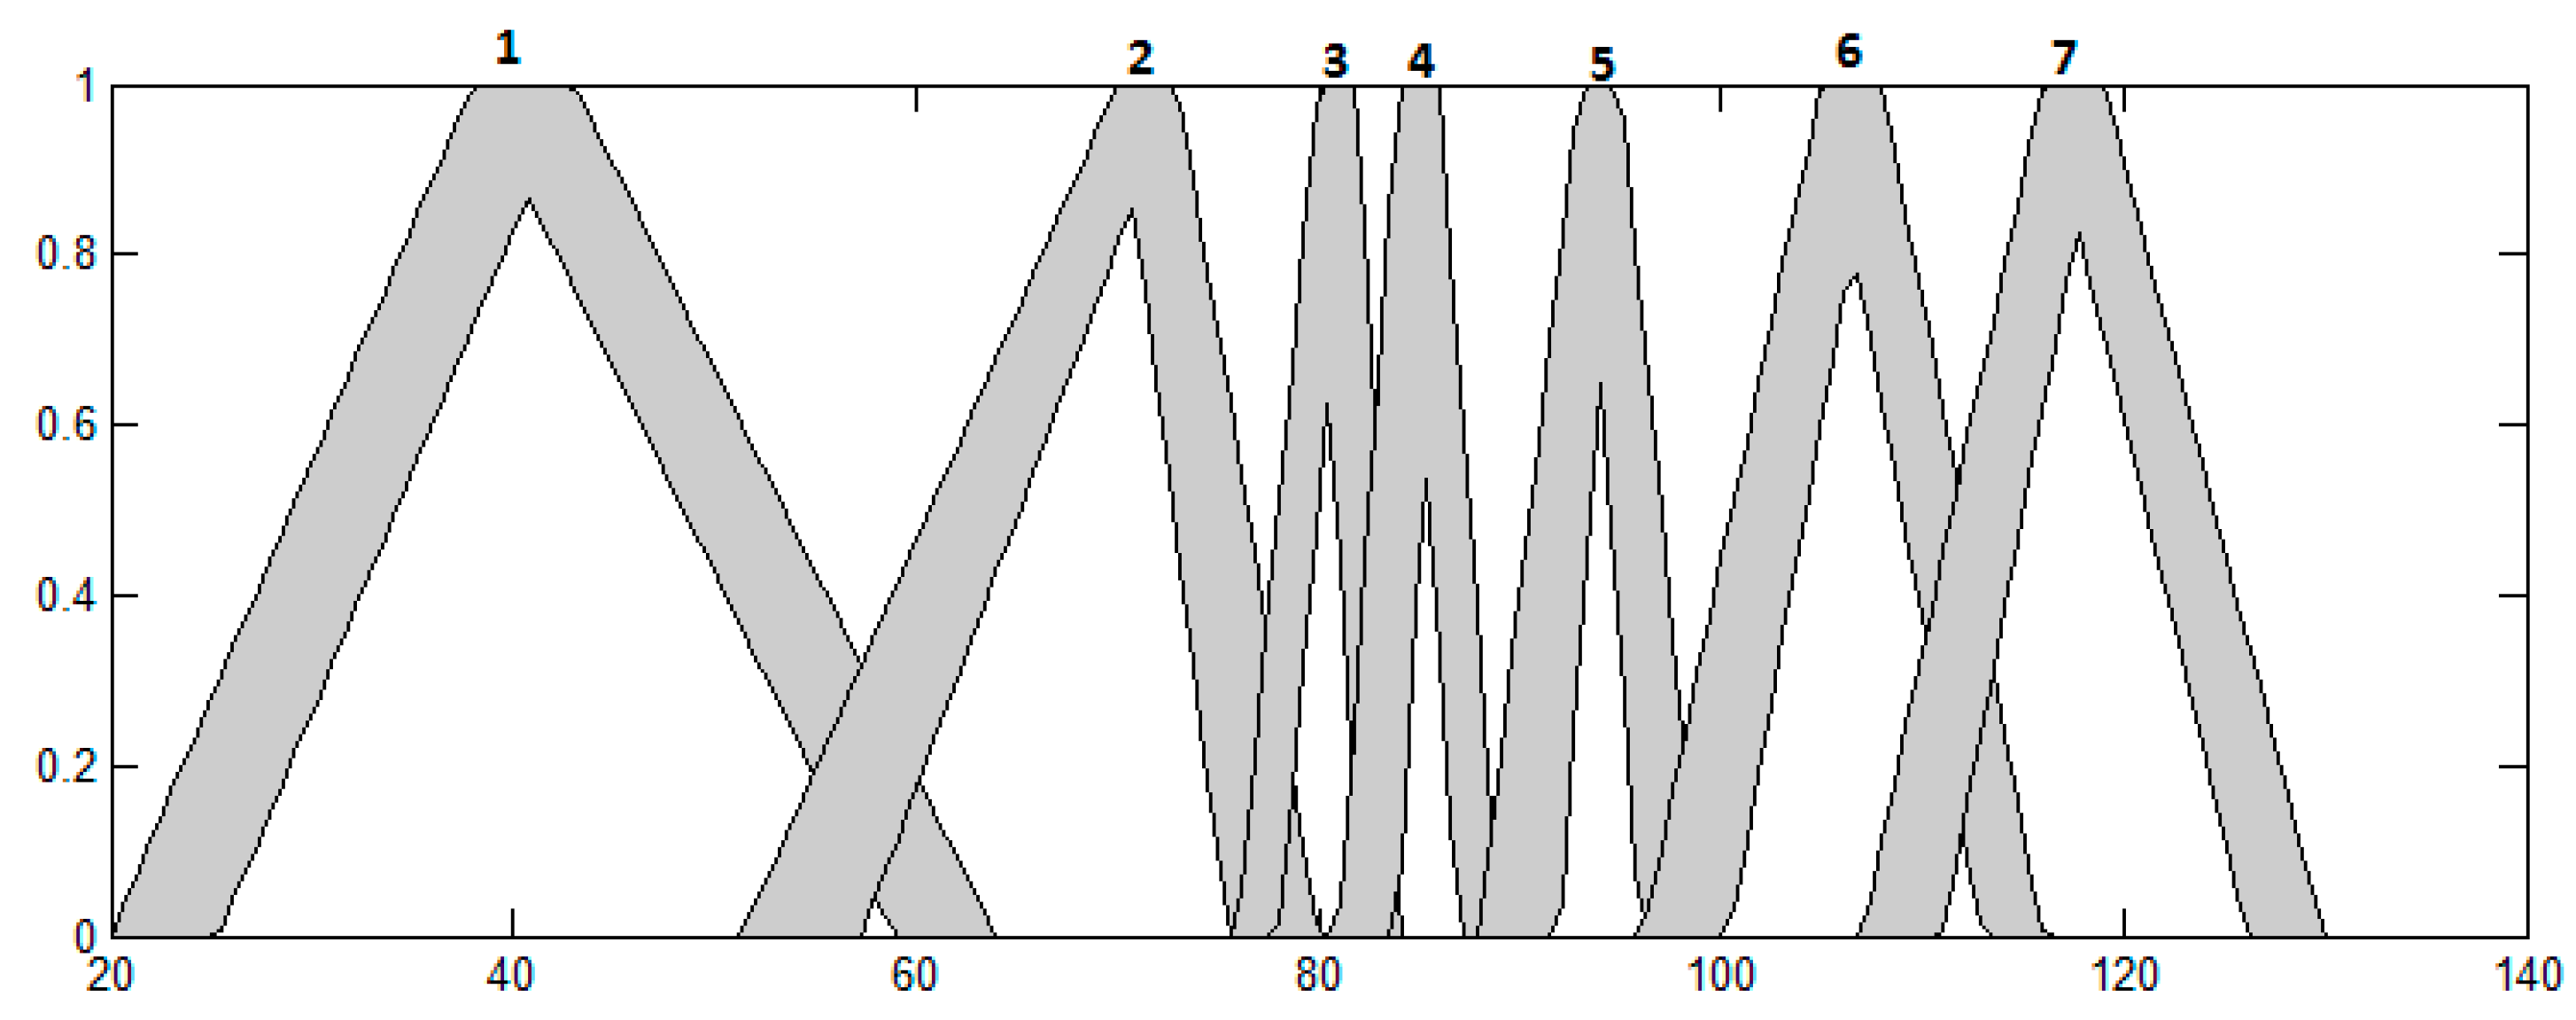
3.4. Design of the Interval Type-2 FS for Classification with Triangular Membership Functions

3.4.1. Design of the First Interval Type-2 FS for the Classification of BP Levels with Triangular Membership Functions

The structure of the fuzzy system is illustrated in Figure 21. The numbers marked in the Figure 22 list each of the membership functions for the input systolic and these are: 1—Low, 2—Low_Normal, 3—Normal, 4—High_Normal, 5—High, 6—Very_High, 7—Too_High.
The numbers marked in the Figure 23 list each of the MFs for the input diastolic and these are: 1—Low, 2—Low_Normal, 3—Normal, 4—High_Normal, 5—High, 6—Very_High, 7—Too_High.
The numbers marked in the Figure 24 list each of the membership functions for the output BP_Levels and these are: 1—Hypotension, 2—Optimal, 3—Normal, 4—High_Normal, 5—ISHGRADE_1, 6—Grade_1, 7—ISHGRADE_2, 8—Grade_2, 9—ISHGRADE_3, 10—Grade_3.

3.4.2. Optimization of the Triangular Interval Type-2 Fuzzy Inference System with Genetic Algorithm

The interval type-2 fuzzy system was optimized with GA, where we have a chromosome to optimize the membership functions (MFS), as shown in Figure 25 and the chromosome has 144 genes, which help to optimize the membership functions, Genes 1–42 (real numbers) allow to manage the parameters of the systolic input, Genes 43–84 (real numbers) allow to manage the parameters of the diastolic input and Genes 85–144 (real numbers) allow to manage the parameters of the BP_Levels output. The following Figure 25 shows the structure of the chromosome:

3.4.3. Design of the Optimized Interval Type-2 FS for Classification with Triangular Membership Functions

The structure of the optimized interval type-2 fuzzy system is illustrated in Figure 26. The numbers marked in the Figure 27 list each of the membership functions for the input systolic and these are: 1—Low, 2—Low_Normal, 3—Normal, 4—High_Normal, 5—High, 6—Very_High, 7—Too_High.
The numbers marked in the Figure 28 list each of the membership functions for the input diastolic and these are: 1—Low, 2—Low_Normal, 3—Normal, 4—High_Normal, 5—High, 6—Very_High, 7—Too_High.
The numbers marked in the Figure 29 list each of the membership functions for the output BP_Levels and these are: 1—Hypotension, 2—Optimal, 3—Normal, 4—High_Normal, 5—ISHGRADE_1, 6—Grade_1, 7—ISHGRADE_2, 8—Grade_2, 9—ISHGRADE_3, 10—Grade_3.

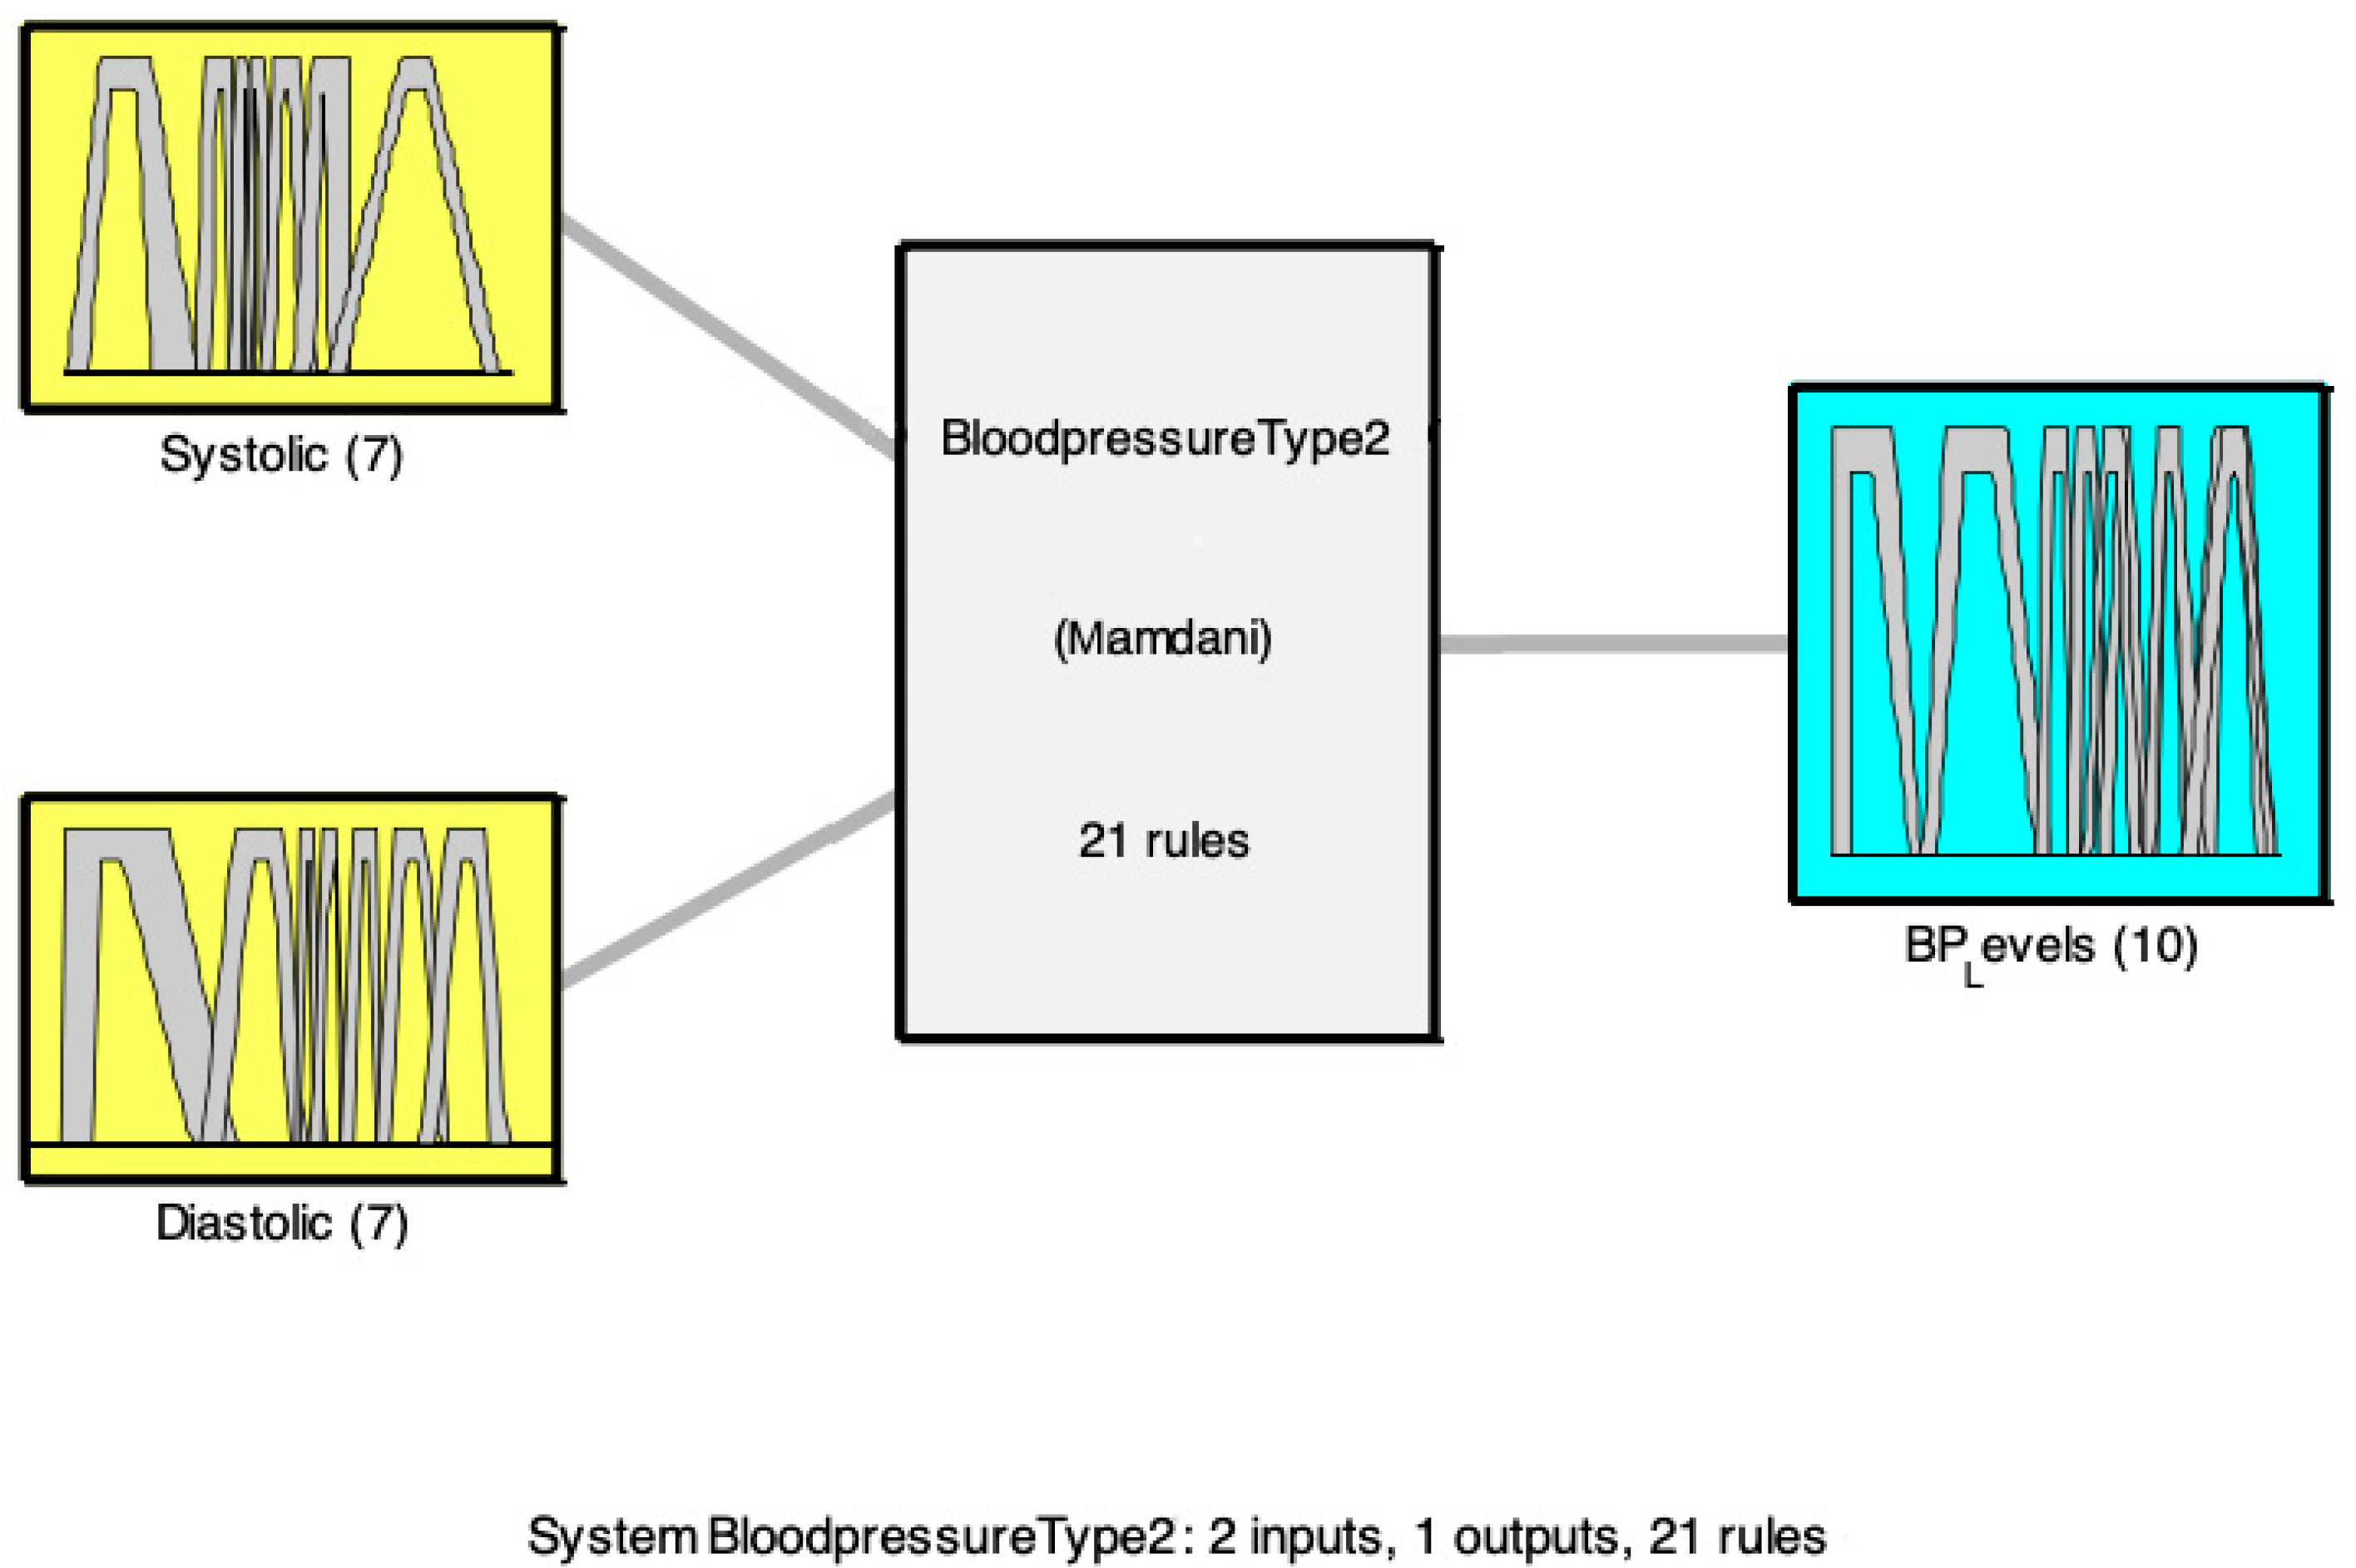
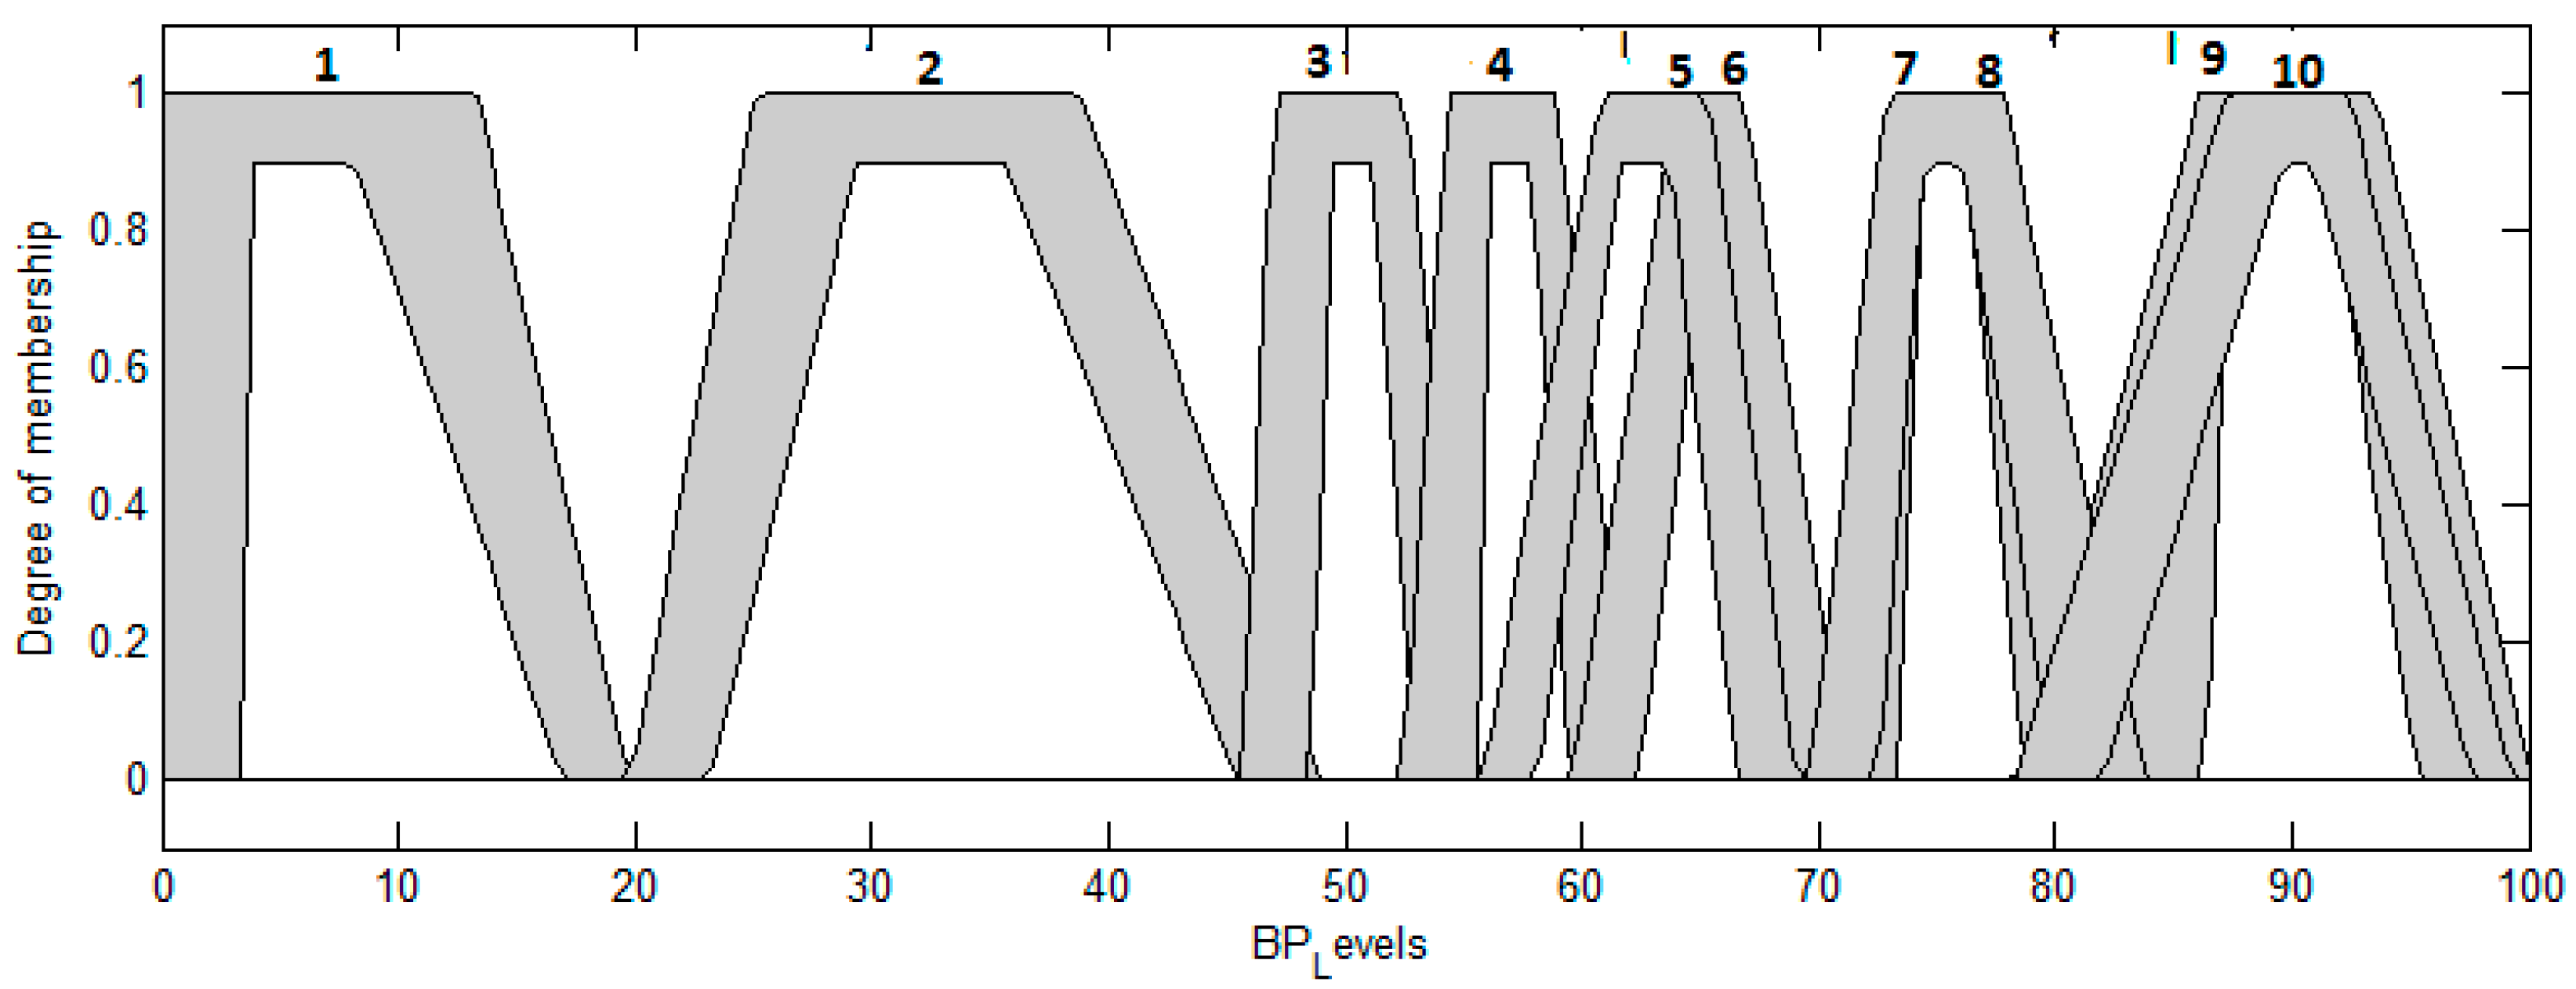
3.5. Design of the Interval Type-2 FS for Classification with Trapezoidal Membership Functions

3.5.1. Design of the First Interval Type-2 FS for the Classification of BP Levels with Trapezoidal Memberships Functions

The structure of the interval type-2 fuzzy system is show in Figure 30. The numbers marked in the Figure 31 list each of the membership functions for the input systolic and these are: 1—Low, 2—Low_Normal, 3—Normal, 4—High_Normal, 5—High, 6—Very_High, 7—Too_High.
The numbers marked in the Figure 32 list each of the membership functions for the input diastolic and these are: 1—Low, 2—Low_Normal, 3—Normal, 4—High_Normal, 5—High, 6—Very_High, 7—Too_High.
The numbers marked in the Figure 33 list each of the membership functions for the output BP_Levels and these are: 1—Hypotension, 2—Optimal, 3—Normal, 4—High_Normal, 5—ISHGRADE_1, 6—Grade_1, 7—ISHGRADE_2, 8—Grade_2, 9—ISHGRADE_3, 10—Grade_3.

3.5.2. Optimization of the Trapezoidal Type-2 Fuzzy Inference System with Genetic Algorithm

The interval type-2 fuzzy system was optimized with GA, in the GA it is necessary a chromosome to optimize the membership functions (MFS), as shown in Figure 34 and the chromosome has 246 genes and this data help to optimize the membership functions, Genes 1–63 (real numbers) allow to manage the parameters of the systolic input, Genes 64–126 (real numbers) allow to manage the parameters of the diastolic input and Genes 127–216 (real numbers) allow to manage the parameters of the BP_Levels output. The following Figure 34 shows the structure of the chromosome:

3.5.3. Design of the Optimized Interval Type-2 FS for Classification with Trapezoidal MFs

The structure of the optimized interval type-2 fuzzy system is shown in Figure 35. The numbers marked in the Figure 36 list each of the membership functions for the input systolic and these are: 1—Low, 2—Low_Normal, 3—Normal, 4—High_Normal, 5—High, 6—Very_High, 7—Too_High.
The numbers marked in the Figure 37 list each of the membership functions for the input diastolic and these are: 1—Low, 2—Low_Normal, 3—Normal, 4—High_Normal, 5—High, 6—Very_High, 7—Too_High.
The numbers marked in the Figure 38 list each of the membership functions for the output BP_Levels and these are: 1—Hypotension, 2—Optimal, 3—Normal, 4—High_Normal, 5—ISHGRADE_1, 6—Grade_1, 7—ISHGRADE_2, 8—Grade_2, 9—ISHGRADE_3, 10—Grade_3.

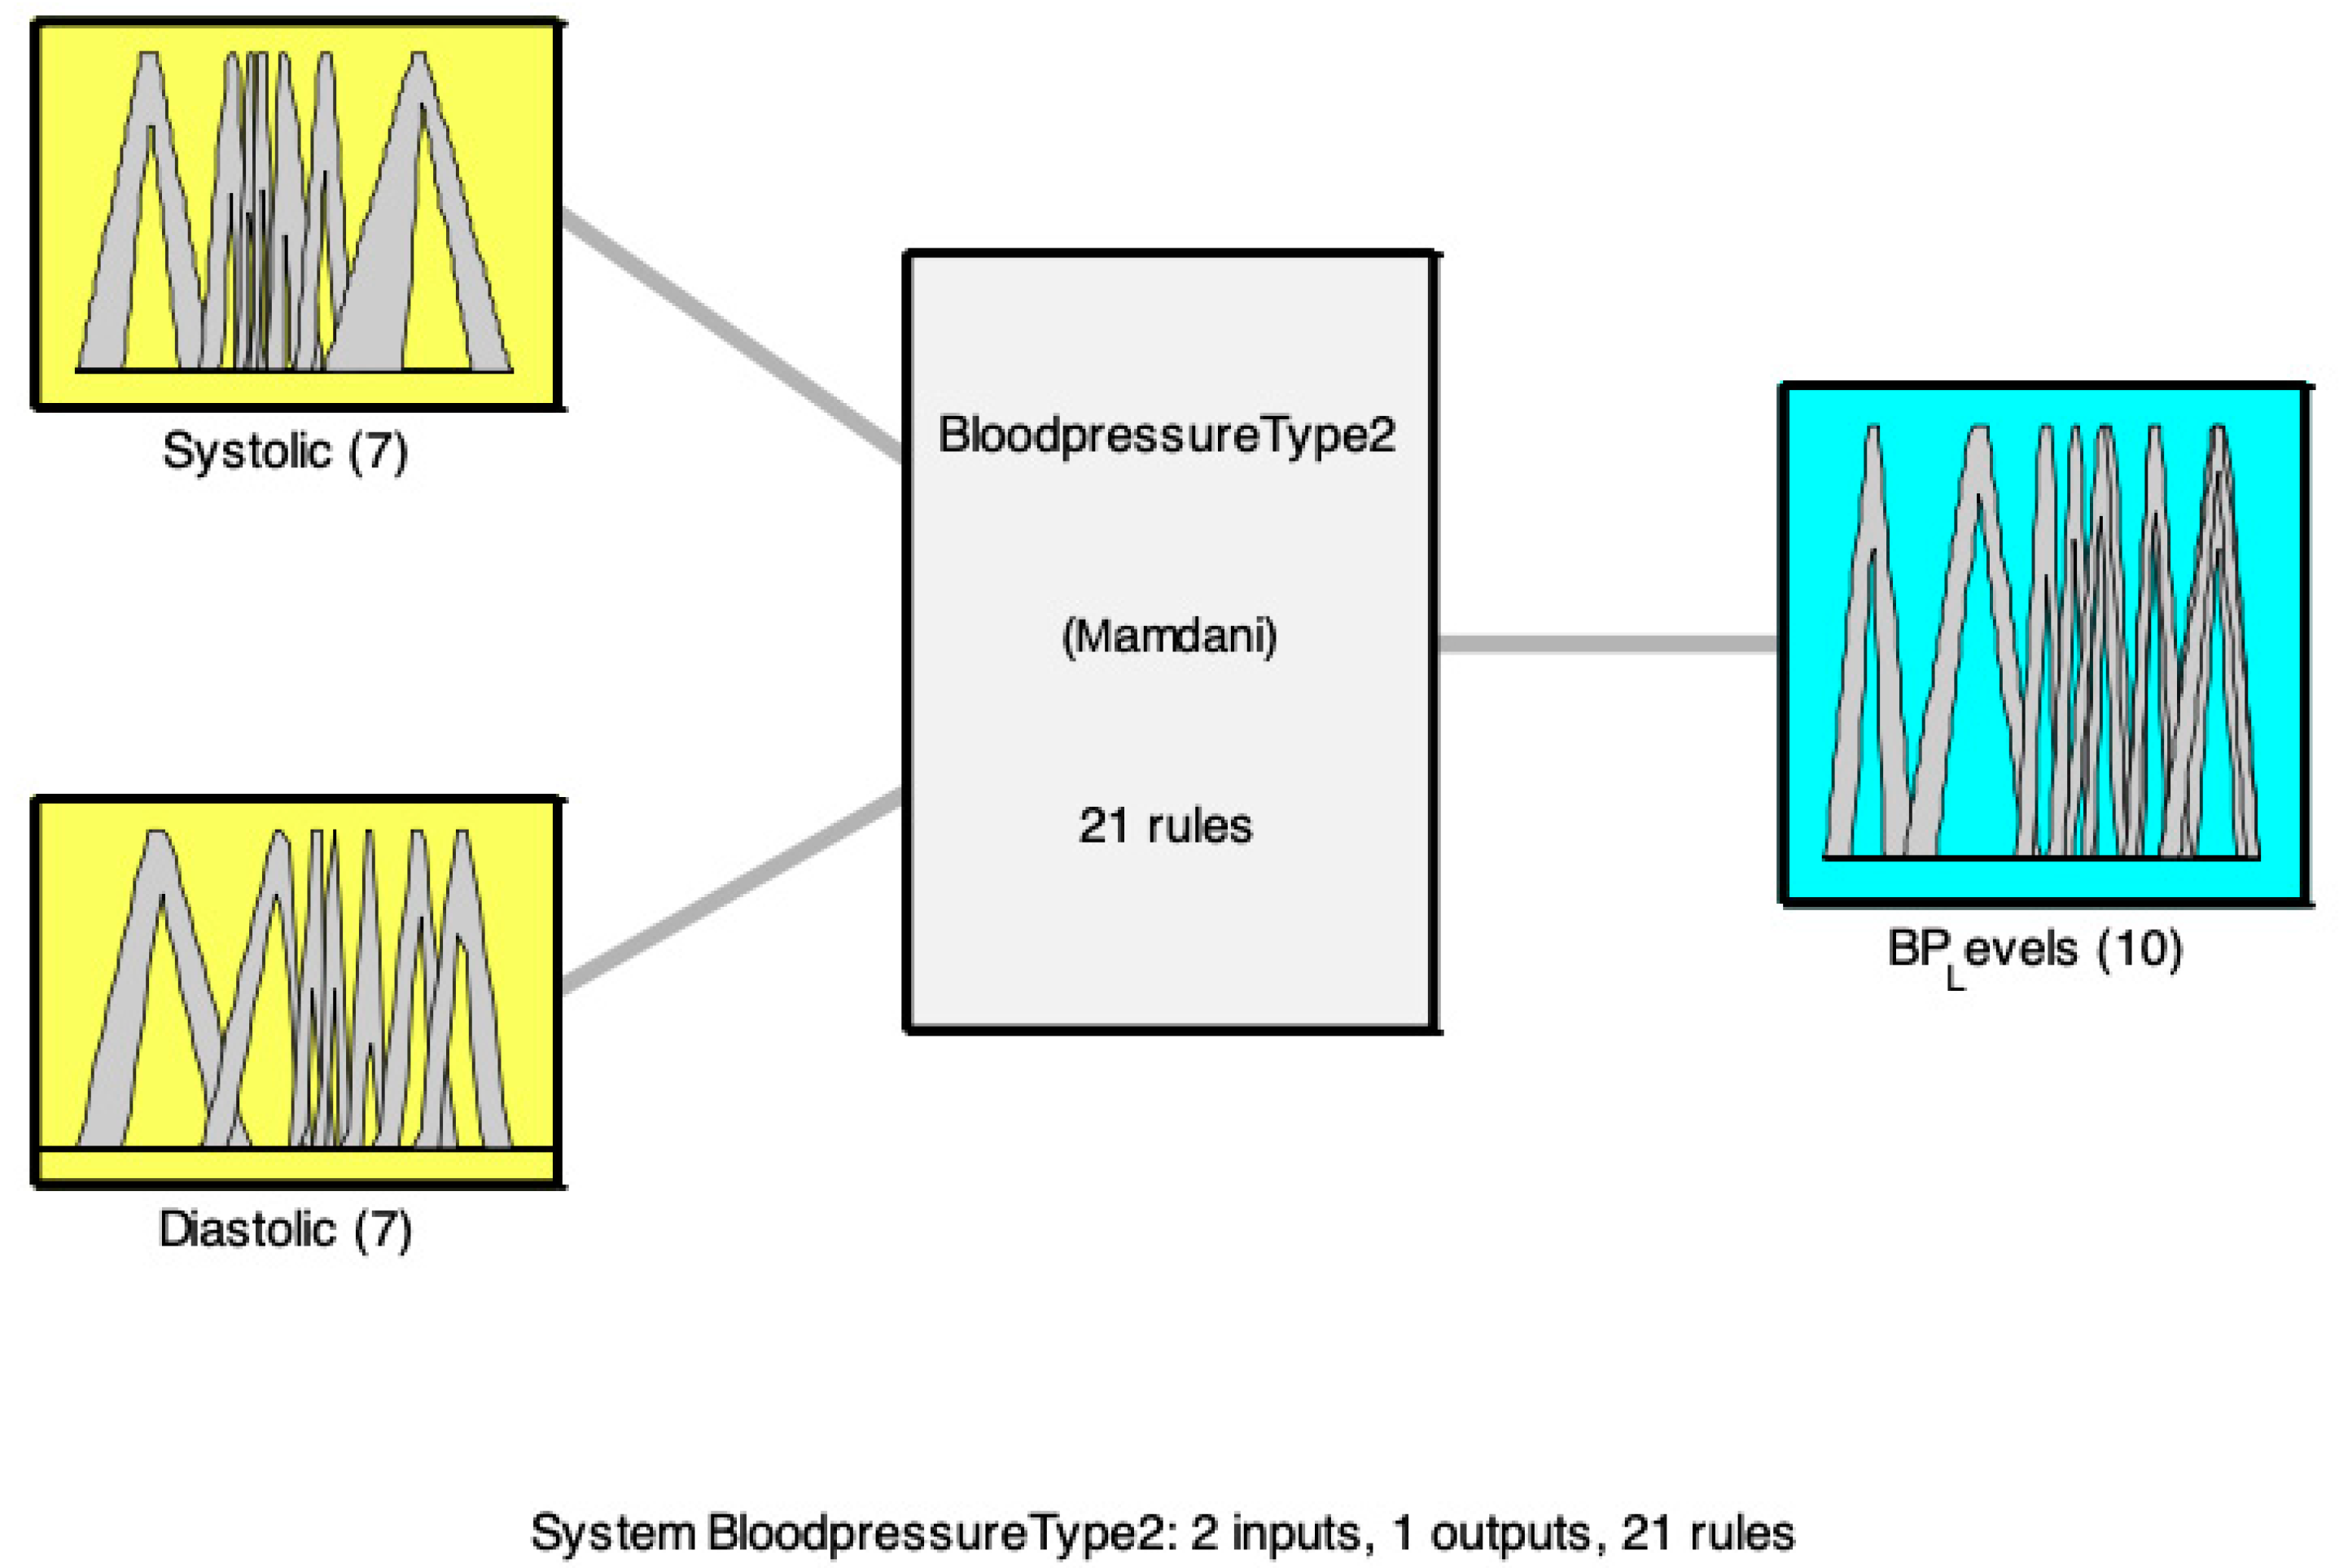
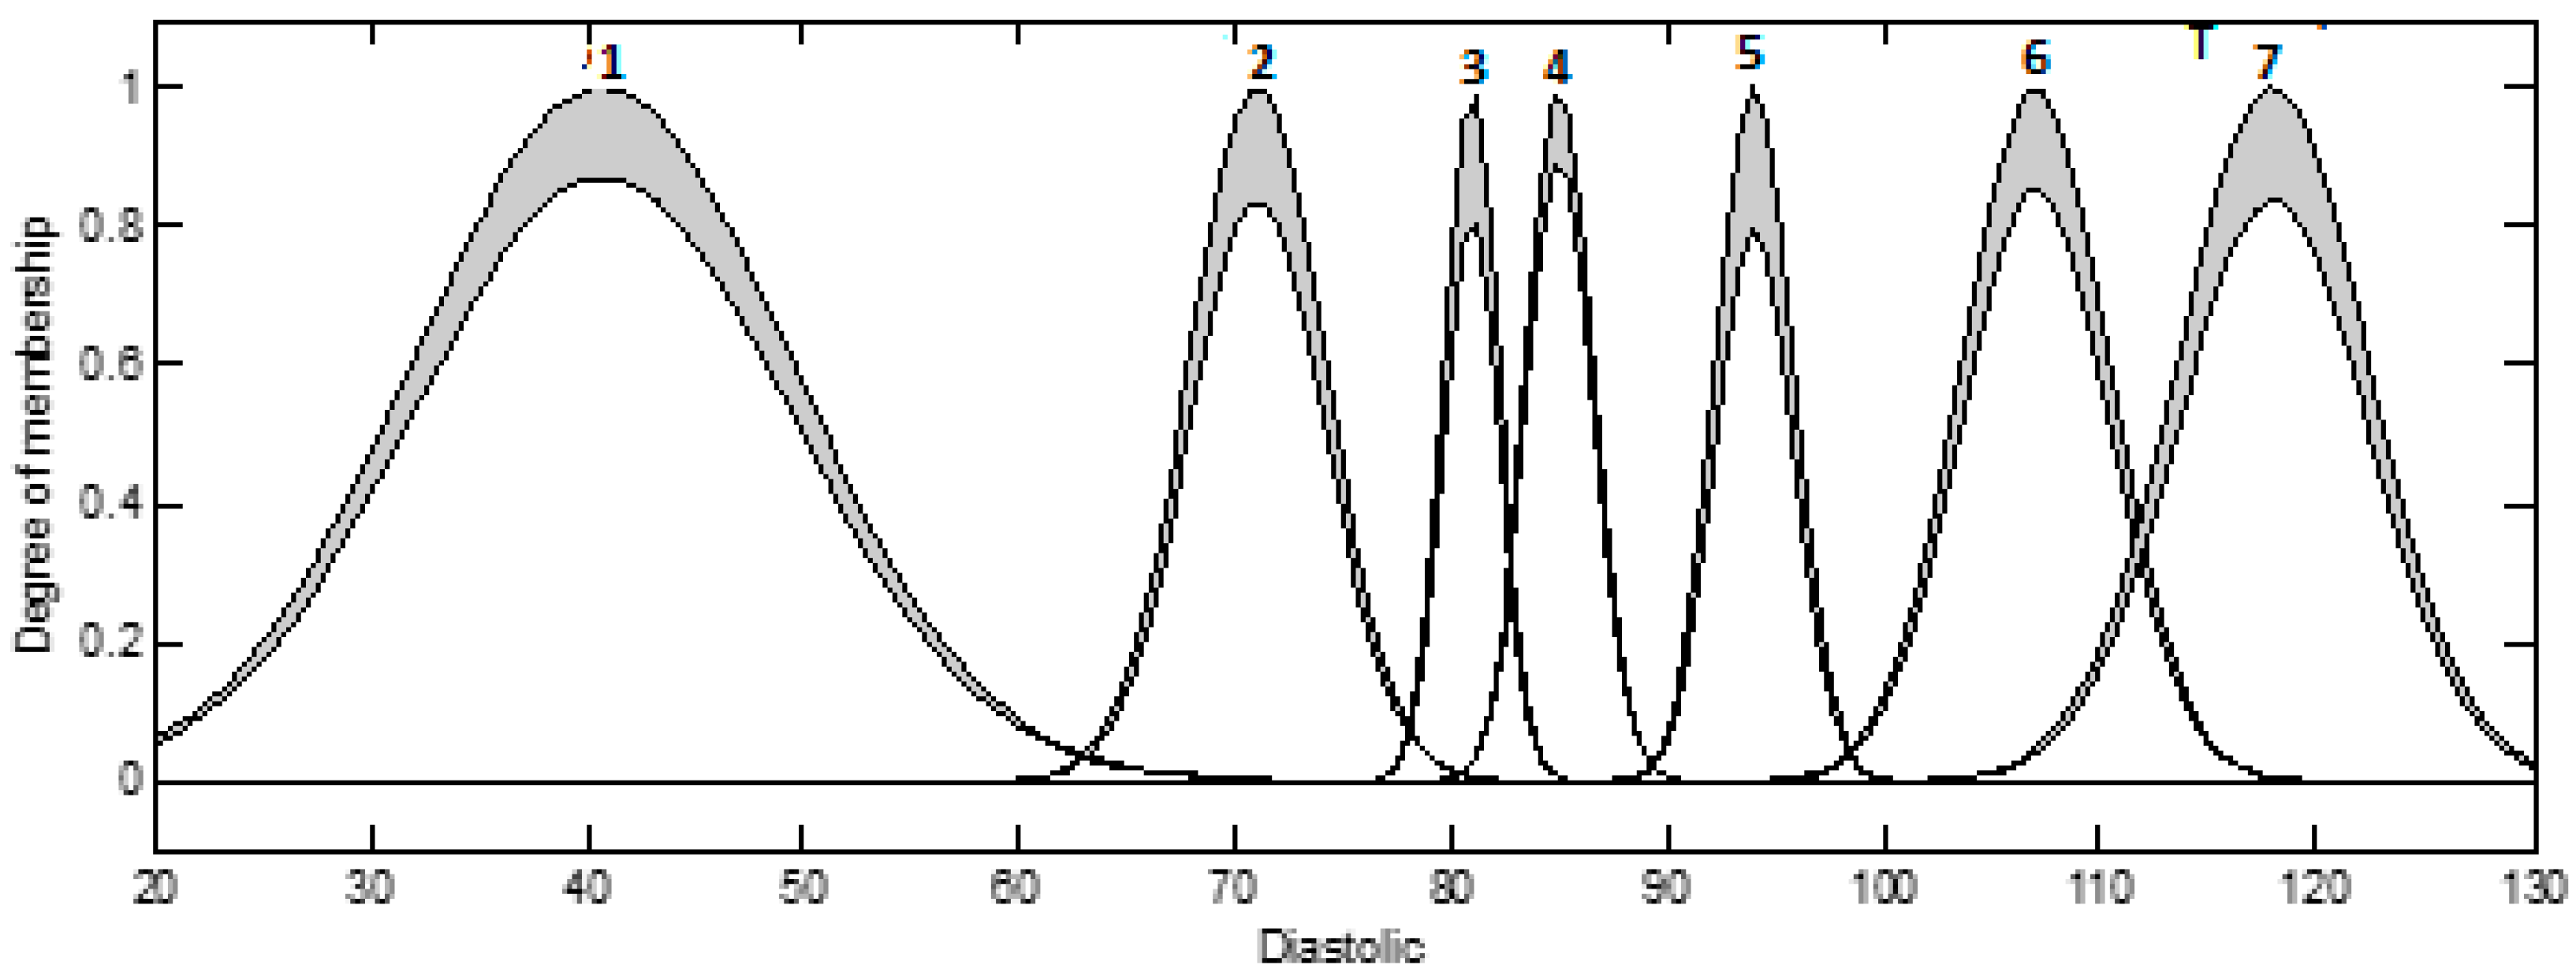
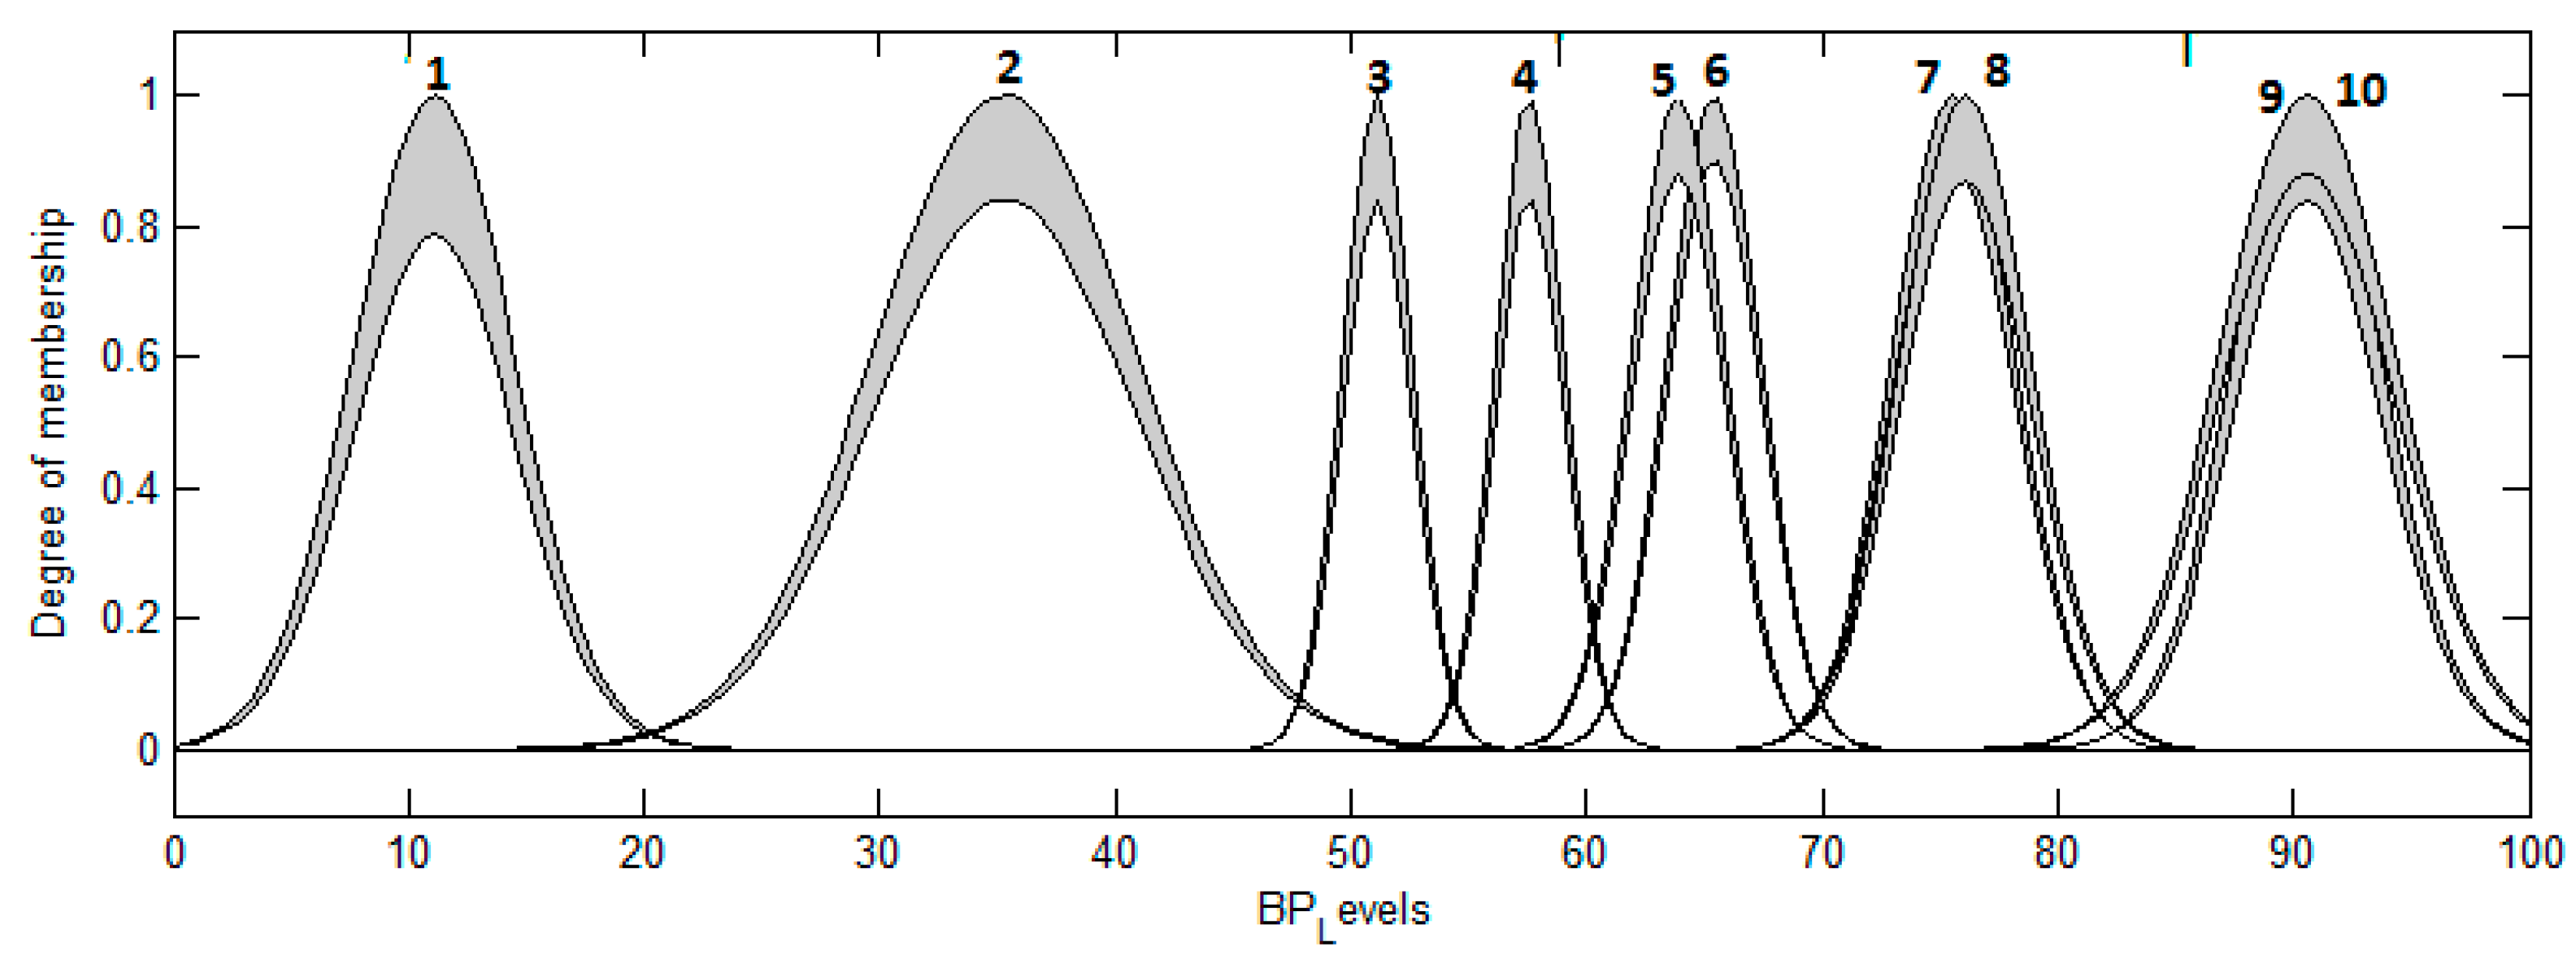
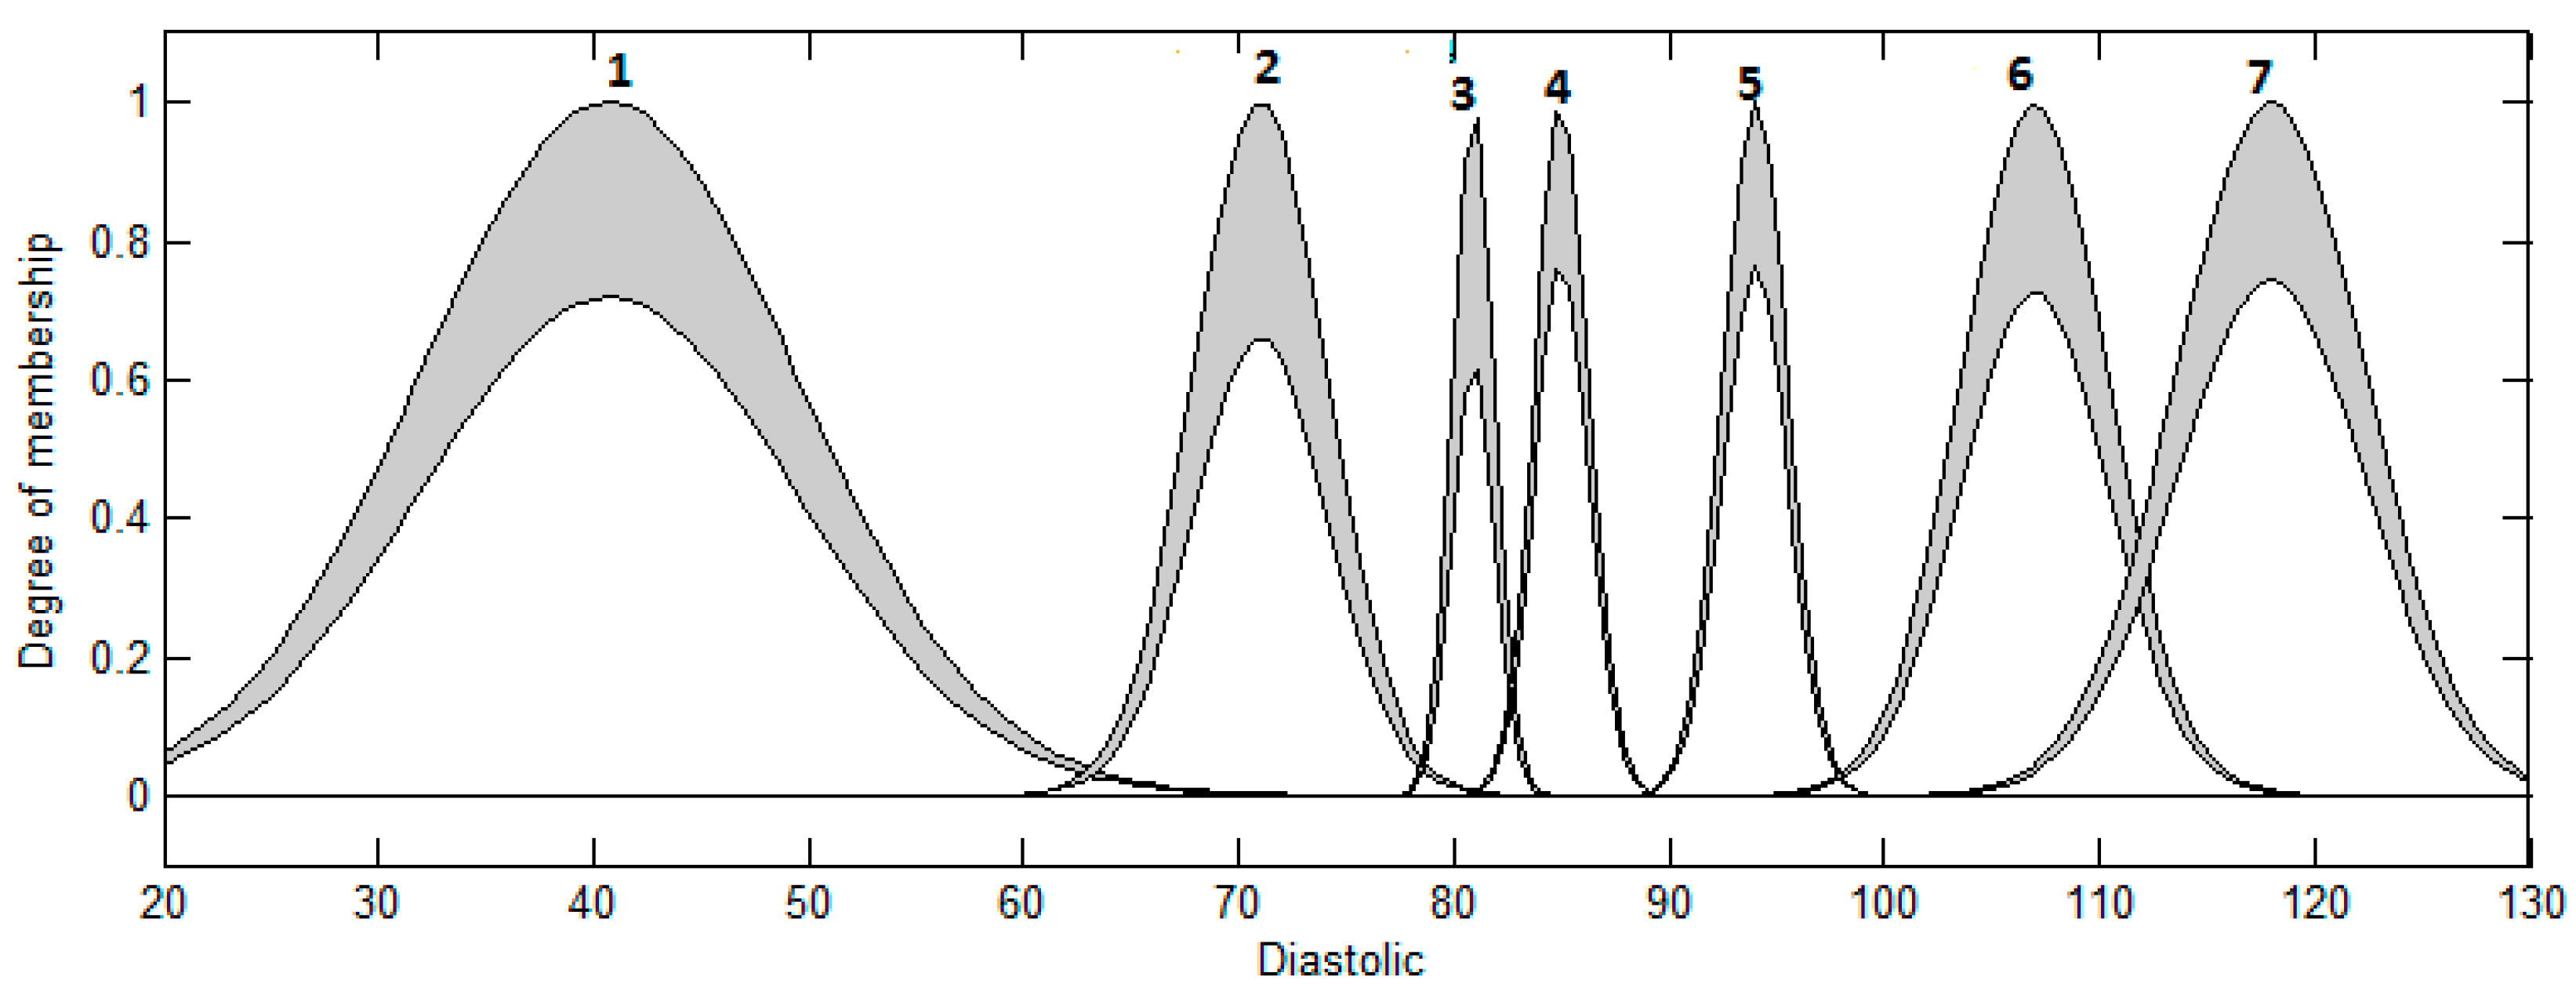
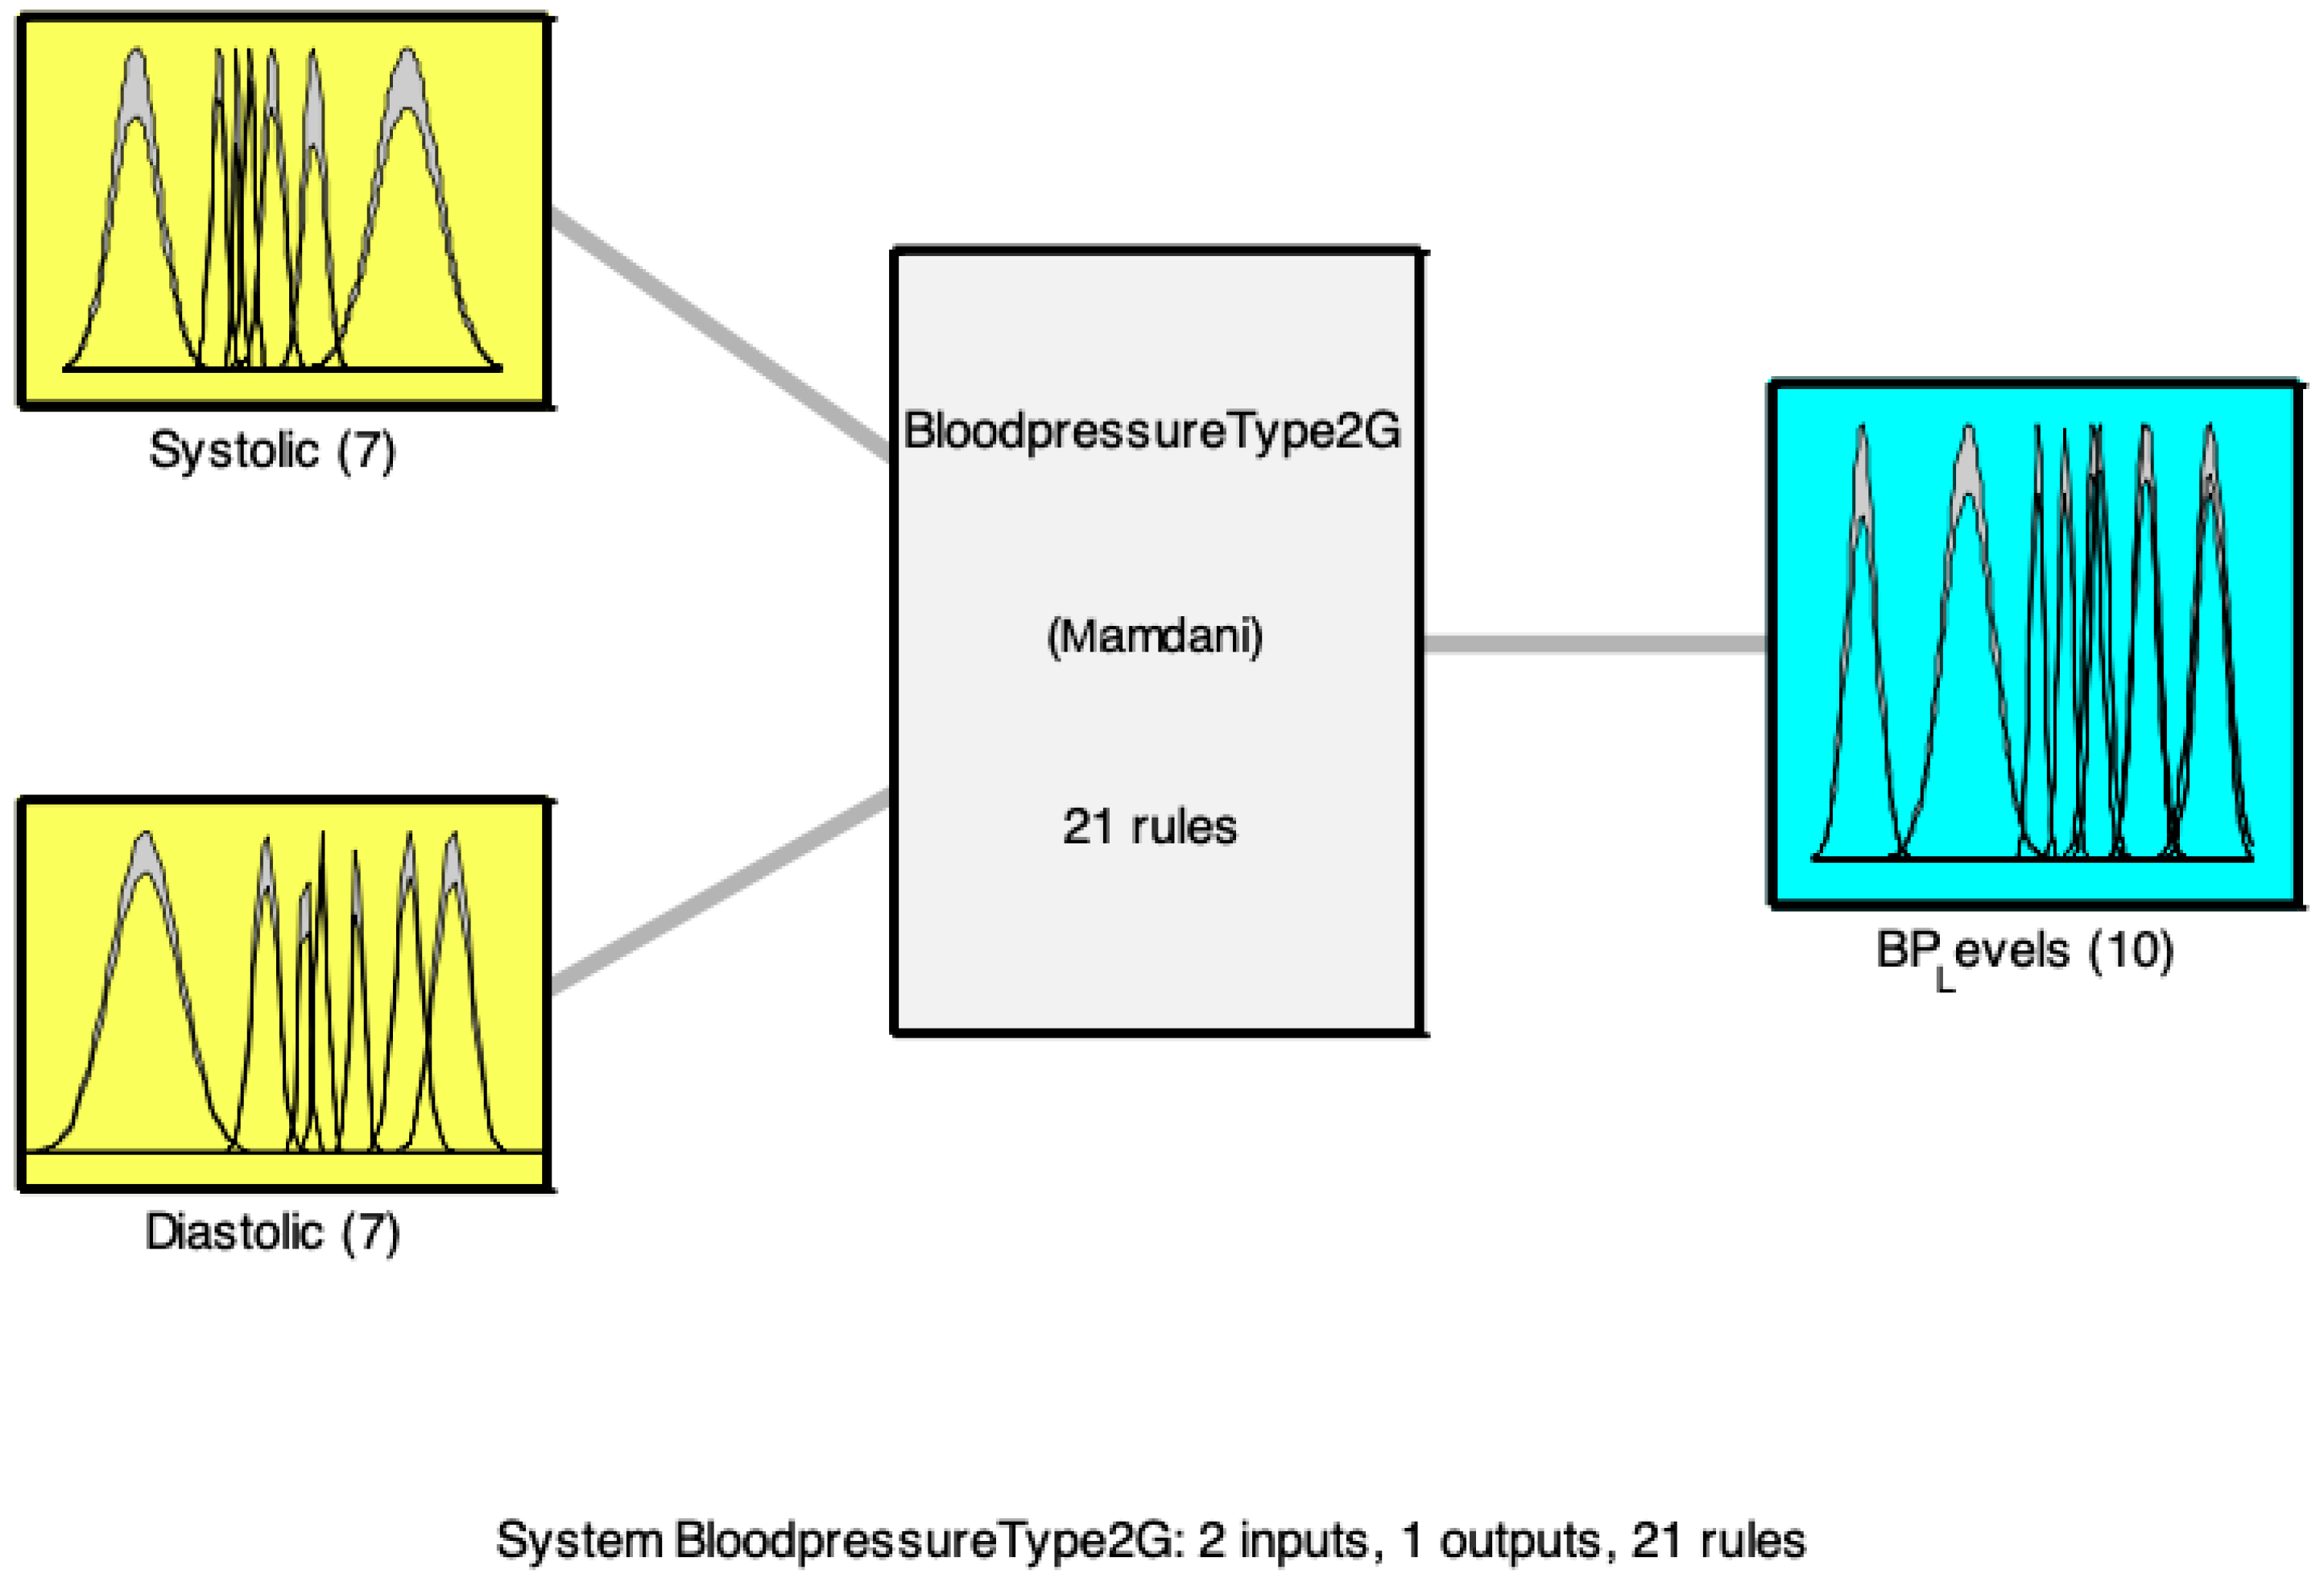
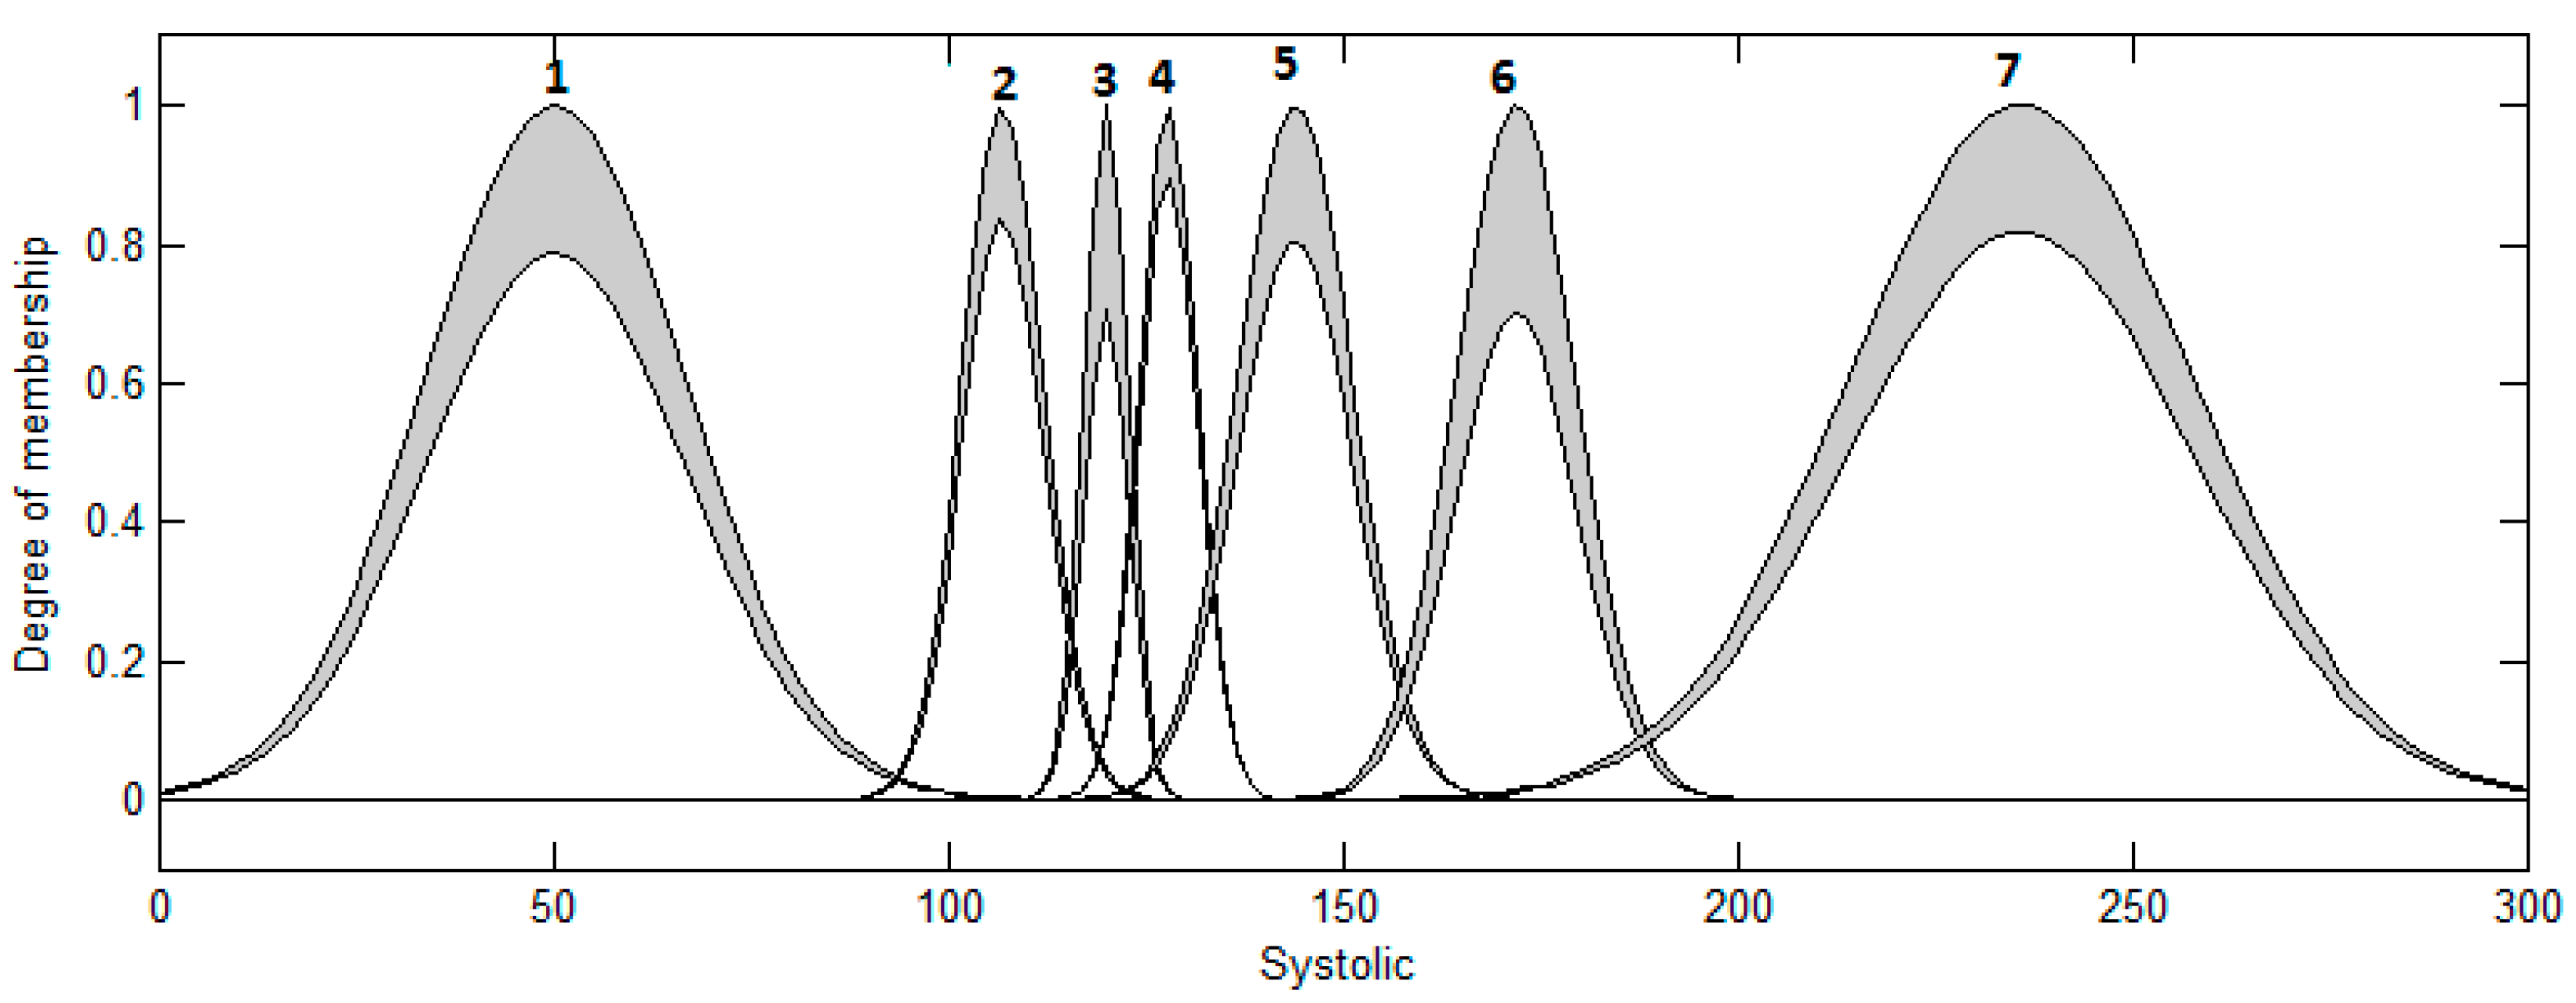
3.6. Design of the Interval Type-2 FS for Classification with Gaussians Membership Functions

3.6.1. Design of the First Interval Type-2 Fuzzy System for the Classification of BP Levels with Gaussians Memberships Functions

The structure of the interval type-2 fuzzy system with Gaussian MFs is illustrated in Figure 39. The numbers marked in the Figure 40 list each of the membership functions for the input systolic and these are: 1—Low, 2—Low_Normal, 3—Normal, 4—High_Normal, 5—High, 6—Very_High, 7—Too_High.
The numbers marked in the Figure 41 list each of the membership functions for the input diastolic and these are: 1—Low, 2—Low_Normal, 3—Normal, 4—High_Normal, 5—High, 6—Very_High, 7—Too_High.
The numbers marked in the Figure 42 list each of the membership functions for the output BP_Levels and these are: 1—Hypotension, 2—Optimal, 3—Normal, 4—High_Normal, 5—ISHGRADE_1, 6—Grade_1, 7—ISHGRADE_2, 8—Grade_2, 9—ISHGRADE_3, 10—Grade_3.

3.6.2. Optimization of the Gaussian Type-2 Fuzzy Inference System with Genetic Algorithm

The interval type-2 fuzzy system was optimized with GA, in the GA it is necessary a chromosome to optimize the membership functions (MFS), as shown in Figure 43 and the chromosome has 72 genes and this genes help to optimize the membership functions, Genes 1–21 (real numbers) allow to manage the parameters of the systolic input, Genes 22–42 (real numbers) allow to manage the parameters of the diastolic input and Genes 43–72 (real numbers) allow to manage the parameters of the BP_Levels output. The following Figure 43 shows the structure of the chromosome:

3.6.3. Design of the Optimized Interval Type 2 FS for Classification with Gaussians Membership Functions

The structure of the optimized interval type-2 fuzzy system with Gaussian MFs is illustrated in Figure 44. The numbers marked in the Figure 45 list each of the membership functions for the input systolic and these are: 1—Low, 2—Low_Normal, 3—Normal, 4—High_Normal, 5—High, 6—Very_High, 7—Too_High.
The numbers marked in the Figure 46 list each of the MFs for the input diastolic and these are: 1—Low, 2—Low_Normal, 3—Normal, 4—High_Normal, 5—High, 6—Very_High, 7—Too_High.
The numbers marked in the Figure 47 list each of the membership functions for the output BP_Levels and these are: 1—Hypotension, 2—Optimal, 3—Normal, 4—High_Normal, 5—ISHGRADE_1, 6—Grade_1, 7—ISHGRADE_2, 8—Grade_2, 9—ISHGRADE_3, 10—Grade_3.

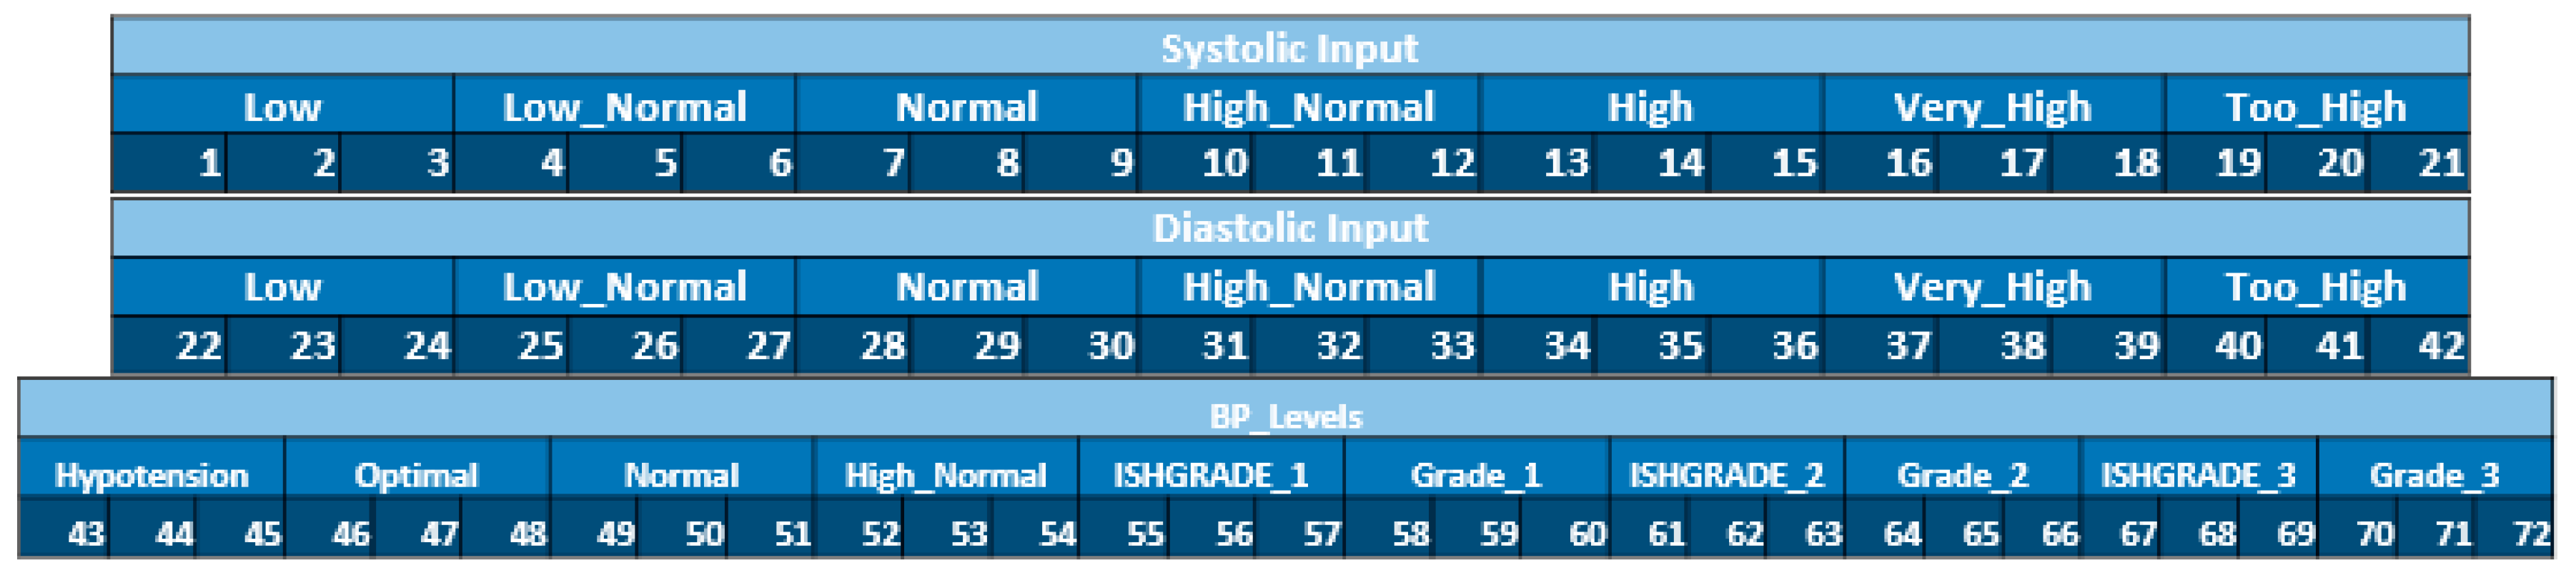
3.6.4. Fuzzy Rules for the Type-1 and Interval Type-2 FS with the Different Architectures.

In previous work we have worked with the optimization of fuzzy rules, for which we already have the optimal number of fuzzy rules based on the optimization made previously, that is why the fuzzy rules are listed below, it should be noted that the same fuzzy rules were used for each architecture of the different type 1 and type 2 fuzzy systems.
  • If (Systolic is Low) and (Diastolic is Low) then (BP_Levels is Hypotension)
  • If (Systolic is Low_Normal) and (Diastolic is Low_Normal) then (BP_Levels is Optimal)
  • If (Systolic is Normal) and (Diastolic is Normal) then (BP_Levels is Normal)
  • If (Systolic is High_Normal) and (Diastolic is High_Normal) then (BP_Levels is High_Normal)
  • If (Systolic is High) and (Diastolic is High) then (BP_Levels is Grade_1)
  • If (Systolic is Very_high) and (Diastolic is Very_High) then (BP_Levels is Grade_2)
  • If (Systolic is too_high) and (Diastolic is Too_High) then (BP_Levels is Grade_3)
  • If (Systolic is Very_high) and (Diastolic is High) then (BP_Levels is Grade_2)
  • If (Systolic is too_high) and (Diastolic is Very_High) then (BP_Levels is Grade_3)
  • If (Systolic is too_high) and (Diastolic is High) then (BP_Levels is Grade_3)
  • If (Systolic is High) and (Diastolic is Very_High) then (BP_Levels is Grade_2)
  • If (Systolic is High) and (Diastolic is Too_High) then (BP_Levels is Grade_3)
  • If (Systolic is Very_high) and (Diastolic is Too_High) then (BP_Levels is Grade_3)
  • If (Systolic is High) and (Diastolic is Normal) then (BP_Levels is ISHGRADE_1)
  • If (Systolic is High) and (Diastolic is High_Normal) then (BP_Levels is ISHGRADE_1)
  • If (Systolic is Very_high) and (Diastolic is Normal) then (BP_Levels is ISHGRADE_2)
  • If (Systolic is Very_high) and (Diastolic is High_Normal) then (BP_Levels is ISHGRADE_2)
  • If (Systolic is too_high) and (Diastolic is Normal) then (BP_Levels is ISHGRADE_3)
  • If (Systolic is too_high) and (Diastolic is High_Normal) then (BP_Levels is ISHGRADE_3)
  • If (Systolic is Normal) or (Diastolic is Normal) then (BP_Levels is Normal)
  • If (Systolic is High_Normal) or (Diastolic is High_Normal) then (BP_Levels is High_Normal)

4. Knowledge Representation of the Optimized Type-1 and Interval Type-2 Fuzzy Systems

In this part, we show the knowledge representation of the type-1 FS with triangular membership functions.
The crisp output is calculated as follows: If the number of fired rules is r then the final BP level is:
B P = i = 1 r B P i   L i   i = 1 r L i  
where L i is the firing level and B P i is the crisp output of the if-th rule.
The triangular curve is a function of a vector, x and depends on three scalar parameters a, b and c, as given by
f ( x ; a ,   b ,   c ) = { 0 x a x a b a , a x b c   x c b , b x c 0 , c x

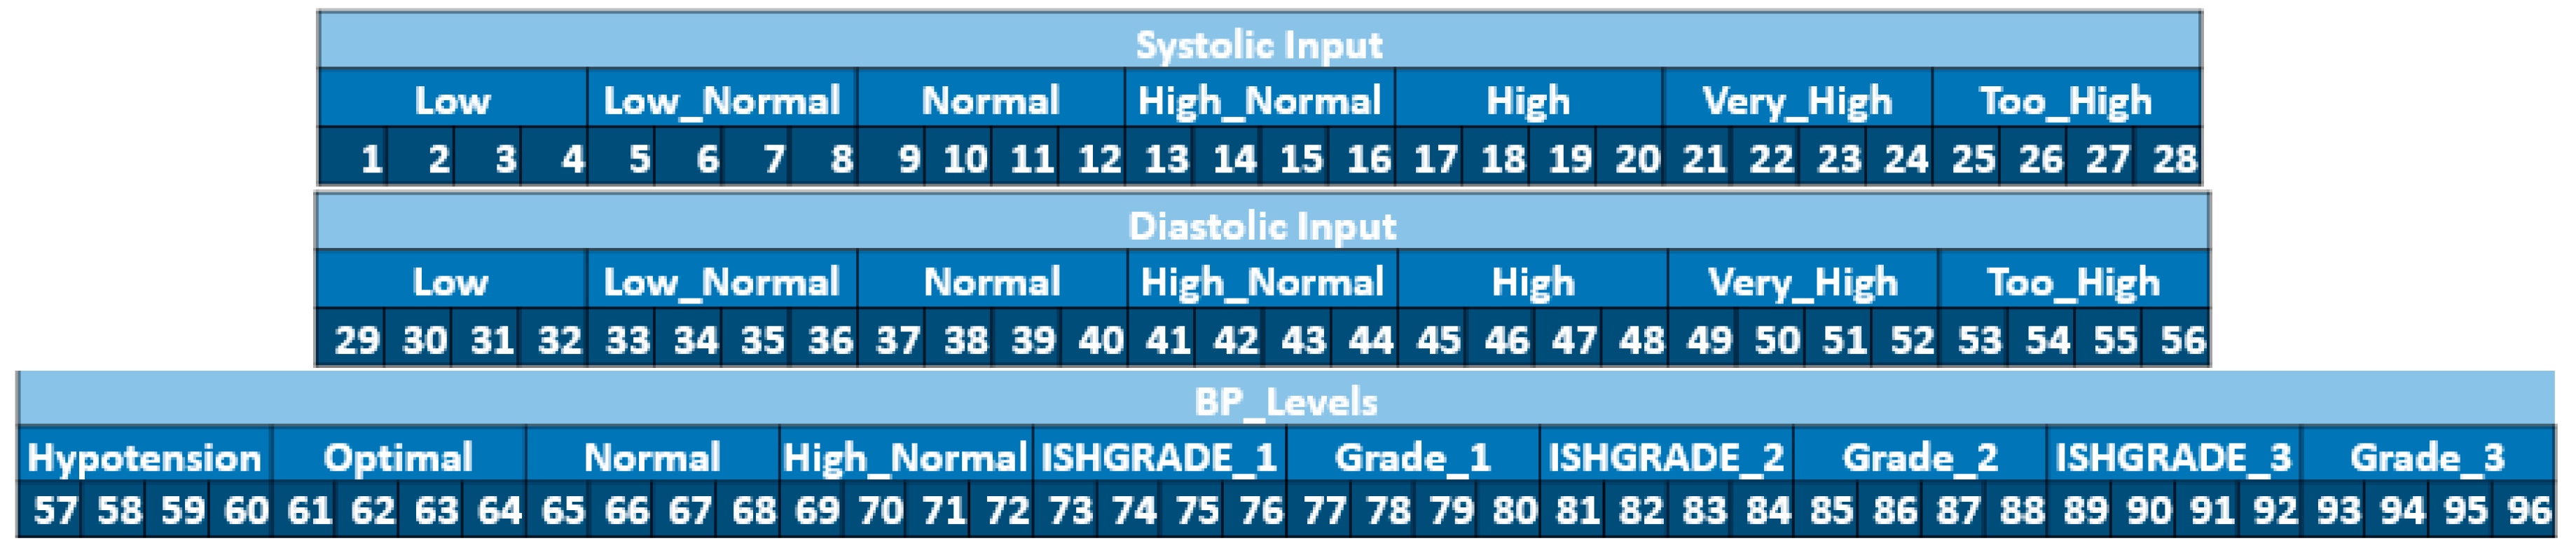
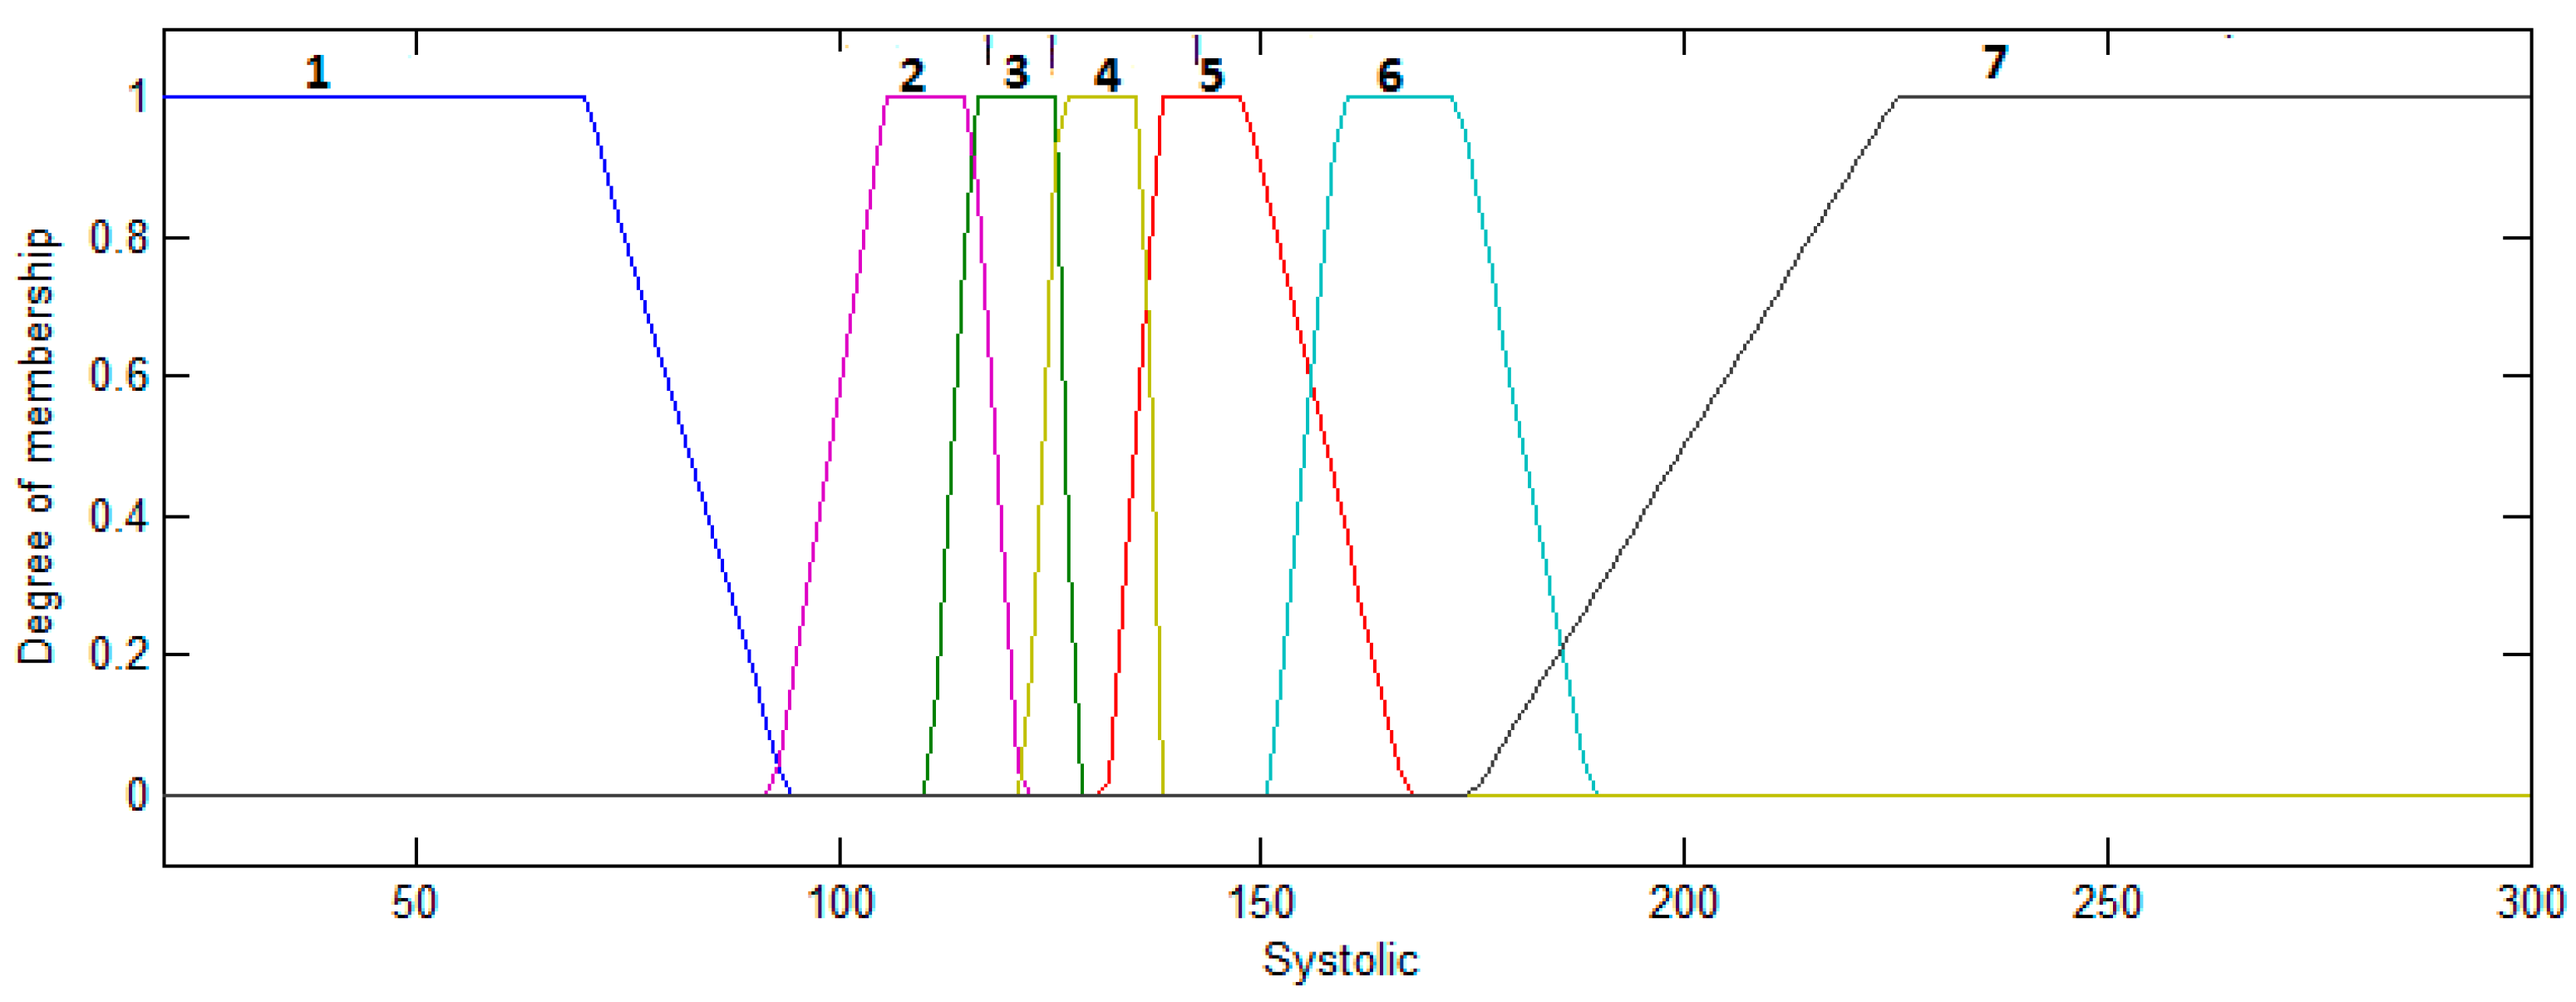
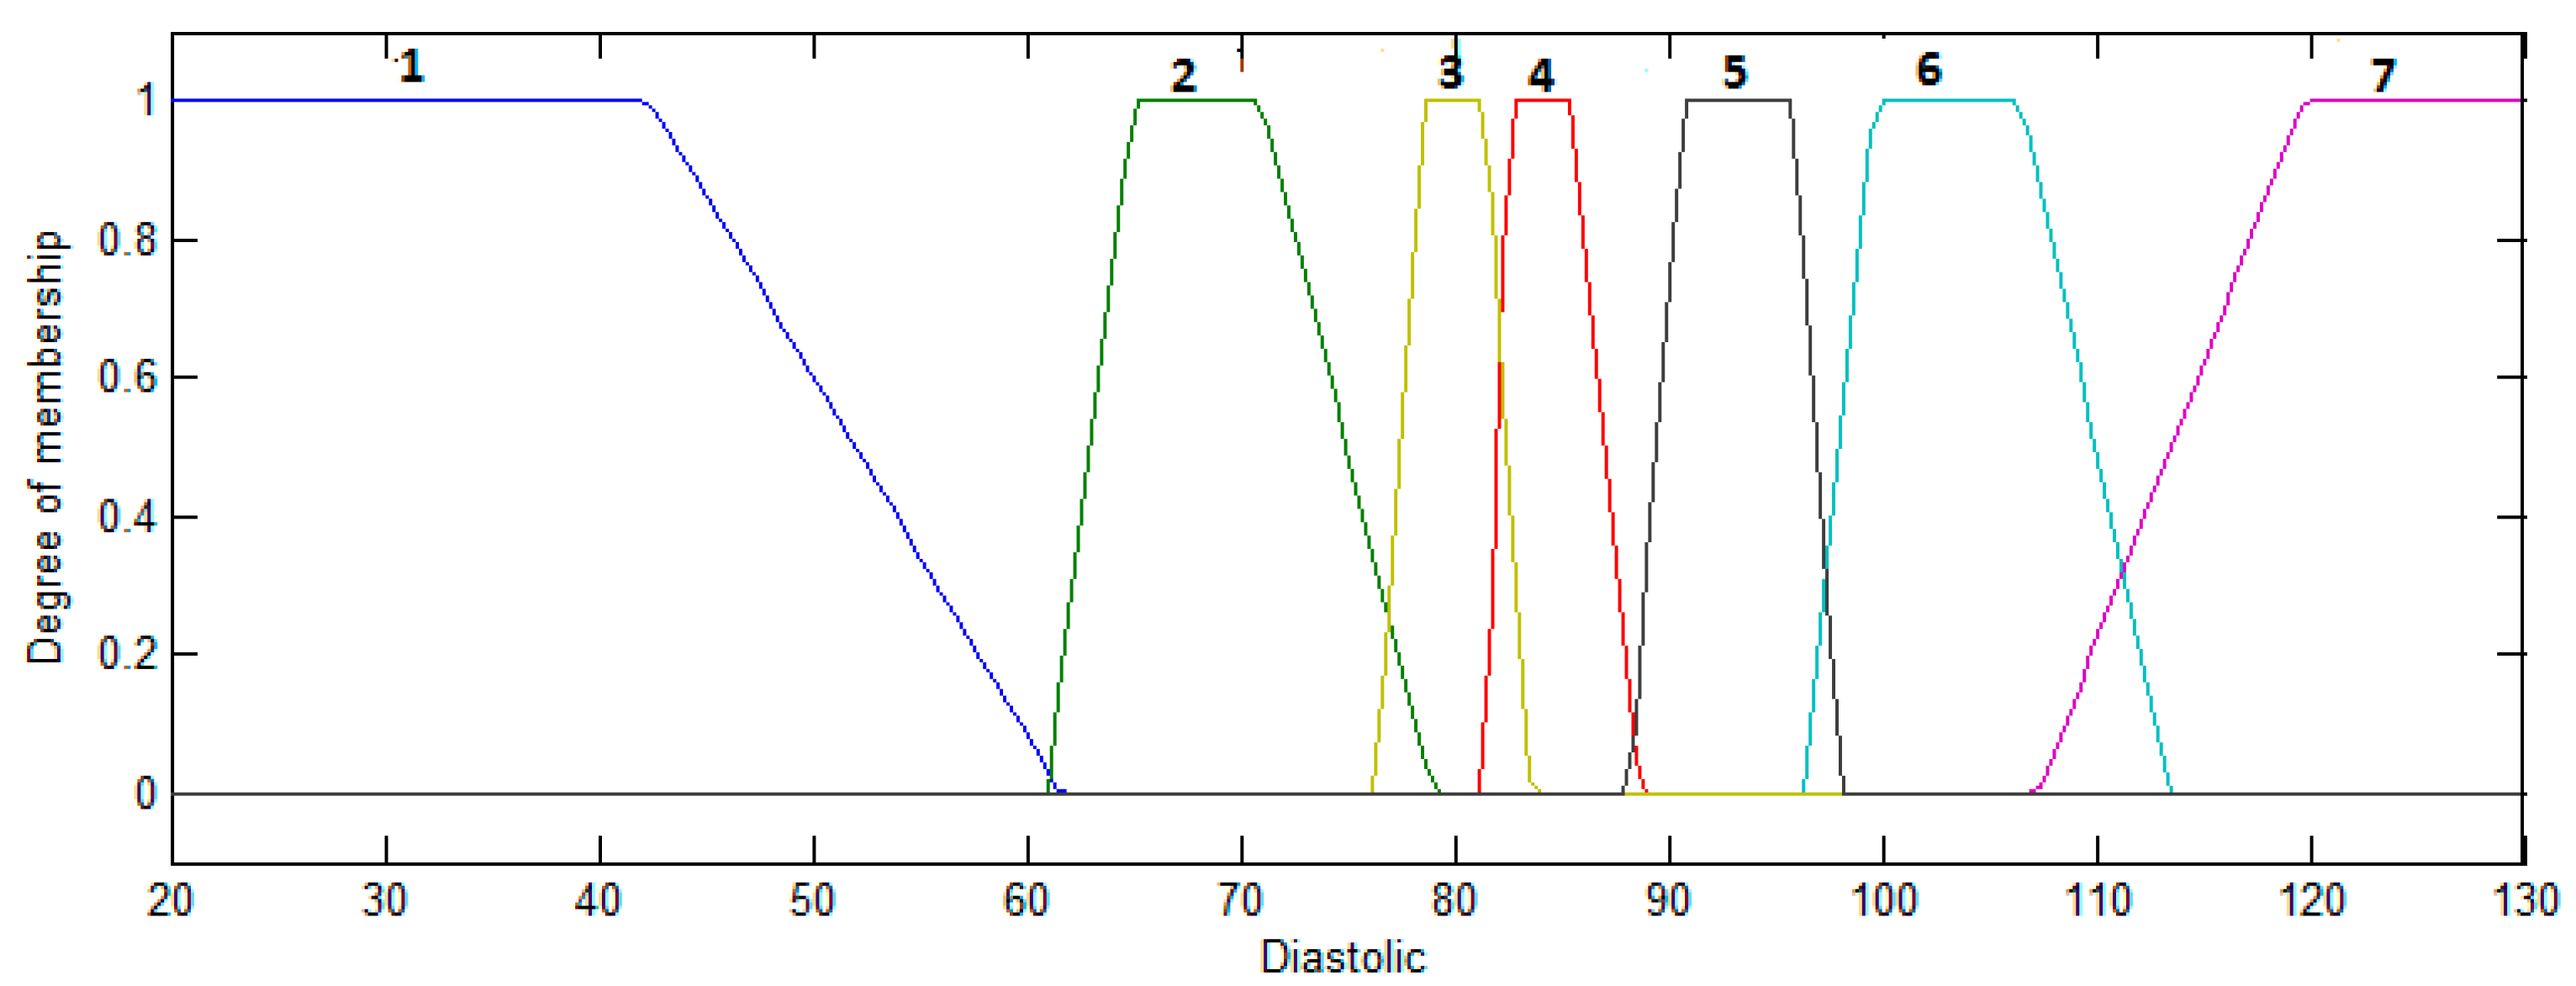
4.1. Input and Output Variables for Triangular Type-1 Fuzzy System

To design a FS, we must determine the input and output linguistic variables, in this FS, we have two inputs and one output.

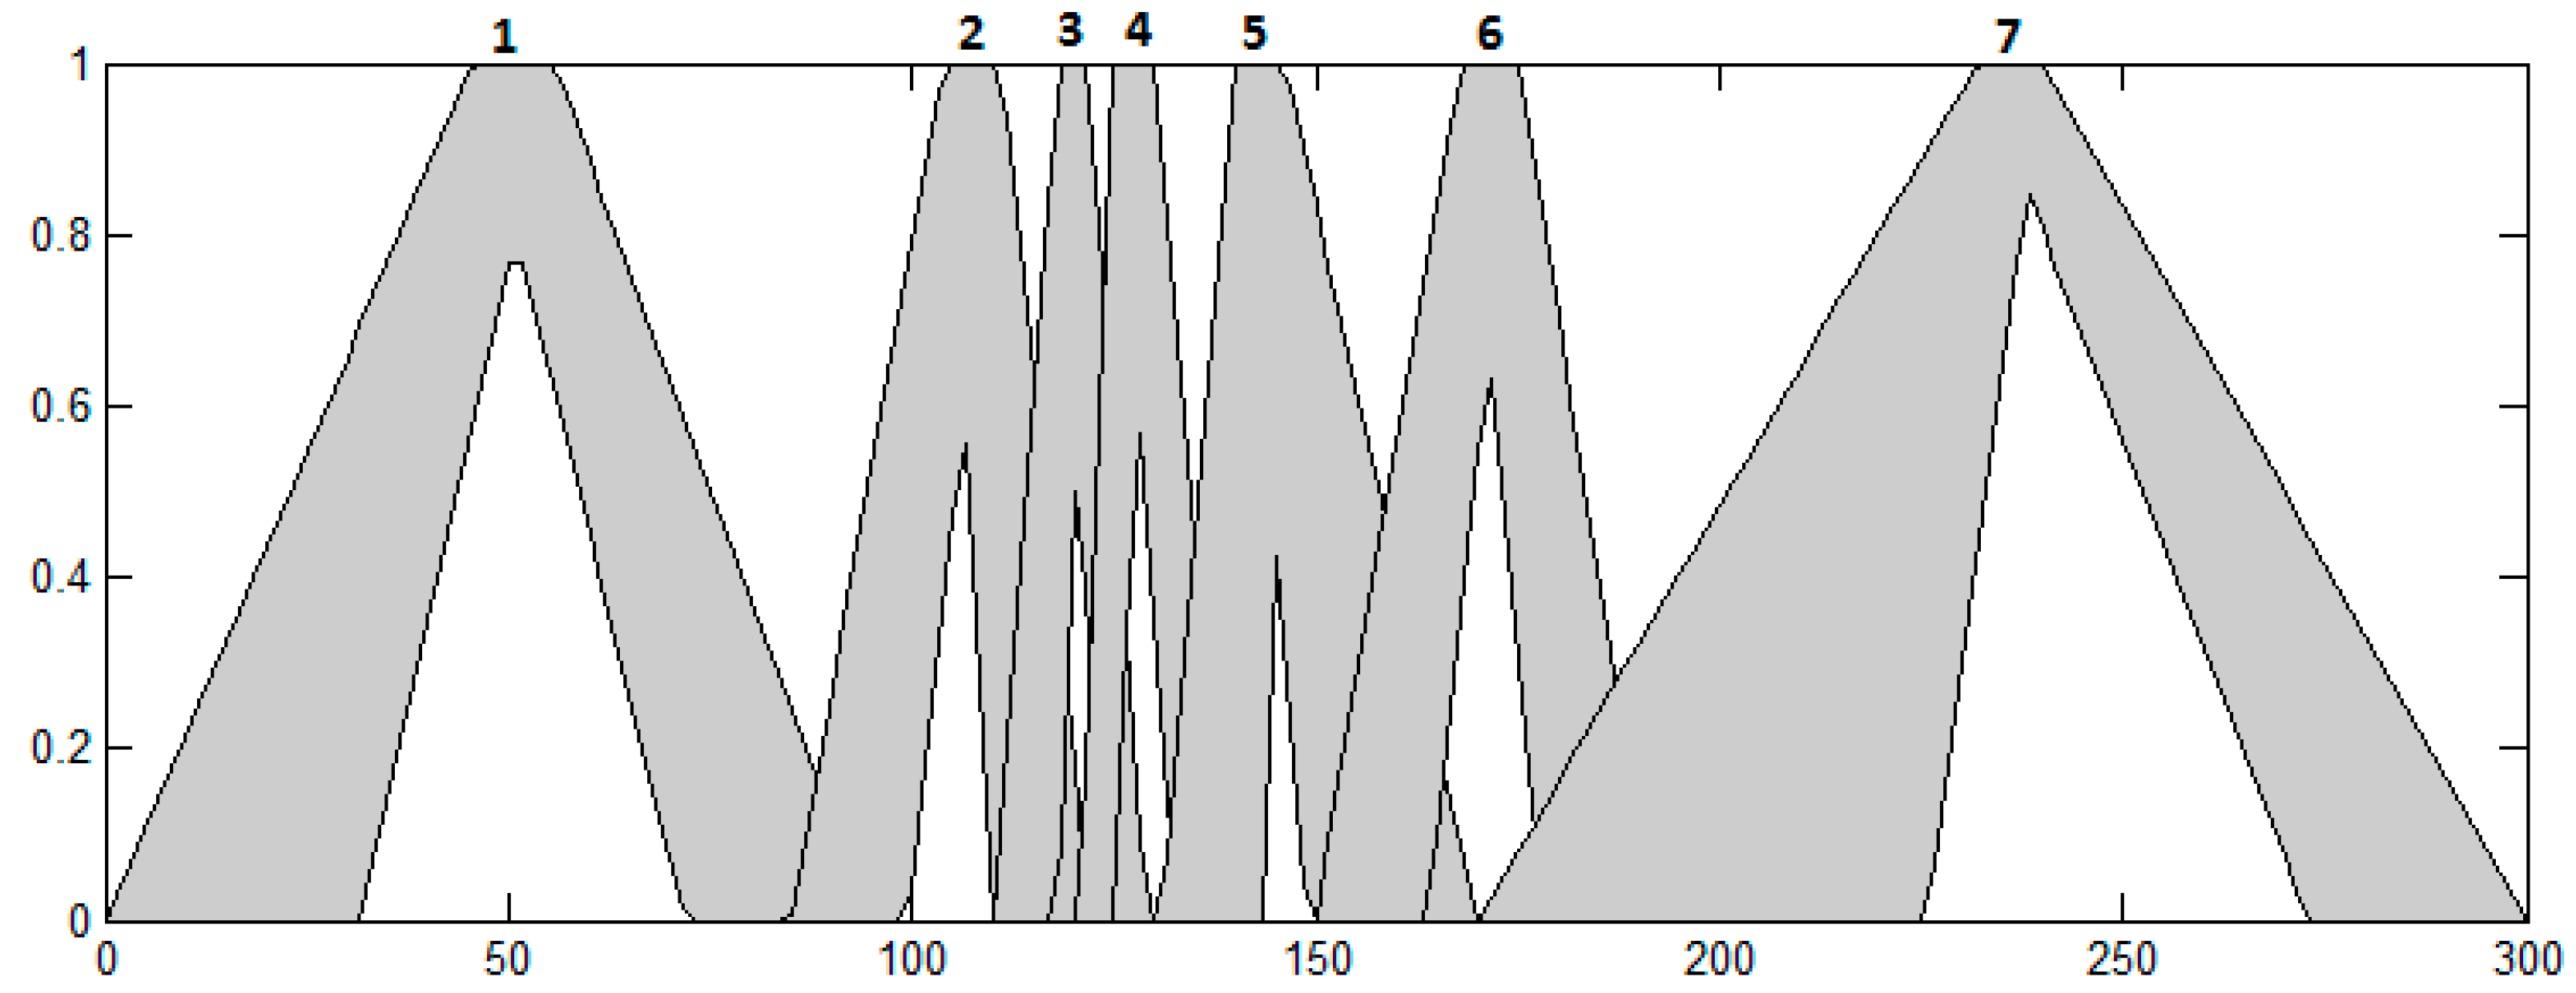
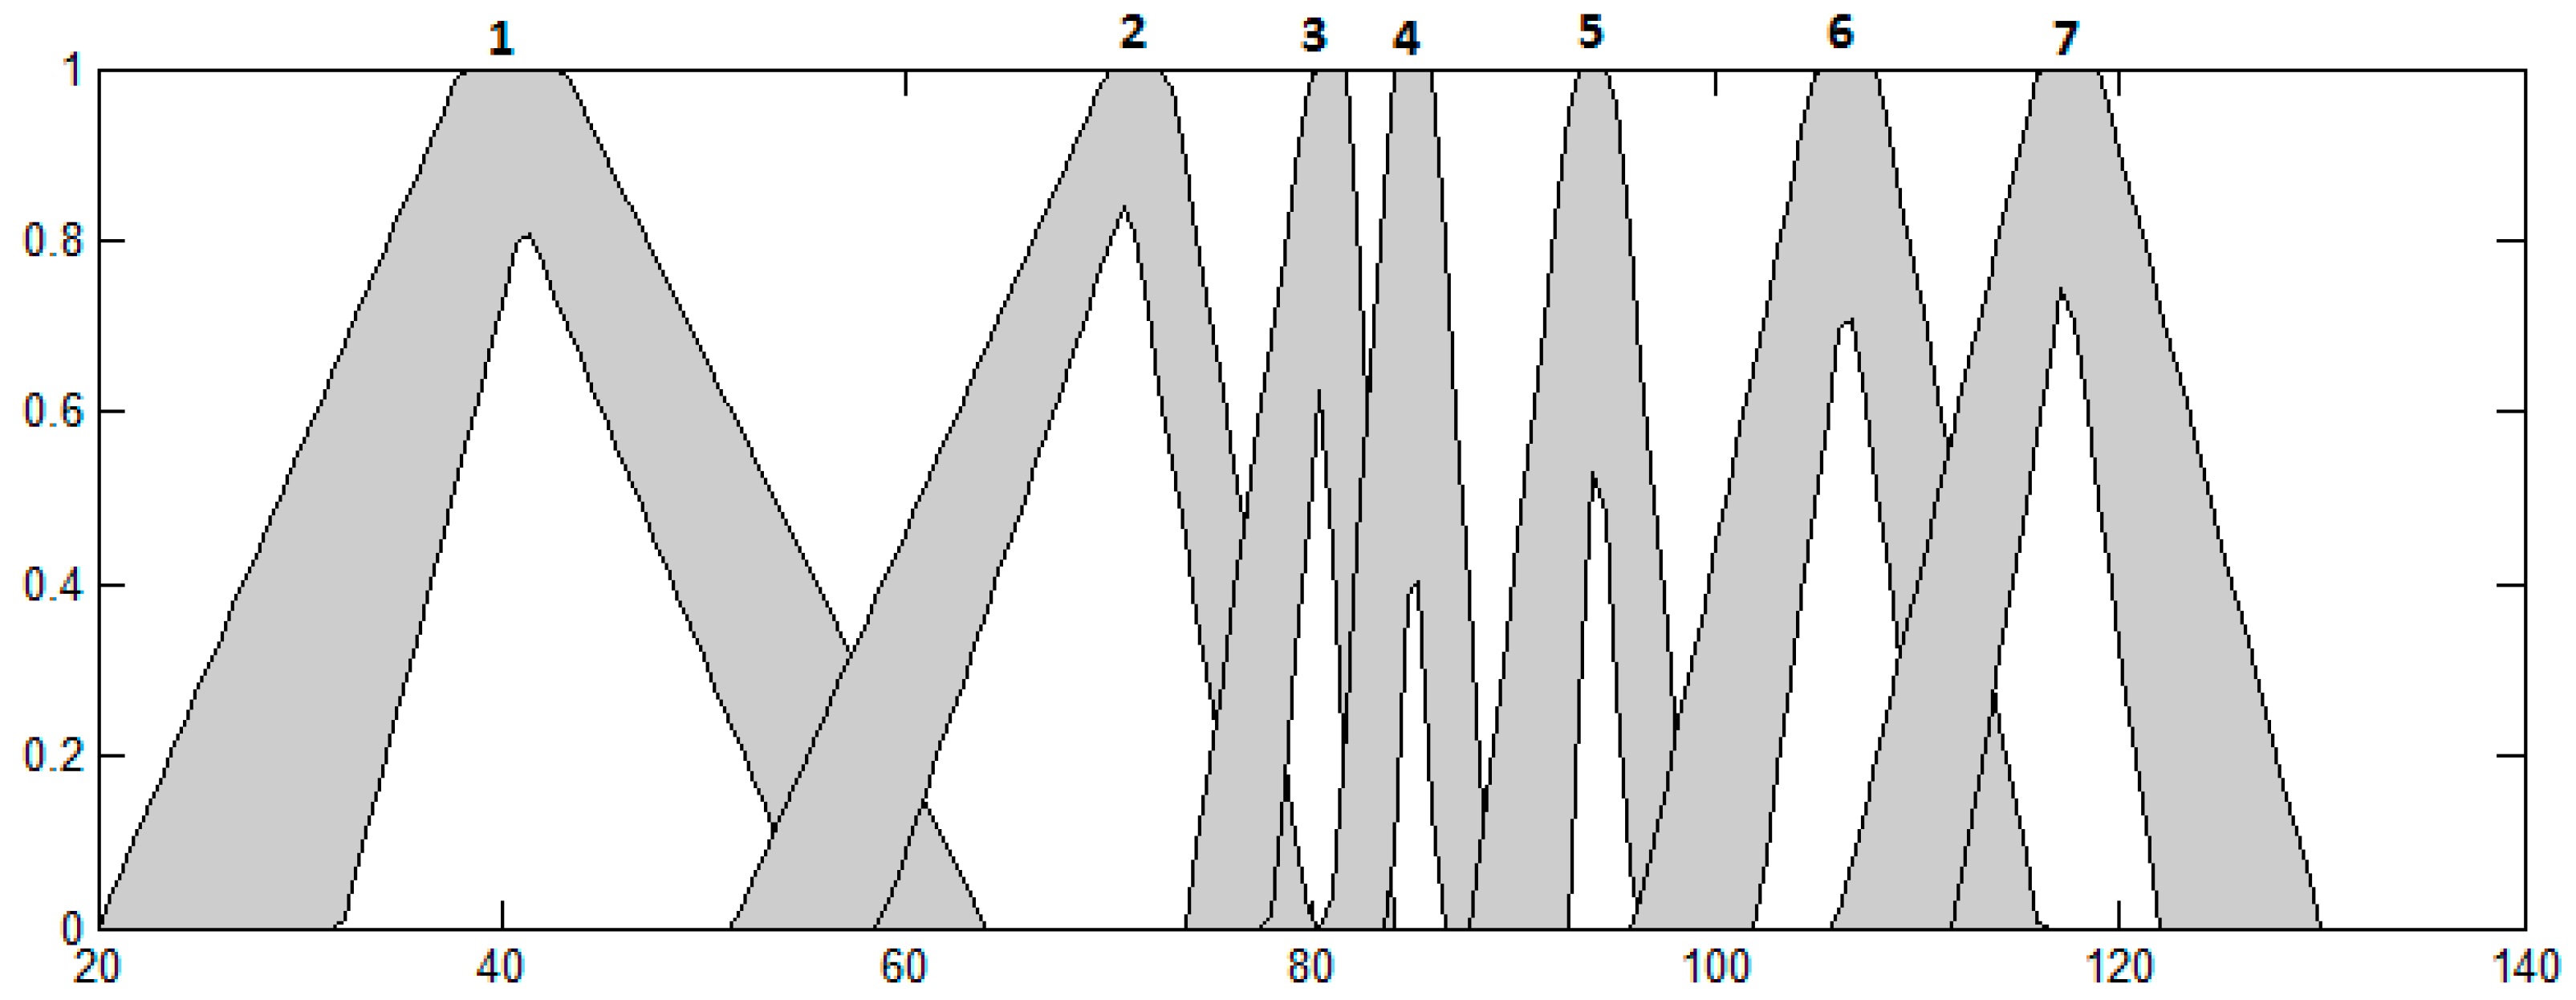
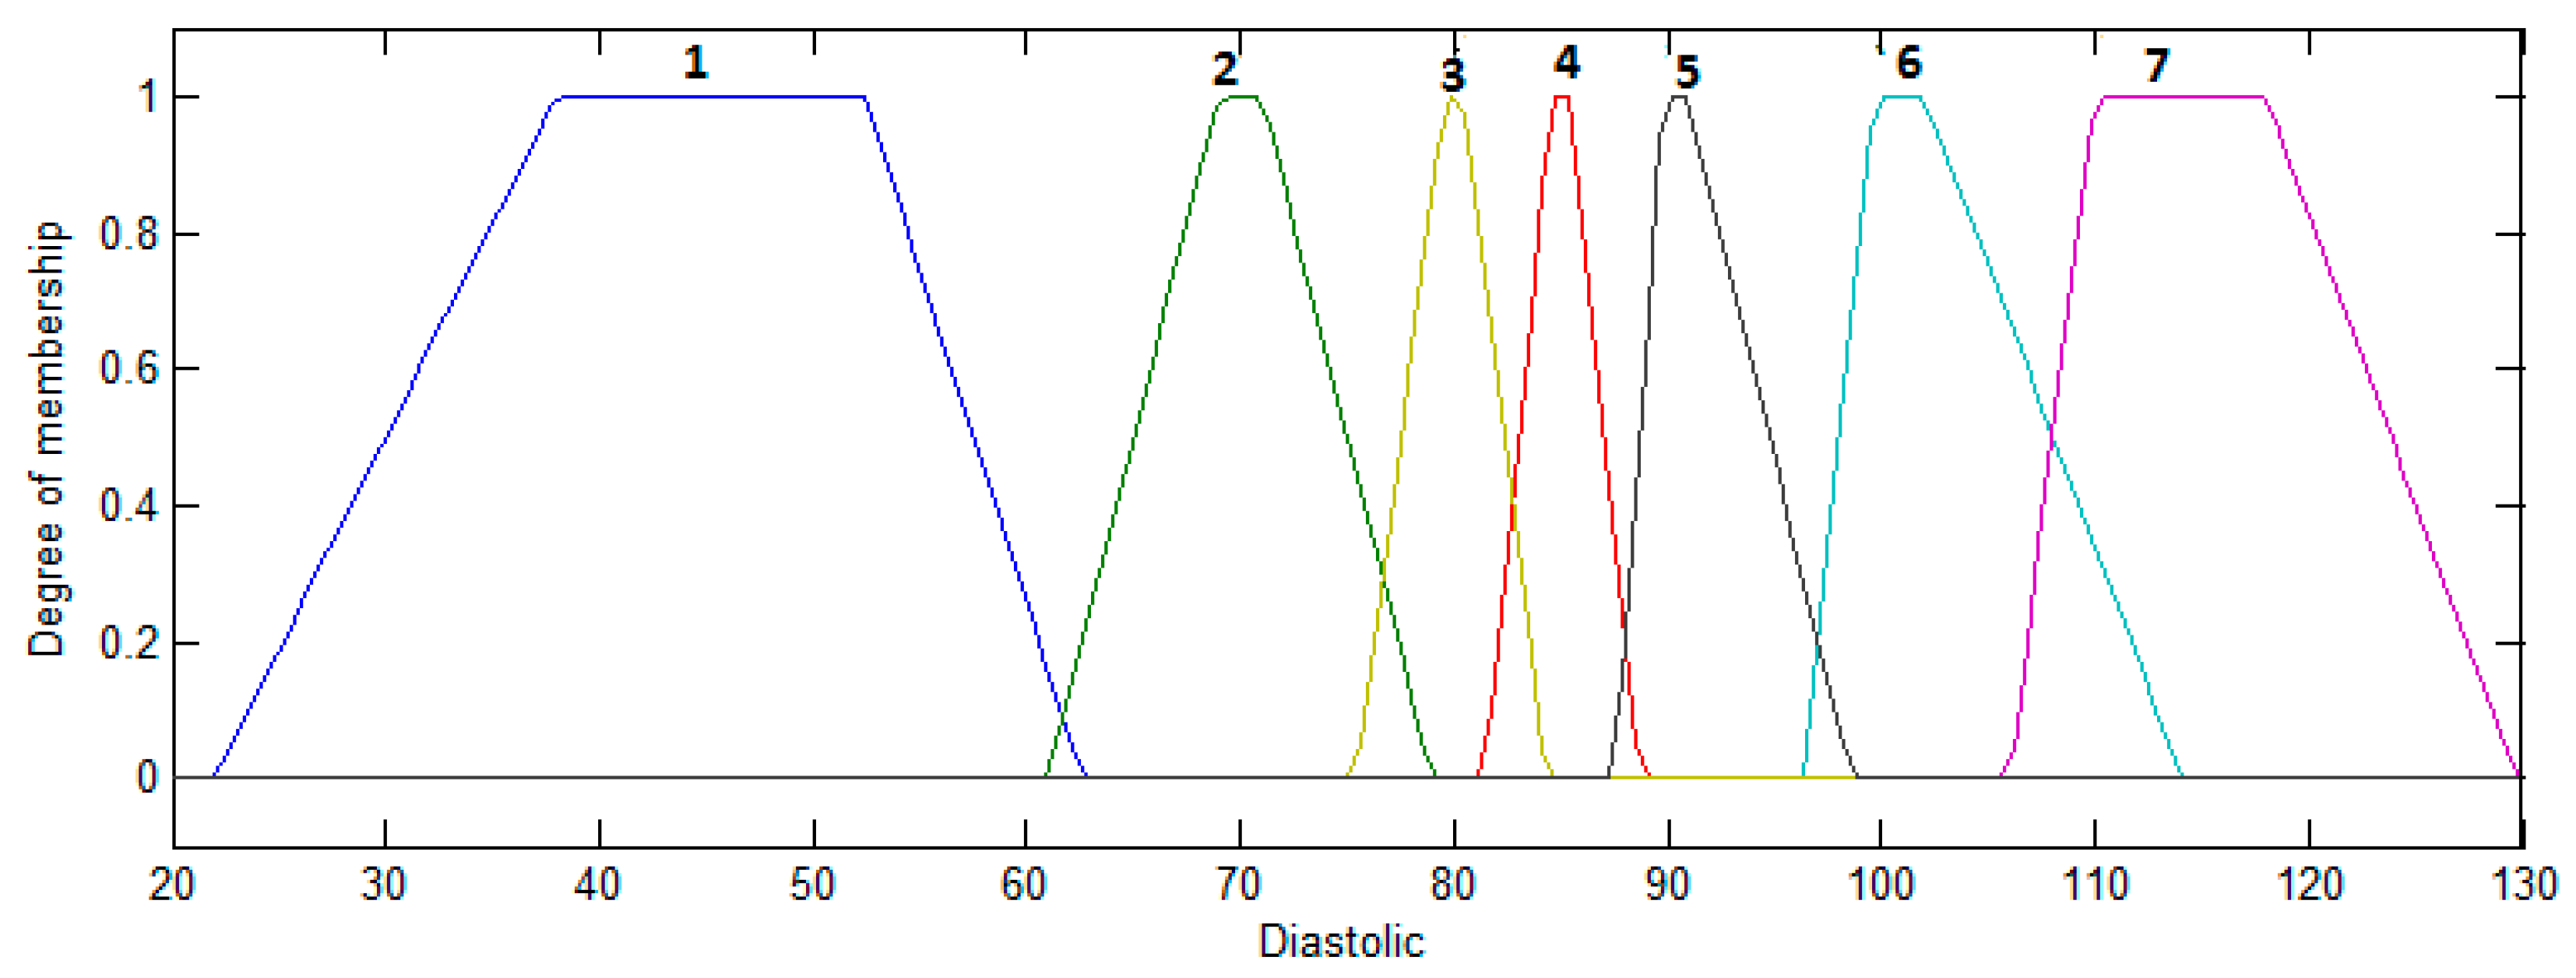
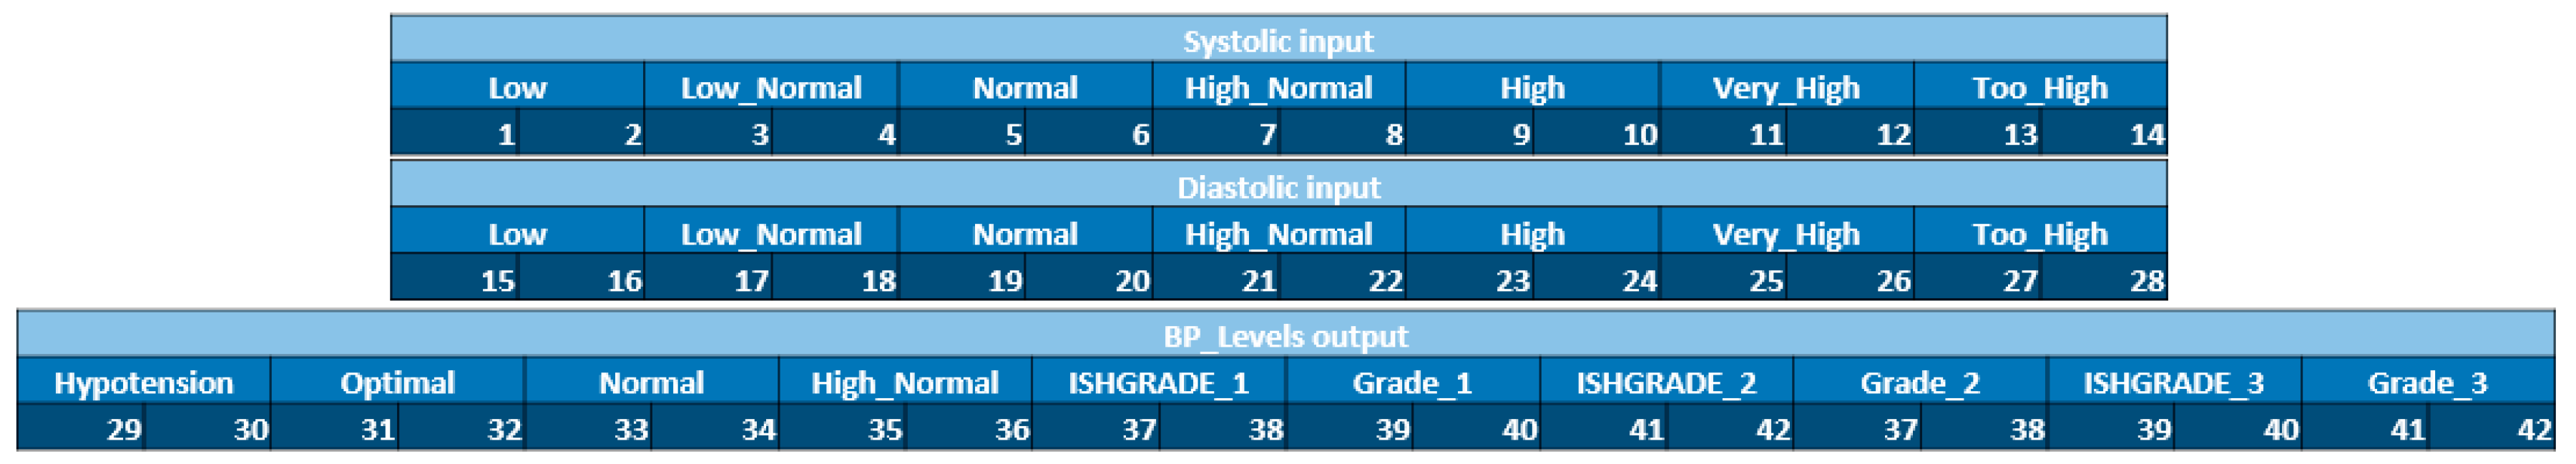
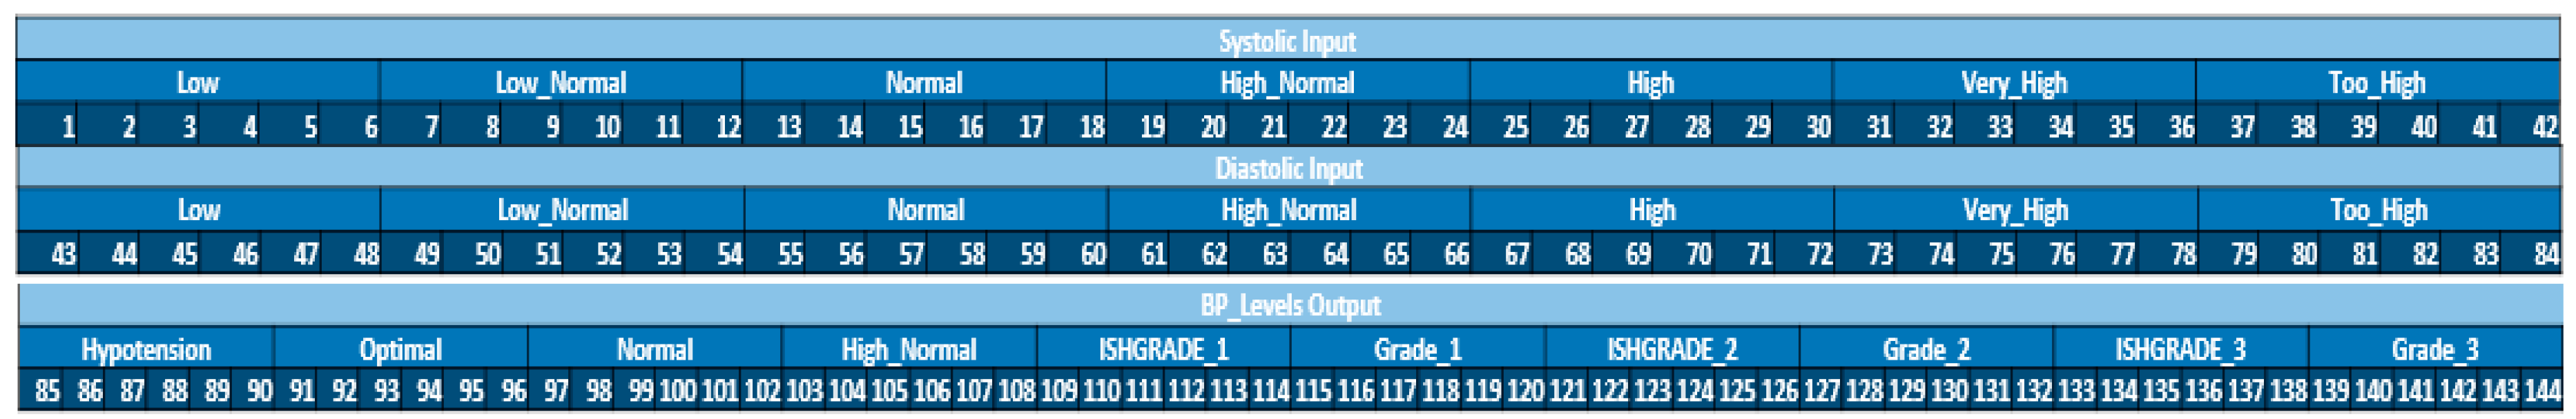
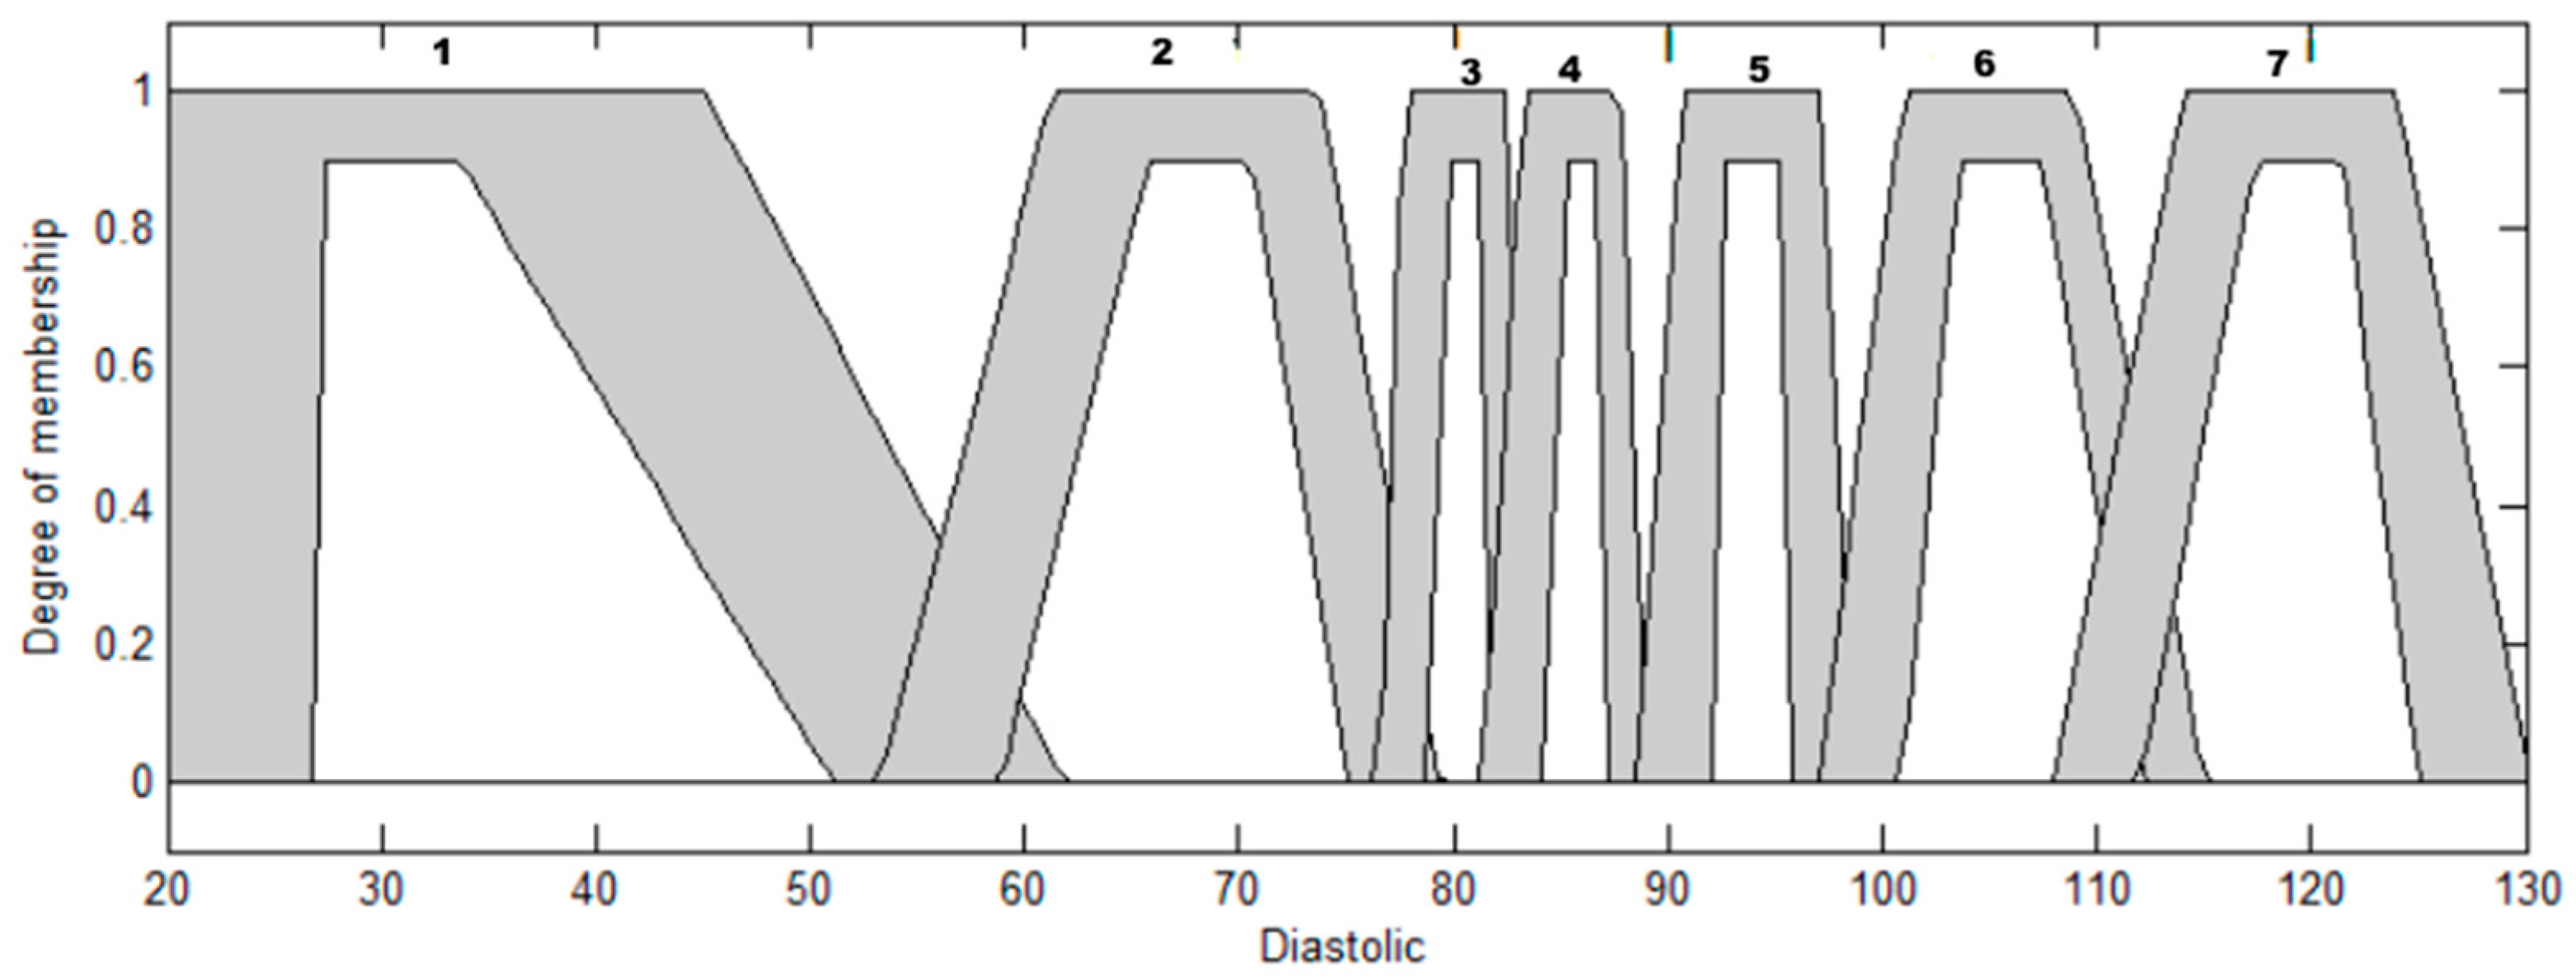
4.1.1. Input Variables

1. Systolic. This variable has the following membership functions (MFS): Low, Low_normal, Normal, High_normal, High, Very_high, Too_high. This MFS are listed below:
µ L o w ( x ) = [ 0 , x 20.2 x   20.2 50.15 , 20.2 x 70.35 94.21   x 23.86 , 70.35 x 94.21 0 , 94.21 x
µ L o w _ N o r m a l ( x ) = [ 0 , x 90.15 x   90.15 25.06 , 90.15 x 115.21 122.3   x 7.09 , 115 x 122.3 0 , 122.3 x
µ N o r m a l ( x ) = [ 0 , x 110.25 x   110.25 9.86 , 110.25 x 120.11 129.1   x 8.99 , 120.11 x 129.1 0 , 129 x
µ H i g h _ N o r m a l ( x ) = [ 0 , x 121.1 x   121.1 9.11 , 121 x 130.21 139.2   x 8.99 , 130.21 x 139.2 0 , 139.2 x
µ H i g h ( x ) = [ 0 , x 131 x   131 9.3 , 131 x 140.3 170.17   x 29.87 , 140.3 x 170.17 0 , 170.17 x
µ V e r y _ h i g h ( x ) = [ 0 , x 150.23 x   150.23 9.77 , 150.23 x 160 192.12   x 32.12 , 160 x 192.12 0 , 192.12 x
µ T o o _ h i g h ( x ) = [ 0 , x 170.35 x   170.35 49.78 , 170.35 x 220.1 300.26   x 80.16 , 220.1 x 300.26 0 , 300.26 x
2. Diastolic. This variable has the following membership functions (MFS): Low, Low_normal, Normal, High_normal, High, Very_high, Too_high. This MFS are listed below:
µ L o w ( x ) = [ 0 , x 20.16 x   20.16 20.04 , 20.16 x 40.2 64.1   x 23.9 , 40.2 x 64.1 0 , 64.1 x
µ L o w _ N o r m a l ( x ) = [ 0 , x 60.2 x   60.2 9.93 , 60.2 x 70.13 80.22   x 10.09 , 70.13 x 80.22 0 , 80.22 x
µ N o r m a l ( x ) = [ 0 , x 76.07 x   76.07 4.03 , 76.07 x 80.1 84.2   x 4.1 , 80.1 x 84.2 0 , 84.2 x
µ H i g h _ N o r m a l ( x ) = [ 0 , x 81.2 x   81.2 3.8 , 81.2 x 85 89.2   x 4.2 , 85 x 89.2 0 , 89.2 x
µ H i g h ( x ) = [ 0 , x 88.14 x   88.14 1.96 , 88.14 x 90.1 99.1   x 9 , 90.1 x 99.1 0 , 99.1 x
µ V e r y _ h i g h ( x ) = [ 0 , x 96.32 x   96.32 3.9 , 96.32 x 100.22 115.31   x 15.09 , 100.22 x 115.31 0 , 115.31 x
µ T o o _ h i g h ( x ) = [ 0 , x 107.15 x   107.15 2.85 , 107.15 x 110 130.1   x 20.1 , 110 x 130.1 0 , 130.1 x

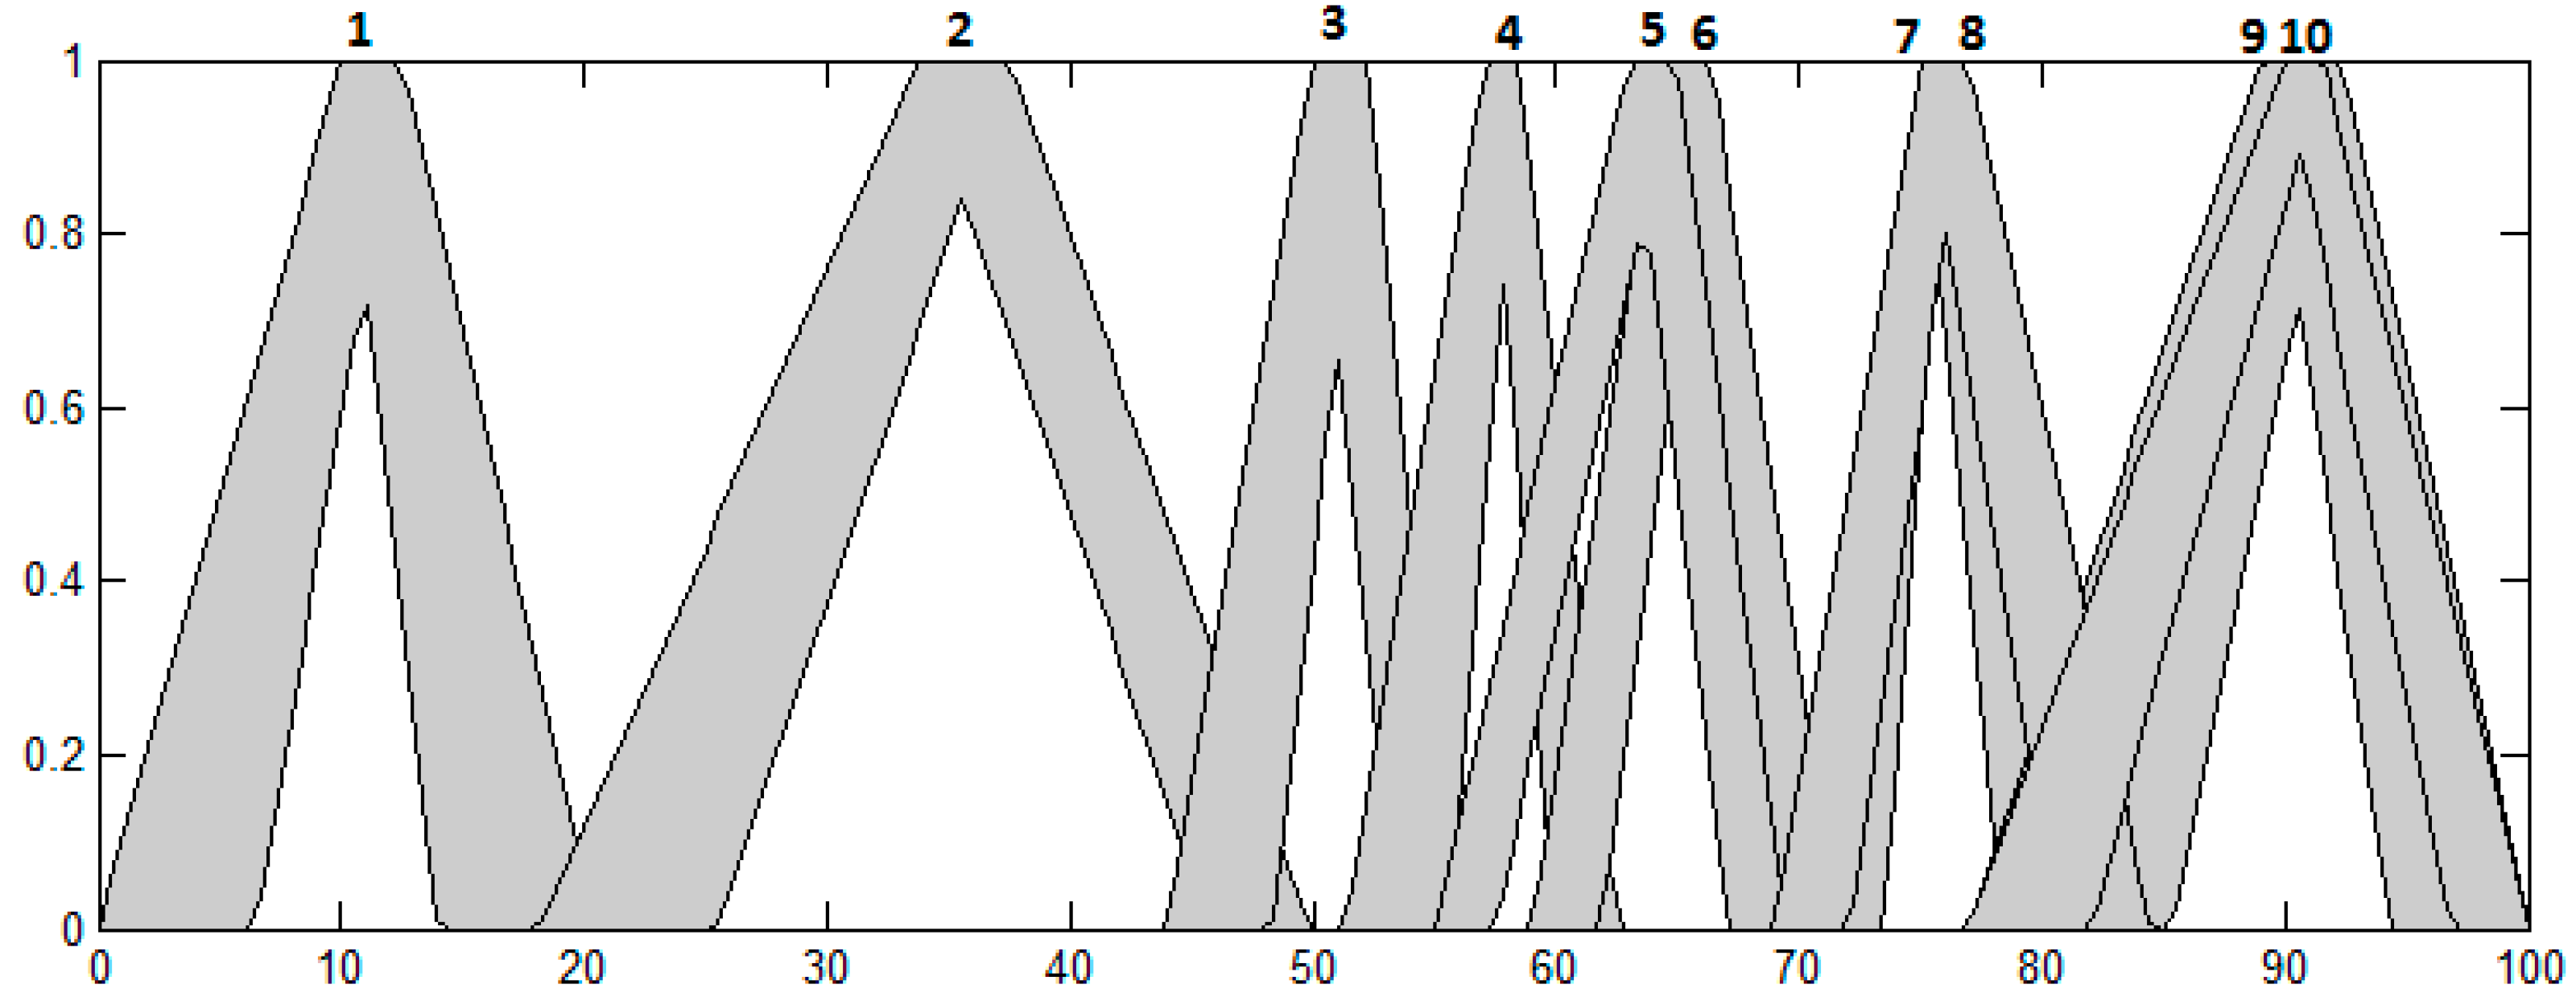
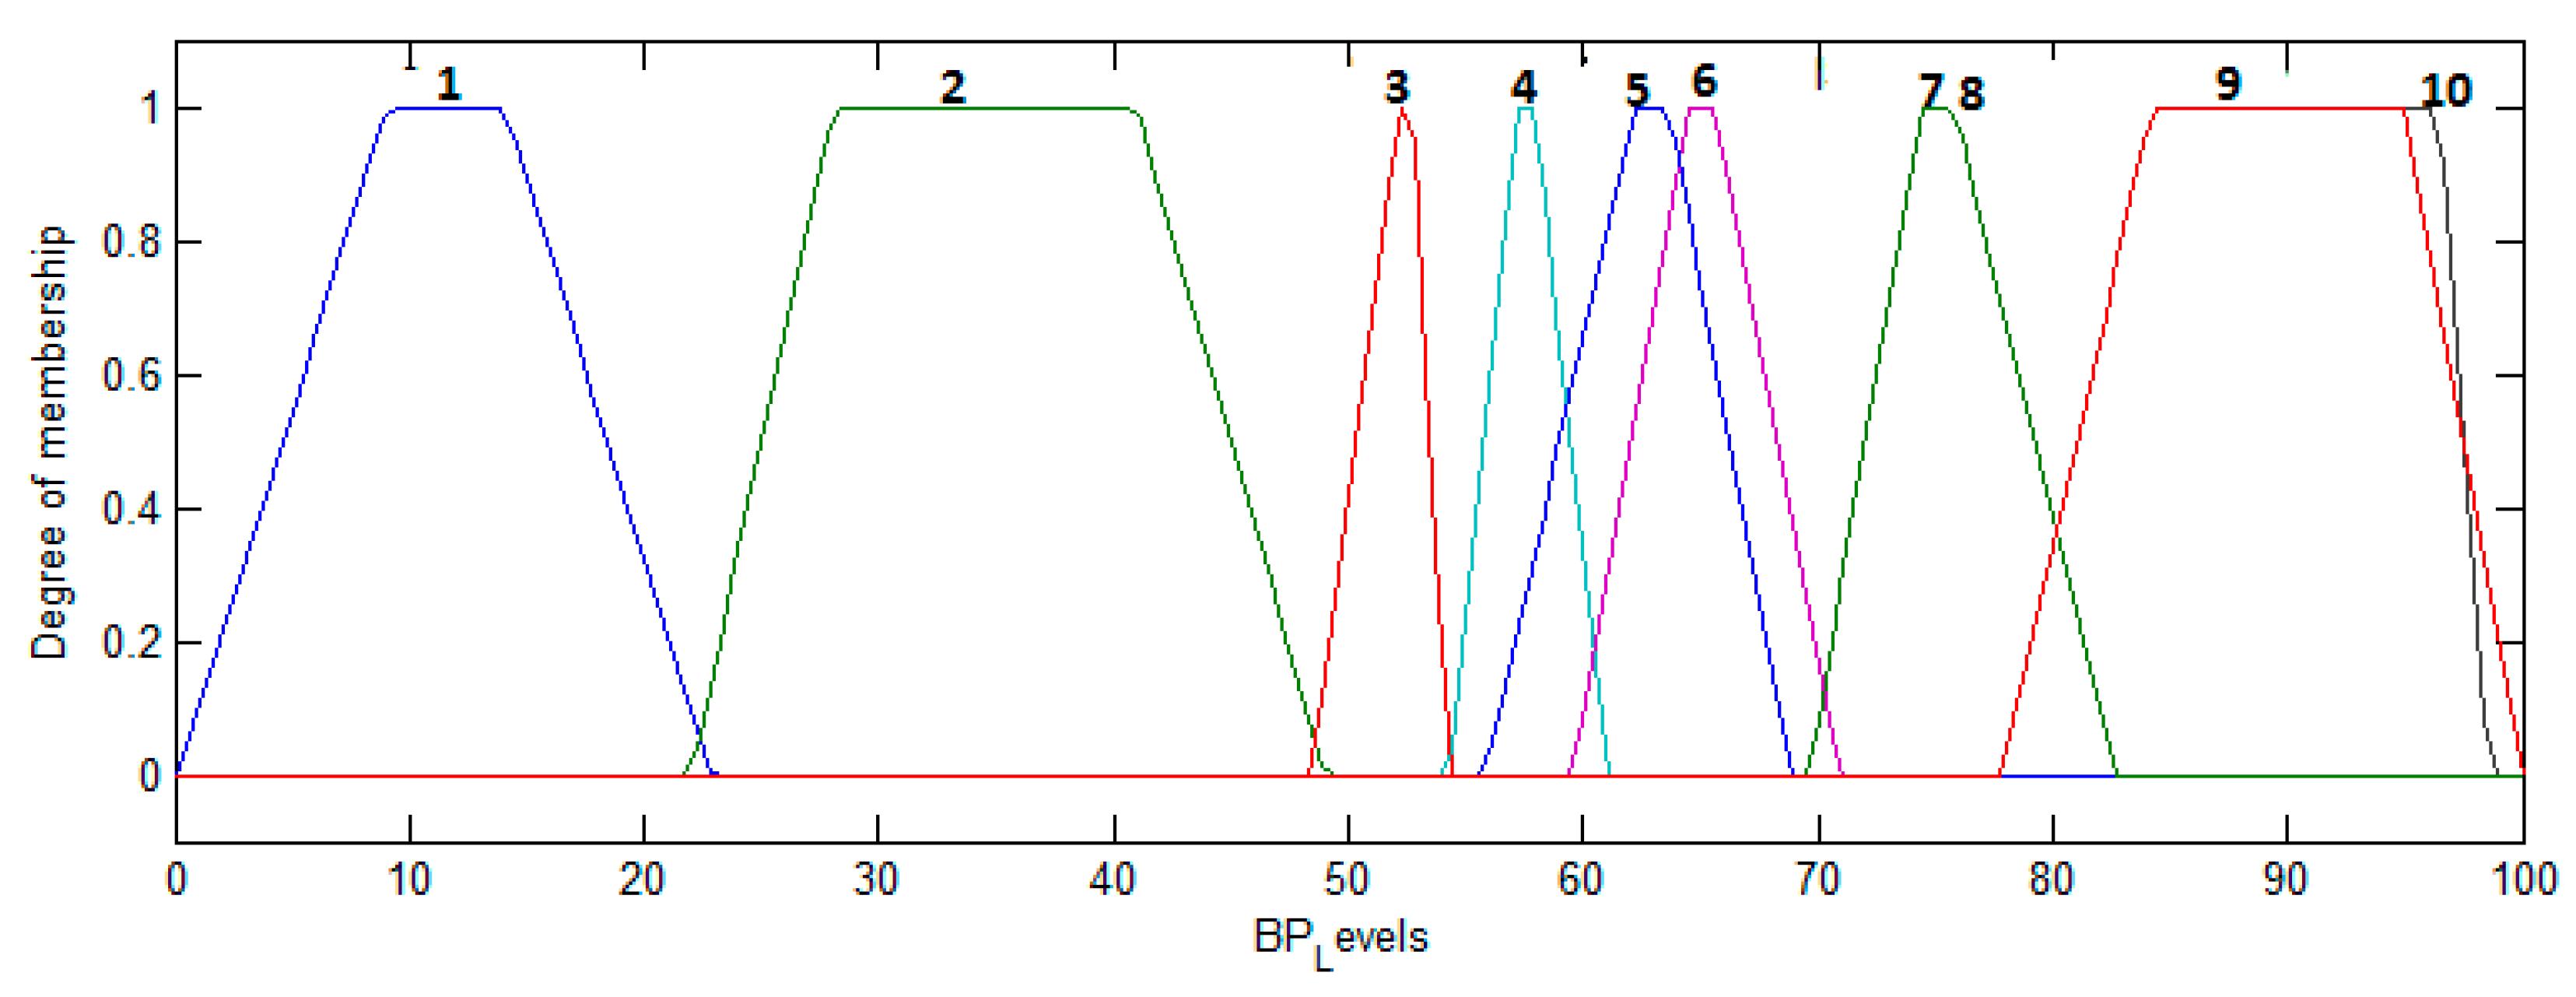
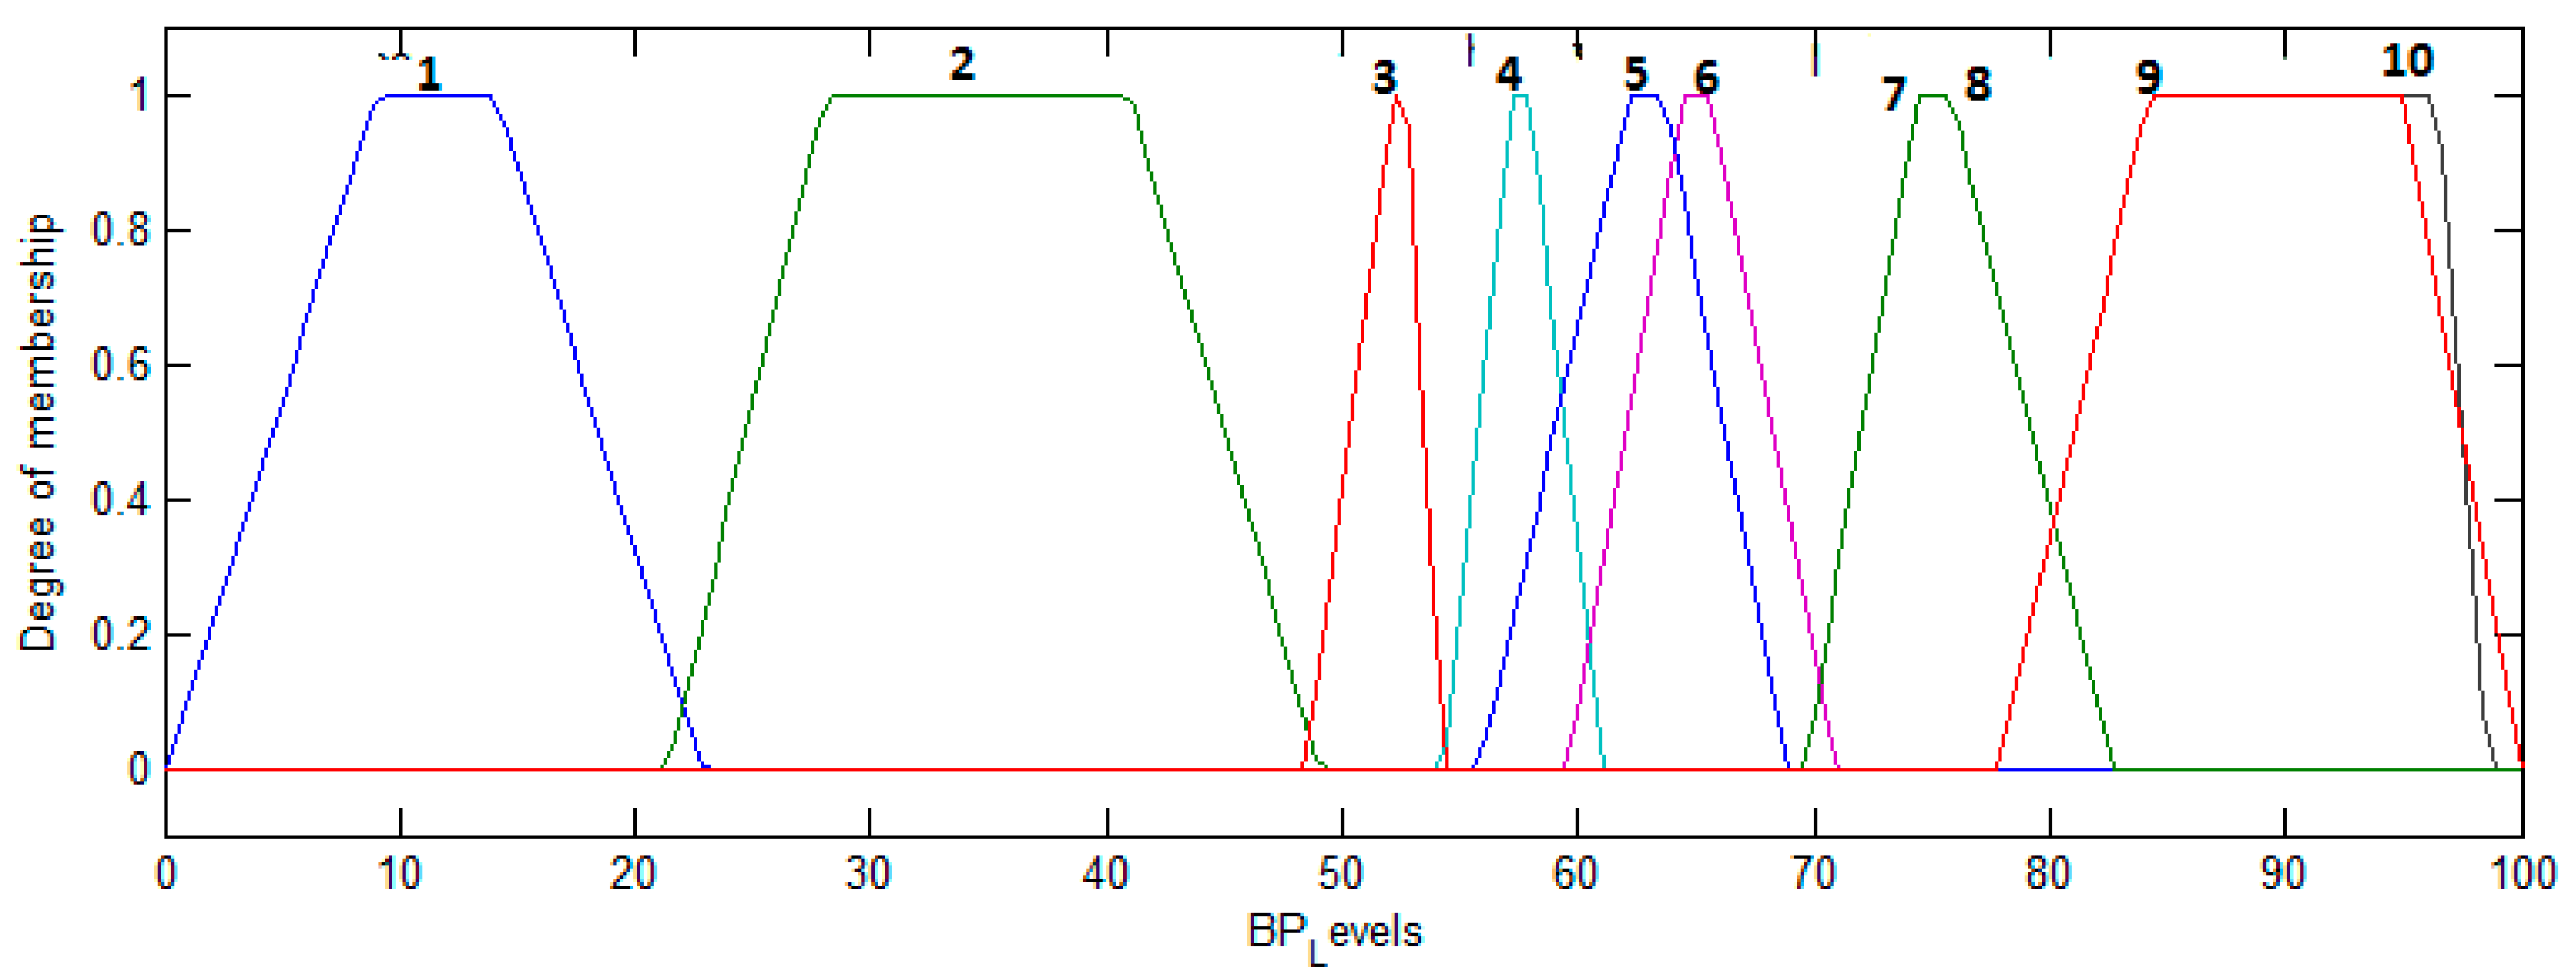
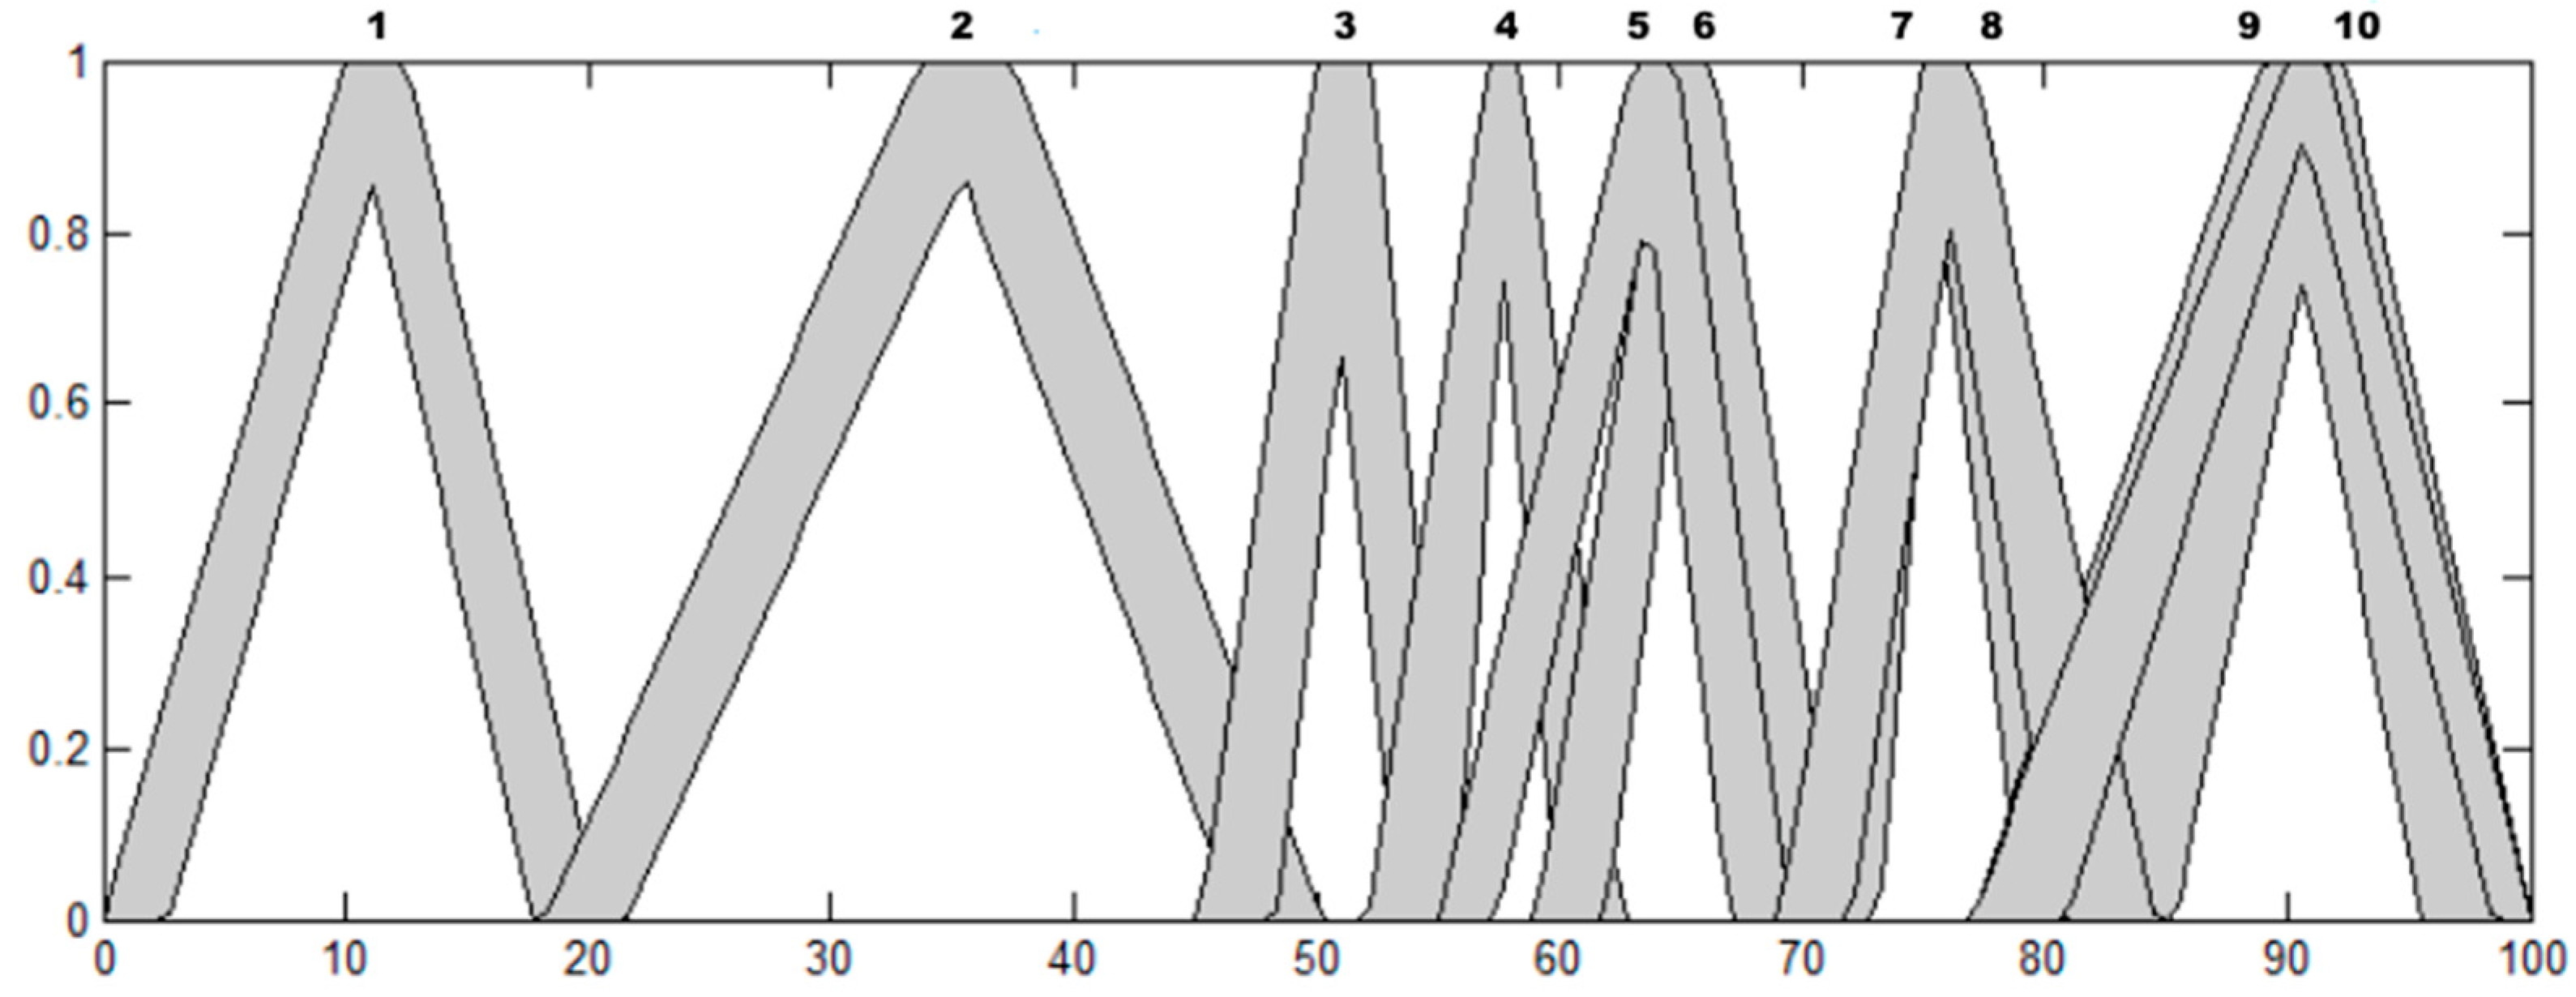
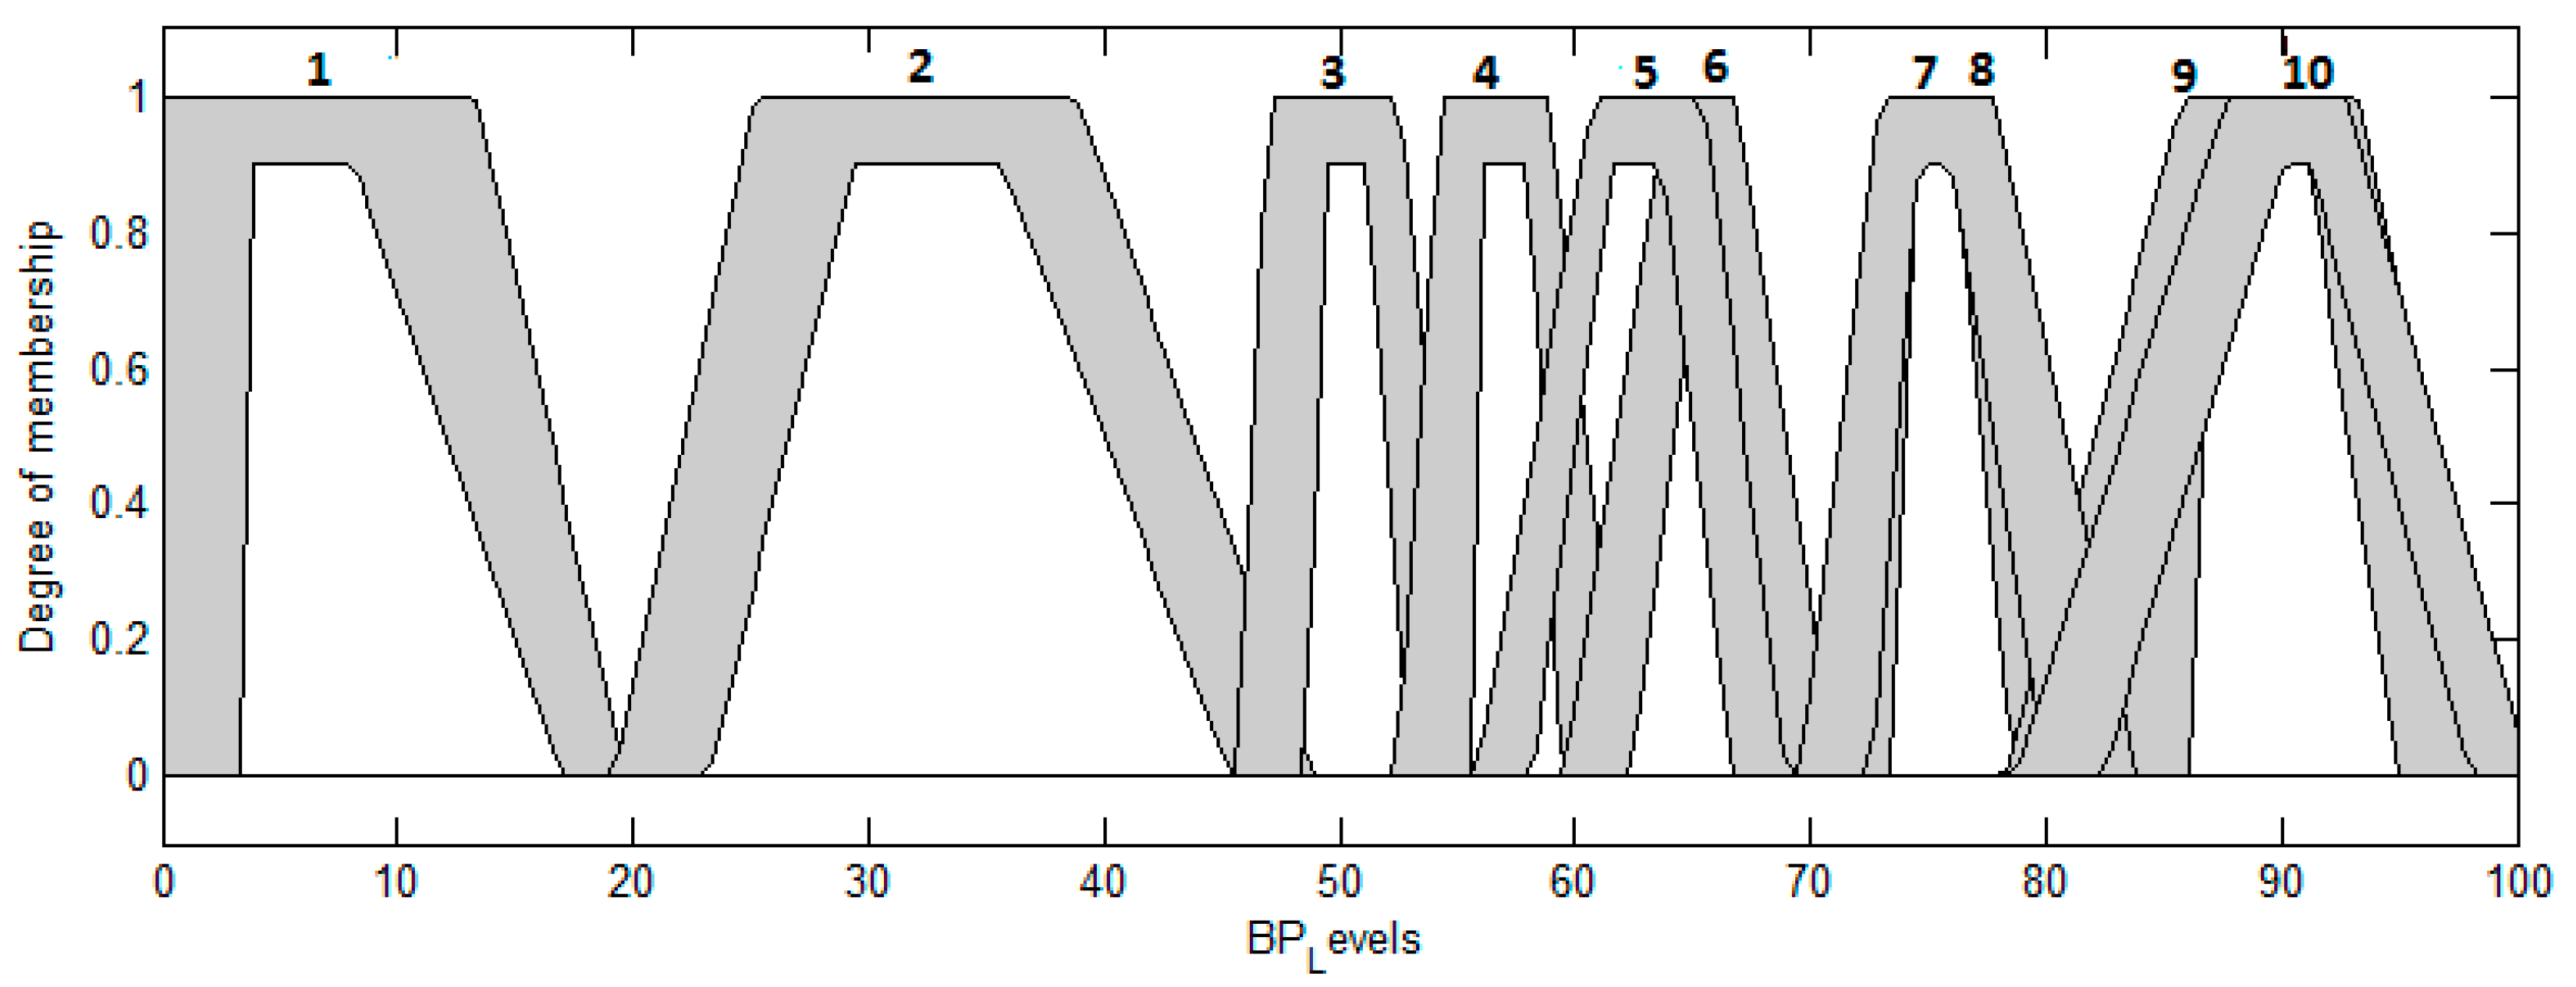
4.1.2. Output Variable

The FS has only one output called BP_LEVELS, which refers to the BP level, the output gives a percentage, which refers to the following BP levels: Hypotension, Optimal, Normal, High_Normal, Grade 1, Grade 2, Grade 3, Isolated systolic hypertension (ISH) Grade 1, ISH Grade 2 and ISH Grade 3. The linguistic value of MFs is shown below:
µ H y p o t e n s i o n ( x ) = [ 0 , x 0 x   0 10.3 , 0 x 10.3 20.5   x 10.2 , 10.3 x 20.5 0 , 20.5 x
µ O p t i m a l   ( x ) = [ 0 , x 20.5 x   20.5 19.5 , 20.5 x 40 50.3   x 10.3 , 40 x 50.3 0 , 50.3 x
µ N o r m a l ( x ) = [ 0 , x 49.3 x   49.3 3.2 , 49.3 x 52.5 54.7   x 2.2 , 52.5 x 54.7 0 , 54.7 x
µ H i g h _ N o r m a l ( x ) = [ 0 , x 54.25 x   54.25 3.25 , 54.25 x 57.5 61.6   x 4.1 , 57.5 x 61.6 0 , 61.6 x
µ G r a d e   1 ( x ) = [ 0 , x 59.1 x   59.1 6.4 , 59.1 x 65.5 71.5   x 6 , 65.5 x 71.5 0 , 71.5 x
µ G r a d e   2 ( x ) = [ 0 , x 69.4 x   69.4 5.6 , 69.4 x 75 83.4   x 8.4 , 75 x 83.4 0 , 83.4 x
µ G r a d e   3 ( x ) = [ 0 , x 77.1 x   77.1 8.1 , 77.1 x 85.2 100   x 14.8 , 85.2 x 100 0 , 100 x
µ I S H _ G r a d e   1 ( x ) = [ 0 , x 55.5 x   55.5 7.5 , 55.5 x 63 69.4   x 6.4 , 63 x 69.4 0 , 69.4 x
µ I S H _ G r a d e   2 ( x ) = [ 0 , x 69.3 x   69.3 5.95 , 69.3 x 75.25 83.5   x 8.25 , 75.25 x 83.5 0 , 83.5 x
µ I S H _ G r a d e   3 ( x ) = [ 0 , x 77.2 x   77.2 8.1 , 77.2 x 85.3 100.15   x 14.85 , 85.3 x 100.15 0 , 100.15 x

4.2. Knowledge Representation of Triangular, Trapezoidal and Gaussian Type-2 Membership Function for Interval Type-2 Fuzzy Systems

To make a fuzzy system, you must first determine the input and output linguistic variables, in this case, we have two inputs and one output.

4.2.1. Triangle Interval Type-2 Membership Functions with Uncertainty a [ a 1 , a 2 ] , b [ b 1 , b 2 ] and c [ c 1 , c 2 ]

The Equation (3) represents the triangle Interval Type-2 Membership Functions with Uncertainty.
μ ˜ ( x ) = [ μ _ ( x ) , μ ¯ ( x ) ] = itritype 2 ( x , [ a 1 , b 1 , c 1 , a 2 , b 2 , c 2 ] ) ,   where   a 1 < a 2 ,   b 1 < b 2 ,   c 1 < c 2 μ 1 ( x ) = max ( min ( x a 1 b 1 a 1 , c 1 x c 1 b 1 ) , 0 ) μ 2 ( x ) = max ( min ( x a 2 b 2 a 2 , c 2 x c 2 b 2 ) , 0 ) μ ¯ ( x ) = { m a x ( μ 1 ( x ) , μ 2 ( x ) )   x ( b 1 , b 2 ) 1   x ( b 1 , b 2 ) μ _ ( x ) = m i n ( μ 1 ( x ) , μ 2 ( x ) )

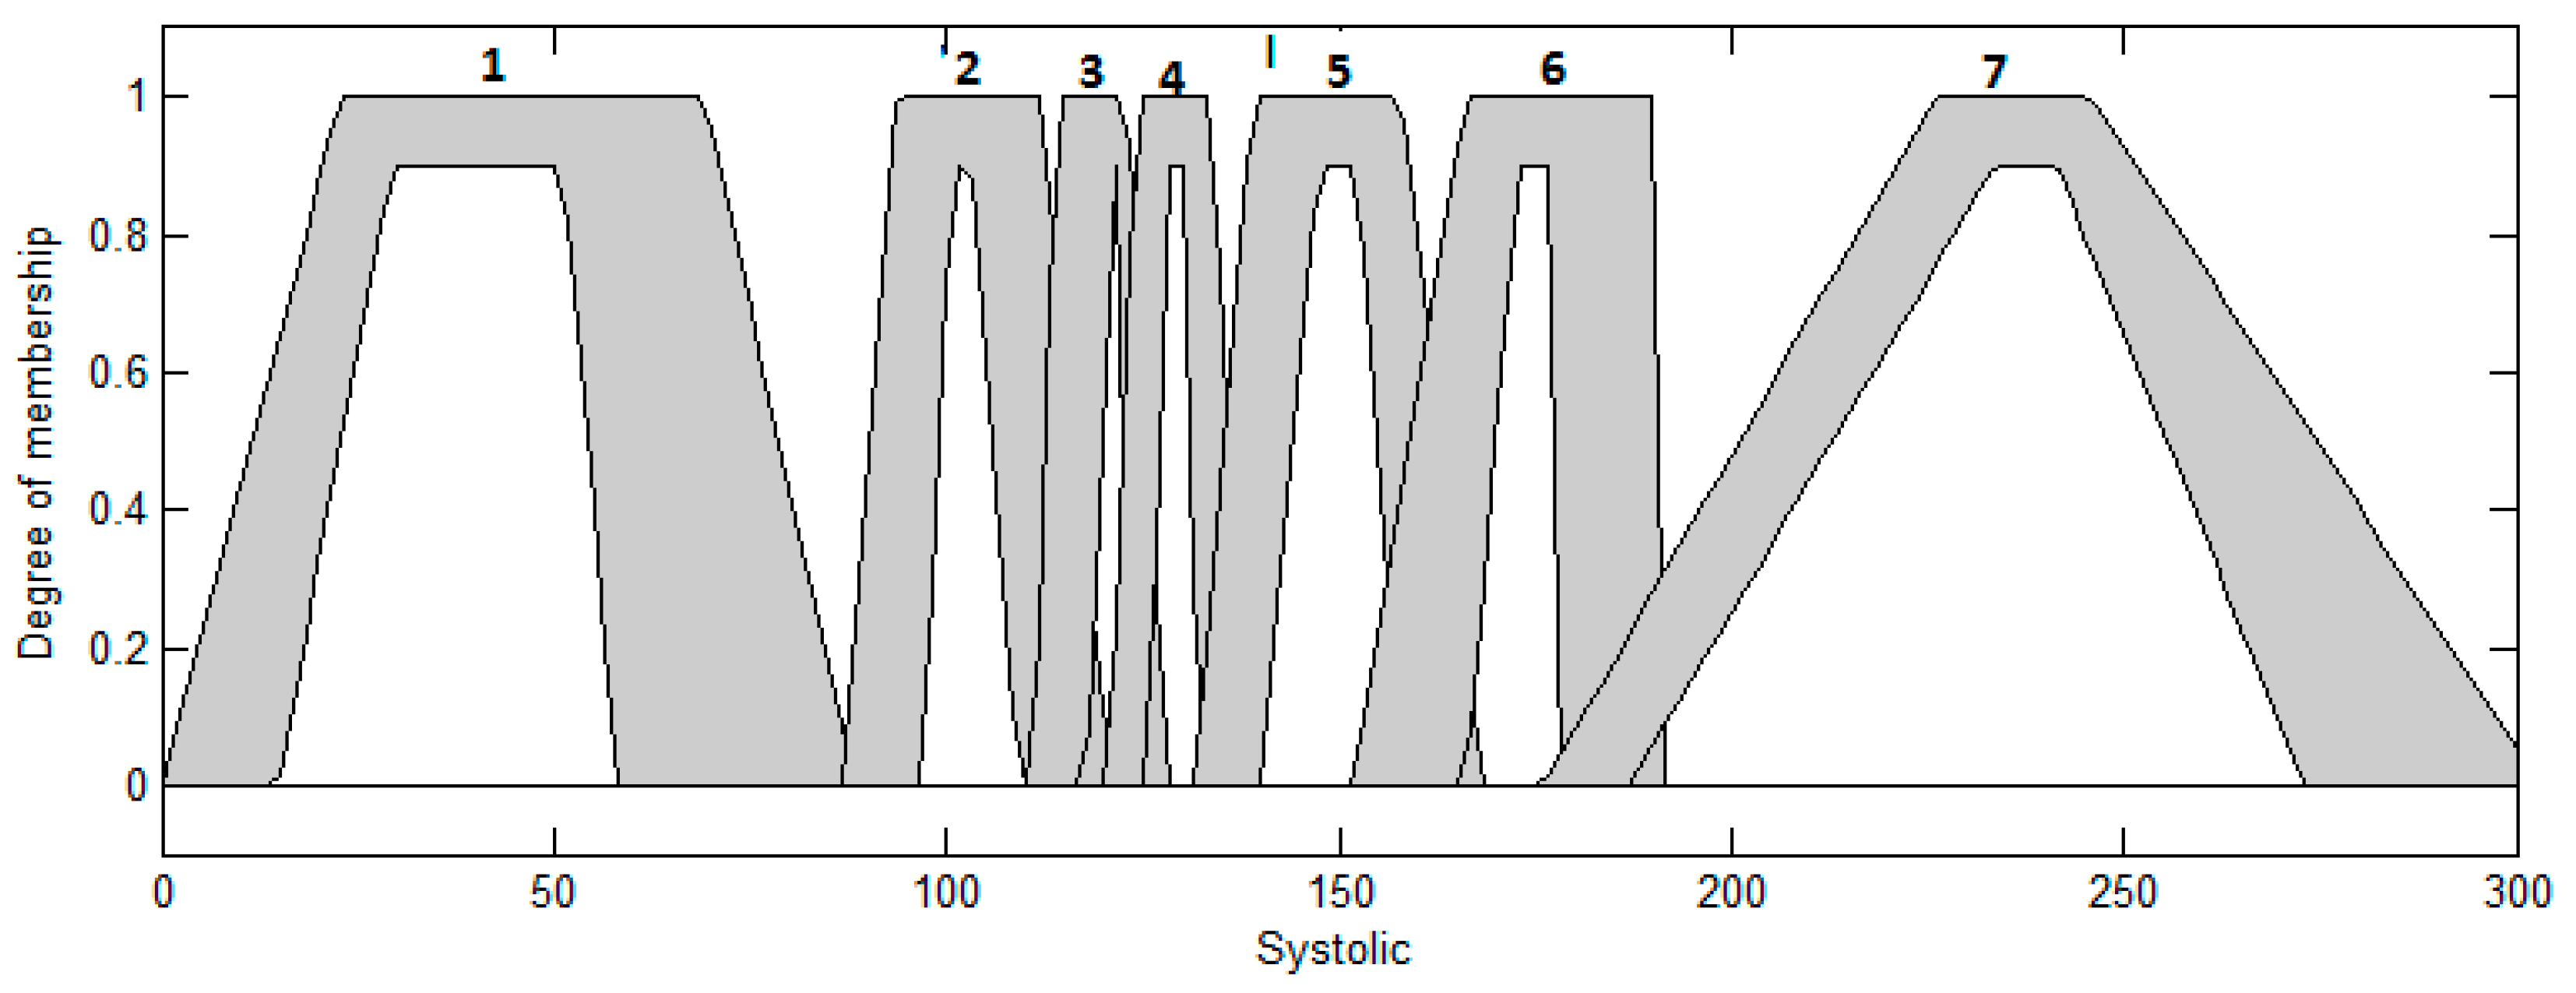
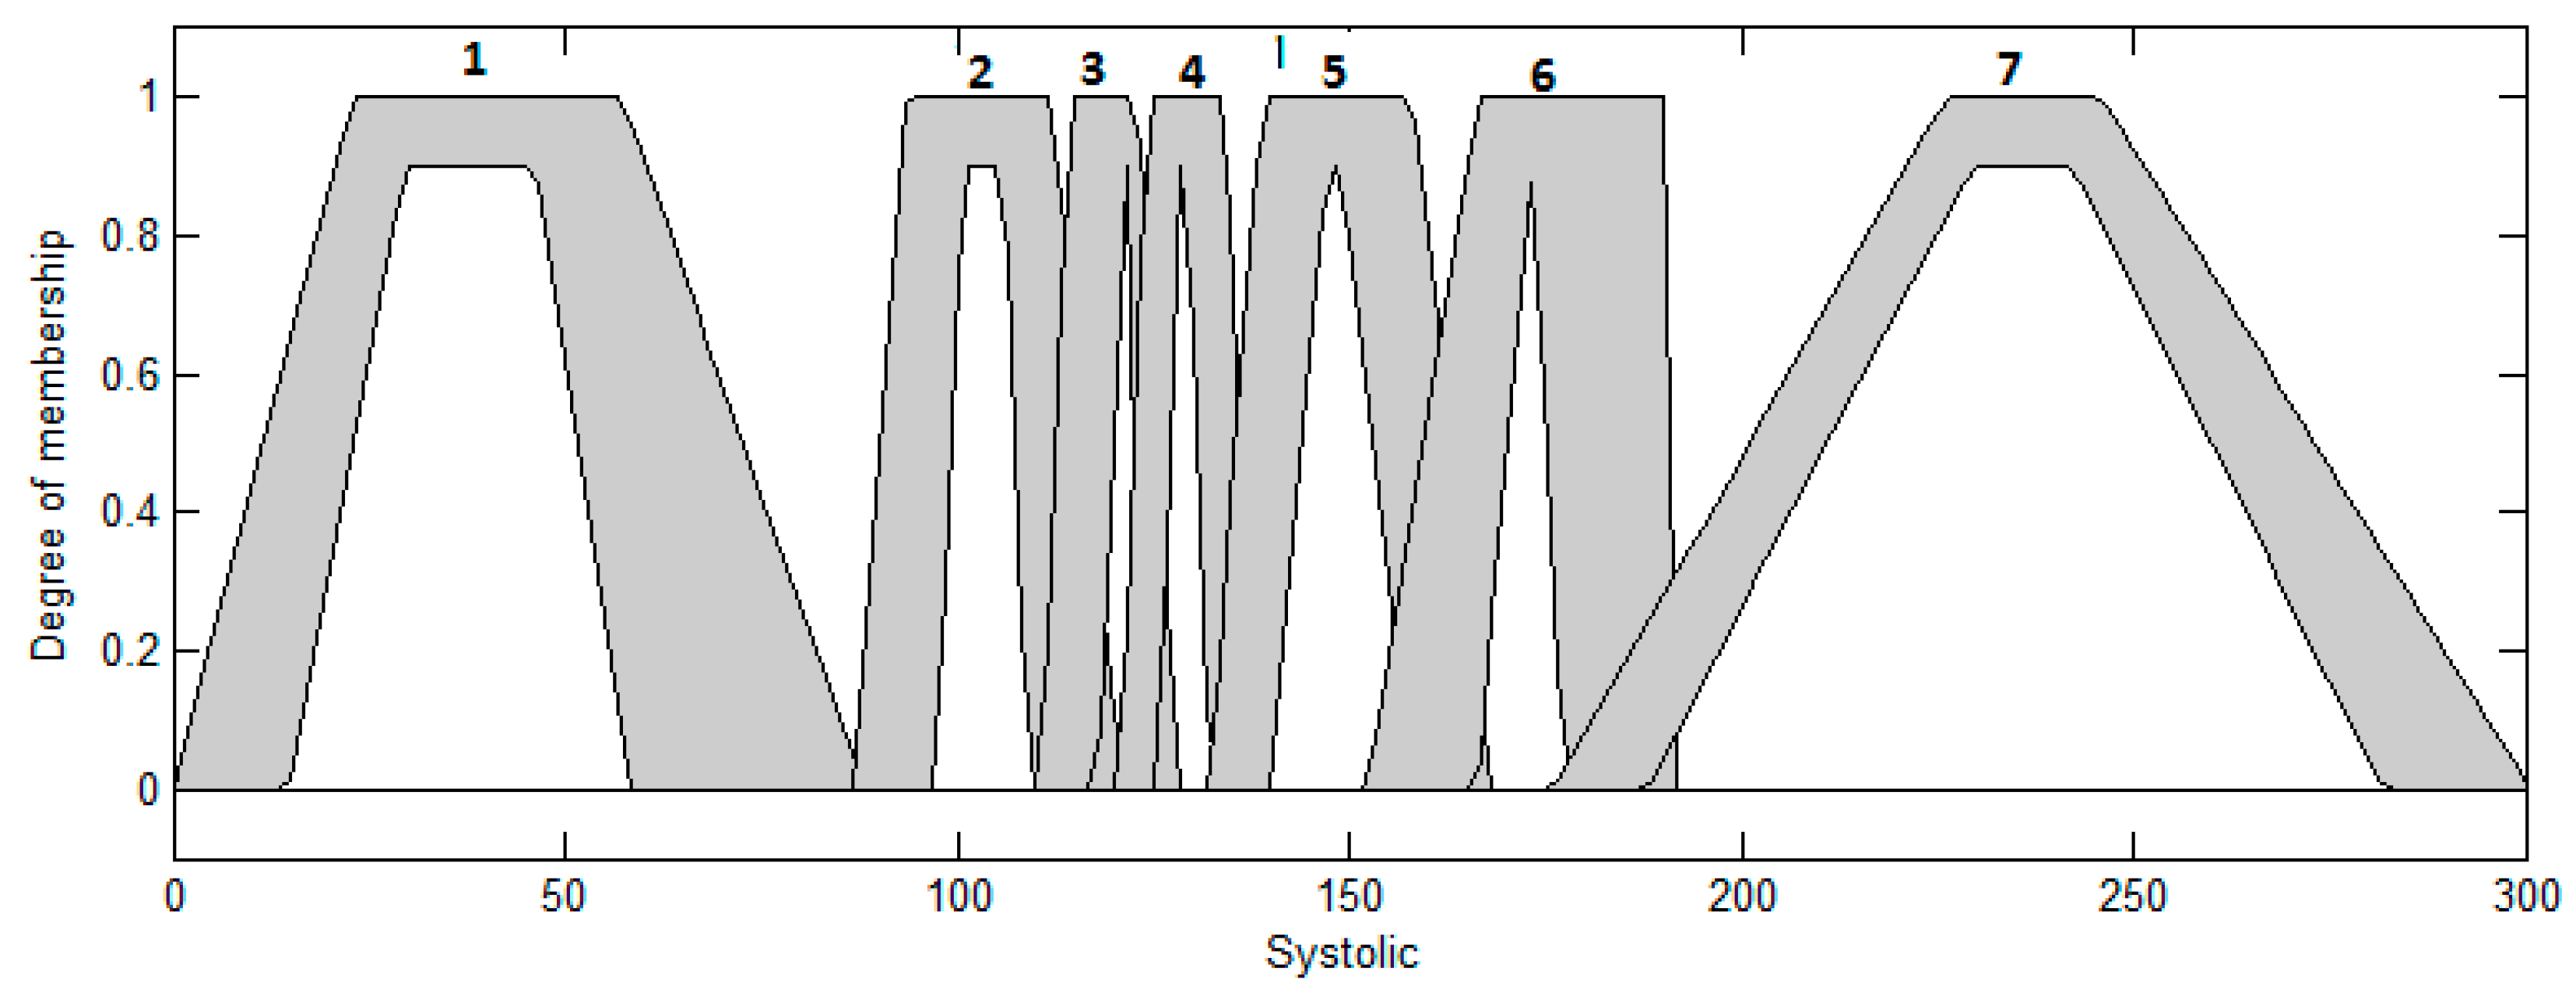
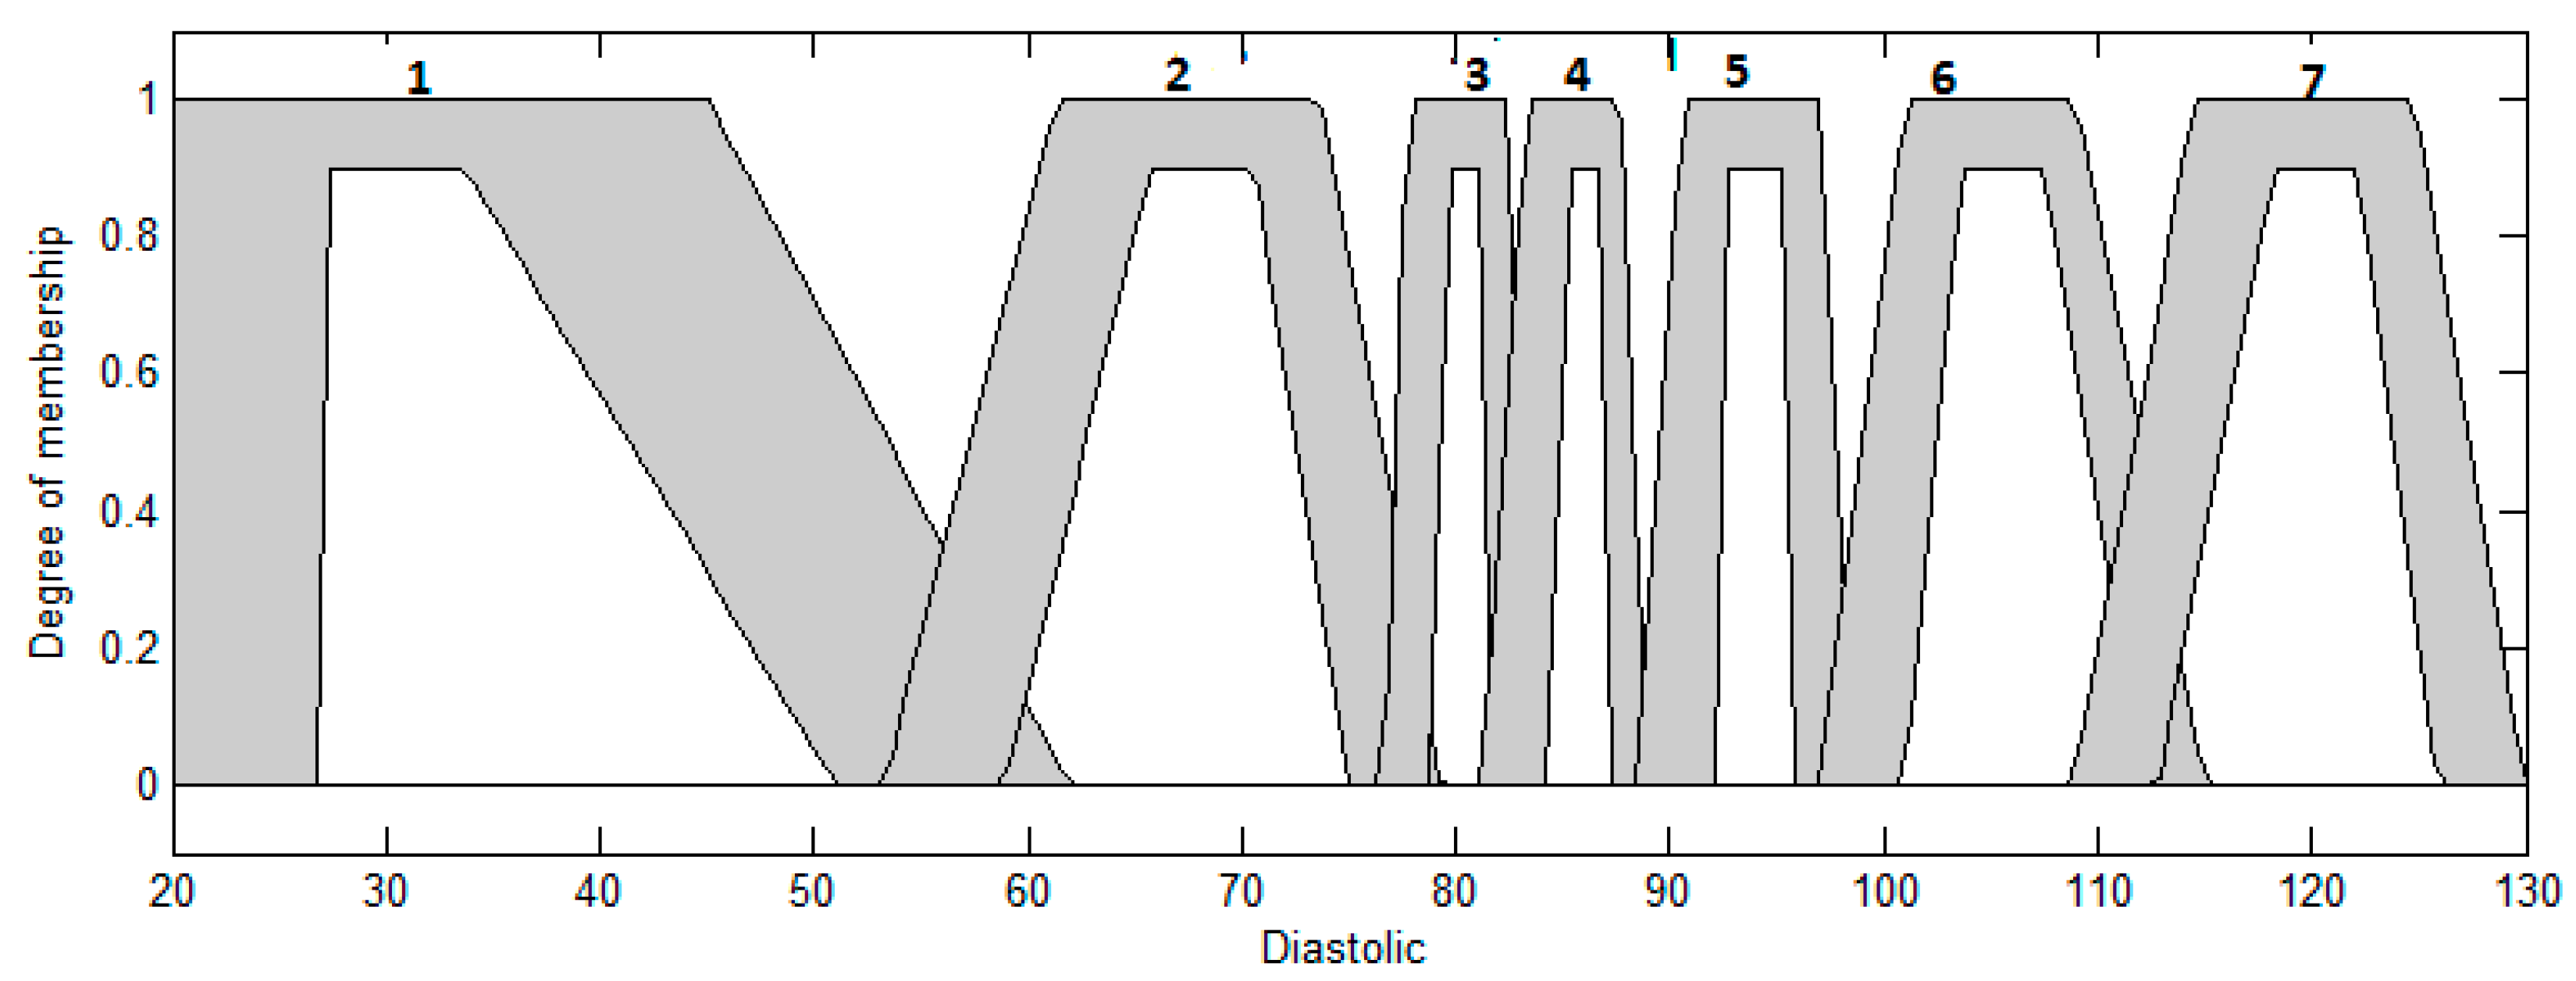
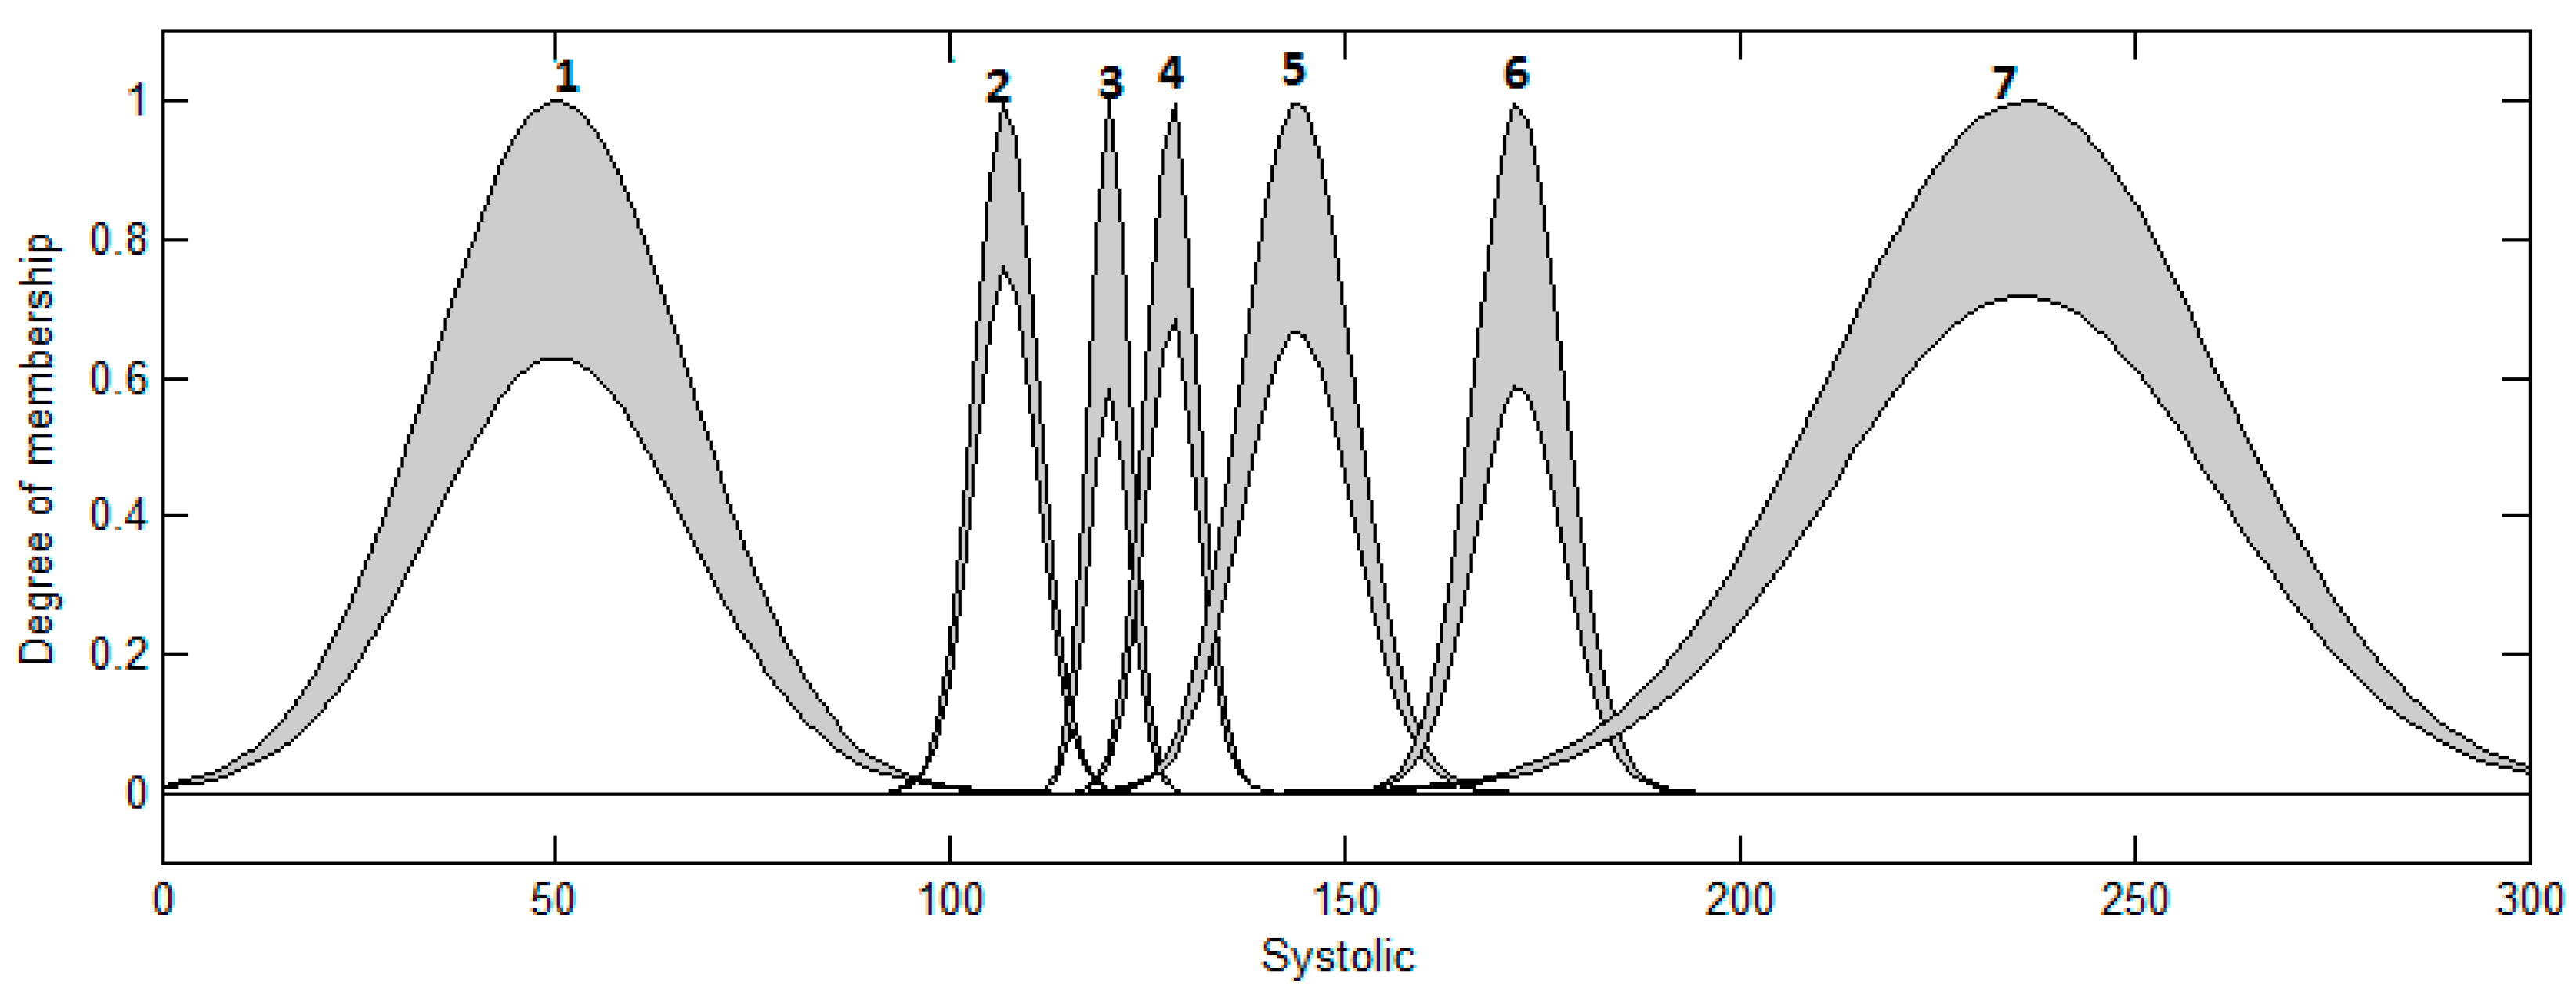
4.2.1.1. Input variables for triangular type-2 fuzzy system

1. Systolic. This variable has the following membership functions (MFS): Low, Low_Normal, Normal, High_Normal, High, Very High and Too_High. This MFS are listed below:
Low
μ 1 ( x ) = max ( min ( x 0 45.5 , 82.48 x 36.98 ) , 0 )
μ 2 ( x ) = max ( min ( x 12.8 42.8 , 94.5 x 38.9 ) , 0 )
Low_Normal
μ 1 ( x ) = max ( min ( x 85.21 19.09 , 110.3 x 6 ) , 0 )
μ 2 ( x ) = max ( min ( x 96.04 15.26 , 122.3 x 11 ) , 0 )
Normal
μ 1 ( x ) = max ( min ( x 110.1 8.2 , 123 x 4.7 ) , 0 )
μ 2 ( x ) = max ( min ( x 118.1 4.2 , 129.2 x 6.9 ) , 0 )
High_Normal
μ 1 ( x ) = max ( min ( x 121.1 3.9 , 132.7 x 7.7 ) , 0 )
μ 2 ( x ) = max ( min ( x 125 5.3 , 139.2 x 8.9 ) , 0 )
High
μ 1 ( x ) = max ( min ( x 131 9.2 , 151.6 x 11.4 ) , 0 )
μ 2 ( x ) = max ( min ( x 142.6 3.6 , 170.1 x 23.9 ) , 0 )
Very_High
μ 1 ( x ) = max ( min ( x 150 18 , 178 x 10 ) , 0 )
μ 2 ( x ) = max ( min ( x 165 11 , 192 x 16 ) , 0 )
Too_High
μ 1 ( x ) = max ( min ( x 170.5 62 , 287.8 x 55.3 ) , 0 )
μ 2 ( x ) = max ( min ( x 165 57.8 , 192 x 59.5 ) , 0 )
2. Diastolic. This variable has the following membership functions (MFS): Low, Low_Normal, Normal, High_Normal, High, Very High and Too_High. This MFS are listed below:
Low
μ 1 ( x ) = max ( min ( x 20 18.3 , 58.95 x 20.65 ) , 0 )
μ 2 ( x ) = max ( min ( x 25.4 17.9 , 64.2 x 20.9 ) , 0 )
Low_Normal
μ 1 ( x ) = max ( min ( x 51.4 18.6 , 75.57 x 5.57 ) , 0 )
μ 2 ( x ) = max ( min ( x 57.3 15.7 , 80 x 7 ) , 0 )
Normal
μ 1 ( x ) = max ( min ( x 76.1 4.2 , 82.5 x 2.2 ) , 0 )
μ 2 ( x ) = max ( min ( x 78.3 3.7 , 84.2 x 2.2 ) , 0 )
High_Normal
μ 1 ( x ) = max ( min ( x 81 3.5 , 87.3 x 2.8 ) , 0 )
μ 2 ( x ) = max ( min ( x 84 2.2 , 89 x 2.8 ) , 0 )
High
μ 1 ( x ) = max ( min ( x 88.2 5.1 , 96 x 2.7 ) , 0 )
μ 2 ( x ) = max ( min ( x 92 3.5 , 99 x 3.5 ) , 0 )
Very_High
μ 1 ( x ) = max ( min ( x 96.1 9.2 , 113 x 7.7 ) , 0 )
μ 2 ( x ) = max ( min ( x 100.4 8 , 116 x 7.6 ) , 0 )
Too_High
μ 1 ( x ) = max ( min ( x 107 9.5 , 126.2 x 9.7 ) , 0 )
μ 2 ( x ) = max ( min ( x 111.3 8.2 , 130 x 10.5 ) , 0 )

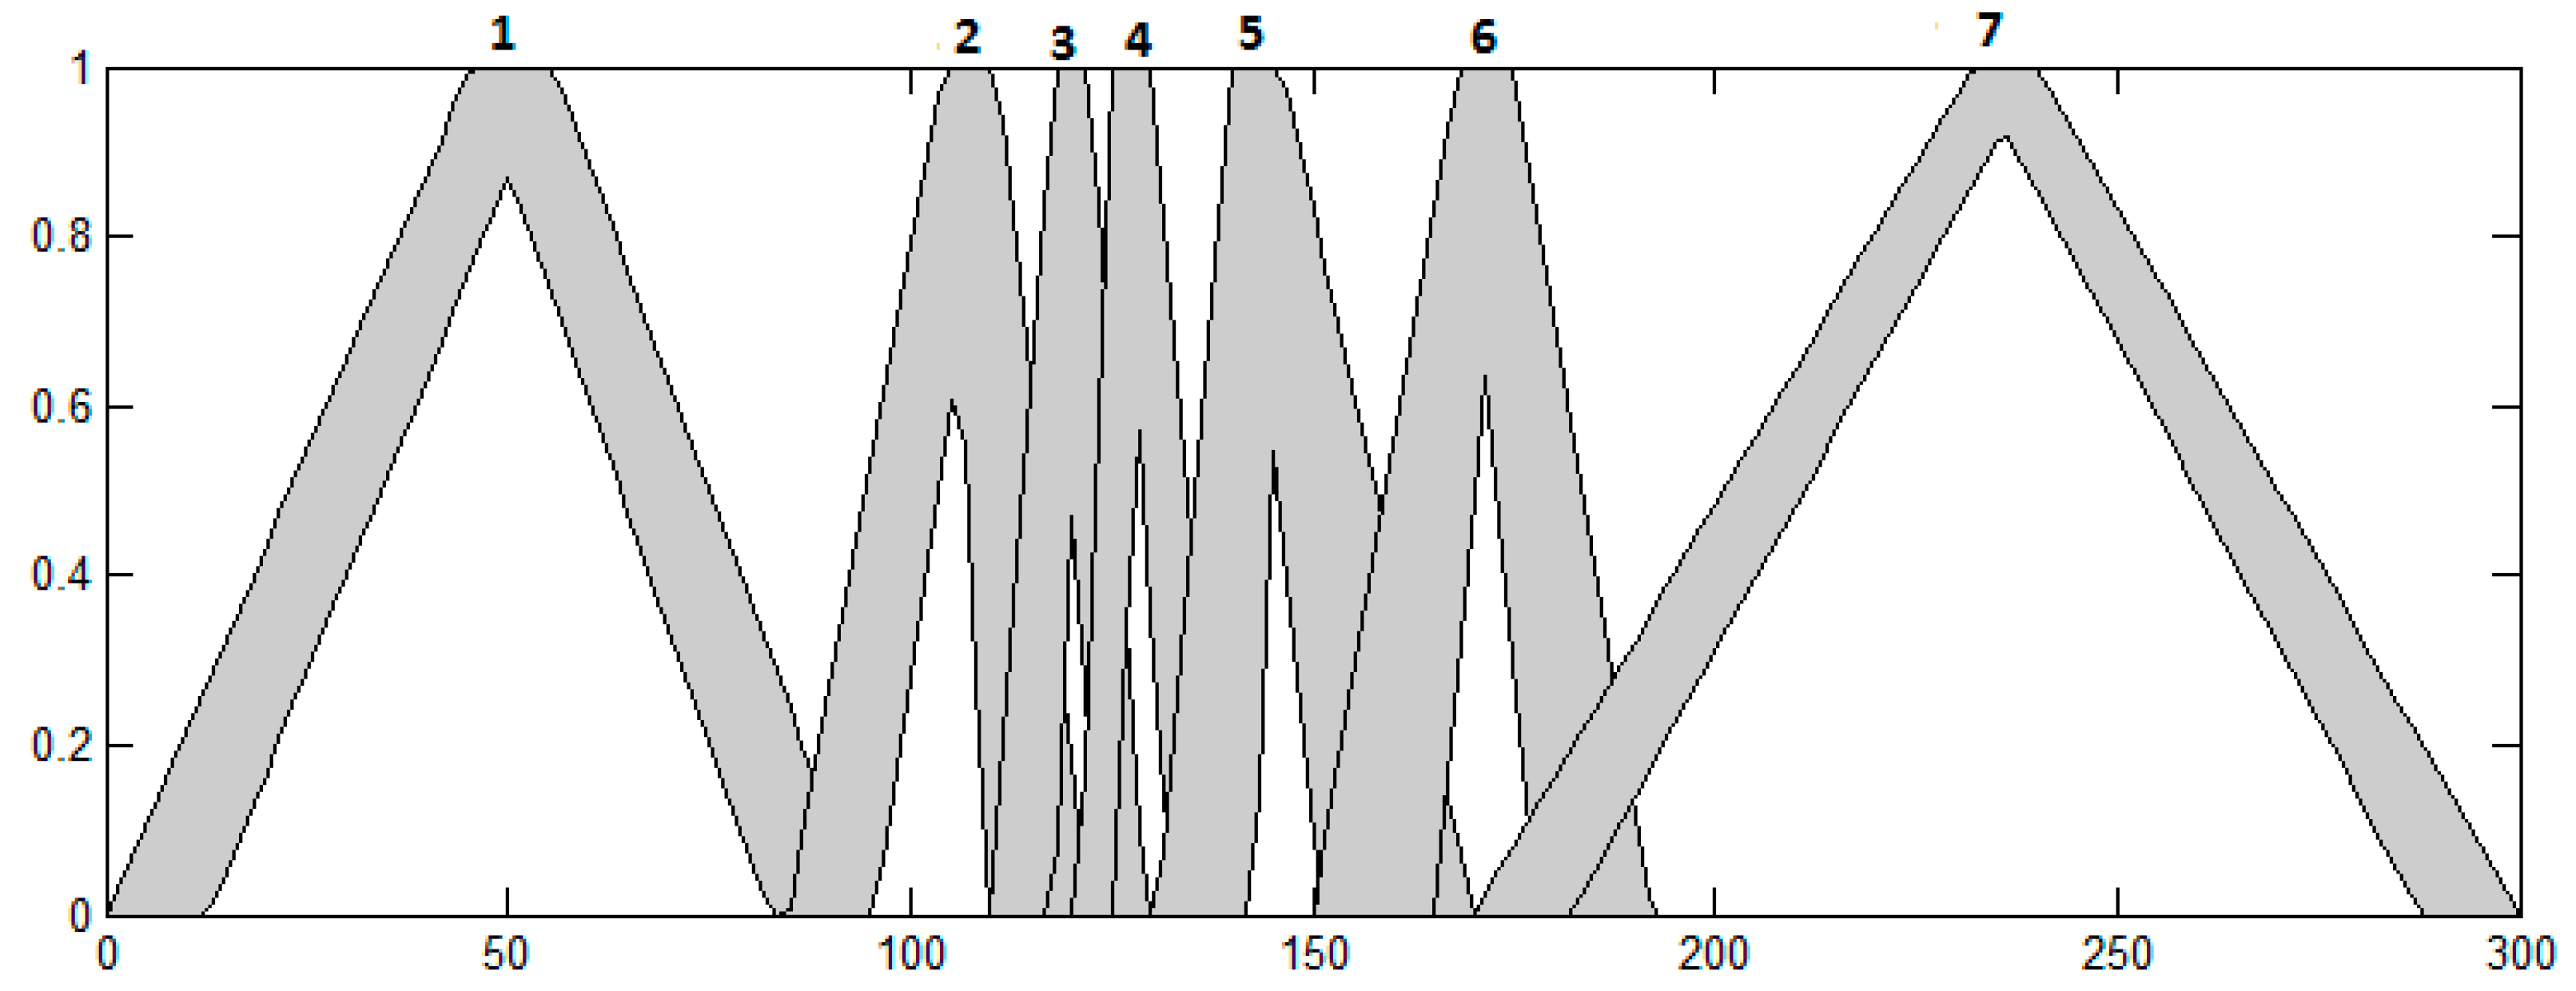
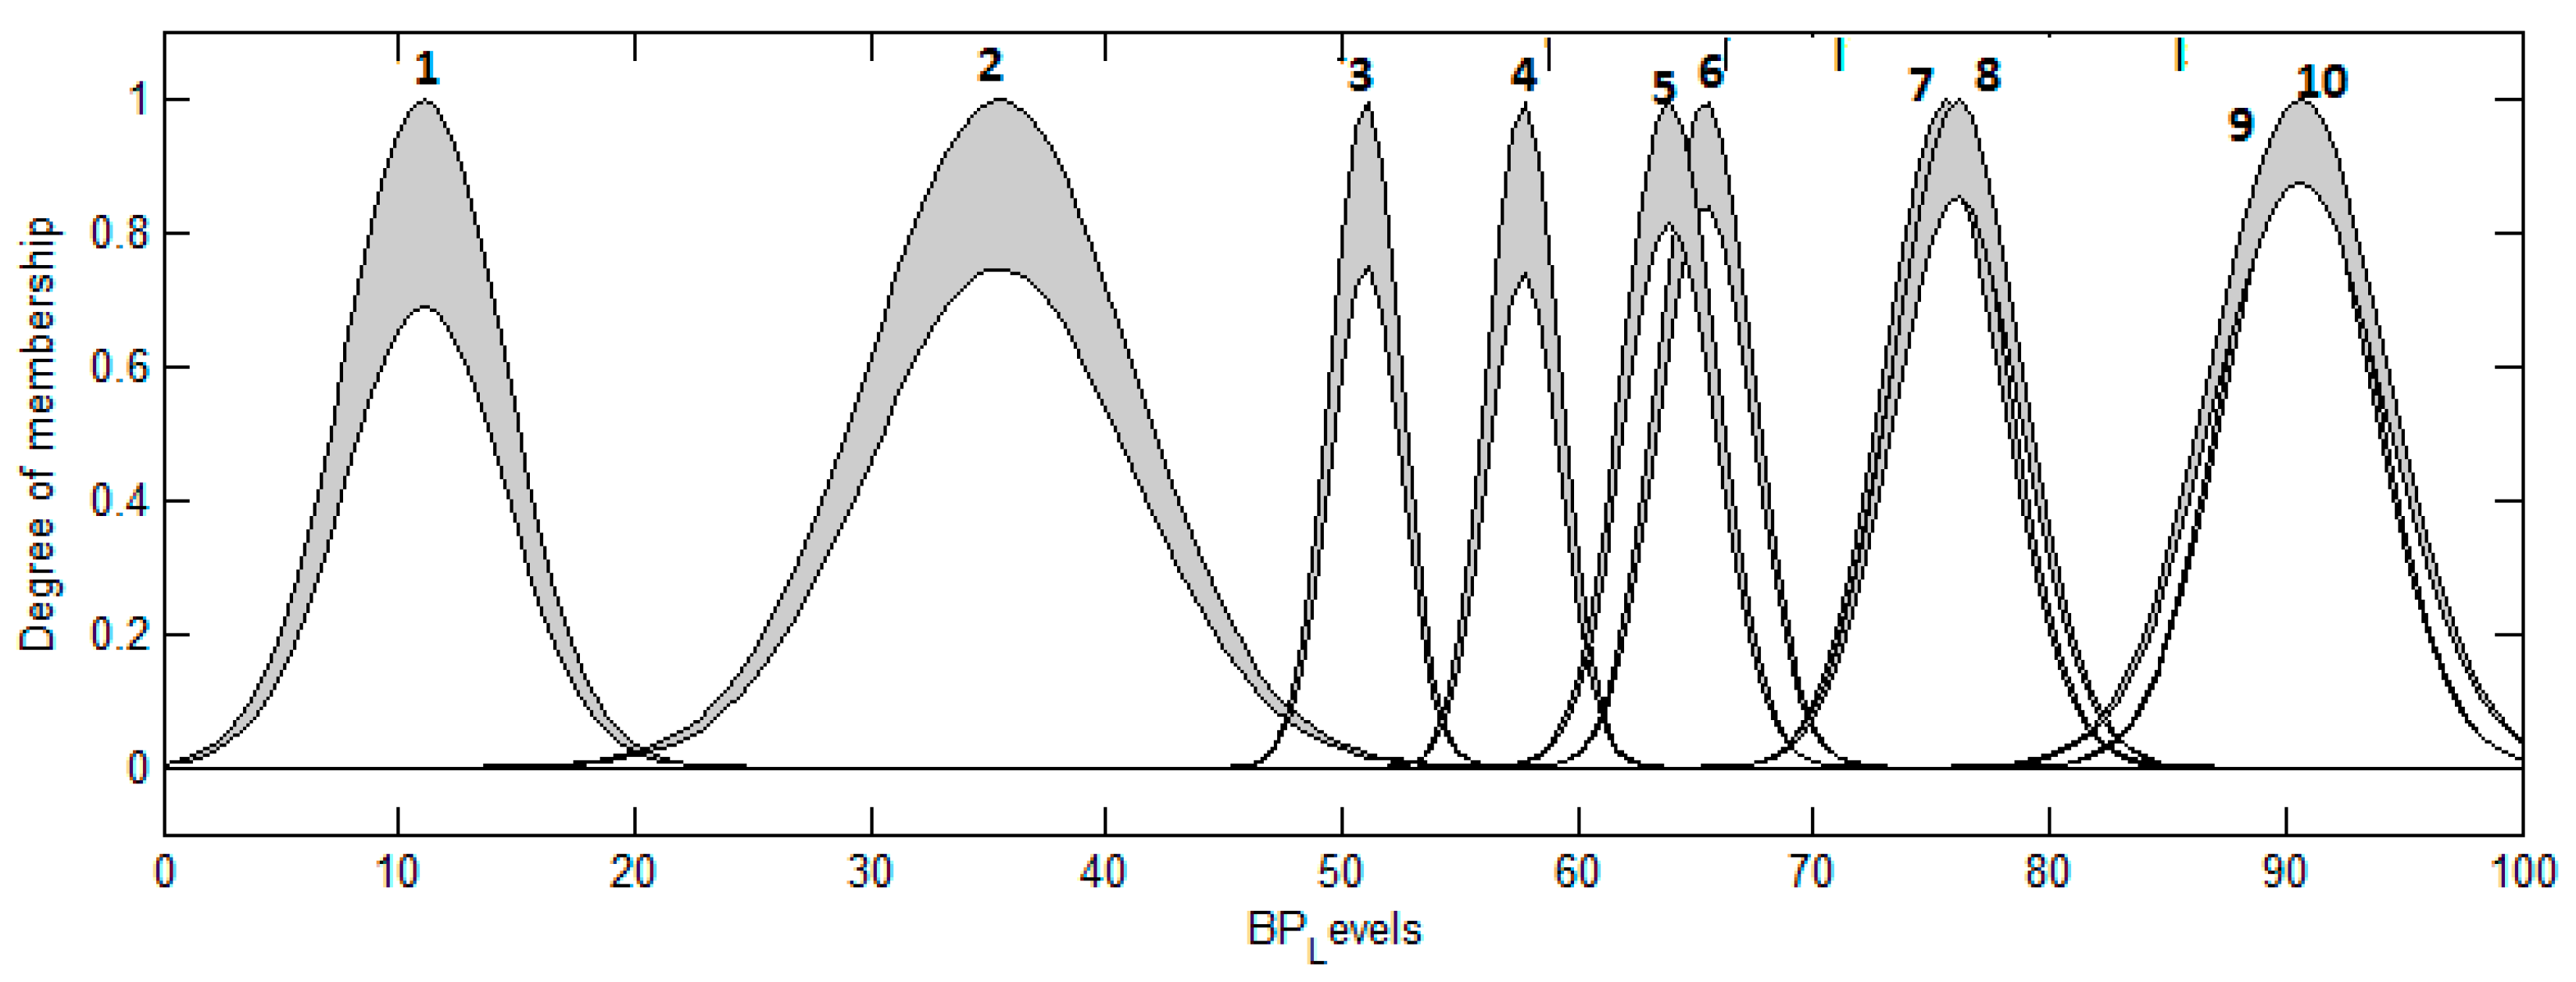
4.2.1.2. Output variables for triangular type-2 fuzzy system

The FS has only one output called BP_LEVELS, which refers to the Blood pressure (BP) level, the output gives a percentage, which refers to the following BP levels: Hypotension, Optimal, Normal, High_Normal, Grade_1, ISH_Grade1, Grade_2, ISH_Grade2, Grade_3, ISH_Grade3. The linguistic value of MFs is shown below:
Hypotension
μ 1 ( x ) = max ( min ( x 0 10 , 17.7 x 7.7 ) , 0 )
μ 2 ( x ) = max ( min ( x 2.72 9.77 , 20.5 x 8.01 ) , 0 )
Optimal
μ 1 ( x ) = max ( min ( x 18.2 15.5 , 46.7 x 13 ) , 0 )
μ 2 ( x ) = max ( min ( x 21.63 15.87 , 50.2 x 12.7 ) , 0 )
Normal
μ 1 ( x ) = max ( min ( x 45.27 4.63 , 53.4 x 3.5 ) , 0 )
μ 2 ( x ) = max ( min ( x 48.3 4 ,   55.5 x 3.2 ) , 0 )
High_Normal
μ 1 ( x ) = max ( min ( x 52.16 4.84 , 60 x 3 ) , 0 )
μ 2 ( x ) = max ( min ( x 55.6 2.9 ,   62.5 x 4 ) , 0 )
Grade_1
μ 1 ( x ) = max ( min ( x 59.1 5.3 , 68.4 x 4 ) , 0 )
μ 2 ( x ) = max ( min ( x 61.9 4.3 ,   71.6 x 5.2 ) , 0 )
ISH_Grade_1
μ 1 ( x ) = max ( min ( x 55 8 , 67 x 4 ) , 0 )
μ 2 ( x ) = max ( min ( x 57.5 7.4 ,   69.5 x 4.6 ) , 0 )
Grade_2
μ 1 ( x ) = max ( min ( x 69 6 , 79 x 4 ) , 0 )
μ 2 ( x ) = max ( min ( x 73.23 2.77 , 84.5 x 8.5 ) , 0 )
ISH_Grade_2
μ 1 ( x ) = max ( min ( x 69 6 , 80 x 5.6 ) , 0 )
μ 2 ( x ) = max ( min ( x 72.1 4.9 ,   84.5 x 7.5 ) , 0 )
Grade_3
μ 1 ( x ) = max ( min ( x 77 12 , 95.5 x 6.5 ) , 0 )
μ 2 ( x ) = max ( min ( x 83 9.4 , 100 x 7.6 ) , 0 )
ISH_Grade_3
μ 1 ( x ) = max ( min ( x 77 13 , 98.4 x 8.4 ) , 0 )
μ 2 ( x ) = max ( min ( x 80.94 10.66 , 100 x 8.4 ) , 0 )

4.2.2. Trapezoidal Interval Type-2 Membership Functions with Uncertain a [ a 1 , a 2 ] , b [ b 1 , b 2 ] , c [ c 1 , c 2 ] and d [ d 1 , d 2 ]

The Equation (4) represents trapezoidal interval type-2 membership functions with uncertain.
μ ˜ ( x ) = [ μ _ ( x ) , μ ¯ ( x ) ] = itrapatype 2 ( x , [ a 1 , b 1 , c 1 , d 1 , a 2 , b 2 , c 2 , d 2 , α ] ) where   a 1 < a 2 ,   b 1 < b 2 ,   c 1 < c 2 ,   d 1 < d 2 μ 1 ( x ) = max ( min ( x a 1 b 1 a 1 , 1 , d 1 x d 1 c 1 ) , 0 ) μ 2 ( x ) = max ( min ( x a 2 b 2 a 2 , 1 , d 2 x d 2 c 2 ) , 0 ) μ ¯ ( x ) = { m a x ( μ 1 ( x ) , μ 2 ( x ) )   x ( b 1 , c 2 ) 1   x ( b 1 , c 2 ) μ _ ( x ) = m i n ( α , m i n ( μ 1 ( x ) , μ 2 ( x ) ) )

4.2.3. Interval Type-2 Gaussian Membership Function

The Equation (5) represents Interval Type-2 Gaussian Membership Function.
μ ˜ ( x ) = [ μ _ ( x ) , μ ¯ ( x ) ] = igaussatype 2 ( x , [ σ , m , α ] ) μ _ ( x ) = α   exp [ 1 2 ( x m σ ) 2 ]   Where   0 < α < 1 μ ¯ ( x ) = exp [ 1 2 ( x m σ ) 2 ]

5. Results of This Work

The results obtained are based on the optimization of the membership functions with the genetic algorithm, below in Table is shown the best architectures of the genetic algorithm
The parameters used in the algorithm are generation: 100, population: 100, selection method: roulette wheel, mutation rate: 0.06 crossing rate: 0.5. These are the parameters used, since in previous tests, a good error was obtained using these parameters.
The classification error is based in the fitness function as shows Equation (7), the thought is to limit the order mistake and this let realizing that the base classifier is arranging effectively, the best approach to know whether the classifier is characterizing accurately is following Table 1, which characterizes the BP levels. Table 2 demonstrates the distinctive parameters utilized as a part of the GA (in bold).
The next tables show the results obtained for 30 patients randomly selected and based on these results we obtain the classification accuracy (CA) rate and classification error (CE) rate, for which we use the following equations:
The CA Rate is calculated as follows:
CA = N c N t
where N c is the Number of Training Instances Correctly Classified and N t is the Number of Training instances.
The CE is calculated as follows:
CE = N e N t
where N e is the Number of Training Instances Incorrectly Classified and N t is the Number of Training instances. The columns shaded with yellow, are the incorrect classifications of each classifier.
Below are the experiments done to obtain the best fuzzy classifier, it should be noted that they were tested with 30 patients and this was the result which is shown in Table 3 for type-1 fuzzy systems and the results obtained for interval type-2 fuzzy systems is shown in Table 4:
The results for the classification of the experiments with 45 systolic and diastolic samples from the 24 h monitoring in 30 patients using type-1 fuzzy systems with triangular membership functions is shown in Table 5 with an average 98% and the standard Deviation of 2.36, trapezoidal membership functions is: average 91.925% and the standard Deviation of 7.16 and finally Gaussian membership functions is 91.926% and the standard Deviation of 5.91, then the best one is the triangular type-1 fuzzy system with average of 98 % and the standard Deviation is 2.36.
The results for the classification of the experiments with 45 systolic and diastolic samples from the 24 h monitoring in 30 patients using type-2 fuzzy systems with triangular membership functions is shown in Table 6 with an average of 99.408 % and the standard Deviation of 0.998, trapezoidal membership functions is: average 94.29% and the standard Deviation of 4.16 and finally Gaussian membership functions is 93.63% and the standard Deviation of 4.59, then the best one is the type-2 fuzzy system with triangular membership function with the average of 99.408 % and the standard Deviation is 0.998.
Based on the experiments performed with the different architectures, it gives the possibility of being able to compare each one of the results and reach the conclusion that the best architecture is the one that is composed of type-2 triangular membership functions, with 21 fuzzy rules and Mamdani type. It is worth mentioning that all architectures improved when using type-2 but the best one is the type-2 fuzzy system with triangular membership functions.
It is also important to highlight the results obtained in the architectures with trapezoidal and Gaussian membership functions, since their standard deviation of type 2 is lower than that of type 1 that is why we conclude that the trapezoidal and Gaussian architectures in type-2 are better than Trapezoidal and Gaussian architectures in Type-1.

6. Discussion

This work is focused on analyzing each of the possible architectures of type-1 and type-2 fuzzy systems, in order to obtain the best classifier with the least possible error at the moment of making the blood pressure classification.
In the work entitled Design of an optimized fuzzy classifier for the diagnosis of blood pressure with a new computational method for expert rule optimization, the design of a type-1 fuzzy classifier was carried out with the optimization of triangular membership functions and the appropriate fuzzy rules based on the knowledge of an expert in cardiology. The optimization was done with genetic algorithms, in this work the chromosome structure is shown for the optimization and thus finding the appropriate parameters. It is worth mentioning that only work was done with type-1 fuzzy systems and it was limited to testing with triangular functions, since the main objective was to obtain the appropriate number of fuzzy rules and thus avoid possible unnecessary rules for the classification of blood pressure.
In the current work, once the optimal number of fuzzy rules was achieved, we decided to design type-1 and type-2 fuzzy classifiers using triangular, trapezoidal and Gaussian membership functions in order to compare the different architectures with which the experiments were carried out. These are shown in the results section and all this in order to obtain the architecture with the lowest classification error rate.
It is important to emphasize that the use of type-2 fuzzy systems can help to improve the results, compared to previous works of the authors, that is why the contribution of this work is was to find a better classification architecture based on interval type-2 fuzzy systems since the management of uncertainty in their membership functions helped to give a more adequate classification.
At present there are some works in the literature, which have done research in medicine focused on cancer, diabetes, nutrition, cardiovascular diseases among others, all these using other intelligent techniques [42,43,44,45].

7. Conclusions

In this work, we experiment with different architectures designed based on fuzzy logic and evolutionary computing techniques, which belong to the artificial intelligence area. The optimal design of the fuzzy systems enables making decisions based on a structure built from the knowledge of an expert, which is specified by membership functions and fuzzy rules and these are made based on parameters on Table 1, which is an official standard of the European Hypertension Society.
Based on the information obtained in the tables shown above, we can conclude that the best architectures are those that use triangular membership functions with either a type-1 fuzzy inference system or an interval type-2 fuzzy inference system. It is important to note that each of the fuzzy systems were tested with 30 patients, each of which are independent and therefore has an individual classification, based on the best architecture, then the best average is the triangular type-1 and type-2 fuzzy system. The contribution of this work is the design of the type-2 fuzzy system with triangular membership functions, which is better than the design of the type-1 fuzzy system developed previously by the authors [36], it is also important to mention that the results obtained in the type-2 fuzzy systems with trapezoidal and Gaussian membership functions are also better than their respective type-1, however the design with the best result is achieved in this work with a 99.11% classification with the type-2 fuzzy system with triangular membership functions.

Author Contributions

The authors J.C.G., I.M., P.M. were responsible for (1) concept and design of the model, (2) acquisition of data, G.P.-A. (3) analysis and interpretation of data, and all authors (4) preparation of the manuscript. The authors have agreed to authorship the paper and the order of authorship for this manuscript of this research.

Funding

This research was funding by The Consejo Nacional de Ciencia y Tecnologia (CONACYT) with the research grant no. 246774.

Acknowledgments

We would like to express our gratitude to the CONACYT and Tijuana Institute of Technology for the facilities and resources granted for the development of this research.

Conflicts of Interest

The authors declare that there are no conflicts of interest, financial or nonfinancial, with respect to this research study.

References

  1. Yang, X.S.; Karamanoglu, M.; He, X. Flower pollination algorithm: A novel approach for multiobjective optimization. Eng. Optim. 2014, 46, 1222–1237. [Google Scholar] [CrossRef]
  2. Yu, J.J.Q.; Li, V.O.K. A social spider algorithm for global optimization. Appl. Soft Comput. 2015, 30, 614–627. [Google Scholar] [CrossRef] [Green Version]
  3. Meng, X.-B.; Gao, X.Z.; Lu, L.; Liu, Y.; Zhang, H. A new bio-inspired optimisation algorithm: Bird Swarm Algorithm. J. Exp. Theor. Artif. Intell. 2016, 28, 673–687. [Google Scholar] [CrossRef]
  4. Gopinathannair, R.; Olshansky, B. Management of tachycardia. F1000Prime Rep. 2015, 7, 60. [Google Scholar] [CrossRef] [PubMed]
  5. Wilson, J.M. Essential Cardiology: Principles and Practice. Tex. Heart Inst. J. 2005, 32, 616. [Google Scholar]
  6. Lai, C.; Coulter, S.A.; Woodruff, A. Hypertension and Pregnancy. Tex. Heart Inst. J. 2017, 5, 350–351. [Google Scholar] [CrossRef]
  7. Guzman, J.C.; Melin, P.; Prado-Arechiga, G. Design of an optimized fuzzy classifier for the diagnosis of blood pressure with a new computational method for expert rule optimization. Algorithms 2017, 10, 79. [Google Scholar] [CrossRef]
  8. Guzmán, J.C.; Melin, P.; Prado-Arechiga, G. Neuro-Fuzzy Hybrid Model for the Diagnosis of Blood Pressure. In Nature-Inspired Design of Hybrid Intelligent Systems; Melin, P., Castillo, O., Kacprzyk, J., Eds.; Springer International Publishing: Cham, Switaerland, 2017; pp. 573–582. [Google Scholar]
  9. Guzmán, J.C.; Melin, P.; Prado-Arechiga, G. Design of a Fuzzy System for Diagnosis of Hypertension. In Design of Intelligent Systems Based on Fuzzy Logic, Neural Networks and Nature-Inspired Optimization; Springer International Publishing: Cham, Switaerland, 2015; pp. 517–526. [Google Scholar]
  10. Karami, Y.; Fathy, M.; Khakzad, H.; Shirazi, H.; Arab, S. Protein structure prediction using bio-inspired algorithm: A review. In Proceedings of the 16th CSI International Symposium on Artificial Intelligence and Signal Processing (AISP 2012), Shiraz, Iran, 2–3 May 2012; pp. 201–206. [Google Scholar]
  11. Sari, I.R.F. Bioinspired algorithms for Internet of Things network. In Proceedings of the 2017 4th International Conference on information Technology, Computer, and Electrical Engineering (ICITACEE), Semarang, Indonesia, 18–19 October 2017; p. 1. [Google Scholar]
  12. Udo, E.U.; Oparaku, O.U. Fuzzy Logic System for Fetal Heart Rate Determination. Int. J. Eng. Res. 2015, 4, 60–63. [Google Scholar]
  13. Battegay, E.J.; Lip, G.Y.H.; Bakris, G.L. Hypertension: Principles and Practices; Taylor & Francis: Boca Raton, FL, USA, 2005. [Google Scholar]
  14. Carretero, O.A.; Oparil, S. Essential Hypertension. Circulation 2000, 101, 329–335. [Google Scholar] [CrossRef] [Green Version]
  15. Zadeh, L.A. Fuzzy sets. Inf. Control 1965, 8, 338–353. [Google Scholar] [CrossRef] [Green Version]
  16. Carvajal, O.R.; Castillo, O.; Soria, J.J. Optimization of Membership Function Parameters for Fuzzy Controllers of an Autonomous Mobile Robot Using the Flower Pollination Algorithm. J. Autom. Mob. Robot. Intell. Syst. 2018, 12, 44–49. [Google Scholar]
  17. Domanal, S.; Guddeti, R.M.; Buyya, R. A Hybrid Bio-Inspired Algorithm for Scheduling and Resource Management in Cloud Environment. IEEE Trans. Serv. Comput. 2017. [Google Scholar] [CrossRef]
  18. Haupt, R.L.; Haupt, S.E. Practical Genetic Algorithms, 2nd ed.; A Wiley-Interscience Publication: Hoboken, NJ, USA, 2004. [Google Scholar]
  19. Kennedy, J.; Eberhart, R. Particle swarm optimization. In Proceedings of the IEEE International Conference on Neural Networks, Perth, Australia, 27 November–1 December 1995; Volume 4, pp. 1942–1948. [Google Scholar]
  20. American Heart Association. 2015. Available online: http://www.heart.org/HEARTORG/Conditions/HighBloodPressure/High-Blood-Pressure-or-Hypertension_UCM_002020_SubHomePage.jsp (accessed on 9 July 2016).
  21. Kenney, L.; Humphrey, R.; Mahler, D.; Brayant, C. ACSM’s Guidelines for Exercise Testing and Prescription; Williams & Wilkins: Philadelphia, PA, USA, 1995. [Google Scholar]
  22. Mangrum, J.M.; DiMarco, J.P. The Evaluation and Management of Bradycardia. N. Engl. J. Med. 2000, 342, 703–709. [Google Scholar] [CrossRef] [PubMed]
  23. Mancia, G.; Grassi, G.; Kjeldsen, S.E. Manual of Hypertension of the European Society of Hypertension; Informa Healtcare: London, UK, 2008. [Google Scholar]
  24. Wizner, B.; Gryglewska, B.; Gasowski, J.; Kocemba, J.; Grodzicki, T. Normal blood pressure values as perceived by normotensive and hypertensive subjects. J. Hum. Hypertens. 2003, 17, 87–91. [Google Scholar] [CrossRef] [Green Version]
  25. Duodu, Q.; Panford, J.K.; Hafron-acquah, J.B. Designing Algorithm for Malaria Diagnosis using Fuzzy Logic for Treatment (AMDFLT) in Ghana. Int. J. Comput. Appl. 2014, 91, 17. [Google Scholar] [CrossRef]
  26. Morsi, I.; el Gawad, Y.Z.A. Fuzzy logic in heart rate and blood pressure measuring system. In Proceedings of the 2013 IEEE Sensors Applications Symposium Proceedings, Galveston, TX, USA, 19–21 February 2013; pp. 113–117. [Google Scholar]
  27. Nohria, R.; Mann, P.S. Diagnosis of Hypertension using Adaptive Neuro-Fuzzy Inference System. Int. J. Comput. Sci. Technol. 2015, 8491, 36–40. [Google Scholar]
  28. Sikchi, S.; Ali, M. Design of fuzzy expert system for diagnosis of cardiac diseases. Int. J. Med. Sci. Public Heal. 2013, 2, 56. [Google Scholar] [CrossRef]
  29. Rosendorff, C. Essential Cardiology, 3rd ed.; Springer: Bronx, NY, USA, 2013. [Google Scholar]
  30. Melin, P.; Castillo, O. Hybrid Intelligent Systems for Pattern Recognition Using Soft Computing; Springer-Verlag: Berlin/Heidelberg, Germany, 2005. [Google Scholar]
  31. Asl, A.A.S.; Zarandi, M.H.F. A Type-2 Fuzzy Expert System for Diagnosis of Leukemia. In Fuzzy Logic in Intelligent System Design, Proceedings of the North American Fuzzy Information Processing Society Annual Conference, Cancun, Mexico, 16–18 October 2017; Springer: Cham, Switzerland, 2017; pp. 52–60. [Google Scholar]
  32. Sotudian, S.; Zarandi, M.H.F.; Turksen, I.B. From Type-I to Type-II Fuzzy System Modeling for Diagnosis of Hepatitis. World Acad. Sci. Eng. Technol. Int. J. Comput. Electr. Autom. Control Inf. Eng. 2016, 10, 1280–1288. [Google Scholar]
  33. Miramontes, I.; Martínez, G.; Melin, P.; Prado-Arechiga, G. A Hybrid Intelligent System Model for Hypertension Risk Diagnosis. In Fuzzy Logic in Intelligent System Design, Proceedings of the North American Fuzzy Information Processing Society Annual Conference, Cancun, Mexico, 16–18 October 2017; Springer: Cham, Switzerland, 2017; pp. 202–213. [Google Scholar]
  34. Melin, P.; Miramontes, I.; Prado-Arechiga, G. A hybrid model based on modular neural networks and fuzzy systems for classification of blood pressure and hypertension risk diagnosis. Expert Syst. Appl. 2018, 107, 146–164. [Google Scholar] [CrossRef]
  35. Miramontes, I.; Martínez, G.; Melin, P.; Prado-Arechiga, G. A Hybrid Intelligent System Model for Hypertension Diagnosis BT. In Nature-Inspired Design of Hybrid Intelligent Systems; Melin, P., Castillo, O., Kacprzyk, J., Eds.; Springer International Publishing: Cham, Switaerland, 2017; pp. 541–550. [Google Scholar]
  36. Zarandi, M.H.F.; Khadangi, A.; Karimi, F.; Turksen, I.B. A Computer-Aided Type-II Fuzzy Image Processing for Diagnosis of Meniscus Tear. J. Digit. Imaging 2016, 29, 677–695. [Google Scholar] [CrossRef] [Green Version]
  37. Pabbi, V. Fuzzy Expert System for Medical Diagnosis. Int. J. Sci. Res. Publ. 2015, 5, 1–7. [Google Scholar]
  38. Mohamed, K.A.; Hussein, E.M. Malaria Parasite Diagnosis using Fuzzy Logic. Int. J. Sci. Res. 2016, 5, 2015–2017. [Google Scholar]
  39. Melin, P.; Prado-Arechiga, G. New Hybrid Intelligent Systems for Diagnosis and Risk Evaluation of Arterial Hypertension; Springer: Cham, Switzerland, 2018. [Google Scholar]
  40. O’Brien, E.; Parati, G.; Stergiou, G. Ambulatory Blood Pressure Measurement. Hypertension 2013, 62, 988–994. [Google Scholar] [CrossRef] [Green Version]
  41. Słowiński, K. Rough Classification of HSV Patients. In Intelligent Decision Support. Theory and Decision Library (Series D: System Theory, Knowledge Engineering and Problem Solving); Słowiński, R., Ed.; Springer: Dordrecht, The Netherlands, 1992; Volume 11. [Google Scholar]
  42. Yuksel, S.; Dizman, T.; Yildizdan, G.; Sert, U. Application of soft sets to diagnose the prostate cancer risk. J. Inequal. Appl. 2013, 2013, 229. [Google Scholar] [CrossRef] [Green Version]
  43. Galilea, E.H.; Santos-García, G.; Suárez-Bárcena, I.F. Identification of Glaucoma Stages with Artificial Neural Networks Using Retinal Nerve Fibre Layer Analysis and Visual Field Parameters. In Innovations in Hybrid Intelligent Systems. Advances in Soft Computing; Corchado, E., Corchado, J.M., Abraham, A., Eds.; Springer: Berlin/Heidelberg, Germany, 2007; Volume 44. [Google Scholar]
  44. Alcantud, J.C.R.; Santos-García, G.; Hernández-Galilea, E. Glaucoma Diagnosis: A Soft Set Based Decision Making Procedure. In Advances in Artificial Intelligence, Proceedings of the Conference of the Spanish Association for Artificial Intelligence, Albacete, Spain, 9–12 November 2015; Lecture Notes in Computer Science; Puerta, J., Ed.; Springer: Cham, Switzerland, 2015; Volume 9422. [Google Scholar]
  45. José Carlos, R. Alcantud, Alessio Emanuele Biondo, Alfio Giarlotta: Fuzzy politics I: The genesis of parties. Fuzzy Sets Syst. 2018, 349, 71–98. [Google Scholar]
Figure 1. General Neuro fuzzy hybrid model.
Axioms 08 00008 g001
Figure 2. Specific neuro fuzzy hybrid model.
Axioms 08 00008 g002
Figure 3. Structure of the type-1 FS for classification with trapezoidal membership functions.
Axioms 08 00008 g003
Figure 4. Systolic input for the type-1 FS for classification with trapezoidal membership functions.
Axioms 08 00008 g004
Figure 5. Diastolic input for the type-1 FS for classification with trapezoidal membership functions.
Axioms 08 00008 g005
Figure 6. BP_Levels output for the type-1 FS for classification with trapezoidal membership functions.
Axioms 08 00008 g006
Figure 7. Structure of the chromosome for the type-1 FS for classification with trapezoidal MFs.
Axioms 08 00008 g007
Figure 8. Structure of the optimized type-1 FS for classification with trapezoidal membership functions.
Axioms 08 00008 g008
Figure 9. Systolic input for the optimized type-1 FS for classification with trapezoidal membership functions.
Axioms 08 00008 g009
Figure 10. Diastolic input for the optimized type-1 FS for classification with trapezoidal membership functions.
Axioms 08 00008 g010
Figure 11. BP_Levels output for the optimized type-1 FS for classification with trapezoidal membership functions.
Axioms 08 00008 g011
Figure 12. Structure of the type-1 fuzzy system for classification with Gaussian membership functions.
Axioms 08 00008 g012
Figure 13. Systolic input for the type-1 FS for classification with Gaussian membership functions.
Axioms 08 00008 g013
Figure 14. Diastolic input for the type-1 fuzzy system for classification with Gaussian membership functions.
Axioms 08 00008 g014
Figure 15. BP_Levels output for the type-1 fuzzy system for classification with Gaussian membership functions.
Axioms 08 00008 g015
Figure 16. Structure of the chromosome for the type-1 FS for classification with Gaussians membership functions.
Axioms 08 00008 g016
Figure 17. Structure of the optimized type-1 FS for classification with Gaussians membership functions.
Axioms 08 00008 g017
Figure 18. Systolic input for the optimized type-1 FS for classification with Gaussians membership functions.
Axioms 08 00008 g018
Figure 19. Diastolic input for the optimized type-1 FS for classification with Gaussian membership functions.
Axioms 08 00008 g019
Figure 20. BP_Levels output for the optimized type-1 FS for classification with Gaussians membership functions.
Axioms 08 00008 g020
Figure 21. Structure of the interval type-2 FS for classification with triangular membership functions.
Axioms 08 00008 g021
Figure 22. Systolic input for the interval type-2 FS for classification with triangular membership functions.
Axioms 08 00008 g022
Figure 23. Diastolic input for the interval type-2 FS for classification with triangular membership functions.
Axioms 08 00008 g023
Figure 24. BP_Levels output for the interval type-2 FS for classification with triangular membership functions.
Axioms 08 00008 g024
Figure 25. Structure of the chromosome for the interval type-2 fuzzy system for classification with triangular membership functions.
Axioms 08 00008 g025
Figure 26. Structure of the optimized interval type-2 fuzzy system for classification with triangular membership functions.
Axioms 08 00008 g026
Figure 27. Systolic input for the optimized interval type-2 fuzzy system for classification with triangular membership functions.
Axioms 08 00008 g027
Figure 28. Diastolic input for the optimized interval type-2 fuzzy system for classification with triangular membership functions.
Axioms 08 00008 g028
Figure 29. BP_Levels output for the interval type-2 fuzzy system for classification with triangular membership functions.
Axioms 08 00008 g029
Figure 30. Structure of the interval type-2 FS for classification with trapezoidal MFs.
Axioms 08 00008 g030
Figure 31. Systolic input for the interval type-2 FS for classification with trapezoidal membership functions (MFs).
Axioms 08 00008 g031
Figure 32. Diastolic input for the interval type-2 FS for classification with trapezoidal MFs.
Axioms 08 00008 g032
Figure 33. BP_Levels output for the interval type-2 fuzzy system for classification with trapezoidal membership functions.
Axioms 08 00008 g033
Figure 34. Structure of the chromosome for the interval type-2 FS for classification with trapezoidal MFs.
Axioms 08 00008 g034
Figure 35. Structure of the optimized interval type-2 FS for classification with trapezoidal MFs.
Axioms 08 00008 g035
Figure 36. Systolic input for the optimized interval type-2 fuzzy system for classification with trapezoidal membership functions.
Axioms 08 00008 g036
Figure 37. Diastolic input for the optimized interval type-2 fuzzy system for classification with trapezoidal membership functions.
Axioms 08 00008 g037
Figure 38. BP_Levels output for the optimized interval type-2 fuzzy system for classification with trapezoidal membership functions.
Axioms 08 00008 g038
Figure 39. Structure of the interval type-2 FS for classification with Gaussian membership functions (MFs).
Axioms 08 00008 g039
Figure 40. Systolic input for the interval type-2 fuzzy system for classification with Gaussian membership functions.
Axioms 08 00008 g040
Figure 41. Diastolic input for the interval type-2 fuzzy system for classification with Gaussian membership functions.
Axioms 08 00008 g041
Figure 42. BP_Levels output for the interval type-2 fuzzy system for classification with Gaussians membership functions.
Axioms 08 00008 g042
Figure 43. Structure of the chromosome for the interval type-2 FS for classification with Gaussian membership functions.
Axioms 08 00008 g043
Figure 44. Structure of the optimized interval type-2 FS for classification with Gaussian MFs.
Axioms 08 00008 g044
Figure 45. Systolic input for the optimized interval type-2 FS for classification with Gaussian membership functions.
Axioms 08 00008 g045
Figure 46. Diastolic input for the optimized interval type-2 fuzzy system for classification with Gaussian membership functions.
Axioms 08 00008 g046
Figure 47. BP_Levels output for the optimized interval type-2 FS for classification with Gaussian membership functions.
Axioms 08 00008 g047
Table 1. Classification of office BP levels.
CategorySystolic Diastolic
Hypotension<90and/or<60
Optimal<120and<80
Normal120–129and/or80–84
High Normal130–139and/or85–89
Grade 1 Hypertension140–159and/or90–99
Grade 2 Hypertension160–179and/or100–109
Grade 3 Hypertension≥180and/or≥110
Isolated systolic hypertension≥140and<90
Table 2. Some of the parameters that were tested before choosing the optimal parameters for the GA.
Genetic AlgorithmGenerationPopulationSelection MethodMutation RateCrossing Rate
GA 1100100roulette wheel0.060.5
GA 2100100roulette wheel0.040.6
GA 3100100roulette wheel0.060.7
Table 3. Shows the experiments of the 30 patients with 45 systolic and diastolic samples from the 24-h monitoring and classified by the optimized type-1(T1) fuzzy inference system with triangular, trapezoidal and Gaussian MFs based in an expert.
Experiments with 45 Systolic and Diastolic Samples from the 24 h Monitoring
PatientsCorrect Classification Percentage of the Optimized Classifier T1 (Triangular)Correct Classification Percentage of the Optimized Classifier T1 (Trapezoidal)Correct Classification Percentage of the Optimized Classifier T1 (Gaussians)
193.3397.7893.33
210093.3393.33
393.3397.7893.33
410097.7880
510093.3395.56
697.7810077.78
793.3393.3395.56
897.7893.3395.56
997.7897.7880
1010077.7884.44
1110093.33100
1297.7893.3395.56
1310097.7893.33
1497.7893.3393.33
1510097.78100
1697.7810095.56
1710093.3384.44
1897.7893.3384.44
1910077.7893.33
2093.3397.7893.33
2110086.6695.56
2210093.3393.33
2397.7886.6695.56
2497.7893.3386.66
2510077.7895.56
2697.7877.7895.56
2710097.7895.56
2897.7893.3386.66
2993.3377.7895.56
3097.7893.3395.56
Average98.0003333391.92591.926
Table 4. Shows the experiments of the 30 patients with 45 systolic and diastolic samples from the 24-h monitoring and classified by the optimized type-2(T2) fuzzy inference system with triangular, trapezoidal and Gaussian MFs based in an expert.
Experiments with 45 Systolic and Diastolic Samples from the 24 h Monitoring
PatientsCorrect Classification Percentage of the Optimized Classifier T2 (Triangular)Correct Classification Percentage of the Optimized Classifier T2 (Trapezoidal)Correct Classification Percentage of the Optimized Classifier T2 (Gaussians)
110097.7893.33
210093.3395.56
310097.7893.33
410097.7895.56
510093.3395.56
610010077.78
797.7893.3395.56
810093.3395.56
910097.7895.56
1010093.3384.44
1110097.78100
1297.7893.3395.56
1310097.7893.33
1497.7893.3393.33
1510097.78100
1610010095.56
1710093.3384.44
1810093.3393.33
1910097.7893.33
2010097.7893.33
2110086.6695.56
2210093.3393.33
2310086.6695.56
2497.7893.3386.66
2510097.7895.56
2697.7893.3395.56
2710086.6695.56
2897.7886.6695.56
2997.7886.6695.56
3097.7897.7895.56
Average99.40894.294666793.6306667
Table 5. The results for the experiments with 45 systolic and diastolic samples from the 24 h monitoring in 30 patients using type-1 FS with triangular, trapezoidal and Gaussian MFs.
Results for Type-1 Fuzzy Systems
Classifier T1
(Triangular MF)
Classifier T1
(Trapezoidal MF)
Classifier T1
(Gaussians MF)
Average:98%91.925%91.926%
Variance5.5751.2534.92
Standard Deviation2.367.165.91
Table 6. The results for the classification of the 30 experiments in the type-2 FS with triangular, trapezoidal and Gaussian MFs.
Results for Type-2 Fuzzy System
Classifier T2
(Triangular MF)
Classifier T2
(Trapezoidal MF)
Classifier T2
(Gaussians MF)
Average:99.408%94.29%93.63%
Variance0.99717.2921.04
Standard Deviation0.9984.164.59

