Article

Mathematical Modeling, Bifurcation Theory, and Chaos in a Dusty Plasma System with Generalized (r, q) Distributions

1
Department of Mathematics, Quaid-I-Azam University, Islamabad 45320, Pakistan
2
Department of Mathematics and Statistics, College of Science, Imam Mohammad Ibn Saud Islamic University (IMSIU), Riyadh 11564, Saudi Arabia
*
Author to whom correspondence should be addressed.
Axioms 2025, 14(8), 610; https://doi.org/10.3390/axioms14080610
Submission received: 18 June 2025 / Revised: 31 July 2025 / Accepted: 2 August 2025 / Published: 5 August 2025
(This article belongs to the Special Issue Trends in Dynamical Systems and Applied Mathematics)

Abstract

This study investigates the dynamics of dust acoustic periodic waves in a three-component, unmagnetized dusty plasma system using generalized ( r , q ) distributions. First, boundary conditions are applied to reduce the model to a second-order nonlinear ordinary differential equation. The Galilean transformation is subsequently applied to reformulate the second-order ordinary differential equation into an unperturbed dynamical system. Next, phase portraits of the system are examined under all possible conditions of the discriminant of the associated cubic polynomial, identifying regions of stability and instability. The Runge–Kutta method is employed to construct the phase portraits of the system. The Hamiltonian function of the unperturbed system is subsequently derived and used to analyze energy levels and verify the phase portraits. Under the influence of an external periodic perturbation, the quasi-periodic and chaotic dynamics of dust ion acoustic waves are explored. Chaos detection tools confirm the presence of quasi-periodic and chaotic patterns using Basin of attraction, Lyapunov exponents, Fractal Dimension, Bifurcation diagram, Poincaré map, Time analysis, Multi-stability analysis, Chaotic attractor, Return map, Power spectrum, and 3D and 2D phase portraits. In addition, the model’s response to different initial conditions was examined through sensitivity analysis.
MSC:
37M10; 37N30; 74A20; 37M20; 65P40; 35G20; 35G50

1. Introduction

This section provides background information, reviews the existing research that is relevant to the model under consideration, identifies gaps in the literature, outlines the key contributions, and presents the structure of the paper.

1.1. Research Foundation

Dust in the electron–ion plasma alters the plasma’s properties and adds new modes such as dust acoustic waves [1]. However, apart from the Maxwell distribution, there are non-Maxwellian distributions that include k distribution [2], q -nonextensive distribution [3], α -nonthermal distribution [4], and the generalized ( r , q ) distribution, which are predominantly used in astrophysical and space plasmas [5]. The model by Zaheer et al. [5] is called generalized ( r , q ) distribution, and it is more flexible as it consists of two spectral indices, r and q . This requires r to be equal to zero, which makes generalized ( r , q ) distribution reduce to the Maxwellian distribution form when q and to the k distribution when q = k + 1 . More recently, over the twentieth century, the generalized tree variables ( r , q ) distribution is similar to k distribution, which was successfully employed to evaluate the plasma modes; these are the electrostatic [5] and Langmuir waves [6], with charging currents derived using both k and generalized ( r , q ) distributions. Descriptions of the generalized ( r , q ) distribution function over the past two decades have revealed its successful applicability to space observations, since it has been used to analyze various plasma modes, including electrostatic modes, electromagnetic waves, ion-acoustic waves, and Langmuir waves. Furthermore, using k -generalized and ( r , q ) distributions, Rubab and Murtaza [7] developed expressions for the charging currents. Spectral indices r and q are the factors that affect the nonlinear properties of dust acoustic waves, including the fluctuation in the dust charge [8]. In the current year, Lee and Jung extended the analysis of the dispersion properties of surface dust ion acoustic waves in a magnetized dusty plasma for surface dust ion acoustic waves by adopting the generalized ( r , q ) distribution. El-Taibany and Taha also studied the effects of generalized ( r , q ) -distributed electrons on the dusty plasma waves in a dusty plasma with varying-size dust grains [9]. Subsequent research has revealed the capacity of the generalized ( r , q ) distribution to be used in capturing a wide variety of plasma types [10].
Nowadays, the study of dynamical behavior in nonlinear physical models has emerged as a prominent topic in nonlinear science. Bifurcation describes a topological and qualitative change in a system’s phase space caused by slight variations in parameters crossing critical thresholds [11]. It serves as a switching mechanism in many real-world systems, including neuron activation, pattern formation in morphogenesis, abrupt ecosystem shifts, and binary data storage in computers. Chaos describes the seemingly random yet deterministic behavior of nonlinear systems, highly sensitive to initial conditions. In continuous-time systems, chaos typically requires at least three nonlinear variables. Though governed by deterministic rules, chaotic systems exhibit unpredictable, non-repeating behavior, making long-term prediction difficult. Many researchers are actively exploring topics such as bifurcation and chaotic dynamics. For instance, San et al. [12] analyzed solitary waves of the fractional magneto–electro–elastic system. Jhangeer et al. [13] studied analytical solutions and dynamics of the extended Bogoyavlensky–Konopelchenko equation.

1.2. Insights from Prior Studies

El-Wakil et al. [14] studied dusty plasma super soliton propagation in a four-component dusty plasma, highlighting the need for a multi-component model. Das et al. [15] analyzed nonlinear super soliton features under collisional effects. Ragab M. Taha et al. [16] studied Equations (1)–(3) using bifurcation analysis, but discussed only three cases, which do not provide a complete set of phase portrait results.

1.3. Identified Research Gaps

Although several studies have examined the generalized ( r , q ) distributions, the dynamical behavior of the model remains unexplored in terms of phase portraits, Hamiltonian structures, and chaotic dynamics. Prior research has applied certain analytical methods to specific systems, but a unified and thorough investigation using all essential tools is still lacking.

1.4. Core Contributions

The present study examines both non-autonomous and autonomous dynamical systems. Sensitivity analysis and phase portraits are explored for the non-autonomous system. The Hamiltonian function is also calculated, and the corresponding energy levels are analyzed. Furthermore, the chaotic behavior of the autonomous dynamical system is investigated in detail. Subsequently, the chaotic behavior of the autonomous dynamical system was examined using the fourth-order Runge–Kutta method, along with a range of chaos detection tools, including:
  • Basin of attraction.
  • Lyapunov exponents.
  • Fractal Dimension.
  • Bifurcation diagram.
  • Poincaré map.
  • Time analysis.
  • Multi-stability analysis.
  • Chaotic attractor.
  • Return map.
  • Power spectrum.
  • Three-dimensional (3D) phase portrait.
  • Two-dimensional (2D) phase portrait.

1.5. Research Structure

The structure of this research is organized as follows: Section 1 introduces the fundamental equations governing the system. Section 3 focuses on the construction of the dynamic system. In Section 5, the exploration of chaos analysis is presented. Section 6 outlines the techniques employed for identifying chaotic behavior. Section 7 describes the sensitivity analysis of the considered model. Finally, the main results are detailed in Section 8.

2. Mathematical Framework

In this section, the mathematical structure is developed, starting with a detailed discussion of the governing parameters [16].

Mathematical Modeling of the Governing System

Consider a one-dimensional, unmagnetized, collisionless three-component dust-plasma system composed of highly significant, negatively charged dust grains, Maxwellian ions, and electrons that follow a generalized ( r , q ) distribution. In equilibrium, charge neutrality is given by [16]:
α i t + ( α i β i ) x = 0 ,
β i t + β i β i x = γ x ,
2 γ x 2 = α i + α e α k .
In equilibrium, charge neutrality is given by:
Z i α i 0 + α e 0 = α k 0 .
Here, the subscript 0 denotes the unperturbed values of the corresponding quantities. The normalization of various quantities is performed as follows [16]:
T eff = T k T e μ 0 T e + ν 0 T k , s 0 = T eff T k = 1 μ 0 + ν 0 σ 0 , σ 0 = T k T e , λ D i = T eff 4 π e 2 Z i α i 0 , ω D i 1 = m i 4 π e 2 Z 2 i α i 0 , c i = Z i T eff m i .
The generalized ( r , q ) distribution function for plasma species j is expressed as [16]:
f j r , q ( v ) = ϵ 1 + 1 q 1 v 2 ϕ j 2 r + 1 q , ϵ = α j 0 ( q 1 ) 1 2 ( r + 1 ) Γ ( q ) 2 ϕ j Γ q 1 2 ( r + 1 ) Γ 1 + 1 2 ( r + 1 ) , ϕ j = 3 ( q 1 ) 1 r + 1 Γ q 1 2 ( r + 1 ) Γ 1 + 1 2 ( r + 1 ) T j Γ q 3 2 ( r + 1 ) Γ 1 + 3 2 ( r + 1 ) m j 1 / 2 .
The spectral indices r and q are subject to the conditions q is greater than one and q [ r + 1 ] > 1.5 . Based on Equation (6), the normalized densities of ions and electrons can be expressed as follows:
M k = μ 0 [ 1 + s 0 γ ( A 0 + B 0 s 0 γ C 0 s 0 2 γ 2 + D 0 s 0 3 γ 3 ) ] , M e = ν 0 [ 1 + s 0 σ 0 γ ( A 0 + B 0 s 0 σ 0 γ + C 0 s 0 2 σ 0 2 γ 2 + D 0 s 0 3 σ 0 3 γ 3 ) ] , A 0 = ( q 1 ) 1 2 ( r + 1 ) Γ q + 1 2 ( r + 1 ) Γ 1 1 2 ( r + 1 ) 2 Γ q 1 2 ( r + 1 ) Γ 1 + 1 2 ( r + 1 ) , B 0 = ( q 1 ) 2 r + 1 Γ q + 3 2 ( r + 1 ) Γ 1 3 2 ( r + 1 ) 8 Γ q 1 2 ( r + 1 ) Γ 1 + 1 2 ( r + 1 ) , C 0 = ( q 1 ) 3 r + 1 Γ q + 5 2 ( r + 1 ) Γ 1 5 2 ( r + 1 ) 16 Γ q 1 2 ( r + 1 ) Γ 1 + 1 2 ( r + 1 ) , D 0 = 5 ( q 1 ) 4 r + 1 Γ q + 7 2 ( r + 1 ) Γ 1 7 2 ( r + 1 ) 128 Γ q 1 2 ( r + 1 ) Γ 1 + 1 2 ( r + 1 ) .
As r approaches zero and q tends towards infinity, the values are set as A 0 is equal to one, B 0 is equal 0.5, C 0 is equal 0.1667, and D 0 is equal to 0.04166, resulting in the recovery of the Maxwellian distribution.

3. Construction of the Autonomous Dynamic System

Consider the following wave transformation [16]:
ζ = x g t ,
by substituting Equation (8) into Equations (1) and (2) and applying the boundary conditions α 1 , β 0 , γ 0 , and d γ d ζ 0 as ζ ± , we derive:
α = 1 + 2 γ ν 0 2 1 / 2 ,
substituting Equation (8) into Equation (3), we get:
d 2 γ d ζ 2 = ρ 1 γ + ρ 2 γ 2 + ρ 3 γ 3 + ρ 4 γ 4 ,
where:
ρ 1 = 1 ν 0 2 + s 0 A 0 ( 1 + ν 0 + σ 0 ν 0 ) , ρ 2 = 3 2 ν 0 4 s 0 2 B 0 ( 1 + ν 0 σ 0 2 ν 0 ) , ρ 3 = 5 2 ν 0 5 + s 0 3 C 0 ( 1 + ν 0 + σ 0 3 ν 0 ) , ρ 4 = 35 8 ν 0 5 s 0 4 D 0 ( 1 + ν 0 σ 0 4 ν 0 ) .
Equation (10) can be reformulated as an autonomous dynamical system in the form [17]:
d γ d ζ = K , d K d ζ = ρ 1 γ + ρ 2 γ 2 + ρ 3 γ 3 + ρ 4 γ 4 .

Bifurcation Analysis

In this section, we discuss the dynamical analysis using bifurcation analysis. For this purpose, determine the equilibrium points of the autonomous dynamical system given in Equation (12):
d γ d ζ = 0 ,   and   d K d ζ = 0 .
As a consequence:
K = 0 ,   and   ρ 1 γ + ρ 2 γ 2 + ρ 3 γ 3 + ρ 4 γ 4 = 0 .
K = 0 , γ = 0 ,   and   ρ 1 + ρ 2 γ + ρ 3 γ 2 + ρ 4 γ 3 = 0 .
The discriminant of a cubic polynomial is given by:
Ψ = 18 ρ 1 ρ 2 ρ 3 ρ 4 4 ρ 3 3 ρ 1 + ρ 3 2 ρ 2 2 4 ρ 4 ρ 2 3 27 ρ 4 2 ρ 1 2 ·
The jacobian of the autonomous dynamical system is:
Δ ( γ , K ) = 0 1 ρ 1 + 2 ρ 2 γ + 3 ρ 3 γ 2 + 4 ρ 4 γ 3 0
Δ ( γ , K ) = 1 ( ρ 1 + 2 ρ 2 γ + 3 ρ 3 γ 2 + 4 ρ 4 γ 3 )
Proposition 1.
Consider a dynamical system with an equilibrium point. The local behavior at the equilibrium point can be characterized using the Jacobian Δ ( γ , K ) as follows:
1. 
If Δ ( γ , K ) > 0 , the point is locally stable and corresponds to a center.
2. 
If Δ ( γ , K ) < 0 , the point is unstable and corresponds to a saddle.
3. 
If Δ ( γ , K ) = 0 , the point is non-hyperbolic.
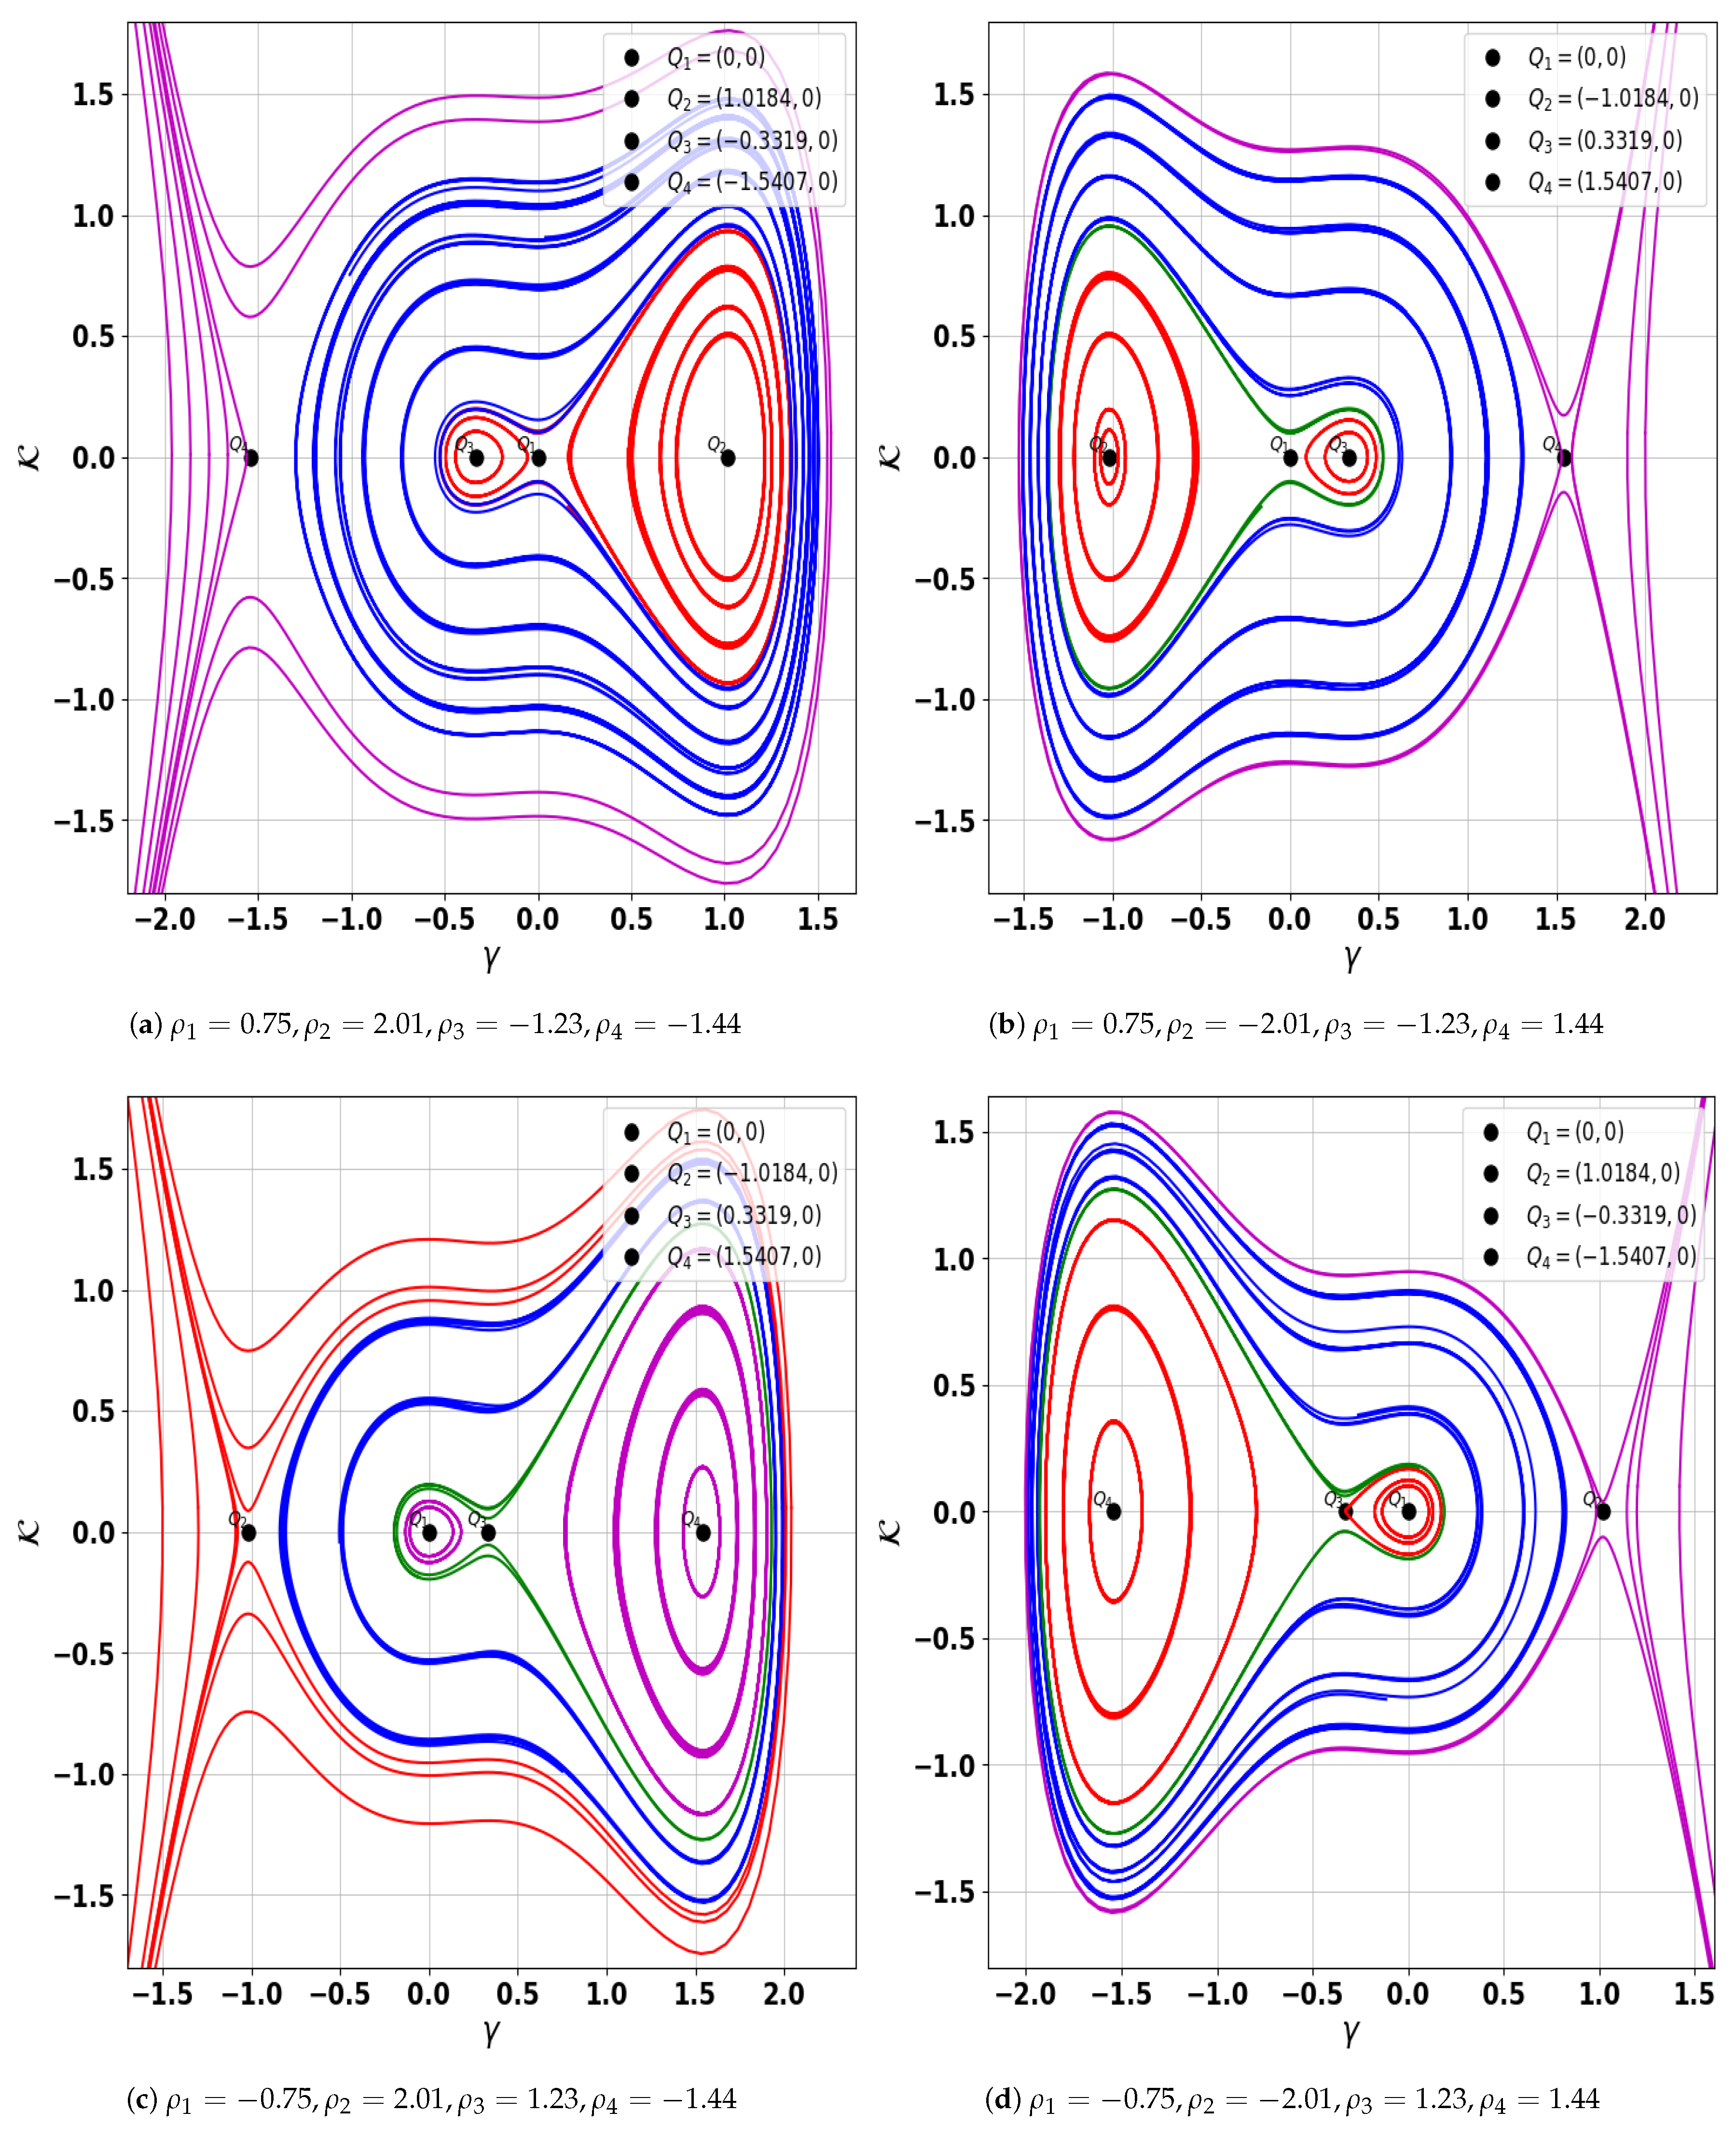
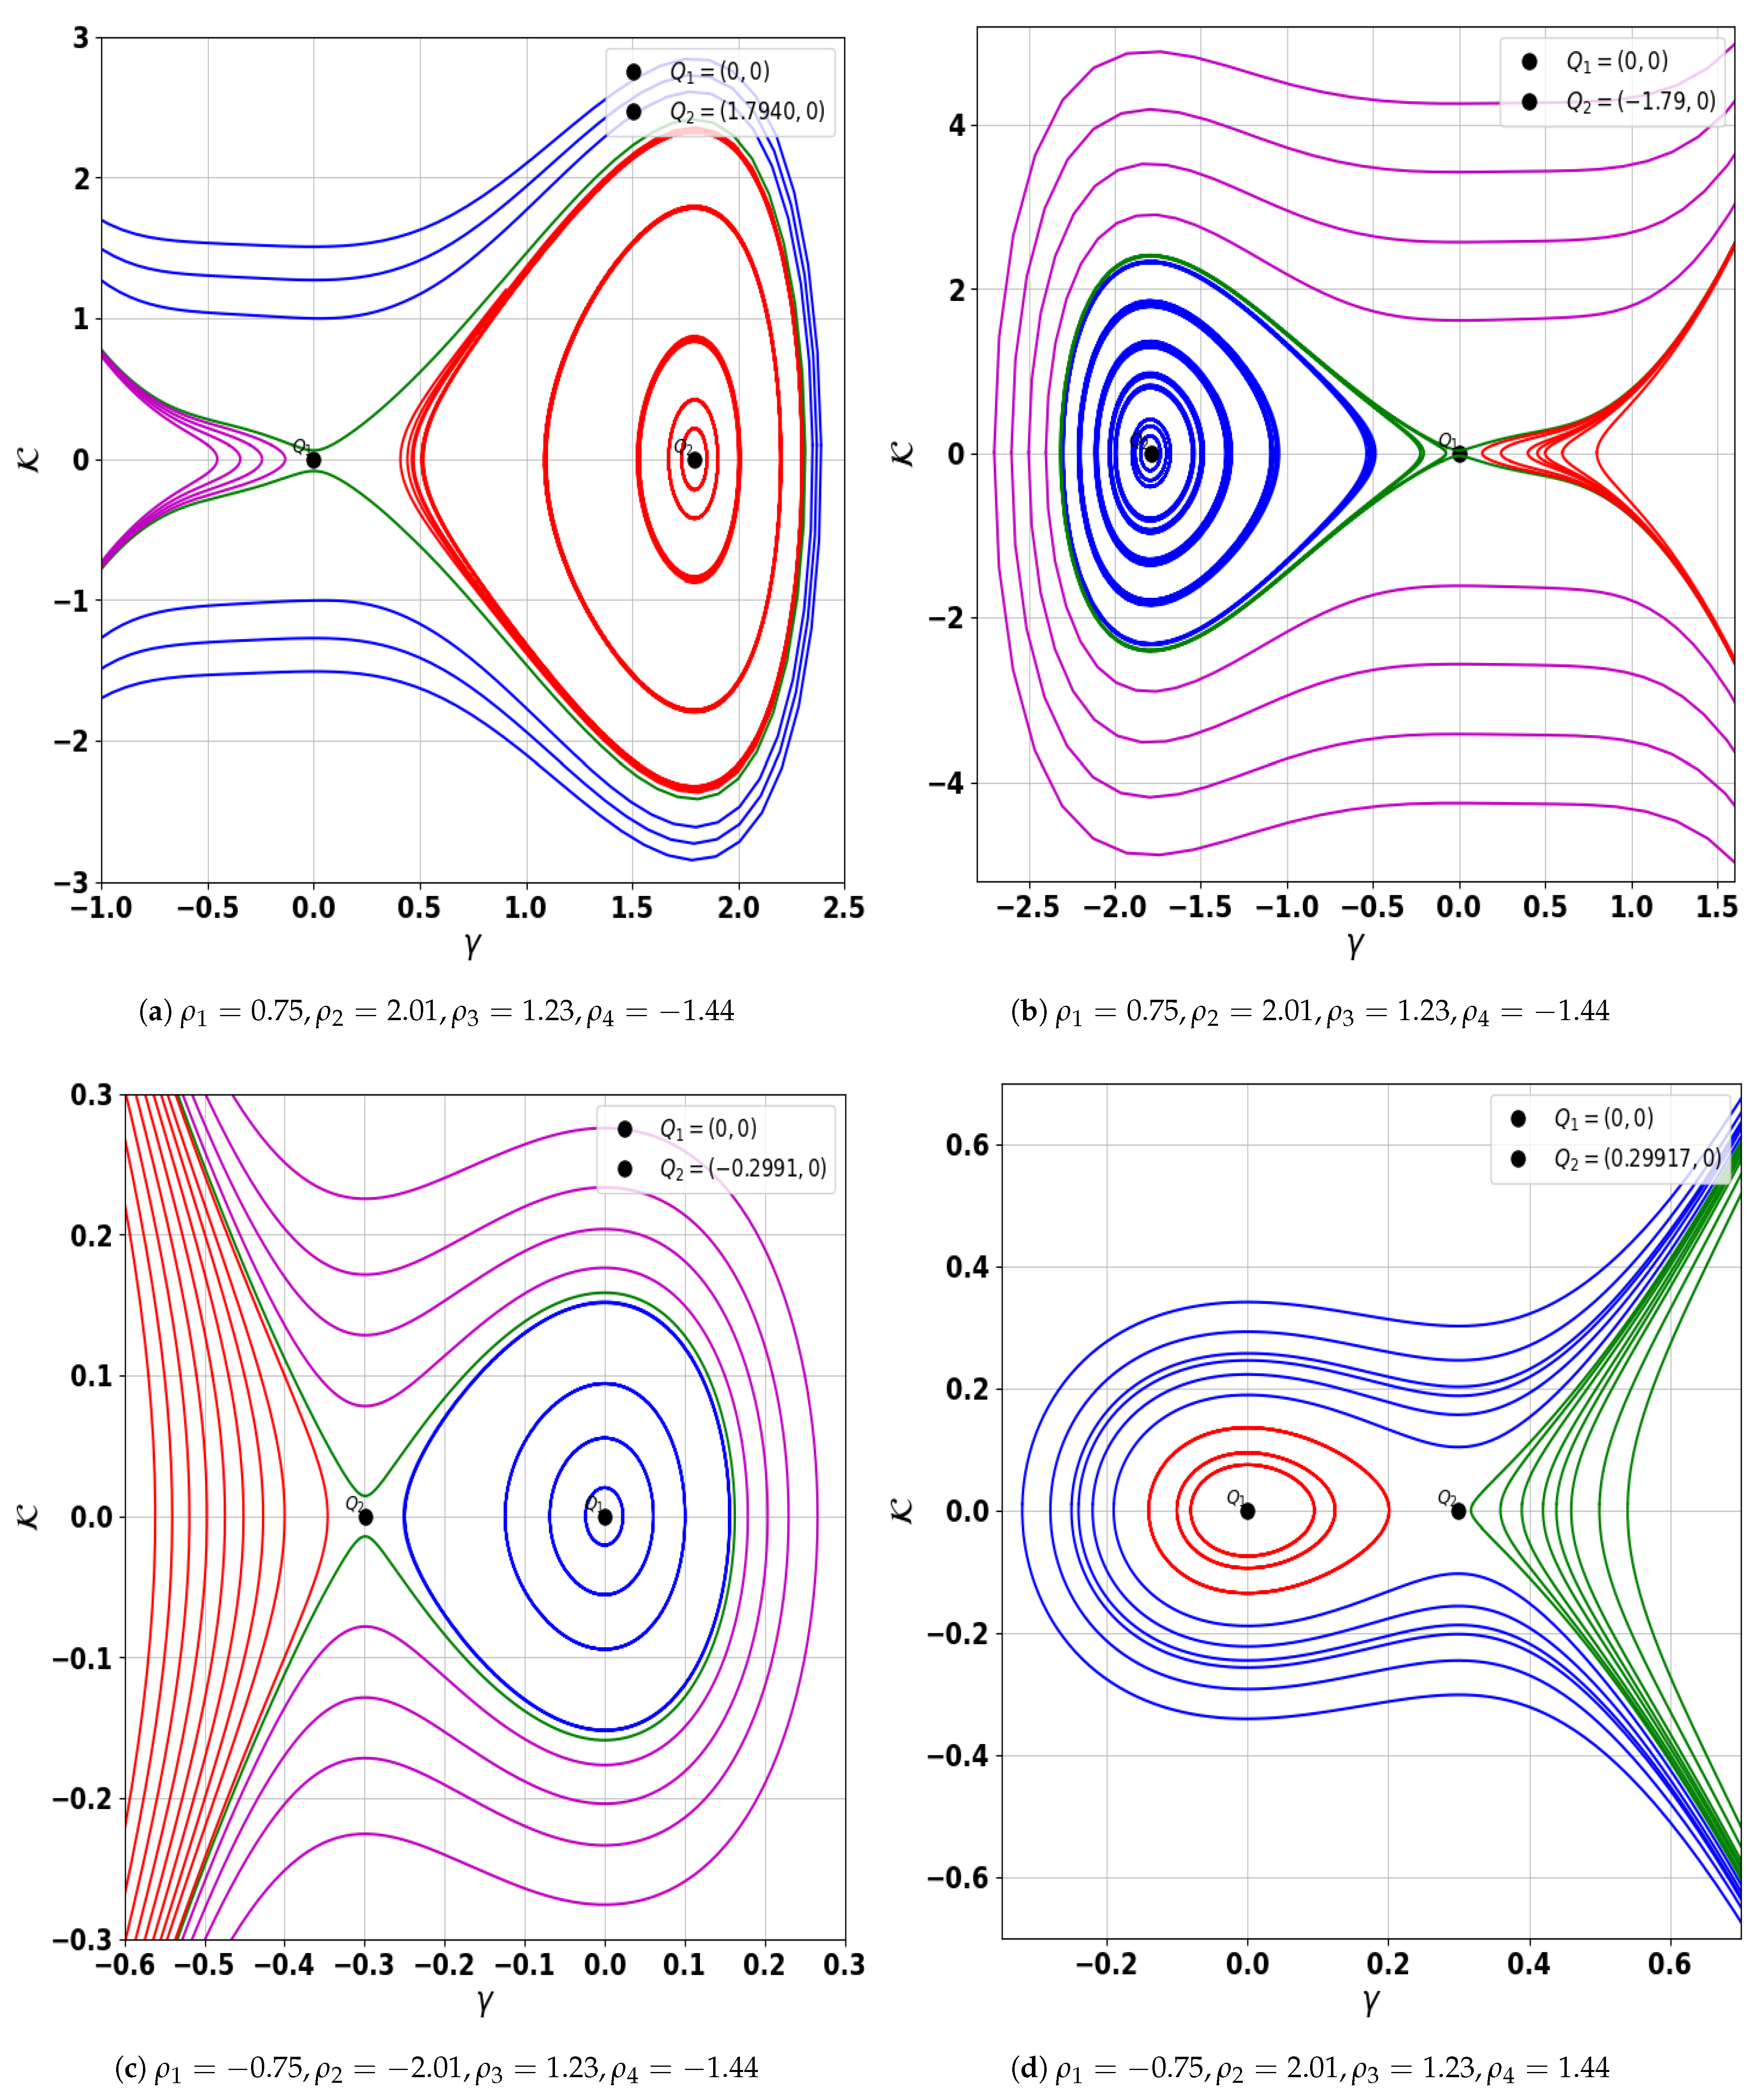
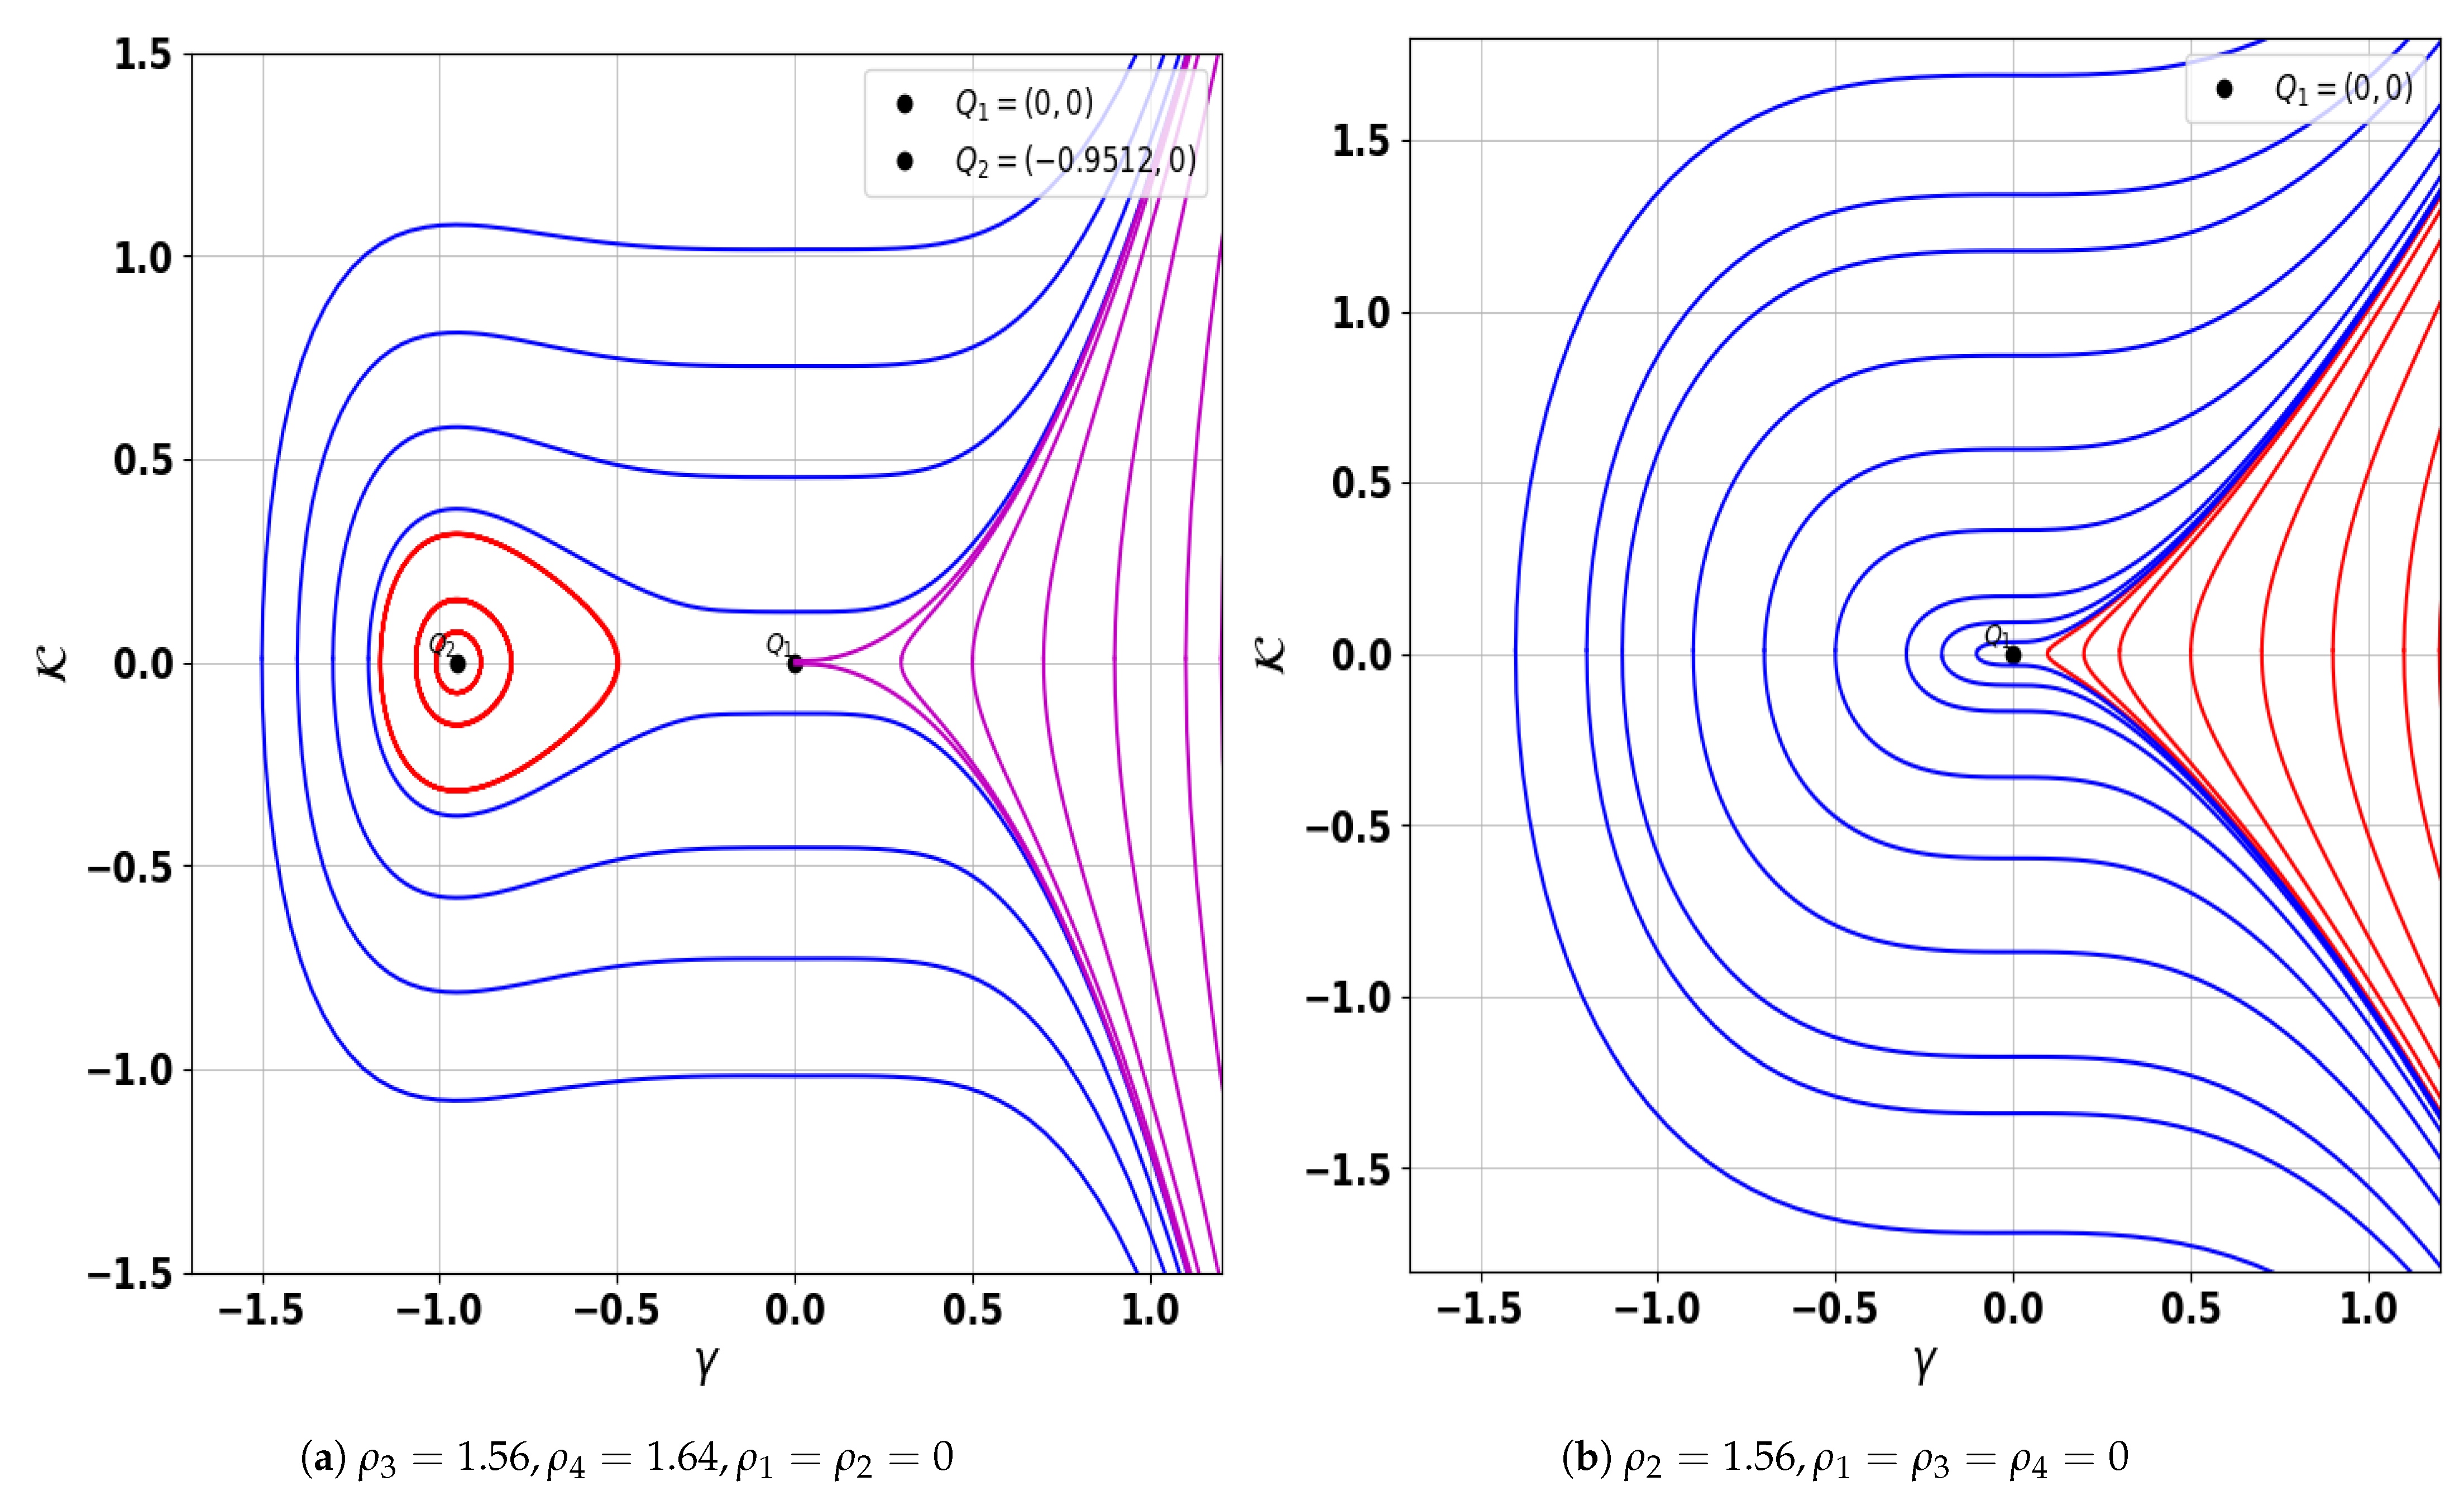
By setting the parameters to Δ , ρ 4 , ρ 3 , ρ 2 , and ρ 1 , the following results are obtained and summarized in Table 1.
Table 1. Overview of phase portraits.
Sub-FigureConditionsEquilibrium Point
Figure 1a ρ 1 = 0.75 , ρ 2 = 2.01 , ρ 3 = 1.23 , ρ 4 = 1.44 Center: (1.0184, 0), (−0.3319, 0), Saddle: (0, 0), (−1.5407, 0)
Figure 1b ρ 1 = 0.75 , ρ 2 = 2.01 , ρ 3 = 1.23 , ρ 4 = 1.44 Center: (−1.0184, 0), (0.3319, 0), Saddle: (0, 0), (1.5407, 0)
Figure 1c ρ 1 = 0.75 , ρ 2 = 2.01 , ρ 3 = 1.23 , ρ 4 = 1.44 Center: (0, 0), (1.5407, 0), Saddle: (−1.0184, 0), (0.3319, 0)
Figure 1d ρ 1 = 0.75 , ρ 2 = 2.01 , ρ 3 = 1.23 , ρ 4 = 1.44 Center: (−0.42922, 0), Saddle: (0, 0)
Figure 2a ρ 1 = 0.75 , ρ 2 = 2.01 , ρ 3 = 1.23 , ρ 4 = 1.44 Center: (1.7940, 0), Saddle: (0, 0)
Figure 2b ρ 1 = 0.75 , ρ 2 = 2.01 , ρ 3 = 1.23 , ρ 4 = 1.44 Center: (−1.7940, 0), Saddle: (0, 0)
Figure 2c ρ 1 = 0.75 , ρ 2 = 2.01 , ρ 3 = 1.23 , ρ 4 = 1.44 Center: (0, 0), Saddle: (−0.29917, 0)
Figure 2d ρ 1 = 0.75 , ρ 2 = 2.01 , ρ 3 = 1.23 , ρ 4 = 1.44 Center: (0, 0), Saddle: (0.29917, 0)
Figure 3a ρ 3 = 1.56 , ρ 4 = 1.64 , ρ 1 = ρ 2 = 0 Saddle: (0, 0), Center: (−0.9512, 0)
Figure 3b ρ 2 = 1.56 , ρ 1 = ρ 3 = ρ 4 = 0 Cusp: (0, 0)
Figure 1. Graphical representation of the phase space behavior of system (12) illustrating when discriminant ( ψ ) is positive.
Axioms 14 00610 g001
Figure 2. Graphical representation of the phase space behavior of system (12) illustrating when discriminant ( ψ ) is negative.
Axioms 14 00610 g002
Figure 3. Graphical representation of the phase space behavior of system (12) illustrating when discriminant ( ψ ) is zero.
Axioms 14 00610 g003

4. Hamiltonian Approach to Dynamical Systems

In this section, we discuss the energy levels and also prove the phase portrait results using the Hamiltonian function. Firstly, introduce some basic definitions related to Hamiltonian systems.
Definition 1.
Let ( γ 0 , K 0 ) be an equilibrium point of the dynamical system, such that:
E γ = E K = 0 at ( γ 0 , K 0 ) .
Definition 2.
Assume that E ( γ , K ) has a stationary point at ( γ 0 , K 0 ) and that all second-order partial derivatives of E ( γ , K ) are continuous in a neighborhood of this point. Then:
R 0 = 2 E γ 2 · 2 E K 2 2 E γ K ,
evaluated at the point ( γ 0 , K 0 ) . Based on this, the following conclusions can be drawn:
1. 
The function E ( γ , K ) attains a maximum or minimum at the point ( γ 0 , K 0 )
if R 0 > 0 .
2. 
E ( γ , K ) has a saddle point at ( γ 0 , K 0 ) if R 0 < 0 .
3. 
If R 0 = 0 , further analysis is required to classify the nature of the stationary point.
Construct the Hamiltonian E ( γ , K ) as the sum of kinetic and potential energies:
E ( γ , K ) = T ( K ) + V ( γ ) .
The kinetic energy is defined as:
T ( K ) = K 2 2 ,
where V ( γ ) is the potential energy function, chosen such that the Hamiltonian function yields the original second-order ODE. We require:
d γ d ζ = E K = K , d K d ζ = E γ = V ( γ ) ·
Comparing this with the second equation of the system:
d K d ζ = ρ 1 γ + ρ 2 γ 2 + ρ 3 γ 3 + ρ 4 γ 4 ·
We identify:
V ( γ ) = ρ 1 γ + ρ 2 γ 2 + ρ 3 γ 3 + ρ 4 γ 4 ·
Thus, integrating with respect to γ , the potential becomes:
V ( γ ) = ρ 1 γ 2 2 ρ 2 γ 3 3 ρ 3 γ 4 4 ρ 4 γ 5 5 ·
The Hamiltonian of (12) is:
E ( γ , K ) = K 2 2 ρ 1 γ 2 2 ρ 2 γ 3 3 ρ 3 γ 4 4 ρ 4 γ 5 5 .
Moreover, the energy conservation is verified by computing the total derivative:
d E d ζ = E γ d γ d ζ + E K d K d ζ = d V d γ · K + K · d V d γ = 0 .
This confirms that the Hamiltonian E ( γ , K ) is conserved along the trajectories of the system. Equation (12) describes the traveling wave solution:
B ( γ , K ) = { ( γ , K ) R × R : E 1 ( γ , K ) = A } ·
As shown in Figure 4, for K > 0 , we observe kink soliton behavior, while for K < 0 , anti-kink behavior appears. The details of phase portraits using Hamiltonian classification are presented in Table 2.

5. Chaos Analysis

In this section, we discuss the chaos analysis by introducing a perturbation term, resulting in the following two-dimensional system (12) as represented in [18]:
d γ d ζ = K , d K d ζ = ρ 1 γ + ρ 2 γ 2 + ρ 3 γ 3 + ρ 4 γ 4 + P c o s ( κ ζ ) .
Here, κ denotes the frequency and P represents the amplitude, to assess the system’s responsiveness to external forces. We investigated the chaotic behaviors at different amplitudes and frequencies by holding the primary parameters, ρ 1 , ρ 2 , ρ 3 , and ρ 4 , and varying the frequency and amplitude values.
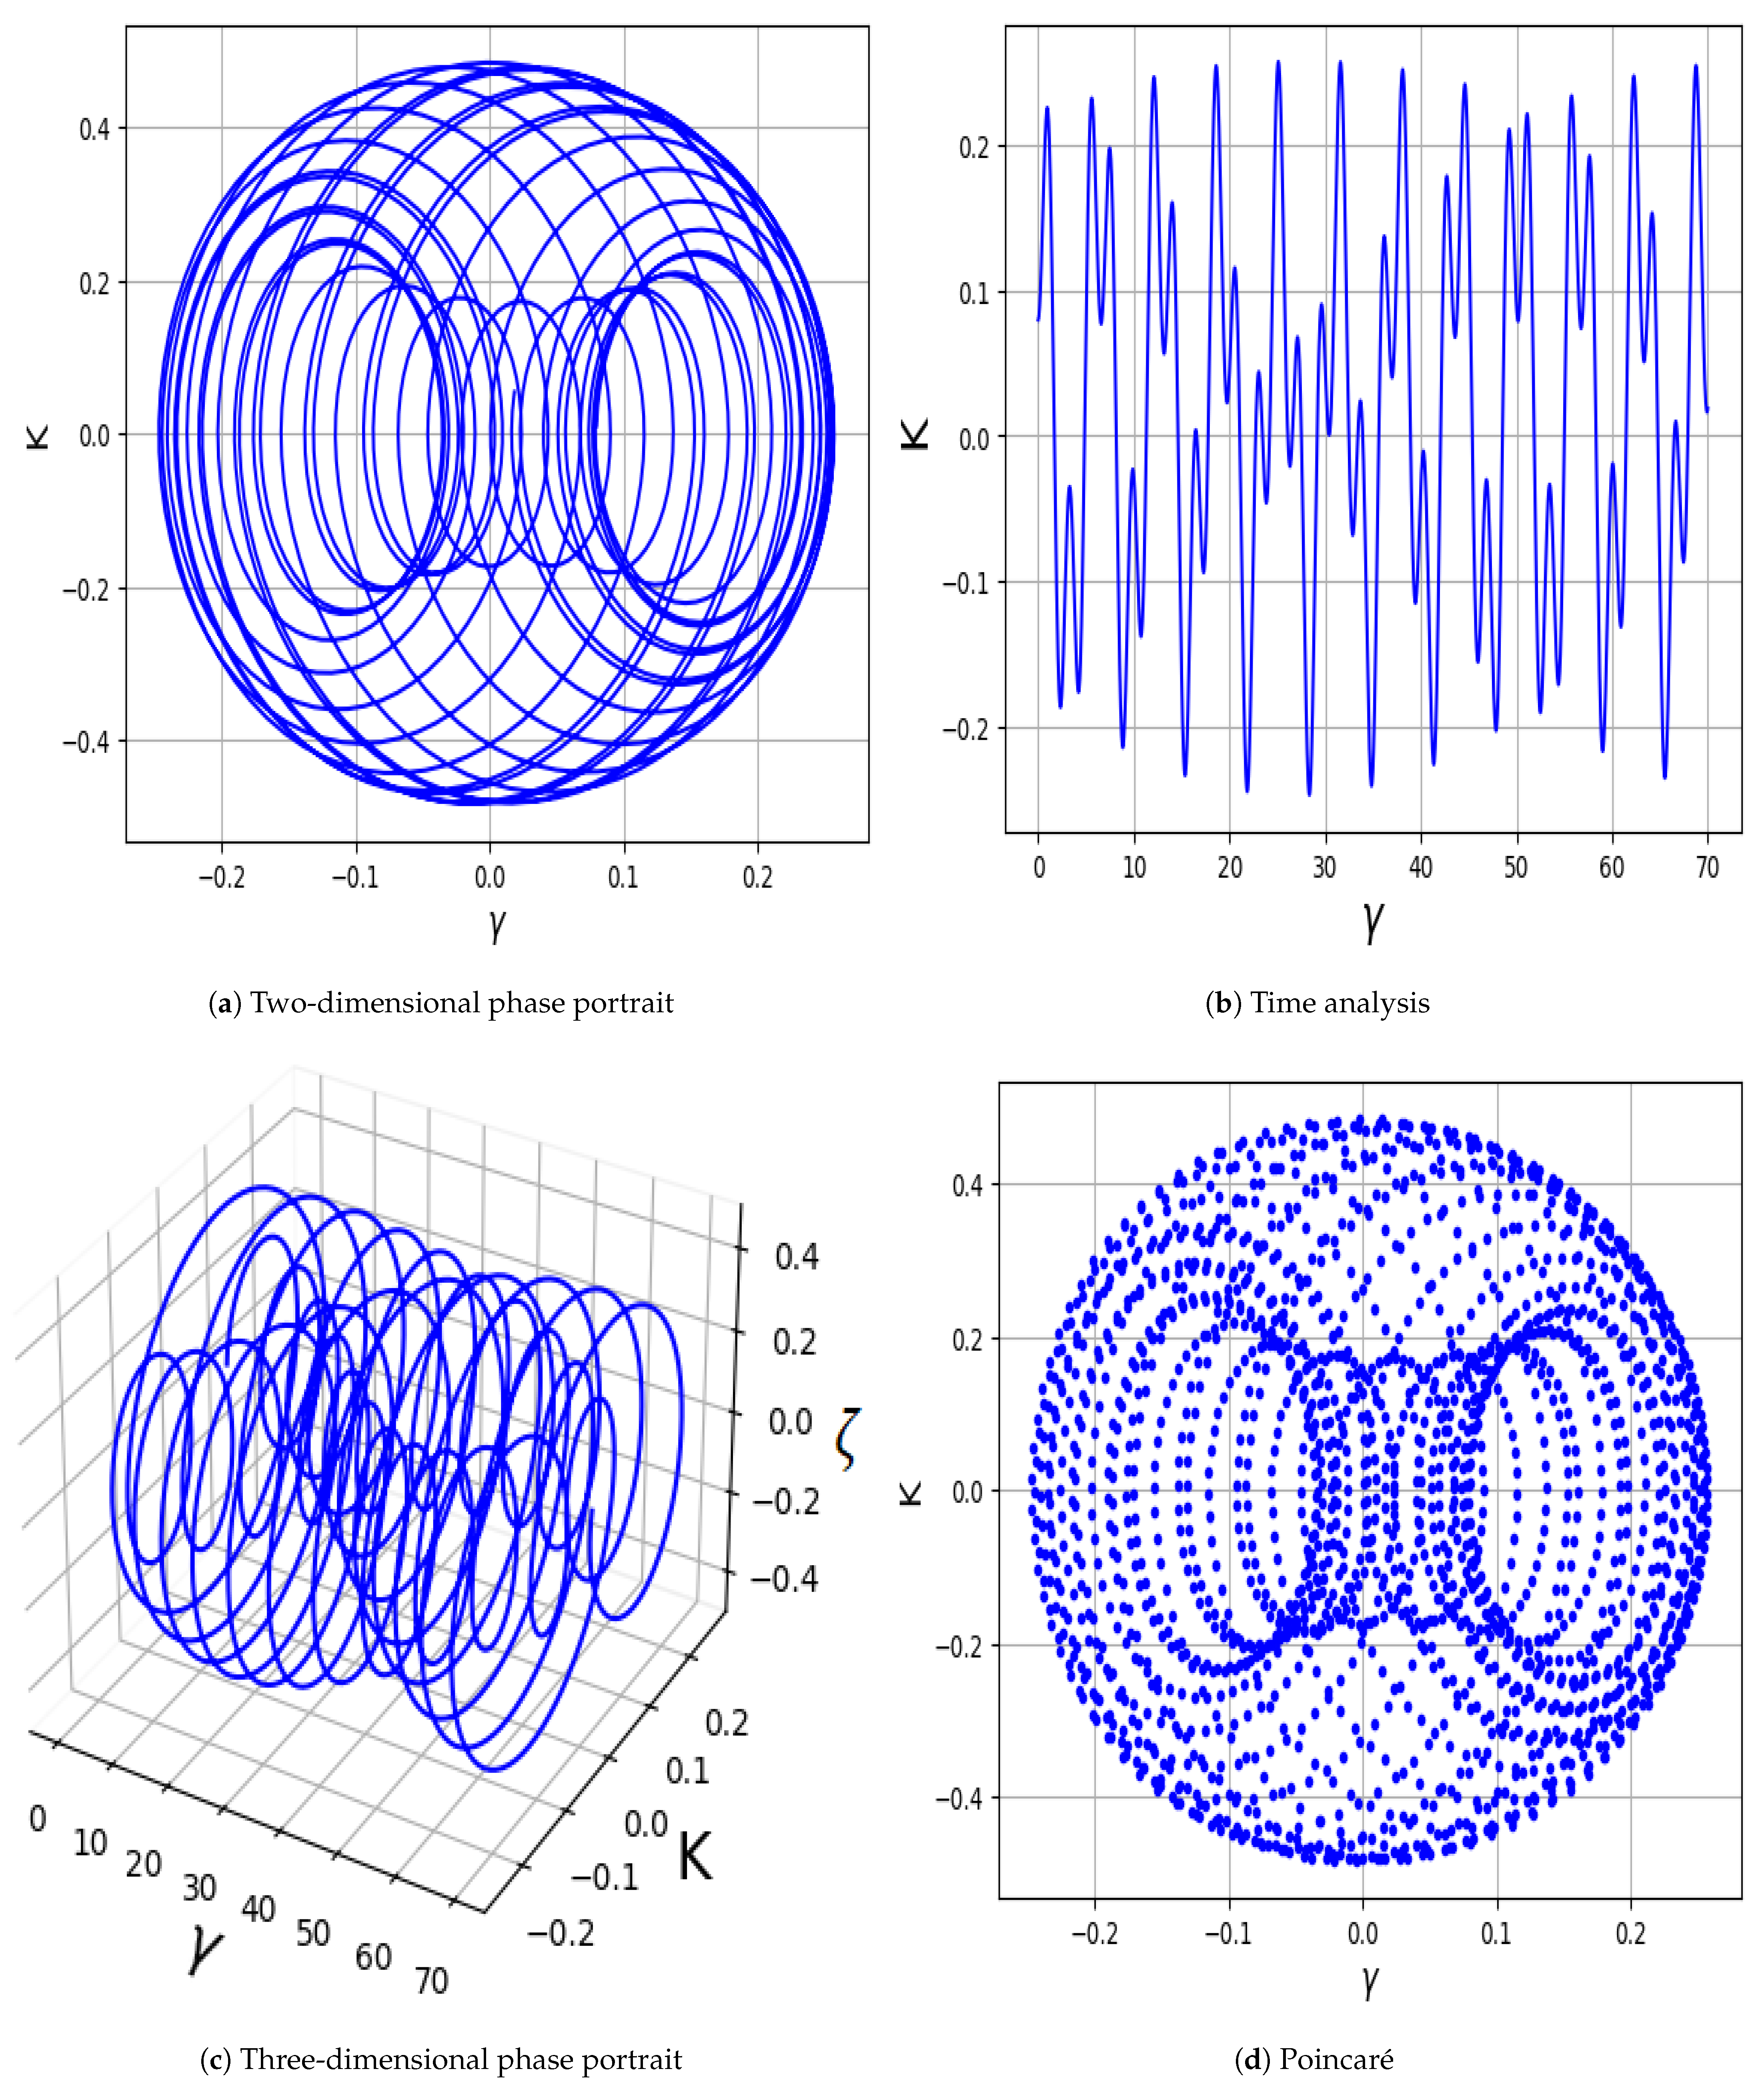
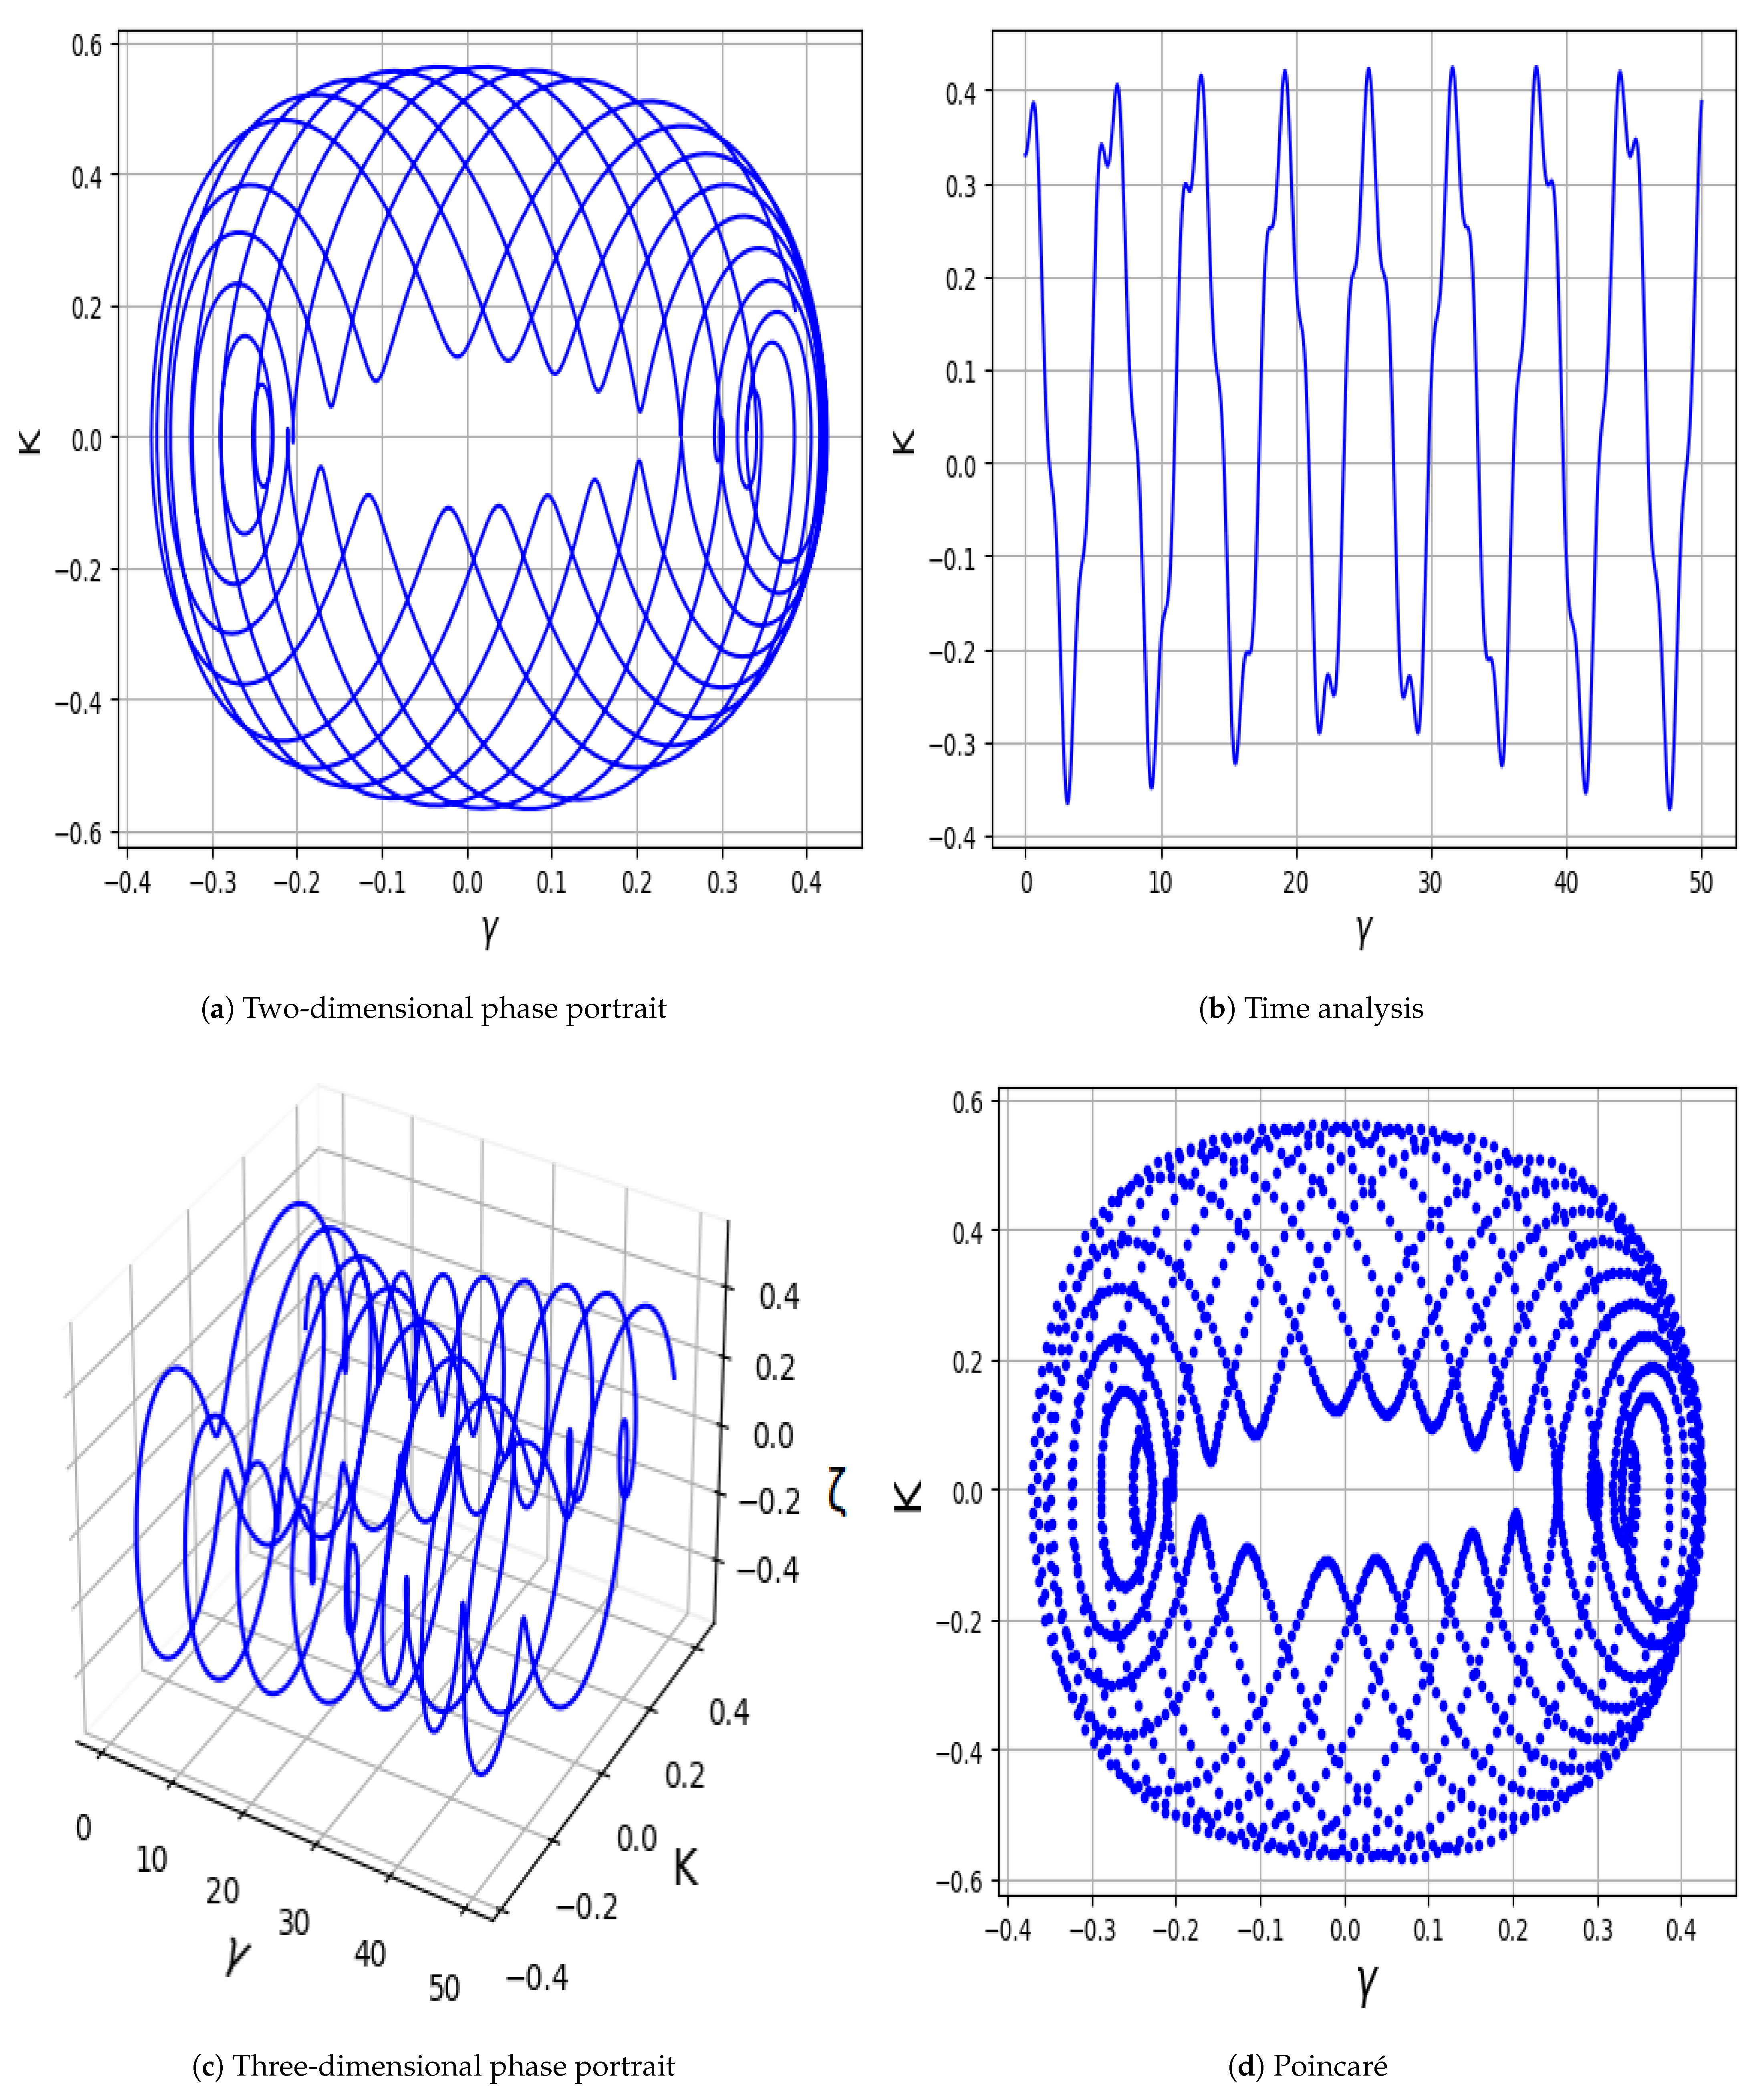
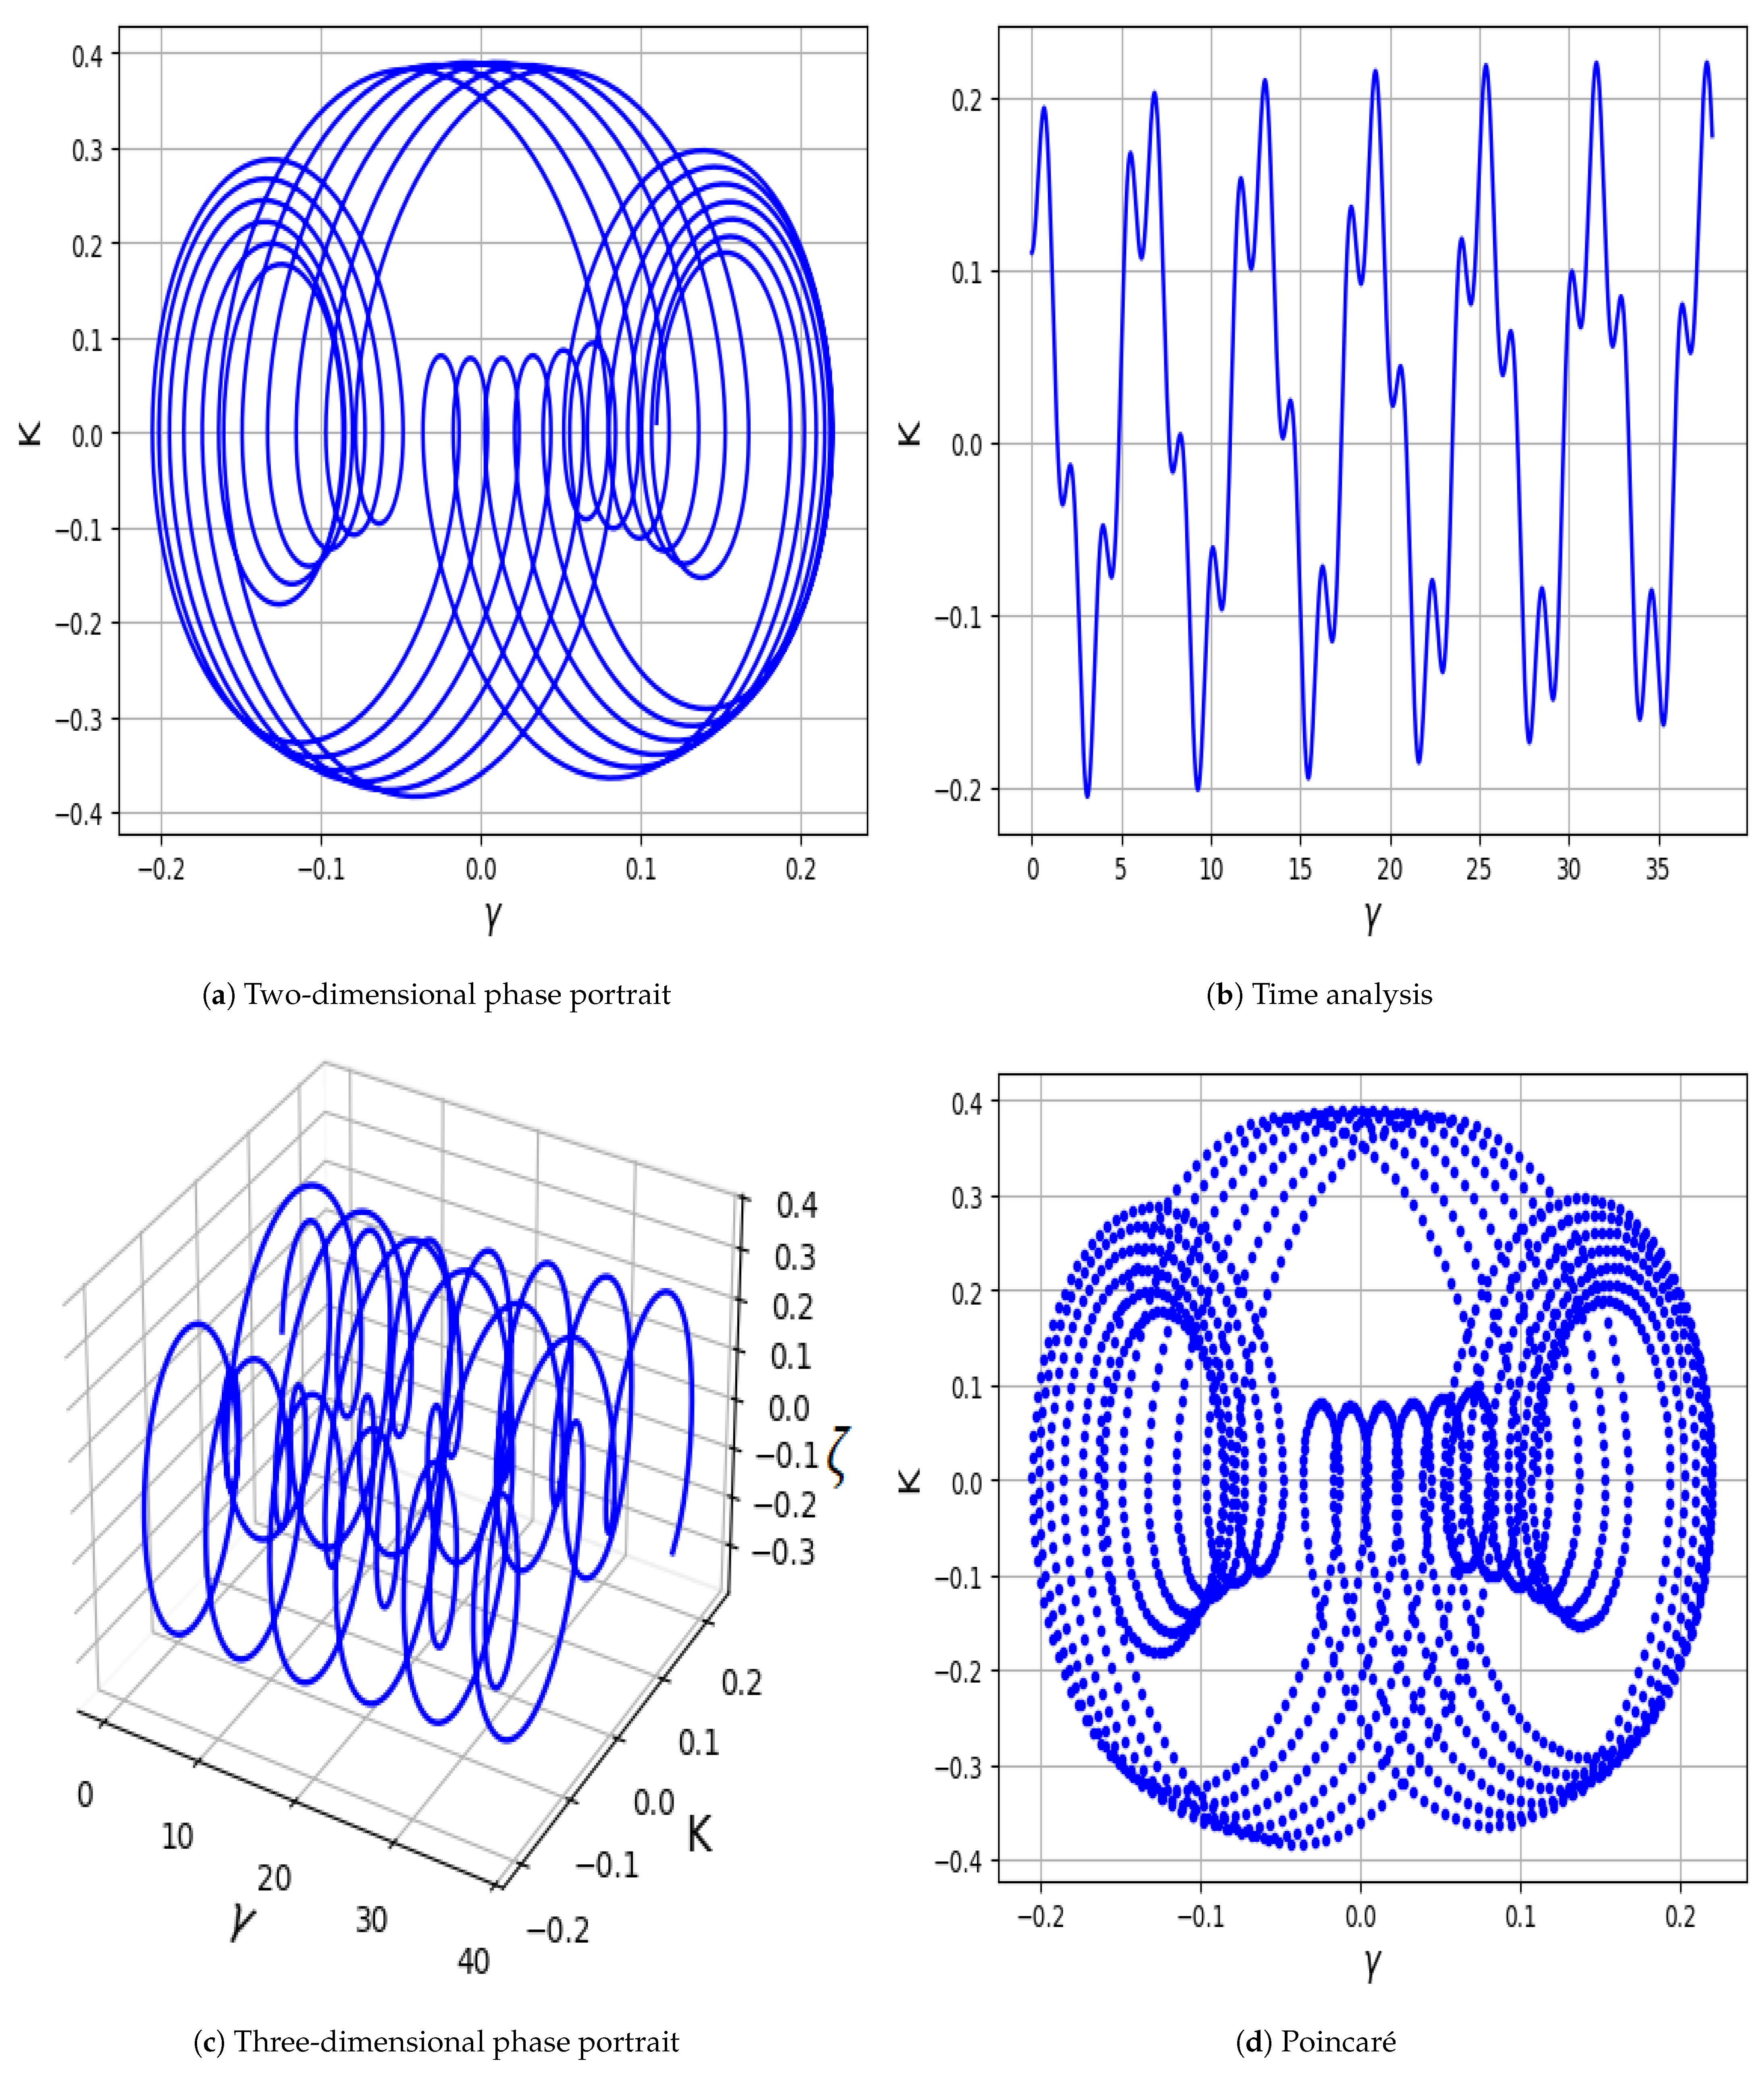
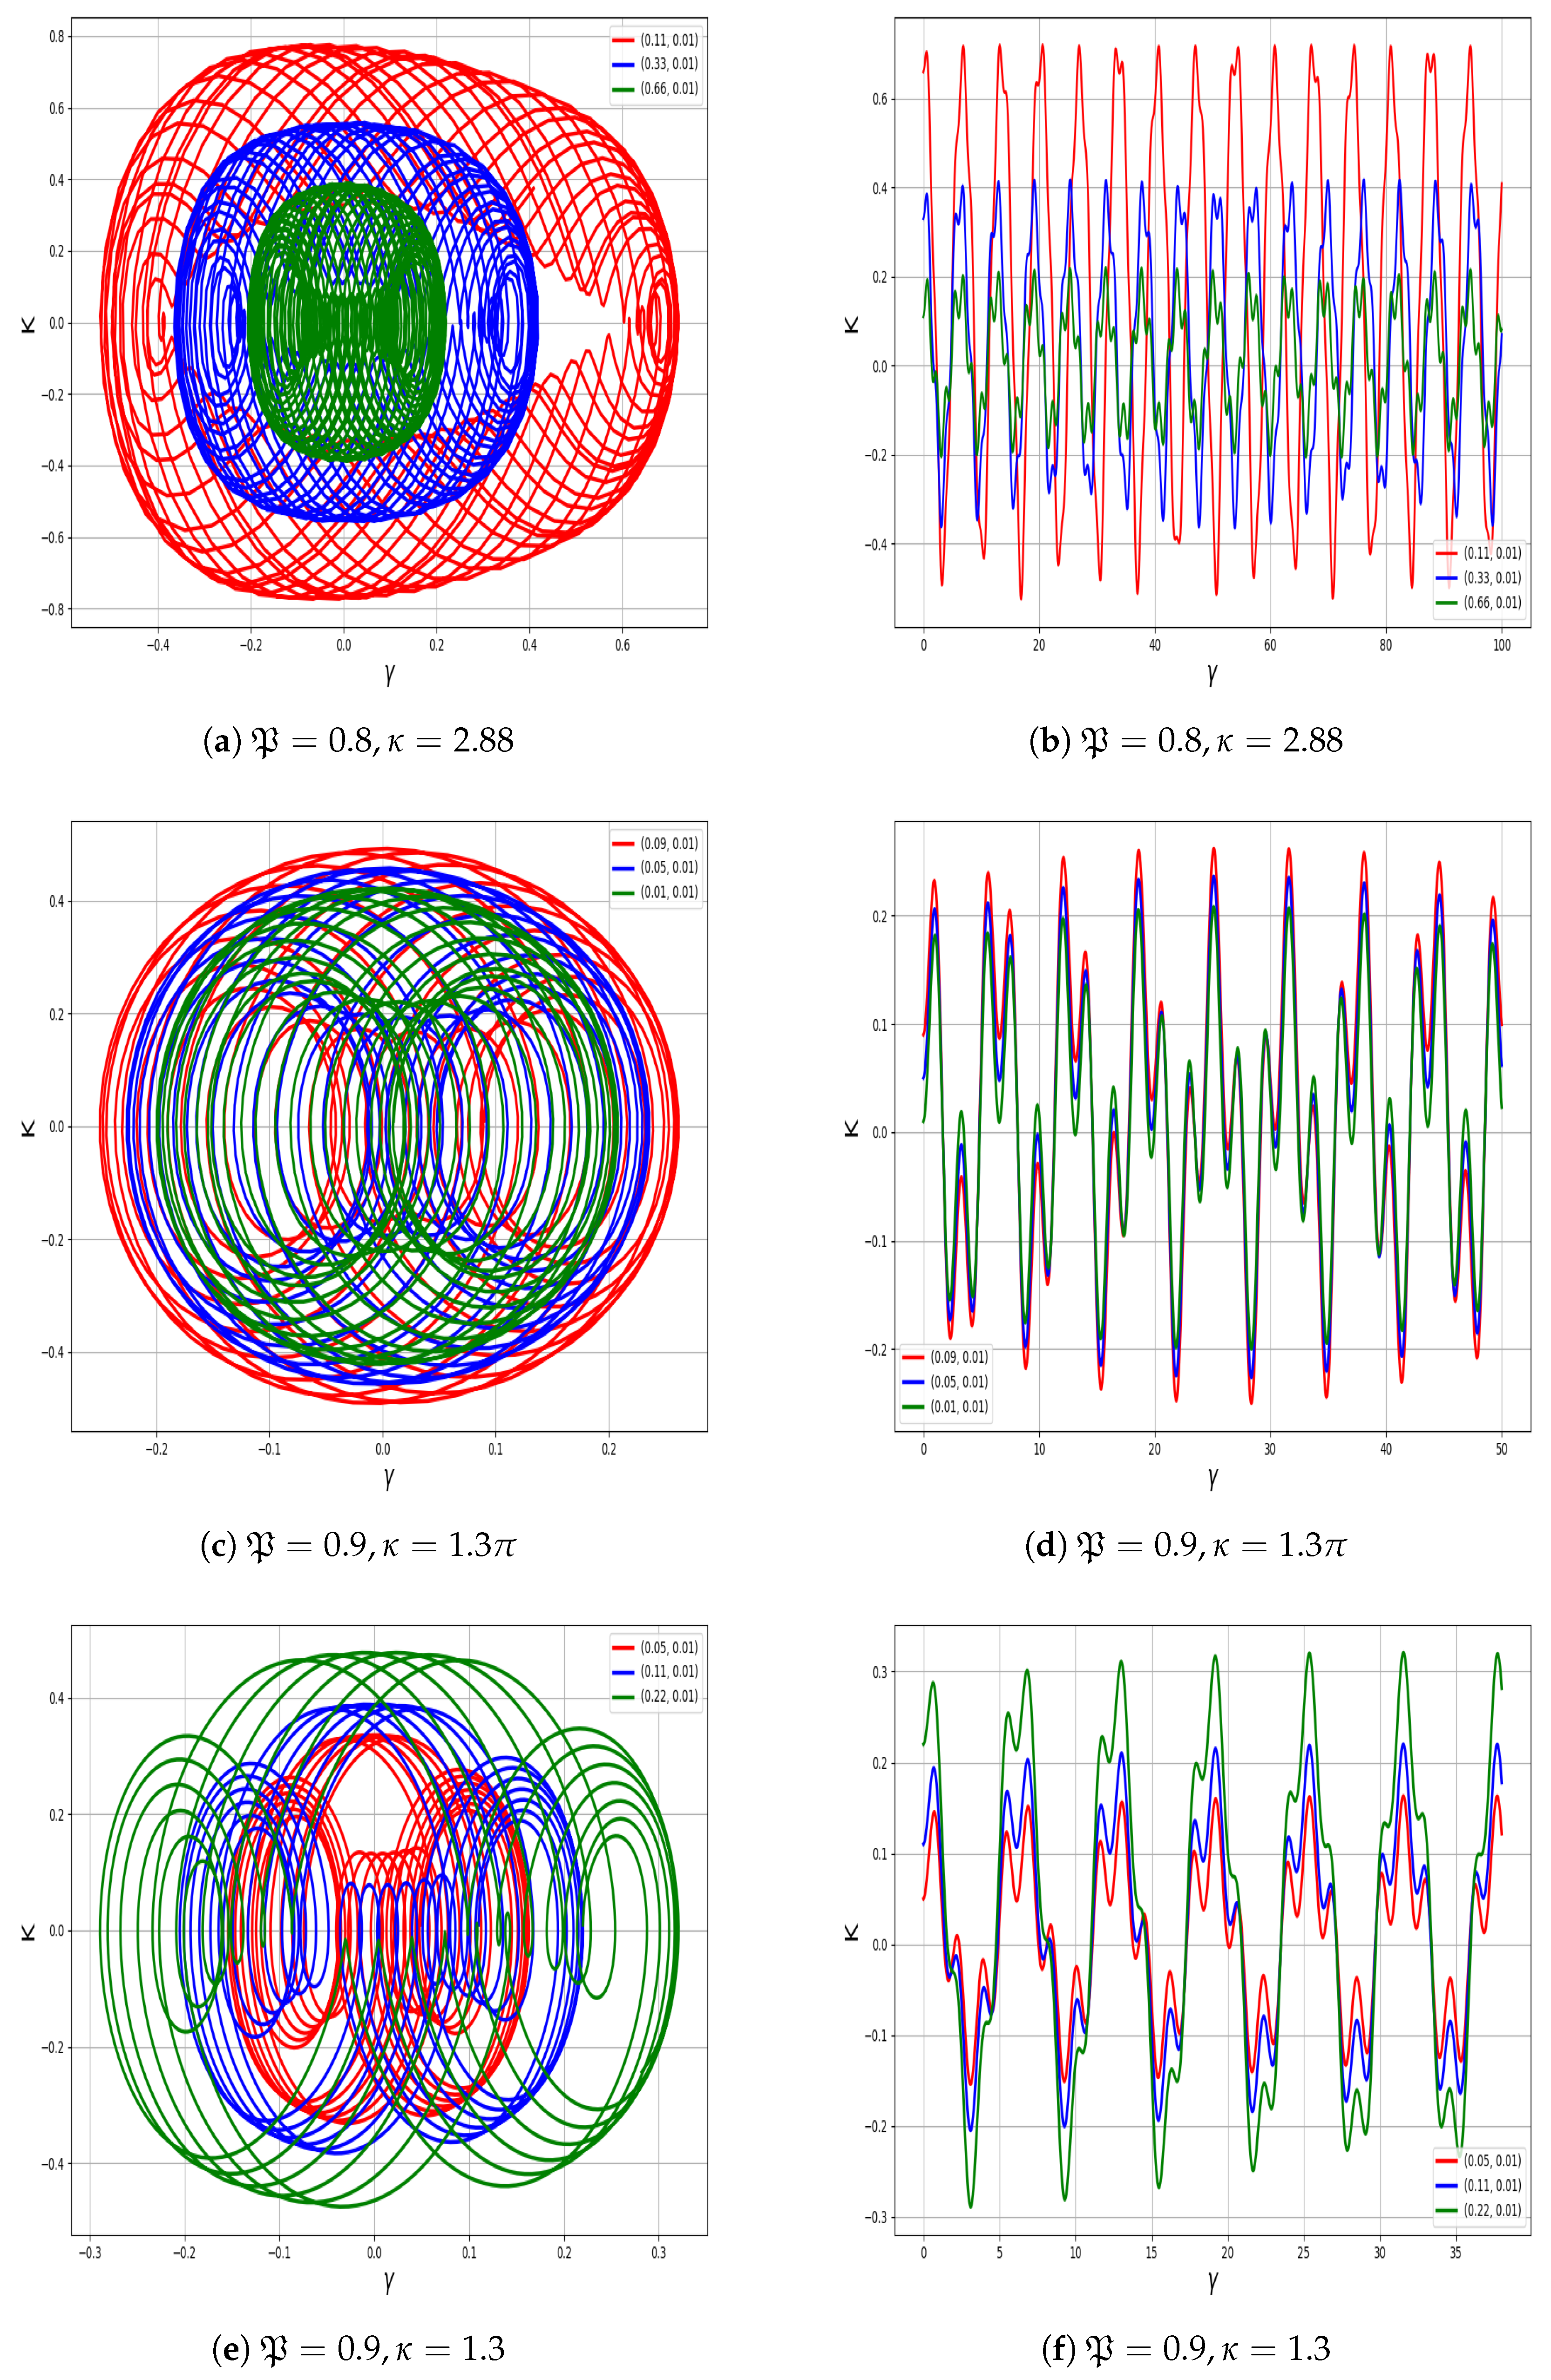
We analyze and visualize the trajectory by adjusting the interference patterns in Figure 5, Figure 6 and Figure 7, considering variations in frequency and intensity. By plotting 2D, 3D phase portraits, and Poincaré map alongside a time series, we observed the chaotic and quasi-periodic behaviors of the system (23). The Poincaré map is a technique that simplifies an m-th order continuous-time system into an ( m 1 ) -th order map by stroboscopically sampling the phase portrait, aiding in stability analysis and simplifying complex systems. In a Poincaré map, periodic behavior appears as a fixed point, while quasi-periodic behavior forms closed curves. Distinct groups of points represent chaos. A properly chosen ( m 1 ) dimensional Poincaré surface divides R m into two regions, capturing crossing points of the observed path.
  • In Figure 5a–d, the parameter values are set as P = 0.8 , ρ 1 = 0.87 , ρ 2 = 1.12 , ρ 3 = 0.98 , ρ 4 = 0.98 , and κ = 2.88 , with ( 0.08 , 0.01 ) demonstrating the influence of positive electrons. The system exhibits strongly chaotic behavior, characterized by densely intertwined and irregular trajectories that do not settle into any repeating pattern.
  • In Figure 6a–d, the system is analyzed using P = 0.9 , ρ 1 = 0.87 , ρ 2 = 1.12 , ρ 3 = 0.98 , ρ 4 = 0.98 , and κ = 1.3 π , with ( 0.33 , 0.01 ) indicating the role of positive electrons. The trajectories show partially organized loops with irregularities, indicating quasi-periodic or weakly chaotic dynamics with signs of sensitivity to initial conditions.
  • In Figure 7a–d, we set P , = 0.9 , ρ 1 = 0.87 , ρ 2 = 1.12 , ρ 3 = 0.98 , ρ 4 = 0.98 , and κ = 1.3 , with ( 0.11 , 0.01 ) reflecting the contribution of positive electrons The orbits form smooth, layered loops with structured repetition, reflecting quasi-periodic behavior without evident irregular transitions.

6. Techniques for Identifying Chaos

In this section, we use various tools to confirm the chaos of the considered model.

6.1. Lyapunov Exponents Technique

Lyapunov exponents are indeed a valuable metric for detecting chaos in dynamic systems. They quantify the system’s sensitivity to initial conditions by representing the average exponential growth or decay rate of minor disturbances along system trajectories. Positive Lyapunov exponents signify chaotic behavior as nearby trajectories diverge exponentially. Conversely, negative exponents denote stability, with adjacent trajectories converging. A zero exponent suggests marginal stability, where trajectories neither diverge nor converge. To compute the Lyapunov exponents, the dynamical system is formulated as [19]:
d γ d ζ = K = w 1 , d K d ζ = ρ 1 γ + ρ 2 γ 2 + ρ 3 γ 3 + ρ 4 γ 4 + P c o s ( κ ζ ) = w 2 ·
The Jacobian matrix is determined as follows:
B = w 1 γ w 1 K w 2 γ w 2 K
We derive the Jacobian matrix of the system as follows:
B = 0 1 ρ 1 + 2 ρ 2 γ + 3 ρ 3 γ 2 + 4 ρ 4 γ 3 0
Subsequently, λ I is subtracted from the matrix; here, I stands for the identity matrix and λ for the eigenvalue.
B λ I = λ 1 ρ 1 + 2 ρ 2 γ + 3 ρ 3 γ 2 + 4 ρ 4 γ 3 λ
After evaluating the determinant | B λ I | , we obtain:
λ 1 = + ρ 1 + 2 ρ 2 γ + 3 ρ 3 γ 2 + 4 ρ 4 γ 3 , λ 2 = ρ 1 + 2 ρ 2 γ + 3 ρ 3 γ 2 + 4 ρ 4 γ 3 ·
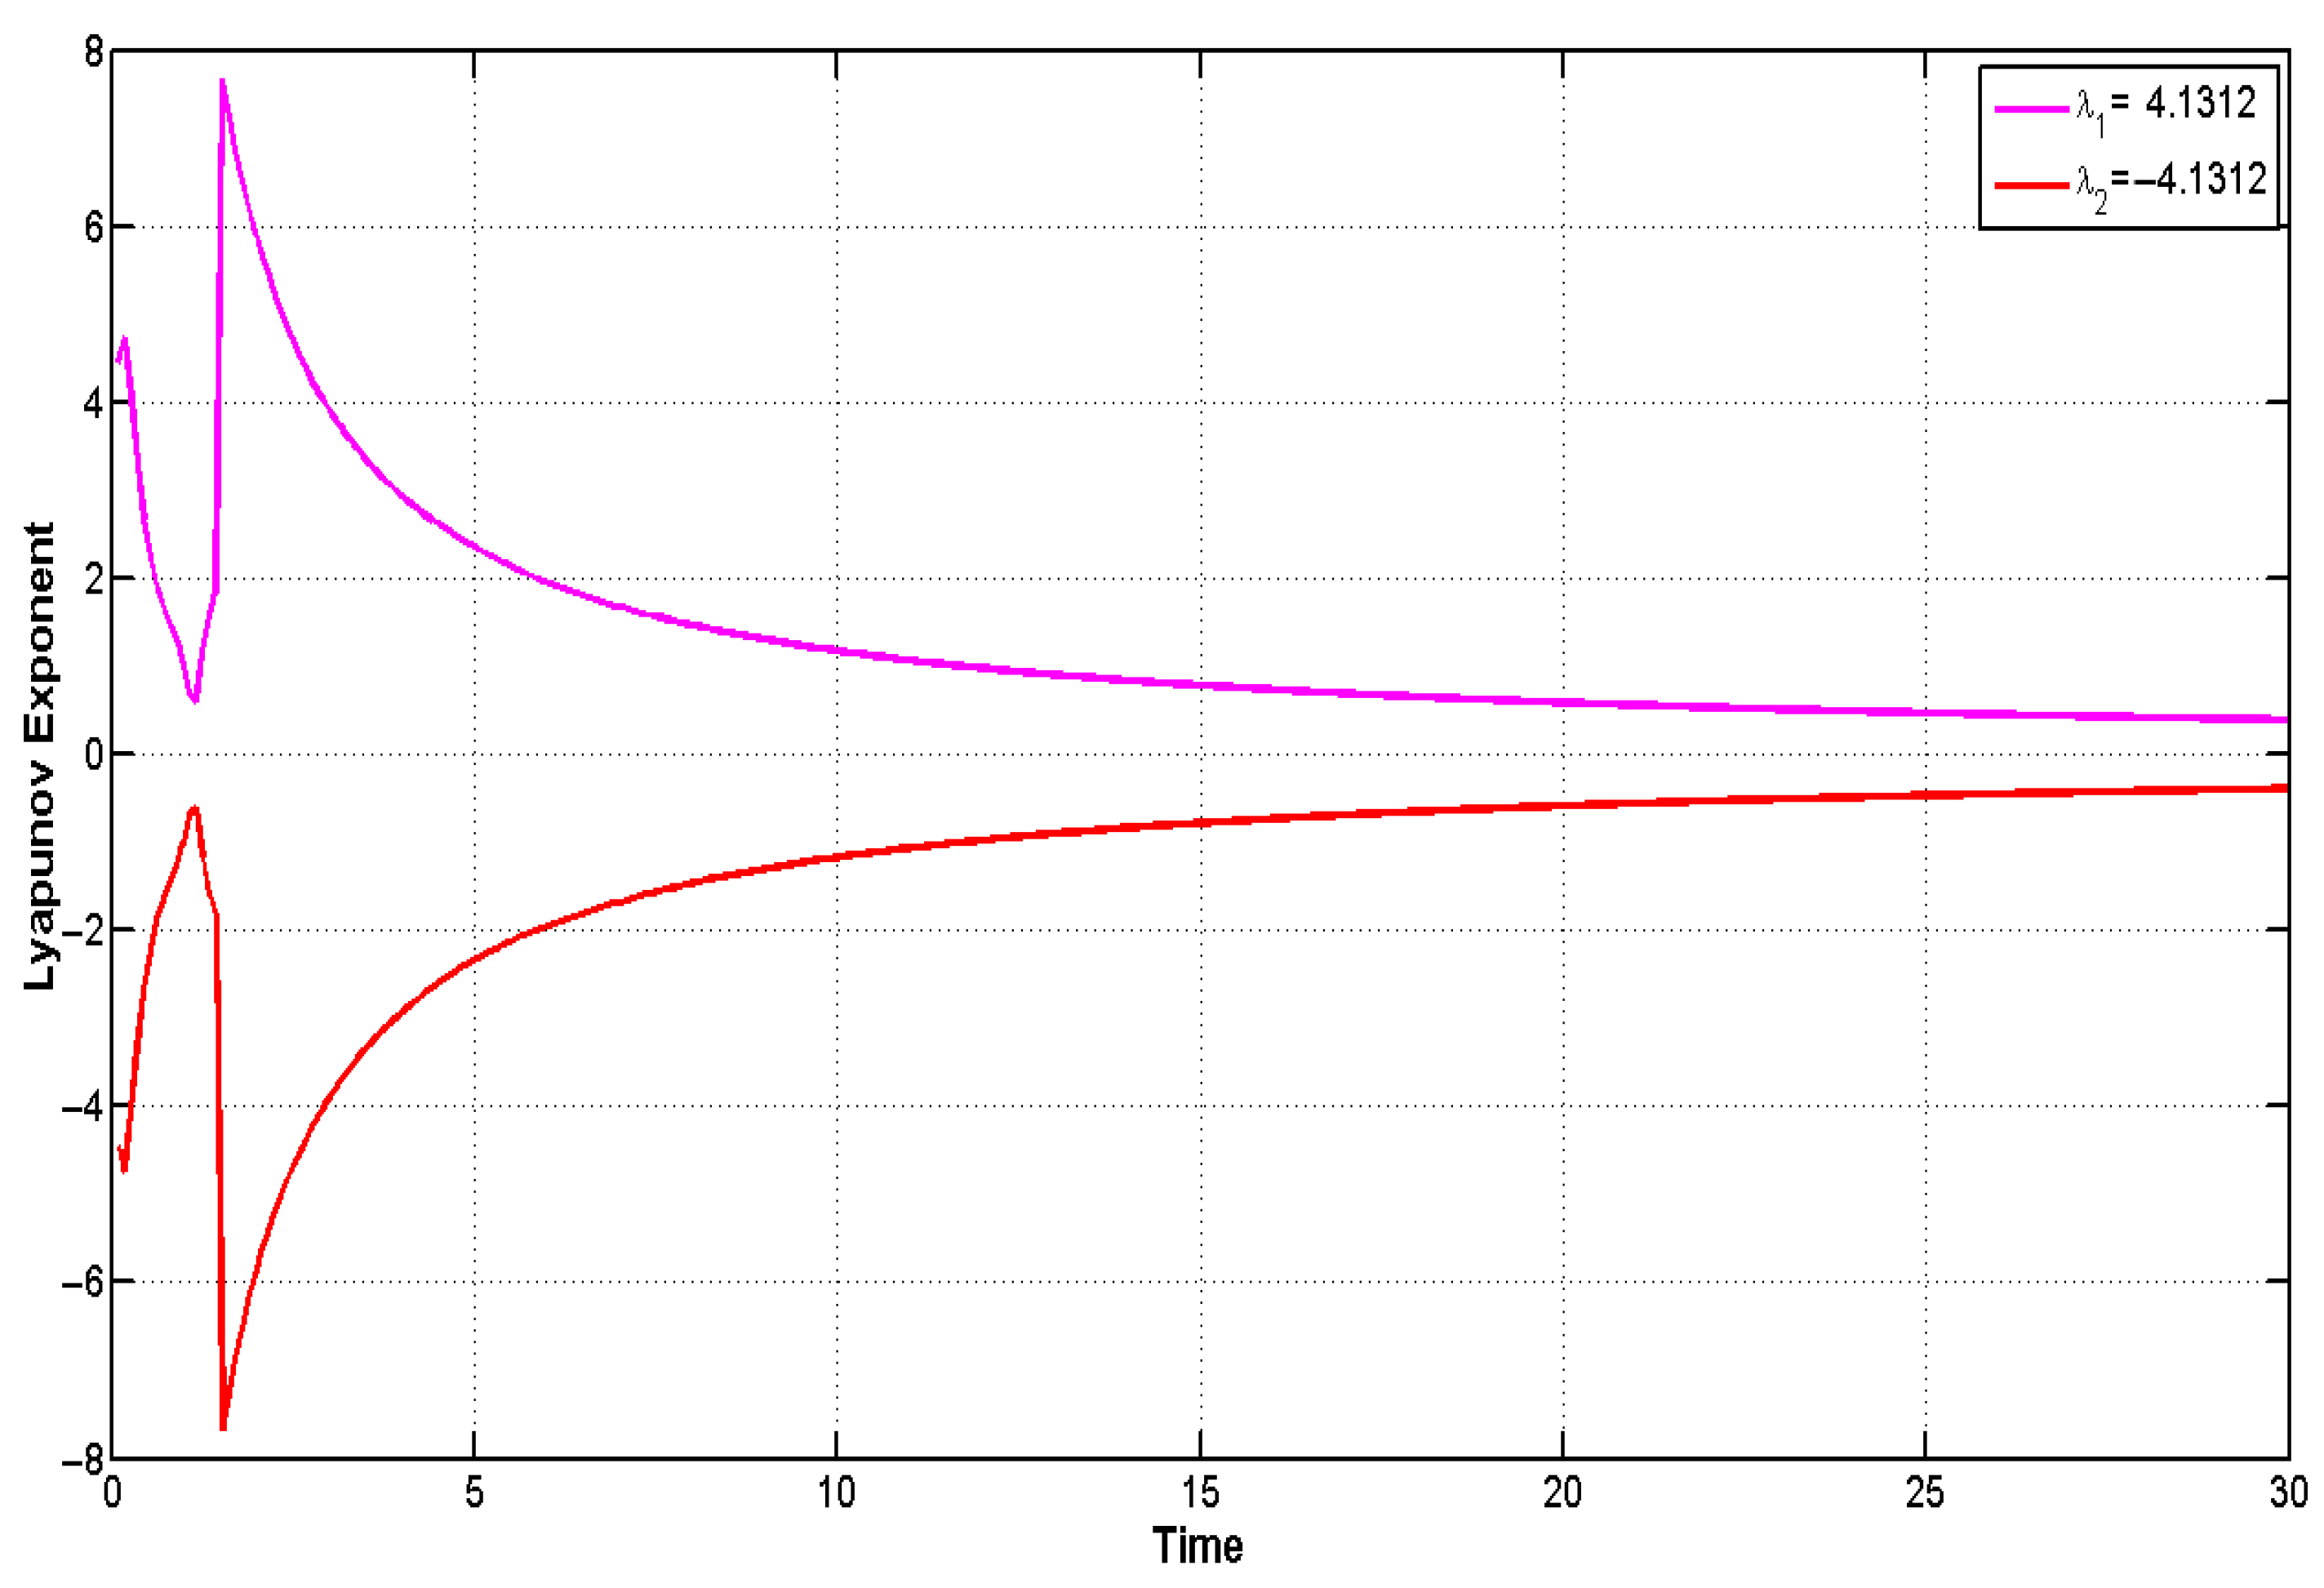
Examining the influence of positive electrons on the Lyapunov exponents for system (23) with parameters ρ 1 = 0.67 , ρ 2 = 1.12 , ρ 3 = 0.98 , ρ 4 = 0.98 , P = 0.01 , κ = 0.3 , and initial condition (0.05, 0.05), we obtain Lyapunov exponents λ 1 = 4.1312 and λ 2 = 4.1312 . The coexistence of one positive and one negative Lyapunov exponent further verifies the chaotic behavior of the dynamical system in this case as shown in Figure 8. In practical applications such as weather forecasting, Lyapunov exponents reflect system predictability. Large positive exponents signify quick divergence, limiting long-term forecasting accuracy, whereas smaller exponents indicate more stable, predictable dynamics beneficial for climate studies and reliable engineering designs [20].

6.2. Basin of Attraction Technique

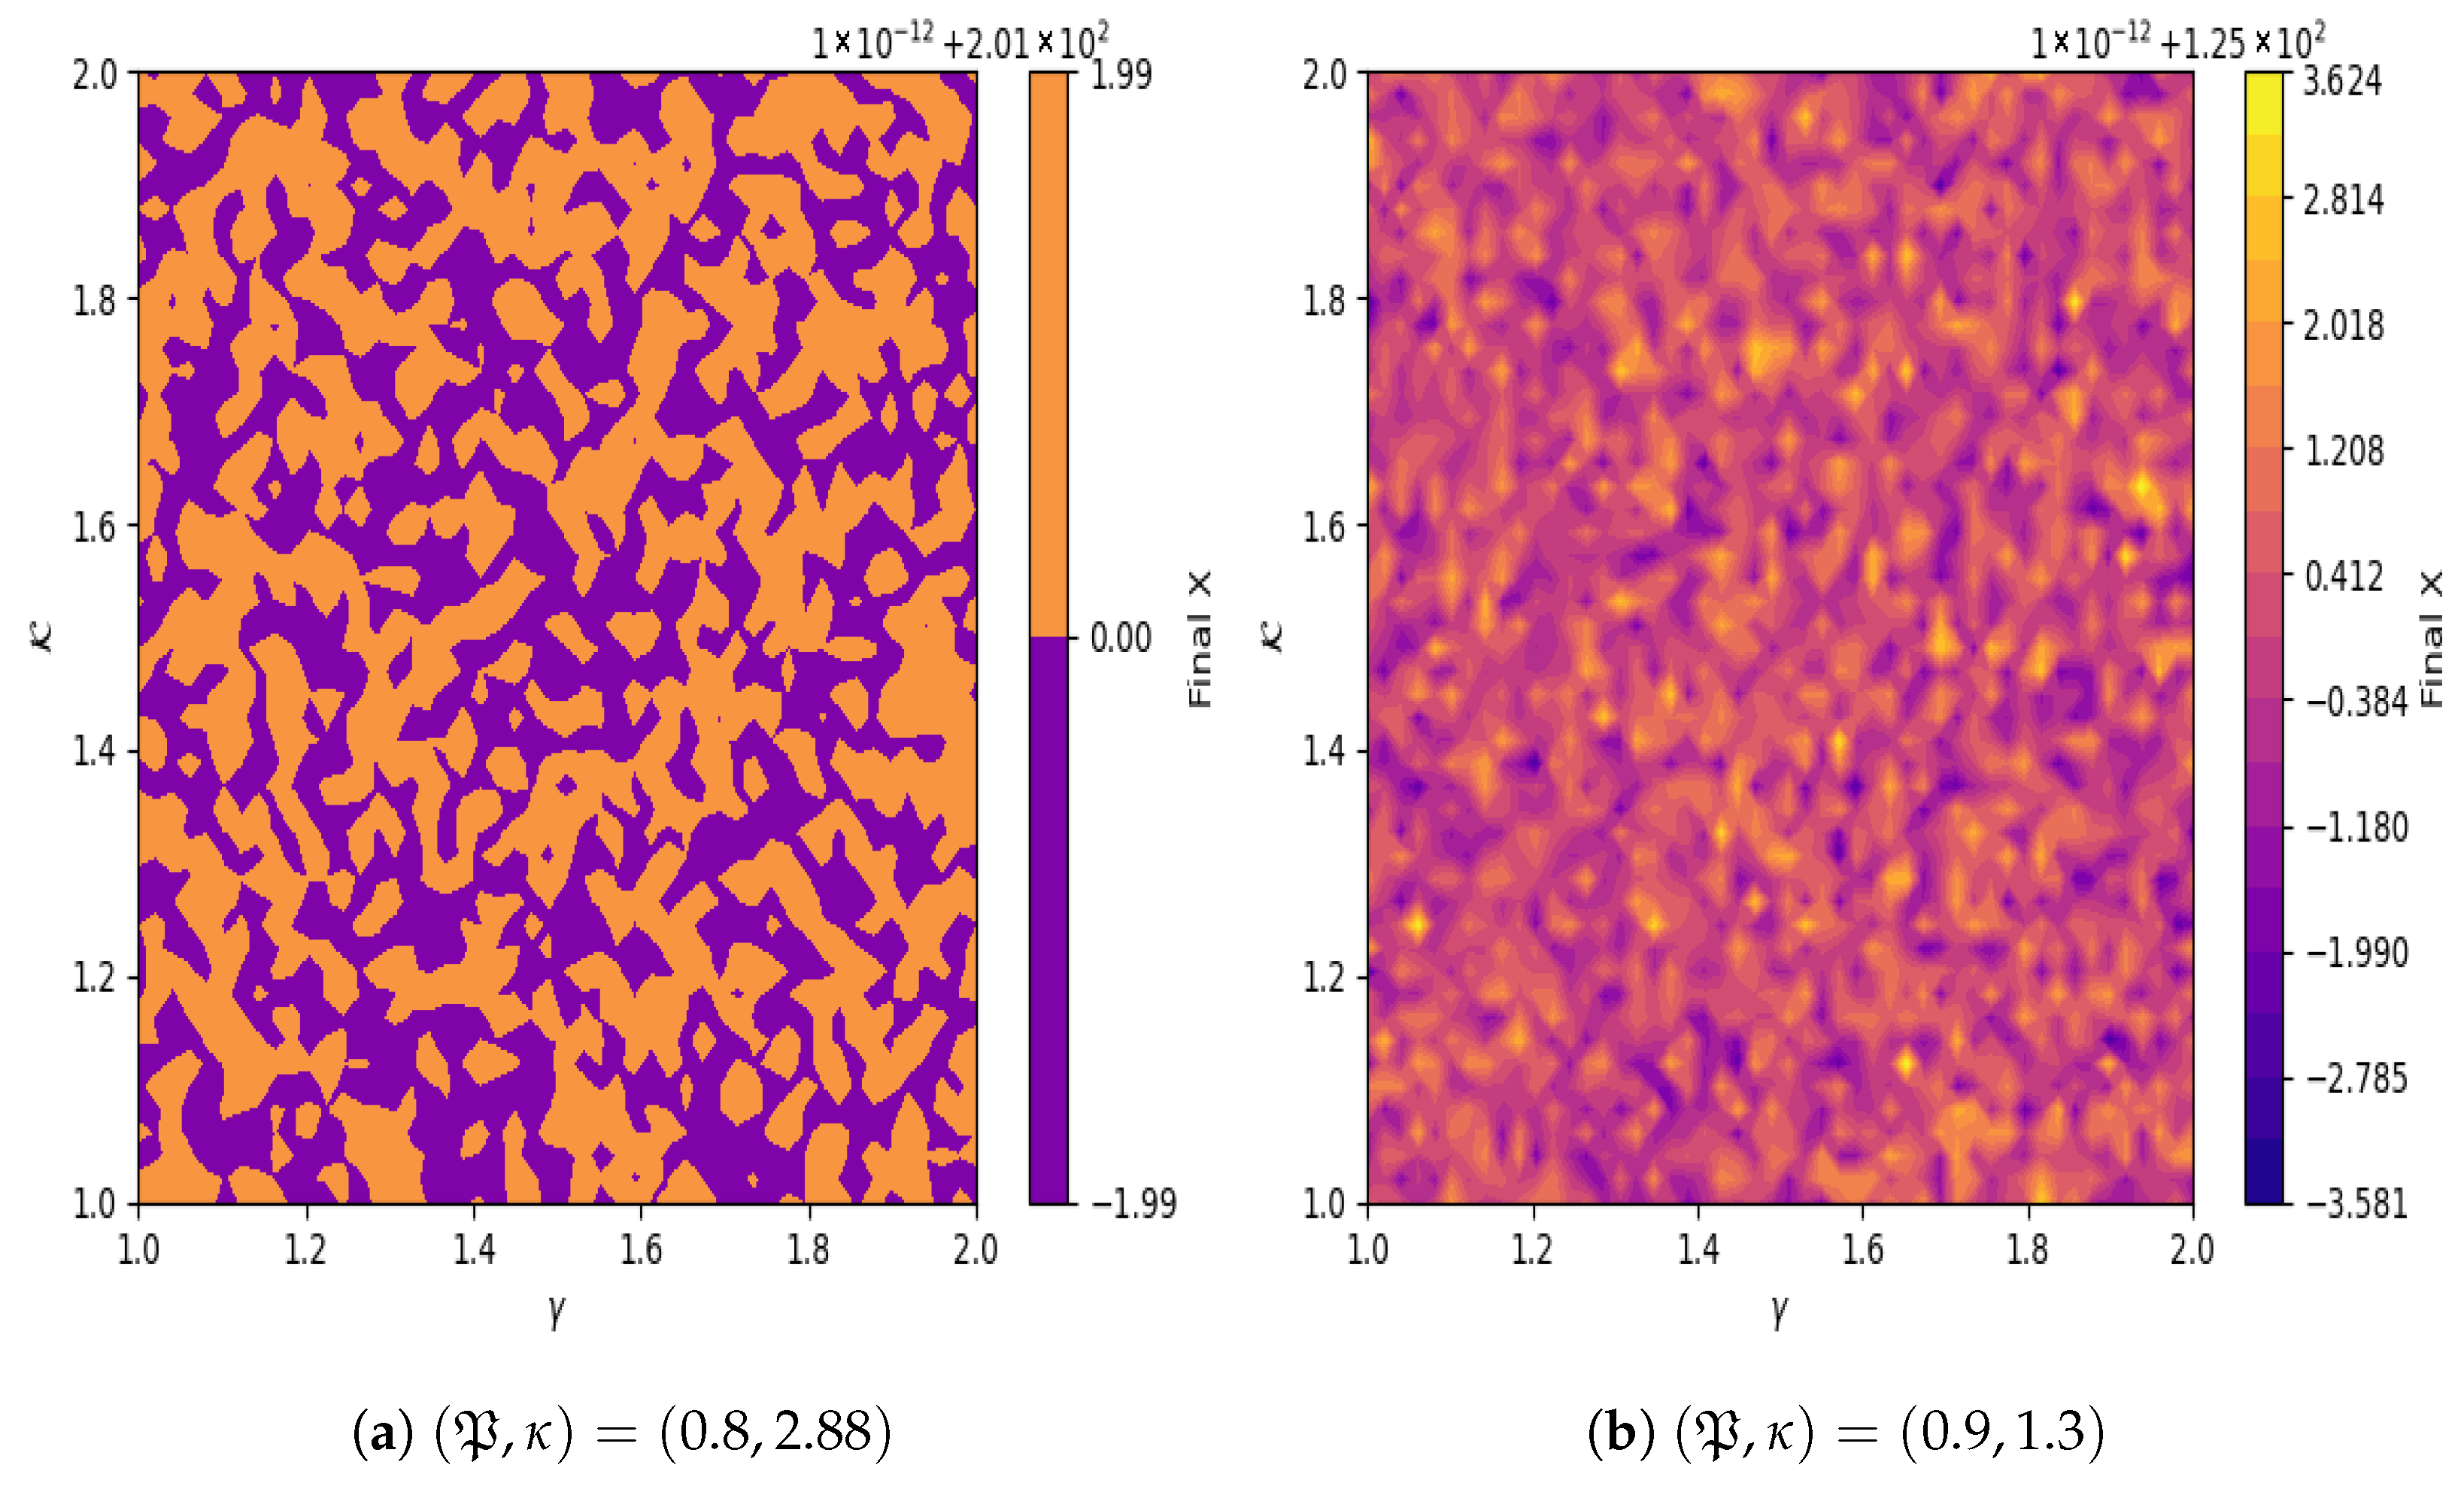
The Basin of attraction refers to the area within the state space that directs the system toward a particular attractor, determined by the initial conditions. In two-dimensional systems, distinct regions correspond to different attractors, and the system’s eventual behavior can be visualized using colors or shading on a plot [21]. In disciplines such as physics, biology, and engineering, understanding basin attractors is essential for analyzing the dynamics of complex or chaotic systems. Figure 9a shows dense vertical and horizontal bands, indicating highly sensitive and chaotic behavior with finely interlaced attractor regions. Figure 9b exhibits broader, more regular vertical structures, suggesting more stable, periodic dynamics and less sensitivity to parameter changes.

6.3. Chaotic Attractor Technique

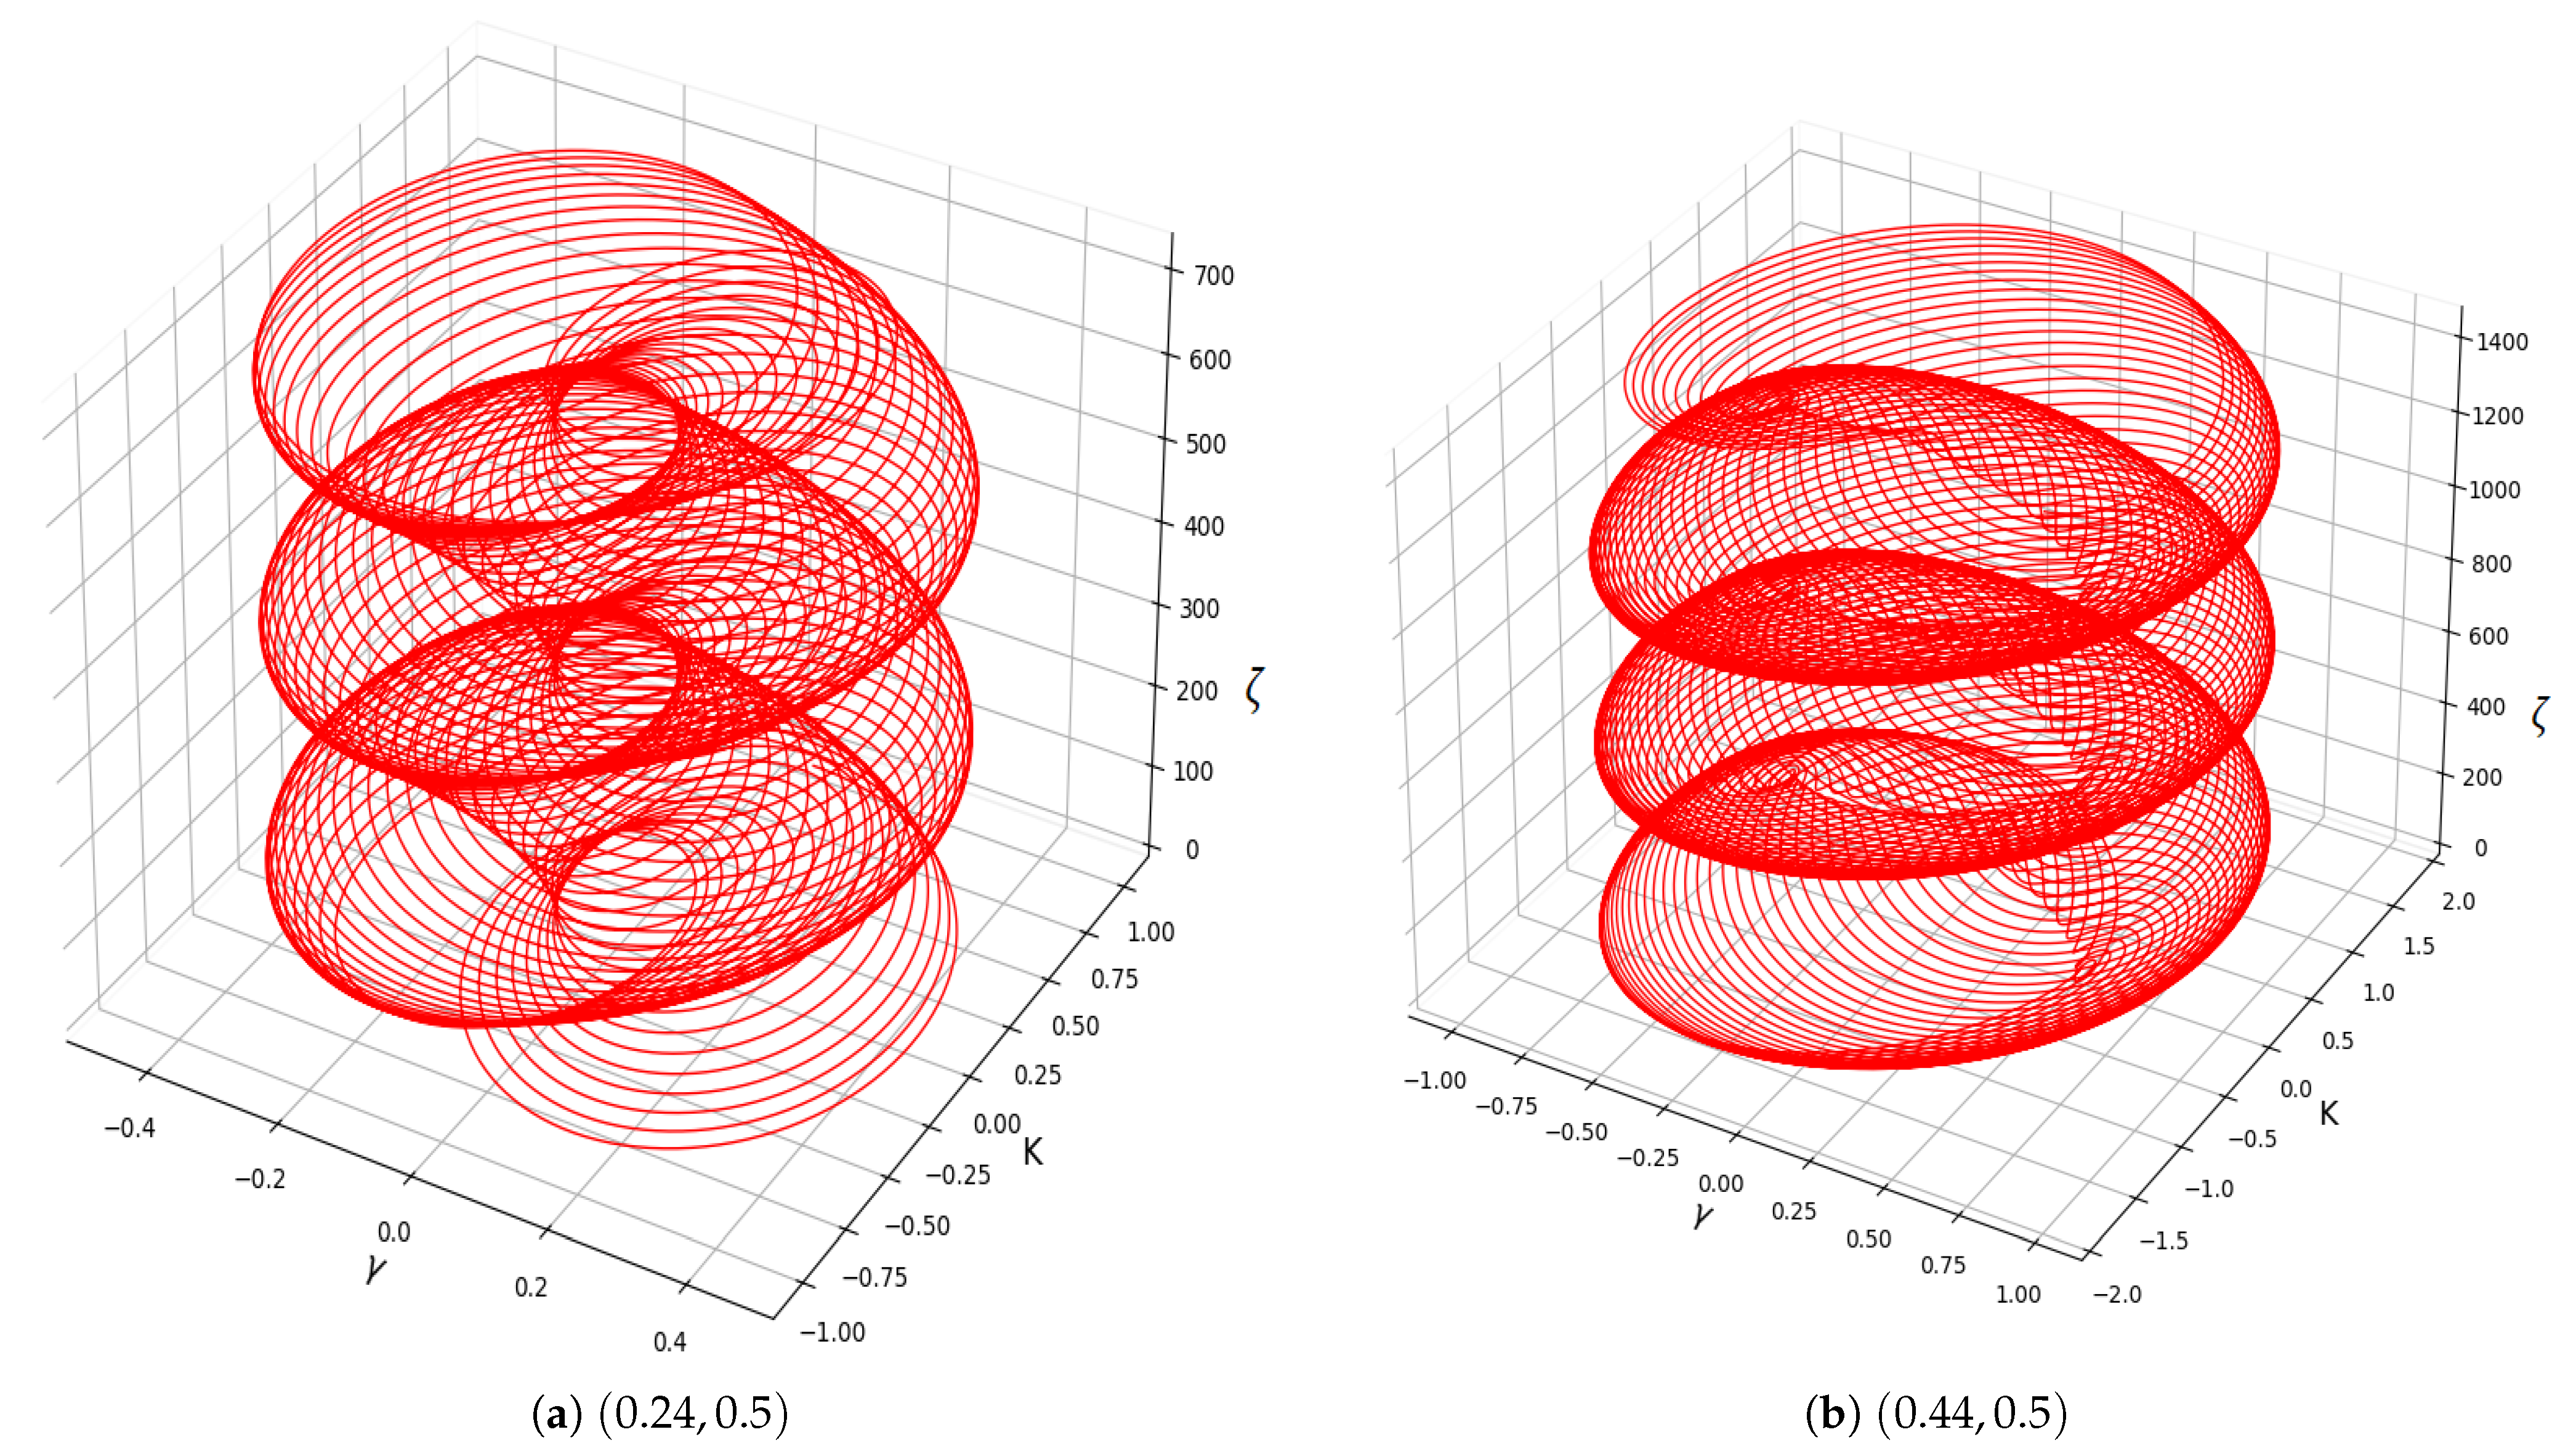
Chaotic attractors are pivotal in comprehending intricate systems in which minor alterations in initial conditions can yield significantly divergent outcomes. Chaotic attractors find extensive utility across many academic domains, including meteorology, where they elucidate the inherent sensitivity present in forecasting models, and within the engineering sector, aimed at guaranteeing secure communication through chaos-based encryption techniques [22]. Chaotic attractors find extensive utility across many academic domains, including meteorology, where they elucidate the inherent sensitivity present in forecasting models, and within the engineering sector, aimed at guaranteeing secure communication through chaos-based encryption techniques. In Figure 10a,b, we analyze the chaotic attractor behavior using the parameters ρ 1 = 0.87 , ρ 2 = 1.12 , ρ 3 = 0.98 , ρ 4 = 0.98 , P = 0.01 , and κ = 0.3 , and two different initial conditions.

6.4. Power Spectrum Technique

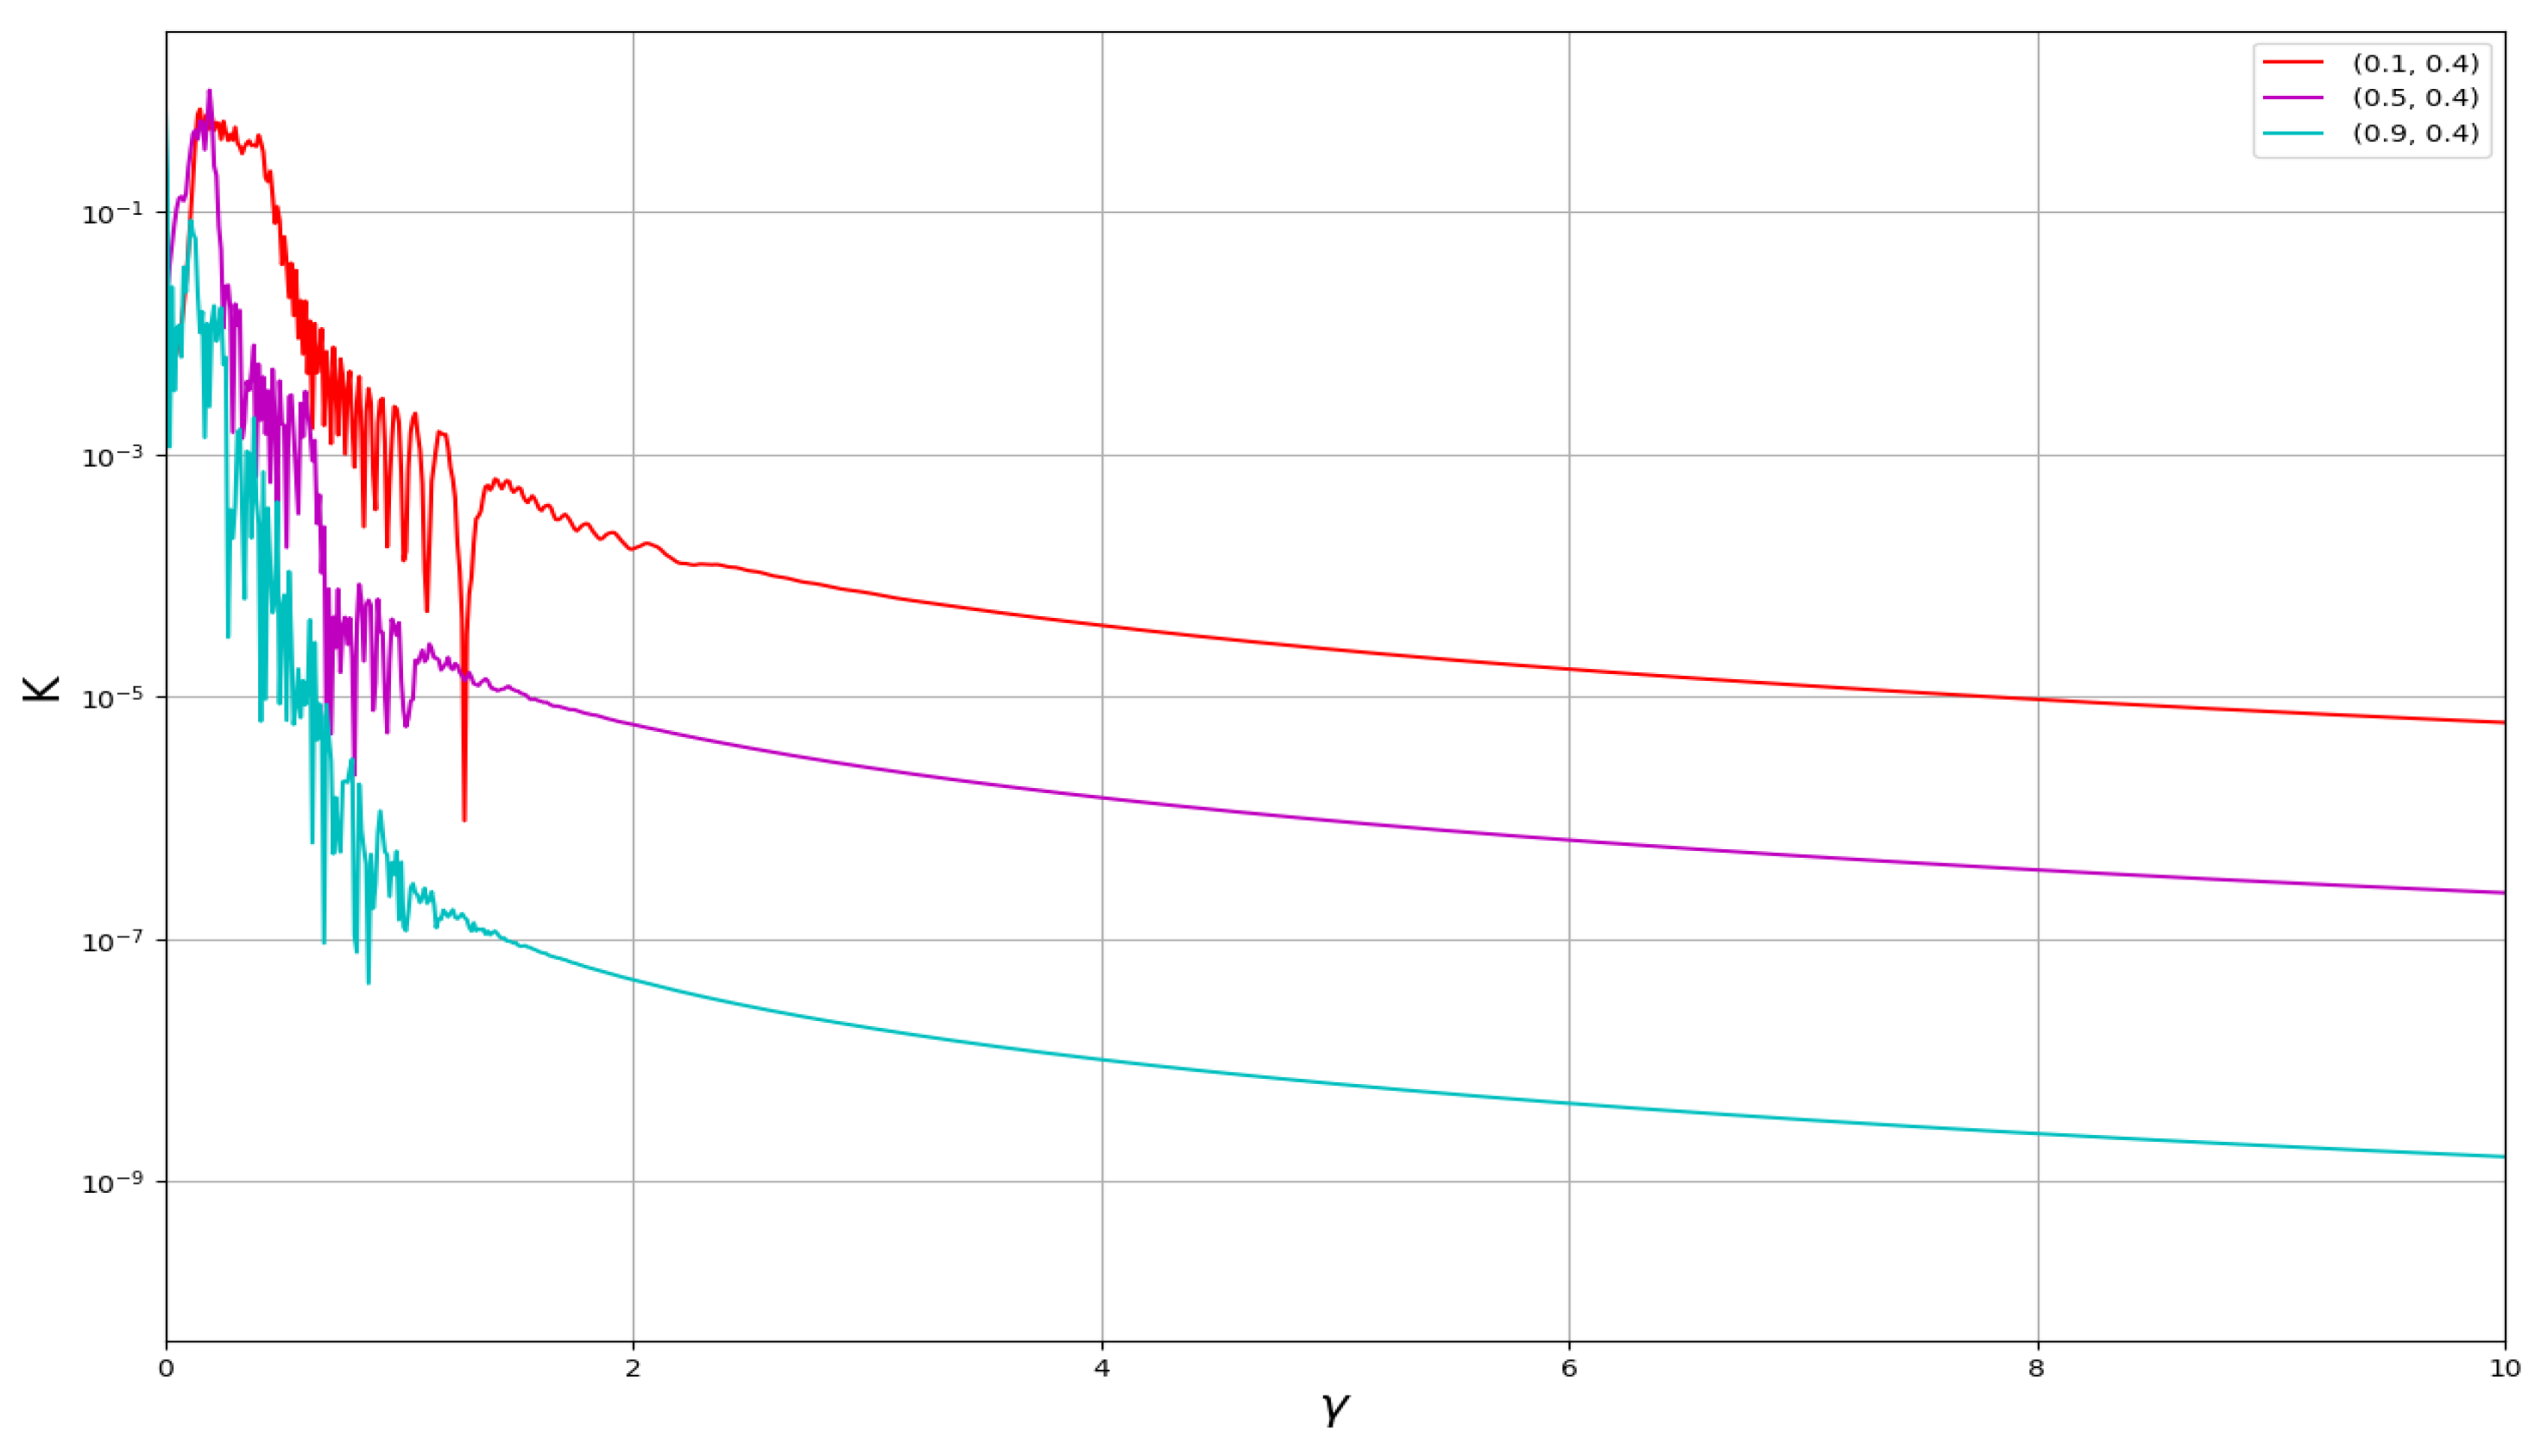
The Power spectrum represents a fundamental analytical instrument for the scrutiny of the frequency components of a signal, illuminating the patterns and periodic behaviors intrinsic within complex datasets. In practical applications, the Power spectrum fulfills critical roles such as filtering, spectral analysis, and noise alleviation [23]. In Figure 11, we analyze the Power spectrum behavior using the parameters ρ 1 = 0.87 , ρ 2 = 1.12 , ρ 3 = 0.98 , ρ 4 = 0.98 , P = 0.01 , and κ = 0.3 , and three different initial conditions. All curves start from the same initial state, but their behavior changes at point value one; after this point, around 1.8, the curves exhibit symmetric behavior.

6.5. Bifurcation Diagram Technique

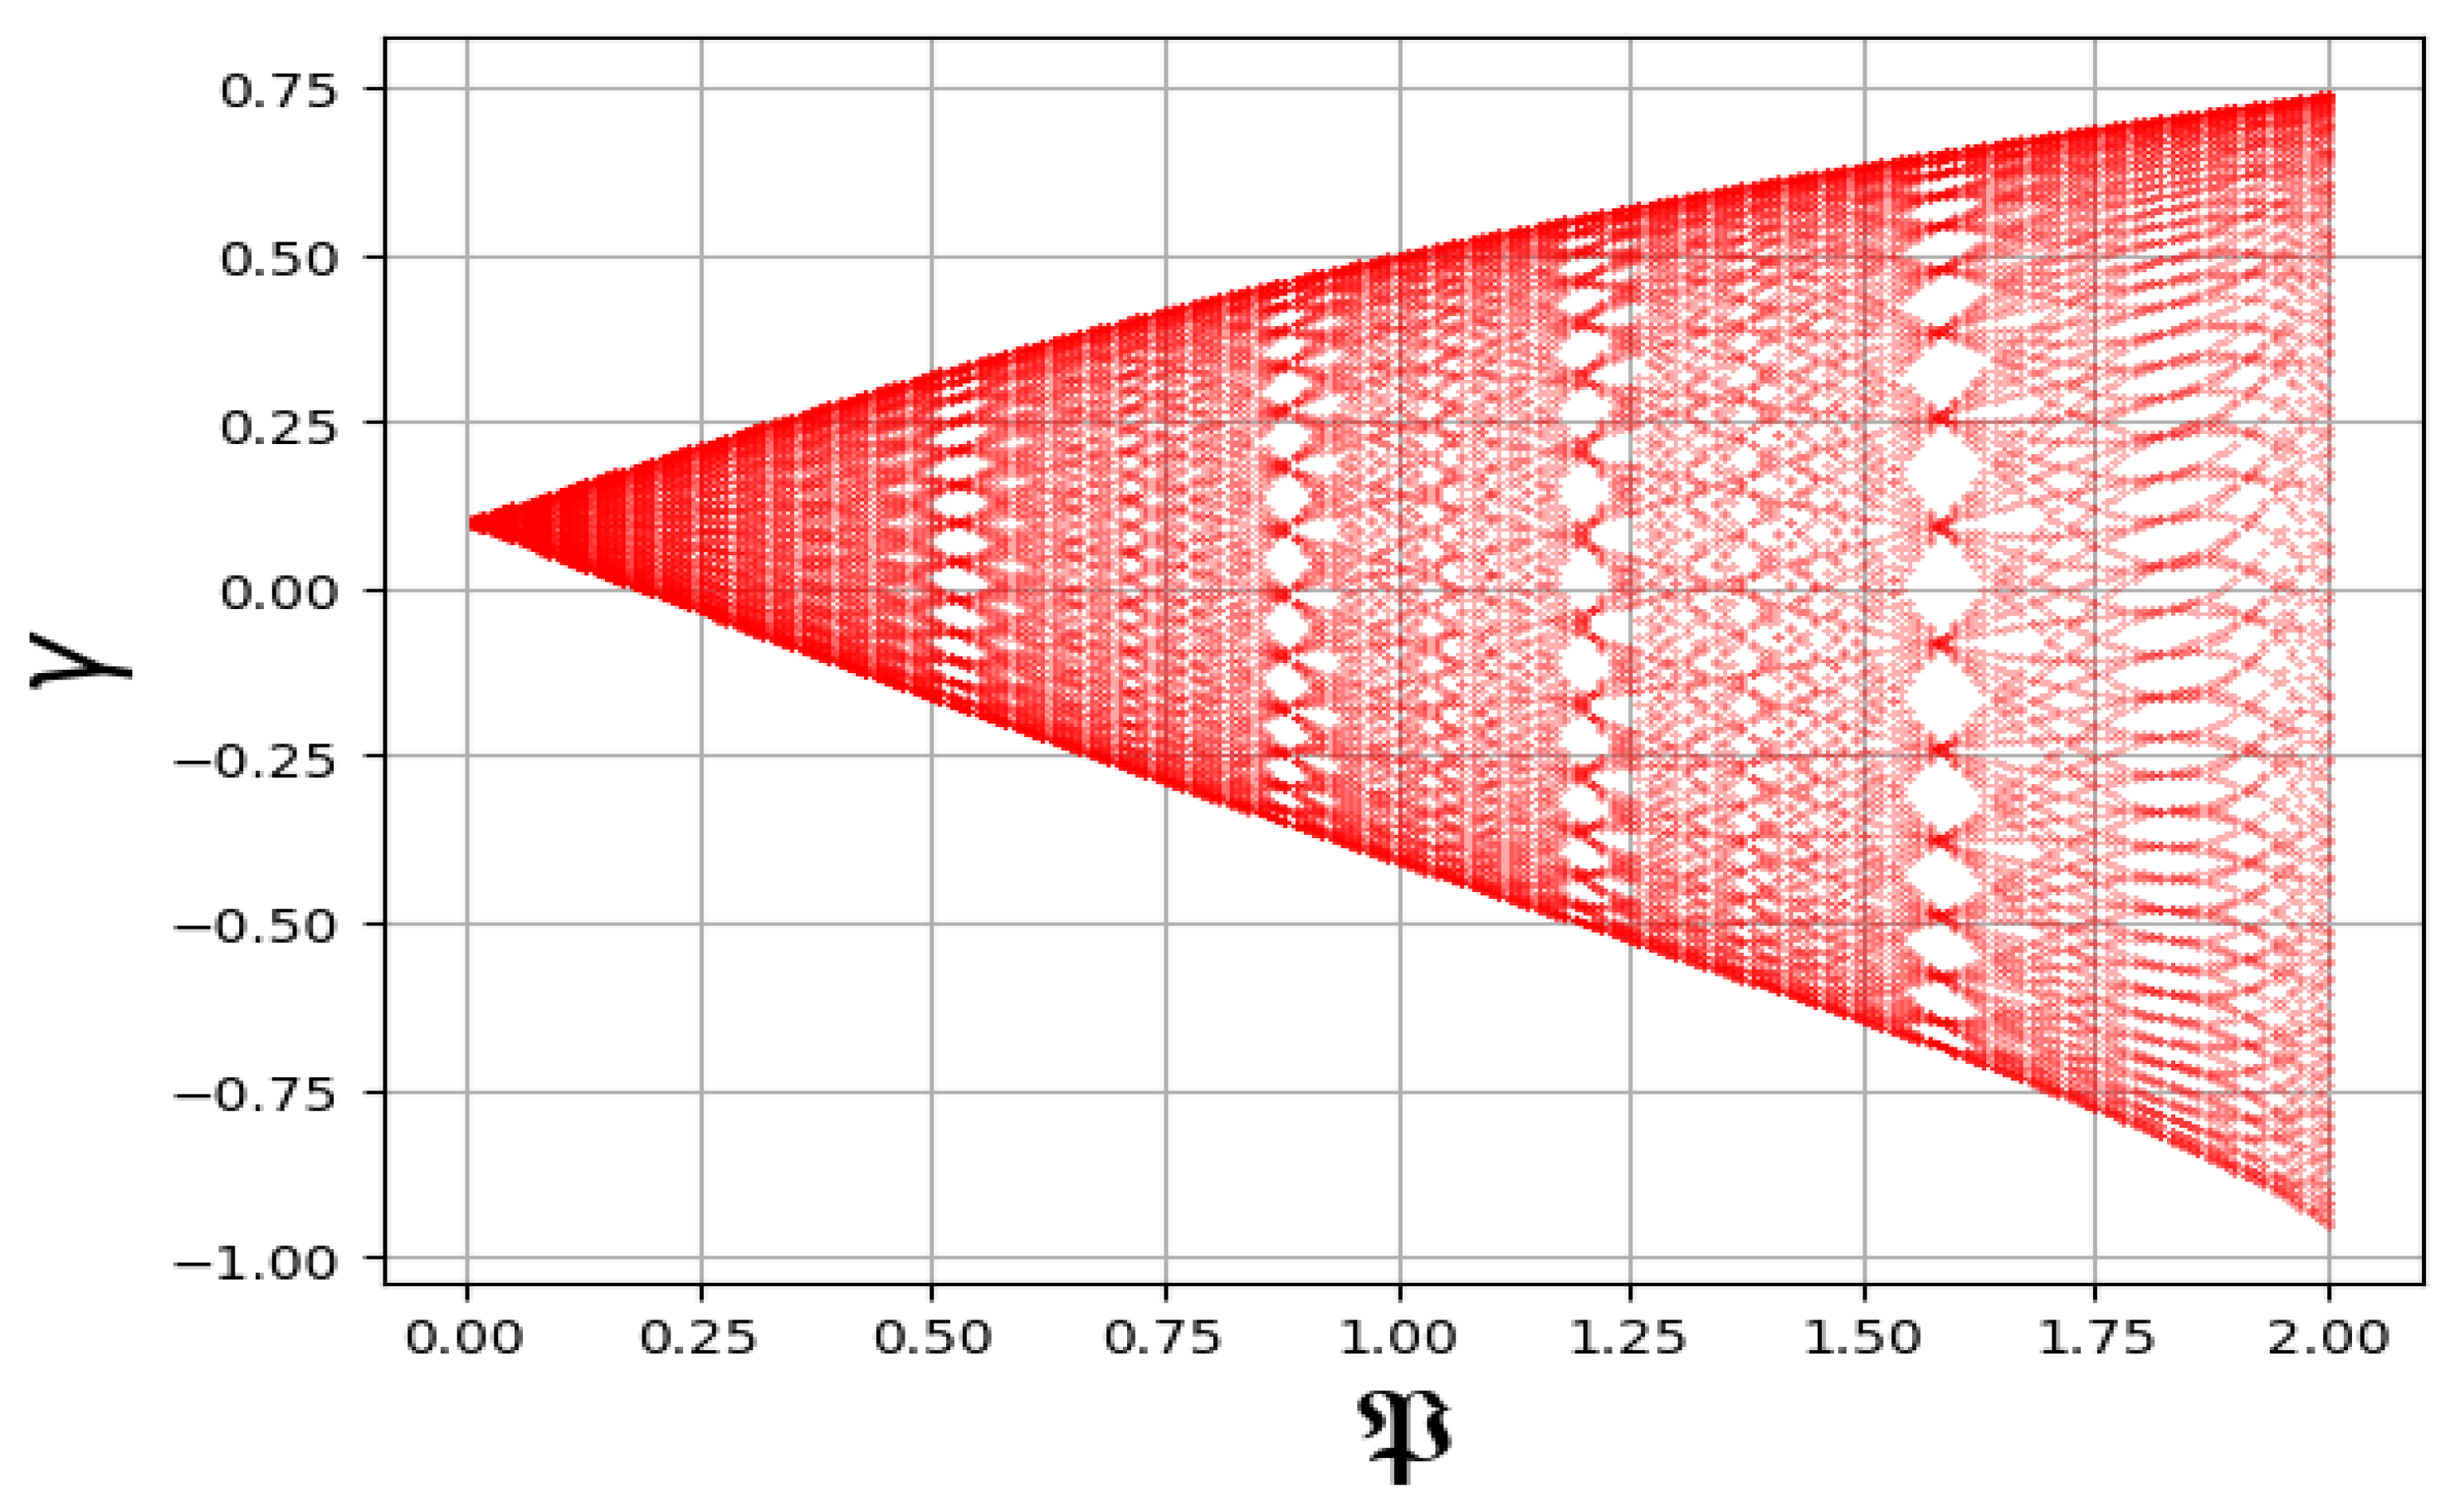
A Bifurcation diagram serves as an instrumental framework for examining dynamic systems and elucidating chaotic phenomena. It provides a visual representation of the modifications in a system’s behavior as a parameter undergoes variation, emphasizing the transition from ordered to chaotic dynamics. The diagram delineates the potential states of the system along the γ -axis while situating the parameter values on the P -axis. Chaotic behavior is frequently characterized by intricate patterns, which may manifest as multiple branches or periodic windows. For the model described in Equation (12), the irregular patterns observed in Figure 12, under the parameter values ρ 1 = 0.87 , ρ 2 = 1.12 , ρ 3 = 0.98 , ρ 4 = 0.98 , and κ = 0.3 , indicate the presence of chaotic behavior.

6.6. Fractal Dimension Technique

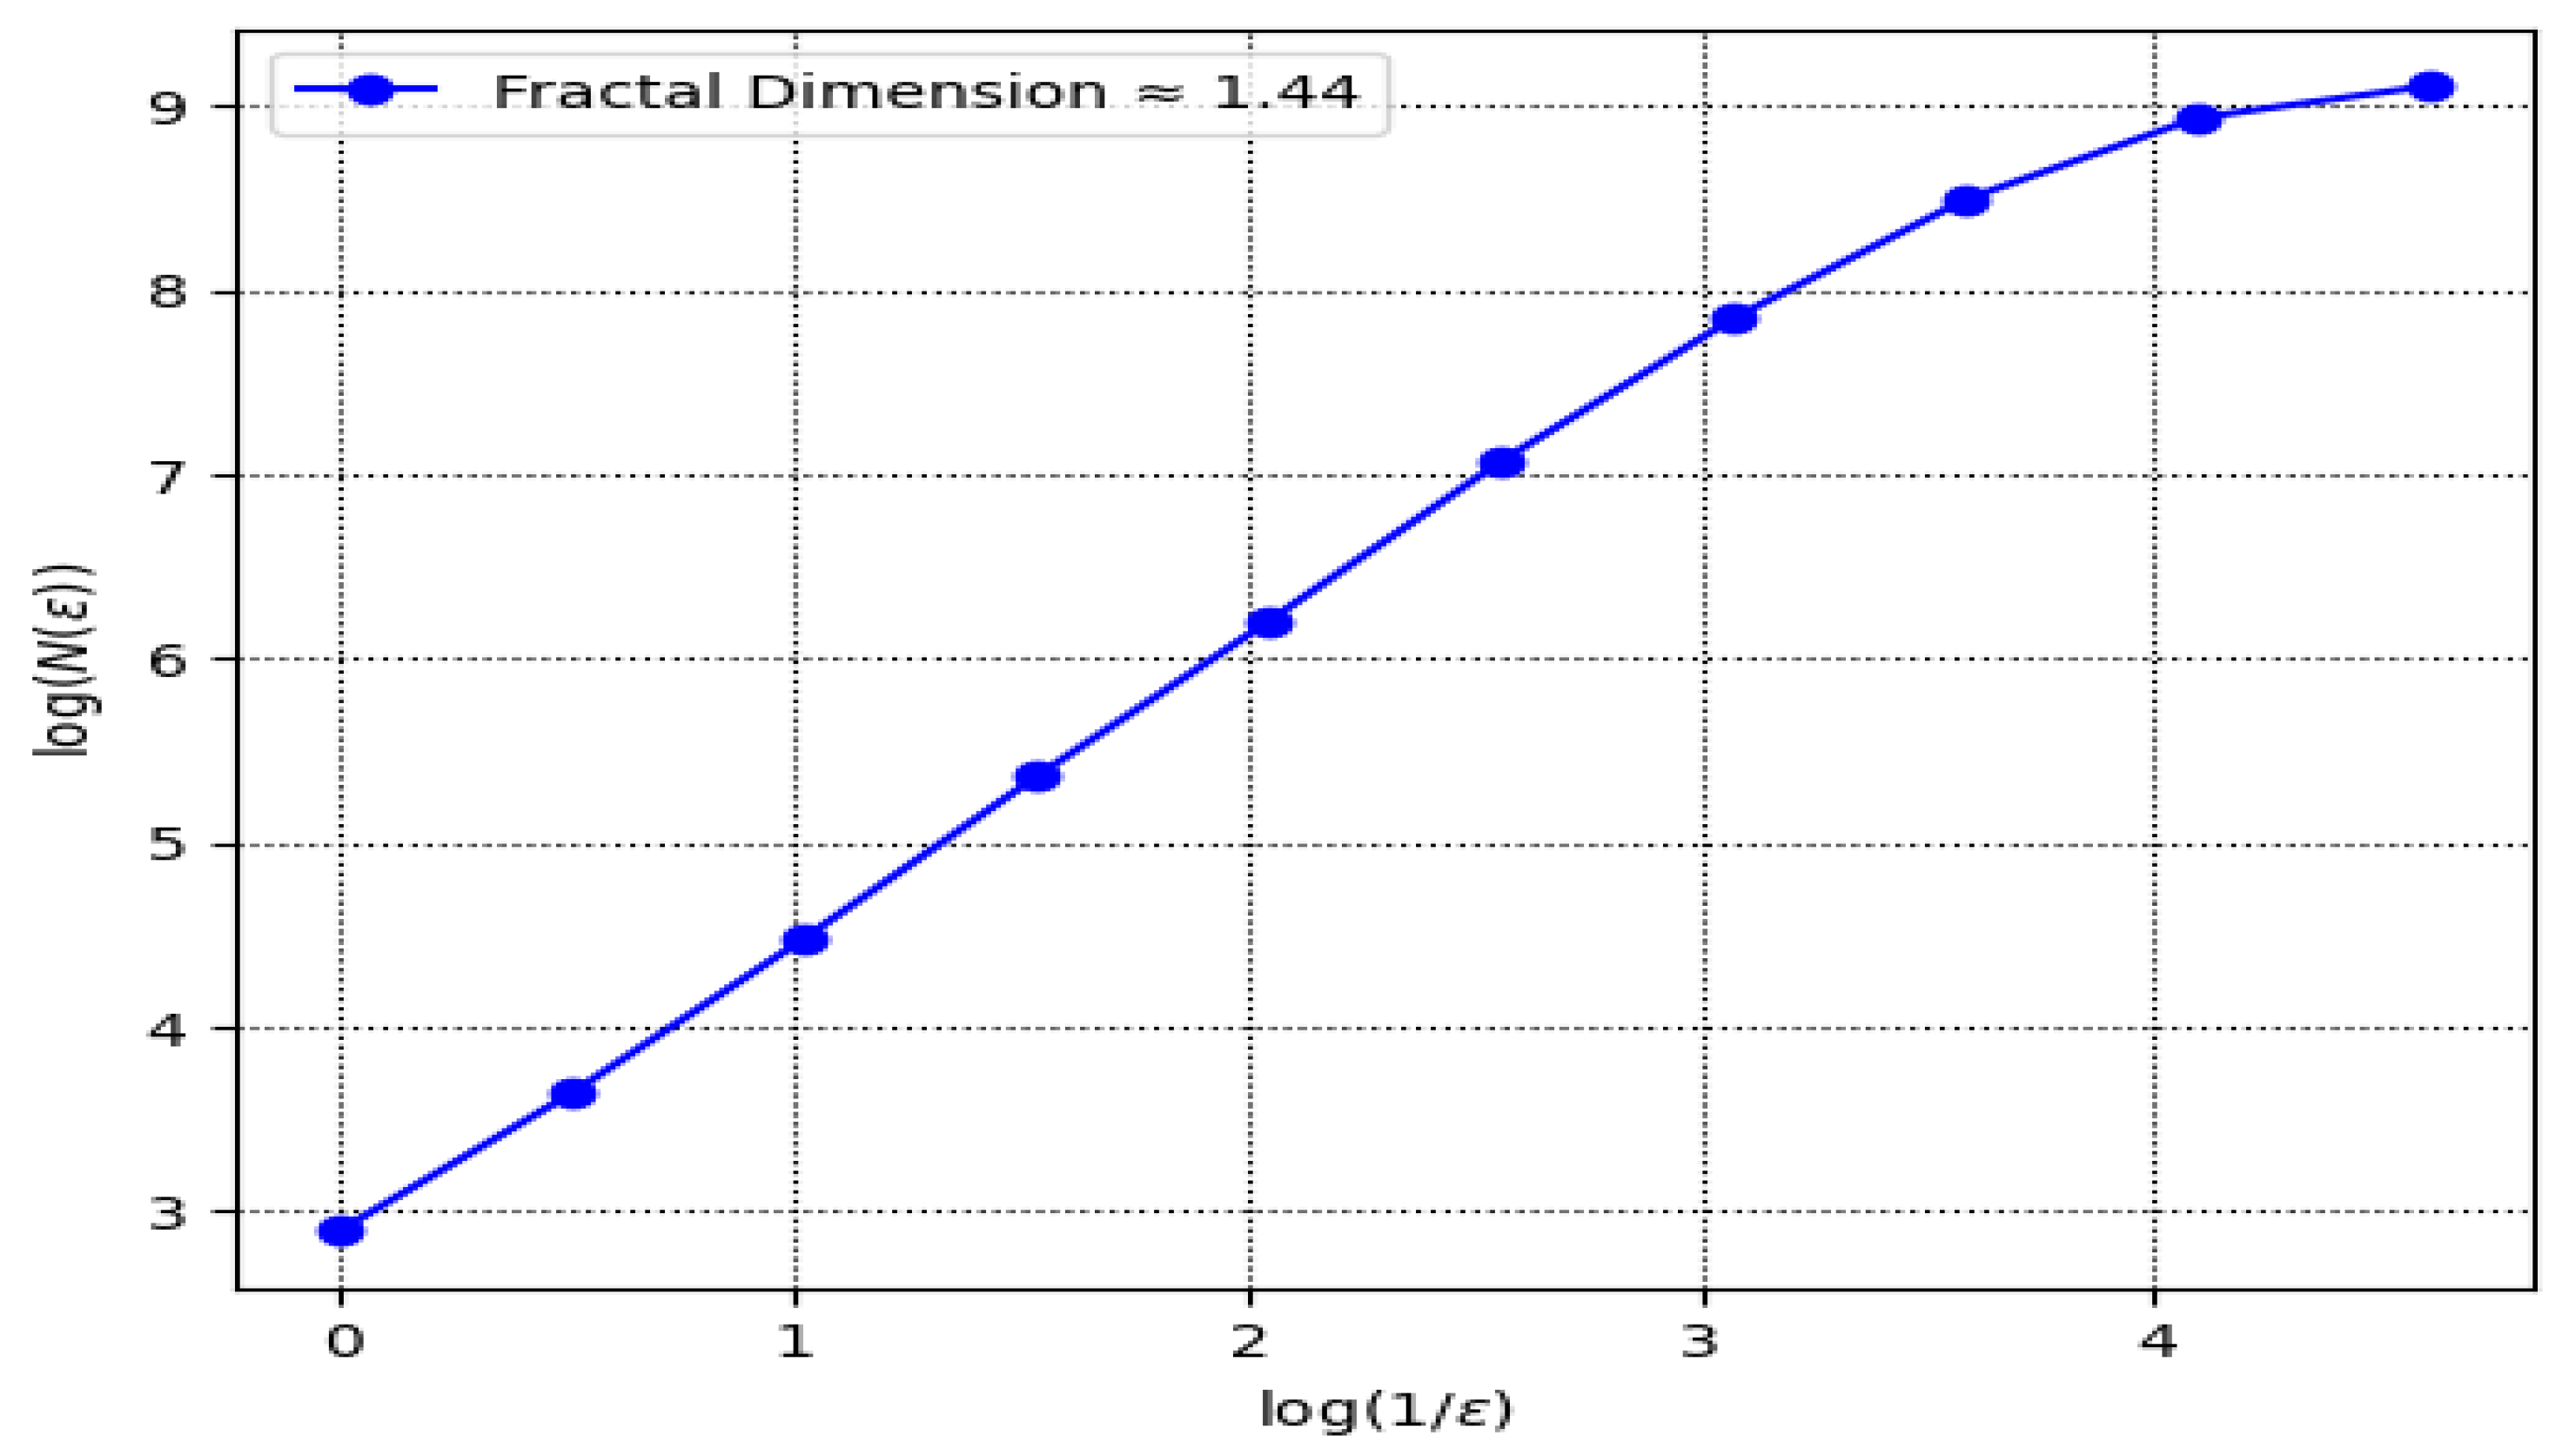
The Fractal Dimension quantifies the complexity of a geometric object by describing how the detail in the pattern changes with the scale at which it is measured. It is widely used to characterize Chaotic attractors in dynamical systems, analyze natural phenomena like coastlines or clouds, and study irregular patterns in physics, biology, and finance. This subsection presents the Fractal Dimension analysis of the chaotic system governed by ρ 1 = 0.87 , ρ 2 = 1.12 , ρ 3 = 0.98 , ρ 4 = 0.98 , P = 0.9 , κ = 1.3 , and ( 0.11 , 0.01 ) . The plot of log ( N ( ε ) ) versus log ( 1 ε ) illustrates the scaling behavior of the trajectory, where N ( ε ) represents the number of boxes needed to cover the attractor at resolution ε . The estimated Fractal Dimension is approximately 1.44, confirming the presence of chaotic dynamics and indicating a complex attractor structure, as shown in Figure 13.

6.7. Return Map Technique

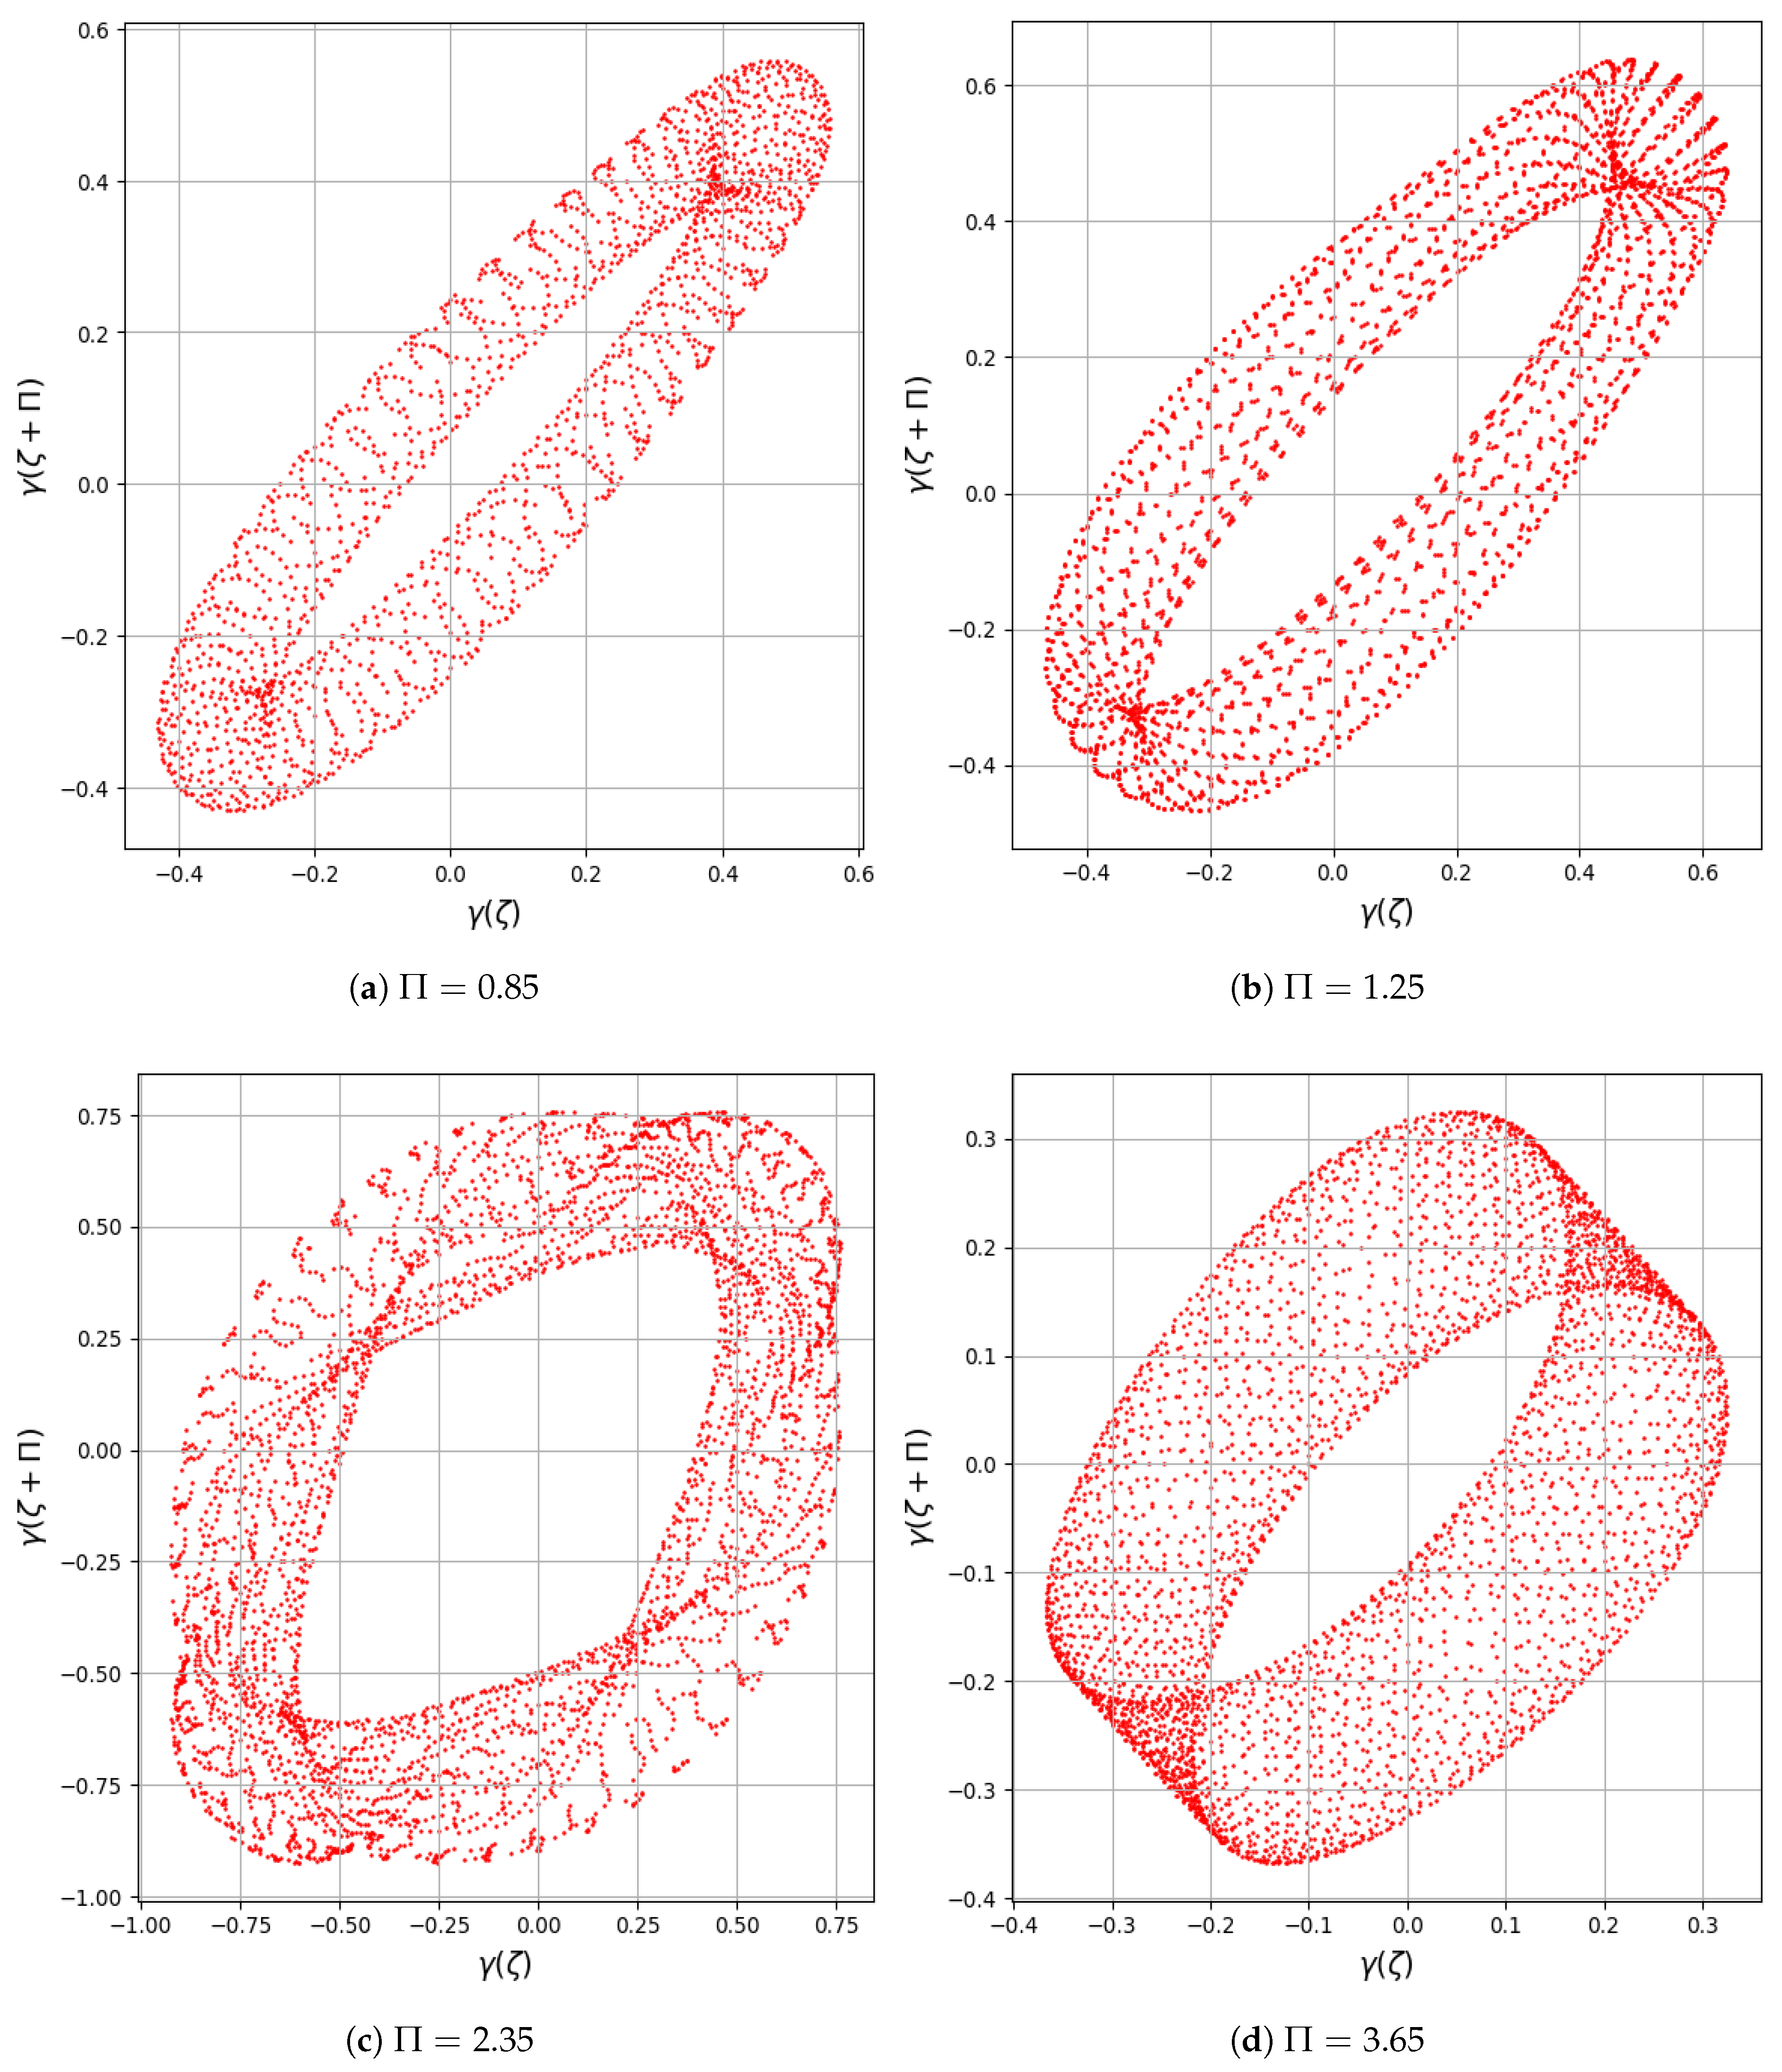
The Return map is an essential analytical technique for examining the dynamics of systems influenced by time delays. By plotting the correlation between γ ( ζ ) and γ ( ζ + 1 ) across various values of the delay parameter Π , one can gain valuable insight into the system’s temporal evolution [24]. Figure 14a–d presents this relationship for four different delays, Π = 0.85 , 1.25 , 2.35 , 3.75 , using fixed parameters ( P , κ ) = ( 5.5 , 0.05 ) , with ρ 1 = ρ 3 = 1 and ρ 2 = ρ 4 = 1 , and initial conditions ( γ , K ) = ( 0.08 , 0.02 ) .
  • In Figure 14a for Π = 0.85 , the points form a nearly closed loop with mild dispersion, indicating quasi-periodic behavior with slight sensitivity.
  • In Figure 14b for Π = 1.25 , the loop becomes more stretched and irregular, showing an onset of chaotic motion.
  • In Figure 14c for Π = 2.35 , the map appears highly scattered and densely filled, reflecting a strongly chaotic regime.
  • In Figure 14d for Π = 3.65 , the Return map shows a tighter, more organized structure, suggesting a possible return to quasi-periodicity.

6.8. Multi-Stability Analysis Technique

This section explores the emergence of multi-stability analysis in a system (23). The perturbed system demonstrates the capacity for multi-stability analysis, highlighting the coexistence of multiple dynamic behaviors for a given parameter set and varying initial conditions. Detection of chaotic behavior in system (23) through multi-stability analysis using ρ 1 = 1 , ρ 2 = 1 , ρ 3 = 1 , and ρ 4 = 1 as shown in Figure 15. The findings confirm that system (23) exhibits high sensitivity to initial conditions, leading to chaotic dynamics.

7. Sensitivity Analysis

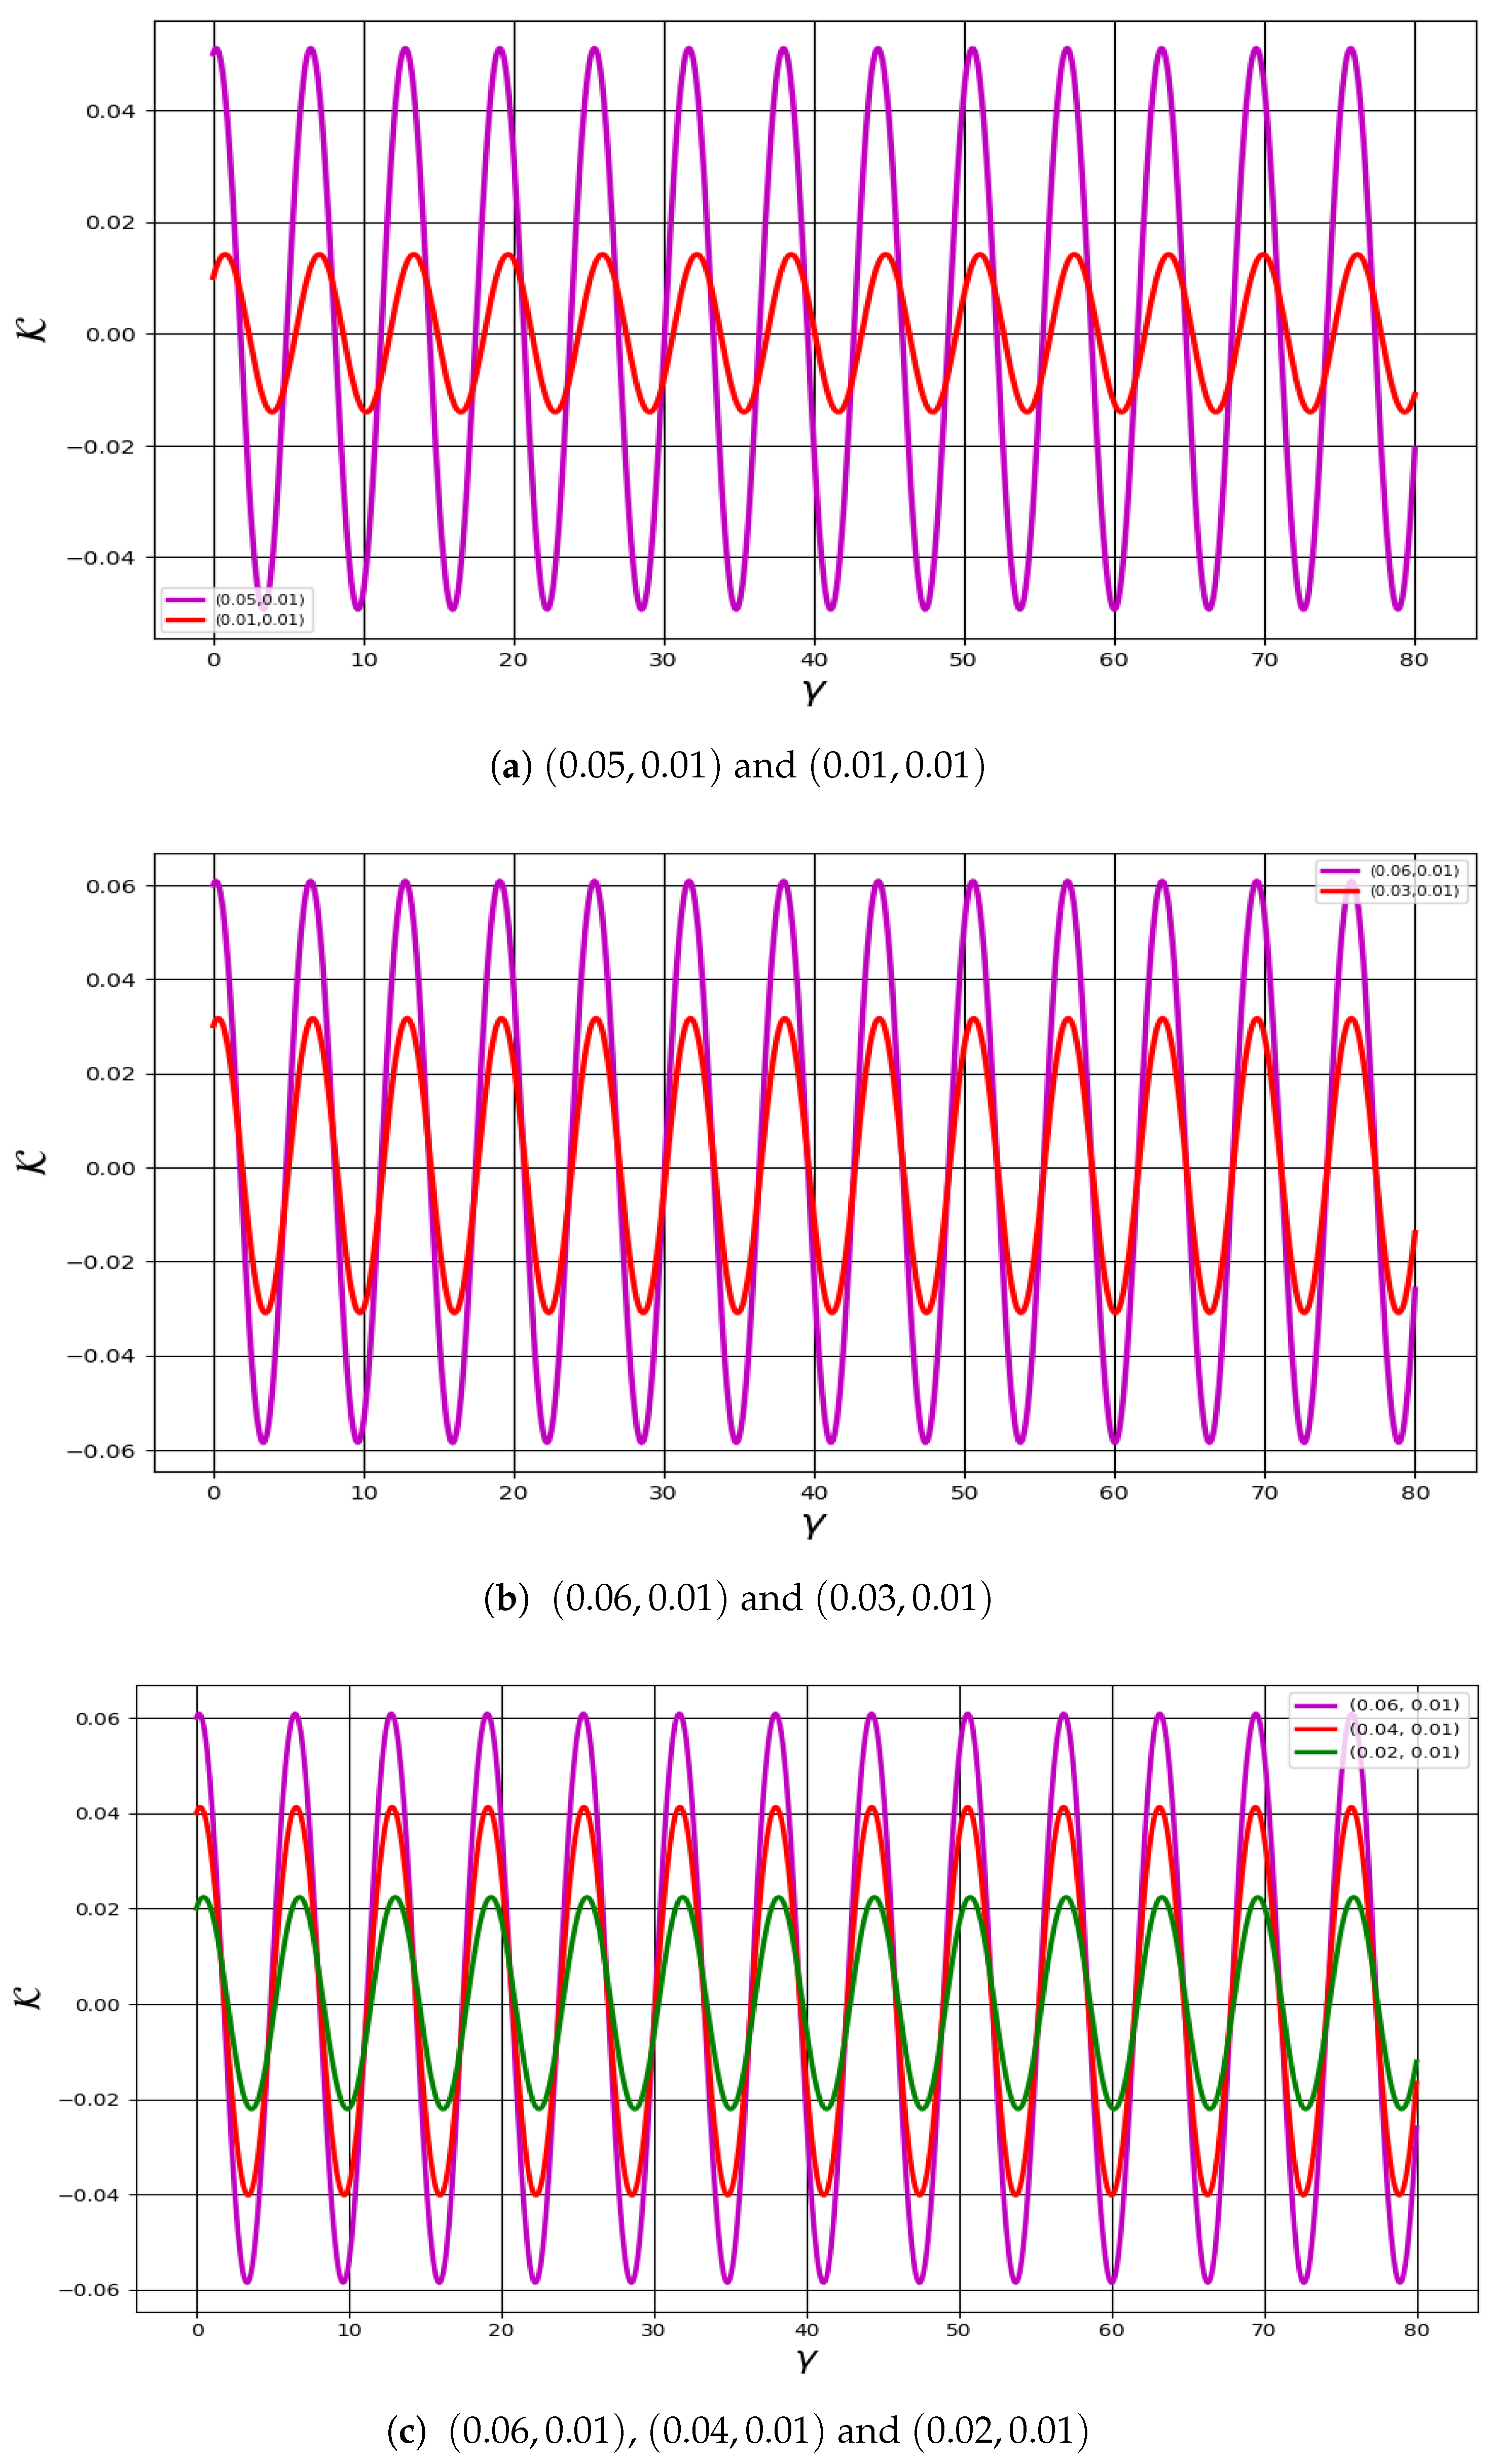
This section investigates the sensitivity analysis of the generalized ( r , q ) distribution under two distinct conditions, concentrating on the implications of electronic, ion, and electron temperatures. Although sensitivity analysis may not explicitly delineate chaos, it serves as a crucial instrument for examining dynamic systems, as it elucidates how a system responds to variations in its initial conditions or parameters [25]. Minor alterations in initial conditions can precipitate divergent trajectories. Figure 16a–c depict the sensitivity analysis for the model under consideration (12). The classification of sensitivity analysis across varying conditions and parameters is delineated in Table 3.

8. Conclusions

This study investigates the nonlinear dynamics of one-dimensional dust acoustic waves in a dusty plasma composed of ions, electrons, and dust grains of varying sizes, where the particle distributions follow a generalized ( r , q ) distribution. The dust grain population adheres to a power-law size distribution. The qualitative characteristics of the generalized ( r , q ) distribution are examined through four distinct aspects.
  • Firstly, the Galilean transformation is applied to convert the model into an autonomous dynamical system. Using bifurcation theory, we construct all corresponding phase portrait plots, which are displayed in Figure 1, Figure 2 and Figure 3 for possible cases of discriminant. The parameter values for all phase portraits are described in Table 1. The understanding of these phase portraits and their dependence on key plasma parameters offers valuable insights into the onset of bifurcations, periodicities, and possible chaotic regimes in realistic dusty plasma conditions.
  • Secondly, the Hamiltonian function of the dynamical system is constructed and used to verify the phase portrait results, as shown in Table 2. The energy levels of the Hamiltonian function are discussed in Figure 4a,b.
  • Additionally, an external driving force is introduced into the planar system, and several analytical techniques are employed to identify chaotic and quasi-periodic behaviors; while various forms can be considered for the perturbation term—such as cosh ( κ ζ ) , cos ( κ ζ ) , sinh ( κ ζ ) , sin ( κ ζ ) , and e ( κ ζ ) —the present study adopts the cos ( κ ζ ) form for further analysis [26]. Using phase portraits, Bifurcation diagrams, Poincaré maps, Lyapunov exponents, Fractal Dimensions, Return maps, Power spectra, time series analyses, Basins of attraction, and Multi-stability analysis, quasi-periodic and chaotic features are successfully revealed in the modified system, as illustrated in Figure 5, Figure 6, Figure 7, Figure 8, Figure 9, Figure 10, Figure 11, Figure 12, Figure 13, Figure 14 and Figure 15. In the chaotic and quasi-periodic behaviors analysis, we fix the values of positive electrons, ions, and parameters ρ 1 , ρ 2 , ρ 3 , ρ 4 , while varying the frequency and amplitude of the external force under different initial conditions. The complex behaviors observed, such as chaos, quasi-periodicity, and Multi-stability, are highly relevant to various space and laboratory plasma environments. In particular, external perturbations similar to those modeled here can arise in regions like Saturn’s rings, cometary tails, and plasma boundaries, where charged dust particles interact with fluctuating fields. Understanding the response of dust-ion acoustic waves to such perturbations helps explain energy transport, localization, and the development of instabilities in both natural and experimental plasma systems.
  • Finally, sensitivity analysis is conducted to investigate the influence of negative and positive electrons under varying initial conditions of the autonomous dynamical system, as illustrated in Figure 16a–c. All values of negative and positive electrons, as well as s 0 with initial conditions, are described in Table 3. As an overall observation, the system is sensitive to variations in initial conditions and particle concentrations.
Bifurcation analysis identifies critical transitions in system behavior, such as shifts from stability to chaos. Chaos analysis helps uncover complex, sensitive, and deterministic dynamics in nonlinear systems. These tools are crucial in understanding wave behavior, energy transport, and instabilities in plasma environments. Sensitivity analysis highlights how small variations in initial conditions or parameters can lead to vastly different outcomes.
  • Future Research Directions: Future research could be directed toward investigating higher-dimensional dust plasma models, incorporating magnetic field effects to analyze the modified characteristics of dust acoustic wave propagation. Extending the current study to account for non-Maxwellian distributions beyond the ( r , q ) framework, such as Cairns or Tsallis distributions, could offer deeper insights into particle trapping and nonthermal effects. Moreover, allowing for spatial and temporal variations in dust charge may reveal richer nonlinear behaviors. The emergence of localized structures such as lumps, breathers, and rogue waves in such generalized plasma environments presents a promising direction for analytical and numerical exploration. Recent advances in PINN and deep learning techniques could also be leveraged for solving governing equations and predicting complex plasma behaviors with high precision. Furthermore, experimental validation using laboratory dusty plasma setups would be essential to verify the theoretical predictions and enhance their applicability to space and astrophysical scenarios.

Author Contributions

Conceptualization, B.; methodology, B. and M.S.; software, B.; validation, B. and M.S.; formal analysis, B. and M.S.; investigation, B., M.S., and F.S.A.; writing—original draft preparation, B.; writing—review and editing, B., M.S., and F.S.A.; visualization, B.; supervision, M.S.; project administration, F.S.A.; funding acquisition, F.S.A. All authors have read and agreed to the published version of the manuscript.

Funding

This work was supported and funded by the Deanship of Scientific Research at Imam Mohammad Ibn Saud Islamic University (IMSIU) (grant number IMSIU-DDRSP2503).

Data Availability Statement

All data generated or analyzed during this study are included in the published article.

Acknowledgments

The authors extend their appreciation to the Deanship of Scientific Research at Imam Mohammad Ibn Saud Islamic University (IMSIU) for supporting this publication.

Conflicts of Interest

The authors declare no conflicts of interest.

Nomenclature

SymbolDescription
β i Velocity
κ Frequency
P Amplitude
μ 0 Ion densities
α i Dust density
ν 0 Electron densities
T e Ion temperatures
γ Electrostatic potential
T eff Effective temperature
T k Electron temperatures
λ D i Effective Debye length
ϵ Normalization constant
α i 0 Equilibrium value of α i
α e 0 Equilibrium value of α e
α k 0 Equilibrium value of α j
c i Effective dust acoustic speed
gVelocity of the traveling wave
ω D i 1 Inverse dusty plasma frequency
α e Number densities of cold electron
α k Number densities of hot electron
r , q  Spectral indices in the generalized distribution function
Z i Number of elementary charges on the dust grain surface

References

  1. Shukla, P.K.; Mamun, A.A. Introduction to Dusty Plasma Physics; CRC Press: Boca Raton, FL, USA, 2015. [Google Scholar]
  2. Abid, A.A.; Khan, M.Z.; Lu, Q.; Yap, S.L. A generalized AZ-non-Maxwellian velocity distribution function for space plasmas. Phys. Plasmas 2017, 24, 033702. [Google Scholar] [CrossRef]
  3. Tsallis, C. Possible generalization of Boltzmann-Gibbs statistics. J. Stat. Phys. 1988, 52, 479–487. [Google Scholar] [CrossRef]
  4. Cairns, R.A.; Bingham, R.; Dendy, R.O.; Nairn, C.M.; Shukla, P.K.; Mamun, A.A. Ion sounds like solitary waves with density depressions. J. Phys. IV 1995, 5, C6–C43. [Google Scholar]
  5. Zaheer, S.; Murtaza, G.; Shah, H.A. Some electrostatic modes are based on non-Maxwellian distribution functions. Phys. Plasmas 2004, 11, 2246–2255. [Google Scholar] [CrossRef]
  6. Qureshi, M.N.; Shi, J.K.; Ma, S.Z. Landau damping in space plasmas with generalized (r, q) distribution function. Phys. Plasmas 2005, 12, 122902. [Google Scholar] [CrossRef]
  7. Rubab, N.; Murtaza, G. Dust-charge fluctuations with non-Maxwellian distribution functions. Phys. Scr. 2006, 73, 178. [Google Scholar] [CrossRef]
  8. Rubab, N.; Murtaza, G.; Mushtaq, A. Effect of non-Maxwellian particle trapping and dust grain charging on dust acoustic solitary waves. Phys. Plasmas 2006, 13, 112104. [Google Scholar] [CrossRef]
  9. Lee, M.J.; Jung, Y.D. Propagation of symmetric and anti-symmetric surface waves in a self-gravitating magnetized dusty plasma layer with generalized (r, q) distribution. Phys. Plasmas 2018, 25, 053704. [Google Scholar] [CrossRef]
  10. Ullah, S.; Masood, W.; Siddiq, M.; Rizvi, H. Oblique modulation and envelope excitations of nonlinear ion sound waves with cubic nonlinearity and generalized (r, q) distribution. Phys. Scr. 2019, 94, 125604. [Google Scholar] [CrossRef]
  11. Xu, C.; Ur Rahman, M.; Emadifar, H. Bifurcations, chaotic behavior, sensitivity analysis and soliton solutions of the extended Kadometsev–Petviashvili equation. Opt. Quantum Electron. 2024, 56, 405. [Google Scholar] [CrossRef]
  12. San, S.; Beenish; Alshammari, F.S. Analytical and Dynamical Study of Solitary Waves in a Fractional Magneto-Electro-Elastic System. Fractal Fract. 2025, 9, 309. [Google Scholar] [CrossRef]
  13. Jhangeer, A.; Talafha, A.M.; Ansari, A.R. Analytical solutions and dynamical behaviors of the extended Bogoyavlensky-Konopelchenko equation in deep water dynamics. Phys. Scr. 2024, 100, 015279. [Google Scholar] [CrossRef]
  14. El-Wakil, S.A.; Abulwafa, E.M.; Elhanbaly, A.A. Super-soliton dust-acoustic waves in four-component dusty plasma using non-extensive electron and ion distributions. Phys. Plasmas 2017, 24, 073705. [Google Scholar] [CrossRef]
  15. Kanti Das, T.; Ali, R.; Chatterjee, P. Effect of dust ion collision on dust ion acoustic waves in the framework of the damped Zakharov-Kuznetsov equation in the presence of external periodic force. Phys. Plasmas 2017, 24, 103703. [Google Scholar] [CrossRef]
  16. Taha, R.M.; El-Taibany, W.F. Bifurcation analysis of nonlinear and supernonlinear dust–acoustic waves in a dusty plasma using the generalized (r, q) distribution function for ions and electrons. Contrib. Plasma Phys. 2020, 60, e202000022. [Google Scholar] [CrossRef]
  17. Kopçasız, B.; Yaşar, E. Novel exact solutions and bifurcation analysis to the dual-mode nonlinear Schrödinger equation. J. Ocean. Eng. Sci. 2022; in press. [Google Scholar] [CrossRef]
  18. Jhangeer, A.; Beenish; Riha, L. Symmetry analysis, dynamical behavior, and conservation laws of the dual-mode nonlinear fluid model. Ain Shams Eng. J. 2025, 16, 103178. [Google Scholar] [CrossRef]
  19. Sidorov, N.; Loginov, B.; Sinitsyn, A.V.; Falaleev, M.V. Lyapunov–Schmidt Methods in Nonlinear Analysis and Applications; Springer Science Business Media: Dordrecht, The Netherlands, 2013; Volume 550. [Google Scholar]
  20. Zhu, X.; Xia, P.; He, Q.; Ni, Z.; Ni, L. Ensemble Classifier Design Based on Perturbation Binary Salp Swarm Algorithm for Classification. CMES-Comput. Model. Eng. Sci. 2023, 135, 653–671. [Google Scholar] [CrossRef]
  21. Sidorov, N.; Sidorov, D.; Li, Y. Basins of attraction and stability of nonlinear systems’ equilibrium points. Differ. Equ. Dyn. Syst. 2023, 31, 289–300. [Google Scholar] [CrossRef]
  22. Li, B.; Liang, H.; He, Q. Multiple and generic bifurcation analysis of a discrete Hindmarsh-Rose model. Chaos Solitons Fractals 2021, 146, 110856. [Google Scholar] [CrossRef]
  23. Zhang, X.; Yang, X.; He, Q. Multi-scale systemic risk and spillover networks of commodity markets in the bullish and bearish regimes. N. Am. J. Econ. Financ. 2022, 62, 101766. [Google Scholar] [CrossRef]
  24. Li, B.; Zhang, Y.; Li, X.; Eskandari, Z.; He, Q. Bifurcation analysis and complex dynamics of a Kopel triopoly model. J. Comput. Appl. Math. 2023, 426, 115089. [Google Scholar] [CrossRef]
  25. Beenish; Samreen, M. Qualitative Behavior and Travelling Wave Solutions of the (n+1)-Dimensional Camassa-Holm Kadomtsev-Petviashvili Equation. Int. J. Geom. Methods Mod. Phys. 2025, 2550275. [Google Scholar] [CrossRef]
  26. Li, Z.; Lyu, J.; Hussain, E. Bifurcation, chaotic behaviors, and solitary wave solutions for the fractional Twin-Core couplers with Kerr law non-linearity. Sci. Rep. 2024, 14, 22616. [Google Scholar] [CrossRef]
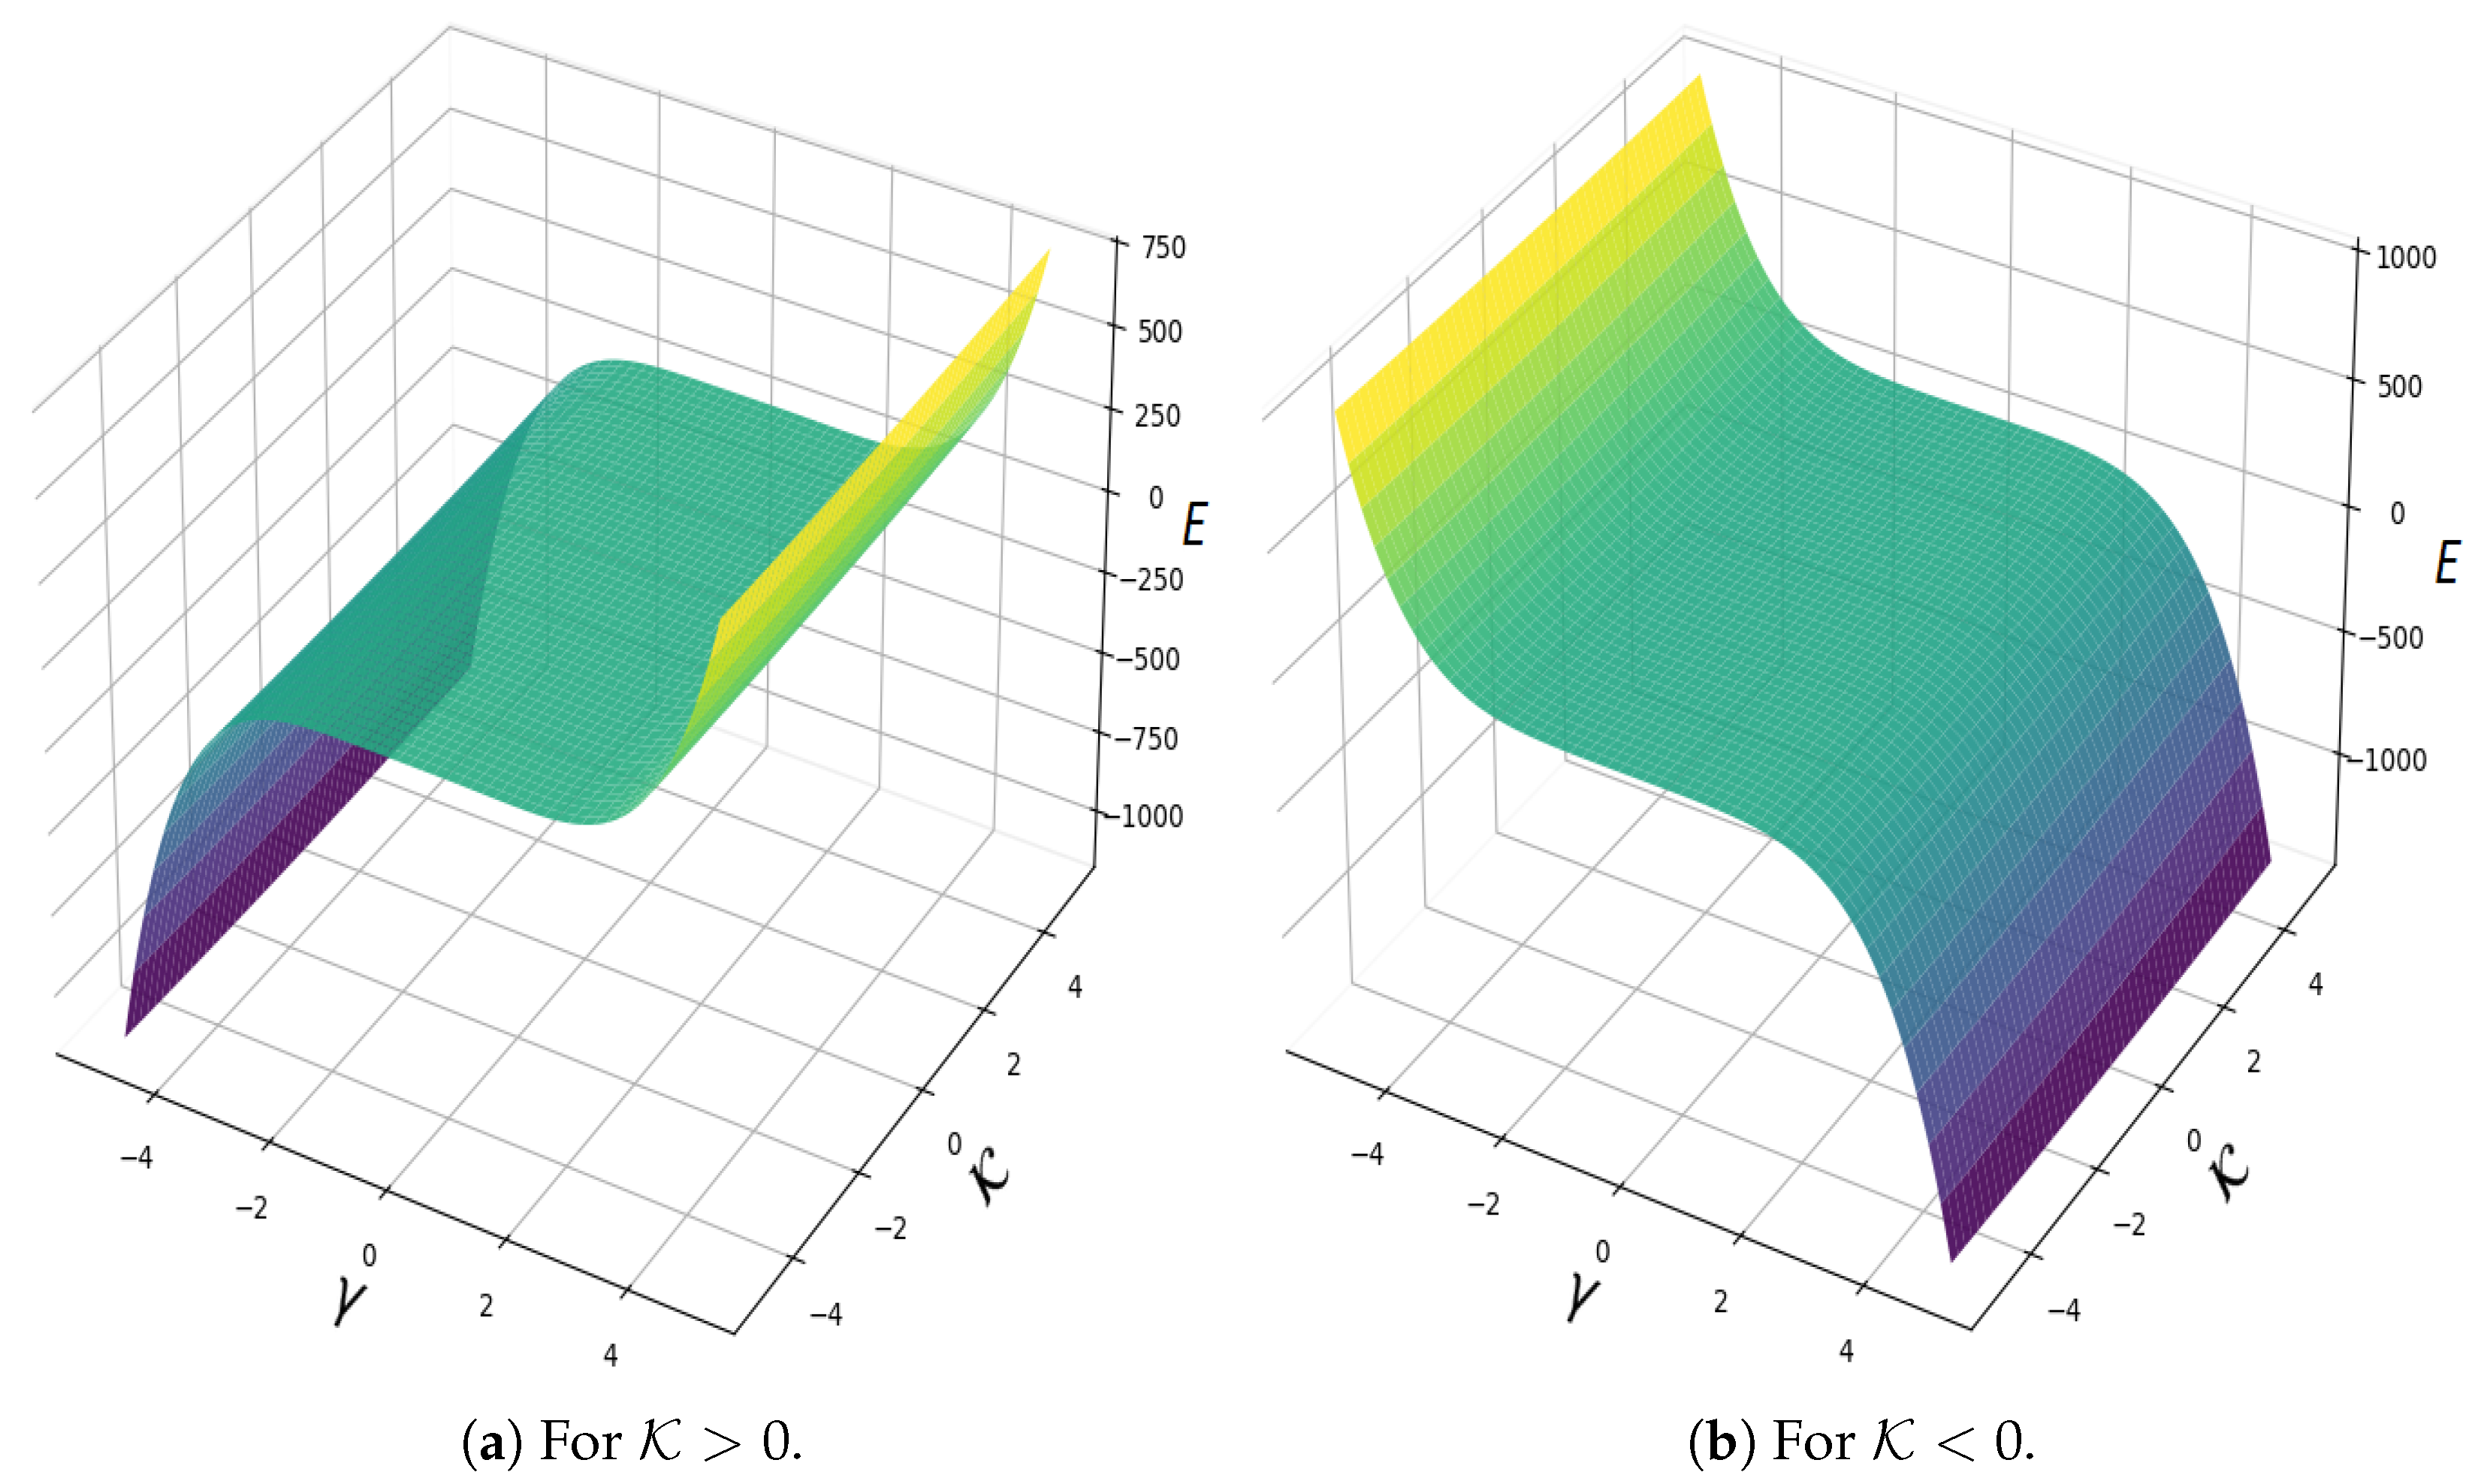
Figure 4. Graphical representation of the Hamiltonian function at different energy levels.
Axioms 14 00610 g004
Figure 5. System (23) displays chaotic behavior using force frequency is ( P ) is 2.88 .
Axioms 14 00610 g005
Figure 6. System (23) displays quasi-periodic or weakly chaotic behavior using force frequency is ( P ) is 1.3 π .
Axioms 14 00610 g006
Figure 7. System (23) displays quasi-periodic behavior using force frequency is ( P ) is 1.3 .
Axioms 14 00610 g007
Figure 8. Chaotic behavior in system (23) is detected via Lyapunov exponents using ρ 1 = 0.67 , ρ 2 = 1.12 , ρ 3 = 0.98 , ρ 4 = 0.98 , P = 0.01 , κ = 0.3 , and initial condition (0.05, 0.05).
Axioms 14 00610 g008
Figure 9. Chaotic behavior in system (23) is detected via Basin of attraction using ρ 1 = 0.67 , ρ 2 = 1.12 , ρ 3 = 0.98 , ρ 4 = 0.98 , P = 0.01 , κ = 0.44 .
Axioms 14 00610 g009
Figure 10. Chaotic behavior in system (23) is detected via 3D chaotic attractor using ρ 1 = 0.87 , ρ 2 = 1.12 , ρ 3 = 0.98 , ρ 4 = 0.98 , P = 0.01 , κ = 0.3 .
Axioms 14 00610 g010
Figure 11. Chaotic behavior in system (23) is detected via Power spectrum using ρ 1 = 0.87 , ρ 2 = 1.12 , ρ 3 = 0.98 , ρ 4 = 0.98 , P = 0.01 , and κ = 0.3 .
Axioms 14 00610 g011
Figure 12. Chaotic behavior in system (23) is detected via Bifurcation diagram using ρ 1 = 0.87 , ρ 2 = 1.12 , ρ 3 = 0.98 , ρ 4 = 0.98 , and κ = 0.3 .
Axioms 14 00610 g012
Figure 13. System (23) through Fractal Dimension using ρ 1 = 0.87 , ρ 2 = 1.12 , ρ 3 = 0.98 , ρ 4 = 0.98 , and κ = 0.3 .
Axioms 14 00610 g013
Figure 14. Chaotic behavior in system (23) is detected via Return map using ρ 1 = ρ 3 = 1 and ρ 2 = ρ 4 = 1 .
Axioms 14 00610 g014
Figure 15. Detection of chaotic behavior in system (23) through Multi-stability analysis.
Axioms 14 00610 g015
Figure 16. Sensitivity analysis of system (12) using different initial conditions.
Axioms 14 00610 g016
Table 2. Phase portraits based on Hamiltonian classification.
FigureQ1Q2Q3Q4
Figure 1aSP (Saddle Point)CP (Center Point)CPSP
Figure 1bSPCPCPSP
Figure 1cCPSPSPCP
Figure 1dCPSPSPCP
Figure 2aSPCP--
Figure 2bSPCP--
Figure 2cCPSP--
Figure 2dCPSP--
Figure 3aSPCP--
Figure 3bCusp Point---
Table 3. Categorization of sensitivity analysis across conditions and parameters.
IllustrationParameter SpecificationsICs
Figure 16a ν 0 = 0.5 , σ 0 = 0.55 , s 0 = 0.5 ( 0.05 , 0.01 ) and ( 0.01 , 0.01 )
Figure 16b ν 0 = 0.5 , σ 0 = 0.55 , s 0 = 0.5 ( 0.06 , 0.01 ) and ( 0.03 , 0.01 )
Figure 16c ν 0 = 0.5 , σ 0 = 0.25 , s 0 = 0.5 ( 0.06 , 0.01 ) , ( 0.04 , 0.01 ) and ( 0.02 , 0.01 )
Disclaimer/Publisher’s Note: The statements, opinions and data contained in all publications are solely those of the individual author(s) and contributor(s) and not of MDPI and/or the editor(s). MDPI and/or the editor(s) disclaim responsibility for any injury to people or property resulting from any ideas, methods, instructions or products referred to in the content.