Article

Improving Stability and Reducing Vibrations of the Smooth and Discontinuous Oscillator Using a Proportional–Derivative Controller

by
M. N. Abd El-Salam
1,*,
Rageh K. Hussein
2 and
Sabry M. El-Shourbagy
1
1
Basic Sciences Department, Higher Technological Institute, 10th of Ramadan City 44634, Egypt
2
Physics Department, College of Science, Imam Mohammad Ibn Saud Islamic University (IMSIU), Riyadh 11623, Saudi Arabia
*
Author to whom correspondence should be addressed.
Axioms 2025, 14(6), 444; https://doi.org/10.3390/axioms14060444
Submission received: 1 May 2025 / Revised: 29 May 2025 / Accepted: 4 June 2025 / Published: 5 June 2025

Abstract

In this study, the Proportional and Derivative Controller (PD) is presented as a modified control that combines features of the Proportional Controller (P-Controller) and the Derivative Controller (D-Controller) to suppress the vibrations of the Smooth and Discontinuous Oscillator (SD). The investigated model has been derived as a one-degree-of-freedom. The frequency response equation of the controlled system has been obtained using the perturbation technique up to a second approximation. The influence of the P-Controller, the D-Controller, and the PD-Controller on the SD-Oscillator amplitude has been studied by plotting the time histories. The numerical and approximate simulation established that the PD-Controller can inhibit the system vibration. Finally, there is high closeness between the numerical solutions (from time histories) and the approximate solutions (from perturbation analysis).

1. Introduction

The study of oscillators, both smooth and discontinuous, is fundamental in understanding the dynamic systems that exhibit periodic behavior. Controlling oscillations is crucial for maintaining stability and performance in many engineering applications, such as mechanical and electrical systems. A proportional–derivative (PD) controller is often employed to regulate these oscillations by adjusting the system’s response to disturbances. Zhao et al. [1] investigated how the delayed feedback control can suppress vibrations in a nonlinear system with external excitation. They found that the vibration can be significantly reduced, with suppression efficiency depending on the delay and gain, and that the analytical predictions match the numerical simulations. The impact of loop delays on the efficiency of the saturation controller is explored in Refs. [2,3]. The authors demonstrated that loop delays can destabilize the controlled system and improve the controller’s efficiency. Liao [4] developed a method to scrutinize nonlinear systems with fractional derivatives and time delays. Using harmonic balance and eigenvalue analysis, he calculated system behavior, stability, and sensitivity. He found that the method is validated through examples and shows potential for optimization and uncertainty analysis. Andreaus et al. [5] examined how the base speed affects the system, introducing closed-form solutions and identifying a critical base velocity. They also compared the effects of Coulomb’s friction law with a velocity-dependent friction model on the system’s behavior. Very small excitation forces can lead to large vibration amplitudes in nonlinear systems under various resonance conditions [6,7,8]. These resonant vibrations can degrade system accuracy, particularly in micro- and nanoscale applications, and may even result in complete system failure. Saeed et al. [9] studied nonlinear oscillations of a cantilever beam and introduced a time-delayed controller to reduce vibrations. They deduced that loop delay affects controller performance, and optimal delay values are found to improve results, with numerical tests confirming the findings. Xiuting et al. [10] observed the optimal time delay for active control in a nonlinear isolation system under various external excitations. They also scrutinized the system’s stability and response to determine the best time delay values, guiding optimization of control in practical engineering applications. Mao and Ding [11] investigated the dynamics of a nonlinear vibration reduction system with time delay feedback control and a quasi-zero stiffness structure. Also, they examined the system’s stability, oscillations, and force transmissibility, using a genetic algorithm for optimization, and explored the effects of time delay on performance under various types of excitations. Jian et al. [12] studied time-delayed feedback control to reduce vibrations in a piezoelectric elastic beam. They found that optimal time delays and mixed feedback controllers improve vibration reduction and system stability. Refs. [13,14,15,16] presented a new control strategy combining PD, IRC, and PPF controllers to reduce vibrations in eight and twelve-pole electromagnetic suspension systems. The system’s dynamics were framed as a nonlinear four-degree-of-freedom system, and the effectiveness of different control strategies was scrutinized. The results clarified that the combined PD + IRC + PPF controller successfully eliminated vibrations under various conditions, offering the benefits of individual controllers without their drawbacks. Abd El-Salam et al. [17] examined and solved a system of nonlinear differential equations constituting the oscillations of a cantilever beam, using PD and NDF controllers to reduce vibrations. Their study scrutinizes the frequency response curves, comparing the controllers and evaluating their effects on stability and response curves under different resonance cases. Ibrahim [18] focused on tuning PI–PD controllers, an extension of PID controllers, to stabilize open-loop unstable processes by using a PD controller in an inner feedback loop. He derived the tuning parameters using analytical rules based on the integral of the squared time-cubed error (IST3E) criterion, and simulations demonstrate the effectiveness and superiority of the proposed approach. Junior et al. [19] developed a coupled controller for evasive maneuvers in over-actuated vehicles, using second-order sliding mode control and a fuzzy logic-based torque-vectoring method to adjust yaw moments. The controller is tested in a simulation of a rear-end collision scenario, successfully enabling the vehicle to perform a lane change and stop in critical situations at speeds up to 130 km/h. This research will explore the use of P-Controller, D-Controller, and PD-Controller in smooth and discontinuous oscillators, investigating how the controller can reduce vibrations, enhance system stability, and ensure optimal performance in nonlinearity and discontinuities. Through theoretical analysis and simulation, the effectiveness of PD control in handling both types of oscillators is evaluated, providing insights into its application in real-world systems. Section 2 provides a mathematical formulation of the system. An analytical method is introduced to derive approximate solutions and investigate the stability conditions of the system in Section 3. In Section 4, the numerical solutions and approximate solutions for the SD Oscillator will be illustrated before and after using the P-Controller, the D-Controller, and the PD-Controller at the primary resonance condition. Finally, we conclude our results in Section 5.

2. Smooth and Discontinuous Oscillator Model

Figure 1a characterizes a schematic model of the SD Oscillator. The oscillator is scrutinized as a one-degree-of-freedom system. Therefore, the equation of motion can be presented as follows [20]:
d 2 z d t 2 + ω 2 z + ζ d z d t + β z 1 1 α 2 + z 2 = f cos ( Ω t )
where z ¨ presents the inertia of the SD Oscillator. It explains how the position z changes with time as governed by the external force f acting on the system. According to Hooke’s law in springs, the linear restoring force is given by ω 2 z , where ω symbolizes the natural frequency of the system. The damping and nonlinear coefficients are ζ and β , respectively. For small displacement ( z < < α ), the nonlinear term behaves almost linearly as 1 1 α 2 + z 2 z 2 2 α 2 , but for larger displacement ( z > > α ), the nonlinear term strongly becomes nonlinear and significantly alters the system’s behavior. The amplitude of the periodic external force is f , and its frequency is Ω . To eliminate vibrations of the SD Oscillator, we will use the PD-Controller. It combines two components: proportional control and derivative control, which work together to minimize the vibrations of the vibrating system. So, Equation (1) takes the following form:
d 2 z d t 2 + ω 2 z + ζ d z d t + β z 1 1 α 2 + z 2 = f cos ( Ω t ) η 1 z η 2 d z d t
The term η 1 z presents the P-Controller, where the proportional gain is η 1 . The D-Controller is given by η 2 z ˙ , where the derivative gain is η 2 . The performance of the PD-Controller on reducing or eliminating vibrations resulting from the influence of external force in the primary resonance case can be illustrated in Figure 1b.

3. Analytical Realization and Autonomous Amplitude-Phase Equations

The Maclaurin series will be used to apply the multiple scale method to obtain the solution of Equation (2) as follows:
d 2 z d t 2 + ω 2 z + ζ d z d t + β α 1 α z + β 2 α 3 z 3 = f cos ( Ω t ) η 1 z η 2 d z d t
Relying on the perturbation technique, a second-order approximate solution for the SD Oscillator equation of motion can be written as follows [20]:
z ( t , ε ) = z 0 ( T 2 , T 1 , T 0 ) + ε z 1 ( T 2 , T 1 , T 0 ) + ε 2 z 2 ( T 2 , T 1 , T 0 ) + O ( ε 3 )
where ε is the perturbation parameter, T 0 = t , and T n = ε n t (n = 1, 2). According to the time scales T 0 , T 1 , and T 2 , the derivatives d d t and d 2 d t 2 can be expressed as
d d t = D 0 + ε D 1 + ε 2 D 2 , d 2 d t 2 = D 0 2 + 2 ε D 0 D 1 + ε 2 D 1 2 + 2 D 0 D 2 ,   D j = T j ; j = 0 , 1 , 2
To carry out the solution steps, the system parameters may be scaled as follows:
  ζ = ε ζ 1 ,   β = ε   β 1 , f = ε 2 f 1 ,   η 1 = ε 2 η 10 ,   η 2 = ε 2 η 20
Inserting Equations (4)–(6) into Equation (3), and then equating the coefficients that have the same power of ε , yields O ( ε 0 )
D 0 2 + ω 2 z 0 = 0
O ( ε )
D 0 2 + ω 2 z 1 = 2 D 0 D 1 z 0 ζ 1 D 0 z 0 β 1 α 1 α z 0 β 1 2 α 3 z 0 3
O(ε2)
D 0 2 + ω 2 z 2 = 2 D 0 D 2 z 0 2 D 0 D 1 z 1 D 1 2 z 0 ζ 1 D 0 z 1 ζ 1 D 1 z 0 β 1 α 1 α z 1                                                           β 1 2 α 3 z 0 2 z 1 + f 1 cos ( Ω t ) η 10 z 0 η 20 D 0 z 0
Equation (7) is a homogeneous second-order differential equation; its solution takes the following form:
z 0 T 2 , T 1 , T 0 = A ( T 2 , T 1 ) e i ω T 0 + A ¯ ( T 2 , T 1 ) e i ω T 0
where i = 1 , and the unknown function A ( T 2 , T 1 ) will be calculated later. Inserting Equation (10) into the right-hand side of Equation (8), to obtain the first approximation as follows:
D 0 2 + ω 2 z 1 = 2 i ω ( D 1 A ) i ω ζ 1 A β 1 α 1 α A 3 β 1 2 α 3 A 2 A ¯ e i ω T 0 β 1 2 α 3 A 3 e 3 i ω T 0 + c c
where c c is the complex conjugate term. To determine the solvability conditions from the first approximation, we will eliminate all secular terms from the right-hand side of Equation (11) as follows:
D 1 A = 1 2 ζ 1 + i β 1 α 1 2 ω α A + 3 i β 1 4 ω α 3 A 2 A ¯ D 1 A ¯ = 1 2 ζ 1 i β 1 α 1 2 ω α A ¯ 3 i β 1 4 ω α 3 A A ¯ 2
The first approximation can be expressed as
z 1 T 2 , T 1 , T 0 = β 1 16 ω 2 α 3 A 3 e 3 i ω T 0 + c c
Now, inserting Equations (10), (12) and (13) into the right-hand side of Equation (9), yields
D 0 2 + ω 2 z 2 = 2 i ω ( D 2 A ) + ζ 1 2 4 A + β 1 2 ( α 1 ) 2 4 ω 2 α 2 A + 3 i ζ 1 β 1 4 ω α 3 A 2 A ¯ 3 β 1 2 ( α 1 ) 4 ω 2 α 4 A 2 A ¯ 57 β 1 2 32 ω 2 α 6 A 3 A ¯ 2 η 10 A i ω A e i ω T 0                                               + 9 i 8 ω α 3 A 2 ( D 1 A ) 3 i ζ 1 β 1 16 ω α 3 A 3 β 1 2 ( α 1 ) 16 ω 2 α 4 A 3 3 β 1 2 16 ω 2 α 6 A 4 A ¯ e 3 i ω T 0                                               3 β 1 2 16 ω 2 α 6 A 5 e 5 i ω T 0 + f 1 2 e i Ω T 0 + c c
After eliminating the secular terms from Equation (14), the second approximation can be written as
z 2 T 2 , T 1 , T 0 = 9 i 64 ω 3 α 3 A 2 ( D 1 A ) + 3 i ζ 1 β 1 128 ω 3 α 3 A 3 + β 1 2 ( α 1 ) 128 ω 4 α 4 A 3 + 3 β 1 2 128 ω 4 α 6 A 4 A ¯ e 3 i ω T 0                                                           + β 1 2 128 ω 4 α 6 A 5 e 5 i ω T 0 + f 1 2 ( ω 2 Ω 2 ) e i Ω T 0 + c c
To obtain the solvability conditions from the second approximation at the primary resonance case (i.e., Ω = ω ) , we will introduce the detuning parameter σ to show the nearness Ω to ω as follows:
Ω = ω   +   σ
Inserting Equation (16) into Equation (14), we can present the solvability conditions of Equation (14) as follows:
D 2 A = i ζ 2 8 ω A i β 1 2 ( α 1 ) 2 8 ω 3 α 2 A + 3 ζ 2 β 2 8 ω 2 α 3 A 2 A ¯ + 3 i β 1 2 ( α 1 ) 8 ω 3 α 4 A 2 A ¯ + 57 i β 1 2 64 ω 3 α 6 A 3 A ¯ 2 + i η 10 2 ω A                             η 20 2 A i f 1 4 ω e i σ t
To obtain the slow-flow modifying equations of the investigated SD Oscillator, we can rewrite the unknown function A ( T 2 , T 1 ) in its polar form as [18]
A = 1 2 a e i γ d A d t = 1 2 d a d t + i a d γ d t e i γ
According to the definition of the first derivative in Equation (5),
d A d t = ε D 1 A + ε 2 D 2 A
Inserting Equations (12), (17) and (18) into Equation (19) and going back to the main system parameters, yields
a ˙ + i a γ ˙ = ζ 2 + η 2 2 a + i β ( α 1 ) 2 ω ζ 2 8 ω β 2 ( α 1 ) 2 8 ω 3 α 2 + η 1 2 ω a + 3 ζ β 32 ω 2 α 3 a 3                                         + i 3 β 16 ω α 3 + β 2 ( α 1 ) 32 ω 3 α 4 a 3 + i 57 β 2 1024 ω 2 α 6 a 5 + f 2 ω sin ( Ψ ) i f 2 ω cos ( Ψ )
Now, separating the real and imaginary parts, to obtain the following nonlinear autonomous dynamical system
d a d t = ζ 2 + η 2 2 a + 3 ζ β 32 ω 2 α 3 a 3 + f 2 ω sin ( Ψ )
a d γ d t = β ( α 1 ) 2 ω ζ 2 8 ω β 2 ( α 1 ) 2 8 ω 3 α 2 + η 1 2 ω a + 3 β 16 ω α 3 + β 2 ( α 1 ) 32 ω 3 α 4 a 3 + 57 β 2 1024 ω 2 α 6 a 5 f 2 ω cos ( Ψ )
where Ψ = σ t γ . The vibration amplitude of the SD Oscillator is presented by a ( t ) , and its motion phase angle is Ψ . The steady-state amplitude and phase angle of the vibrating system can be obtained by putting a ˙ = Ψ ˙ = 0 , which means that γ ˙ = σ . So, we will obtain the following nonlinear algebraic system of equations:
f 2 ω sin ( Ψ ) = ζ 2 + η 2 2 a 3 ζ β 32 ω 2 α 3 a 3
f 2 ω cos ( Ψ ) = β ( α 1 ) 2 ω ζ 2 8 ω β 2 ( α 1 ) 2 8 ω 3 α 2 + η 1 2 ω σ a + 3 β 16 ω α 3 + β 2 ( α 1 ) 32 ω 3 α 4 a 3 + 57 β 2 1024 ω 2 α 6 a 5
To obtain the frequency response equation, one can square and sum Equations (23) and (24), which yields
ζ 2 + η 2 2 a 3 ζ β 32 ω 2 α 3 a 3 2 + β ( α 1 ) 2 ω ζ 2 8 ω β 2 ( α 1 ) 2 8 ω 3 α 2 + η 1 2 ω σ a + 3 β 16 ω α 3 + β 2 ( α 1 ) 32 ω 3 α 4 a 3 + 57 β 2 1024 ω 2 α 6 a 5 2 = f 2 ω 2
The stability of the nonlinear autonomous dynamical system presented in Equations (21) and (22) can be investigated by using the first (indirect) method of Lyapunov as follows:
d a d t d Ψ d t = χ 11 χ 12 χ 21 χ 22 a Ψ
where
χ 11 = a d a d t = ζ 2 + η 2 2 + 9 ζ β 32 ω 2 α 3 a 2
χ 12 = a d Ψ d t = σ β ( α 1 ) 2 ω + ζ 2 8 ω + β 2 ( α 1 ) 2 8 ω 3 α 2 η 1 2 ω 1 a 3 3 β 16 ω α 3 + β 2 ( α 1 ) 32 ω 3 α 4 a 5 57 β 2 1024 ω 2 α 6 a 3
χ 21 = Ψ d a d t = f 2 ω cos ( Ψ )
χ 22 = Ψ d Ψ d t = f 2 ω a sin ( Ψ )
To study the stability of the system in Equation (26), we must solve the following equation to obtain its eigenvalues λ :
χ 11 λ χ 12 χ 21 χ 22 λ = 0
By resolving Equation (31), we will have a polynomial of the second degree in λ as
λ 2 χ 11 + χ 22 λ + χ 11 χ 22 χ 21 χ 12 = 0
The stability criteria might be written as
χ 11 + χ 22 > 0 ,                               χ 11 χ 22 χ 21 χ 12 > 0
The following section will present the numerical investigation of the theoretical results previously discussed.

4. Results and Discussions

In this section, the numerical solutions and approximate solutions for the SD Oscillator will be illustrated before and after using the P-Controller, the D-Controller, and the PD-Controller at the primary resonance condition ( Ω = ω + σ ). We use the MATLAB 2014 program to simulate the efficacy of different parameters on the SD Oscillator steady-state amplitudes at the following values: ω = 0.8 ,     ζ = 0.08 ,     β = 0.01 ,     α = 5 ,     f = 0.5 [20].

4.1. Uncontrolled Model

The force-response curves and time histories of the investigated system before the mechanism’s operation are outlined in Figure 2.
Figure 2a presents a numerical investigation of the time series of z before using any type of control strategy at σ = 0 (i.e., when Ω = ω ) for various levels of the external force f conforming to Equation (2). In this figure, the numerical solutions were plotted using solid lines (red and blue), while the black dashed lines present the perturbation solution. Some effective notes can be calculated from this figure, such as the agreement between numerical solutions and approximate solutions. The time series of z increases with increasing force f till a stated time value, and then they have steady behavior. The frequency response curves (FRC) for the considered values of f according to Equation (25) are illustrated in Figure 2b. The response amplitude is associated with the external force f and the detuning parameter σ . As the external force value increases, the amplitudes of these curves increase. It reaches its absolute maximum value (its peak) at σ = 0 .

4.2. Controlled Model

According to the closed-loop controlled system in Figure 1b, we use the proportional controller (P-Controller), the derivative controller (D-Controller), and the proportional derivative controller (PD-Controller) to suppress the vibrations of the SD oscillator. To determine the appropriate values for the gains of P-Controller and D-Controller, we plot the response amplitude against η 1 and η 2 at the primary resonance case (i.e., σ = 0 , Ω = ω ), as presented in Figure 3. From this figure, we select the value of η 1 equal to 3 and η 2 equal to 3. To clarify the advantages of the different types of control used in this article, we use the time histories and response curves to compare the numerical results (from time histories) and the approximate solutions (from the response curves) derived from applying the perturbation technique. P-Controller can stabilize a first-order system, give a near-zero error, and improve the setting time by increasing the bandwidth. For high-order systems, it is not sufficient to control the vibrating system, as shown clearly in Figure 4.
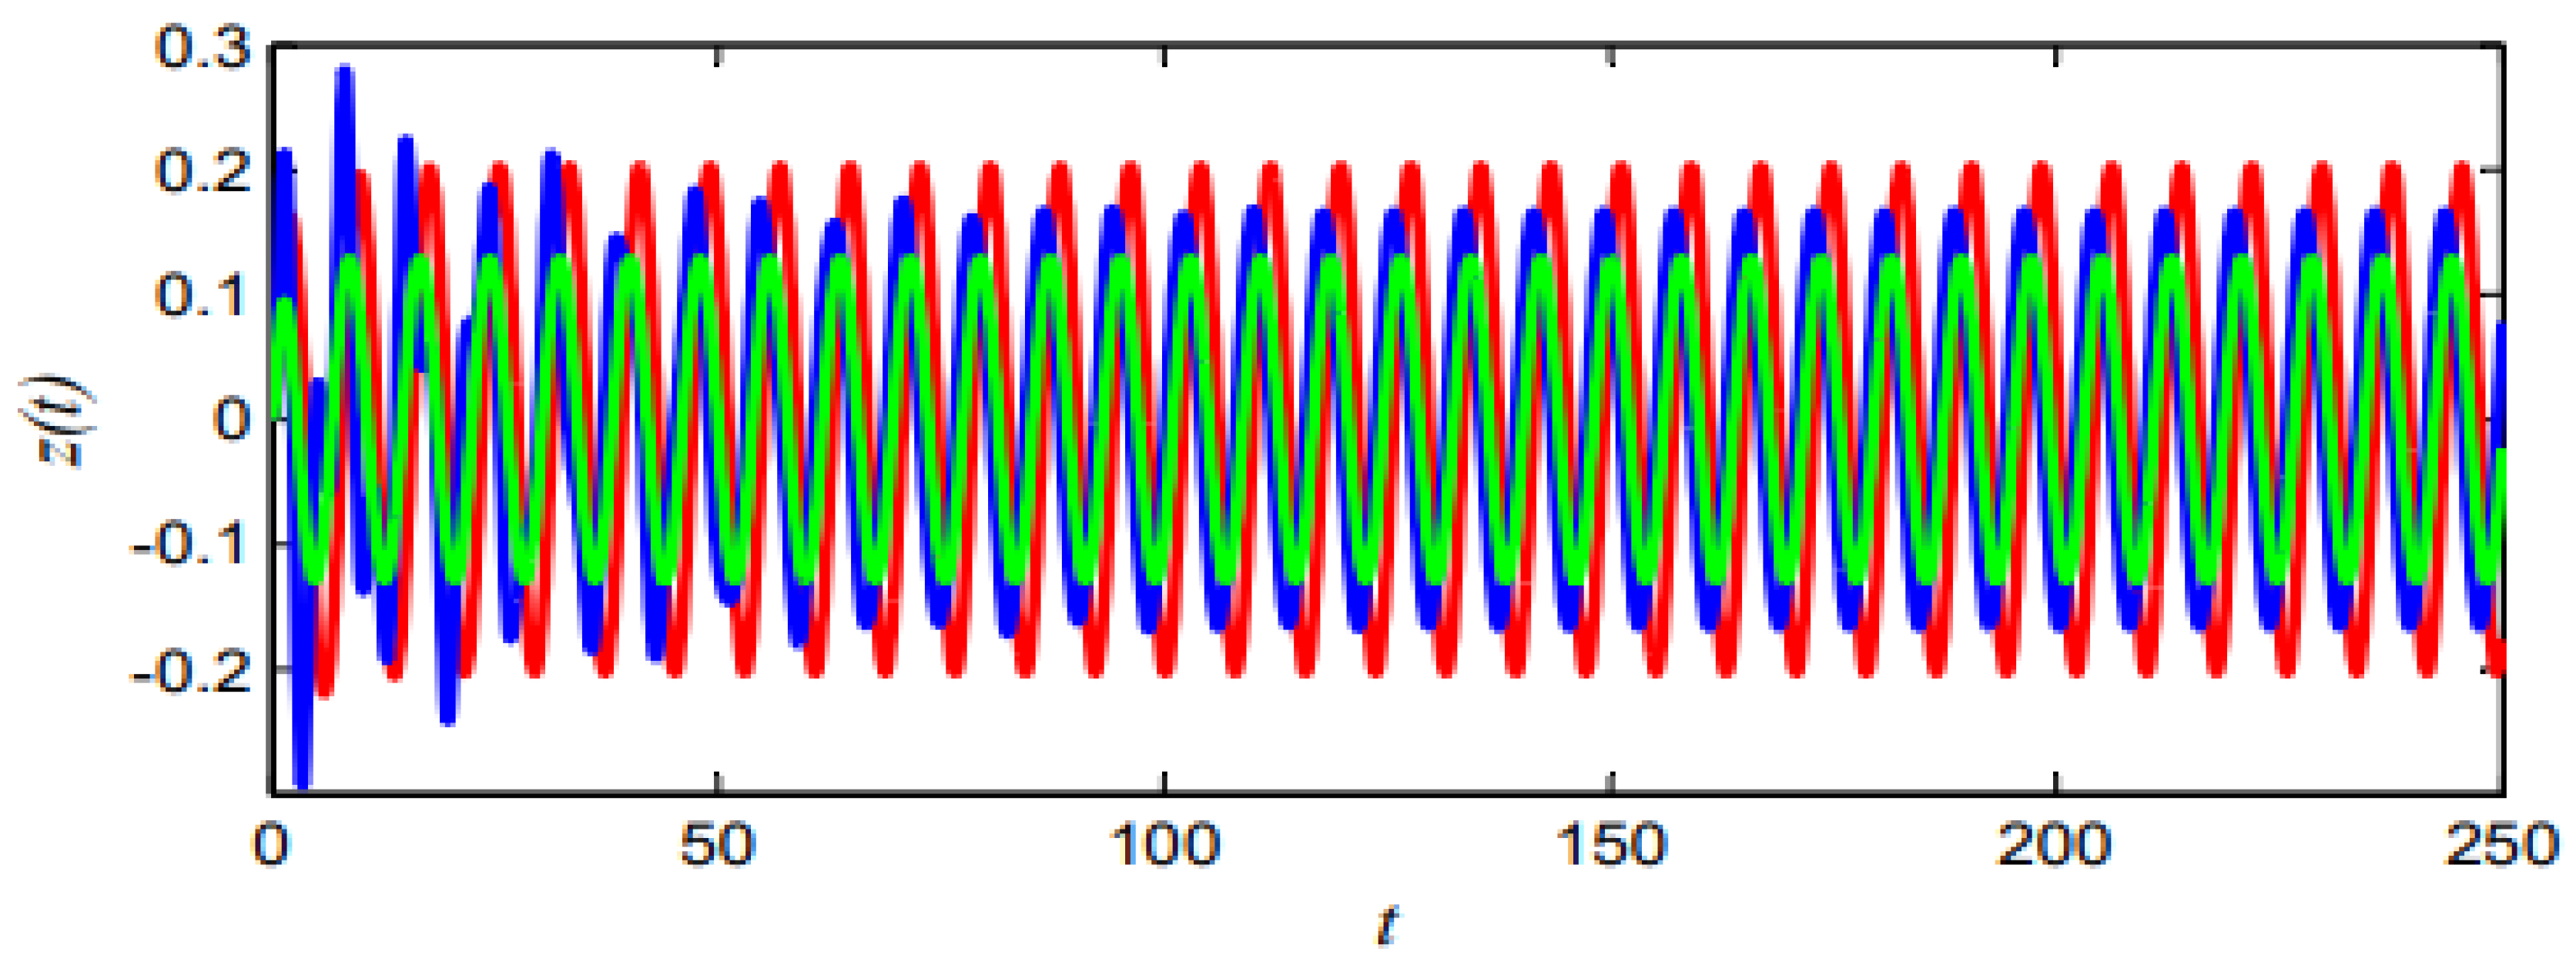
From Figure 4a, the time series establishes the effectiveness of the P-Controller in the primary resonance case. The amplitude of the vibrating system decreases to 0.1663, which means the effectiveness of the P-Controller; ( E a = a m p l i t u d e   w i t h o u t   c o n t r o l l e r a m p l i t u d e   w i t h   c o n t r o l l e r ) is equal to 47. The P-Controller reduces the vibrations of the SD oscillator to 97.5% of its value without control. As shown in Figure 4b, the P-Controller has no effect away from the resonance case ( σ = 0 ), and it affects the frequency response curve to the right-hand and its symmetric axis away from σ = 0 . For more damping, we use a D-Controller, as shown in Figure 5. In the primary resonance case, the amplitude is reduced to 0.2029 after using the D-Controller, as illustrated in Figure 5a. The effectiveness of D-Controller E a is equal to 38, and it is decreased to 97% from its value without control. Figure 5b shows the advantage of the D-Controller, which gives more damping to the vibrating system all the time, and its response curve is symmetric, about σ = 0 . We can conclude that both types of control are not sufficient to suppress the vibrations of the SD Oscillator, so we use the PD-Controller. The PD-Controller combines features of the P-Controller and the D-Controller. It decreases the amplitude of the SD Oscillator to 0.1286, which means that its effectiveness E a is equal to 61, with a reduction rate of up to 98.5%, as shown in Figure 6. Figure 7a shows the uncontrolled system with spiral trajectories in phase space, indicating oscillations that decrease over time. This pattern reflects a stable focus, meaning that the system is asymptotically stable and eventually settles at a steady-state equilibrium. With the PD controller applied, the system likely settles into a stable periodic orbit (limit cycle), exhibiting low-energy oscillations around an equilibrium. This suggests nonlinear dynamics with minimal damping, as shown in Figure 7b. We can conclude the results obtained from Figure 8 in the Table 1:
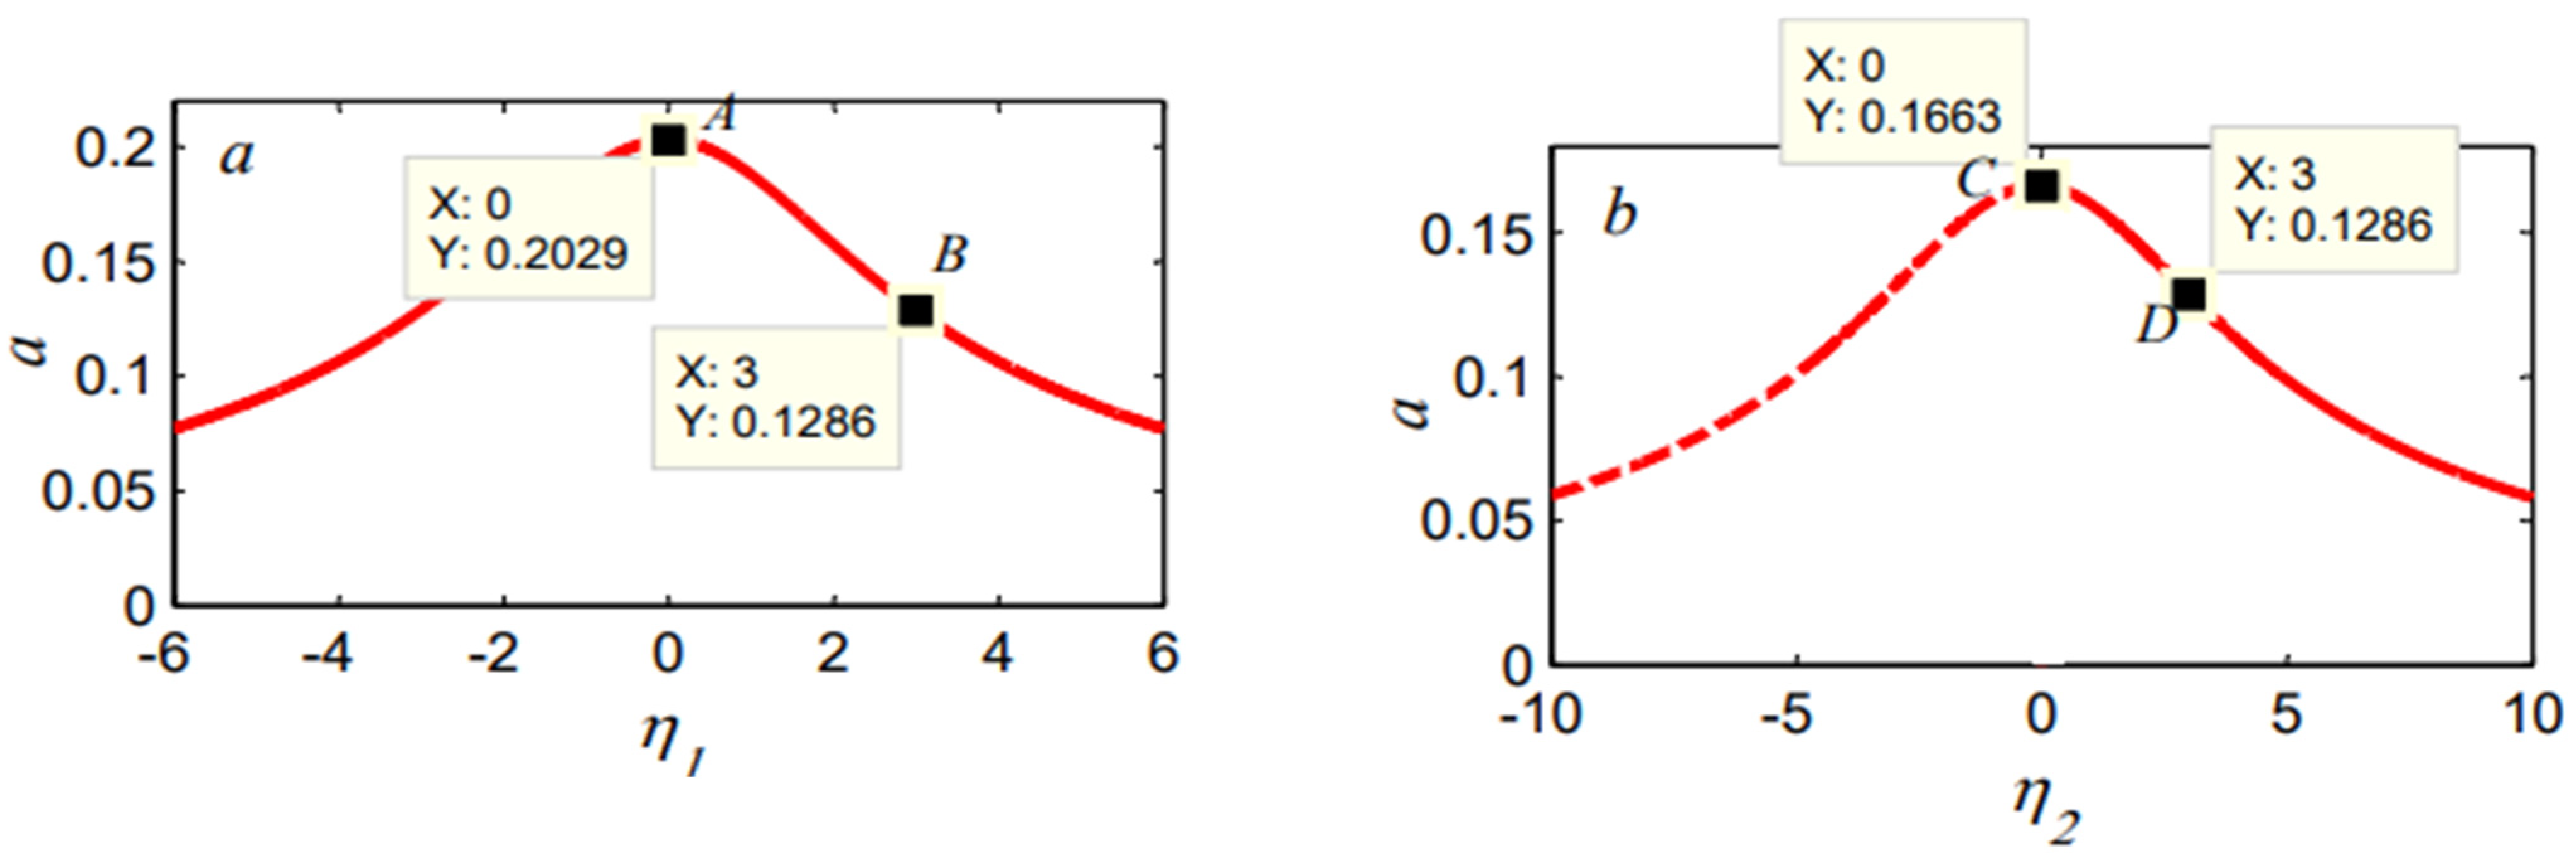
The effect of all parameters on the SD Oscillator after using the PD-Controller was illustrated numerically using the time history in Figure 9a, Figure 10a, Figure 11a, Figure 12a and Figure 13a at the primary resonance case (i.e., σ = 0 ). These figures show the applicability of numerical solutions, with approximate solutions shown in Figure 9b, Figure 10b, Figure 11b, Figure 12b and Figure 13b at the same values of the external force, the natural frequency, the damping coefficient, the proportional gain, and the derivative gain, respectively. Figure 9b clarifies the impact of increasing the external force on the frequency response curves, whereby increasing f , the amplitude of the SD Oscillator increases. The symmetric axis of the curves shifts away from the vertical axis σ = 0 . The derivative gain appends more damping to the SD amplitude as shown in Figure 10b, whereby increasing η 2 ; the amplitude of the SD Oscillator decreases, and the symmetric axis of the curves shifts away from the vertical axis σ = 0 . Figure 11b demonstrates that the amplitude is a monotonic decreasing function of the damping coefficient ζ . Increasing the values of the natural frequency and the proportional gain decreases the amplitude at σ = 0 and shifts the FRC peak to the right-hand and symmetric about different values of σ according to the values of the natural frequency and the proportional gain, as presented in Figure 12b and Figure 13b. The comparison between the FRC curves and the numerical simulation of Equation (2) at the resonance case Ω = ω + σ was presented in Figure 14 for the uncontrolled system (Figure 14a), the P-controller (Figure 14b), the D-Controller (Figure 14c), and the PD-Controller (Figure 14d). From this figure, we notice a high closeness between the numerical solutions (from time histories) and the approximate solutions (from perturbation analysis). In Figure 15, we plot the amplitude against the PD-Controller parameters η 1 and η 2 to clarify our results in the Figures. From Figure 15a at point A, the D-Controller was activated ( η 1 = 0 ,     η 2 = 3 ), so the value of the amplitude is equal to 0.2029, as the value we obtained from Figure 5. At point C in Figure 15b, the P-Controller was activated ( η 1 = 3 ,     η 2 = 0 ), so the value of the amplitude is equal to 0.1663, as the value we obtained from Figure 4. The amplitude has the same value, which is equal to 0.1268, at points B and D when the PD-Controller was activated ( η 1 = 3 ,     η 2 = 3 ), similar to the results we obtained from Figure 6.

4.3. Comparison with Previous Studies

In Ref. [20], the negative derivative feedback controller (NDF) was used to suppress the vibrations of the SD-Oscillator, but in this study, the PD-Controller was used to suppress the vibrations of the same system. We can conclude some differences between the two studies in the Table 2.

5. Conclusions

In this article, the PD-Controller is presented as a modified control model that combines features of the P-Controller and the D-Controller to suppress the vibrations of an SD-Controller. The investigated model has been introduced as a one-degree-of-freedom model. The frequency response equation of the controlled system was obtained using the perturbation technique for up to a second-order approximation. The influence of the various parameters on the steady-state amplitude has been illustrated. According to the introduced study, we can conclude the following:
(1)
Introducing the D-Controller to the SD-Oscillator has modified the damping coefficient;
(2)
Introducing the P-Controller to the SD-Oscillator has modulated the natural frequency;
(3)
The D-Controller and the P-Controller are not sufficient to suppress the vibrations of the SD Oscillator;
(4)
The PD-Controller combines features of the P-Controller and the D-Controller, so we used it to control the vibrating system;
(5)
The efficiency of the PD-Controller is about 61;
(6)
There is a high closeness between the numerical solutions (from time histories) and the approximate solutions (from perturbation analysis).

Author Contributions

Conceptualization, M.N.A.E.-S., R.K.H. and S.M.E.-S.; methodology, M.N.A.E.-S. and S.M.E.-S.; software M.N.A.E.-S.; validation, M.N.A.E.-S., R.K.H. and S.M.E.-S.; formal analysis, R.K.H. and S.M.E.-S.; investigation, M.N.A.E.-S. and R.K.H.; resources, M.N.A.E.-S., R.K.H. and S.M.E.-S.; data curation, S.M.E.-S.; writing—original draft preparation, R.K.H.; writing—review and editing, M.N.A.E.-S.; visualization, S.M.E.-S.; project administration, M.N.A.E.-S.; funding acquisition, R.K.H. All authors have read and agreed to the published version of the manuscript.

Funding

This work was supported and funded by the Deanship of Scientific Research at Imam Mohammad Ibn Saud Islamic University (IMSIU) (grant number IMSIU-DDRSP2503).

Data Availability Statement

Since no datasets were created or investigated for this paper, data sharing is not applicable.

Conflicts of Interest

The authors declare no conflicts of interest.

Nomenclature

z , d z d t , d 2 z d t 2 Position, velocity, and acceleration of the SD Oscillator.
ζ Linear damping coefficients of the SD Oscillator.
ω Linear natural frequency of the SD Oscillator.
Ω The external force frequency of the SD Oscillator.
f The external force of the SD Oscillator.s
β Nonlinearity coefficients.
η 1 The proportional gain of the SD Oscillator.
η 2 The derivative gain of the SD Oscillator.

References

  1. Zhao, Y.-Y.; Xu, J. Effects of delayed feedback control on nonlinear vibration absorber system. J. Sound Vib. 2007, 308, 212–230. [Google Scholar] [CrossRef]
  2. Xu, J.; Chung, K.W.; Zhao, Y.Y. Delayed saturation controller for vibration suppression in stainless-steel beam. Nonlinear Dyn. 2010, 62, 177–193. [Google Scholar] [CrossRef]
  3. Saeed, N.A.; El-Ganini, W.A.; Eissa, M. Nonlinear time delay saturation-based controller for suppression of nonlinear beam vibrations. Appl. Math. Model. 2013, 37, 8846–8864. [Google Scholar] [CrossRef]
  4. Liao, H. Stability analysis of duffing oscillator with time delayed and/or fractional derivatives. Mech. Based Des. Struct. Mach. 2016, 44, 283–305. [Google Scholar] [CrossRef]
  5. Andreaus, U.; Casini, P. Dynamics of friction oscillators excited by a moving base and/or driving force. J. Sound Vib. 2001, 245, 685–699. [Google Scholar] [CrossRef]
  6. Pia, P.F.; Nayfeh, A.H. Three-dimensional nonlinear vibrations of composite beams—I. Equations of motion. Nonlinear Dyn. 1990, 1, 477–502. [Google Scholar]
  7. Pia, P.F.; Nayfeh, A.H. Three-dimensional nonlinear vibrations of composite beams—II. Flapwise excitations. Nonlinear Dyn. 1991, 2, 1–34. [Google Scholar]
  8. Pia, P.F.; Nayfeh, A.H. Three-dimensional nonlinear vibrations of composite beams—III. Chordwise excitations. Nonlinear Dyn. 1991, 2, 137–156. [Google Scholar]
  9. Saeed, N.A.; Moatimid, G.M.; Elsabaa, F.M.F.; Ellabban, Y.Y. Time-delayed control to suppress a nonlinear system vibration utilizing the multiple scales homotopy approach. Arch. Appl. Mech. 2021, 91, 1193–1215. [Google Scholar] [CrossRef]
  10. Sun, X.; Xu, J.; Fu, J. The effect and design of time delay in feedback control for a nonlinear isolation system. Mech. Syst. Signal Process. 2017, 87, 206–217. [Google Scholar] [CrossRef]
  11. Mao, X.; Ding, W. Nonlinear dynamics and optimization of a vibration reduction system with time delay. Commun. Nonlinear Sci. Numer. Simul. 2023, 122, 107220. [Google Scholar] [CrossRef]
  12. Peng, J.; Zhang, G.; Xiang, M.; Sun, H.; Wang, X.; Xie, X. Vibration control for the nonlinear resonant response of a piezoelectric elastic beam via time-delayed feedback. Smart Mater. Struct. 2019, 28, 095010. [Google Scholar] [CrossRef]
  13. El-Shourbagy, S.M.; Saeed, N.A.; Kamel, M.; Raslan, K.R.; Abouel Nasr, E.; Awrejcewicz, J. On the Performance of a Nonlinear Position-Velocity Controller to Stabilize Rotor-Active Magnetic-Bearings System. Symmetry 2021, 13, 2069. [Google Scholar] [CrossRef]
  14. El-Shourbagy, S.M.; Saeed, N.A.; Kamel, M.; Raslan, K.R.; Aboudaif, M.K.; Awrejcewicz, J. Control Performance, Stability Conditions, and Bifurcation Analysis of the Twelve-Pole Active Magnetic Bearings System. Appl. Sci. 2021, 11, 10839. [Google Scholar] [CrossRef]
  15. Abd El-Salam, M.N.; Amer, Y.A.; Darwesh, F.O. Effect of negative velocity feedback control on the vibration of a nonlinear dynamical system. Int. J. Dyn. Control 2023, 11, 2842–2855. [Google Scholar] [CrossRef]
  16. Kay, I. Optimal PI–PD Controller Design for Pure Integrating Processes with Time Delay. J. Control Autom. Electr. Syst. 2021, 32, 563–572. [Google Scholar] [CrossRef]
  17. Junior, A.D.S.; Birkner, C.; Jazar, R.N.; Marzbani, H. Coupled lateral and longitudinal controller for over-actuated vehicle in evasive maneuvering with sliding mode control strategy. IEEE Access 2023, 11, 33792–33811. [Google Scholar] [CrossRef]
  18. Nayfeh, A.H. Problems in perturbation. Appl. Opt. 1986, 25, 3145. [Google Scholar]
  19. Santhosh, B.; Narayanan, S.; Padmanabhan, C. Discontinuity induced bifurcations in nonlinear systems. Procedia IUTAM 2016, 19, 219–227. [Google Scholar] [CrossRef]
  20. Amer, Y.A.; Abdullah, R.E.; Khaled, O.M.; Mahdy, A.M.S.; El-Salam, M.N. Vibration Control of Smooth and Discontinuous Oscillator via Negative Derivative Feedback. J. Vib. Eng. Technol. 2024, 12, 2351–2363. [Google Scholar] [CrossRef]
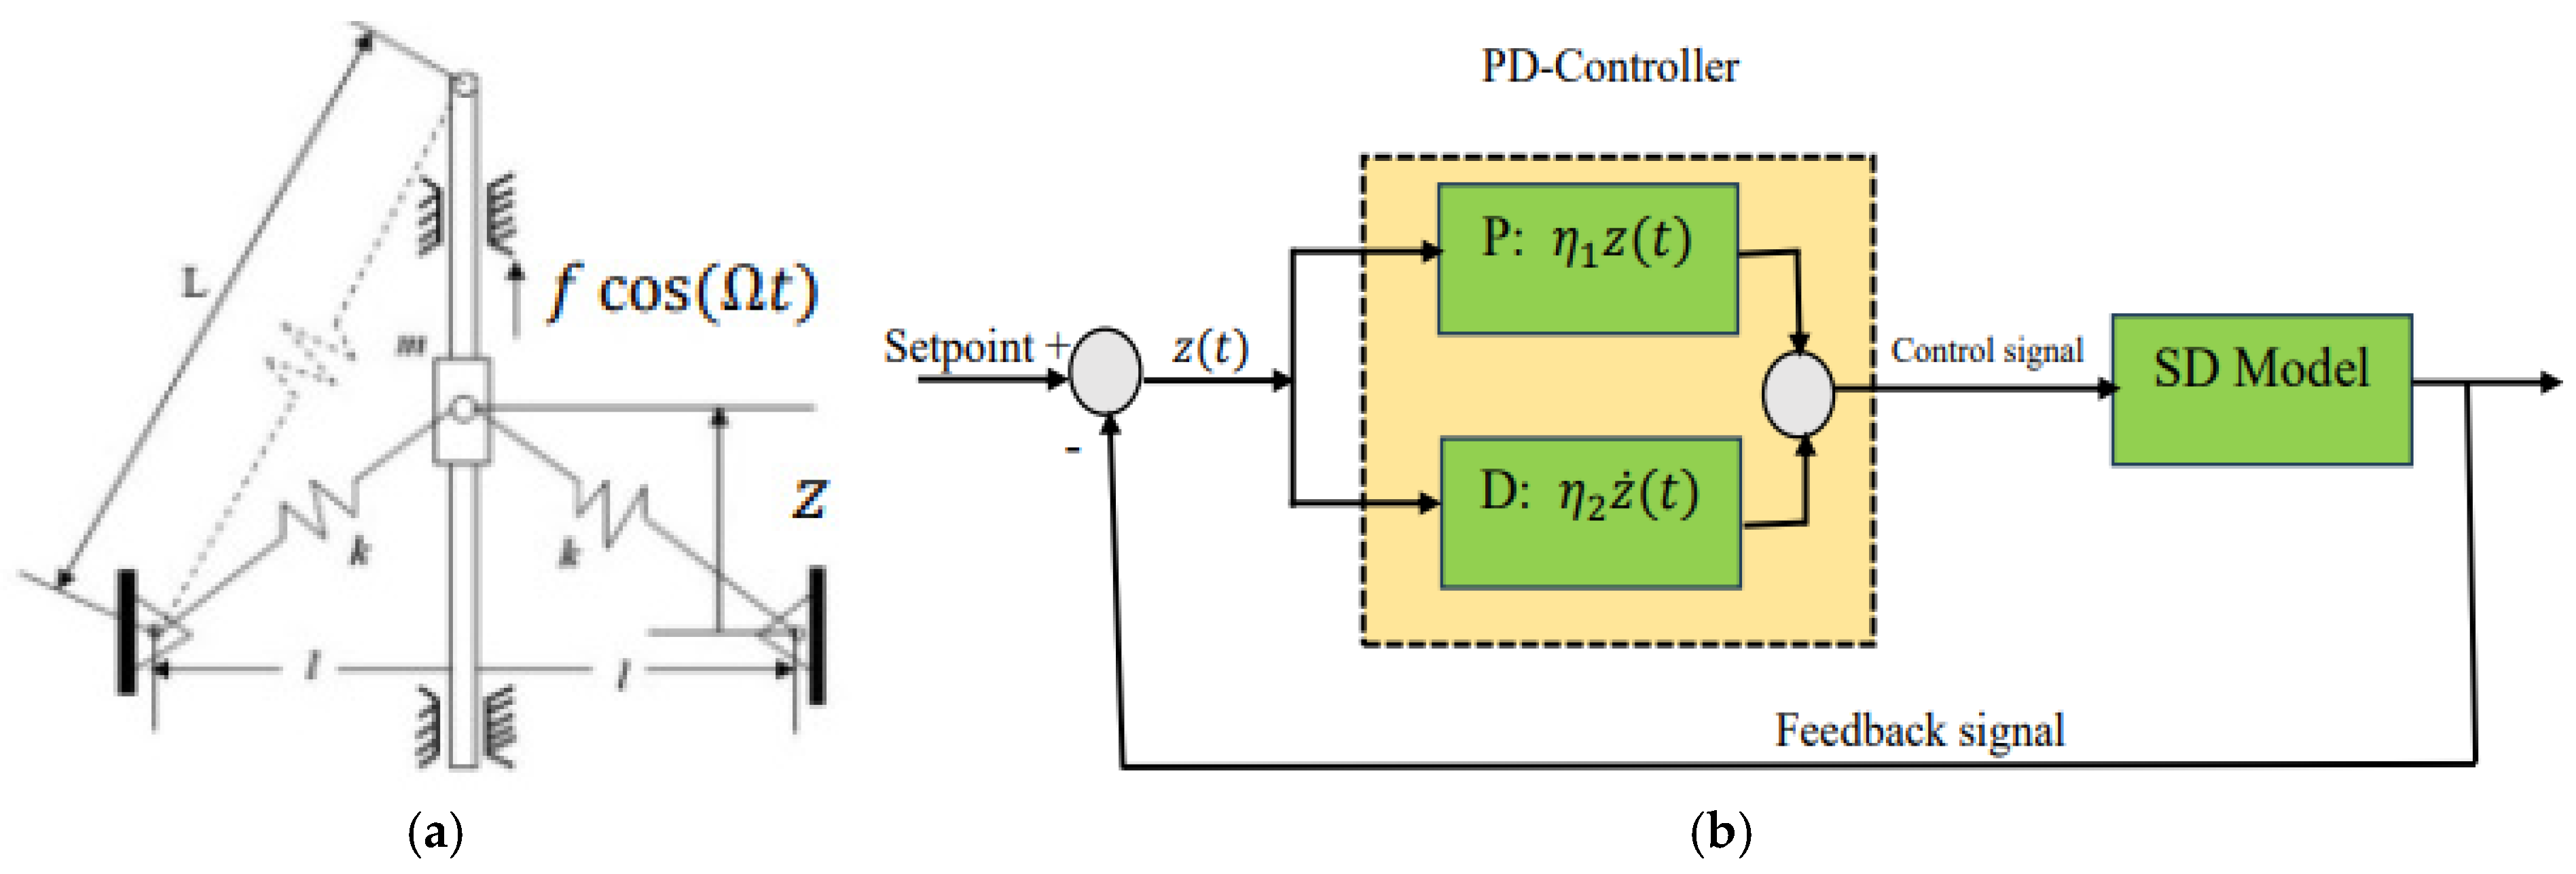
Figure 1. (a) The SD Oscillator schematic diagram, and (b) The Closed-loop control system of the SD Oscillator.
Axioms 14 00444 g001
Figure 2. (a) SD time histories without control, σ = 0 , ω = 0.8 ,     ζ = 0.08 ,     β = 0.01 ,     α = 5 ,     η 1 = η 2 = 0 and (b) σ -response curves corresponding to (a) at two different levels of the external force f = 0.5 and f = 1 .
Axioms 14 00444 g002
Figure 3. (a) The selected value of the proportional gain η 1 and (b) The selected value of the derivative gain η 2 at σ = 0 ,     ω = 0.8 ,     ζ = 0.08 ,     β = 0.01 ,     α = 5 ,     f = 0.5 .
Axioms 14 00444 g003
Figure 4. (a) SD time histories with P-Controller σ = 0 ,     ω = 0.8 ,     ζ = 0.08 ,     β = 0.01 ,     α = 5 ,     f = 0.5 ,     η 2 = 0 and (b) σ -response curves corresponding to (a).
Axioms 14 00444 g004
Figure 5. (a) SD time histories with D-Controller σ = 0 ,     ω = 0.8 ,     ζ = 0.08 ,     β = 0.01 ,     α = 5 ,     f = 0.5 ,     η 1 = 0 and (b) σ -response curves corresponding to (a).
Axioms 14 00444 g005
Figure 6. (a) SD time histories with PD-Controller σ = 0 ,     ω = 0.8 ,     ζ = 0.08 ,     β = 0.01 ,     α = 5 ,     f = 0.5 ,     η 1 = η 2 = 3 and (b) σ -response curves corresponding to (a).
Axioms 14 00444 g006
Figure 7. (a) Phase plane without control and (b) Phase plane with PD-Controller.
Axioms 14 00444 g007
Figure 8. A comparison between D-Controller (), P-Controller (), and PD-Controller ().
Axioms 14 00444 g008
Figure 9. (a) SD time histories with PD-controller σ = 0 ,     ω = 0.8 ,     ζ = 0.08 ,     β = 0.01 ,     α = 5 ,     η 1 = η 2 = 3 and (b) σ -response curves corresponding to (a) at two different levels of the external force f = 0.2 and f = 0.8 .
Axioms 14 00444 g009
Figure 10. (a) SD time histories with PD-controller σ = 0 = 0 ,     ω = 0.8 ,     ζ = 0.08 ,     β = 0.01 ,     α = 5 ,     η 1 = 3 ,     f = 0.5 and (b) σ -response curves corresponding to (a) at two different levels of the derivative gain η 2 = 1 and η 2 = 4 .
Axioms 14 00444 g010
Figure 11. (a) SD time histories with PD-controller σ = 0 ,     ω = 0.8 ,     β = 0.01 ,     α = 5 ,     η 1 = η 2 = 3 ,     f = 0.5 and (b) σ -response curves corresponding to (a) at two different levels of the damping coefficient ζ = 1 and ζ = 4 .
Axioms 14 00444 g011
Figure 12. (a) SD time histories with PD-controller σ = 0 = 0 ,     ζ = 0.08 ,     β = 0.01 ,     α = 5 ,     η 1 = η 2 = 3 ,     f = 0.5 and (b) σ -response curves corresponding to (a) at two different levels of the natural frequency ω = 0.3 and ω = 1.2 .
Axioms 14 00444 g012
Figure 13. (a) SD time histories with PD-controller σ = 0 ,     ω = 0.8 ,     ζ = 0.08 ,     β = 0.01 ,     α = 5 ,     η 2 = 3 ,     f = 0.5 and (b) σ -response curves corresponding to (a) at two different levels of the proportional gain η 1 = 1 and η 1 = 6 .
Axioms 14 00444 g013
Figure 14. A comparison between the FRC curves () and the numerical simulation (ooo).
Axioms 14 00444 g014
Figure 15. The amplitude against the PD-Controller parameters (a) η 1 -response curve and (b) η 2 -response curve.
Axioms 14 00444 g015
Table 1. Summary of results in Figure 8.
Control TypeAmplitude Before the ControllerAmplitude After the Controller E a Reduction Rate
P-Controller7.760.16634797.5%
D-Controller7.760.20293897%
PD-Controller7.760.12866198.5%
Table 2. Comparison between this study and Ref. [20].
FeatureThis StudyRef. [20]
Control type The PD-ControllerThe NDF-Controller
The resonance caseThe primary resonanceThe Simultaneous resonance
Analytical methodThe perturbation techniqueThe perturbation technique
Approximate solutionUp to the second approximationUp to the first approximation
Signal UsedPosition and its derivative Negative derivative signal filtered by a second-order system
Disclaimer/Publisher’s Note: The statements, opinions and data contained in all publications are solely those of the individual author(s) and contributor(s) and not of MDPI and/or the editor(s). MDPI and/or the editor(s) disclaim responsibility for any injury to people or property resulting from any ideas, methods, instructions or products referred to in the content.