Abstract
This paper introduces a linear algebraic approach for forecasting time-series trends, leveraging a theoretical model that transforms historical stock data into matrices to capture temporal dynamics and market patterns. By employing an analytical approach, the model predicts future market movements through delayed patternized time-series machine learning training, achieving an impressive accuracy of 83.77% across 10,539 stock data samples. The mathematical proof underlying the framework, including the use of validation matrices and NXOR operations, ensures a structured evaluation of predictive accuracy. The binary trend-based simplification further reduces computational complexity, making the model scalable for large datasets. This study highlights the potential of linear algebra in enhancing predictive models and provides a foundation for future research to refine the framework, incorporate external variables, and explore alternative machine learning algorithms for improved robustness and applicability in financial markets. The primary advantages of employing linear algebra in this research lay in its ability to systematically structure high-dimensional financial data, enhance computational efficiency, and enable rigorous validation. The results indicate not only the efficacy in trend forecasting but also its potential applicability across various financial settings, making it a valuable tool for investors seeking data-driven insights into market trends. This research paves the way for future studies aimed at refining forecasting methodologies and enhancing financial decision-making processes.
Keywords:
stock market prediction; linear algebra; machine learning; time-series prediction; forecasting; computational finance MSC:
62A99; 62H12; 62H20; 68T99; 68Q32
1. Introduction
Financial markets constitute dynamic ecosystems characterized by intensive analysis, trading, and the systematic exploration of diverse instruments such as stocks, bonds, and derivatives. These markets offer substantial opportunities for researchers and investors spanning diverse academic and professional fields. Trading behaviors—including decisions on asset acquisition/divestment, forecasting market trends, and optimizing portfolio allocations—exhibit significant variability across individuals and are influenced by distinct experiential backgrounds, expertise, and strategic frameworks. Analysis of these complex markets typically integrates historical stock market data with external influencing factors to identify and derive underlying market patterns. A foundational theoretical framework, the efficient market hypothesis (EMH), posits that financial asset prices inherently reflect all available market-related information [1,2]. Nevertheless, the EMH remains contentious, with persistent scholarly debate questioning its validity and real-world applicability in trading contexts. Time-series analysis constitutes a critical component of data analysis, extracting insights from historical data to track current evolutions and project future trajectories of phenomena [3]. Stock price forecasting, inherently complex, requires analysis of extensive datasets. Recent research prioritizes machine learning techniques to assess their efficacy in improving market predictions compared to conventional approaches. Specific timeframe-based stock trend anticipation further drives this interest. Methodological diversity, particularly with machine learning algorithms, underpins these predictive efforts. The Autoregressive Integrated Moving Average (ARIMA) model and its variants dominate as prevalent forecasting frameworks in finance, economics, and stock prediction, demonstrating efficacy in short-term forecasting applications [4,5]. Advancements in computational capabilities have driven researchers toward machine learning techniques for time-series stock forecasting, employing diverse methods to optimize predictive outcomes [6,7]. Several studies have conducted in-depth analysis in which researchers have created a comprehensive feature vector consisting of multiple prior relative returns [8]. They have found that the chances of both the random walk hypothesis and the efficient market hypothesis being valid within the context of their research is notably low. Expanding upon this groundwork, comprehensive investigations into the effectiveness of various machine learning models have been conducted, specifically aimed at predicting the daily prices of five significant global stock indices over an extended period [9]. Moreover, numerous studies have adapted various machine learning techniques for enhancements in time-series forecasting. They have aimed to utilize the period-correlation mechanism to decipher evolving trends in the stock market and to reveal historical relationships for precise and broadly applicable forecasting [10,11]. Certain studies have focused on integrating discretization (or patterning) techniques into time-series predictions [12,13,14]. These techniques aim to minimize the discrepancies between actual and predicted data, as well as to estimate performance measure errors (e.g., mean squared error, absolute error, and root mean squared error). It is important to note that maximizing trend accuracy is a more effective approach than merely minimizing errors when predicting the stock market. This is because an investor can still incur losses if a trend prediction is incorrect, even if the error is minimized. The concept of maximizing the accuracy of the trends in time-series prediction has not been previously explored, and this paper lays the groundwork for measuring trend accuracy rather than focusing solely on error reduction.
A delayed patternized time-series model is introduced for transforming historical stock data into matrices, capturing both temporal dynamics and associated patterns. The primary advantages of employing linear algebra in this research lay in its ability to systematically structure high-dimensional financial data, enhance computational efficiency, and enable rigorous validation. Linear algebraic constructs provide interpretable and quantifiable accuracy metrics by comparing predicted and actual patterns element-wise. Additionally, this paper simplifies the machine learning training process by focusing on binary trend patterns (up or down), which reduces computational complexity while maintaining high accuracy. The use of validation matrices, such as NXOR operations, provides a structured method for evaluating the predictive accuracy of the model. This theoretical work not only advances the field of computational finance but also offers a scalable and efficient tool for investors seeking data-driven insights into market trends. Unlike existing methodologies that predominantly rely on conventional models, this innovative framework introduces a binary trend-based simplification that effectively captures market patterns and temporal dynamics. The transformation of historical stock data into structured matrices allows for systematic analysis and enhances computational efficiency. These findings underscore the capability of the model to improve predictive accuracy significantly while reducing computational complexity, a combination not extensively explored in the current literature. Hence, the outlined contributions not only fill a noticeable gap in the existing body of research but also provide a foundation for future studies aimed at enhancing forecasting methodologies in various financial markets.
The Kelly Criterion Extension (KCE) modernizes the traditional Kelly Criterion (KC) by adapting capital growth strategies to dynamic market conditions, making it especially beneficial in volatile environments like stock and commodity trading [15]. KCE enhances risk management by focusing on the actions of market players instead of direct asset investments, allowing for optimal capital allocation based on fluctuating circumstances. Unlike the KC, which assumes a static investment approach, the KCE embraces fluid market behaviors, providing investors with tailored strategies that optimize expected returns while minimizing risks. This innovative framework leads to significant benefits, such as improved adaptability and increased profit potential during varying market states. Furthermore, KCE can be integrated with advanced machine learning algorithms to analyze historical data and enhance forecasting models, representing a fascinating evolution in gambling strategies to enhance financial success. By examining behavioral trends of market participants rather than merely odds, KCE positions itself as a superior approach for both betting and investment, aligning closely with modern financial strategies that demand flexibility and adaptability across diverse investment landscapes. The application of delayed patronized time-series forecasting in KCE allows investors to adjust their strategies based on time-lagged data patterns. This integration helps calibrate investment allocations more effectively by predicting future returns and optimizing risk management in volatile markets through enhanced foresight. The major contribution of this paper lays in its innovative integration of linear algebra and machine learning for forecasting time-series trends, specifically in the context of stock market prediction. A critical parameter for investment is the winning probability from the KC and and the winning betting rate from the KCE [15]. Patternized machine learning (ML) techniques are explored for enhancing winning probabilities using real-time stock market data [16]. This ML-driven predictive model can be integrated into both KC- and KCE-based investment systems to maximize investment returns. It is evident that a higher winning rate translates to greater investment returns, provided that all other conditions or parameters remain consistent. This study primarily aims to establish the theoretical groundwork and mathematical confirmations essential for incorporating ML-based patternized forecasting models [16] with optimized winning rate parameters within autonomous investment systems. These systems employ a variety of investment strategy frameworks, including the KC and its extension [15].
This paper is structured into four sections, each contributing to the development and evaluation of a linear algebraic approach for time-series forecasting. Section 1 sets the context by discussing the challenges of stock market prediction and the limitations of traditional methods. Section 2 introduces the theoretical framework, detailing the transformation of time-series data into matrices using marked point processes and grid-based patterns. Section 3 explains the delayed training approach, enabling the prediction of future patterns based on current data. The preliminary results of the binary time-series trend-based ML forecasting [16] are also introduced in this section. A newly proposed model from other research [16] simplifies the model by focusing on binary trends (up or down), reducing computational complexity while maintaining high accuracy. Finally, this paper summarizes the achievements of the model, acknowledges limitations, and suggests future research directions in Section 4.
2. Linear Algebraic Approach for Time Series
The time-series process might describe the price in the stock market at the time t and let be the price change in stock during the k-th observation period . A more detailed description of this process is rendered by the means of a generic marked point process:
with the -dependent position marked where is the point mass. The two-variated sequences of the random vectors can be found by time-series data collection. The -by-n fixed grids are horizontally mapped with each observation duration (i.e., the duration of the observation duction is horizontally divided by n grids). The price change within determines the top and the bottom of the vertically ranged grid (see Figure 1).
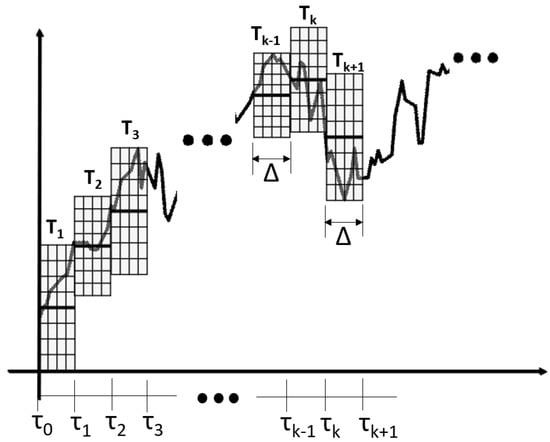
Figure 1.
Patternazing the time-series [16].
The -by-n fixed grids are transformed into the matrices and let us consider the patterned time-series matrix which can be described follows:
where represents the binary state (either 0 or 1) of each component within the pattern . Additionally, the last column of is the patterned trend that can be calculated as follows:
which is the matrix for transforming from the patterned time series to the patterned trend , and is a n-by-1 transforming matrix which changes the patterned trend from the patterned time series . It is noted that is exactly same as the last column of where :
which contains total trend patterns which indicates full trends (i.e., classifications of the trends). It is noted that the trend patterns could be simplified as compact trends (either ups and downs) by determining as follows:
and becomes either
where , from (3) and (5). Let us assign as the predicted pattern of the actual time-series pattern at the moment ; the predicted patterns are usually obtained by a machine learning system. It is noted that the trend matrix indicates the binary trends (either up or down) and its trend matrix (i.e., binary trend matrix) which can be defined as follows:
where from (5) and (6). Let be the validation matrix which is a non-exclusive OR (NXOR or XNOR) between predicted and actual patternized matrices. The XNOR operation initially originates from a digital logic gate whose function is the logical complement of the Exclusive OR (XOR) gate [17]. It is equivalent to the logical connective from the mathematical logic operation. The two-input version implements logical equality; an output of one (1) results if both of the inputs are the same. If not, and both inputs are different, the result of the output is zero (0). The validation matrix for the time-series patterns by adapting the NXOR operation can be described as follows:
and (according to NXOR operations) could be an all-ones matrix (i.e., ; , ) only if the predicted patterned matrix is fully matched with the actual matrix . Alternatively, the validation matrix can be also constructed by adapting the patternized trend matrix from (4) which can be defined as follows:
and can also be an all-ones matrix (i.e., ; ) when and are fully matched. If and are not matched, the elements in the mismatched position will be zero (0) instead of one (1). Hence, an accuracy of a predicted matrix (either time series or trend patterns) could be calculated by counting the number of elements in or . The accuracies of the patternized time series and trend matrices at each moment, , are determined as follows:
The accuracy of overall stock changes can be determined as follows:
where N is the total number of patterns for the entire time series; is the forecasting accuracy based on the full patterns from (8); and is the forecasting accuracy based on the (full, compact, binary) trends from (4) or (6) or (7) and (9). Other classical performance measures including precision, recall, F1-score, and specificity could be easily calculated after counting the number of each trend (i.e., the number of ups and the number of downs of testing stock samples).
3. Delayed Patternized Time-Series Machine Learning Training
Once a continuous time-series process becomes patternized, these patterns can be used for machine learning (ML) training. Originally, ML training was designed to construct the predicted patterns which reflect the current time-series status at the moment of , but the ML training phase could be designed to construct the predicted patterns based on the future (i.e., ) by adapting the delayed time-series ML training. Unlike the original time-series patterning model, the delayed time-series model could predict the patterns which reflected the pattern at the moment of (see Figure 2).
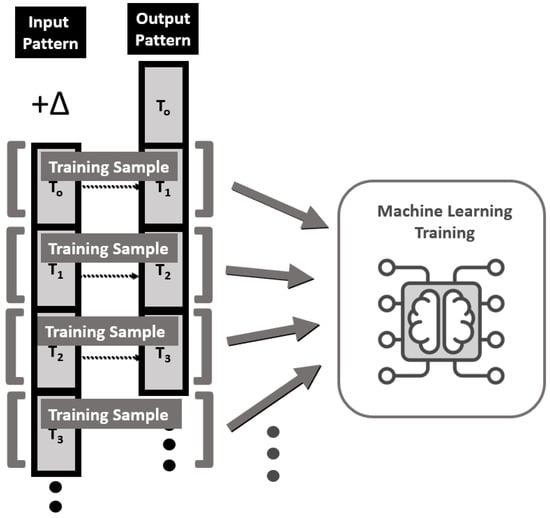
Figure 2.
Machine learning training for delayed time series [16].
Alternatively, the ML forecasting model which is based on binary time-series trends streamlined the forecasting process by transforming complex, patterned time-series data into simple binary trends (either up or down) [16]. Binary trend-pattern-based machine learning forecasting was useful to simplify the ML training. The full patternized time series from (2) contains a greater number of classifications which requires heavy computation compared to the number of classifications of the patternized trend from (7). The ML-based forecasting system, by adapting the binary time-series trend, could be designed accordingly. This approach minimized computational demands while maintaining predictive accuracy. The straightforward experiment demonstrated how to apply the fundamental theory of linear algebra in conjunction with the decision tree machine learning algorithm. Decision tree (DT) learning is a supervised learning method utilized in statistics, data mining, and machine learning contexts. In the experiment, a classification or regression decision tree was used as a predictive model to draw conclusions about a set of observations [18,19]. S&P 500 stock changes were collected daily, with closing prices for these stocks, over the period from 2010 to 2024 [20]. Each pattern, , from (2) contained an eight-by-four grid (i.e., ) and each horizontal grid indicated one day (i.e., ). The patternized time series were paired with the original time series as inputs and delayed time series as outputs for ML training (see Figure 2). From (3), (5), and (7), the binary trend of each time series could be calculated simultaneously.
The framework for utilizing time-series data in stock market forecasting through a machine learning approach is illustrated in Figure 3. Pattern prediction machine learning (ML) processed these patterns to generate a predicted output, , which was the binary trends (either up and down). This ML-based forecasting system emphasizes the significance of pattern recognition and forecasting in financial analytics, showcasing how machine learning can leverage historical data to predict future stock performance, thus facilitating informed investment decisions. Overall, it reflects a systematic approach to enhancing the accuracy of financial predictions. The initial experiment [16] revealed overall accuracies ranging from 52% to 84%, derived from (11) using over 100,000 patterned time-series data from various stocks. Theoretically, a stock market trend forecasting model is beneficial if it achieves an accuracy exceeding 50%. These impressive forecasting accuracies illustrate the effectiveness of the binary trend-based approach, positioning it as a valuable tool for predicting stock market trends.
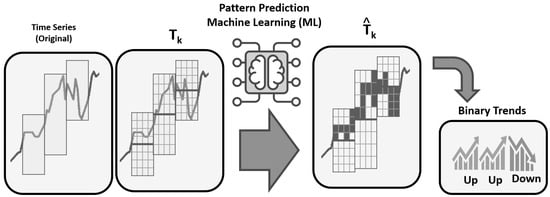
Figure 3.
Binary trend-adapted machine learning-based forecasting design [16].
4. Conclusions
The study introduces a linear algebraic approach to forecasting time-series trends, leveraging an analytical model that transforms financial data into matrices to capture temporal dynamics and market patterns. By transforming time-series data into matrices and employing delayed patternized models, the framework effectively captures temporal dynamics and market patterns, offering a scalable and efficient tool for financial forecasting. The binary trend-based simplification further reduces computational complexity, making the model practical for large-scale applications. However, this paper acknowledges significant limitations, including potential overfitting due to reliance on a specific dataset and the exclusion of broader economic factors that could influence market behavior. These limitations highlight the need for future research to enhance the robustness of the model by incorporating external variables and exploring alternative machine learning algorithms. Despite these challenges, the study makes a valuable contribution to computational finance, demonstrating the potential of linear algebra in improving predictive accuracy and providing actionable insights for investors. Future work should focus on refining the model to address its limitations and expand its applicability across diverse financial markets.
Funding
This work was supported in part by the Macao Polytechnic University (MPU), under Grant RP/FCA-05/2024.
Data Availability Statement
The dataset is available in the Kaggle repository (https://www.kaggle.com/datasets/zhanzeqiye/delayed-binary-time-series-pattern-forecasting, accessed on 31 January 2025).
Acknowledgments
This paper was revised using AI/ML-assisted tools. Special thanks are extended to the reviewers who provided valuable advice for improving this paper.
Conflicts of Interest
The author declares no conflict of interest.
References
- Sewell, M. History of the efficient market hypothesis. Rn 2011, 11, 04. [Google Scholar]
- Malkiel, B.G. Efficient Market Hypothesis; Springer: Berlin/Heidelberg, Germany, 1989; pp. 127–134. [Google Scholar]
- Maharani, F.A.; Ivana, S.; Fithriyah, B.; Zakiyyah, A.Y.; Sihotang, E.F.A. Time Series Forecasting Using LSTM to Predict Stock Market Price in the First Quarter of 2024. In Proceedings of the 2024 International Conference on Smart Computing, IoT and Machine Learning (SIML), Surakarta, Indonesia, 6–7 June 2024; pp. 74–80. [Google Scholar]
- Shah, H.; Bhatt, V.; Shah, J. A Neoteric Technique Using ARIMA-LSTM for Time Series Analysis on Stock Market Forecasting. In Mathematical Modeling, Computational Intelligence Techniques and Renewable Energy; Sahni, M., Merigó, J.M., Sahni, R., Verma, R., Eds.; Springer Nature: Singapore, 2022; pp. 381–392. [Google Scholar]
- Ma, Q. Comparison of ARIMA, ANN and LSTM for Stock Price Prediction. In Proceedings of the 2020 International Symposium on Energy, Environmental Science and Engineering (ISEESE 2020), Chongqing, China, 20–22 November 2020. 5p. [Google Scholar]
- Zhang, L.; Zhao, M.; Feng, Z. Research on knowledge discovery and stock forecasting of financial news based on domain ontology. Int. J. Inf. Technol. Decis. Mak. 2019, 18, 953–979. [Google Scholar] [CrossRef]
- Mintarya, L.N.; Halim, J.N.; Angie, C.; Achmad, S.; Kurniawan, A. Machine learning approaches in stock market prediction: A systematic literature review. Procedia Comput. Sci. 2023, 216, 96–102. [Google Scholar] [CrossRef]
- Htun, H.H.; Biehl, M.; Petkov, N. Forecasting relative returns for S&P 500 stocks using machine learning. Financ. Innov. 2024, 10, 118. [Google Scholar]
- Zheng, J.; Xin, D.; Cheng, Q.; Tian, M.; Yang, L. The Random Forest Model for Analyzing and Forecasting the US Stock Market in the Context of Smart Finance. arXiv 2024, arXiv:2402.17194. [Google Scholar]
- Wang, C.; Chen, Y.; Zhang, S.; Zhang, Q. Stock market index prediction using deep Transformer model. Expert Syst. Appl. 2022, 208, 118128. [Google Scholar] [CrossRef]
- Tao, Z.; Wu, W.; Wang, J. Series decomposition Transformer with period-correlation for stock market index prediction. Expert Syst. Appl. 2024, 237, 121424. [Google Scholar] [CrossRef]
- Rabanser, S.; Januschowski, T.; Flunkert, V.; Salinas, D.; Gasthaus, J. The Effectiveness of Discretization in Forecasting: An Empirical Study on Neural Time Series Models. arXiv 2005, arXiv:2005.10111. [Google Scholar]
- Chang, J.R.; Liu, C.C. A fuzzy time series model based on N-th Quantile Discretization Approach for TAIEX forecasting. In Proceedings of the 2013 5th International Conference on Knowledge and Smart Technology (KST), Chonburi, Thailand, 31 January–1 February 2013; pp. 5–10. [Google Scholar]
- Changqing, Z.; Chengzhi, L. Research on Railway Passenger Traffic Volume Forecasting Method. In Proceedings of the 2009 International Forum on Information Technology and Applications, Chengdu, China, 15–17 May 2009; Volume 1, pp. 279–282. [Google Scholar]
- Kim, S.K. Kelly Criterion Extension: Advanced Gambling Strategy. Mathematics 2024, 12, 1725. [Google Scholar] [CrossRef]
- Zhan, Z.; Kim, S.K. Novel Delayed Binary Time-Series Pattern Based Machine Learning Techniques for Stock Market Forecasting. 2025; submitted. [Google Scholar]
- Tutorials, E. Exclusive-NOR Gate Tutorial. 2020. Available online: https://www.electronics-tutorials.ws/logic/logic_8.html (accessed on 31 January 2025).
- Shalev-Shwartz, S.; Ben-David, S. Understanding Machine Learning; Cambridge University Press: Navi Mumbai, India, 2014. [Google Scholar]
- Afriyie, J.K.; Tawiah, K.; Pels, W.A.; Addai-Henne, S.; Dwamena, H.A.; Owiredu, E.O.; Ayeh, S.A.; Eshun, J. A supervised machine learning algorithm for detecting and predicting fraud in credit card transactions. Decis. Anal. J. 2023, 6, 100163. [Google Scholar] [CrossRef]
- Vijh, A.M. S&P 500 Trading Strategies and Stock Betas. Rev. Financ. Stud. 1994, 7, 215–251. [Google Scholar]
Disclaimer/Publisher’s Note: The statements, opinions and data contained in all publications are solely those of the individual author(s) and contributor(s) and not of MDPI and/or the editor(s). MDPI and/or the editor(s) disclaim responsibility for any injury to people or property resulting from any ideas, methods, instructions or products referred to in the content. |
© 2025 by the author. Licensee MDPI, Basel, Switzerland. This article is an open access article distributed under the terms and conditions of the Creative Commons Attribution (CC BY) license (https://creativecommons.org/licenses/by/4.0/).