1. Introduction
The immunotherapy approach includes modifying the tumor–immune system interaction. in order to more effectively eliminate cancer cells [
1]. As a result, the relationship between cancer cells and immune cells has received increased attention and has been examined using several mathematical models of cancer diffusion ([
2] and references therein, [
3,
4,
5]).
An approach is to use a predator–prey model as an example [
6,
7,
8,
9,
10], which describes the system as a deterministic system with stable limit cycle behavior. As a result, the solution shows a delicate dependence on the initial values. This may result in a limit cycle attractor or a series of nested closed loops where both variables change frequently throughout time [
6,
11,
12,
13,
14].
The predator–prey model, which was originally proposed by Lotka and Volterra [
15,
16], takes the following form:
Equation (
1) is used to describe how predator–prey fish populations have evolved and has four parameters: the prey growth rate
, the prey mortality rate
, the predator mortality rate
, and the predator growth rate
. In our model, we assume that the predator
represents the population of cancer cells at the time
t that are attacked by immune cells and
represents the population of immune cells at the time
t that kills cancer cells.
and
represent how immune cells eliminate cancer cells and how immune cells can proliferate in response to the presence of cancer. In the case of
, the following formula predicts that the prey population will increase exponentially:
When the prey quantity is high, predation does not slow down. General predation depends on the number of prey and predators. With
and
as initial conditions, the model exhibits stable limit cycle behavior, with no trend either towards the equilibrium point or away from it [
8,
17,
18,
19]. As long as there is insufficient competition between the two species, the two populations can coexist stably but will never reach their carrying capacity. Sheriff et al. [
20] noticed that predicting the consequence of the population is therefore difficult due to the intricate relationship between the dynamics of the environmental context, the risk of predation, and the responses of the prey. On the other hand, some researchers show how multiple-equation and innovation accounting time series approaches are useful to study the way variables react to unexpected changes in other variables. The analysis is carried out in the context of a predator–prey system. Furthermore, we use model fitting to see if the nature of the functional response can be inferred from typical ecological predator–prey time series data [
21,
22,
23].
By making the equations in (
1) equal to zero (
), we obtain all the equilibrium points for the system. Analytically, two fixed points are found: the first is at the origin (
), and the second point, which depends on the system parameters, is (
). By analyzing the eigenvalues of the Jacobian matrix at each of these sites, we analyze their stability. In Equation (
1), the Jacobian of the dynamics is provided by
Using the two equilibrium points mentioned above, we analyze the eigenvalues of
in Equation (
3). For the first point,
, we obtain one positive eigenvalue and one negative eigenvalue, indicating that it is an unstable saddle point. On the other hand, panel (c) in
Figure 1 shows that the second point,
, is a center. This center represents the oscillating behavior of conflict between the prey and predators (for food, nesting locations, etc.). It is distinguished by its oscillation frequency, or the number of cycles per unit of time around the center of the phase diagram.
Figure 1a,b show the time series of the prey (
x) and predator (
y) populations for two distinct initial conditions:
and
, respectively. Panel (c), which presents the phase portrait
, demonstrates the corresponding changes in prey and predator densities for these initial conditions. Starting with
generates a larger elliptical phase trajectory, while the initial condition
results in a smaller, more compact phase plot; this highlights the sensitivity of the system’s dynamics to initial conditions. The behavior of the model described by Equation (
1) can vary significantly depending on its initial conditions. The parameter values used in
Figure 1 (
,
,
,
) are consistent with those in [
6].
It is essential to assess the sustainability of predator–prey populations when variability influences the dynamics of the model. Random variations, such as individual biases or environmental factors, for example, the unsuitability of certain habitats for specific species, are significant contributors to both intraspecific and interspecific variability [
16,
24,
25,
26].
1.1. Changes in the Prey Mortality Rate
To examine the effect of the mortality rate of the prey
b, we keep all other parameters constant:
;
; and
. We also set the initial conditions to
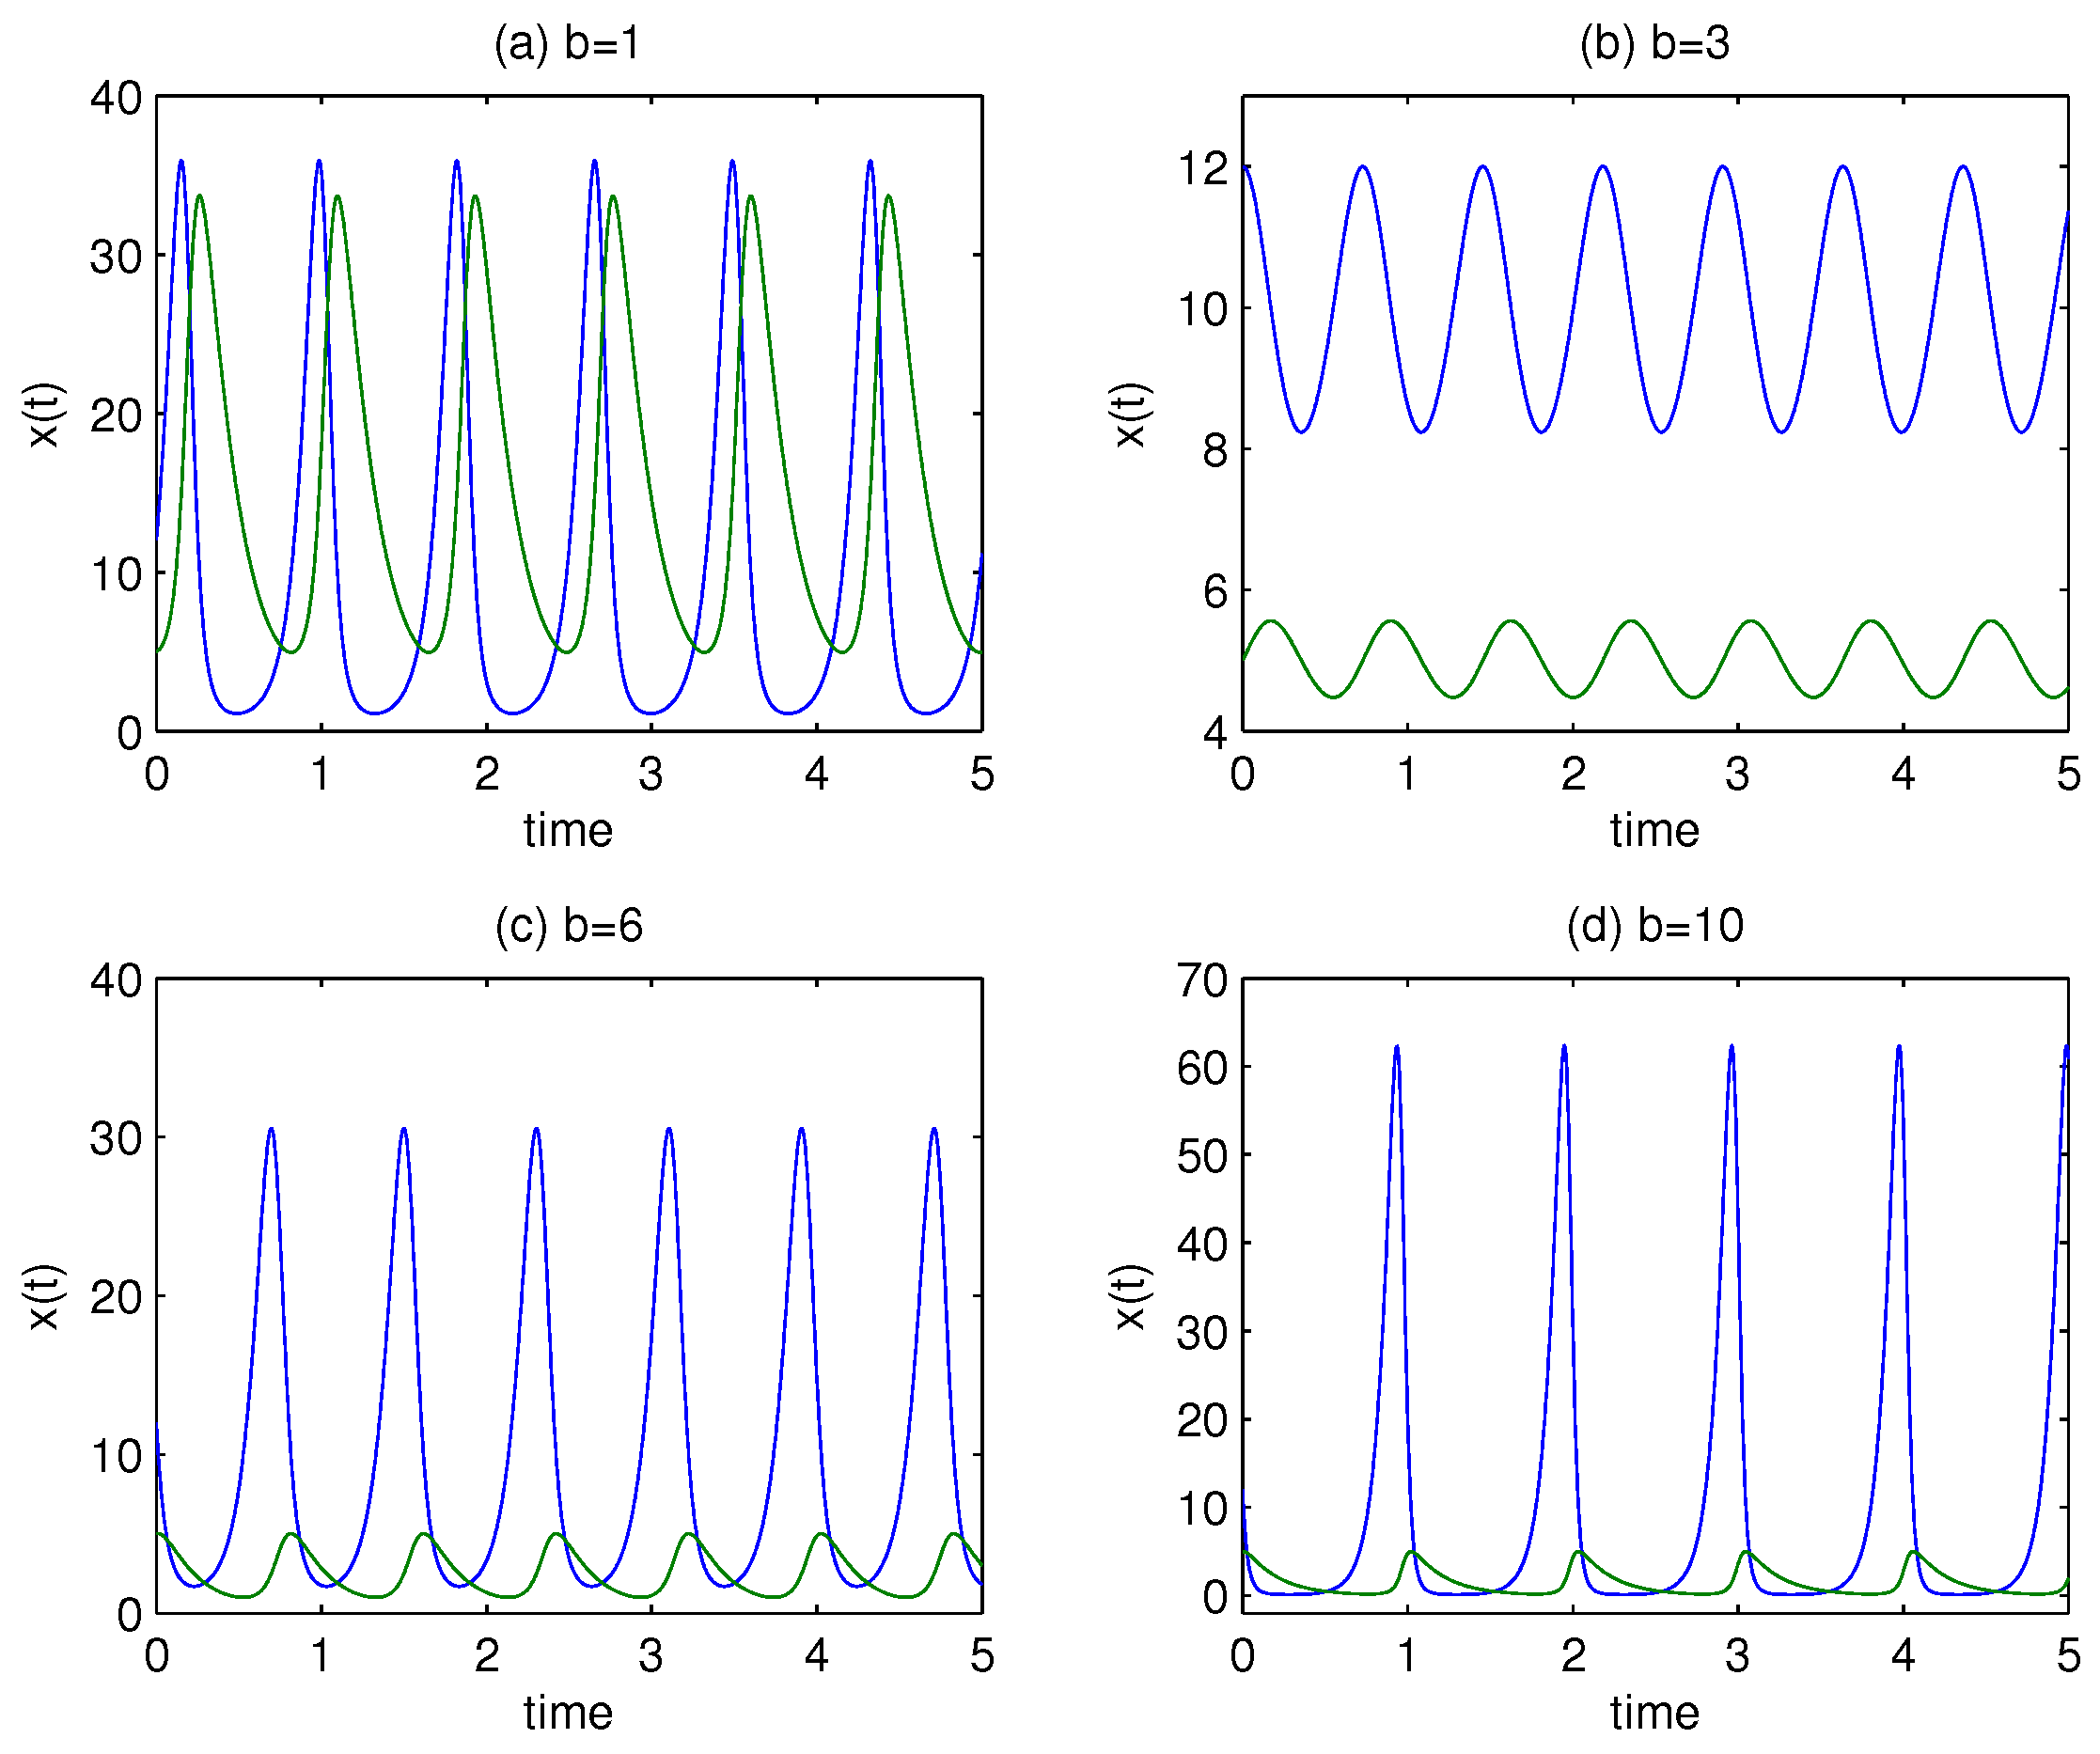
. The results for various values of
b are shown in
Figure 2.
It is clear from
Figure 2 that the dynamic of the model depends on the value of
b. In particular, panel (b) shows that there is no intersection between immune cells (green line) and cancer cells (blue line), resulting in a condition with lower variability. However, as is obvious from panels (c) and (d), both species spend a lot of time close to the equilibrium point. Adjusting the mortality rate of the prey
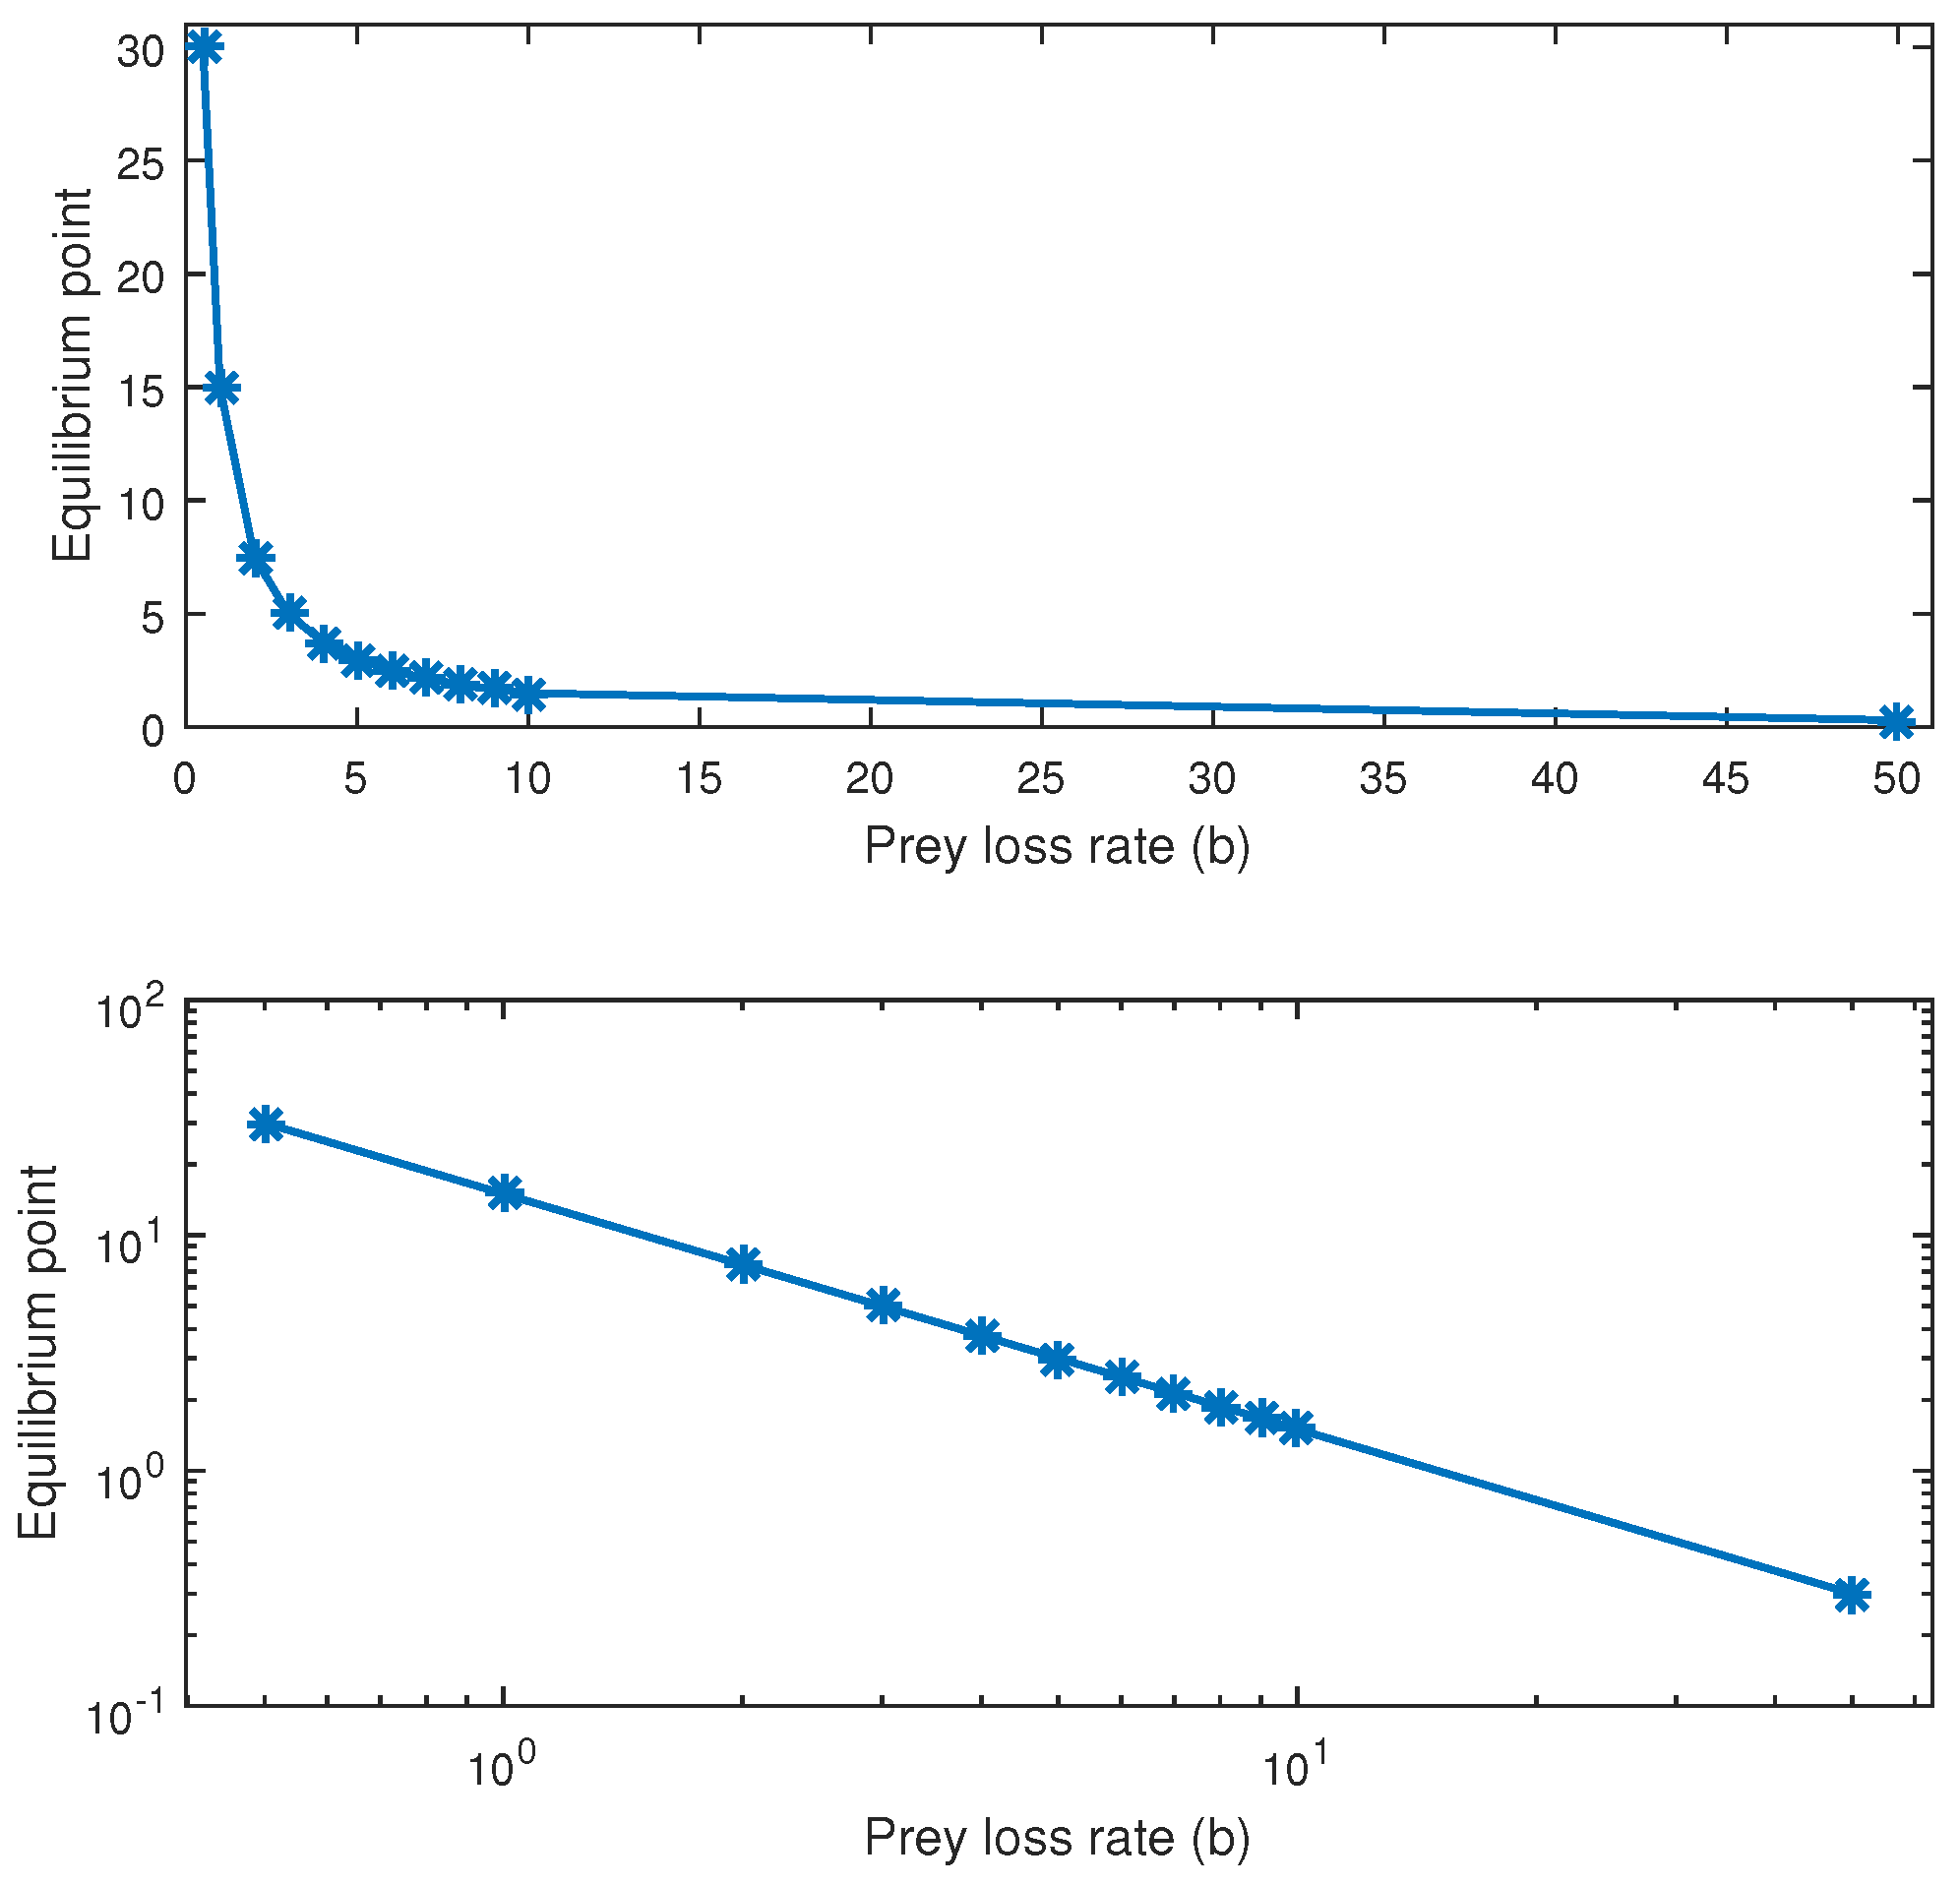
b causes the equilibrium points to decrease monotonically. The reason for this is that the equilibrium points of the predator–prey model are
and
, with the second equilibrium point entirely dependent on the model parameters
and
e. Therefore, as
Figure 3 illustrates,
completely depends on the value of
b for given
and
e.
As we can see in
Figure 3, there is a power-law relationship between the prey mortality rate and the
y values of the equilibrium points. As the mortality rate of prey (the death rate of cancer cells) increases, the upper panel of
Figure 3 shows a flattening of the fluctuation of the immune population around the equilibrium point.
1.2. Probability Density Function and Fisher Information for Predator–Prey Model
To examine the dynamic behavior of the system under conditions of variability and uncertainty, probabilistic tools are indispensable. They provide critical insights into how the system transitions between states and how the distribution of these states reflects its behavior, stability, and sustainability. Using the method proposed by Cabezas [
6,
8], we determine the Probability Density Function (PDF) of the state variable
x, which represents the tumor cell population at the time
t. This is performed by considering the conservation of probability, which relates the probability of observing the system in a given state,
x, to the amount of time the system spends in that state.
Since the total probability remains invariant under a change in variables, and assuming that the time
t has a uniform probability density (i.e., all time intervals are equally probable), we write the following:
Thus, the PDF of
x can be obtained as follows:
where
Equation (
6) describes how the probability of observing a specific tumor population,
x, is related to the inverse of its rate of change over time. The slower the system moves through a particular state,
x, the higher the probability of observing it is. Fisher information measures the sensitivity of a probability distribution to changes in system parameters. In our model,
Fisher information quantifies how variations in key parameters influence the stability and predictability of tumor–immune interactions. High Fisher information corresponds to low variability (strong order), whereas low Fisher information corresponds to high variability (low order). This concept has potential applications in process control and immunotherapy optimization [
19,
27]. By incorporating Fisher information, we assess the system’s responsiveness to small parameter changes, allowing us to identify critical thresholds where immune responses may become ineffective. This provides a mathematical framework for evaluating the robustness of immunotherapy strategies and optimizing treatment interventions. Following the Fisher information theory procedure described in [
28,
29,
30], we compute the time-averaged Fisher information
FT over the total time
T for both species:
where
s represents the rate of change of the system’s state variable and is defined as
which captures the system’s dynamic trajectory in the phase space. Its time derivative,
, is given by
Equation (
10) properly decomposes the evolution of the system’s rate of change in terms of
and
, addressing the previous inconsistency. By computing the Fisher information using Equation (
8), we analyze its dependence on the parameter
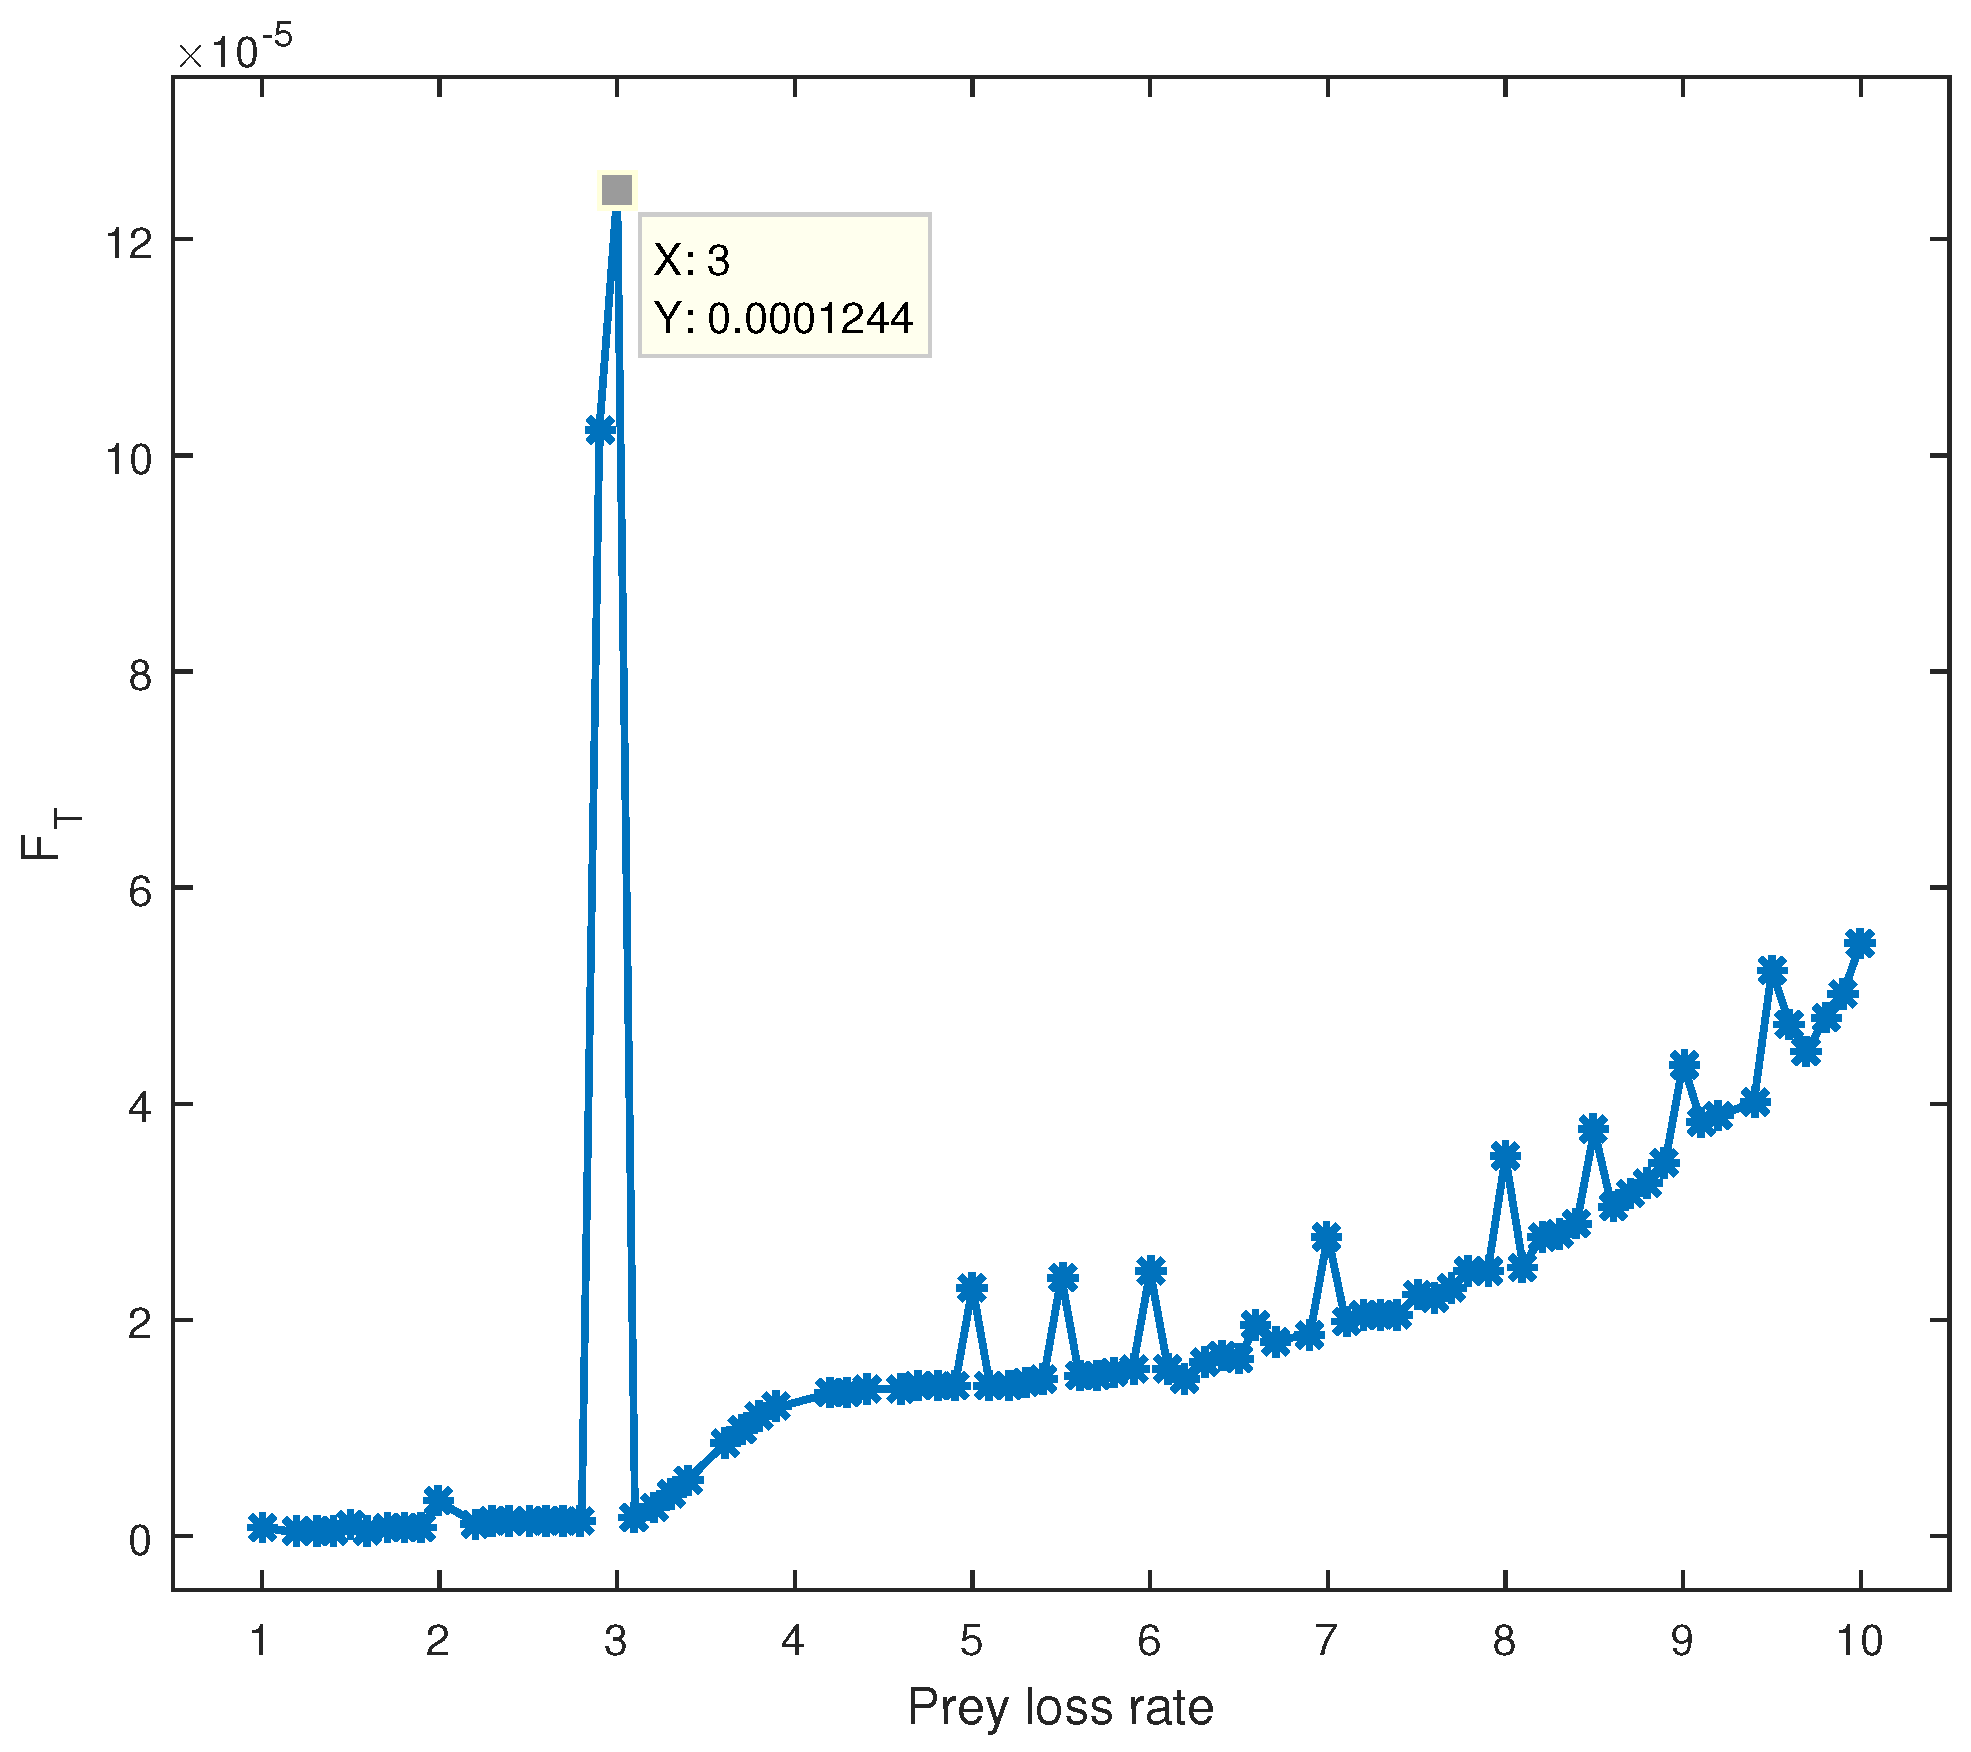
b. As shown in
Figure 4, higher Fisher information (
) is observed at
, corresponding to a tighter cycle around the equilibrium point, indicating less variability. However, in this state, there is no significant interaction between the two species, making it less biologically relevant. Lower values of
indicate greater variability and large oscillations in the state variables, suggesting instability in the tumor–immune dynamics. By plotting
against different parameter values, we can objectively identify critical points where tumor extinction or immune failure may occur, offering valuable insights into immunotherapy optimization.
At
, the local maximum of
, followed by a downward slope, is the most intriguing aspect of
Figure 4.
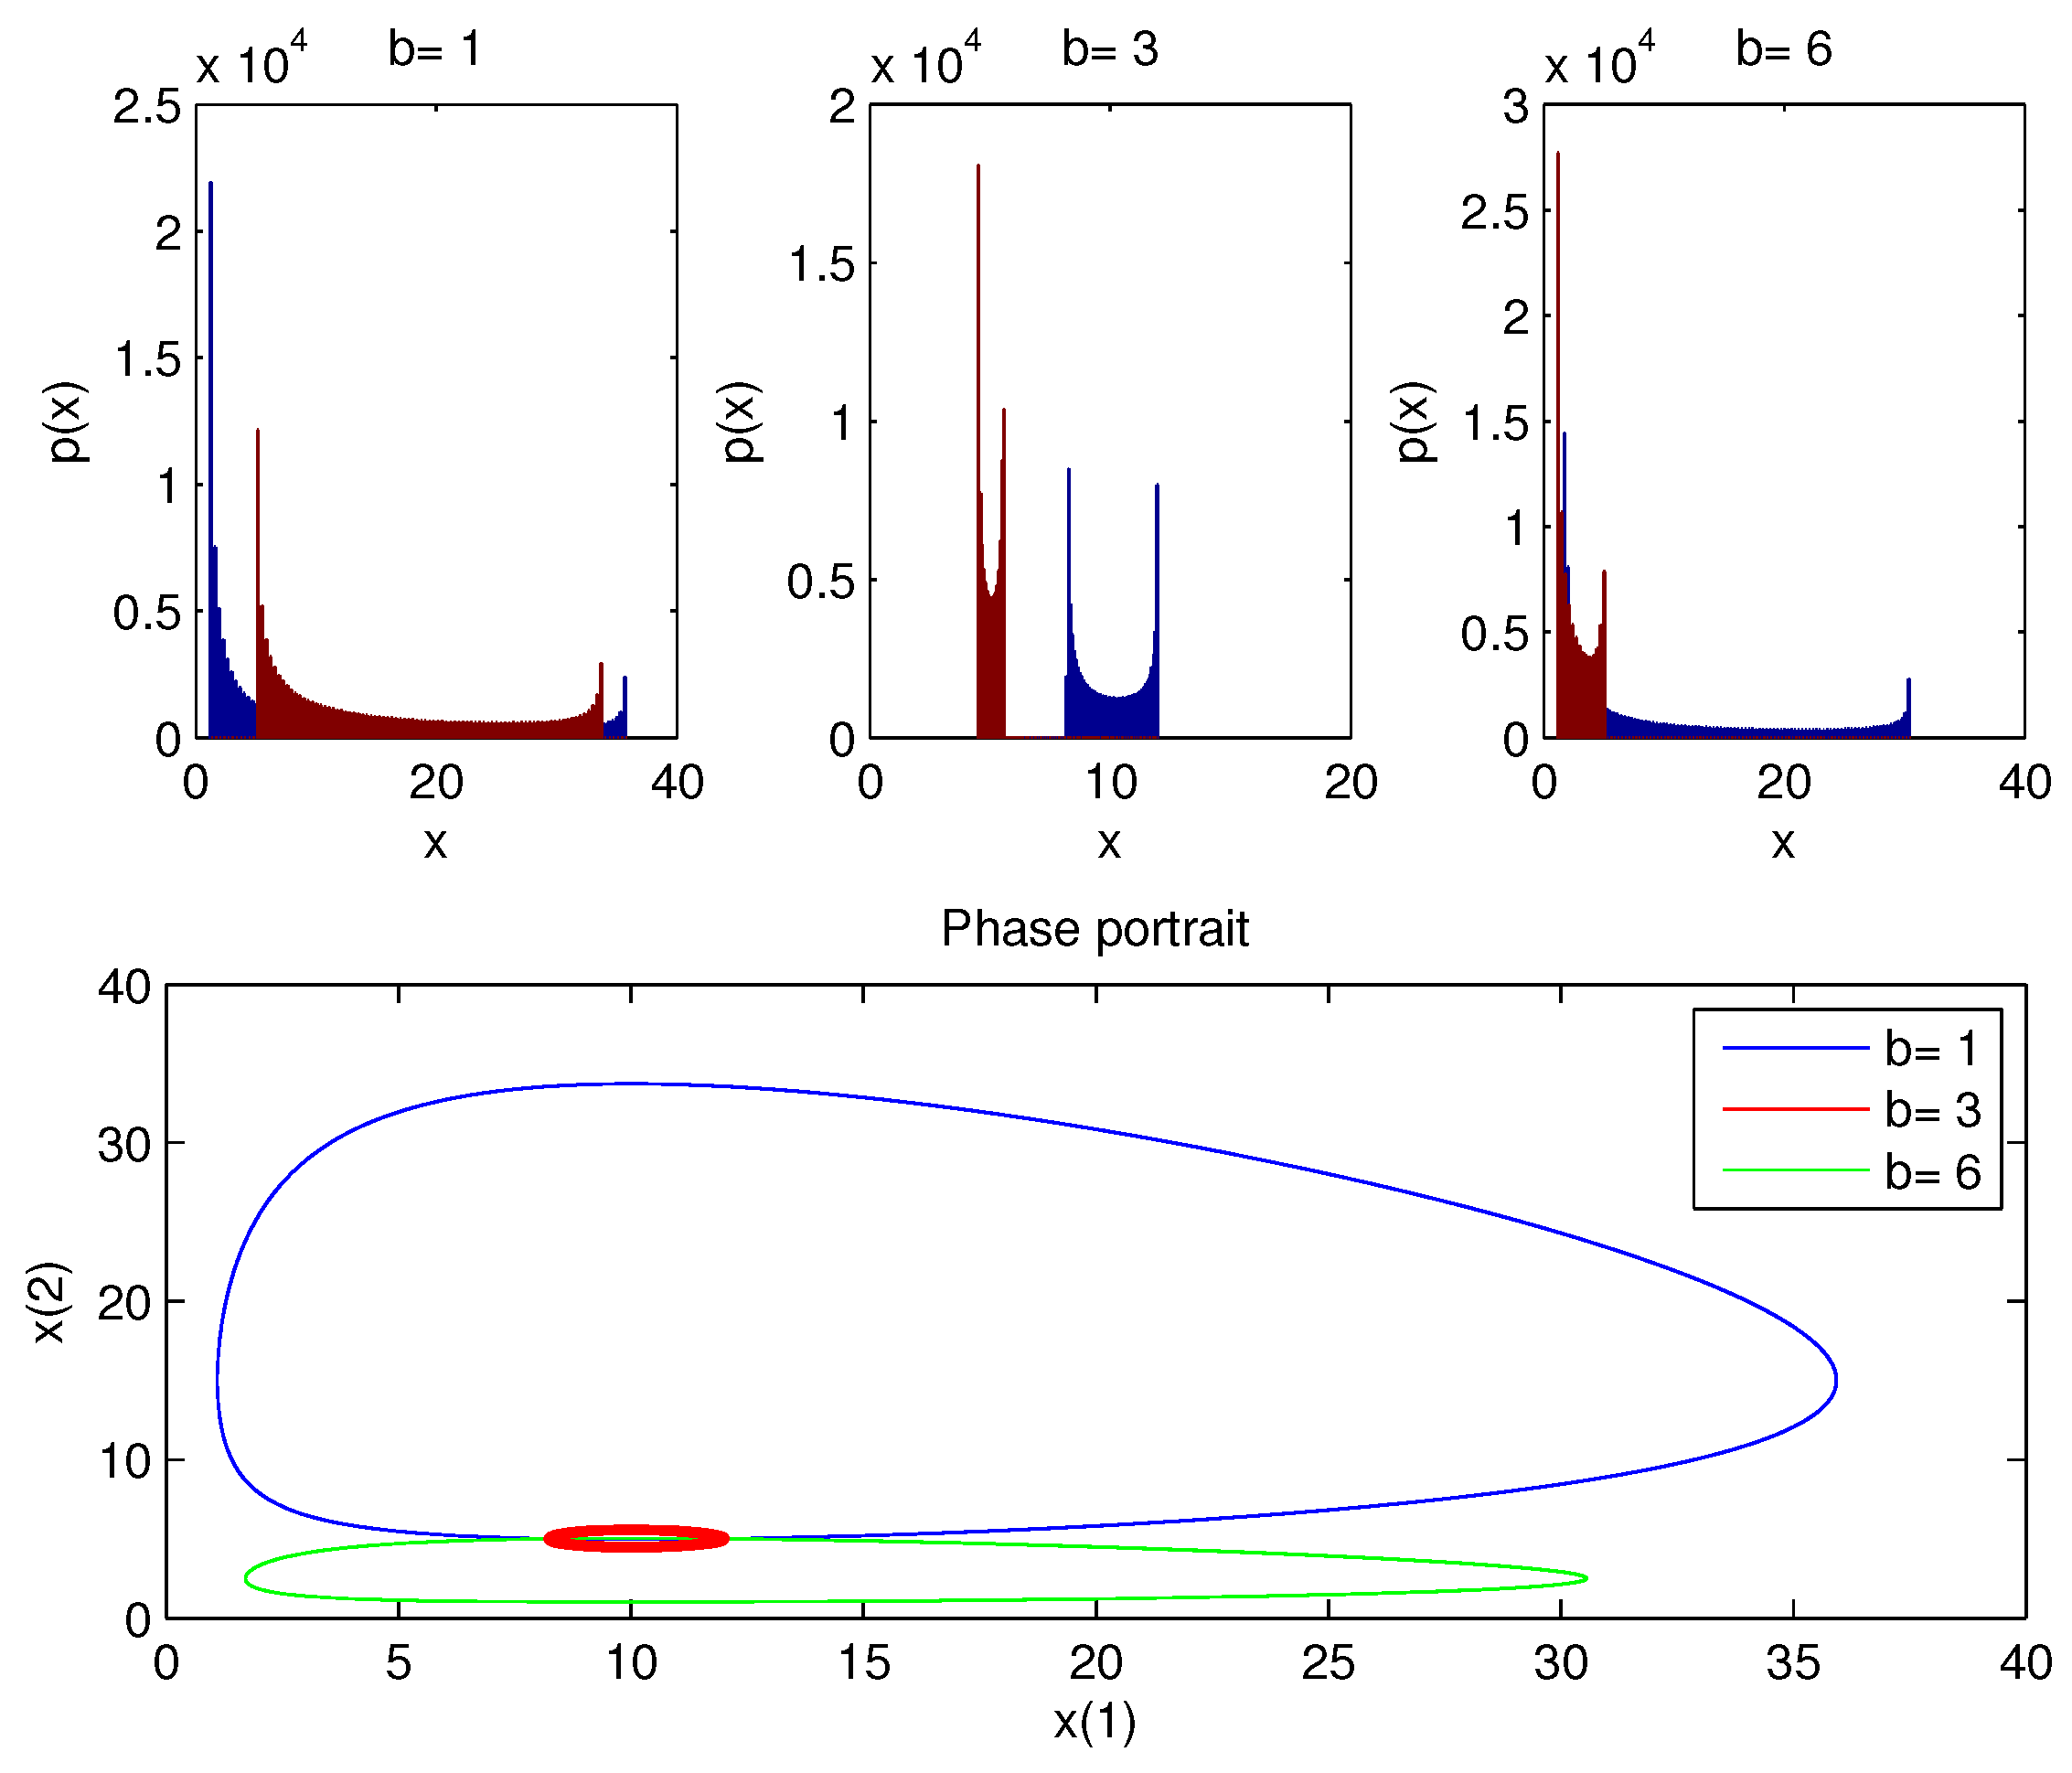
Figure 5 displays the PDF of
x with a phase portrait for a range of
b values.
In contrast to other values of b, which display a broad elliptical shape, the phase picture (red circle) of displays a relatively tight cycle around the equilibrium point, demonstrating how the dynamics of the model differ in different b. For example, the PDF around the equilibrium point is the narrowest when . However, the overall behavior is a limit cycle and the amplitude of these cycles depends on the value of b.
The aforementioned findings highlight the importance of Fisher information as a function of variability and sustainability, leading us to the conclusion that at the b value, there is a peak where the two species cannot interact, which results in the less sustainable (undesirable) case where there is no real interaction.
2. Improvements to the Model in (1)
By taking into account logistic growth with a carrying capacity of
for the prey population (cancer cells), the model is expanded:
Cancer cells can have a maximum population size of
, where
N is the reciprocal of the population’s carrying capacity.
In (
11), the predator–prey model is predicted to influence the behavior of both infected (cancer) and non-infected (immune) cells by either boosting or suppressing their development and/or death (immune cells win, while the cancer population is driven to extinction) [
2]. Therefore, Equation (
11) is extended to study the effect of periodic treatments (immunotherapy) by including an external stimulation.
Here,
denotes the population of cancer cells at the time
t with the growth rate
a and carrying capacity
N;
represents the immune cell population; and the term (
) denotes the external source of immune cells (immunotherapy), where
F is the periodic signal amplitude and
is the periodic signal frequency. With a periodic modulation such as sinusoidal form (see [
31,
32]), the model exhibits periodic evolution. Furthermore, we see that for low values of
, there is enough time for the population to reach the equilibrium point (see [
28,
31]). All the analyses that follow aim to track changes in both species’ amplitudes, frequencies, and starting points. The equations in (12) may be expressed as follows in a dimensionless form:
The parameters in Equation (12) are re-scaled in accordance with
We set the equations in (
13) to equal zero and fix the values of
,
, and
to find three fixed points. The first equilibrium point is
, the second equilibrium point is
, and the third equilibrium point is
. We investigate these equilibrium points’ stability depending on the amplitude
F by using the Jacobian matrix for the model in (
13), such as when
,
and
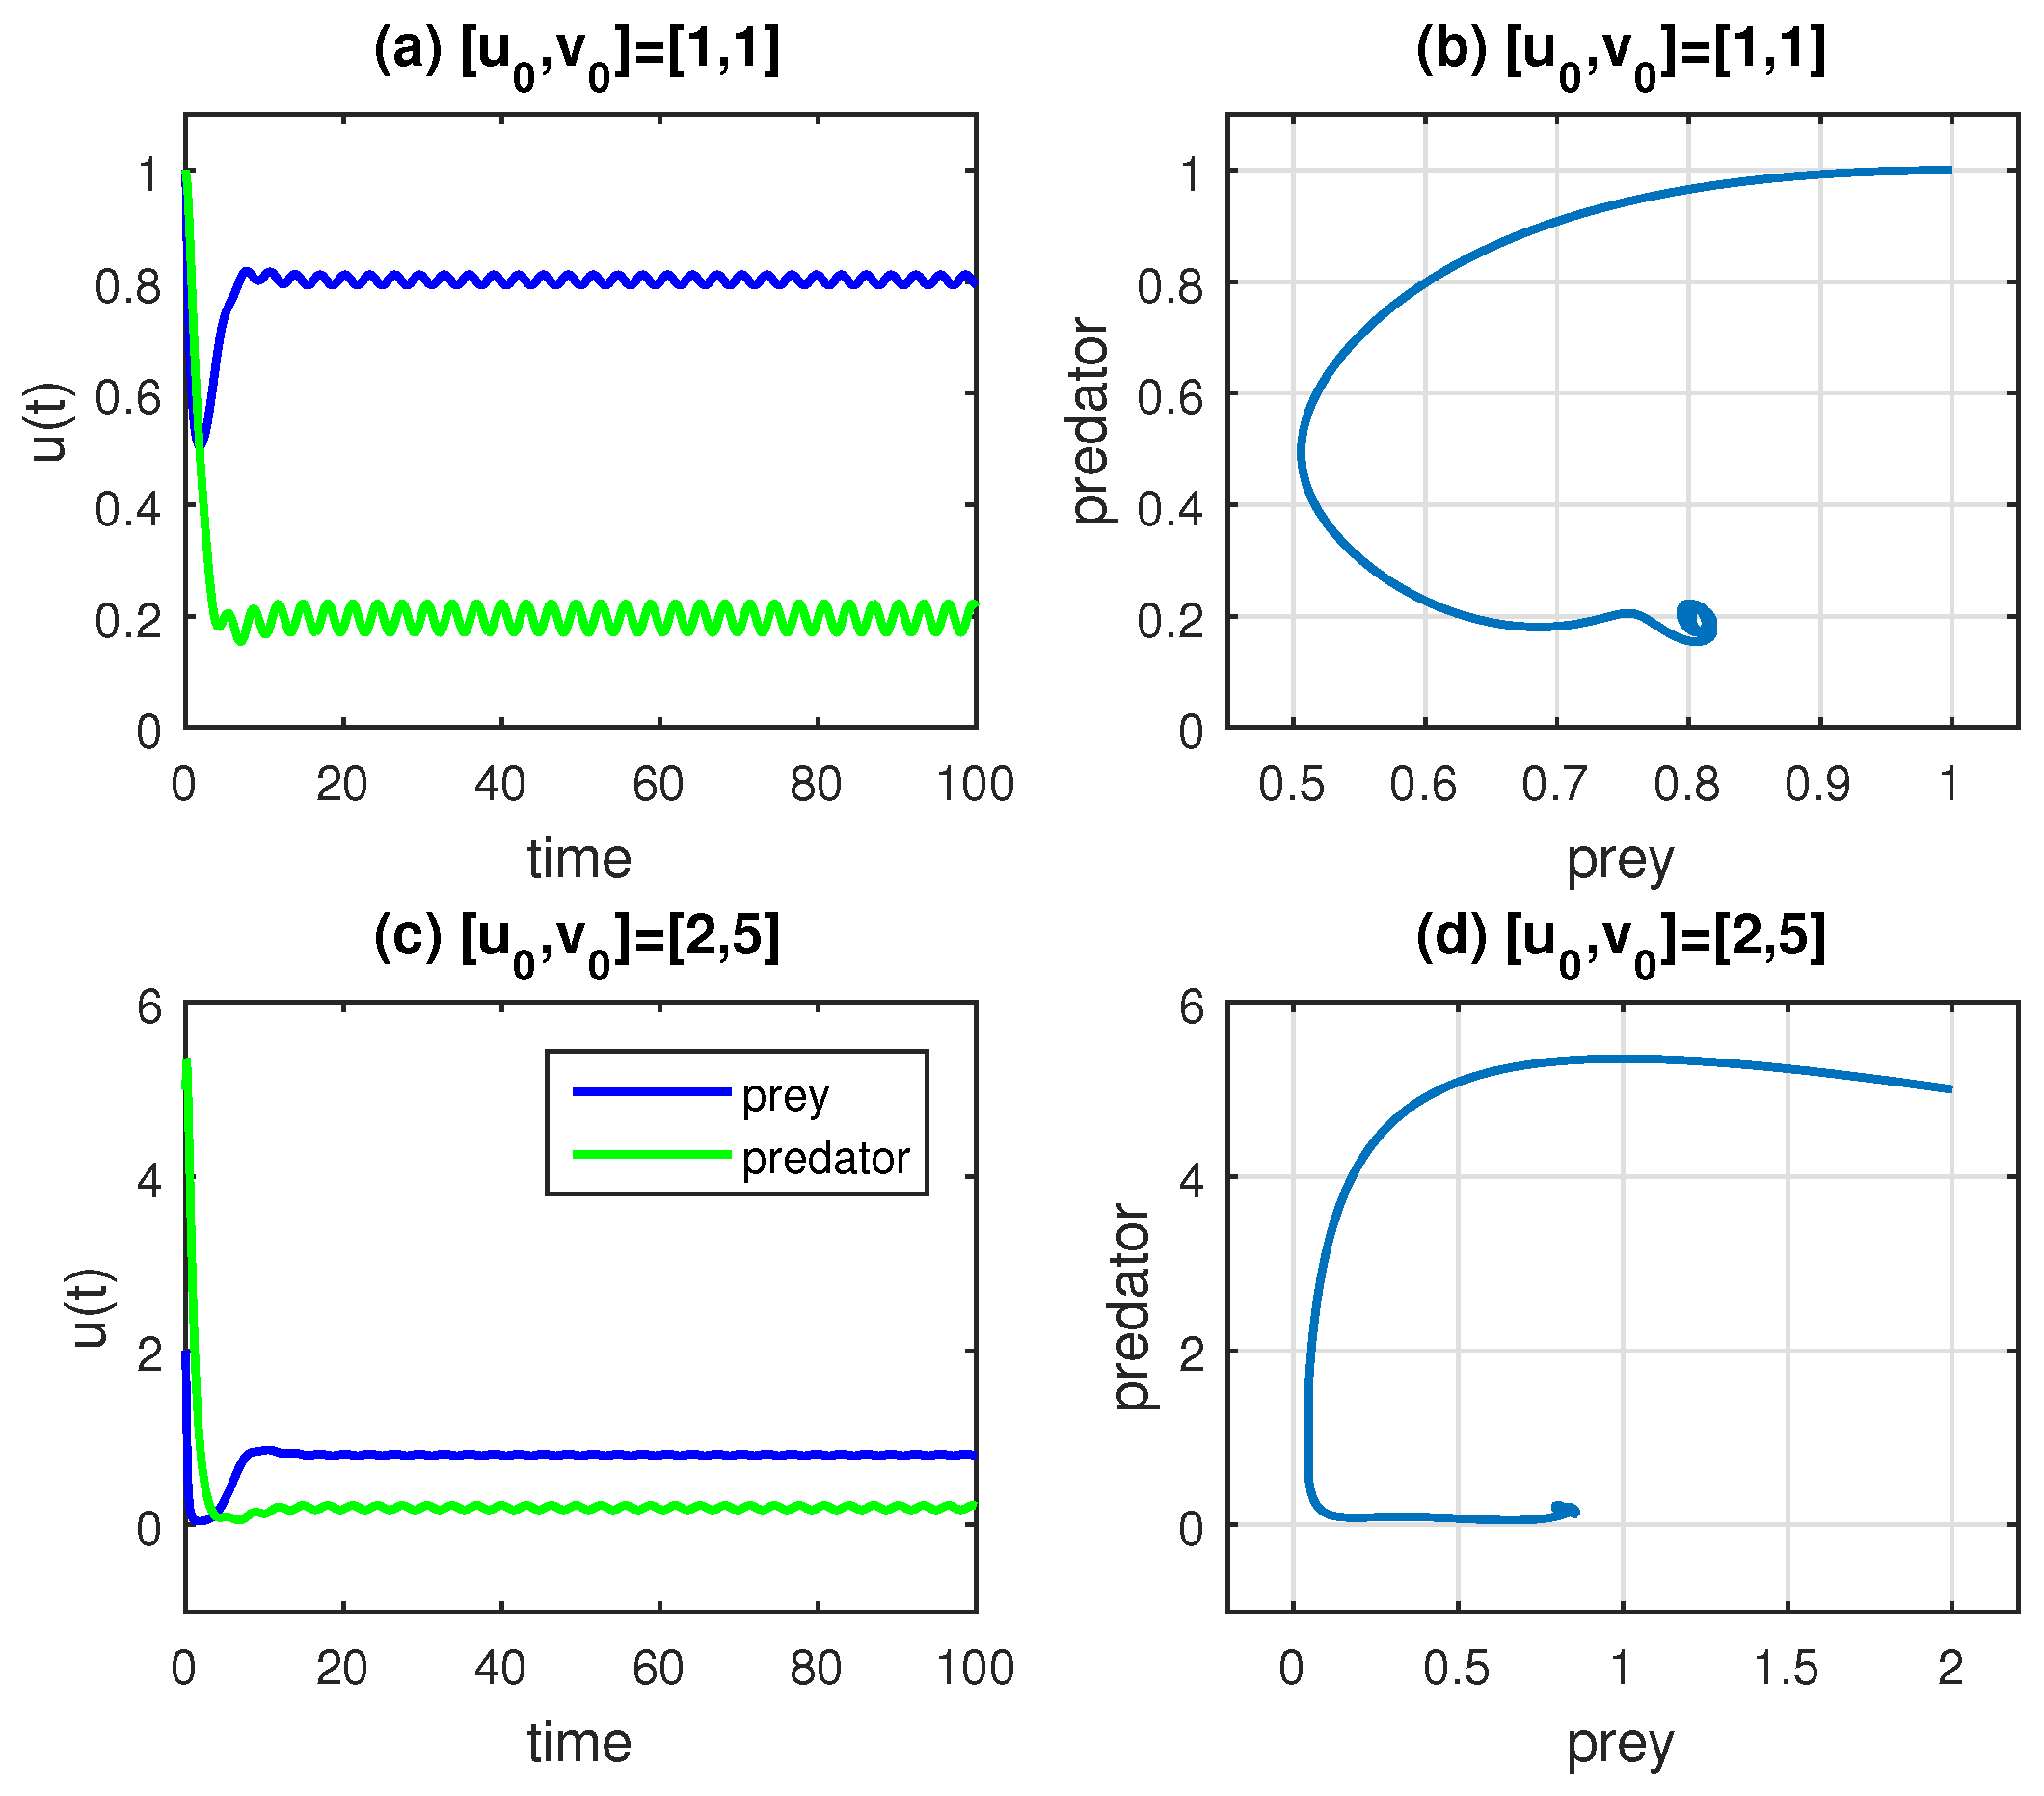
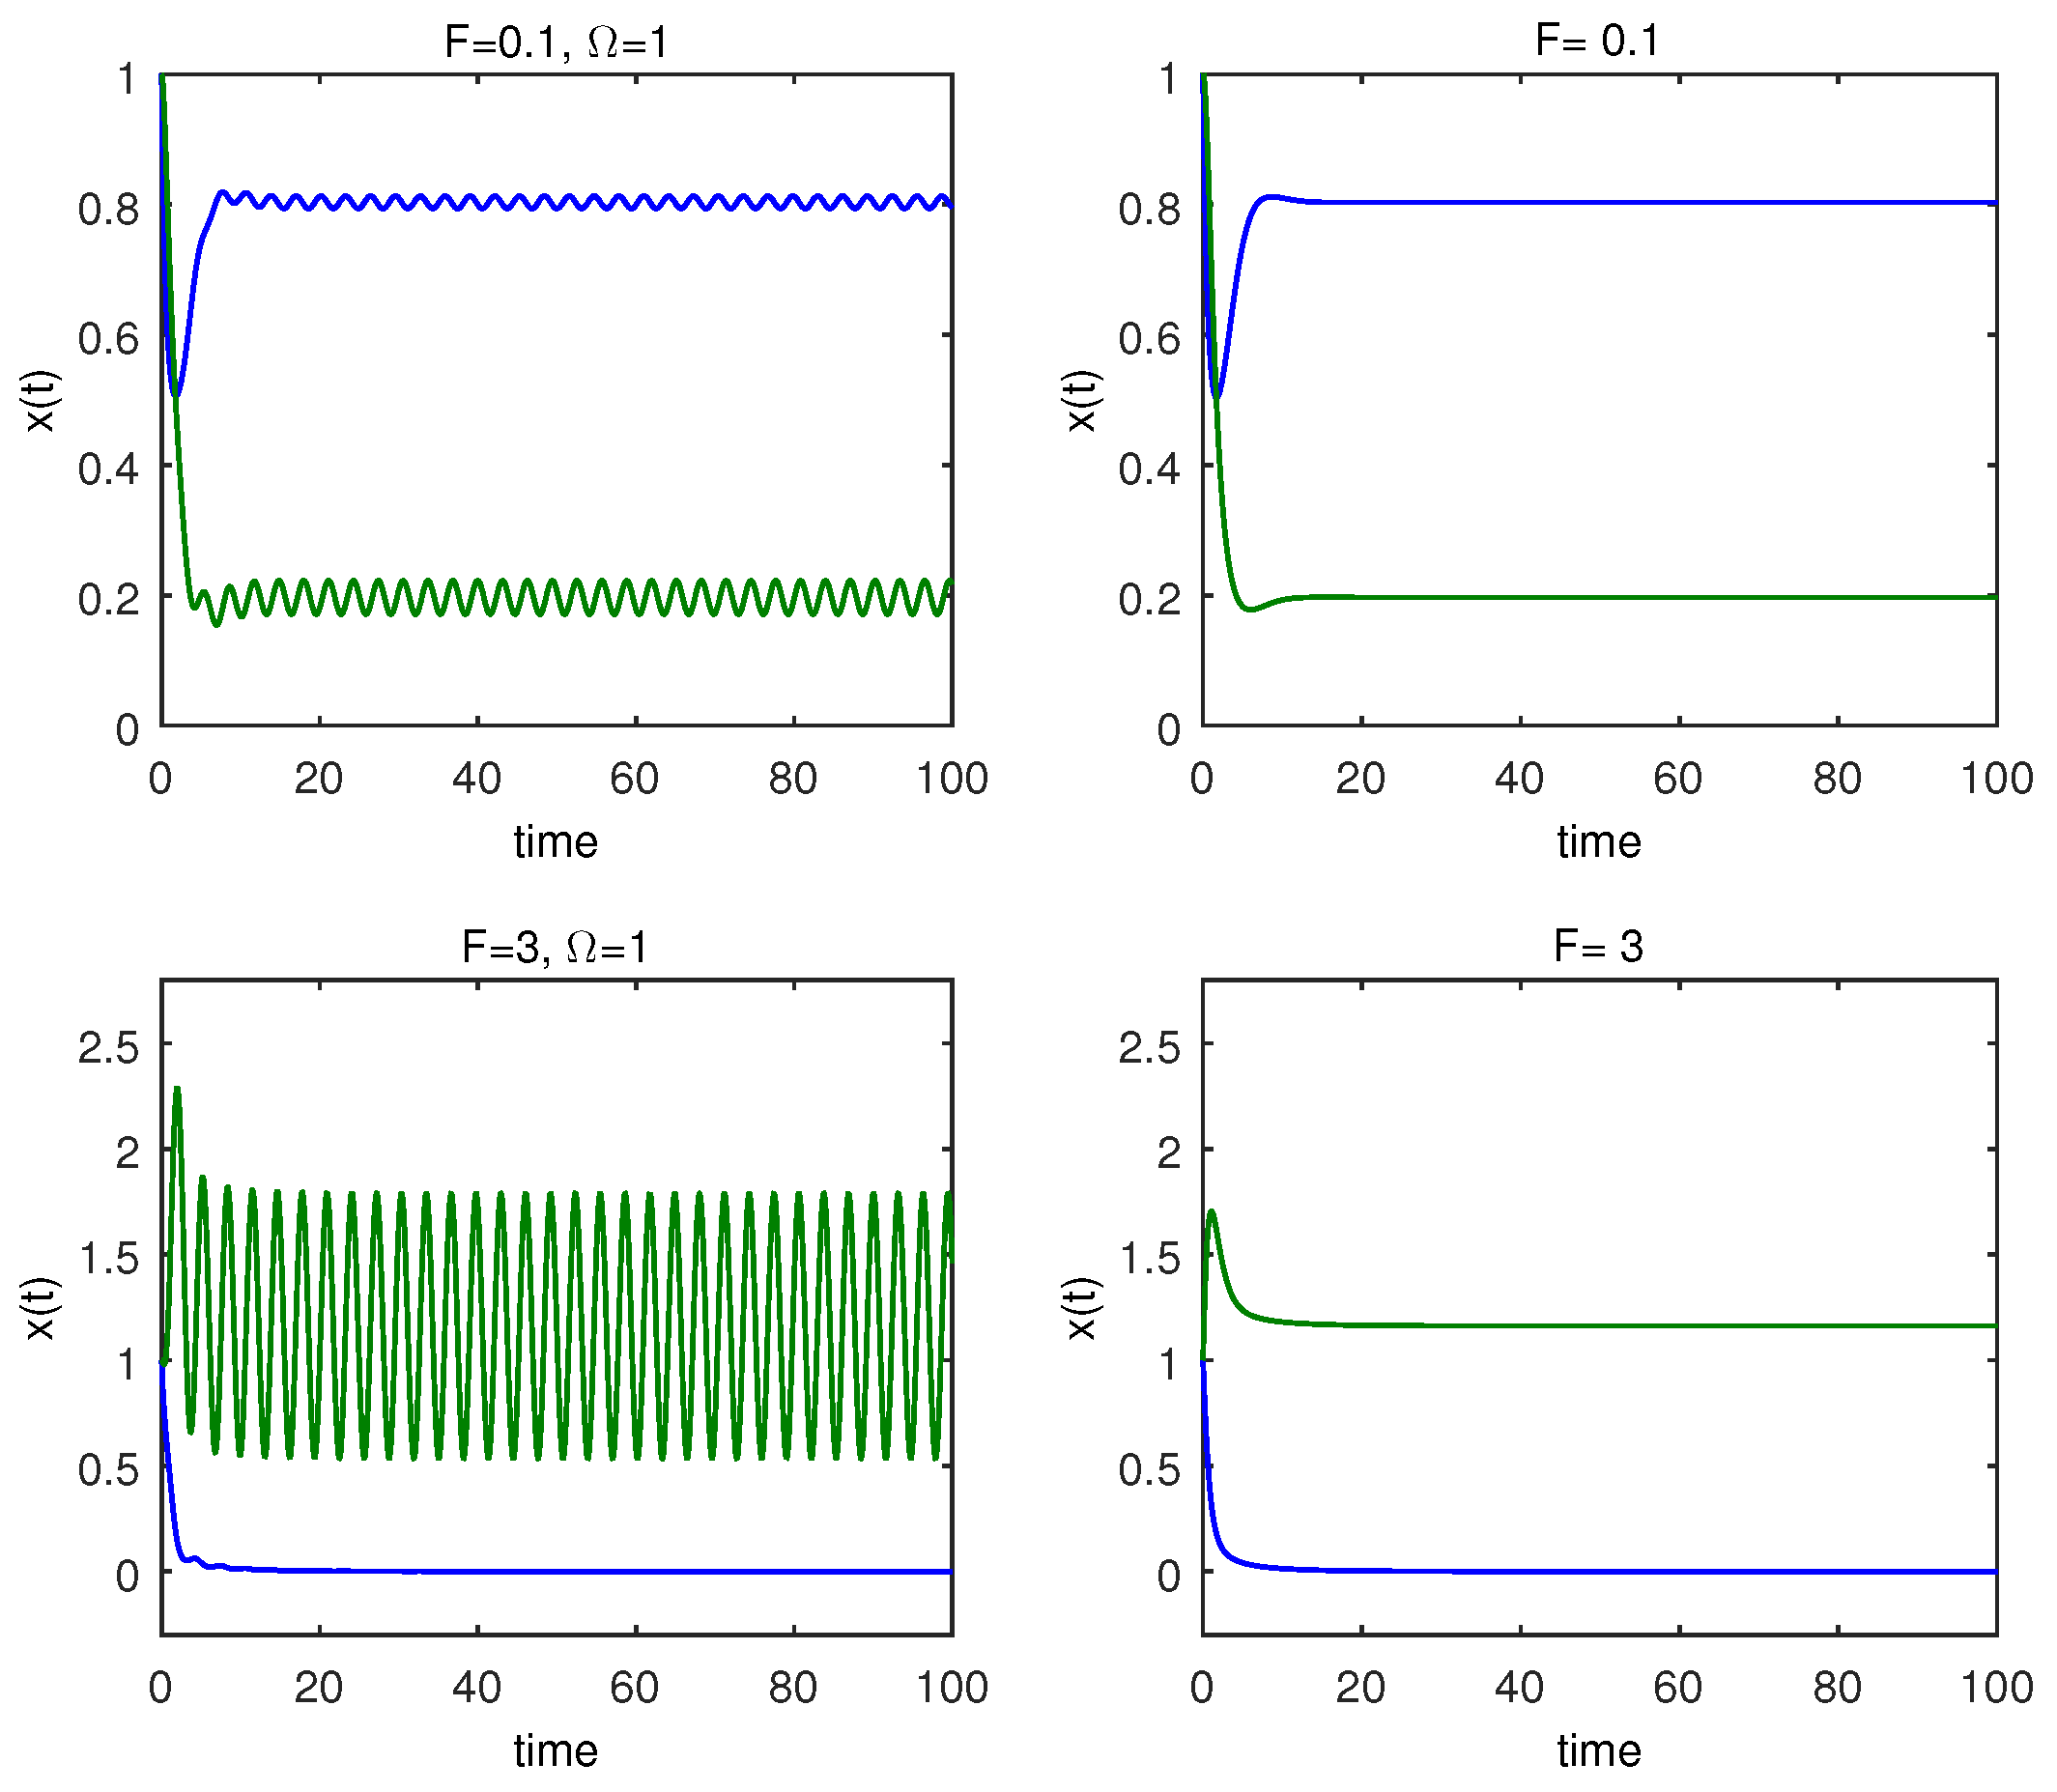
. As seen in
Figure 6 and
Figure 7,
are unstable saddle points, but
is a stable spiral.
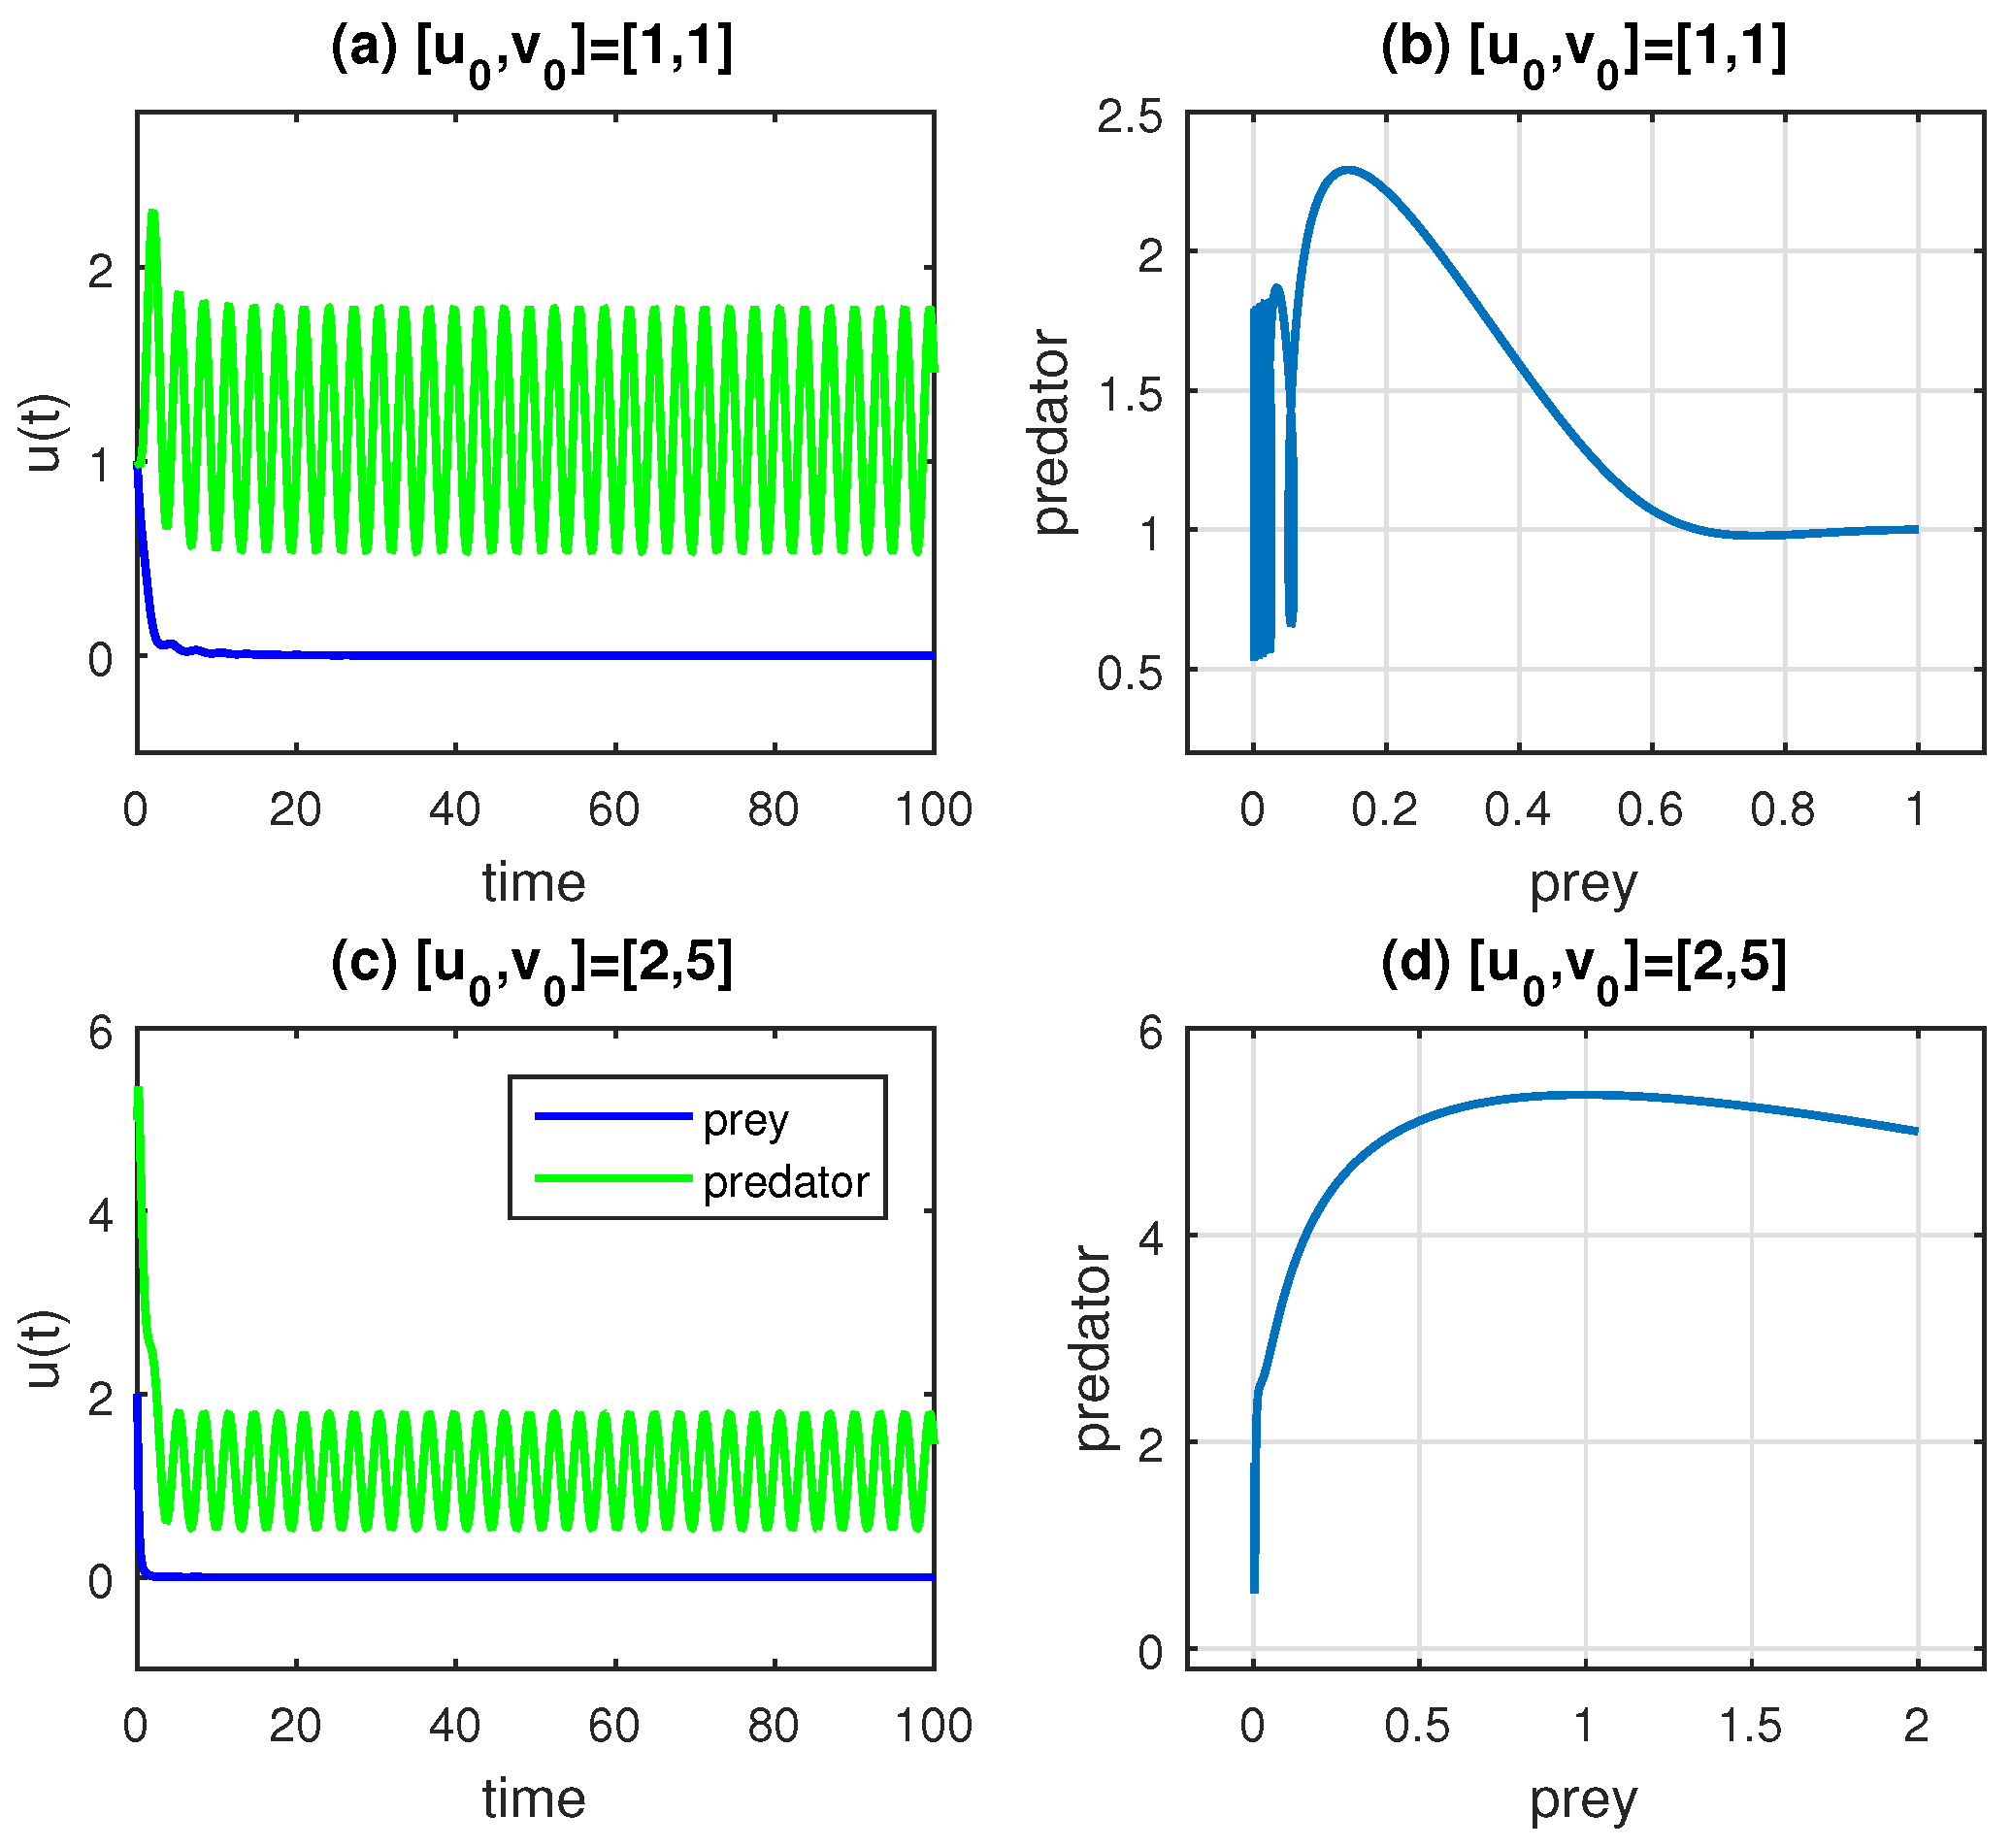
On the other hand, the model in (
13) has three equilibrium points but exhibits unusual stability behavior at higher values of the amplitude
F, such as
. The three fixed points are
,
, and
for
. According to the corresponding diagram, the first equilibrium point is a stable node, whereas the remaining locations are unstable saddle points.
The results may be explained using a biological model of the development of cancer. We fix
,
, and
in our calculation for simplicity. The solution is still stable wherever it is for higher amplitude
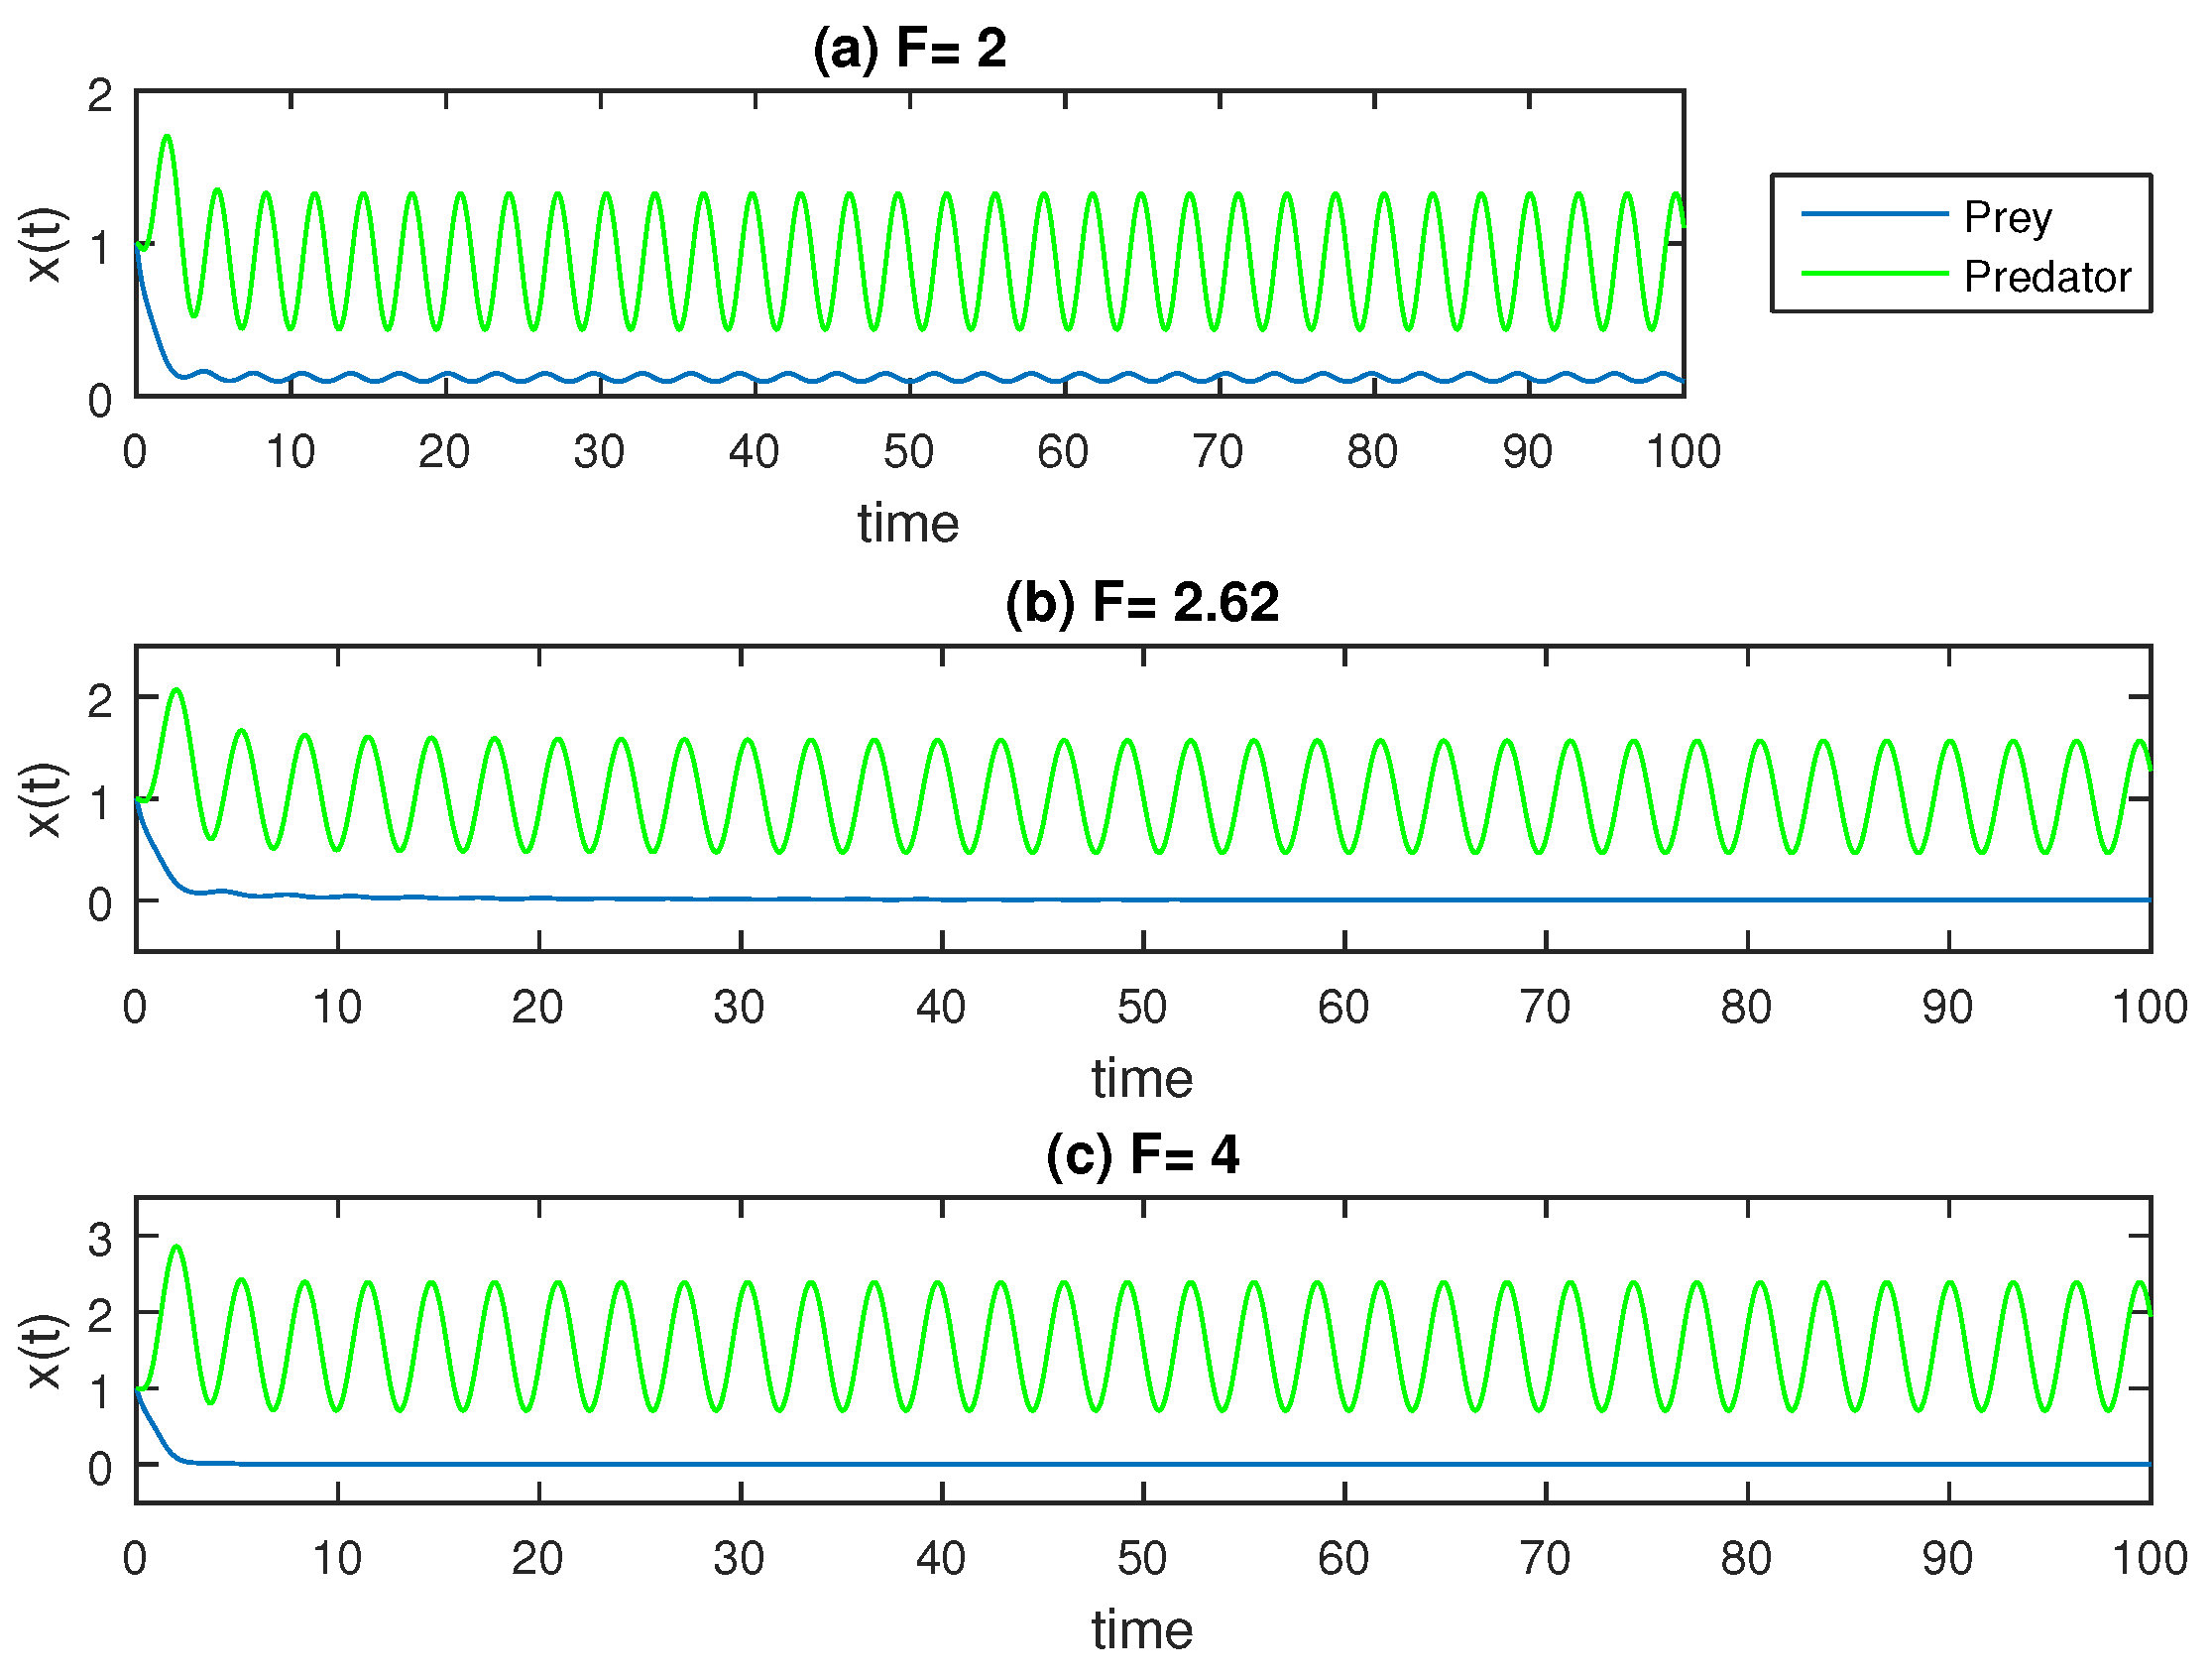
F values in the periodic function (a periodic treatment that boosts immune cell growth and wipes out the cancer population); however, we observe how the cancer cells, the prey, vanish, regardless of the initial values. This is evident in the left panels of
Figure 8.
The variability/sustainability of the model in (
13) is lower than that of the model in (
1) (without the treatment term) at
because one of the species is becoming extinct at a given value of
F. The values of the model parameter of
F in Equation (
13) and the initial conditions, for example, might vary given that the entire treatment plan depends on the patient’s health, their defense mechanisms, their gender and other characteristics. The benefits of including potent vaccination against the evolution of cancer development are shown in
Figure 7 and
Figure 8. Furthermore, for sufficiently small values of
, it is seen that this convergence takes place for any starting value that falls between the initial value boundaries and the equilibrium points.
In
Figure 7 and
Figure 8, when
and
, respectively, the prey, which is the number of cells with cancer, switches from steady state stable condition to extinct state for sufficiently tiny values of the amplitude of
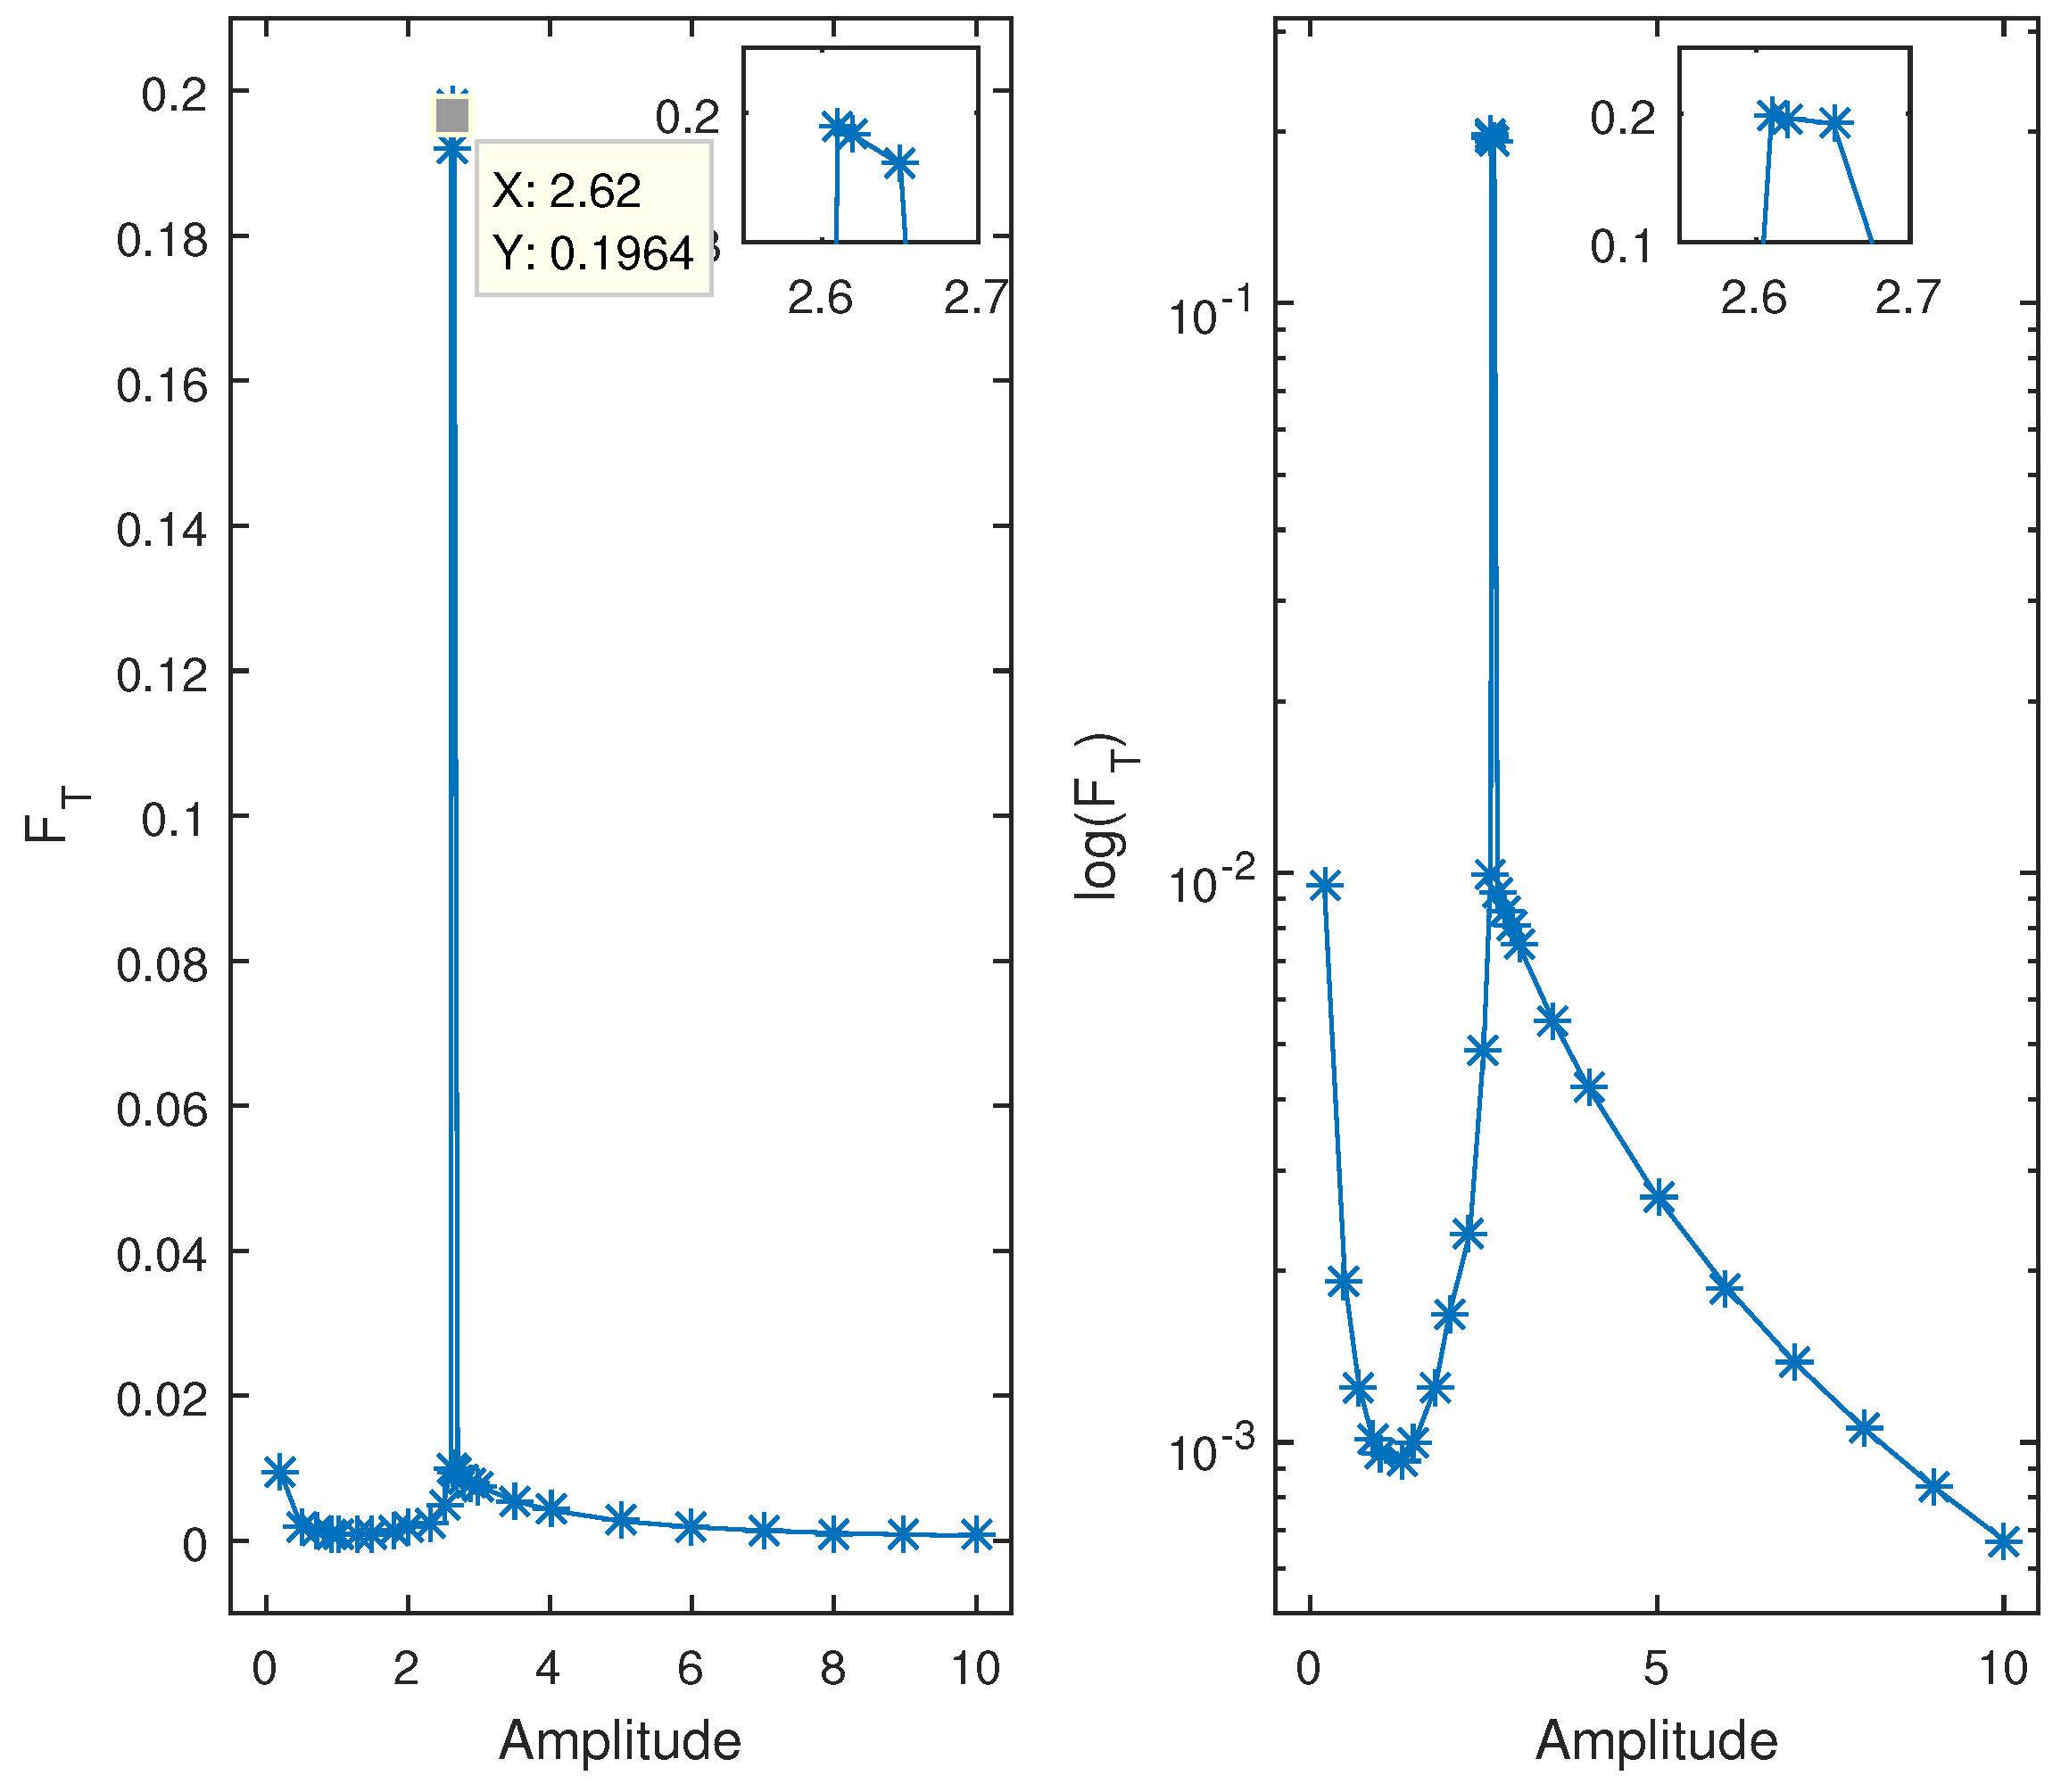
F. To regulate the growth of cancer density and maintain it at its lowest level in the host body, the quantity of the therapeutic dosage (the model’s second Equation (
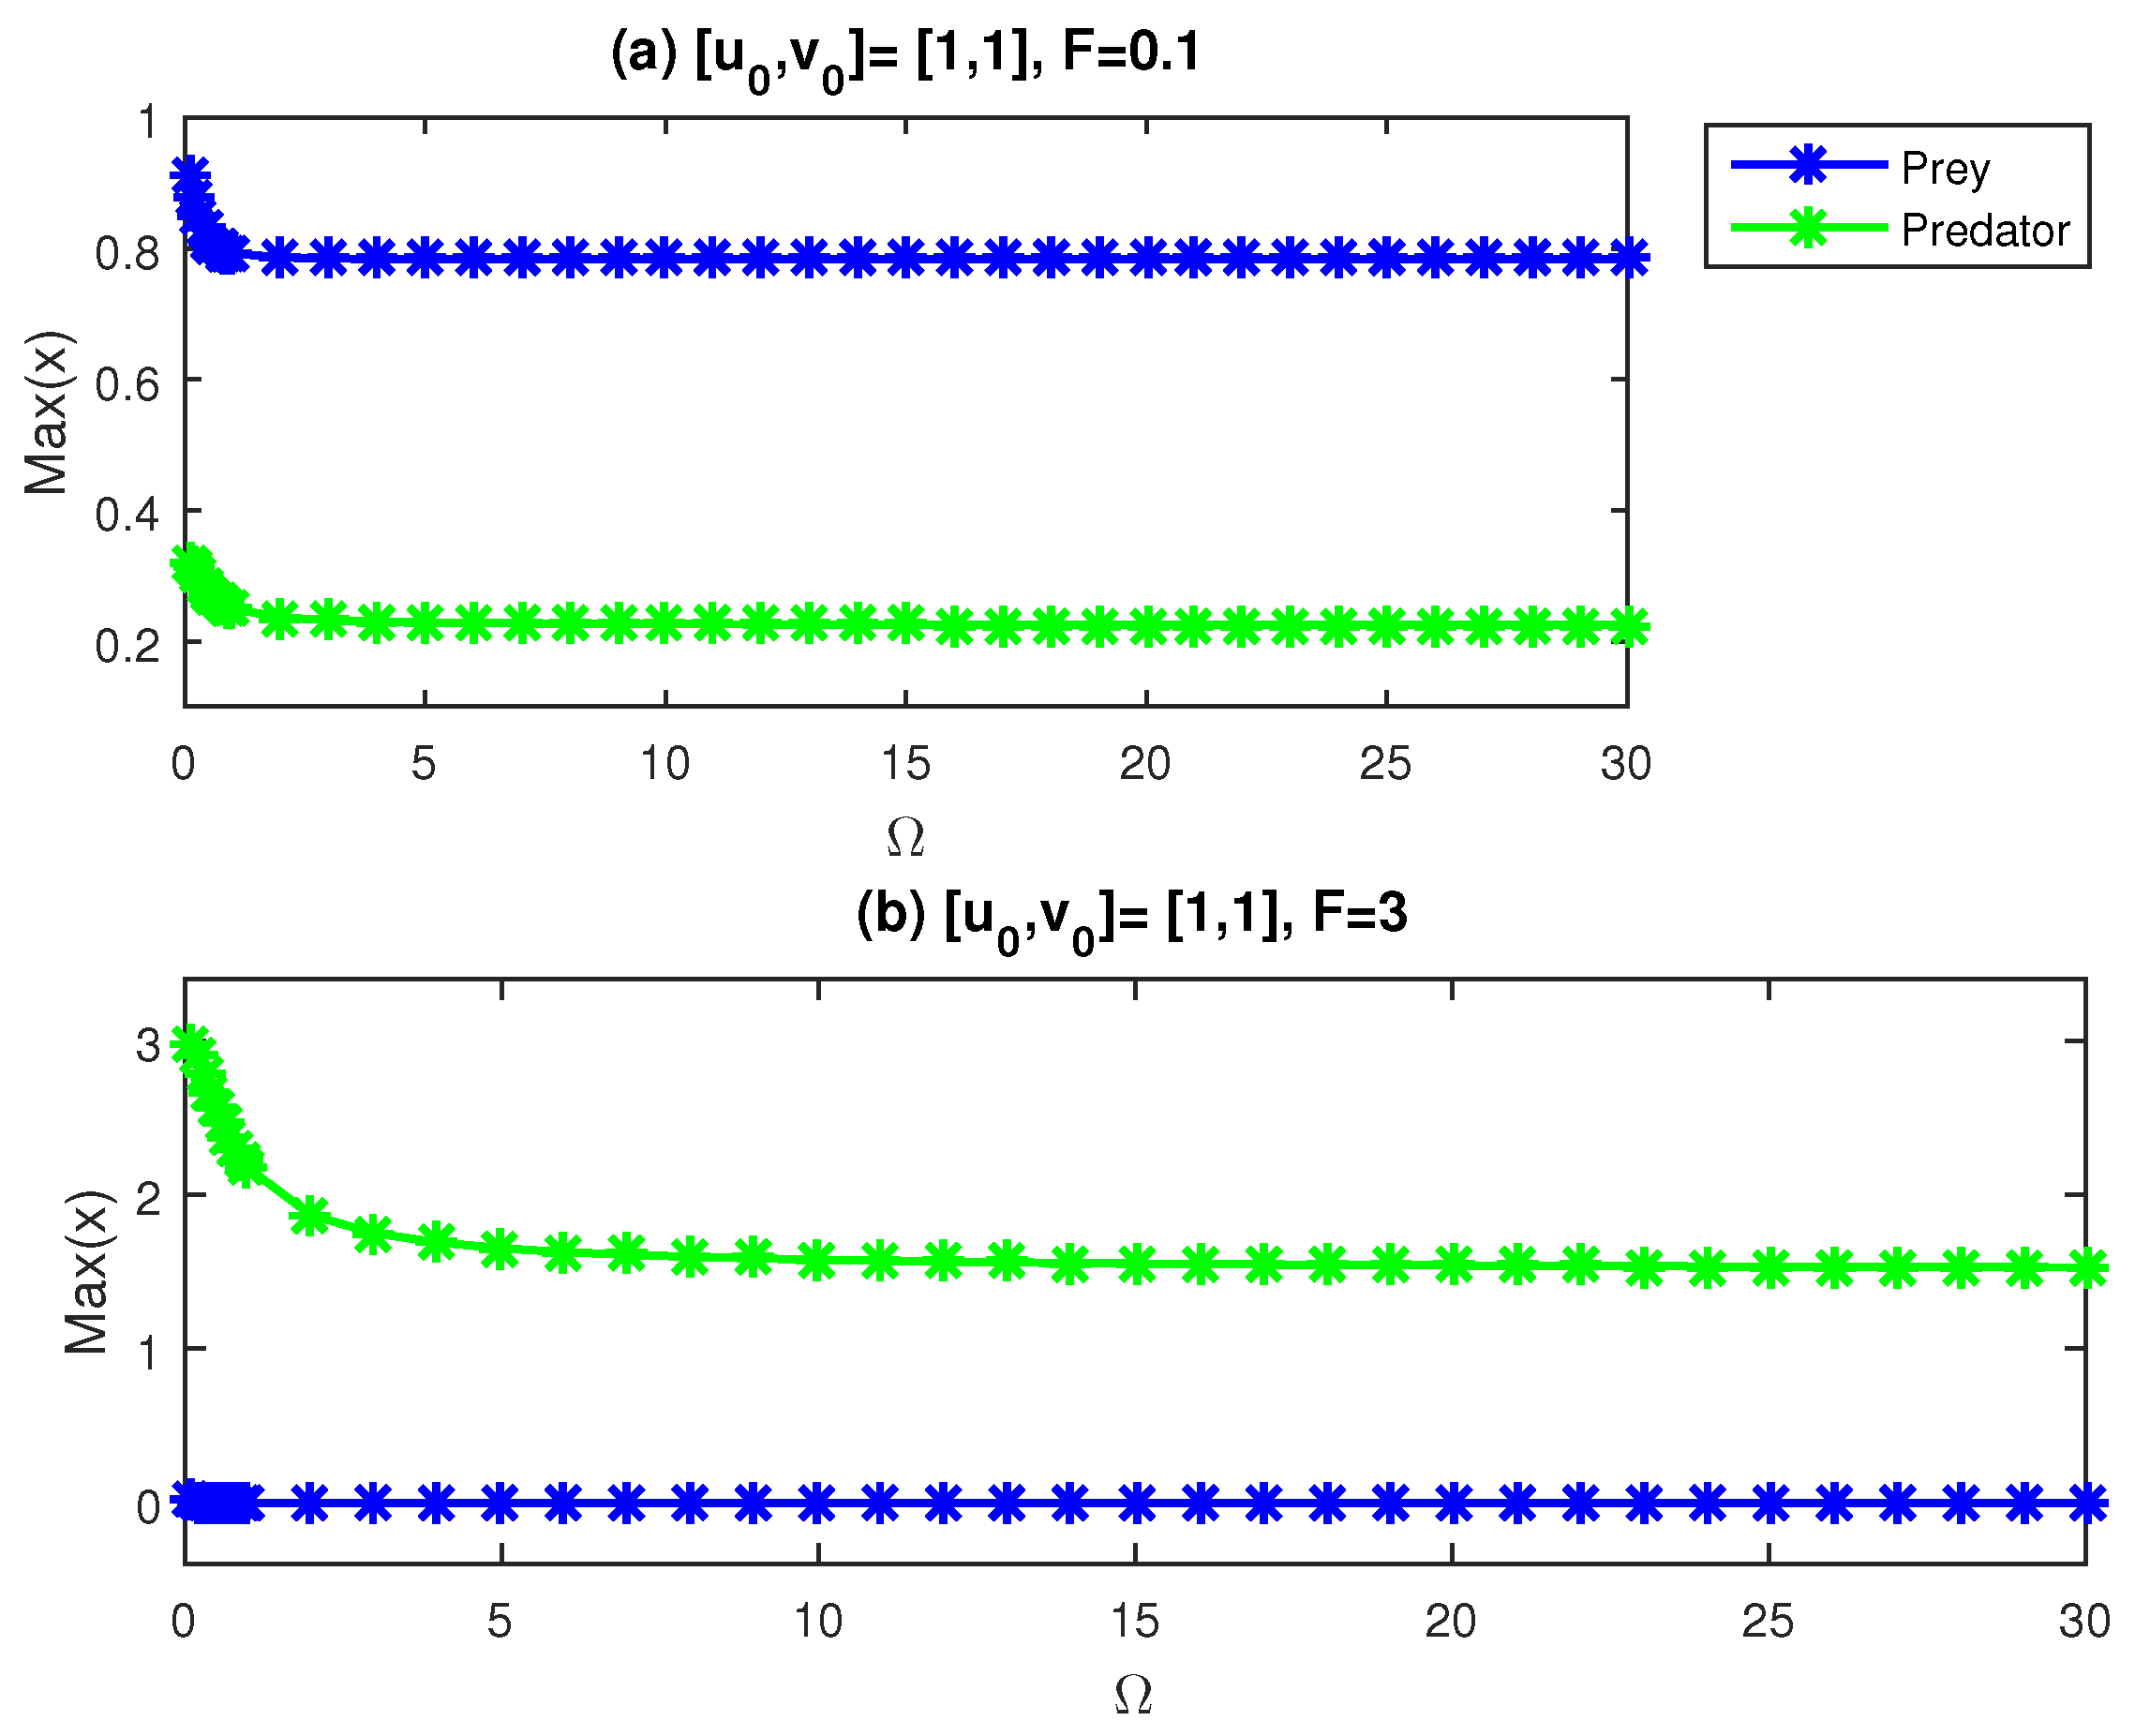
13) shows the amplitude of a periodic modulation) is introduced. To make sense of and take into account the aforementioned facts, in
Figure 8, we show
for immune cells and cancer cells as a function of
with a fixed amplitude value.
In
Figure 8, we provide maximum values of the cancer and immune populations versus
with two amplitude values. In contrast to the findings in panel (a), we note that at
, for all values of
, immune cells are at a higher level than cancer cells, and cancer cells are eliminated at
.
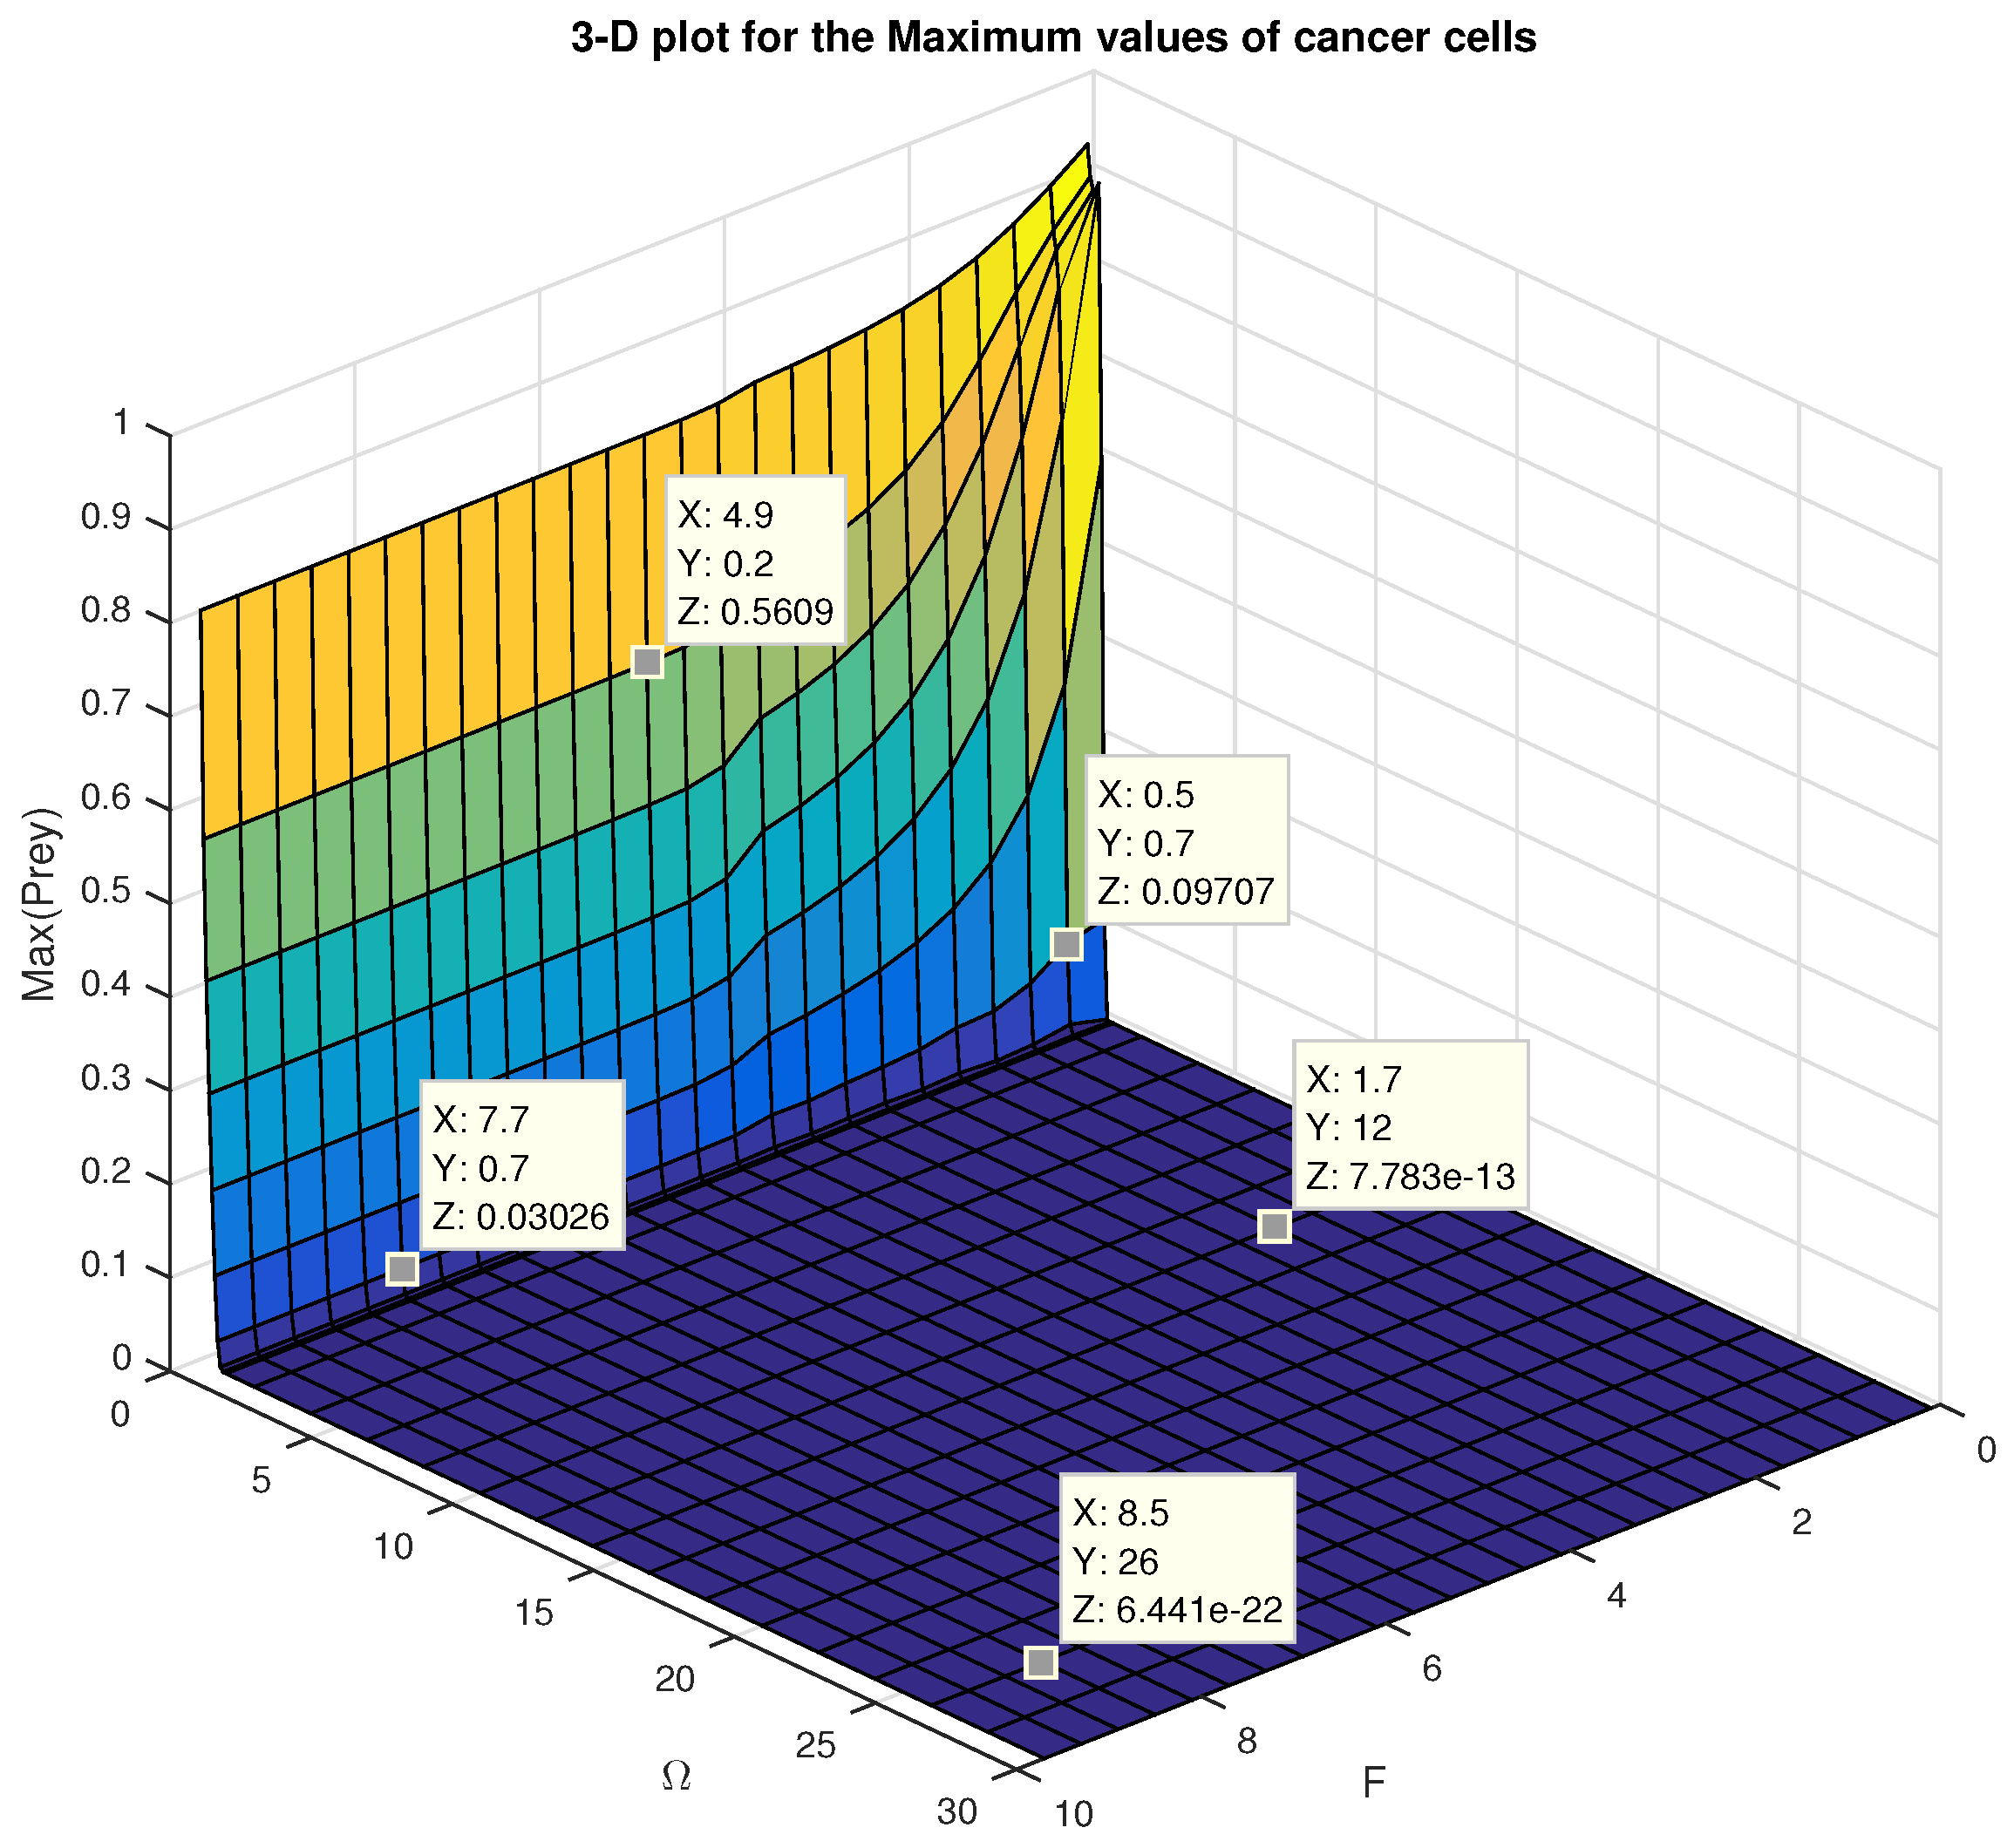
Figure 9 only takes into account the highest values of the cancer population due to its detrimental effects on the host body because our objective is to decrease or at least regulate the number of cancer cells.
Figure 9 displays a figure
for the optimal values
F and
in the periodic modulation in Equation (
13), to conclude our analysis.
In
Figure 9, the maximum values of the prey exhibit a monotonic decline with increasing frequency levels. In this context, we choose all values
F and
where
is seen to be close to zero at high frequencies. The findings are shown in
Figure 10, which helps to identify the ideal amplitude value that would completely eradicate the cancer cell population.
In the model (
13), the periodic modulation has the frequency
, which causes oscillations in the values
in
Figure 10. Based on this, we study the effects of anticancer therapy using the average time value (
) in the second equation of Equation (
13). The results are shown in the right panels in
Figure 11 for the purpose of comparing the two cases (left/right panels) obtained from periodic/constant treatment.
The contrast between the panel on the left, which contains fluctuations (
), and the right panel, which simply has a constant (
), is clear. Furthermore, it is crucial to clarify that the output
in the left panels of
Figure 11 is twice the input frequency
in Equation (
13), with
. Between two peaks on the
x axis, the distance
T is
, for example, when
and
. We then compute
using the following formula:
In this case, we obtain an
of around 2, which is twice
(
) in Equation (
13), which is 1. For various values of
, similar findings are made.
3. Conclusions
An examination is conducted into how immunization affects the dynamic characteristics of a tumor–immune interaction Growth model represented by a predator–prey model (this shows the cancer cell population as the prey and the immune cell population as the predators). We investigated the dynamical characteristics and interactions of the predator-prey model in both the original and expanded models.
The predator–prey model displays a limit cycle as well as a sensitive dependence on the initial conditions, wherein the system behavior changes through changing the initial points. Furthermore, according to our findings that the equilibrium point is dependent on the parameter values, varying the prey mortality rate b (cancer death rate) causes the equilibrium point to decrease monotonically. The observation of a peak for FT in
in
Figure 4, where the PDF of
x shows a shorter distance between the two peaks, supports the conclusion of the information theory that the model at this value is in an undesirable state to investigate because there is less variability and no interaction between the two species. When compared to the other values of
b (≠3), where the state variables experience significant oscillation, the system has a lower
and is not operating at the optimal efficiency (high variability).
Our findings for the predator–prey model with modified model parameters are summarized as follows: The cancer cell population is highly affected by periodic modulation (immunization term), where the optimum value of the amplitude in the periodic dose, , can stimulate the growth of immune cells and result in a reduction in cancer cells within the host body. Quite differently, the density of prey decreases at sufficiently targeted immunotherapy doses. Furthermore, there is a specific value of F when the prey population transitions from a stable steady state to an extinct one. This leads us to the conclusion that the density of cancer cells decreases to a very low value at for a given value of the periodic perturbations. Furthermore, we observe a maximum at this value, indicating that our system is less variable and exhibits a static steady state; however, from the perspective of sustainability, this state is the least sustainable, since the dynamics are too weak to perform an investigation due to the survival of only one species. Finally, the results consistently demonstrate a similar finding: there is a peak in the Fisher information at a specific parameter value where the system at this value represents an undesirable state for investigation, as it exhibits lower variability and minimal interaction between the two species.

