Article

A Trust-Enhancing Variant of the Binary Randomized Response Technique

1
Department of Mathematics and Statistics, University of North Carolina at Greensboro, Greensboro, NC 27412, USA
2
Department of Biomedical Sciences, Texas A & M University, College Station, TX 77843, USA
3
Department of Biochemistry, University of Texas at Austin, Austin, TX 78712, USA
4
Department of Applied Sciences, Bharati Vidyapeeth’s College of Engineering, New Delhi 110063, India
*
Author to whom correspondence should be addressed.
Axioms 2025, 14(12), 864; https://doi.org/10.3390/axioms14120864
Submission received: 15 October 2025 / Revised: 14 November 2025 / Accepted: 22 November 2025 / Published: 25 November 2025

Abstract

Building on recent studies on trust enhancement in quantitative Randomized Response Technique (RRT) models, this study introduces trust enhancement in a binary mixture RRT model. Our approach emphasizes building respondent trust alongside preserving anonymity. To support our theoretical findings, we conduct a simulation study. The overarching goal of our work is to shift the focus from merely protecting anonymity and accounting for lack of trust to actively fostering trust. Simulation results show that the proposed model has better quality, and succeeds in building respondent trust that results in more efficient estimates.

1. Introduction

Collecting accurate responses to sensitive survey questions continues to pose challenges due to non-response and social desirability bias. Respondents are often reluctant to disclose private or stigmatized behaviors, resulting in distorted or missing data. To address this, Warner (1965) introduced the first Randomized Response Technique (RRT) model, a survey technique that offers privacy protection through probabilistic masking, thereby encouraging truthful participation [1]. Building on this foundation, Greenberg et al. (1969) proposed the unrelated question model (UQM), which offers an alternative privacy protection scheme by including a non-sensitive question in the response mechanism [2].
Over the years, researchers have introduced numerous variants of RRT, targeting improvements in estimation accuracy, respondent cooperation, and privacy protection. Notable contributions include the Partial RRT by Mangat and Singh (1990) who introduce a truth element in the survey using a random mechanism [3], the Optional RRT by Gupta et al. (2002) who allow respondents to provide a truthful response if they do not perceive the question to be too sensitive [4], and mixture models explored by Kim and Warde (2005) [5] and Lovig et al. (2023) [6]. These mixture models perform better than the individual component models.
More recent studies have highlighted the importance of trust in RRT mechanisms. This growing awareness has led to models that explicitly account for dishonesty, such as the trust-aware mixture model proposed by Lovig et al. (2023) [6] and the trust-enhancing framework by Parker et al. (2024) [7].
Some researchers such as Jones and Sigall (1971) and Reynolds (1982) have emphasized alternative approaches like the Bogus Pipeline and Social Desirability Scales [8,9], yet RRT remains the most mathematically structured technique for anonymity in data collection. RRT models have been used extensively in real surveys. Ostapczuk et al. (2009) used a RRT model to examine the impact of higher education on attitudes towards immigrants in Germany [10]. Striegel et al. (2006) used RRT to study the prevalence of doping by athletes [11]. Kalucha et al. (2025) have used a complex RRT model to estimate the prevalence of depression among college students [12]. These studies show that RRT methodology can be used effectively in real surveys.
To evaluate the performance of RRT models, researchers have used unified measures that incorporate both estimator efficiency and respondent privacy. Contributions by Lanke (1976) [13], Fligner et al. (1977) [14], and Gupta et al. (2018) [15] have provided metrics that allow for comprehensive model comparisons. These techniques allow researchers to assess the trade-offs involved in improving estimator efficiency and protecting privacy.
The primary goal of this study is to fill a critical gap in binary RRT models where the significance of lack of trust has been acknowledged, as in Lovig et al. (2023) [6], but unlike the quantitative domain, trust enhancement has not been implemented in the binary domain. This study focuses on comparing three core RRT models: the Warner (1965) [1] indirect question model, the Greenberg et al. (1969) unrelated question model [2], and the Lovig et al. (2023) [6] mixture model. We show that the trust-enhanced models perform better than their basic counterparts with no trust enhancement. Simulation results and corresponding plots show that trust-enhanced models lead to greater estimation stability and overall model quality measured through a unified measure of model quality.

2. Trust Enhancement in RRT Models

The original binary Randomized Response Technique (RRT) was introduced by Warner in (1965) which offered respondents better privacy by letting them randomly choose the direct or the indirect version of the sensitive question [1]. For example, a respondent might face the direct question “did you cheat on the exam”, or the indirect question “were you honest on the exam”?. Clearly, a “yes” response is incriminating for the direct question but not for the indirect question. Note that the researcher does not know which question was answered. Since then, numerous other models have been developed, including the Greenberg et al. (1969) unrelated question model [2], each adding new dimensions to the estimation of sensitive trait prevalence. More recently, trust has emerged as a critical factor in the accuracy of these models, with researchers emphasizing the importance of accounting for it (Lovig et al. (2023)) [6] and exploring trust-enhancement approaches (Parker et al. (2024)) [7]. In this study, however, the emphasis will be placed on trust enhancement in the Greenberg model and the Lovig model.

2.1. Previous Models

The flow diagrams below provide representations of various RRT models. We will use the notations given in (Table 1) below:

2.1.1. Warner’s Model

Warner’s Model is illustrated in Figure 1.
The probability of a “yes” response under this model can be expressed as follows:
P y w = p π x + ( 1 p ) ( 1 π x ) .
In Warner’s model, each respondent receives either a sensitive question or an indirect form of that question, selected according to fixed probabilities using a randomization mechanism. Importantly, the interviewer remains unaware of which version of the question the respondent is answering. The diagram assumes the direct question is selected with probability p and the indirect question with probability 1 p .
From Equation (1), an unbiased estimator for π x is derived as follows:
π x ^ = P y w ^ ( 1 p ) 2 p 1 ; p 1 2 .
The variance of this estimator is given by the following:
V a r ( π x ^ ) = P y w ( 1 P y w ) n ( 2 p 1 ) 2 .
It is recommended that an ideal choice of p for the Warner model is away from 1 2 , but not too close to 0 or 1.

2.1.2. Greenberg’s Model

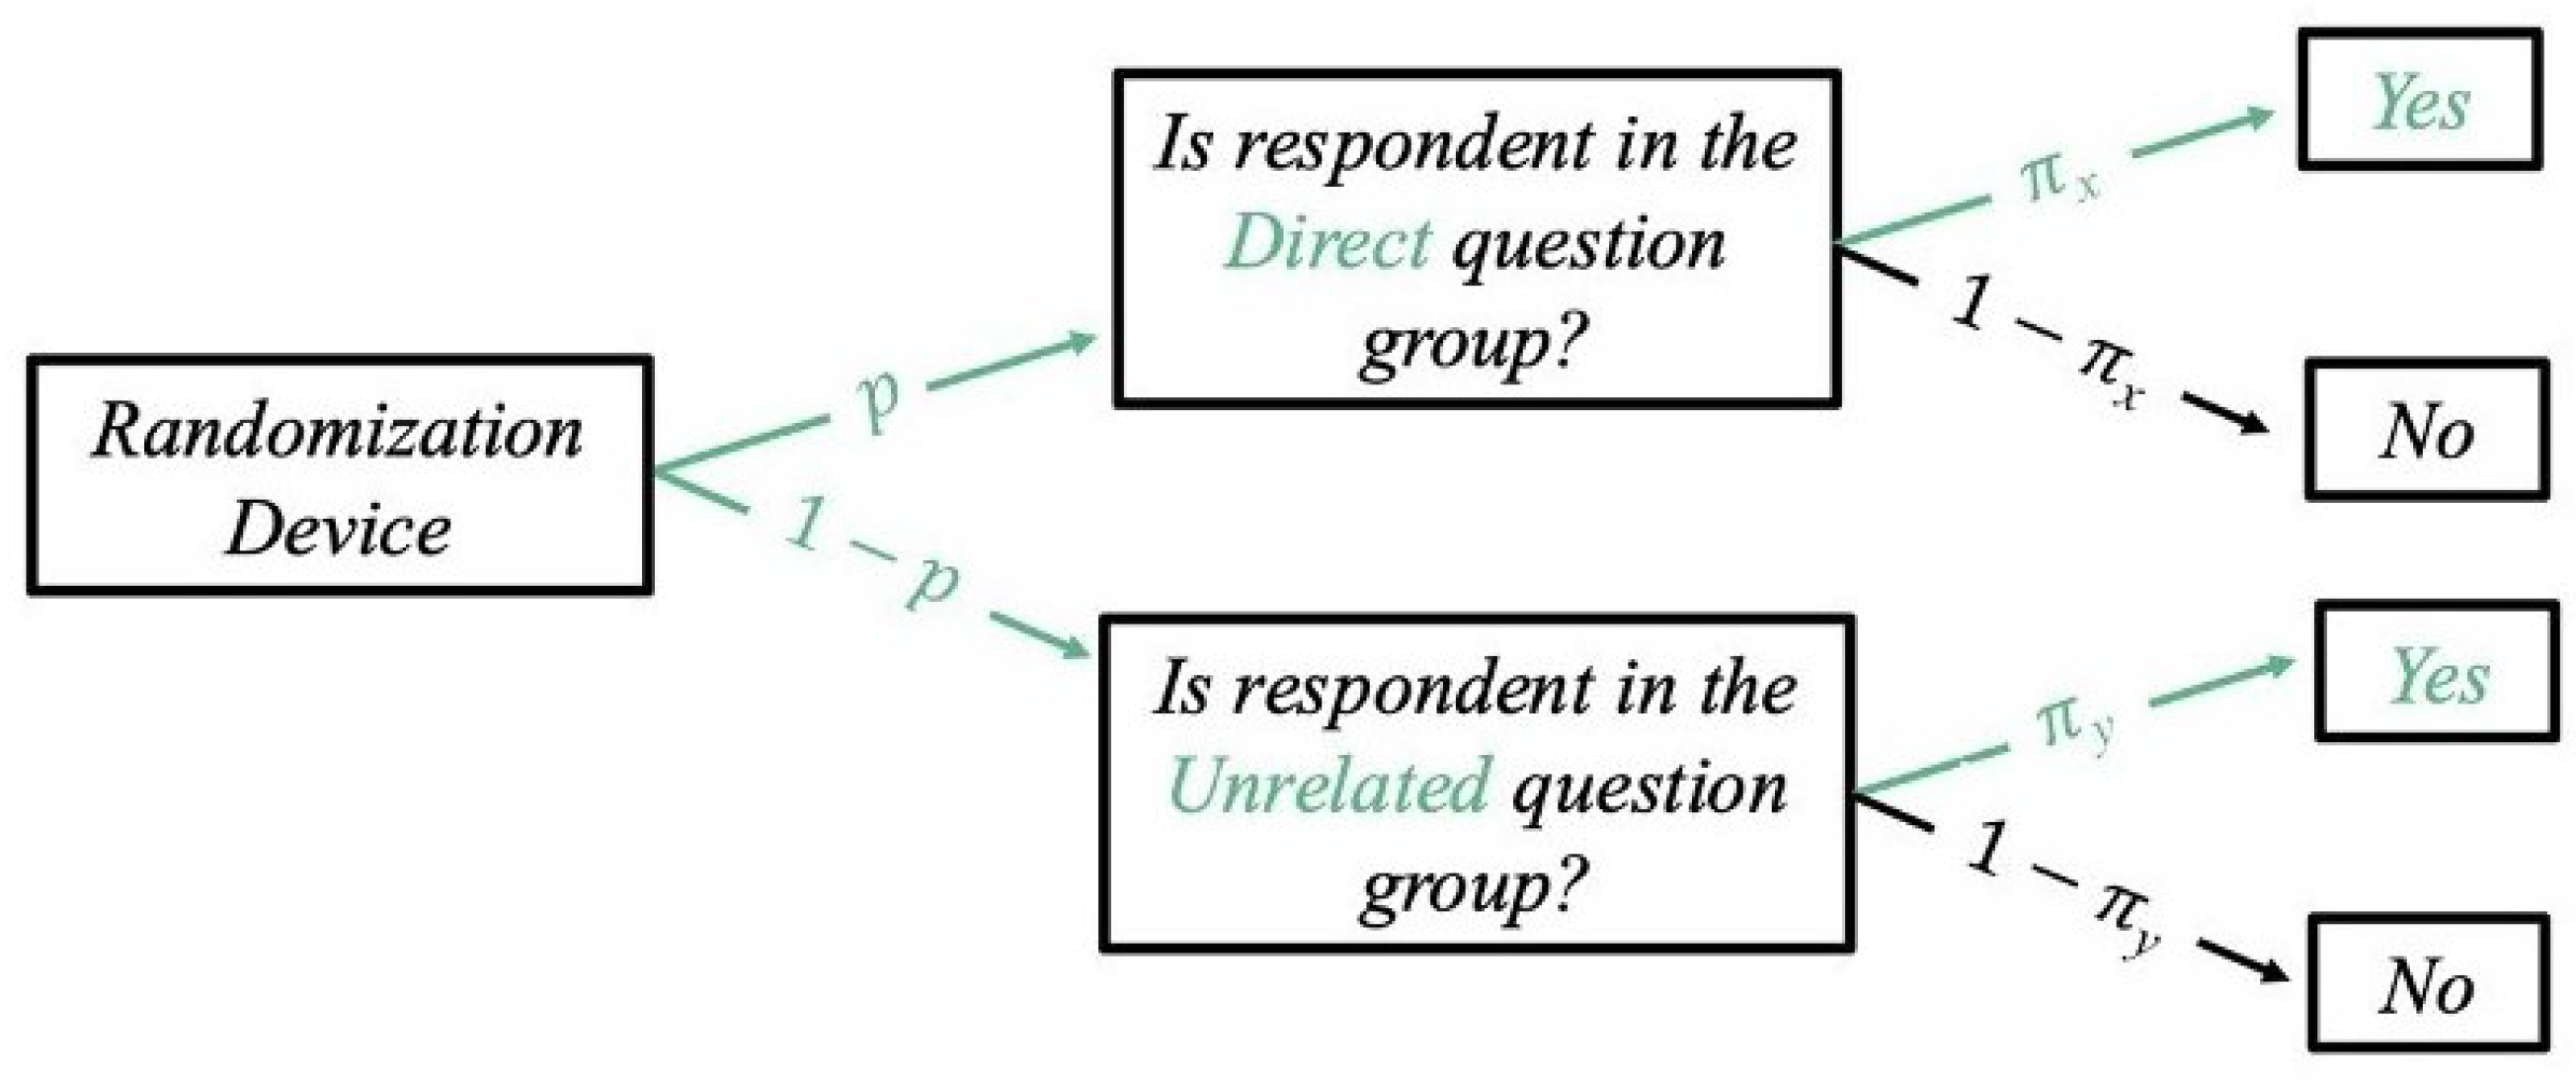
Greenberg’s Model is illustrated in Figure 2.
The probability of a “yes” response under this model can be expressed as follows:
P y g = p π x + ( 1 p ) π y .
In the Greenberg model, respondents are instructed to randomly select between answering the sensitive question or an entirely unrelated one. Because this selection is guided by a randomization device, the interviewer remains unaware of which question the respondent is addressing.
From Equation (2), an unbiased estimator for π x is derived as follows:
π x ^ = P y g ^ ( 1 p ) π y p .
The variance of this estimator is given by the following:
V a r ( π x ^ ) = P y g ( 1 P y g ) n p 2 .
An ideal choice of p for the Greenberg model is one that is greater than 1 3 where the model is shown to be more efficient than the Warner model. Many studies, such as Lovig et al. (2023), have used p = 0.7 . Lovig et al. (2023) used the April birth as the unrelated trait, and accordingly used π y = 0.1 , a value close to probability of April birth [6].

2.1.3. Lovig’s Mixture Model That Accounts for Untruthfulness

Lovig’s Mixture model is illustrated in Figure 3.
The probability of a “yes” response under this model can be expressed as follows:
P y L = π x A ( p q ) + q + ( 1 p q ) π y .
In Lovig’s model, the authors built upon the framework of the Kim and Warde (2005) [5] mixture model, where respondents randomly choose between the Warner model and the Greenberg model. Lovig extended this by emphasizing the role of trust and introducing a trichotomous design. In their approach, it is assumed that if respondents do not trust the model in incriminating situations, they will flip their correct response to a non-incriminating response, which will obviously be an incorrect response.
From Equation (3), the prevalence estimator is given by
π x ^ = P y L ^ q ( 1 p q ) π y A ^ ( p q ) ; p q .
The variance of this estimator is given by the following:
V a r ( π x ^ ) = P y L ( 1 P y L ) ( n 1 ) A 2 ( p q ) 2 .

3. Proposed Trust-Enhanced Binary RRT Framework

In our proposed models, we aim to bridge the gap between merely acknowledging potential lack of trust and actively enhancing trust. To this end, we introduce a new variant of the binary RRT that structurally embeds respondent trust enhancement into the model. Drawing inspiration from recent trust-enhancement approaches of Parker et al. (2024) [7], we propose two binary RRT models: an Enhanced-Trust Greenberg Model and an Enhanced-Trust Lovig Model. Although the trust-enhanced Lovig et al. (2023) model will prove to be the overall best among the competing models [6], we include trust-enhanced Greenberg et al. (1969) [2] model just to include an intermediate step that shows that it can do better than the ordinary Greenberg et al. (1969) model but is not best overall.

3.1. Our Proposed Enhanced-Trust Greenberg Model (Model-I)

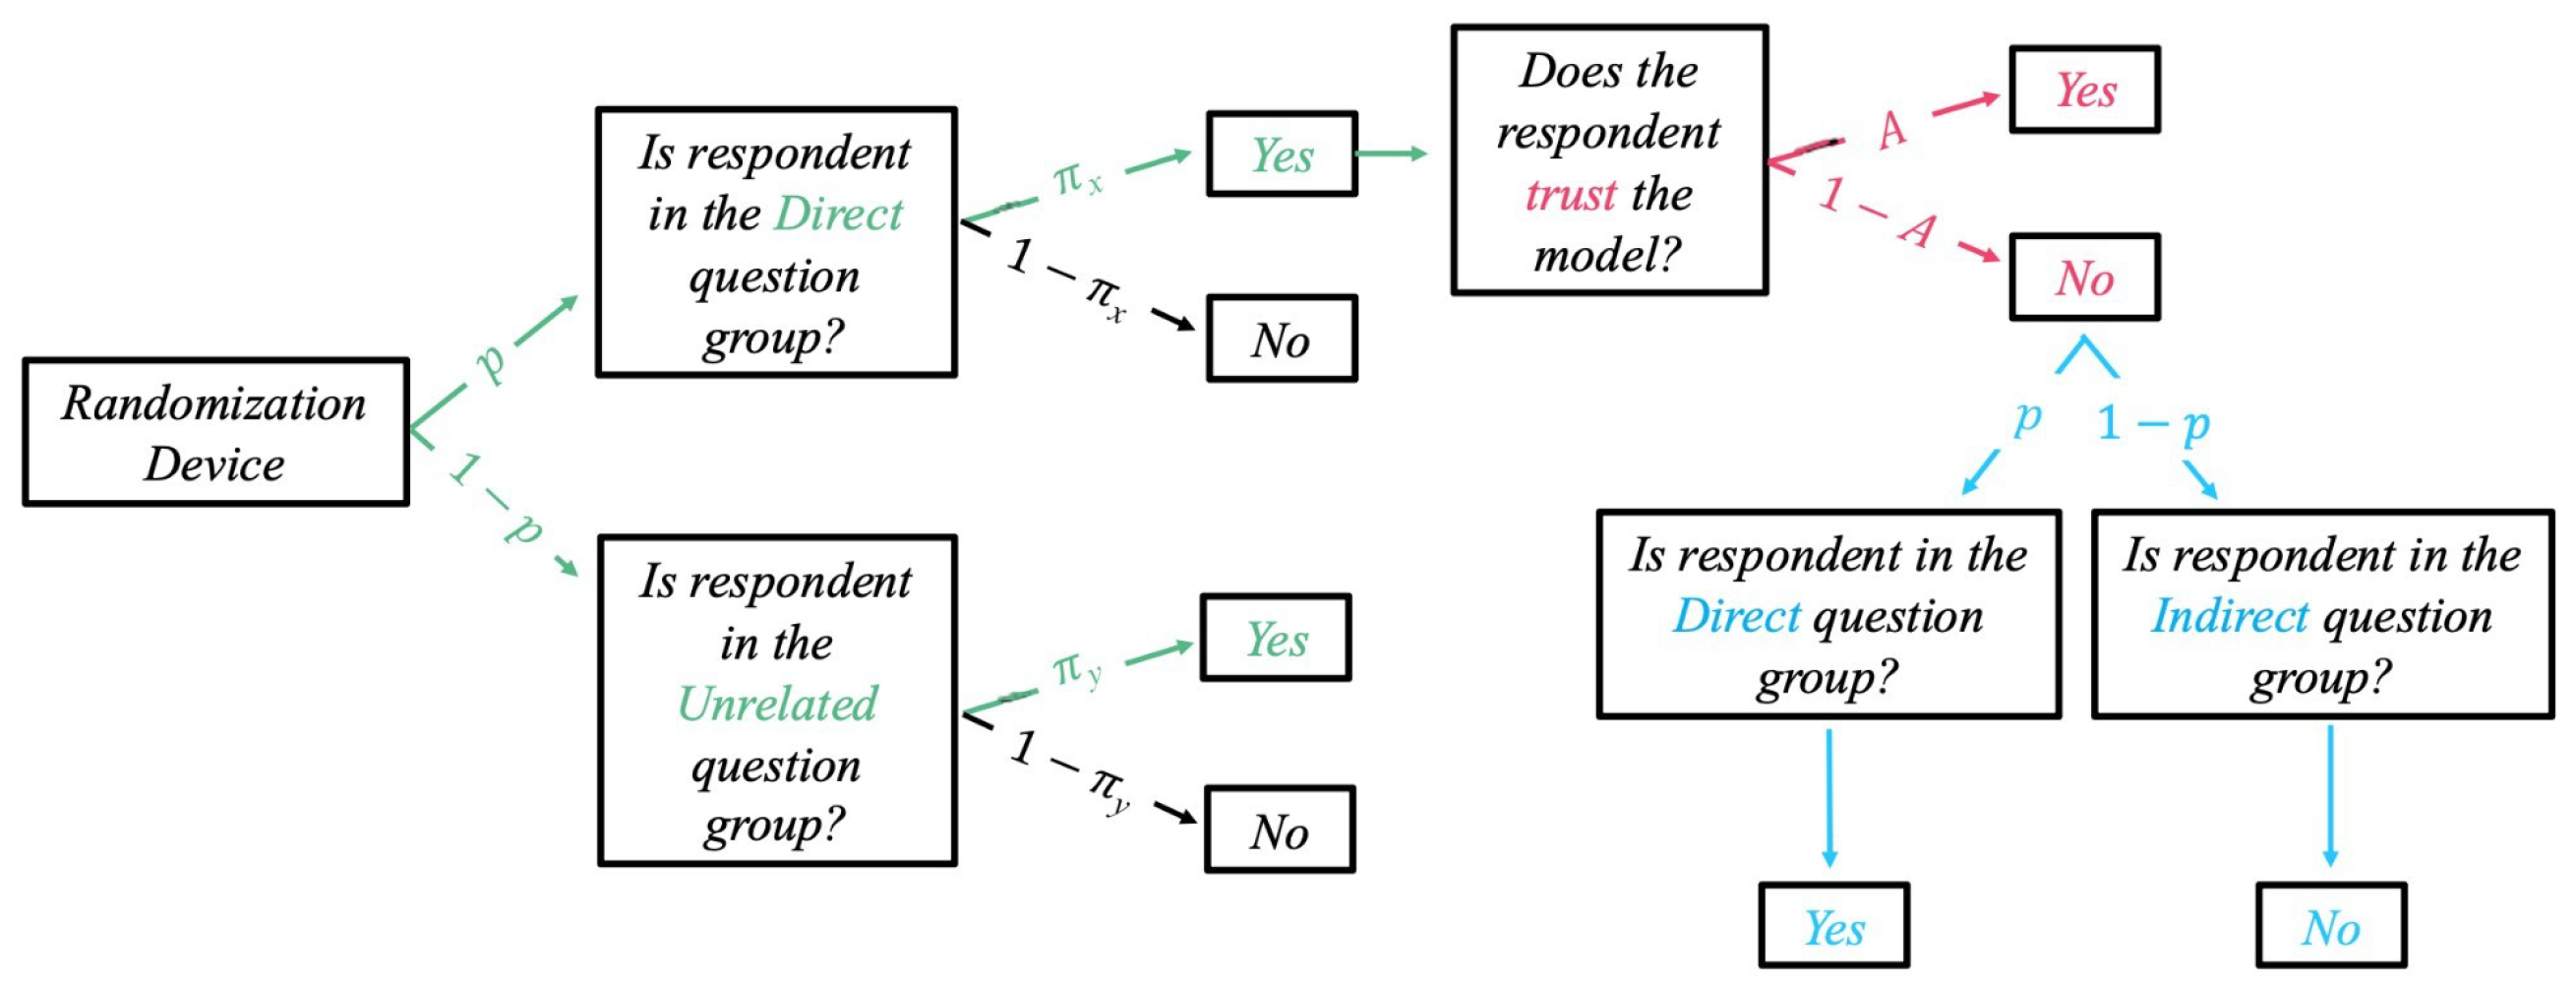
Proposed enhanced-trust Greenberg model (Model-I) is illustrated in Figure 4.
The probability of a “yes” response under this model can be expressed as follows:
P y n 1 = p π x A + p 2 π x ( 1 A ) + ( 1 p ) π y .
In this model, without the trust enhancement, a proportion p π x ( 1 A ) of the respondents would provide dishonest answers; however, with the enhanced-trust model, a proportion p of these inaccurate responses can be corrected.
From Equation (4), the prevalence estimator is given by
π x ^ = P y n 1 ^ ( 1 p ) π y p 2 ( 1 A ^ ) + p A ^ ,
where A ^ is the estimated trust parameter.

3.2. Our Proposed Enhanced-Trust Lovig Model (Model-II)

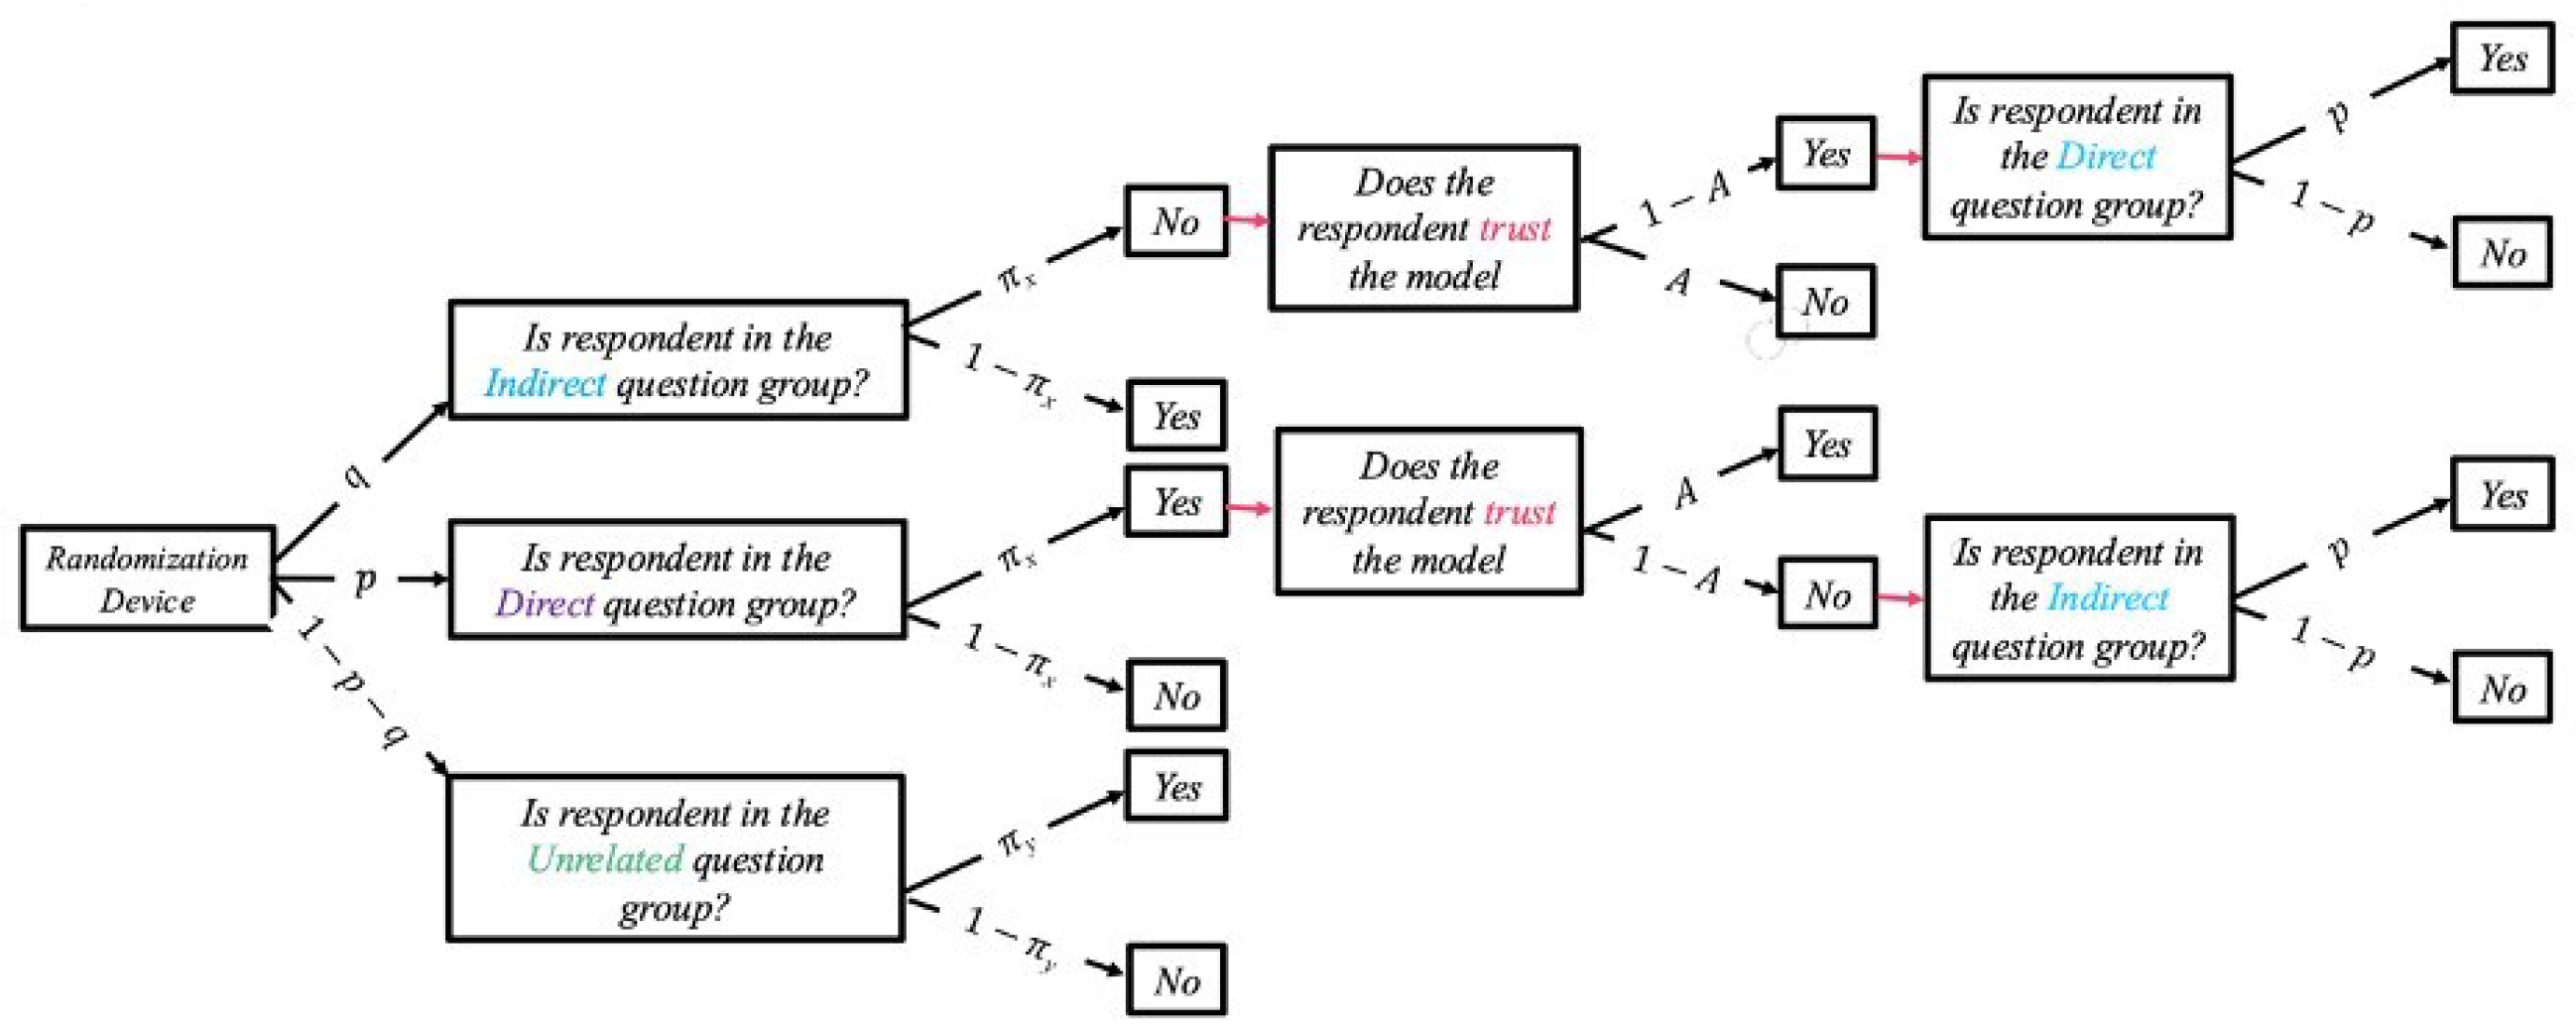
Proposed enhanced-trust Lovig model (Model-II) is illustrated in Figure 5.
The probability of a “yes” response under this model can be expressed as follows:
P y n 2 = p π x A + p 2 π x ( 1 A ) + q ( 1 π x ) + q π x ( 1 A ) p + ( 1 p q ) π y .
In this model, a proportion p π x ( 1 A ) + q π x ( 1 A ) of respondents would provide dishonest answers without trust enhancement. However, with the enhanced-trust model, a proportion p + q of these inaccurate responses can be corrected.
From Equation (5), the prevalence estimator is given by
π x ^ = P y n 2 ^ q ( 1 p q ) π y A ^ p ( 1 p q ) + q ( p 1 ) + p 2 .
It is important to point out that this prevalence estimator depends heavily on the accurate estimation of the trust parameter A. We will use the same approach as the one used by Lovig et al. (2023) and our simulation results confirm that A is estimated fairly accurately [6].

3.3. Effectiveness of the Mixture Model When Accounting for Untruthfulness

To address untruthfulness in our model, we adopt a two-question approach used by Lovig et al. (2023) [6]. The first question is designed to estimate A, and this is achieved using the Greenberg model. The second question then estimates the prevalence of the sensitive trait, utilizing the proposed mixture model. We applied this approach to both of our proposed models: the enhanced-trust Greenberg model and the enhanced-trust Lovig model.
Let
p 0 = the probability of direct questioning utilized in the Greenberg model for the assessment of Trust , π y 0 = the probability of the unrelated trait ,
where ( p , q , π x , π y , A , n ) are all the same as introduced in the proposed model described earlier.
  • Question 1 (With Greenberg Model): Do you trust the model?
The probability of a “yes” response and the resulting estimator are given by
P y o = P o ( y e s ) = p o A + ( 1 p o ) π y o , and
A ^ = P y o ^ ( 1 p o ) π y o p o .
Since, E ( P ^ y o ) = P y o and V a r ( P ^ y o ) = P y o ( 1 P y o ) n , it follows that
E ( A ^ ) = A , V a r ( A ^ ) = P y o ( 1 P y o ) n p o 2 .
  • Question 2 (Proposed Model-I): Do you have the sensitive trait?
The probability of a “yes” response and the resulting estimator are given by
P y n 1 = p π x A + p 2 π x ( 1 A ) + ( 1 p ) π y , and
π x ^ = P y n 1 ^ ( 1 p ) π y p 2 ( 1 A ^ ) + p A ^ ,
E ( P y n 1 ^ ) = P y n 1 , V a r ( P y n 1 ^ ) = P y n 1 ( 1 P y n 1 ) n .
To estimate the π ^ x and V ( π ^ x ) , we use a first-order Taylor’s approximation:
f ( x , y ) f ( a , b ) + ( x a ) f x ( a , b ) + ( y b ) f y ( a , b ) ,
with x = P y n 1 ^ , y = A ^ , a = P y n 1 , b = A in Equation (8), π x ^ can be approximated by the following:
π x ^ P y n 1 ( 1 p ) π y p 2 ( 1 A ) + p A + ( A ^ A ) P y n 1 ( 1 p ) π y p p 2 A [ p p 2 ] + p 2 2 +
( P y n 1 ^ P y n 1 ) 1 A ( p p 2 ) + p 2 .
Since E ( A ^ ) = A , V a r ( A ^ ) = P y o ( 1 P y o ) n p o 2 , it is easy to see from Equation (10) that,
E ( π x ^ ) π x , V ( π x ^ ) V P y n 1 ^ 1 A ( p p 2 ) + p 2 2 + V A ^ P y n 1 ( 1 p ) π y p p 2 A ( p p 2 ) + p 2 2 2 .
V ( A ^ ) is given in Equation (7) and V ( P y n 1 ^ ) is given in Equation (9). The calculations for the enhanced-trust Greenberg model will follow the same way as they do for the enhanced-trust Lovig model below.
  • Question 2 (Proposed Model-II): Do you have the sensitive trait?
The probability of a “yes” response and the resulting estimator are given by
P y n 2 = p π x A + p 2 π x ( 1 A ) + q ( 1 π x ) + q π x ( 1 A ) p + ( 1 p q ) π y , and
π x ^ = P y n 2 ^ q ( 1 p q ) π y A p ( 1 p q ) + q ( p 1 ) + p 2 ,
E ( P y n 2 ^ ) = P y n 2 , V a r ( P y n 2 ^ ) = P y n 2 ( 1 P y n 2 ) n .
To estimate π x , we use a first-order Taylor’s approximation:
f ( x , y ) f ( a , b ) + ( x a ) f x ( a , b ) + ( y b ) f y ( a , b ) ,
with x = P y n 2 ^ , y = A ^ , a = P y n 2 , b = A in Equation (11), π x ^ can be approximated by the following:
π x ^ P y n 2 ^ q ( 1 p q ) π y A p ( 1 p q ) + q ( p 1 ) + p 2 + ( A ^ A ) ( P y n 2 r ) ( p ( 1 p q ) ) ( α + β ) 2 + ( P y n 2 ^ P y n 2 ) 1 α + β ,
where α = A p ( 1 p q ) , β = q ( p 1 ) + p 2 and r = q ( 1 p q ) π y . Since, E ( A ^ ) = A , V a r ( A ^ ) = P y o ( 1 P y o ) n p o 2 , E ( P y n 2 ^ ) = P y n 2 , and V a r ( P y n 2 ^ ) = P y n 2 ( 1 P y n 2 ) n . It is easy to see from Equation (13) that
E ( π x ^ ) π x V ( π x ^ ) P y n 2 ^ q ( 1 p q ) π y A p ( 1 p q ) + q ( p 1 ) + p 2 + V ( A ^ ) ( P y n 2 r ) 2 ( p ( 1 p q ) ) 2 ( α + β ) 4 + V ( P y n 2 ^ ) 1 ( α + β ) 2 .
V ( A ^ ) is given in Equation (7) and V ( P y n 2 ^ ) is given in Equation (12).

3.4. Preservation of Privacy in the Proposed Models

When parameters are estimated using Randomized Response Technique (RRT) models, safeguarding the privacy of respondents is equally critical. If privacy is not adequately protected, individuals may either refuse to answer or provide dishonest responses. To address this concern, Lanke (1976) [13] proposed a metric to assess the extent of privacy loss in a model, as described below.
Let
P ( S Y ) = The probability that an individual belongs to the sensitive group , given that the response is Yes P ( S N ) = The probability that an individual belongs to the sensitive group , given that the response is No Privacy Loss = max ( P ( S Y ) , P ( S N ) ) = η .
Note that η represents the maximum predictability of the sensitive trait based on the reported response. Fligner et al. (1977) call normalized ( 1 η ) as privacy protection [14]. It is defined as
P P = 1 η 1 π x .
Note that in a completely truthful survey, there will be complete privacy loss and hence η will be 1, and privacy protection will be zero.

3.5. Proposed Unified Metric

Lovig et al. (2023) proposed a unified metric that captures both privacy and efficiency [6], and used it to define the overall model quality. It is expressed as follows:
M = P P Estimator Variance .

3.6. Privacy of the Proposed Models

Following Lanke (1976) [13], privacy loss η for the proposed enhanced-trust Lovig model is given by
η = Max ( η 1 , η 2 ) , where η 1 = P r ( S | Y ) = P Y S P ( Y ) = q π x ( 1 A ) p + p π x A + p π x ( 1 A ) p + ( 1 p q ) π x π y P y n 2 η 2 = P r ( S | N ) = P N S P ( N ) = q π x ( 1 A ) ( 1 p ) + q π x A + p π x ( 1 A ) ( 1 p ) + ( 1 p q ) ( 1 p i y ) π x 1 P y n 2 .
Calculations for the proposed enhanced-trust Greenberg model will follow by putting q = 0 and calculations for the Warner model will follow by putting q = 1 p .

4. Simulation Study

A simulation study was conducted in MATLAB (https://matlab.mathworks.com/) to evaluate the performance of the proposed estimators and to compare them with existing models. For better comparison, we followed the parameter choices used by Lovig et al. (2023) [6].
Each simulation consisted of 10,000 independent repetitions, where random responses were generated under different trust levels A = 1 , 0.9 , and 0.8 . For every iteration, we save the estimator π ^ x . These 10,000 values are averaged to obtain the final estimate of π x and the variance of these 10,000 values is used as the empirical value of V a r ( π ^ x ) . Privacy loss η is calculated for each iteration and is used to calculate empirical privacy protection. Empirical variance and the empirical privacy protection are used to calculate empirical unified measure M. The corresponding theoretical values are calculated analytically using the parameter values.
The results, summarized in Table 2, indicate that the prevalence estimator π ^ x is very close to the true prevalence value of 0.4 , confirming unbiasedness. Moreover, the empirical variances closely match the theoretical ones, supporting the accuracy of the derived expressions. As expected, the estimator efficiency ( V a r ( π ^ x ) decreases as the trust level A declines, demonstrating the trade-off between respondent trust and estimator precision.

4.1. Numerical Results

The table below summarizes results of our simulations.
We can make several observations from the numerical results in Table 2. Since the π x estimation depends on the estimation of the trust parameter A, it is important that A ^ is an unbiased estimator of A. The close match between the A and A ^ columns confirms this. The estimate of π x under each model is very close to the true π x value of 0.4 . This validates the unbiasedness of the prevalence estimator under all four models. When we look at the stability of the prevalence estimators through their variances, it is clear that the enhanced-trust Greenberg model does better than the basic Greenberg model (lower variance). Similarly, the enhanced-trust Lovig model performs better than the ordinary Lovig model. An observation that might sound misleading at first sight is that the enhanced-trust models have lower privacy protection than their ordinary counterparts. This is because the enhanced-trust models have a greater proportion of truthful responses as compared to their basic counterparts. Note that a completely truthful survey has zero privacy protection. In terms of the overall model quality measured through the unified measure M, the enhanced-trust Lovig model performs the best since it gives higher M values at each trust level as compared to the other three models.
One can also note that if one focuses only on the privacy protection and ignores estimator efficiency, then the Lovig models perform better since they involve more scrambling. If we focus only on the efficiency (estimator variance), then the Greenberg models perform better because they involve lesser scrambling. However, if we compare the models through the unified measure, as we should, the enhanced-trust Lovig model performs the best.
Comparing the empirical estimates to their theoretical counterparts, we observe that the empirical results align well with theoretical expectations, validating the robustness of the simulation design.

4.2. Graphical Comparison of the Models

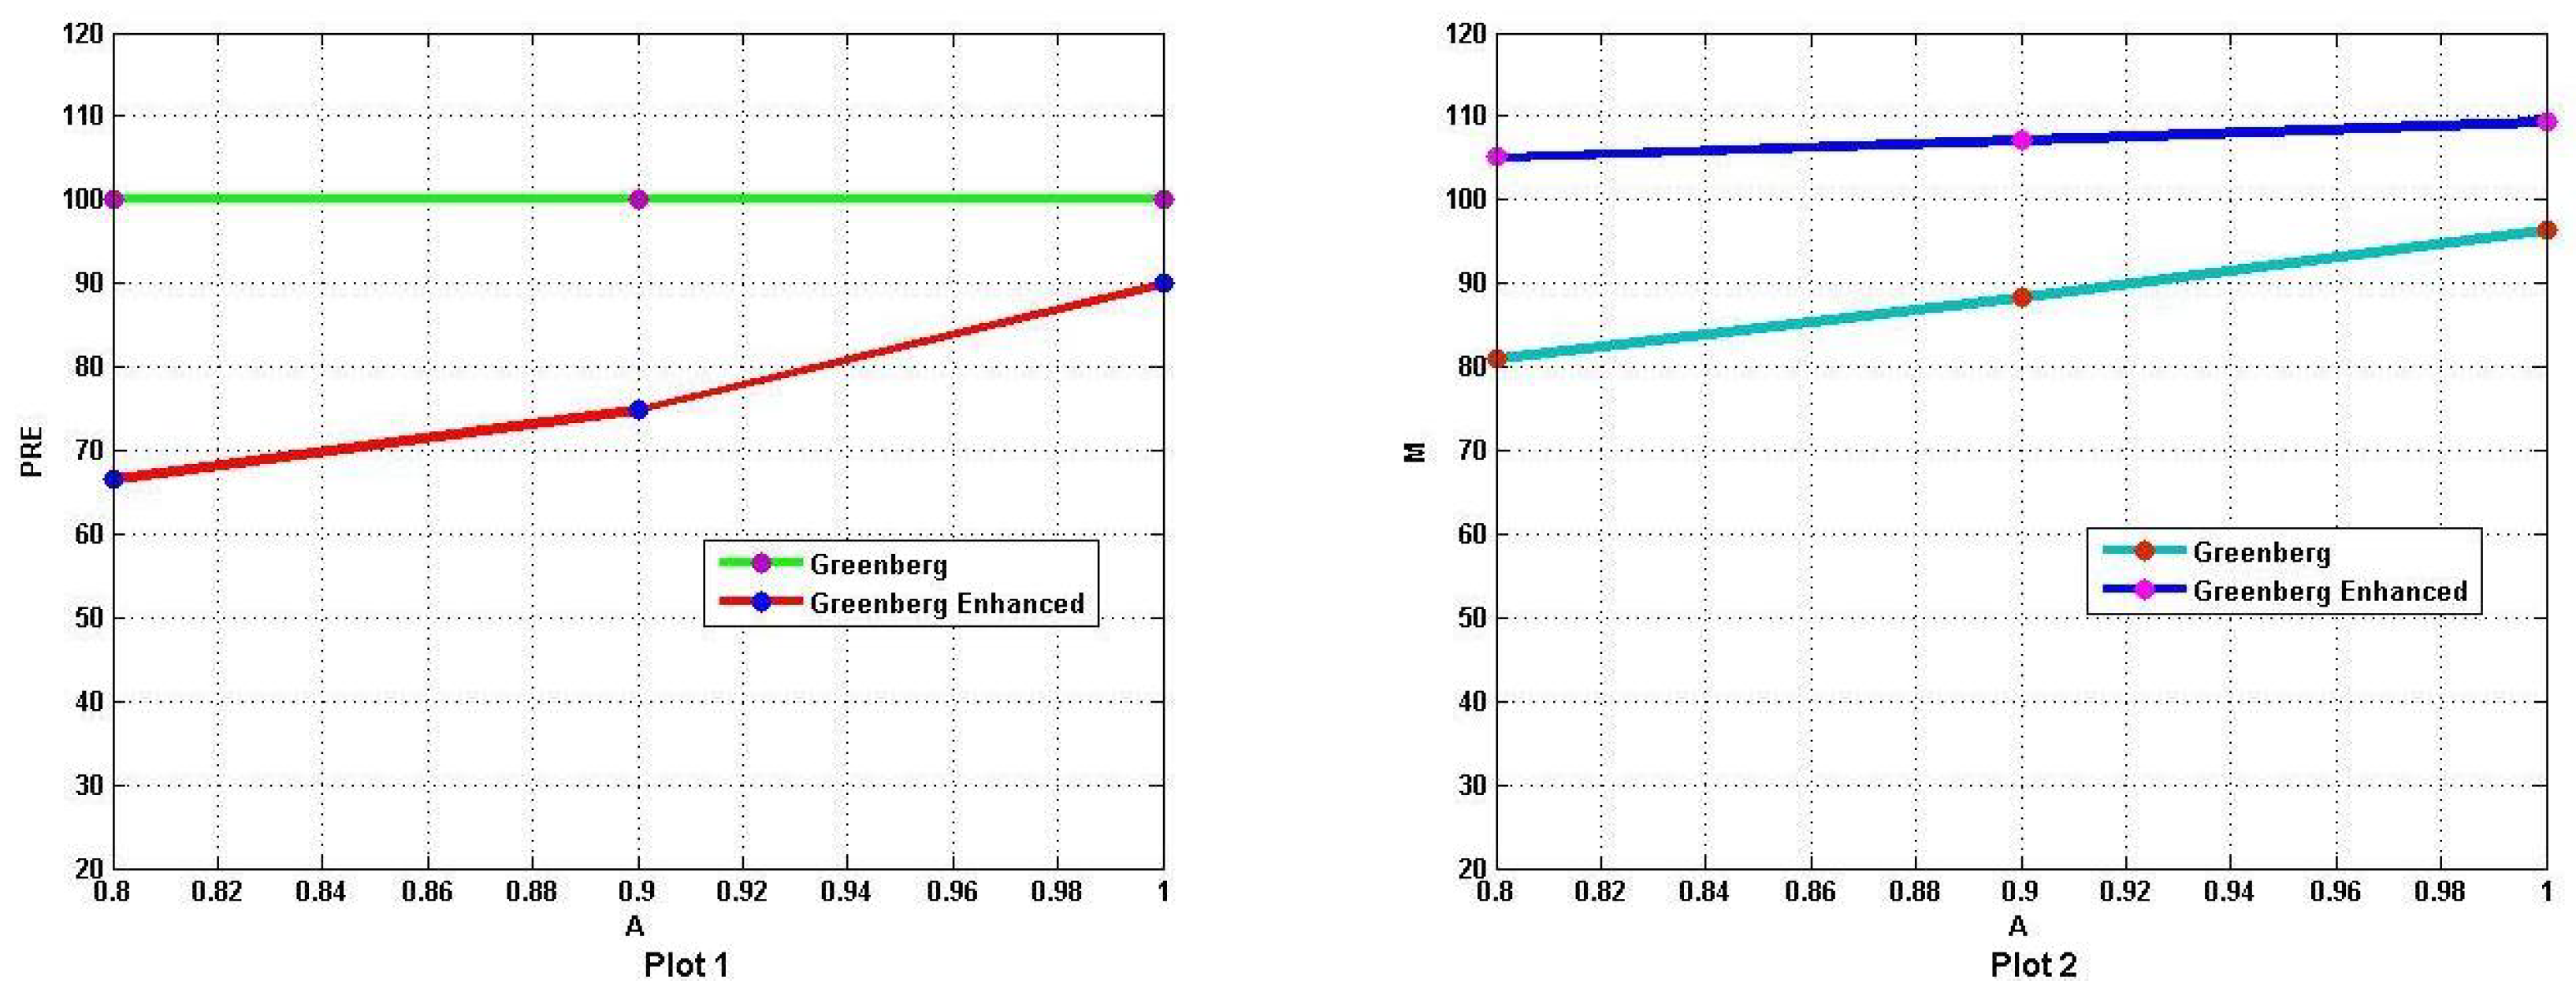
As further evidence of the usefulness of trust enhancement, we provide below plots comparing the trust-enhanced models with their basic counterparts (Figure 6 and Figure 7). Plots 1 and 3 provide percent relative efficiency (PRE) of the trust-enhanced models using the definition.
PRE of Model 1 relative to Model 2 = Estimator Variance under Model 1 Estimator variance under Model 2 .
Both plots show higher PRE value for the trust-enhanced models. Plots 2 and 4 provide a comparison of the overall model quality measured through the unified measure M. It is clear that the trust-enhanced models perform better than their ordinary counterparts.

4.3. Estimator Stability Under Different Models

The following graphs provide 95% confidence intervals for the prevalence parameter π ^ x under the four models for A = 0.9 , using the formula
π ^ x ± 1.96 Var ^ ( π ^ x ) 500 .
The four confidence intervals are as follows:
  • Greenberg Model:
    0.3999 ± 1.96 0.0011 500 = 0.3999 ± 0.0029
  • Enhanced-Trust Greenberg Model:
    0.4000 ± 1.96 0.0009 500 = 0.4000 ± 0.0026
  • Lovig Model:
    0.4006 ± 1.96 0.0020 500 = 0.4006 ± 0.0039
  • Enhanced-Trust Lovig Model:
    0.3998 ± 1.96 0.0017 500 = 0.3998 ± 0.0036
Although the efficiencies are not very different, there will be a lesser degree of respondent cooperation without enhancement of trust. That loss of cooperation is not visible in a simulation study(where responses are programmed correctly and there is no non-response) but can be very damaging in a real field survey.

5. Study Limitations and Future Directions

5.1. Limitations

The main limitation of the study is that the ultimate prevalence estimate depends critically on the estimation of the Trust parameter A. A poor estimate of A will in turn lead to a less accurate estimate of the prevalence. This phenomenon is noticed in a recent field study by Kalucha et al. (2025) [12]. Extra attention is needed during this step. Another limitation is that survey researchers in the RRT domain do not have a perfect method for selecting the model parameters p and q. The only theoretical guidance is that we should have p > 1 3 and that p should be sufficiently away from 0.5 . Keeping these two conditions in mind, we have used p = 0.7 and q = 0.15 . The same choices were used in Lovig et al. (2023) [6].

5.2. Future Directions

The focus of the current study was to develop a theoretical trust-enhanced model and validate it through simulations. However, one could consider implementing these models in a field study on the lines of Kalucha et al. (2025) where a RRT model was used to estimate prevalence of depression among college students [12]. RRT has been used extensively in health sciences and social sciences, and one can use the proposed models in these fields.

Author Contributions

Conceptualization, S.G.; Methodology, S.G., N.J., M.G. and P.T.; Software, N.J., M.G. and P.T.; Validation, S.G., N.J., M.G. and P.T.; Formal analysis, S.G., N.J., M.G. and P.T.; Investigation, S.G. and P.T.; Resources, S.G.; Writing—original draft, N.J., M.G. and P.T.; Writing—review & editing, S.G. and P.T.; Visualization, S.G., N.J., M.G. and P.T.; Supervision, S.G.; Funding acquisition, S.G. All authors have read and agreed to the published version of the manuscript.

Funding

This research was supported by the NSF REU grant DMS-2244160.

Data Availability Statement

Data are contained within the article.

Acknowledgments

The authors appreciate the suggestions by the reviewers which helped improve the presentation significantly.

Conflicts of Interest

The authors declare no conflicts of interest.

References

  1. Warner, S.L. Randomized response: A survey technique for eliminating evasive answer bias. J. Am. Stat. Assoc. 1965, 60, 63–69. [Google Scholar] [CrossRef] [PubMed]
  2. Greenberg, B.G.; Abul-Ela, A.-L.A.; Simmons, W.R.; Horvitz, D.G. The unrelated question randomized response model: Theoretical framework. J. Am. Stat. Assoc. 1969, 64, 520–539. [Google Scholar] [CrossRef]
  3. Mangat, N.S.; Singh, R. An alternative randomized response procedure. Biometrika 1990, 77, 439–442. [Google Scholar] [CrossRef]
  4. Gupta, S.; Gupta, B.; Singh, S. Estimation of the sensitivity level of personal interview survey questions. J. Stat. Plan. Inference 2002, 100, 239–247. [Google Scholar] [CrossRef]
  5. Kim, J.-M.; Warde, W.D. A mixed randomized response model. J. Stat. Plan. Inference 2005, 113, 211–221. [Google Scholar] [CrossRef]
  6. Lovig, M.; Khalil, S.; Rahman, S.; Sapra, P.; Gupta, S. A mixture binary RRT model with a unified measure of privacy and efficiency. Commun. Stat. - Simul. Comput. 2023, 52, 2727–2737. [Google Scholar] [CrossRef]
  7. Parker, M.; Gupta, S.; Khalil, S. A Mixture Quantitative Randomized Response Model That Improves Trust in RRT Methodology. Axioms 2024, 13, 11. [Google Scholar] [CrossRef]
  8. Jones, E.E.; Sigall, H. The bogus pipeline: A new paradigm for measuring affect and attitude. Psychol. Bull. 1971, 76, 349–364. [Google Scholar] [CrossRef]
  9. Reynolds, W.M. Development of a reliable and valid short form of the Marlowe-Crowne SDB scale. J. Clin. Psychol. 1982, 38, 119–125. [Google Scholar] [CrossRef]
  10. Ostapczuk, M.; Musch, J.; Moshagen, M. A randomized-response investigation of the education effect in attitudes towards foreigners. Eur. J. Soc. Psychol. 2009, 39, 920–931. [Google Scholar] [CrossRef]
  11. Striegel, H.; Simon, P.; Hansel, J.; Niess, A.M.; Ulrich, R. Doping and drug use in elite sports: An analysis using the randomized response technique. Med. Sci. Sport. Exerc. 2006, 38, S247. [Google Scholar] [CrossRef]
  12. Kalucha, G.; Khalil, S.; Gupta, M.; Gupta, S. Estimating the Prevalence of Depression Among College Students — Field Validation of a Complex Randomized Response Technique. J. Stat. Theory Pract. 2025, 19, 96. [Google Scholar] [CrossRef]
  13. Lanke, J. On the degree of protection in randomized interviews. Int. Stat. Rev. Rev. Int. Stat. 1976, 44, 197–203. [Google Scholar] [CrossRef]
  14. Fligner, M.A.; Policello, G.E.; Singh, J. A comparison of two randomized response survey methods with consideration for the level of respondent protection. Commun. Stat. Theory Methods 1977, 6, 1511–1524. [Google Scholar] [CrossRef]
  15. Gupta, S.; Mehta, S.; Shabbir, J.; Khalil, S. A unified measure of respondent privacy and model efficiency in quantitative RRT models. J. Stat. Theory Pract. 2018, 12, 506–511. [Google Scholar] [CrossRef]
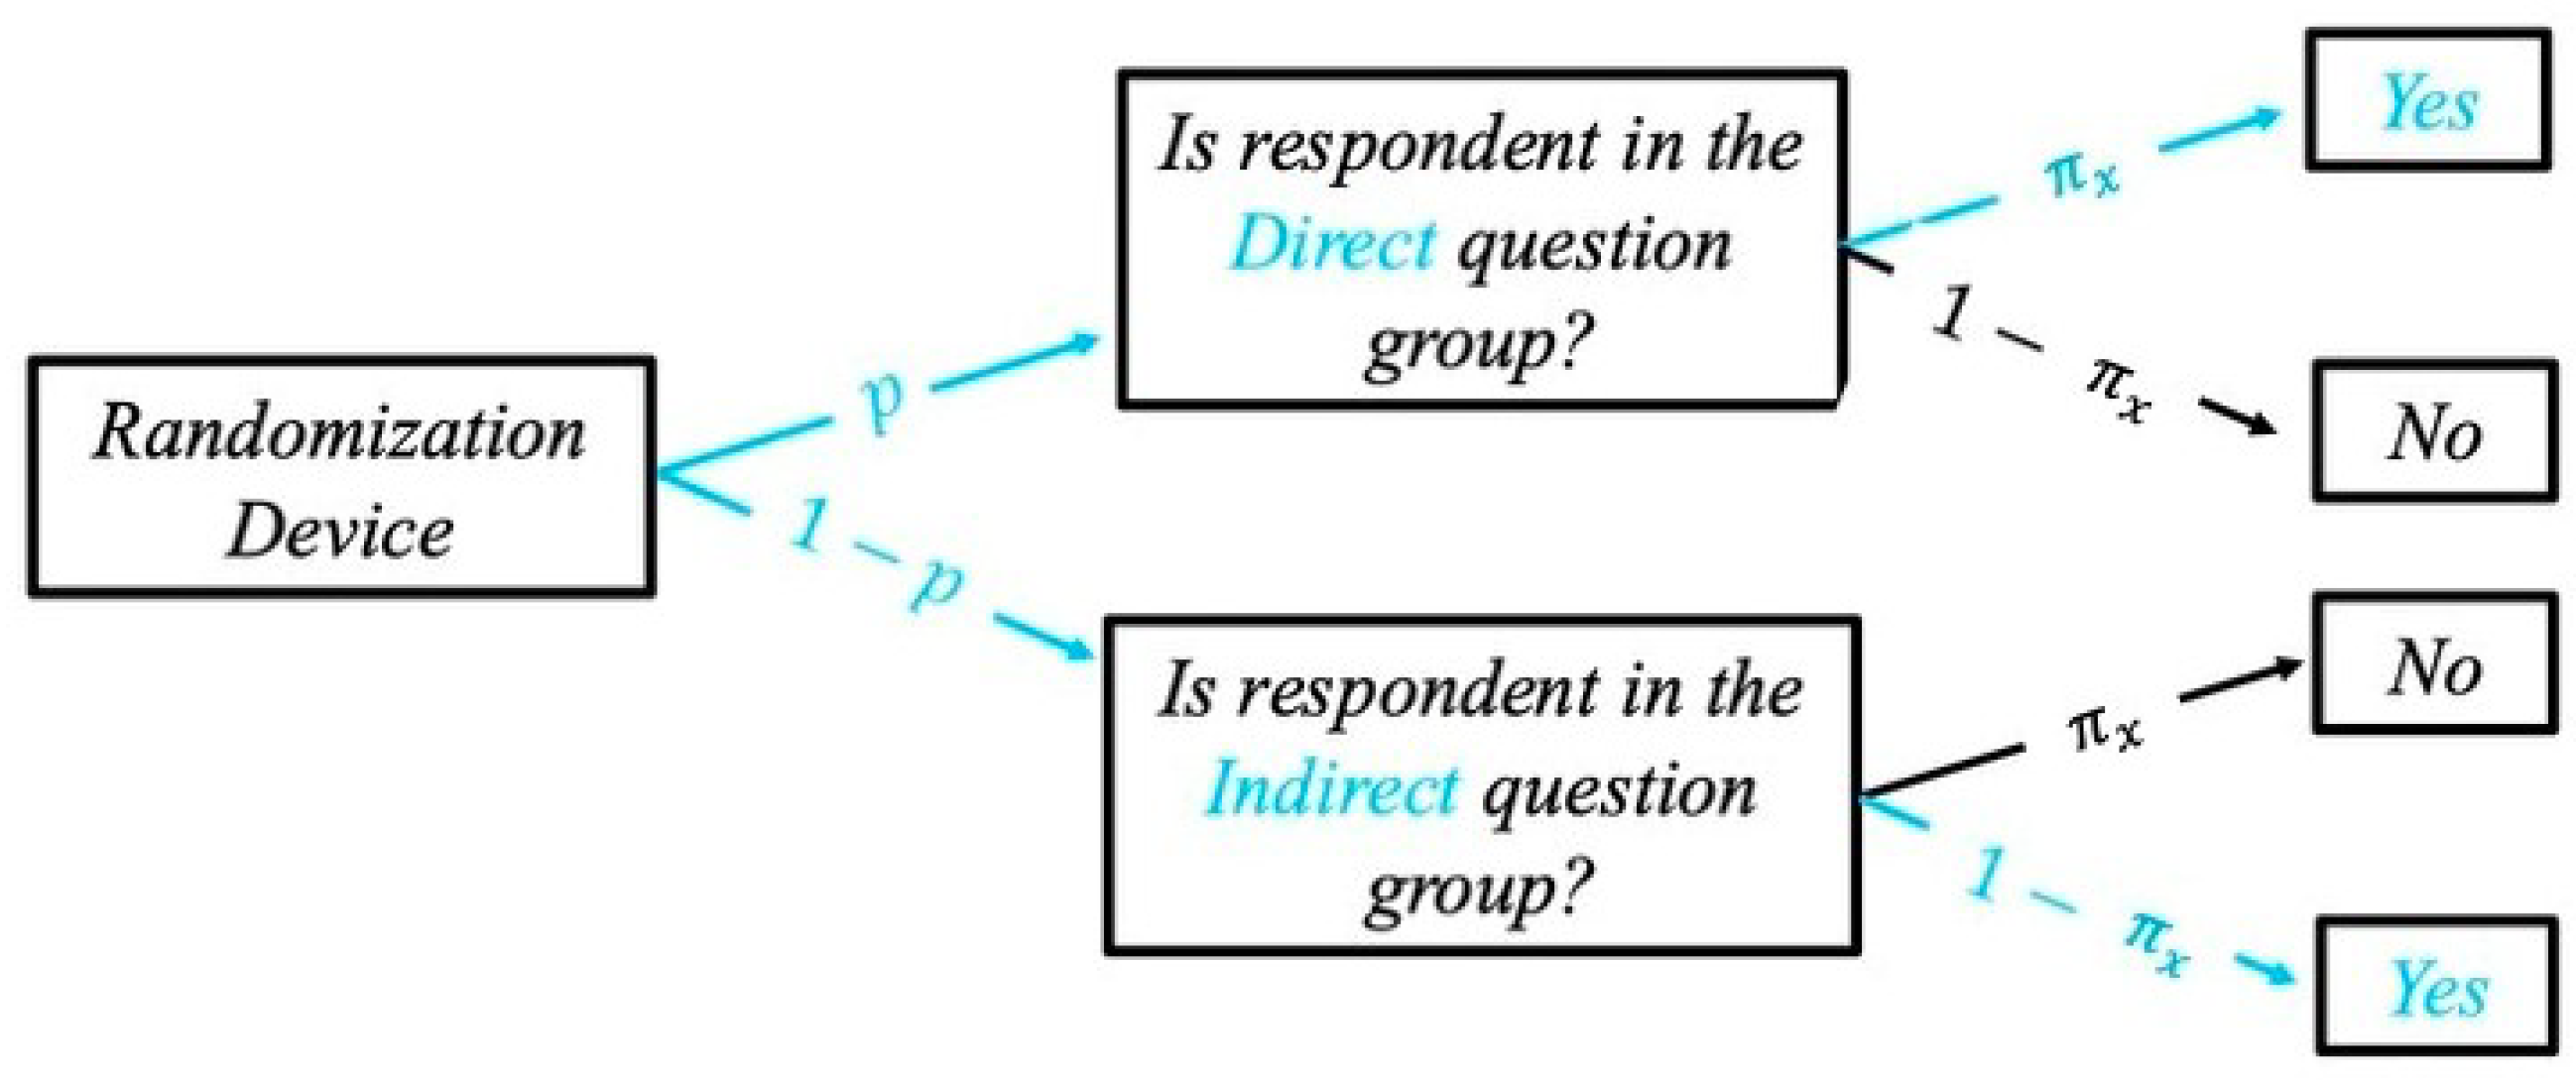
Figure 1. Warner’s Model.
Axioms 14 00864 g001
Figure 2. Greenberg’s Model.
Axioms 14 00864 g002
Figure 3. Lovig’s Mixture model.
Axioms 14 00864 g003
Figure 4. Proposed enhanced-trust Greenberg model (Model-I).
Axioms 14 00864 g004
Figure 5. Proposed enhanced-trust Lovig model (Model-II).
Axioms 14 00864 g005
Figure 6. PRE and M for Greenberg and Greenberg-enhanced models for varying A.
Axioms 14 00864 g006
Figure 7. PRE and M for Lovig and Lovig-enhanced models for varying A.
Axioms 14 00864 g007
Table 1. Notation and definitions used in the RRT models.
SymbolDescription
nsample size (number of respondents).
pprobability that the respondent is in the direct question group.
qprobability that the respondent is in the indirect question group.
1 p q probability that the respondent is in the unrelated question group.
π x prevalence of the sensitive trait in the target population.
π y proportion of the unrelated trait in the target population (such as prevalence of April births).
Aproportion of respondents who trust the underlying RRT model and provide a response as per the model instructions.
1 A proportion of the respondents who do not trust the RRT methodology to protect their privacy if the model-based response is incriminating, and switch their response from “yes” to “no”, or from “no” to “yes” to avoid incrimination and maintain social desirability.
P y w probability of the respondent entering a “yes” response for Warner’s Model.
P y g probability of the respondent entering a “yes” response for Greenberg’s model.
P y L probability of the respondent entering a “yes” response for Lovig’s model.
P y n 1 probability of the respondent entering a “yes” response for the Enhanced-Trust Greenberg model.
P y n 2 probability of the respondent entering a “yes” response for the Enhanced-Trust Lovig model.
p 0 the probability of direct questioning utilized in the Greenberg model for the assessment of Trust.
π y 0 the probability of the unrelated trait in the Greenberg model for the assessment of Trust.
θ ^ the estimated value of the parameter θ .
Table 2. Theoretical and empirical values based on 10,000 iterations ( n = 500 , π x = 0.4 , π y = 0.1 ).
Modelpq1-p-qA A ^ π ^ x Var ( π x ^ ) Var ( π x ^ ) ^ PP PP ^ M M ^
Greenberg0.70.3011.00020.40010.00100.00100.09680.096896.409199.1116
0.90.90060.39990.00120.00110.10640.106288.386194.2058
0.80.80050.40030.00150.00130.11810.117880.997988.5820
Greenberg0.70.3010.99980.39940.00090.00090.09680.1132109.3931103.9980
Enhanced 0.90.89980.40000.00090.00090.09950.1128107.2141109.1430
0.80.80020.39880.00100.00100.10230.1121105.1185106.8716
Lovig0.70.150.1511.00010.40020.00160.00170.42860.4291252.2162251.2180
0.90.89980.40060.00210.00200.45450.4551219.3250225.2544
0.80.79990.40060.00260.00250.48390.4842188.0234194.8597
Lovig0.70.150.1511.00020.40050.00160.00150.42860.4283272.9501279.7032
Enhanced 0.90.90060.39980.00160.00170.43330.4334266.5181254.9553
0.80.79980.39910.00170.00170.43810.4387260.1536251.2456
Disclaimer/Publisher’s Note: The statements, opinions and data contained in all publications are solely those of the individual author(s) and contributor(s) and not of MDPI and/or the editor(s). MDPI and/or the editor(s) disclaim responsibility for any injury to people or property resulting from any ideas, methods, instructions or products referred to in the content.