Article

Optimizing Textile Manufacturing with an MX/G/1 Queueing Model: Two Heterogeneous Services, Bernoulli Vacations, and Disaster–Repair Interventions

by
Logapriya Balasubramaniam
1,*,
Saeid Jafari
2,*,
Vidhya Dhayalan
3 and
Shobana Arunachalam
4
1
Department of Science and Humanities, Karpagam College of Engineering, Coimbatore 641032, India
2
Department of Mathematics, College of Vestsjaelland South Herrestarede 11, DK 4200 Slagelse, Denmark
3
Department of Science and Humanities, Karpagam Institute of Technology, Coimbatore 641021, India
4
Department of Science and Humanities, Nehru Institute of Technology, Coimbatore 641105, India
*
Authors to whom correspondence should be addressed.
Axioms 2025, 14(12), 863; https://doi.org/10.3390/axioms14120863
Submission received: 1 November 2025 / Revised: 17 November 2025 / Accepted: 21 November 2025 / Published: 25 November 2025
(This article belongs to the Special Issue Numerical Analysis and Applied Mathematics)

Abstract

This study investigates an M X / G / 1 queueing system tailored to the textile manufacturing industry, incorporating two heterogeneous service types, Bernoulli vacation schedules, and the effects of disasters and repairs. The system handles bulk fabric arrivals following a Poisson process, where customers can opt for either standard finishing or advanced finishing services. Disasters such as equipment malfunctions cause system interruptions, necessitating stochastic repair periods, while Bernoulli vacation schedules allow the machines to take probabilistic vacations based on operational conditions. By employing the supplementary variable technique, the probability generating function (PGF) for the number of customers in the system is obtained. Key performance metrics are derived alongside rate arguments to analyze system behavior comprehensively. Numerical techniques are utilized to explore and illustrate the influence of model parameters, providing practical insights for optimizing resource allocation, enhancing production efficiency, and maintaining system reliability in textile manufacturing operations.

1. Introduction

Queueing systems play a vital role in the analysis and optimization of service and manufacturing processes, especially during interruptions, service variability, and in crucial workload management. This study focuses on modeling an M X / G / 1 queueing system characterized by two heterogeneous services, Bernoulli vacation schedules, and the influence of disasters and repairs. The concept of heterogeneous services reflects real-world settings where a server offers two distinct types of service differing in complexity, resource requirements, or in time. Disasters represent system-wide failures that interrupt operations, necessitating repair periods to restore functionality. The inclusion of a Bernoulli vacation schedule adds flexibility by allowing the server to probabilistically decide on taking a vacation. In this study, these features are integrated into a unified framework to derive key system performance metrics, including the probability generating function (PGF) for the number of customers in the system, using the supplementary variable technique.
The present study contributes to the literature on bulk-arrival single-server systems by formulating an M X / G / 1 model that simultaneously incorporates heterogeneous service choice, Bernoulli-type vacations, and disaster–repair interruptions within a unified analytical framework. Earlier works of certain model addresses these mechanisms only in isolation or partial combinations, whereas the current model captures their joint influence through a coupled supplementary-variable structure and modified steady-state balance equations. This integrated formulation enables system descriptors that explicitly reflect the interaction among service heterogeneity, probabilistic vacations, and breakdown–repair cycles, yielding structural and parametric behaviors not observed in models with only one or two of these features. This establishes the technical novelty and broadens the applicability of M X / G / 1 queueing models to more realistic operational environments.
The development of this model is grounded upon significant prior work. The integration of disasters and repairs builds on the foundational work of Afanasyev [1], who examined the busy period in queueing systems with vacations, providing insights into the probabilistic structure of service interruptions. Afthab Begum et al. [2] extended disaster models by including working breakdowns. Arumuganathan and Jeyakumar [3] studied bulk queueing systems with service feedback and control policies. In a related context, Barron [4] developed a replenishment inventory model under random environments with stock- and age-dependent cost functions, bridging queueing theory and inventory control under stochastic conditions. Similarly, Choi and Lim [5] proposed a Markovian queueing model with an alternating server and queue-length-based threshold control, contributing to adaptive service mechanisms. Choudhury and Paul [6] examined two-phase queueing systems with feedback, while Choudhury and Deka [7] explored single-server systems operating under Bernoulli vacation schedules in disaster-prone environments. Fu et al. [8] analyzed optimization decisions in customer-intensive services under bounded rationality, incorporating behavioral uncertainty through Gumbel distributions. Guendouzi and Bouzebda [9] optimized a GI/M/2/N queue with heterogeneous servers, working vacations, and impatience using the Bat algorithm, demonstrating the potential of metaheuristic techniques in queue optimization. Jeyakumar and Logapriya [10,11,12] further explored non-terminating vacation policies, single vacation policies, and compulsory vacation policies in queueing systems under disaster and repair conditions. Jeyakumar and Senthilnathan [13] provided insights into the behavior of bulk queueing systems with multiple vacations and breakdowns, emphasizing their relevance to real-world operations. The role of Bernoulli vacation schedules is highlighted by Jingjing et al. [14]. Kadi et al. [15] analyzed an M/M/1/K queue with single working vacation, feedback, and impatience under an N-policy. Collectively, these studies form the foundation on which the present comprehensive queueing model is developed to address real-world challenges in manufacturing and service industries.
In addition to these foundational contributions, several recent studies have advanced the analysis and optimization of queueing systems under modern operational complexities. Ke and Pearn [16] discussed optimal management policies in vacation models, while Kim and Lee [17] analyzed working breakdowns in M/G/1 queues. Kumar and Arivudainambi [18] examined queueing systems with catastrophes. The inclusion of heterogeneous services is inspired by Madan [19] and Madan et al. [20], who studied two-stage and multi-type service models. Mahanta et al. [21] and Mytalas and Zazanis [22] extended disaster models by considering working breakdowns and MAV policies, respectively. Niranjan et al. [23] studied bulk queueing models with load balancing and vacation, relevant to distributed and industrial service systems. Palaniammal and Kumar [24] further investigated the implications of heterogeneity on queueing performance across various industries. Applications of similar models in manufacturing environments have been demonstrated by Park et al. [25] in stochastic disaster systems. Sasikala et al. [26] focused on Bernoulli vacation schedules in retrial queueing systems, while Singh C.J., Jain M., and Kumar B. [27] analyzed an M X / G / 1 unreliable retrial queue with the option of additional service and Bernoulli vacation. Xie et al. [28] investigated equilibrium and optimization in multi-server queues with heterogeneous information and reneging. Yechiali [29] examined queues with system disasters and impatient customers, contributing substantially to research on vacation policies. Zhu and Wang [30] explored strategic joining in single-server Markovian queues with Bernoulli working vacations, revealing the behavioral dynamics of customers in such systems. Collectively, these recent developments emphasize a growing research interest in queueing models with vacations, customer heterogeneity, and stochastic disruptions—providing strong motivation for the present study.
Accordingly, the current work proposes a queueing model featuring two heterogeneous services, Bernoulli vacation schedules, and disaster–repair interventions, which is formulated to optimize textile manufacturing operations. The model captures realistic production characteristics such as probabilistic breakdowns, rest periods, and service variability, offering a unified analytical framework for improving efficiency and reliability in manufacturing environments.
The comparison in Table 1 clearly highlights that most existing studies address only one or two aspects, such as vacations, breakdowns, or service heterogeneity, in isolation. The present work uniquely combines bulk arrivals, two heterogeneous services, Bernoulli vacation schedules, and disaster–repair mechanisms within a unified M X / G / 1 queueing framework. Furthermore, the model is applied to a real-world textile manufacturing scenario, providing both analytical insight and practical relevance. This integrated approach distinguishes the present study from earlier theoretical models and offers a novel contribution toward performance optimization and operational reliability in industrial systems.
The aim of this model is to analyze complex queueing scenarios that arise in industries where bulk arrivals, diverse service options, and system disruptions are common. In a textile manufacturing unit, fabric rolls (customers) arrive in bulk for processing. The server (machine) provides two types of finishing services that are Standard Finishing and Advanced Finishing. Finishing services play a crucial role in enhancing the properties and appearance of fabrics to meet specific customer demands. Finishing is often the final stage of production that adds value to the product, ensuring it meets both functional and aesthetic requirements. Customers may opt for standard fabric finishing (basic chemical treatments for durability) or advanced finishing (waterproofing, anti-bacterial coatings, or wrinkle resistance) based on their needs and budget. Occasionally, the machine (server) undergoes disasters like machine malfunctions due to wear and tear in standard finishing service (service 1) and high-tech failures due to issues in UV curing machines in advanced finishing services (service 2), requiring repair before resuming operations. During periods of low workload, the machine may enter a Bernoulli vacation state for maintenance or energy conservation. This model helps in evaluating the system performance, optimizing machine utilization, improve production efficiency, and in maintaining high customer satisfaction while managing the inherent uncertainties in manufacturing operations.
Beyond textile manufacturing, similar queueing dynamics are observed in other industrial and service sectors. For instance, in automobile assembly lines, robotic units often alternate between routine operations and calibration (vacation periods), while different service stations handle heterogeneous assembly or finishing tasks. In semiconductor fabrication plants, equipment frequently undergoes maintenance and repair cycles, and production batches (bulk arrivals) must queue for standard or specialized processing steps. Likewise, in healthcare service systems, diagnostic centers face bulk patient arrivals, where medical devices or testing units provide heterogeneous services (basic vs. advanced tests) and occasionally undergo service interruptions or recalibrations.
Thus, the proposed queueing model with heterogeneous services, Bernoulli vacations, and disaster–repair mechanisms capture a wide range of real-world operations, providing valuable insights for optimizing resource utilization, improving service efficiency, and maintaining customer satisfaction under uncertainty.
The present study can be extended in several meaningful directions to enhance its analytical scope and practical relevance. Future research may incorporate customer impatience, reneging, or feedback mechanisms to model situations where fabric batches or customers withdraw or rejoin the system depending on service delays. The framework can also be generalized to multi-server or parallel-machine environments, reflecting large-scale textile or manufacturing systems with coordinated operations and load balancing. Introducing finite buffer capacity and priority-based service rules would allow analysis of preferential treatment for high-value or urgent orders. Moreover, the development of data-driven or machine learning-based control policies could optimize vacation scheduling, repair decisions, and service switching in real time. Further, integrating the queueing framework with inventory or supply-chain models would provide a holistic view of production and material flow. Allowing general or state-dependent distributions for repair and vacation times could also capture practical uncertainties in maintenance processes. Finally, future studies may conduct simulation-based validation or empirical analysis using industrial data to evaluate economic and energy efficiency, thereby strengthening the real-world applicability of the proposed model.
The paper is organized as follows. Section 2 presents the mathematical model of the queueing system with two heterogeneous services, Bernoulli vacations, and disaster–repair mechanisms. Section 3 details the derivation of the steady-state equations using the supplementary variable approach and the probability generating function (PGF) methodology. Section 4 analyzes the queue size distribution and key performance measures, while Section 5 illustrates the numerical results and discusses the impact of various system parameters. Finally, Section 6 concludes the study and highlights potential directions for future research.

2. Model Formulation

The system considers a bulk-arrival process in which customer batches arrive according to a Poisson process with rate λ .   The size of each arriving batch is modeled by the random variable C. A batch of customers i with the parameters λ   ,   λ > 0   joins the system with a provided with two kinds of heterogeneous service under first come, first serve discipline. The mean batch size is denoted by E C . An arriving customer has the option to select either the first service with a probability ‘p’ or second service with a probability ‘ 1 p ’. Let μ 1 x and μ 2 x be the hazard rate function of the of both the services, with the corresponding density functions S 1 and S 2   and with the mean service times E S 1 and E S 2 . After completing service, the server may either take vacation with probability b or with probability 1 b , where the server may wait in the system to serve the arriving customer. Let v x be the hazard rate function of the vacation, with the mean vacation time being E L . All vacation periods are independent of each other. Finally, disaster is assumed to happen in the system during either the first or second kind of service. With the disaster rate δ , it removes all the customers, including the one being served by the system, and the system is immediately moved to a repair period. Let r x be the hazard rate function of the repair period with density function R and mean repair time E R . The customers who arrive during repair time may wait in the queue.
In this model, we aim to derive the KolmogorovChapman equations for a bulk arrival single-server queueing system with two different kinds of heterogeneous service, server vacations, and disasters requiring repairs. Let S i , t , i = 1 , 2 and L t be introduced as supplementary variables to obtain a Markov Process as N t , Ω t , S i , t , R t , L t , t 0 .
Let N t and Ω t be the system size and random variable corresponding to server’s status at a time t. For the various server’s states, the limiting probabilities are defined as follows:
Server’s idle state: P 0 at Ω ( t ) = 0 represents the probability that the system is empty and the server is idle. Server’s busy state (first kind of service): P n s 1 ( x ) at Ω ( t ) = 1 represents the joint probability of having n customers in the system and the server busy with the first kind of service. Server’s busy state (second kind of service): P n s 2 ( x ) at Ω ( t ) = 2 represents the joint probability of having n customers in the system and the server busy with the second kind of service. Server’s repair state: R n x at Ω ( t ) = 3 represents the probability of having n customers in the system and the server undergoing repairs. Server’s vacation state: L n x at Ω ( t ) = 4 represents the probability of having n customers in the system and the server is on vacation. Symbols and notations are listed in Appendix A.

3. Supplementary Variable Approach to Steady-State Differential Equations

The supplementary variable technique is a powerful tool in queueing theory for deriving steady-state differential equations and analyzing system performance. This method is particularly effective for systems with bulk arrivals, general service distributions, and stochastic disruptions like disasters and repairs. Building on our earlier studies on single vacation policies [5] and non-terminating vacation models in M X / G / 1 queues [6], this work extends the application of the supplementary variable technique to explore steady-state behaviors in two different heterogeneous services.
The governing equations for various states of the system are framed for n > 0   a s
0 = λ P 0 + 0 L 0 x v x d x + ( 1 b ) 0 P 1 s 2 x μ 2 x d x + 0 P 1 s 1 x μ 1 x d x + 0 R 0 x r x d x  
d d x + λ + μ 1 x + δ P n s 1 x = λ i = 1 n 1 C i P n i s 1 x   , n 1
d d x + λ + μ 2 x P n s 2 x = λ i = 1 n 1 C i P n i s 2 x   , n 1
d d x + λ + r x R n x = λ i = 1 n 1 C i R n i x , n 1
d d x + λ + v x L n x = λ i = 1 n 1 C i L n i x , n 1  
With the boundary conditions
P n s 1 0 = p 0 L n x v x d x + 0 P n + 1 s 2 x μ 2 x d x + 0 P n + 1 s 1 x μ 1 x d x + 0 R n x r x d x + λ C n P 0
P n s 2 0 = ( 1 p ) 0 L n x v x d x + 0 P n + 1 s 2 x μ 2 x d x + 0 P n + 1 s 1 x μ 1 x d x + 0 R n x r x d x + λ C n P 0
R 0 0 = δ n = 1 0 P n s 1 x d x + n = 1 0 P n s 2 x d x
L n 0 = b 0 P n s 2 x μ 2 x d x + 0 P n + 1 s 1 x μ 1 x d x

4. PGF-Based Steady-State Analysis

We derive the steady-state probability generating function (PGF) by systematically linking each balance equation to the corresponding operational condition of the system. Intermediate steps are outlined to clarify how the supplementary variables capture service heterogeneity, vacation decisions, and disaster–repair dynamics. By presenting the derivation in a stepwise manner, the structure of the PGF becomes transparent, showing how each component of the model contributes to the steady-state representation.
To obtain the PGF, we define the functions as
P ( s 1 ) x , z = n = 1 P n s 1 x z n , P n s 1 z = n = 1 P n s 1 z n P ( s 2 ) x , z = n = 1 P n s 2 x z n , P n s 2 z = n = 1 P n s 2 z n L x , z = n = 0 L n x z n , R x , z = n = 0 R n x z n
By multiplying Equations (2)–(9) with certain powers of z and summing it over n   , we obtain the PDEs as
d d x P ( s 1 ) x , z + λ + μ 1 x + δ λ C ( z ) P s 1 x , z = 0 d d x P ( s 2 ) x , z + λ + μ 2 x + δ λ C ( z ) P s 2 x , z = 0 d d x R x , z + λ + r x λ C ( z ) R x , z = 0 d d x L x , z + λ + v x λ C ( z ) L x , z = 0
P ( s 1 ) 0 , z = p ( 0 L x , z L 0 x v x d x + 0 1 z P s 2 x , z P 1 s 2 x μ 2 x d x + 0 1 z P s 1 x , z P 1 s 1 x μ 1 x d x + 0 R x , z R 0 x r x d x + λ C ( z ) P 0 )
P ( s 2 ) 0 , z = 1 p ( 0 L x , z L 0 x v x d x + 0 1 z P s 2 x , z P 1 s 2 x μ 2 x d x + 0 1 z P s 1 x , z P 1 s 1 x μ 1 x d x + 0 R x , z R 0 x r x d x + λ C ( z ) P 0 )
R 0 , z = δ 0 P s 1 x , 1 d x + 0 P s 1 x , 1 d x
L 0 , z = b 0 P n s 1 x , z μ 2 x d x + 0 P n s 2 x , z μ 1 x d x
Upon solving Equation (11), we have
P ( s 1 ) x , z = P s 1 0 , z ( 1 S 1 x ) e λ + δ λ C z x P ( s 2 ) x , z = P s 2 0 , z ( 1 S 2 x ) e λ + δ λ C z x R x , z = R 0 , z ( 1 R x ) e λ λ C z x L x , z = L 0 , z ( 1 L x ) e λ λ C z x
By integrating the Equation (16) again, we have
P ( s 1 ) z = P ( s 1 ) 0 , z 1 S 1 * ( λ + δ λ C ( z ) ) λ + δ λ C ( z ) P ( s 2 ) z = P ( s 2 ) 0 , z 1 S 2 * ( λ + δ λ C ( z ) ) λ λ C ( z ) R z = R 0 , z 1 R * ( λ λ C ( z ) ) λ λ C ( z ) L z = L 0 , z 1 L * ( λ λ C ( z ) ) λ λ C ( z )
S 1 * λ + δ λ C z   a n d   S 2 * λ + δ λ C z represent the Laplace-Stieltjes transforms of the first and second types of service time distributions, respectively. Similarly, R * λ λ C z denotes the Laplace-Stieltjes transform of the repair time distributions, and L * λ λ C z corresponds to the Laplace-Stieltjes transform of the vacation time distribution. These transforms are essential in expressing the steady-state characteristics of the queueing system.
Equations (13)–(16) are evaluated to determine and obtain the integral equations as,
0 P s 1 x , z μ 1 x d x = P ( s 1 ) 0 , z S 1 * ( λ + δ λ C ( z ) )
0 P s 2 x , z μ 2 x d x = P ( s 2 ) 0 , z S 2 * ( λ + δ λ C ( z ) )
0 R x , z r x d x = R 0 , z R * ( λ λ C ( z ) )
0 L x , z v x d x = L 0 , z L * ( λ λ C ( z ) )
In the given queueing system, it is assumed that no customers are present immediately after the completion of a vacation period or a repair period that follows a disaster. This condition arises because the system state resets at the end of these events. Consequently, the joint probabilities associated with the number of customers in the system and the system’s phase simplify PGFs L 0 , z   a s   L 0 0 and R 0 , z   a s   R 0 ( 0 ) .

5. Queue Size Distribution Under Different Operational States

The analysis of the queue size distribution proceeds by decomposing the overall PGF into parts associated with the key operational states of the system—busy operation, vacation periods, disaster epochs, and repair phases. Each resulting expression is accompanied by brief interpretative remarks illustrating how the model parameters influence the distribution under these conditions. This separation of structural components provides clearer insight into how the combined effects of bulk arrivals, service heterogeneity, vacations, and breakdown–repair cycles shape the system’s queue length behavior.
Queueing systems are subjected to disruptions like vacations, repairs, and varying server availability, and the queue size distribution depends significantly on the operational state of the server. By deriving the PGFs for different states, such as when the server is busy, under repair, or on vacation, this enables us to compute key performance metrics like mean queue length and waiting time.
P ( s 1 ) 0 , z = z p δ P s 1 1 + P ( s 2 ) 1 R * A z λ P 0 H z z p S 1 * A z + δ + ( 1 p ) . S 2 * ( A z + δ ) z b L * A z + 1
where A z = λ λ C ( z ) , and H z = 1 1 b C z .
Therefore Equation (17) becomes
P ( s 1 ) z = z p δ P s 1 1 + P ( s 2 ) 1 R * A z λ P 0 H z z p S 1 * A z + δ + ( 1 p ) . S 2 * ( A z + δ ) z b L * A z + 1 1 S 1 * ( A z + δ ) A z + δ
To establish the existence of a unique root inside the unit disk, we apply Rouche’s theorem. If possible, let z = z θ be the unique solution of z = p S 1 * A z + δ + ( 1 p ) . S 2 * ( A z + δ ) z b L * A z + 1 . In that case, equality becomes λ P 0 H z θ = δ P ( s 1 ) 1 + P ( s 2 ) 1 R * A z θ . Let us set π = H z θ R * A z θ .
Results:
The probability generating functions (PGFs) for the size of the system at different epochs—corresponding to the first kind of service, second kind of service, repair phase, and vacation phase—are derived as follows:
The PGF at the epoch of the first kind of service is given as
P ( s 1 ) z = z p π λ P 0 R * A z λ P 0 H z z p S 1 * A z + δ + ( 1 p ) . S 2 * ( A z + δ ) z b L * A z + 1 1 S 1 * ( A z + δ ) A z + δ
The PGF at the epoch of the second kind of service is given as
P s 2 z = z ( 1 p ) π λ P 0 R * A z λ P 0 H z z p S 1 * A z + δ + ( 1 p ) . S 2 * ( A z + δ ) z b L * A z + 1 1 S 2 * ( A z + δ ) A z + δ
The PGF at the epoch under repair is given as
R z = λ P 0 π b 1 b P 1 S 1 * δ + ( 1 P ) ( 1 S 2 * δ ) 1 R * A z ( 1 b + 1 p S 1 * δ + ( 1 p ) S 2 * δ A z
The PGF at the epoch of under vacation is given as
L z = z b π λ P 0 R * A z λ P 0 H z p S 1 * A z + δ + 1 p . S 2 * A z + δ 1 L * A z ( z p S 1 * A z + δ + ( 1 p ) . S 2 * ( A z + δ ) z b L * A z + 1 A z
Using the normalizing condition   a t   z = 1 , the probability P 0 is obtained when the server being idle as
P 0 = 1 + λ π b 1 b p 1 S 1 * δ + ( 1 p ) 1 S 2 * δ 1 + δ E R + δ p S 1 * δ + ( 1 p ) S 2 * δ δ 1 b + 1 p S 1 * δ + ( 1 p ) S 2 * δ 1
Finally, the total PGF of queue size X ( z ) is obtained as
X z = 1 + λ π b 1 b p 1 S 1 * δ + ( 1 p ) 1 S 2 * δ 1 + δ E R + δ p S 1 * δ + ( 1 p ) S 2 * δ δ 1 b + 1 p S 1 * δ + ( 1 p ) S 2 * δ 1 [ 1 + z π λ P 0 R * A z λ P 0 H z z p S 1 * A z + δ + 1 p . S 2 * A z + δ z b L * A z + 1 ( p 1 S 1 * A z + δ + 1 p 1 S 2 * A z + δ A z + δ + b p S 1 * A z + δ + 1 p . S 2 * A z + δ 1 L * A z A z ) + λ P 0 π b 1 b P 1 S 1 * δ + ( 1 P ) ( 1 S 2 * δ ) 1 R * A z ( 1 b + 1 p S 1 * δ + ( 1 p ) S 2 * δ A z ]
Also, due to disaster, the PGF of the total number of customers removed from the queueing system is given as
X d z = z δ π R * A z H z 1 ( b + 1 ) p S 1 * δ + ( 1 p ) S 2 * δ z p S 1 * A z + δ + 1 p . S 2 * A z + δ z b L * A z + 1 π b 1 b 1 S 1 * ( A z + δ ) ( 1 S 1 * δ ) ( A z + δ ) + 1 S 2 * ( A z + δ ) ( 1 S 2 * δ ) ( A z + δ )

6. Performance Measures

The expected queue length ( E Q L ) and waiting time ( E W T ) of the customer in the system are derived using L’ Hospital’s rule. By applying this rule to the PGF obtained from the Equation (29), the mean queue length of the customer in the queue and mean waiting time of the customer are calculated. It produces valuable insights into the performance of the queueing system.
E Q L = λ E c δ 1 b + 1 S a δ 1 b + 1 S a + λ λ c   S c 1 + δ E R + δ   S a E L S d   λ c λ δ b λ 2 E L +   S c   S e +   λ c   S f λ δ b + 1 S d   S a b + 1 S e   λ c b + 1 S f + 1 δ E c λ δ E L +   S a   S g +   λ c   S h S d b ( b + 1 ) 2 λ E L λ δ 1 + b   S a   S g   λ c 1 + b 1 ( b + 1 ) S a 2
E W T = δ 1 b + 1 S a δ 1 b + 1 S a + λ λ c   S c 1 + δ E R + δ   S a E L S d   λ c λ δ b λ 2 E L +   S c   S e +   λ c   S f λ δ b + 1 S d   S a b + 1 S e   λ c b + 1 S f + 1 δ E c λ δ E L +   S a   S g +   λ c   S h S d b ( b + 1 ) 2 λ E L λ δ 1 + b   S a   S g   λ c 1 + b 1 ( b + 1 ) S a 2
where   λ c = π   b 1 b
S d = p S 1 * δ + ( 1 p ) p S 2 * δ ;     S a = ( p S 1 * δ + 1 p S 2 * δ ) ,
  S c = p ( 1 S 1 * δ ) + 1 p ( 1 S 2 * δ ) ;     S h = b λ 2 E L 2 b 2 E c E L
  S e = π λ δ E R δ ;     S f = λ δ 2 + λ 2 E R 2   ;     S g = b 2 E L λ E R 1
Also, R * 0 and L * 0 are the mean repair time and mean vacation time; R * 0 and L * 0 are the second moment repair time and vacation time.

7. Rate Arguments

Disasters in the system can occur either before the commencement of a repair period or at the conclusion of a busy period. Consequently, the rate at which disasters occur is expressed as
r d = λ P 0 π b 1 b P 1 S 1 * δ + ( 1 P ) ( 1 S 2 * δ ) ( 1 b + 1 p S 1 * δ + ( 1 p ) S 2 * δ
At the end of a busy period, the server may proceed to take a vacation. Hence, the rate of normal busy period completion is expressed as
r n b p c = z λ P 0 π R * A z H z P 1 S 1 * δ + ( 1 P ) ( 1 S 2 * δ ) z p S 1 * A z + δ + ( 1 p ) . S 2 * ( A z + δ ) z b L * A z + 1
Every busy period is initiated either following the conclusion of the previous busy period or after the occurrence of a disaster. Accordingly, the rate of initiation of a busy period is given as
r s b p = λ P 0 P 1 S 1 * δ + 1 P 1 S 2 * δ z π R * A z H z z p S 1 * A z + δ + 1 p . S 2 * A z + δ z b L * A z + 1 + π b 1 b ( 1 b + 1 p S 1 * δ + ( 1 p ) S 2 * δ
A customer leaves the system either after his first essential service or second optional service. Therefore, the rate of customers leaving the system (due to service completion) is given as
r c l s c = λ P 0 π b 1 b p S 1 * δ + ( 1 p ) S 2 * δ ( 1 b + 1 p S 1 * δ + ( 1 p ) S 2 * δ
If a customer suffers disaster only during the first essential service, therefore, the rate of customers leaving (due to disaster) is given as
r c l d = λ E c P 0 π b 1 b p S 1 * δ + ( 1 p ) S 2 * δ ( 1 b + 1 p S 1 * δ + ( 1 p ) S 2 * δ

8. Numerical Illustration

Numerical technique was applied to compute the queue size distribution for various states in the illustrated real-life situation that exist in textile production. Parameters μ ,   r , v are assumed to be distributed in exponential. The numerical parameters were chosen as illustrative values to highlight the behavioral impact of service choice, vacations, and disaster–repair dynamics. Real industrial datasets that jointly capture all these features are not readily available, but the selected ranges are consistent with those used in related queueing studies.
In a textile manufacturing unit, the arrival rate of fabric rolls to the manufacturing unit is λ , where they choose between standard finishing or advanced finishing services based on their specific needs. Standard finishing involves basic chemical treatments aimed at enhancing fabric durability, with a processing rate μ 1 = 5 , while advanced finishing includes high-tech processes like waterproofing, anti-bacterial coatings, or UV curing for wrinkle resistance, processed at a rate μ 2 = 6 . Both services are susceptible to disasters; standard finishing faces machine malfunctions due to wear and tear, and advanced finishing encounters high-tech failures such as UV curing machine breakdowns at a disaster rate δ . After a disaster, the machine undergoes a repair phase at a rate r   before resuming operations. Additionally, during periods of low workload, the machine may enter a Bernoulli vacation state for maintenance with a rate v .
To analyze the described textile production system, the tables below summarize the key parameters, and the graphs represent the impact of these parameters on the performance metrics. These visualizations provide a clear understanding of the system’s behavior under different scenarios, highlighting the effects of disasters in different service.
From Table 2 and Figure 1, it is evident that as the probability p of opting for the standard finishing service of the first kind increases, the idle time of the fabric rolls decreases, while the queue length and expected waiting time increase. This occurs because the service rate for standard finishing μ 1 is lower than that of advanced finishing μ 2 .
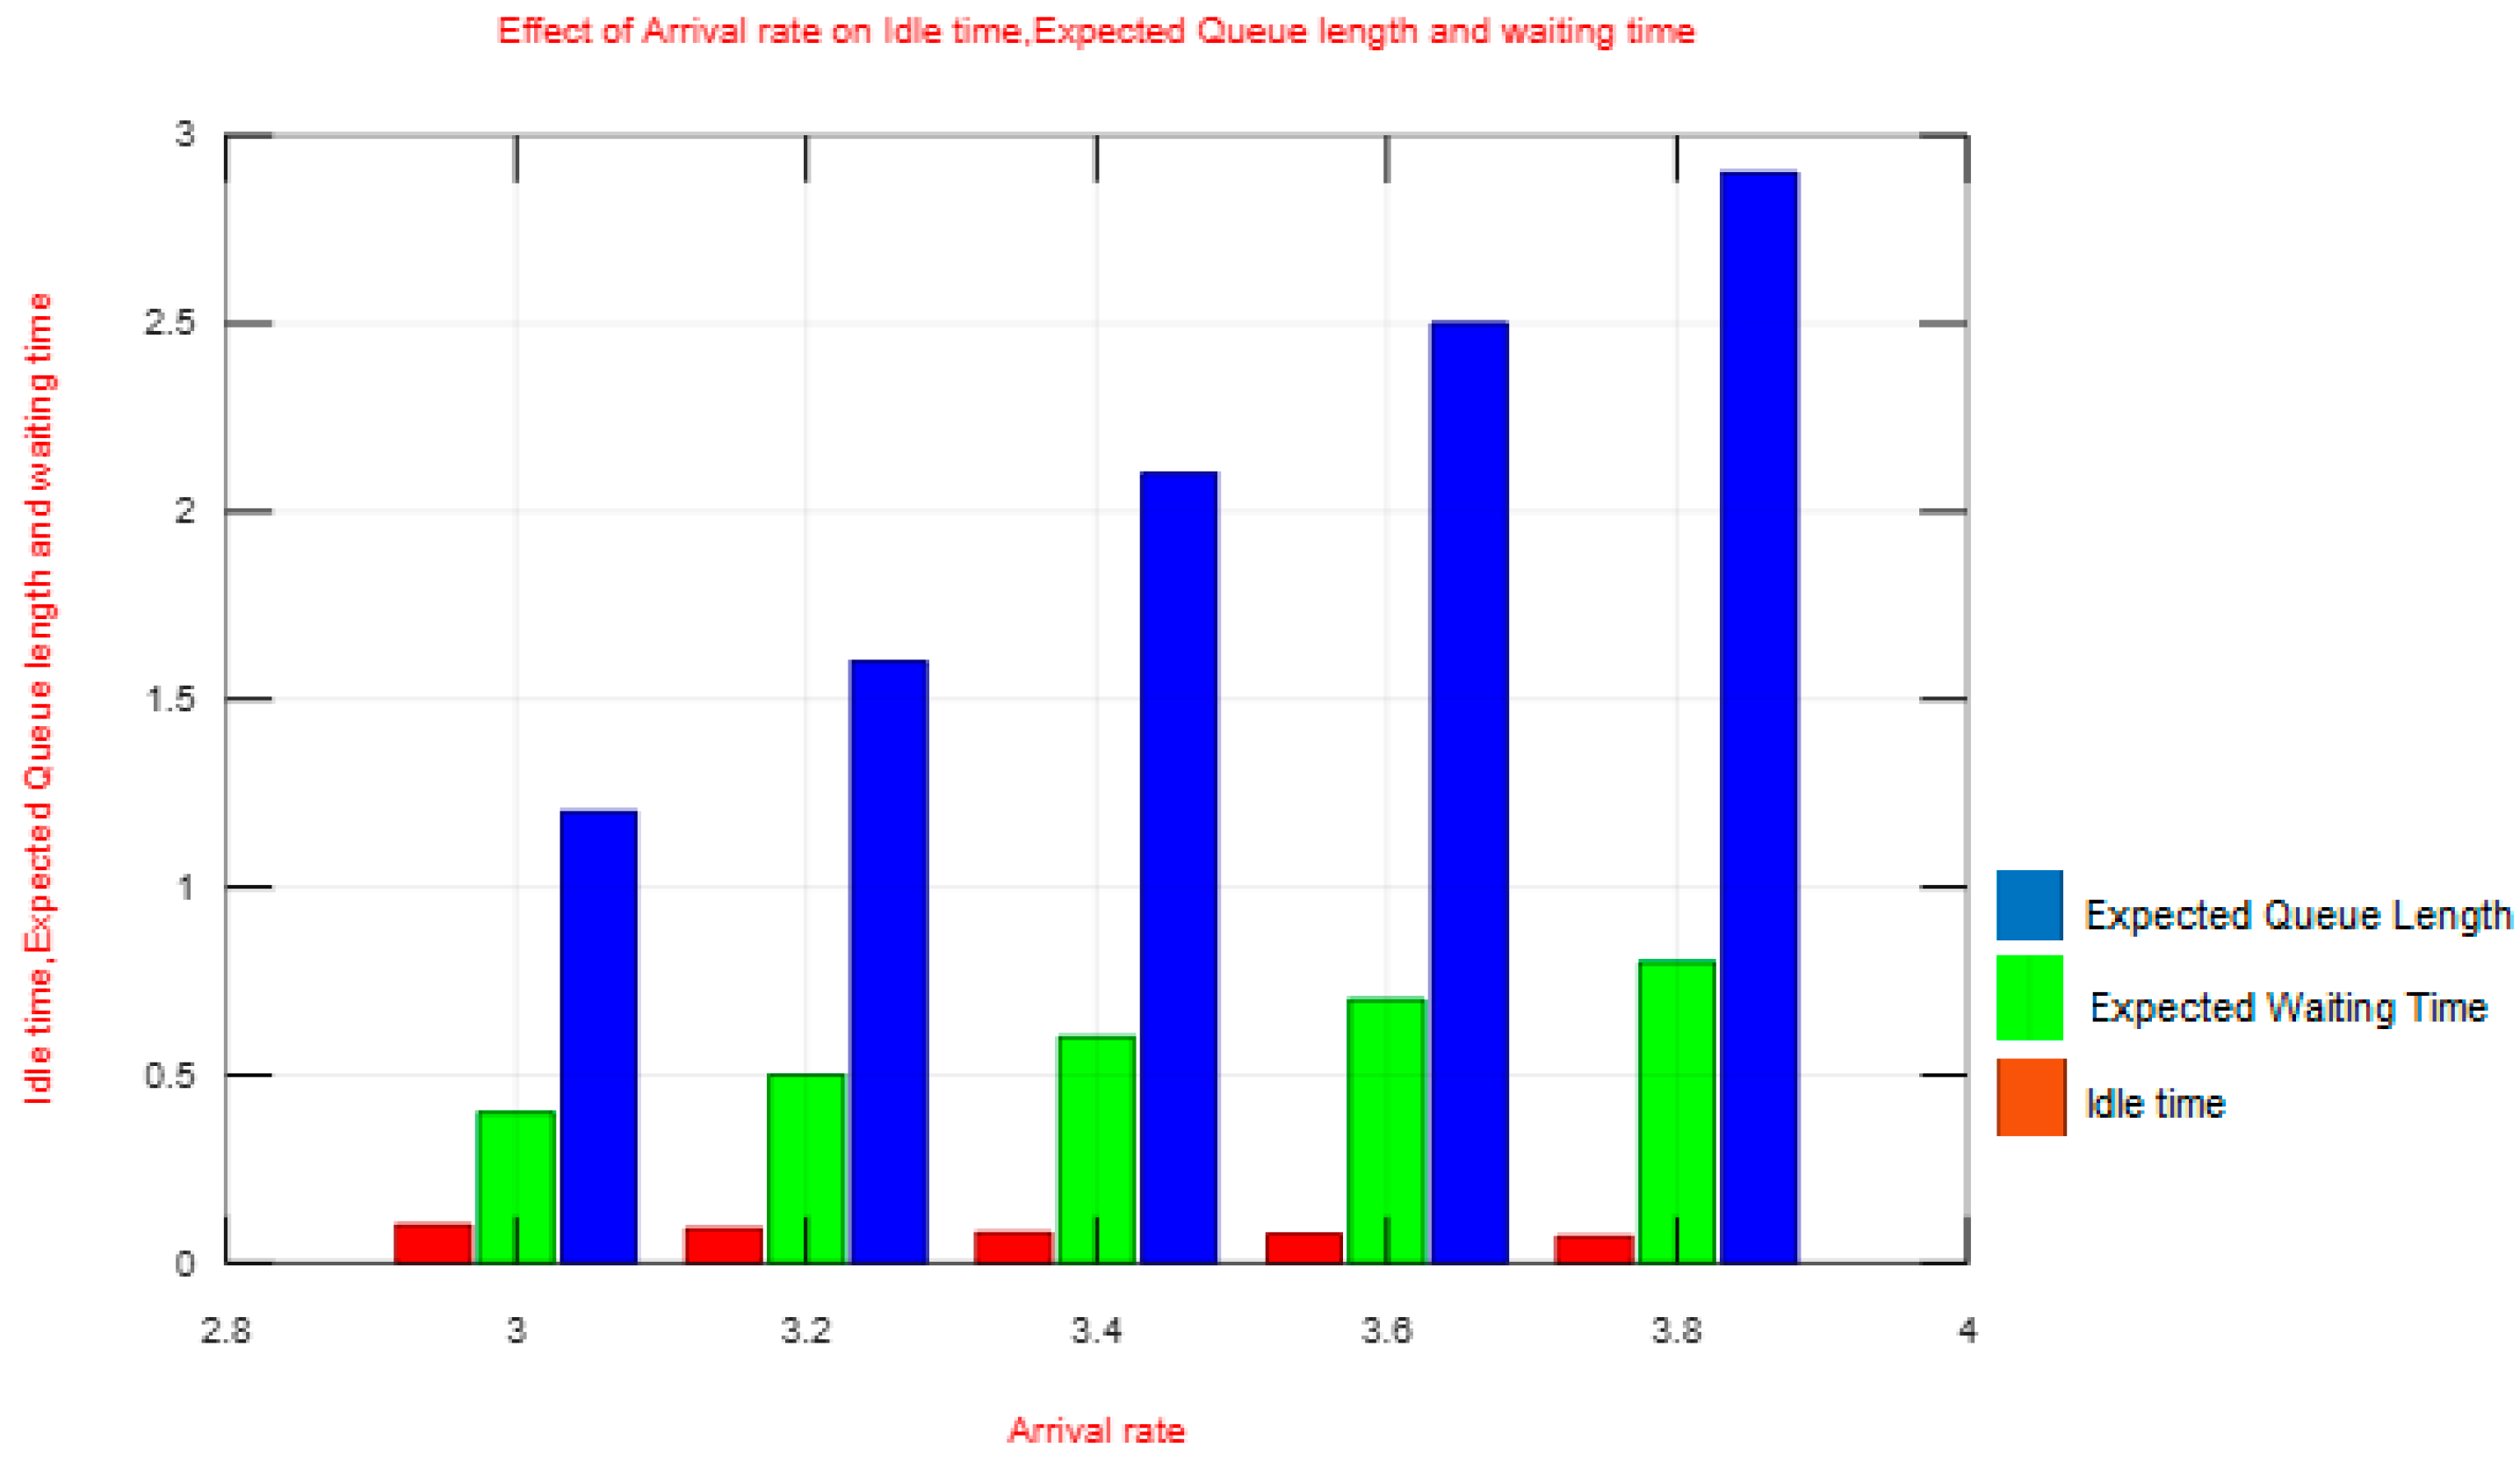
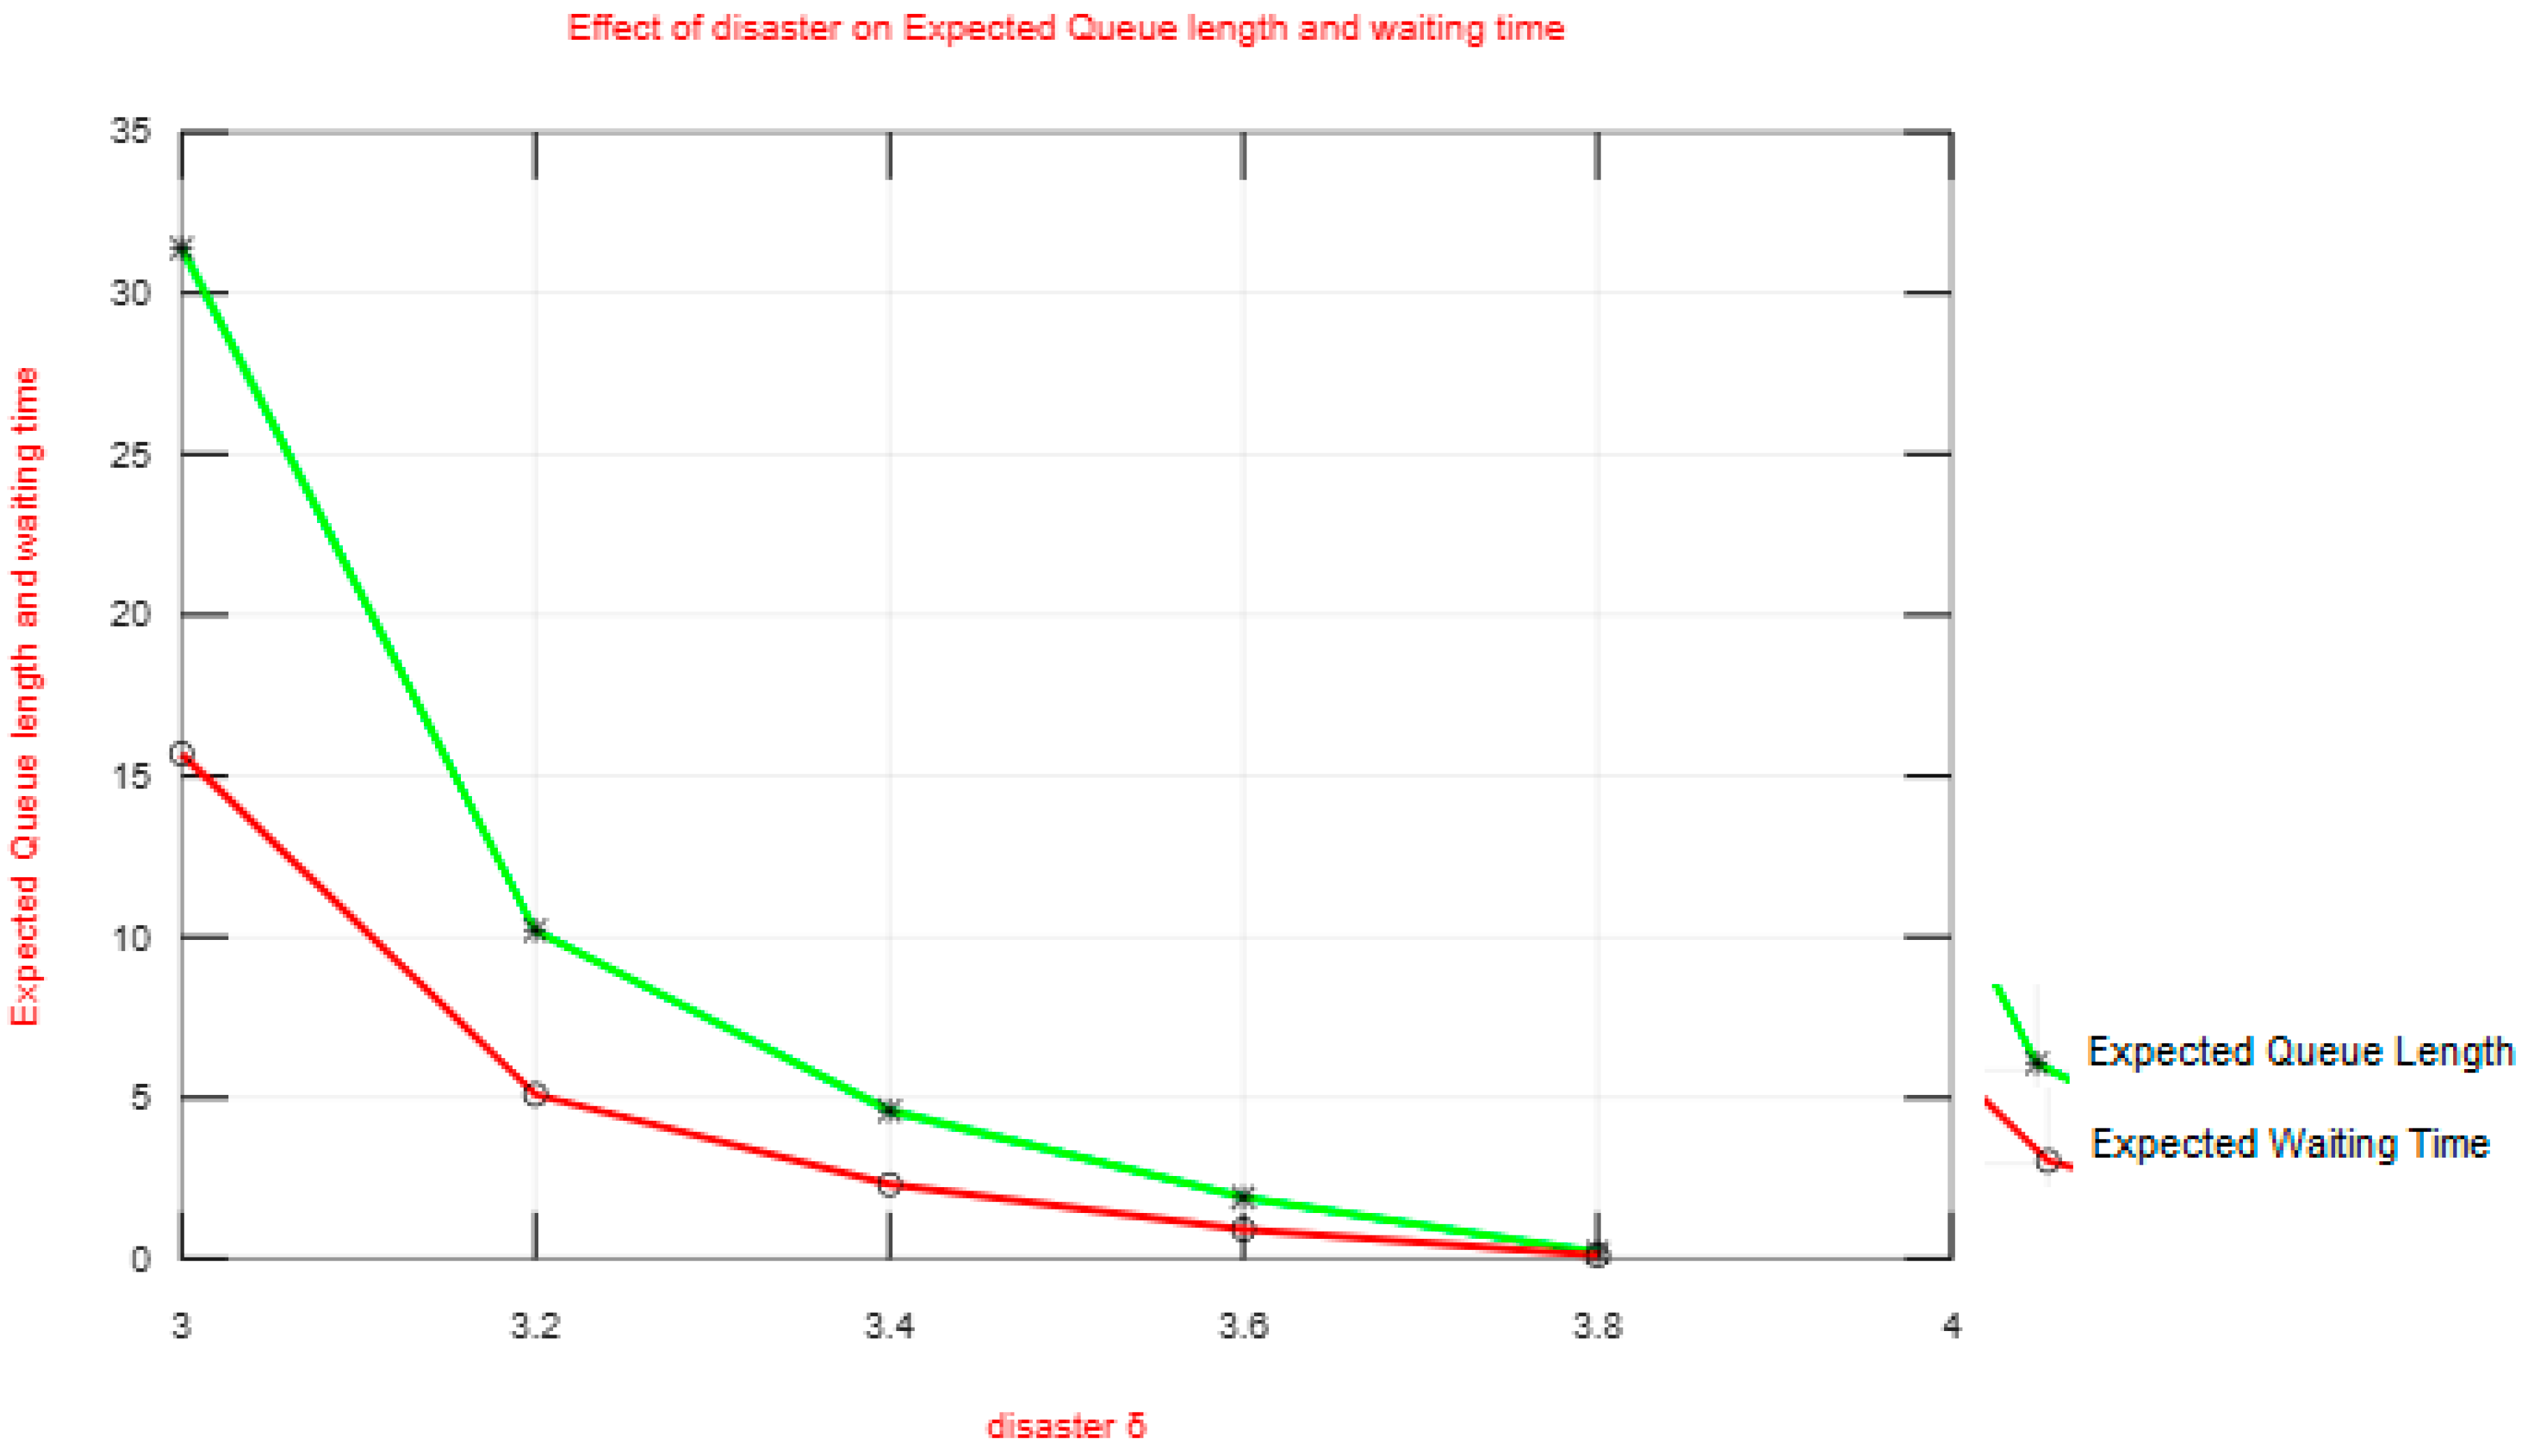
From Table 3 and Figure 2, it is clear that an increase in the arrival rate of fabric rolls leads to a rise in both the queue length and expected waiting time, reflecting the added workload on the system. Conversely, when the disaster rate increases, as also shown in Table 4 and Figure 3, the queue length and expected waiting time decrease, indicating reduced service continuity due to frequent interruptions requiring repairs.
Although the model is motivated by textile manufacturing operations, empirical datasets that jointly capture bulk arrivals, heterogeneous services, Bernoulli vacations, and disaster–repair behavior are not currently available; therefore, the numerical results presented here serve as theoretical illustrations, with analytical correctness verified through consistency with known M X / G / 1 special cases.

9. Conclusions

In this article, an M X / G / 1 queueing model with two heterogeneous services and a Bernoulli vacation schedule is examined in the context of disasters and repairs within the textile manufacturing industry. We derive the queue size distributions for various steady states, along with quality metrics, using the supplementary variable technique. Numerical examples are provided to illustrate the approach, demonstrating the disaster, impact waiting times, and queue lengths for the two service types in textile production. The numerical analysis reveals key insights: as the arrival rate and the probability of opting for the service increase, both the server’s busy period and customer waiting times also rise. Conversely, when the disaster rate increases, leading to more frequent system interruptions, the server’s busy period and customer waiting time decrease. These findings highlight the critical role of managing service options, machine downtime, and operational disruptions in optimizing production efficiency and minimizing delays in textile manufacturing.

Author Contributions

Conceptualization, methodology and validation, L.B. and S.J.; writing—original draft preparation, L.B.; writing—review and editing, S.J., L.B., V.D., and S.A.; visualization, L.B.; supervision, L.B. and S.J. All authors have read and agreed to the published version of the manuscript.

Funding

This research received no external funding.

Data Availability Statement

Data is contained within the article.

Conflicts of Interest

The authors declare no conflicts of interest.

Appendix A. Notation and Mathematical Remarks

Appendix A.1. Summary of Symbols and Variable Definitions

The key variables used throughout the analysis are summarized below for clarity:
  • m: Number of customers in the system.
  • n: Number of customers in the queue.
  • λ : The average rate of customers entering the queue system.
  • μ : The average rate of serving customers per server.
  • ρ : A measure of traffic congestion for single server system, which is defined as ρ = λ μ .
  • N t : Number of customers in the system at time t.
  • S i , t : Elapsed service time for i = 1 , 2 at time t.
  • R t : Elapsed repair time at time t.
  • L j , t : Elapsed vacation time for j = 1 , 2 , at time t.
  • S 1 : Random variable representing the essential service with mean service time E S 1 .
  • S 2 : Random variable representing the optional service with mean service time E S 2 .
  • P 0 : Probability that at time t, there are no customers in the system, and the server is idle but available in the system.
  • P n e x : Probability that at time t, the server is providing the first essential service, and there are n customers in the queue.
  • P n o ( x ) : Probability that at time t, the server is providing the second optional service, and there are n customers in the queue.
  • R n x : Probability that at time t, the system is inactive due to system repair while there are n customers in the queue waiting for service.
All PGFs, LSTs, and auxiliary functions appearing in Section 4, Section 5 and Section 6 are analytic in the unit disk and are defined at their first use in the text.

Appendix A.2. Notes on Mathematical Transitions

To maintain continuity in the derivations, we summarize the main transitions used:
  • Applying PGFs: Whenever the steady-state equations involve the number of customers in the system, we apply the probability generating function by multiplying with certain powers of z and summing it over n . This converts recursive balance relations into algebraic equations in z, enabling closed-form expressions.
  • Applying Laplace–Stieltjes transforms (LSTs): Service-time distributions and repair-time distributions are introduced through their LSTs to simplify convolution expressions and waiting-time relations. All transform steps correspond directly to the integral definitions of the involved random variables.
  • Differentiating PGFs: Derivatives of PGFs at z = 1 are used to obtain the mean queue length and mean waiting time.
  • These steps follow standard queueing-theoretic procedures and are applied consistently across Section 4 and Section 5.

Appendix A.3. Dimensional Consistency

All performance measures have been verified for dimensional consistency:
  • Arrival rate carries dimension time.
  • Service times and repair time carry dimension time.
  • Quantities such as queue length, loss probability, and utilization are dimensionless.

References

  1. Afanasyev, G.A. On the Busy Period in Queuing Systems with Vacations. Theory Probab. Its Appl. 2025, 70, 418–424. [Google Scholar] [CrossRef]
  2. Afthab Begum, M.L.; Fijy Jose, P.; Bama, S. MX/G/1 queue with disasters and working breakdowns. Int. J. Sci. Res. Publ. 2016, 6, 2250–3153. [Google Scholar]
  3. Arumuganathan, R.; Jeyakumar, S. A Non-Markovian bulk queue with multiple vacations and control policy on request for re service. Qual. Technol. Quant. Manag. 2011, 8, 253–269. [Google Scholar] [CrossRef]
  4. Barron, Y. A replenishment inventory model with a stock-dependent demand and age–stock-dependent cost functions in a random environment. Asia-Pac. J. Oper. Res. 2022, 39, 2150035. [Google Scholar]
  5. Choi, D.I.; Lim, D.E. Analysis of a Markovian Queueing Model with an Alternating Server and Queue-Length-Based Threshold Control. Mathematics 2025, 13, 3555. [Google Scholar]
  6. Choudhury, G.; Paul, M. A two phase queueing system with Bernoulli feedback. Int. J. Inf. Manag. Sci. 2005, 16, 35–52. [Google Scholar]
  7. Choudhury, G.; Deka, M. A single server Queueing system with two phases of service subject to server breakdown and Bernoulli vacation. Appl. Math. Model. 2012, 36, 6050–6060. [Google Scholar] [CrossRef]
  8. Fu, G.; Jiang, M.; Zhan, W. Optimization Decisions with Bounded Rationality in Customer-Intensive Services Under Gumbel Distributions. Axioms 2025, 14, 309. [Google Scholar] [CrossRef]
  9. Guendouzi, A.; Bouzebda, S. Cost Optimization in a GI/M/2/N Queue with Heterogeneous Servers, Working Vacations, and Impatient Customers via the Bat Algorithm. Mathematics 2025, 13, 3559. [Google Scholar] [CrossRef]
  10. Jeyakumar, S.; Logapriya, B. Production analysis of manufacturing industry in a single vacation policy under disaster. Math. Models Eng. 2023, 9, 198–207. [Google Scholar]
  11. Jeyakumar, S.; Logapriya, B. Modelling MX/G/1 Queueing System with Optional Second Service under Disaster and Repairs with Non-Terminating Vacation. Indian J. Nat. Sci. 2024, 14, 69871–69878. [Google Scholar]
  12. Jeyakumar, S.; Logapriya, B. Mathematical analysis on production control in manufacturing units under disaster and repair with compulsory vacation. OPSEARCH 2024, 62, 532–549. [Google Scholar] [CrossRef]
  13. Jeyakumar, S.; Senthilnathan, B. A study on the behaviour of the server breakdown without interruption in MX/G(a,b)/1 queuing system with multiple vacations and closedown time. Appl. Math. Comput. 2012, 219, 2618–2633. [Google Scholar]
  14. Jingjing, Y.E.; Liu, L.; Jiang, T. Analysis of a single server queue with disasters and repairs under Bernoulli vacation schedule. J. Syst. Sci. Inf. 2016, 4, 547–559. [Google Scholar]
  15. Kadi, A.; Boualem, M.; Touche, N.; Dehimi, A. Modeling and optimization of an M/M/1/K queue with single working vacation, feedback, and impatience timers under N-policy. Discret. Contin. Model. Appl. Comput. Sci. 2025, 33, 10–26. [Google Scholar] [CrossRef]
  16. Ke, J.C.; Pearn, W.L. Optimal management policy for heterogeneous arrival queueing systems with server breakdowns and vacations. Qual. Technol. Quant. Manag. 2004, 1, 149–162. [Google Scholar] [CrossRef]
  17. Kim, B.K.; Lee, D.H. The M/G/1 Queue with disasters and working breakdowns. Appl. Math. Model. 2014, 38, 1788–1798. [Google Scholar] [CrossRef]
  18. Kumar, B.K.; Arivudainambi, D. The transient solution of M/M/1 Queue with catastrophes. Comput. Math. Appl. 2000, 40, 1233–1240. [Google Scholar] [CrossRef]
  19. Madan, K.C. On a single server queue with two-stage heterogeneous service and deterministic server vacations. Int. J. Syst. Sci. 2001, 32, 837–844. [Google Scholar] [CrossRef]
  20. Madan, K.C.; Al-Rawi, Z.R.; Al-Nasser, A.D. On MX/(G1,G2)/1/G(BS)/Vs vacation queue with two types of general heterogeneous service. J. Appl. Math. Decis. Sci. 2005, 3, 123–135. [Google Scholar]
  21. Mahanta, S.; Choudhury, G.; Ling, N. On queue with two types of general heterogeneous service with Bernoulli feedback. Cogent Math. Stat. 2018, 5, 1. [Google Scholar] [CrossRef]
  22. Mytalas, G.C.; Zazanis, M.A. An MX/G/1 queueing system with disasters and repairs under MAV policy. Nav. Res. Logist. 2015, 62, 171–189. [Google Scholar] [CrossRef]
  23. Niranjan, S.P.; Latha, S.D.; Vlase, S.; Scutaru, M.L. Analysis of Bulk Queueing Model with Load Balancing and Vacation. Axioms 2024, 14, 18. [Google Scholar] [CrossRef]
  24. Palaniammal, S.; Kumar, K. A bulk queue’s analysis with two-stage heterogeneous services, multiple vacations, closedown with server breakdown, and two types of renovation. Math. Model. Eng. 2024, 10, 49–64. [Google Scholar]
  25. Park, H.M.; Yang, W.S.; Chae, K.C. Analysis of the G1/Geo/1 Queue with disaster. Stoch. Anal. Appl. 2009, 28, 44–53. [Google Scholar] [CrossRef]
  26. Sasikala, S.; Indhira, K.; Chandrasekaran, V.M. A study on MX/GB/1 retrial Queueing system with Bernoulli vacation schedule and variable server capacity. Int. J. Knowl. Manag. Tour. Hosp. 2017, 1, 263–277. [Google Scholar]
  27. Singh, C.J.; Jain, M.; Kumar, B. MX/G/1 unreliable retrial queue with the option of additional service and Bernoulli Vacation. Ain Shams Eng. J. 2016, 7, 415–429. [Google Scholar] [CrossRef]
  28. Xie, X.; Sun, W.; Wang, H.; Li, S. Equilibrium and Optimization in a Multi-server Queue with N-policy, Heterogeneous Information and Reneging. Methodol. Comput. Appl. Probab. 2025, 27, 85. [Google Scholar] [CrossRef]
  29. Yechiali, U. Queues with system disasters and impatient customers when system is down. Queueing Syst. 2007, 56, 195–202. [Google Scholar] [CrossRef]
  30. Zhu, S.; Wang, J. Strategic Joining in a Single-Server Markovian Queue with Bernoulli Working Vacations. J. Syst. Sci. Complex. 2025, 38, 1683–1706. [Google Scholar] [CrossRef]
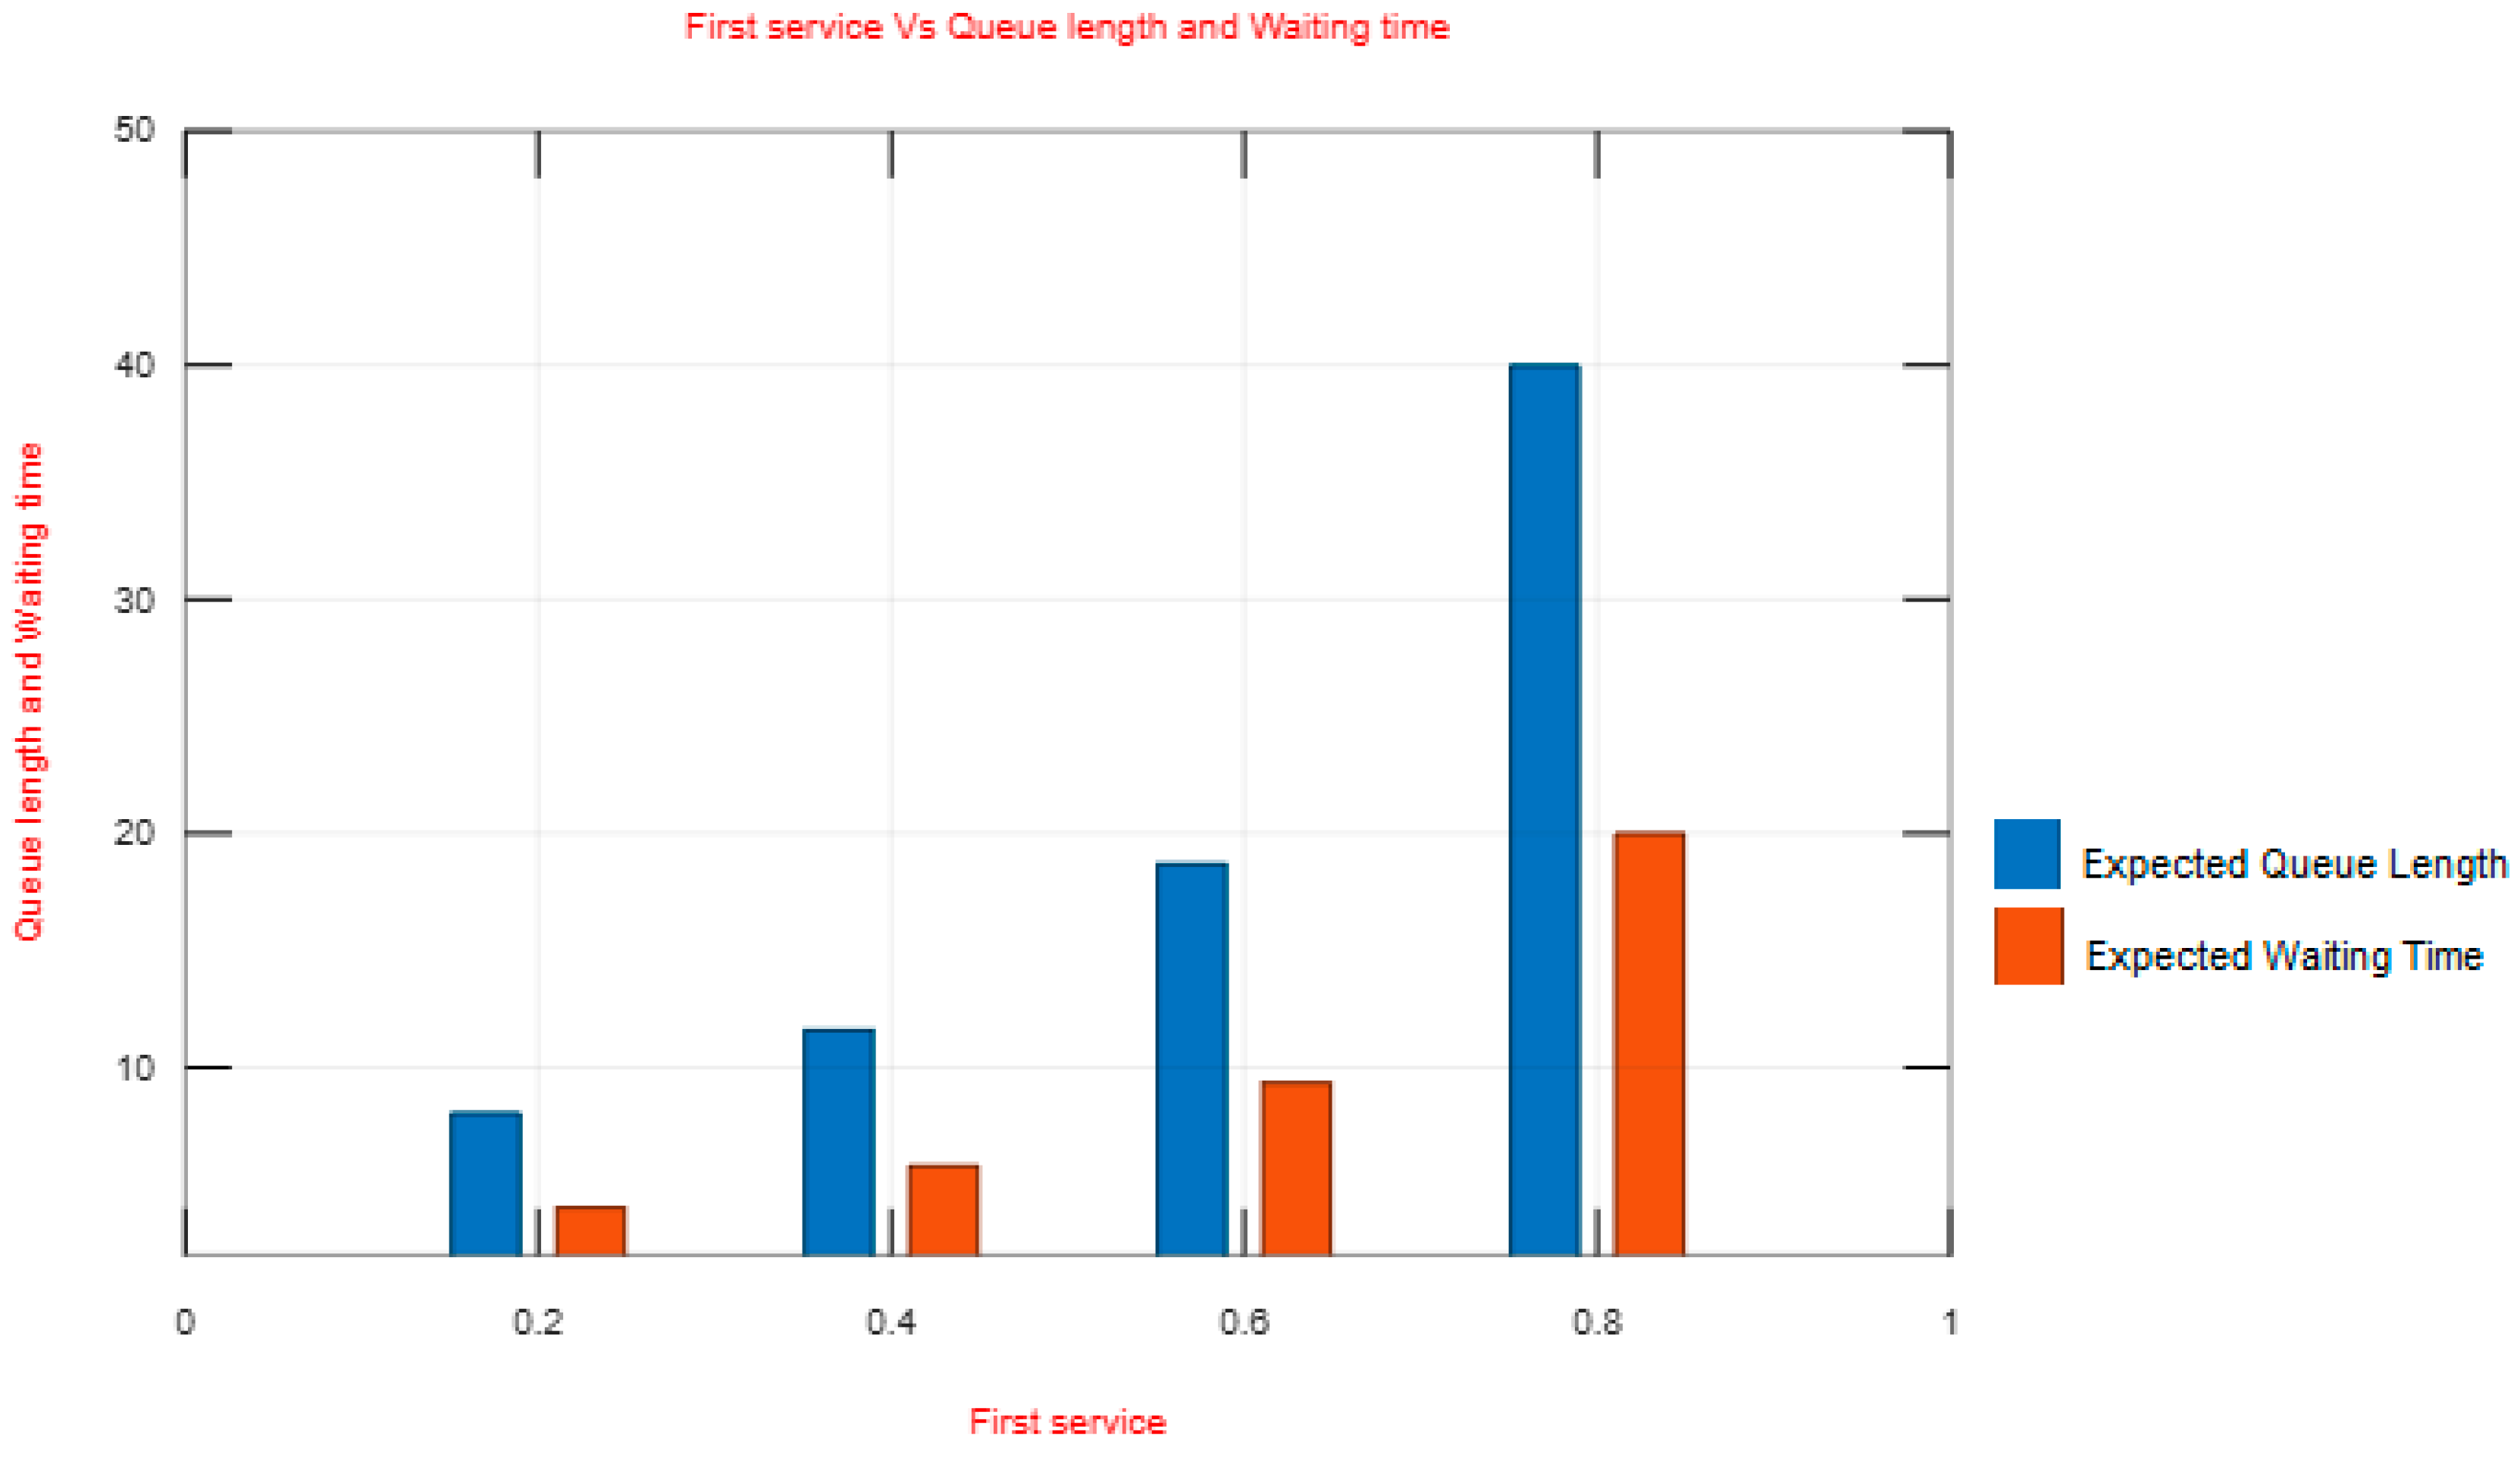
Figure 1. Prob. for first kind service vs. queue length and waiting time.
Axioms 14 00863 g001
Figure 2. Arrival rate vs. idle time, queue length, and waiting time.
Axioms 14 00863 g002
Figure 3. Disaster rate vs. queue length and waiting time.
Axioms 14 00863 g003
Table 1. Comparison of the Present Study with Existing Related Works.
YearModelHeterogeneous ServicesBulk ArrivalsBernoulli VacationDisaster/
Breakdown
Repair
Mechanism
Application
2000M/M/1 with CatastrophesTheoretical
2007Queue with Disasters and ImpatienceTheoretical
2014Single-Server with Bernoulli Vacation
2011Two-Stage/Multi-Type Service Models
2018Bulk Queue with Feedback
2020Retrial Queue with Bernoulli Vacation
2024Bulk Queue with Load Balancing and Vacation
2025GI/M/2/N with Working Vacation, Feedback, and Impatience
Present Study Two Heterogeneous Services, Bernoulli Vacation, and Disaster–Repair
Table 2. Performance measures with λ = 2   a n d   δ = 3 .
p P 0 E Q L E W T
0.20.06758.0334.017
0.40.052011.5855.792
0.60.035618.6839.341
0.80.018339.96519.983
Table 3. Performance measures with δ = 4 ,   p = 0.25 ,   a n d   b = 0.5 .
λ P 0 E Q L E W T
3.00.09741.20130.4004
3.20.08981.63570.5111
3.40.08312.07000.6088
3.60.07722.50320.6953
3.80.07192.93530.7725
Table 4. Performance measures with λ = 2 ,   p = 0.25 ,   a n d   b = 0.5 .
δ P 0 E Q L E W T
3.00.022731.45315.727
3.20.053710.1615.080
3.40.08234.5662.283
3.60.10871.8770.938
3.80.13320.2280.114
Disclaimer/Publisher’s Note: The statements, opinions and data contained in all publications are solely those of the individual author(s) and contributor(s) and not of MDPI and/or the editor(s). MDPI and/or the editor(s) disclaim responsibility for any injury to people or property resulting from any ideas, methods, instructions or products referred to in the content.