Article

Hopf Bifurcation Analysis of a Phagocyte–Bacteria Diffusion Model with Delay in Crohn’s Disease

Department of Mathematics, Northeast Forestry University, Harbin 150040, China
*
Author to whom correspondence should be addressed.
Axioms 2025, 14(12), 861; https://doi.org/10.3390/axioms14120861
Submission received: 13 October 2025 / Revised: 12 November 2025 / Accepted: 18 November 2025 / Published: 24 November 2025
(This article belongs to the Special Issue Nonlinear Dynamical System and Its Applications)

Abstract

Dysbiosis of the gut microbiota and dysregulated immune responses are key pathological features in both the onset and progression of Crohn’s disease. We propose a phagocyte–bacteria diffusion model with a time delay to explore their dynamic interactions and impact on the progression of Crohn’s disease. We first supplement the proof of the positivity, boundedness, existence, uniqueness, and global stability of the solutions for the ordinary differential system without time delay. Then we examine the stability of the positive equilibrium point and the occurrence of a Hopf bifurcation. By applying normal form and center manifold theory, we determine the direction of the bifurcation and the stability of the bifurcating periodic solution. Numerical simulations are used to verify the theoretical results. We find that the time delay significantly slows the system’s approach to a steady state. With a fixed delay, increased intestinal permeability prolongs the stabilization time. Conversely, with fixed intestinal permeability, a larger delay renders the system more prone to oscillations. Furthermore, a higher maximum engulfment rate by phagocytes reduces bacterial biomass but prolongs stabilization, whereas an increased phagocyte death rate shortens it. Additionally, an elevated bacterial growth rate increases both the bacterial biomass and the stabilization time. These results enhance our understanding of the dynamic equilibrium in immune systems.
MSC:
35R10; 35B32; 34K18

1. Introduction

Crohn’s disease [1] is a chronic inflammatory intestinal disorder that may involve any region of the digestive tract, with the terminal ileum and colon being the most commonly affected areas. Dysregulation of the immune system is the central pathological feature of Crohn’s disease [2,3]. Normally, the immune response helps the body defend against foreign pathogens. But in Crohn’s disease, it mounts an aberrant response to commensal gut microbiota and dietary antigens, resulting in chronic intestinal inflammation. This inflammation not only damages the normal structure and function of the affected parts of the intestine but can also lead to a series of complications that, in severe cases, may even threaten the patient’s life. In a healthy state, gut bacteria are kept in check by phagocytes, maintaining a homeostatic balance. In Crohn’s disease, however, this delicate balance is disrupted, leading to a pathological cycle where phagocyte activity against bacteria perpetuates inflammation and tissue damage. Crucially, Crohn’s disease manifests clinically as a chronic and relapsing condition. The fluctuating and unpredictable nature of core symptoms, such as abdominal pain, diarrhea, and fatigue, poses persistent and substantial challenges for disease management, the selection of treatment strategies, and patient quality of life.
The pathogenesis of Crohn’s disease involves complex interactions among genetic, environmental, and immunological factors [4,5,6]. Despite significant advances in clinical research, the precise mechanisms driving the pathologic interactions between gut bacteria and phagocytes remain poorly understood. As an effective approach, reaction-diffusion dynamical systems have attracted widespread attention in recent research [7,8,9,10,11]. Therefore, mathematicians employ mathematical modeling to examine gut dysbiosis, propose simplified models to simulate the immune responses that triggers inflammation, and thus investigate the pathogenesis of Crohn’s disease [12,13,14].
In [12], Nadin et al. characterized the patchy inflammatory patterns in the intestinal tract that are characteristic of Crohn’s disease. To explain this phenomenon, they proposed a diffusion system modeling bacteria-phagocyte interactions (1) and demonstrated the occurrence of Turing instability. Turing instability refers to a phenomenon in which, under certain conditions, the homogeneous equilibrium state of a reaction-diffusion system may become unstable upon the introduction of diffusion terms, leading to the spontaneous emergence of spatial patterns.
m t = d 1 Δ m   +   p ( 1 m K ) m a m n r   +   m   +   s ( 1 m K ) n , x ( 0 , l π ) ,   t > 0 , n t = d 2 Δ n   +   c m v n , x ( 0 , l π ) ,   t > 0 , m x ( 0 , t ) = n x ( 0 , t ) = 0 , m x ( l π , t ) = n x ( l π , t ) = 0 , t > 0 , m ( x , 0 ) = Ψ ( x ) 0 , n ( x , 0 ) = Φ ( x ) 0 , x [ 0 , l π ] ,
where m ( t ) denotes the bacterial biomass, n ( t ) denotes the phagocyte biomass, and Δ denotes the Laplace operator. The Neumann boundary conditions m x = n x = 0 at x = 0 and x = l π represent no-flux conditions, modeling a closed environment. Ψ ( x ) , Φ ( x ) are continuous functions with non-negative values, defined on the interval [ 0 , l π ] . All other parameters are positive, with their biological meanings summarized in Table 1.
Shi et al. [13] conducted further investigations on the system (1). Through multiscale analysis, they derived amplitude equations governing Turing pattern structures under varying bacterial biomass conditions, and proposed a numerical metric for assessing the severity of Crohn’s disease.
To better align the bacteria-phagocyte interaction model with biological reality, Shi et al. introduced the interference between phagocytes during phagocytosis of bacteria into the system in [14]. They investigated the complex spatiotemporal dynamics generated by the system (2) near the Turing-Hopf bifurcation point through bifurcation analysis. In addition, they also focused on the effects of intestinal permeability and phagocyte diffusion rate on the pattern structure of Crohn’s disease.
m t = d 1 Δ m   +   p ( 1 m K ) m a m n r   +   m   +   ω n   +   s ( 1 m K ) n , x ( 0 , l π ) ,   t > 0 , n t = d 2 Δ n   +   c m v n , x ( 0 , l π ) ,   t > 0 , m x ( 0 , t ) = n x ( 0 , t ) = 0 , m x ( l π , t ) = n x ( l π , t ) = 0 , t > 0 , m ( x , 0 ) = Ψ ( x ) 0 , n ( x , 0 ) = Φ ( x ) 0 , x [ 0 , l π ] .
In biological systems, immune responses are never instantaneous [16]. Numerous studies have investigated the associated time delays [17,18,19]. Cherraf et al. [17] incorporated both time delays and diffusion processes when modeling tumor-immune system interactions. In [18], Yang et al. found that intracellular time delay in HIV infection models can induce Hopf bifurcations, destabilizing immune-presence equilibria. Riha et al. [19] developed a model with fractional order and time delay to describe the interactions between the tumor immune system and external treatments.
In Crohn’s disease, intestinal phagocytes, such as macrophages, require a certain amount of time to detect bacteria, migrate to the site of infection, and initiate effector functions. Although this is physiologically significant, most previous studies in Crohn’s disease [12,13,14] have simplified immune activation as an instantaneous process (i.e., τ = 0 ), which may overlook some critical dynamic changes. Within the framework of our model, this delay is specifically attributed to the intracellular execution time of phagocytosis, the core effector function. This process involves multiple biochemical steps, including recognition, internalization, and degradation, and is considered the most significant rate-limiting stage [20,21]. Therefore, we specifically correlate the phagocytic rate at time t with the bacterial biomass at an earlier time t τ , modifying the phagocytic term in the model (2) to c m ( t τ ) . This formulation captures the biological principle that the clearance efficacy observed at the present moment is determined by bacterium-phagocyte encounters that occurred at a prior time. We model τ as a constant delay, based on the core biological assumption that the mean time required for a phagocyte to complete a successful phagocytic event is relatively stable for a given host at a specific stage of disease progression. This duration is primarily set by intrinsic physiological constraints dictated by the host’s genetic background and immune status. Given that time delays are well-known to induce Hopf bifurcations and subsequent oscillatory dynamics in such systems, we propose the following model (3) to investigate its Hopf bifurcation.
m t = d 1 Δ m   +   p ( 1 m K ) m a m n r   +   m   +   ω n   +   s ( 1 m K ) n , x ( 0 , l π ) ,   t > 0 , n t = d 2 Δ n   +   c m ( t τ ) v n , x ( 0 , l π ) ,   t > 0 , m x ( 0 , t ) = n x ( 0 , t ) = 0 , m x ( l π , t ) = n x ( l π , t ) = 0 , t > 0 , m ( x , t ) = Ψ ( x , t ) 0 , n ( x , t ) = Φ ( x , t ) 0 , x [ 0 , l π ] ,   t [ τ , 0 ] .
In the term s ( 1 m K ) n , the parameter s quantifies the negative effect of phagocyte concentration on epithelial resistance, thereby exerting a positive net effect on bacterial density. Activated phagocytes n damage the intestinal epithelium by releasing inflammatory mediators. The resulting epithelial gaps, represented by the term ( 1 m K ) , create new colonization niches for bacteria m, which in turn recruit additional phagocytes to the site, further exacerbating epithelial porosity and perpetuating a self-sustaining cycle of inflammation.
The functional response term for phagocytosis, a m n r   +   m   +   ω n , is adopted from prior works [12,13,14] to facilitate comparison. Within this structure, the parameters are endowed with distinct physical meanings through the defined relationship a = p c × r . Here, a represents the maximum engulfment rate, with its reciprocal f = 1 / a defining the average handling time per bacterium. The parameter r functions as the baseline half-saturation constant, specifying the bacterial density required for the engulfment rate to reach half of its maximum under idealized conditions. Consequently, the ratio p c = a / r defines the encounter rate, characterizing phagocyte search efficiency. This interlocked set of definitions ensures that all parameters possess clear and independent biological interpretations.
Our analysis focuses on the stability of the positive equilibrium and the direction of the Hopf bifurcation. Specifically, the derivation of the bifurcation direction utilizes normal form and center manifold theory, an approach that is universally applied in the bifurcation analysis of systems [22,23].
The paper is structured in the following manner. Section 2 establishes the positivity, boundedness, and global stability of the solutions to the ordinary differential system (4) without time delay. Section 3 investigates the local stability of the positive equilibrium point and the occurrence of Hopf bifurcation in the delayed system (3) and Section 4 analyzes the direction and stability of the spatial Hopf bifurcation. Section 5 validates the theoretical results through numerical simulations and explores the influence of time delay and other parameters on the system’s dynamic behavior. The final section concludes the paper.

2. The Properties of the Non-Delayed Ordinary Differential Model

2.1. Positivity and Boundedness of Solutions

To ensure that the solutions of the differential system (4) are well-defined, we first prove its positivity and boundedness.
d m d t = p ( 1 m K ) m a m n r   +   m   +   ω n   +   s ( 1 m K ) n , d n d t = c m v n .
Theorem 1.
The solutions ( m ( t ) , n ( t ) ) of the system (4) are defined on [ 0 , ) , where m ( t ) 0 , n ( t ) 0 for t [ 0 , ) , and they are bounded.
Proof. 
According to the theory of functional differential equations [24,25], it is known that the (4) has a solution ( m ( t ) , n ( t ) ) satisfying the initial conditions. Integrating both sides of two equations from 0 to t, we obtain
0 t m ˙ ( α ) m ( α ) d α = 0 t p 1 m ( α ) K a n ( α ) r   +   m ( α )   +   ω n ( α )   +   s 1 m ( α ) K n ( α ) m ( α ) d α .
Then
m ( t ) = Ψ ( 0 ) exp 0 t p 1 m ( α ) K a n ( α ) r   +   m ( α )   +   ω n ( α )   +   s 1 m ( α ) K n ( α ) m ( α ) d α 0 .
Similarly, from second equation of (4) we can obtain
n ( t ) = Φ ( 0 ) exp 0 t c m ( α ) v n ( α ) d α 0 .
Define κ ( t ) = m ( t )   +   n ( t ) and σ 1 = v s   >   0 . Then
d κ ( t ) d t   +   ( v s ) κ ( t ) = p 1 m K m a m n r   +   m   +   ω n   +   s 1 m K n   +   c m v n   +   ( v s ) ( m   +   n )   = ( p   +   c   +   v s ) m p K m 2 a m n r   +   m   +   ω n s K m n   +   ( s v   +   v s ) n   ( p   +   c   +   v ) m   ( p   +   c   +   v ) K .
Let σ 2 = ( p   +   c   +   v ) K . It follows from (5) that d κ ( t ) d t   +   σ 1 κ ( t ) σ 2 . By using the comparison method, 0 κ ( t ) σ 2 σ 1 = ( p   +   c   +   v ) K v s can be obtained. Therefore, the solutions of the system (4) remain bounded in the following domain
Ω = ( m , n ) R + 2 : m   +   n ( p   +   c   +   v ) K v s .

2.2. Existence and Uniqueness of Solutions

Theorem 2.
For the initial value problem for system (4) with initial conditions m ( 0 ) = Ψ ( 0 ) , n ( 0 ) = Φ ( 0 ) , there exists a unique solution ( m ( t ) , n ( t ) ) defined on [ 0 , T ] with T > 0 .
Proof. 
The system (4) can be written in the standard vector form
d u d t = F ( u ( t ) ) ,   u ( 0 ) = ( Ψ ( 0 ) , Φ ( 0 ) ) T ,
where u ( t ) = ( m ( t ) , n ( t ) ) T , and F is defined by
F ( u ) = F 1 ( m , n ) F 2 ( m , n ) = p 1 m K m a m n r   +   m   +   ω n   +   s 1 m K n c m v n .
For the subsequent analysis, we consider the bounded domain
Ω ˜ = ( m , n ) R + 2 : 0 < m M , 0 < n N ,
where M and N are sufficiently large positive constants such that all trajectories originating from the initial data remain confined to Ω ˜ . The vector field F is continuously differentiable on this domain.
For any ( m 1 , n 1 ) , ( m 2 , n 2 ) Ω ˜ , we can obtain
  | F 1 ( m 1 , n 1 ) F 1 ( m 2 , n 2 ) |   = p m 1 m 1 2 K m 2   +   m 2 2 K   +   s n 1 m 1 n 1 K n 2   +   m 2 n 2 K       +   a m 2 n 2 r   +   m 2   +   ω n 2 m 1 n 1 r   +   m 1   +   ω n 1   p ( m 1 m 2 ) 1 K ( m 1 2 m 2 2 )   +   s ( n 1 n 2 ) 1 K ( m 1 n 1 m 2 n 2 )       +   a m 1 n 1 r   +   m 1   +   ω n 1 m 2 n 2 r   +   m 2   +   ω n 2 .
We proceed to bound each of the three terms in (7). The first term satisfies
( m 1 m 2 ) 1 K ( m 1 2 m 2 2 ) = ( m 1 m 2 ) 1 m 1   +   m 2 K   1   +   2 M K | m 1 m 2 | .
The second term satisfies
( n 1 n 2 ) 1 K ( m 1 n 1 m 2 n 2 )   | n 1 n 2 |   +   1 K | m 1 n 1 m 2 n 2 | .
The third term satisfies
  m 1 n 1 r   +   m 1   +   ω n 1 m 2 n 2 r   +   m 2   +   ω n 2   = r ( m 1 n 1 m 2 n 2 )   +   m 1 m 2 ( n 1 n 2 )   +   ω n 1 n 2 ( m 1 m 2 ) ( r   +   m 1   +   ω n 1 ) ( r   +   m 2   +   ω n 2 )   1 r 2 r | m 1 n 1 m 2 n 2 |     +     M 2 | n 1 n 2 |     +     ω N 2 | m 1 m 2 | .
A crucial intermediate estimate concerns the product terms:
| m 1 n 1 m 2 n 2 | = | m 1 ( n 1 n 2 )   +   n 2 ( m 1 m 2 ) | M | n 1 n 2 |   +   N | m 1 m 2 | .
Incorporating this estimate into the preceding bounds yields
  | F 1 ( m 1 , n 1 ) F 1 ( m 2 , n 2 ) |   p 1   +   2 M K | m 1 m 2 |       +   s | n 1 n 2 |   +   1 K ( M | n 1 n 2 |   +   N | m 1 m 2 | )       +   a r 2 r ( M | n 1 n 2 |   +   N | m 1 m 2 | )   +   M 2 | n 1 n 2 |   +   ω N 2 | m 1 m 2 |
  = p 1   +   2 M K   +   s N K   +   a r 2 ( r N   +   ω N 2 ) | m 1 m 2 |       +   s 1   +   M K   +   a r 2 ( r M   +   M 2 ) | n 1 n 2 | .
Define the coefficients
G m = p 1   +   2 M K   +   s N K   +   a r 2 ( r N   +   ω N 2 ) , G n = s 1   +   M K   +   a r 2 ( r M   +   M 2 ) .
Then, setting G 1 = max { G m , G n } , we conclude
| F 1 ( m 1 , n 1 ) F 1 ( m 2 , n 2 ) |     G m | m 1 m 2 |   +   G n | n 1 n 2 |     G 1 ( | m 1 m 2 |   +   | n 1 n 2 | ) ,
which completes the proof that F 1 is Lipschitz continuous on Ω ˜ with Lipschitz constant G 1 .
For F 2 ( m , n ) , a similar analysis shows that for any ( m 1 , n 1 ) , ( m 2 , n 2 ) Ω ˜ :
| F 2 ( m 1 , n 1 ) F 2 ( m 2 , n 2 ) |   = | c ( m 1 m 2 ) v ( n 1 n 2 ) |   c | m 1 m 2 |   +   v | n 1 n 2 |   G 2 ( | m 1 m 2 |   +   | n 1 n 2 | ) ,
where
G 2 = max { c , v } .
Let G = max { G 1 , G 2 } . Consequently, we obtain the global Lipschitz bound
F ( u 1 ) F ( u 2 ) 1     2 G u 1 u 2 1 .
Since the vector field F is continuous and satisfies the Lipschitz condition on the domain Ω ˜ containing the initial point, an application of the Cauchy–Picard theorem [26] guarantees the existence of T > 0 such that the initial value problem admits a unique solution u ( t ) on the interval [ 0 , T ] .
Furthermore, since we have established that the solution remains within the bounded domain Ω ˜ and the vector field is smooth and well-defined on this domain, the solution can be uniquely extended to the maximal interval of existence [ 0 , ) . □

2.3. Global Asymptotic Stability

According to the study by [14], we conclude that system (4) admits both an extinction equilibrium point ( 0 , 0 ) and a positive equilibrium point E = ( m 0 , n 0 ) . We present the calculation formula for E = ( m 0 , n 0 ) .
m 0 = Y   +   Y 2   +   4 K r v ( v   +   ω c ) ( p v   +   s c ) 2 2 ( v   +   ω c ) ( p v   +   s c ) , n 0 = c Y   +   c Y 2   +   4 K r v ( v   +   ω c ) ( p v   +   s c ) 2 2 v ( v   +   ω c ) ( p v   +   s c ) ,
where Y = ( p v   +   s c ) ( K v   +   K ω c r v ) K v a c .
Theorem 3.
The positive equilibrium E = ( m 0 , n 0 ) of the ordinary differential system (4) is globally asymptotically stable if r < K < s n 0   +   c m 0 a r m 0 n 0 .
Proof. 
Define the Lyapunov function V ( m , n ) : R + 2 R such that
V ( m , n ) = V 1 ( m )   +   V 2 ( n ) ,
where
V 1 ( m ) = m m 0 m 0 l n m m 0
and
V 2 ( n ) = n n 0 n 0 l n n n 0 .
It is continuous and positive by definition, except for E = ( m 0 , n 0 ) . Taking the time derivative of V along the trajectories of system (5) results in
d V d t = d V 1 d t   +   d V 2 d t ,
where
d V 1 d t = m m 0 p 1 m K a n r   +   m   +   s 1 m K n m , d V 2 d t = ( n n 0 ) c m n v .
From E ( m 0 , n 0 ) as the equilibrium point of the system, the following expression can be obtained by calculation,
p 1 m 0 K m 0 = a m 0 n 0 r   +   m 0   +   ω m 0 s 1 m 0 K n 0 , c m 0 = v n 0 .
By substituting (10) into Equation (9), we can obtain
d V 1 d t = ( m m 0 ) ( K   +   m ) ( m 0 n   +   n 0 m ) s K m m 0 a n r   +   m   +   s 1 m K n m = ( m m 0 ) 2 m s n 0 ( K   +   m ) K m 0   +   a n ( m m 0 ) 2 ( m 0 n 0 ω K r )     +   ( m m 0 ) ( n n 0 ) s m 0 a K r a K   +   a r s K m 0
and
d V 2 d t = ( n n 0 ) c m n c m 0 n 0   = ( n n 0 ) c m n 0 c m 0 n n n 0   = m n ( n n 0 ) 2 c n 0   +   ( m m 0 ) ( n n 0 ) c n 0 .
Thus, it is straightforward to conclude that
d V d t = d V 1 d t   +   d V 2 d t = m m 0 2 m s n 0 K   +   m K m 0   +   a n m m 0 2 m 0 n 0 ω K r     +   m m 0 n n 0 s m 0 a K r a K   +   a r s K m 0     +   m n n n 0 2 c n 0   +   m m 0 n n 0 c n 0 .
From K > m and Young’s inequality ( m m 0 ) ( n n 0 ) < ( m m 0 ) 2 2   +   ( n n 0 ) 2 2 , when K > r and s m 0   +   c n 0 > a r K , i.e., r < K < s n 0   +   e m 0 a r m 0 n 0 , d V d t is always less than 0, and equality holds if and only if m = m 0 and n = n 0 . At this point, the system exhibits global asymptotic stability at E = ( m 0 , n 0 ) . □

3. Stability Analysis of the Partial Differential Model with Delay

It is important to note that both the time delay τ and diffusion terms do not affect the existence or the values of the equilibrium points. This is because, at an equilibrium, the system states are constant in time, nullifying the effect of the delay, and spatially homogeneous, nullifying the Laplacian diffusion terms. Consequently, the conditions for finding equilibrium points are identical to those of the homogeneous system. Therefore, the equilibrium point formulas (8) remain valid for system (3).
In this section, we analyze the stability of the equilibrium point E = ( m 0 , n 0 ) and the emergence of Hopf bifurcation for the system (3).
The linearized system at E = ( m 0 , n 0 ) is
t m ( x , t ) n ( x , t ) = ( D Δ   +   A ) m ( x , t ) n ( x , t )   +   B m ( x , t τ ) n ( x , t τ ) ,
where
A = a 11 a 12 0 a 22 ,     B = 0 0 b 21 0 ,     D = d 1 0 0 d 2 ,
and
a 11 = p 2 p m 0   +   s n 0 K a n 0 ( r   +   ω n 0 ) ( r   +   m 0   +   ω n 0 ) 2 , a 12 = a m 0 ( r   +   ω m 0 ) ( r   +   m 0   +   ω n 0 ) 2   +   s 1 m 0 K , b 21 = c , a 22 = v .
Therefore, the equation of the characteristic takes the form
λ 2   +   P 1 λ   +   P 2   +   P 3 e λ τ = 0 ,
where P 1 = n 2 l 2 ( d 1   +   d 2 ) a 11 a 22 , P 2 = ( n 2 l 2 d 2 a 22 ) ( n 2 l 2 d 1 a 11 ) and P 3 = a 12 b 21 .
Under hypothesis
( H 1 ) a 11 a 22 a 12 b 21 > 0
and
( H 2 ) a 11   +   a 22 < 0 .                  
Lemma 1.
Assuming that ( H 1 ) and ( H 2 ) are satisfied, the system (3) behaves stably when τ = 0 .
Proof. 
The detailed proof for the case when τ = 0 can be found in [14]. Briefly speaking, (15) can be written in
λ 2   +   P 1 λ   +   P 2   +   P 3 = 0 ,
with P 1 a 11 a 22 > 0 and P 2   +   P 3 a 11 a 22 a 12 b 21 > 0 for n N 0 . Hence all roots of (15) possess negative real parts for n N 0 . □
P 2   +   P 3 > 0 can be easily obtained under ( H 1 ) and ( H 2 ) , then Lemma 2 holds.
Lemma 2.
Assuming that ( H 1 ) and ( H 2 ) are satisfied, the value λ = 0 does not satisfy Equation (15) for any n N 0 .
When τ > 0 , let λ = ± i ω ( ω > 0 ) be the solutions of (15). Euler’s formula provides a representation of eigenvalues through their real and imaginary components.
ω 2 P 2 = P 3 cos ( ω τ ) , P 1 ω = P 3 sin ( ω τ ) .
Square both sides of the two equations in (16) and then add them together, we can obtain
ω 4   +   ( P 1 2 2 P 2 ) ω 2   +   P 2 2 P 3 2 = 0 .
Define z = ω 2 , then (17) is equivalent to
z 2   +   ( P 1 2 2 P 2 ) z   +   P 2 2 P 3 2 = 0
and the roots of (18) take the form
z ± = 1 2 ( P 1 2 2 P 2 ) ± ( P 1 2 2 P 2 ) 2 4 ( P 2 2 P 3 2 ) .
Through the computation, it is found that
P 1 2 2 P 2 = ( d 1 n 2 l 2 a 11 ) 2   +   ( d 2 n 2 l 2 a 22 ) 2 > 0 ,
P 2 P 3 = d 1 d 2 n 4 l 4   +   a 11 d 2 a 22 d 1 n 2 l 2 ( a 12 b 21 a 11 a 22 ) ,
P 2   +   P 3 = d 1 d 2 n 4 l 4   +   a 11 d 2 a 22 d 1 n 2 l 2   +   ( a 12 b 21   +   a 11 a 22 ) .
Under the hypothesis ( H 1 ) and ( H 2 ) , there will be two possible situations.
( Case   1 )                                                                                                               P 2 P 3 > 0 .                                                                                                                                
( Case   2 )   For   some   N 1 N 0 ,   P 2   +   P 3 < 0   for   n = 0 , 1 , , N 1   and   P 2   +   P 3 > 0   for   n > N 1 .
Lemma 3.
Assuming that ( H 1 ) and ( H 2 ) are satisfied, the following statements hold.
(i)
In ( Case   1 ) , Equation (15) has no purely imaginary root.
(ii)
In ( Case   2 ) , Equation (15) has two roots ± i ω n     ( 0 n N 1 ) at τ n j = τ n 0   +   2 j π ω n ,   j   =   0 , 1 , 2 , , where
τ n 0 = 1 ω n arccos ω n 2 B n s B C
and
ω n = 1 2 ( P 1 2 2 P 2 ) ± ( P 1 2 2 P 2 ) 2 4 ( P 2 2 P 3 2 ) .
Let λ n ( τ ) be the root of Equation (15), where its real part is 0 and its imaginary part is ω n as τ approaches τ n j . Therefore, we derive the transversality condition.
Lemma 4.
Assuming that ( H 1 ) , ( H 2 ) and ( Case   2 ) are satisfied, we can obtain
d λ d τ | τ = τ n j > 0     f o r     0 n N 1     a n d     j N 0 .
Proof. 
Make transformations
( d λ d τ ) 1 = 2 λ   +   P 1 τ P 3 e λ τ λ P 3 B e λ τ .
Using λ = i ω and (15), the following expression can be obtained.
R e ( d λ d τ ) τ = τ n j 1 = P 1 2 2 P 2   +   2 ω n 2 P 3 2 = ( P 1 2 2 P 2 ) 2 4 ( P 2 2 P 3 2 ) P 3 2 .
Therefore d λ d τ | τ = τ n j > 0 . □
Define τ 0 = min 0 i N 1 { τ i 0 } . The situation where τ n 1 j = τ n 2 l for some n 1 n 2 may occur. This paper addresses
τ R : = { τ n j :   τ n 1 j τ n 2 l ,   n 1 n 2 ,   0 n 1 , n 2 N 1 ,   j , l N 0 } .
In summary, the Theorem 4 is obtained.
Theorem 4.
For system (3), assuming that ( H 1 ) and ( H 2 ) are satisfied, the statements below hold.
(i)
In ( Case   1 ) , E ( m 0 , n 0 ) is locally stable. The system (3) will asymptotically converge to it.
(ii)
In ( Case   2 ) , for 0 τ < τ 0 , E ( m 0 , n 0 ) is locally stable. The system (3) will asymptotically converge to it.
(iii)
In ( Case   2 ) , for τ > τ 0 , E ( m 0 , n 0 ) exhibits instability.
(iv)
In ( Case   2 ) , the system (3) also undergoes a Hopf bifurcation. When τ = τ 0 j with j N 0 , the bifurcating periodic solutions arising from the bifurcation are spatially homogeneous. Otherwise, the bifurcating periodic solutions are not spatially homogeneous.

4. Direction and Stability of Spatial Hopf Bifurcation

The center manifold theorem and the normal form theory [27,28] are applied to study both the direction of the Hopf bifurcation and the stability of the bifurcating periodic solution.
Make m ˜ ( x , t ) = m ( x , τ t ) m 0 and n ˜ ( x , t ) = n ( x , τ t ) n 0 . To simplify the notation, we drop the tilde. Consequently, the system (3) can be rewritten as
m t = τ [ d 1 Δ m   +   p ( 1 ( m   +   m 0 ) K ) ( m   +   m 0 )                 a ( m   +   m 0 ) ( n   +   n 0 ) r   +   ( m   +   m 0 )   +   ω ( n   +   n 0 )   +   s ( 1 ( m   +   m 0 ) K ) ( n   +   n 0 ) ] , x ( 0 , l π ) ,   t > 0 , n t = τ [ d 2 Δ n   +   c ( m ( t τ )   +   m 0 ) v ( n   +   n 0 ) ] , x ( 0 , l π ) ,   t > 0 .
Let
τ = τ ˜   +   μ ,     m 1 ( t ) = m ( · , t ) ,     m 2 ( t ) = n ( · , t )     and     U = ( m 1 , m 2 ) T .
In the space C of continuous functions on the interval [ 1 , 0 ] , the expression (21) is abstractly represented by
d U ( t ) d t = τ ˜ D Δ U ( t )   +   L τ ˜ ( U t )   +   W ( U t , μ ) ,
where D = diag ( d 1 , d 2 ) , and L μ ( ϕ ) : C X and W ( ϕ , μ ) : C × R X are defined by
L μ ( ϕ ) = μ a 11 ϕ 1 ( 0 )   +   a 12 ϕ 2 ( 0 ) b 21 ϕ 1 ( 1 )   +   a 22 ϕ 2 ( 0 )
and
W ( ϕ , μ ) = μ D Δ ϕ   +   L μ ( ϕ )   +   f ( ϕ , μ ) ,
with
f ( ϕ , μ ) = ( τ ˜   +   μ ) ( W 1 ( ϕ , μ ) , W 2 ( ϕ , μ ) ) T , W 1 ( ϕ , μ ) = p 1 ( ϕ 1 ( 0 )   +   m 0 ) K ( ϕ 1 ( 0 )   +   m 0 ) a ( ϕ 1 ( 0 )   +   m 0 ) ( ϕ 2 ( 0 )   +   n 0 ) r   +   ( ϕ 1 ( 0 )   +   m 0 )   +   ω ( n   +   n 0 )       +   s 1 ( ϕ 1 ( 0 )   +   m 0 ) K ( ϕ 2 ( 0 )   +   n 0 ) , W 2 ( ϕ , μ ) = c ( ϕ 1 ( 1 )   +   m 0 ) v ( ϕ 2 ( 0 )   +   n 0 ) .
When τ ˜ = τ n j , the system (21) undergoes a Hopf bifurcation at the equilibrium point ( 0 , 0 ) . And Λ n : = { i ω n τ ˜ , i ω n τ ˜ } is a pair of eigenvalues of the linearized system
d U ( t ) d t = ( τ ˜   +   μ ) D Δ U ( t )   +   L ( τ ˜   +   μ ) ( U t )
near the equilibrium point when μ = 0 .
Detailed calculations of basis functions and normal form coefficients are provided in Appendix A.
Based on the center manifold reduction and normal form theory, we proceed to calculate the following equation,
  c 1 ( 0 ) = i 2 ω n τ ˜ ( g 20 g 11 2 | g 11 | 2 | g 02 | 2 3 )   +   1 2 g 21 ,       μ 2 = R e ( c 1 ( 0 ) ) R e ( λ ( τ n j ) ) ,   T 2 = 1 ω n τ ˜ [ I m ( c 1 ( 0 ) )   +   μ 2 I m ( λ ( τ n j ) ) ] ,       β 2 = 2 R e ( c 1 ( 0 ) ) .
Theorem 5.
For any critical value τ n j , the following statements hold.
(i)
The directions of the Hopf bifurcation are determined by the sign of μ 2 . When μ 2 > 0 , bifurcating periodic solutions exist for τ > τ n j with a forward Hopf bifurcation. When μ 2 < 0 , the bifurcating periodic solutions do not exist for τ < τ n j , and the direction of the Hopf bifurcation is backward for τ < τ n j .
(ii)
The stability of the bifurcating periodic solutions on the center manifold is determined by the sign of β 2 . When β 2 < 0 , the bifurcating periodic solutions are locally asymptotically stable. When β 2 > 0 , it is unstable.
(iii)
The period of the bifurcating periodic solutions is determined by the sign of T 2 . When T 2 > 0 , the period of the periodic solutions increases. When T 2 < 0 , it decreases.

5. Numerical Simulations

To confirm the accuracy of the results above, we use MATLAB R2020a for numerical simulation.
For the system (3), the values of the parameters are shown in Table 1. By calculation, we can obtain the positive equilibrium point E ( m 0 , n 0 ) = ( 9.57334 × 10 15 , 9.57334 × 10 14 ) and
a 11 0.018013 ,     a 12 0.236918 ,     b 21 = 0.002 ,     a 22 = 0.02 ,
a 11 a 22 a 12 b 21 0.000113575 > 0 ,     a 11   +   a 12 0.00198699 < 0 .
Therefore both ( H 1 ) and ( H 2 ) are satisfied, and ( Case 2 ) is met. Through further calculation, it is obtained that N 1 = 2 , ω 0 0.010635 , τ 0 = τ 0 0 4.1948 .
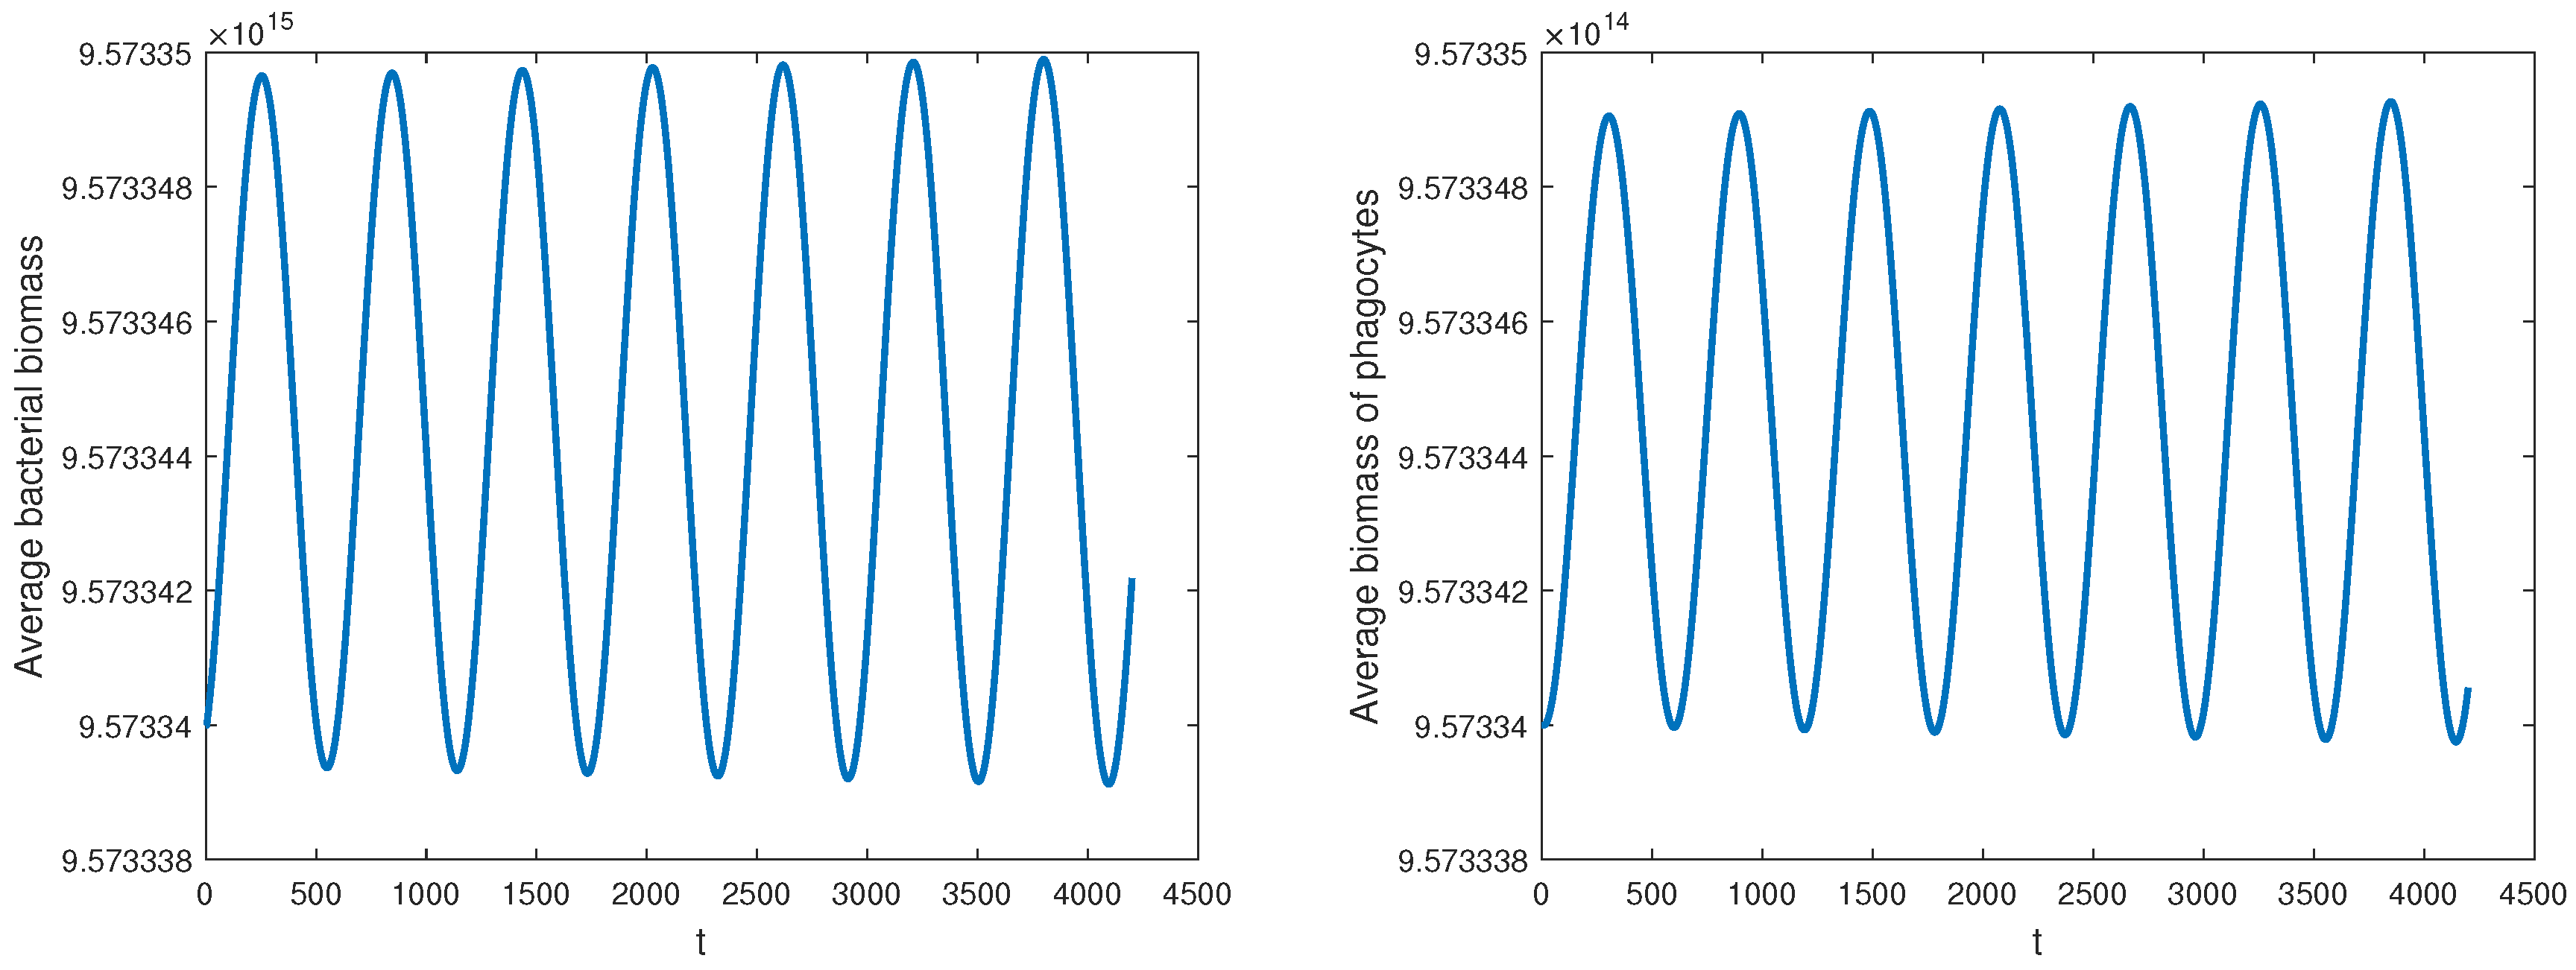
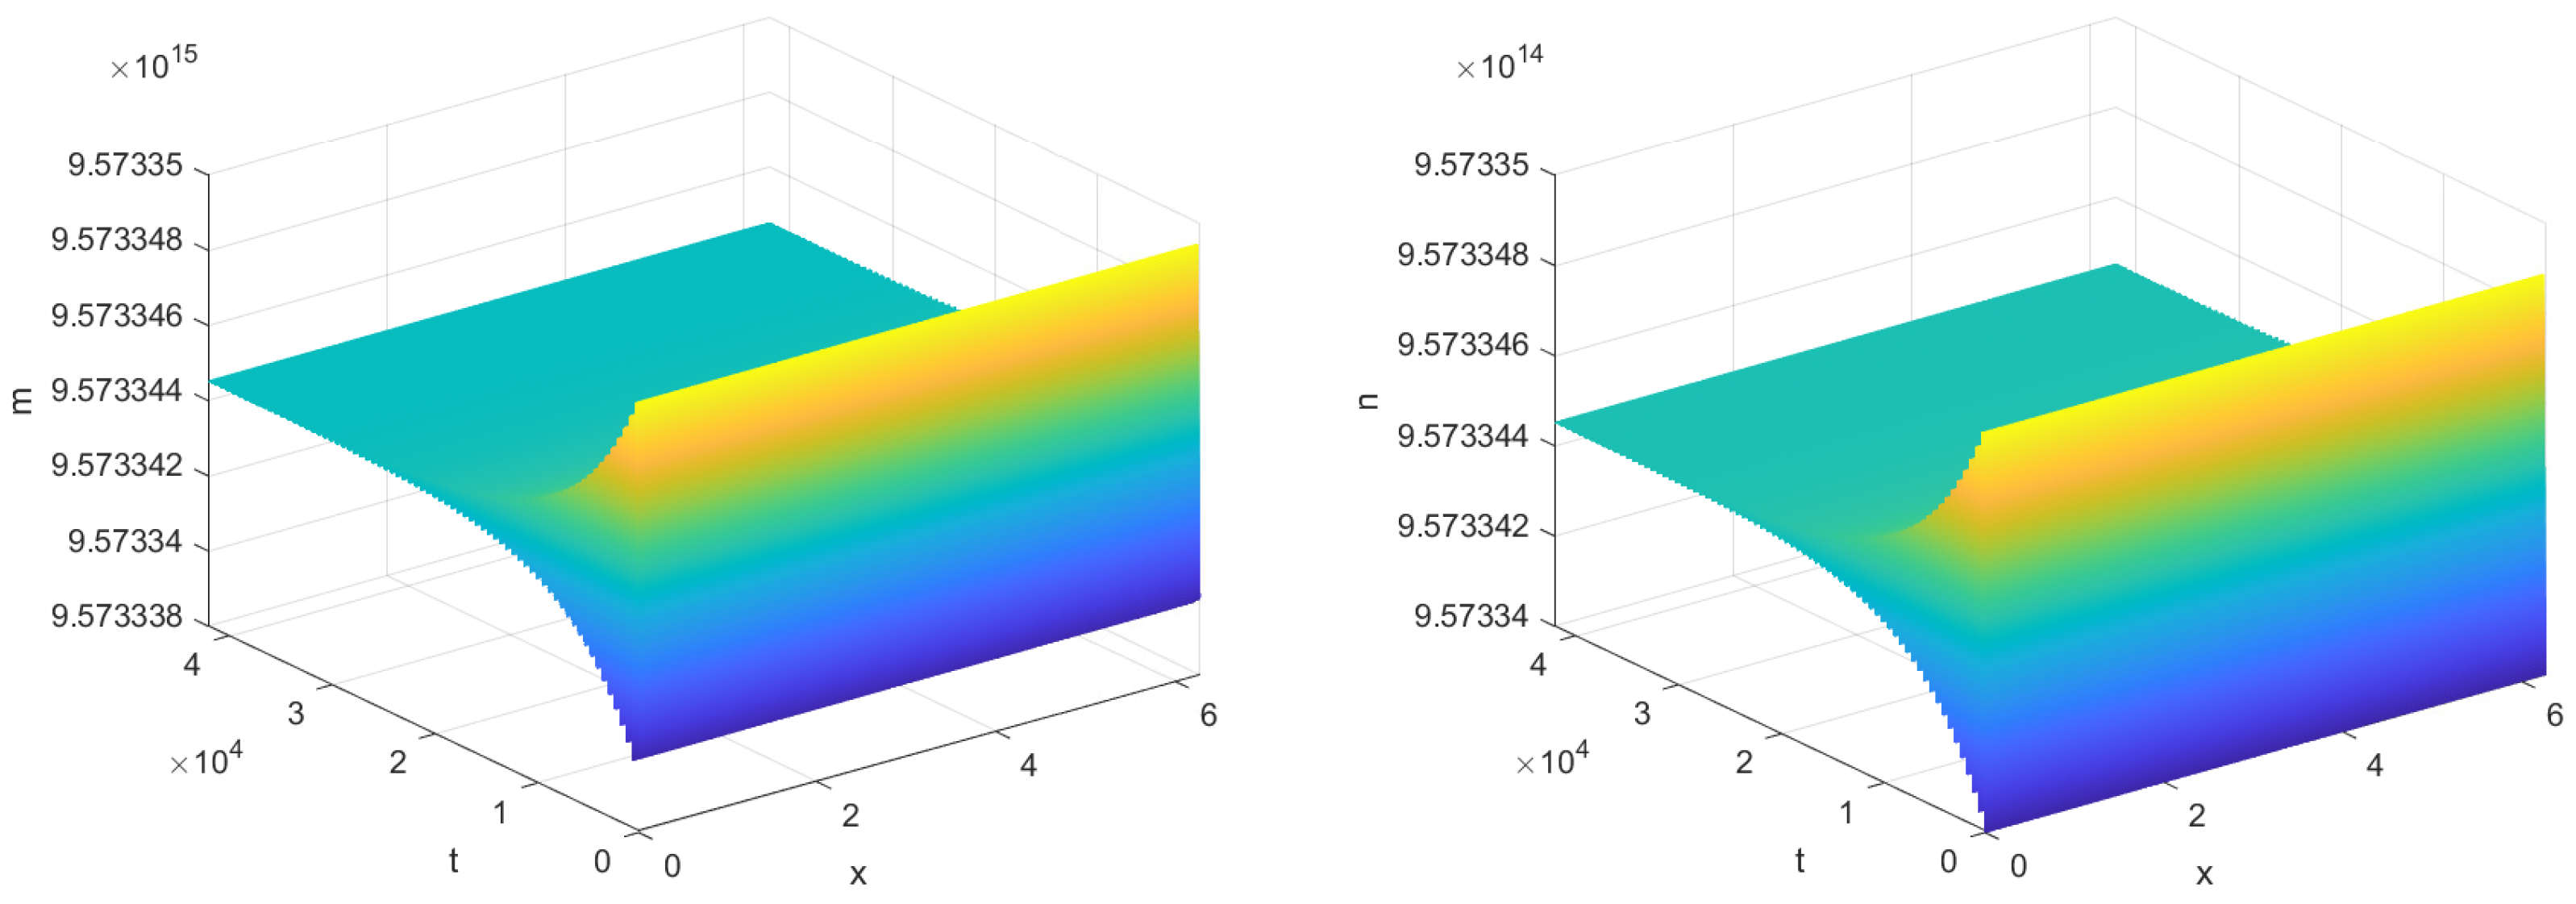
Theorem 4(ii) implies that when 0 τ < τ 0 , E ( m 0 , n 0 ) is locally asymptotically stable. This can be shown in Figure 1, where τ = 3.5 is chosen. Theorem 4(iii) implies that the equilibrium E ( m 0 , n 0 ) loses its stability as τ increases through τ 0 , giving rise to a Hopf bifurcation. According to Theorem 5,
Re ( c 1 ( τ 0 ) ) 0.0002357 ,     Im ( c 1 ( τ 0 ) ) 0.0000105074 ,
Re ( λ ( τ 0 ) ) 2.16494 × 10 6 ,     Im ( λ ( τ 0 ) ) 0.00104042 ,
μ 2 0.117811 > 0 ,     β 2 0.000055536 < 0 ,     and     T 2 0.0012837 < 0 .
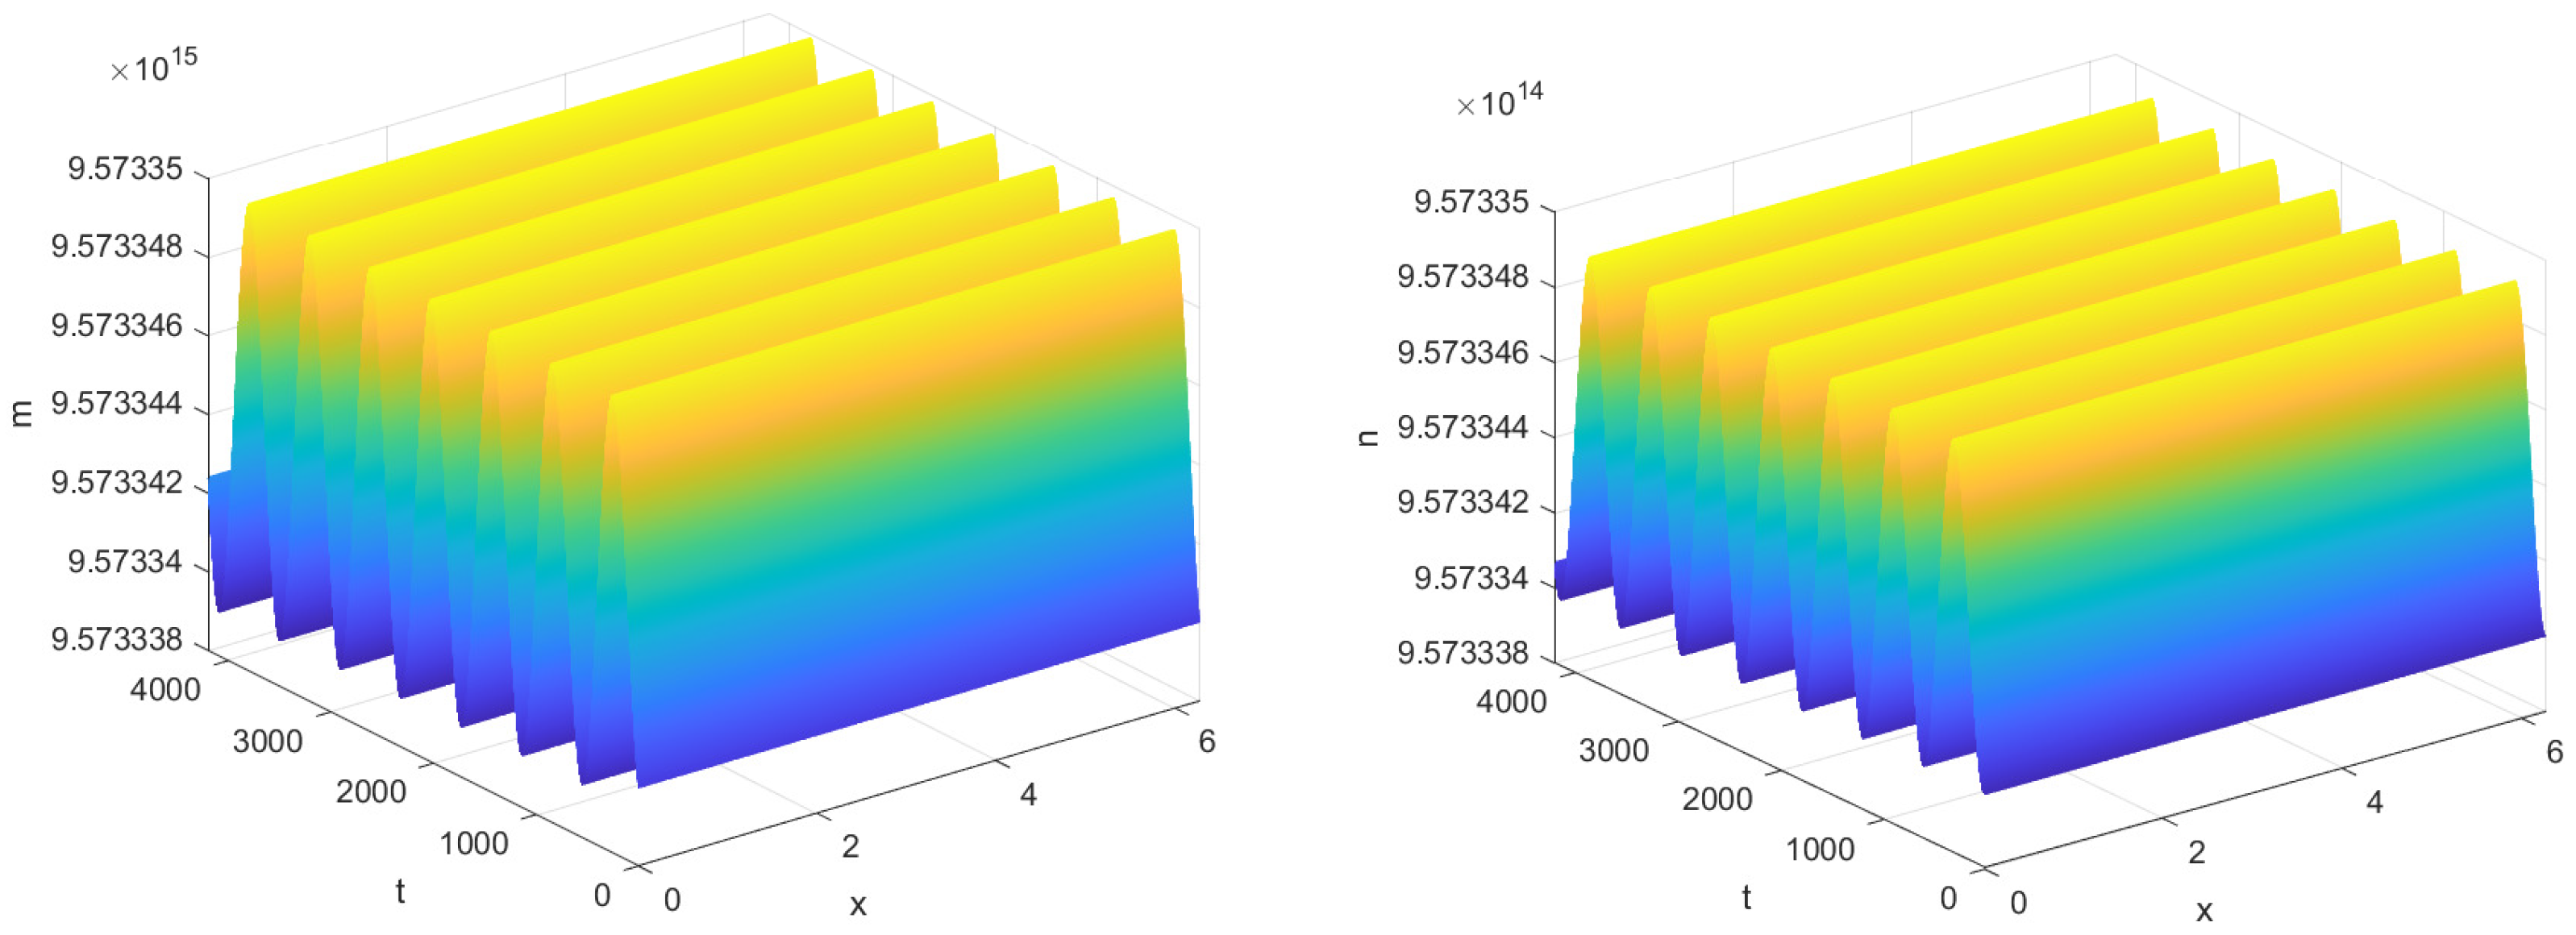
It can be concluded from the above results that the bifurcation proceeds in the forward direction. The bifurcating periodic solutions are locally asymptotically stable. Moreover, the period of the solutions emerging from the bifurcation decreases with increasing τ . Figure 2 illustrates this behavior at the value τ = 4.2 .
As shown in Figure 3, Figure 4 and Figure 5, time delay plays a critical role in inflammatory responses, where even minor variations can lead to significant changes in system dynamics. Specifically, when 0 < τ < τ 0 , the time it takes for the system to reach steady state is significantly longer than when there is no time delay, i.e., τ = 0 . This is because the introduction of time delay causes a lag in the response of phagocytes to bacterial signals, resulting in the system’s current state being dependent on its past state, slowing down the convergence to steady state. Notably, as shown in Figure 4, when 0 < τ < τ 0 , the stabilization time of the system increases with increasing τ , indicating that delays in immune regulation may prolong infection recovery time. And as shown in Figure 5, when τ = 4.2 > τ 0 , the system transitions into a stable periodic oscillatory state. This shift suggests that excessive delays in immune responses may lead to recurrent inflammation.
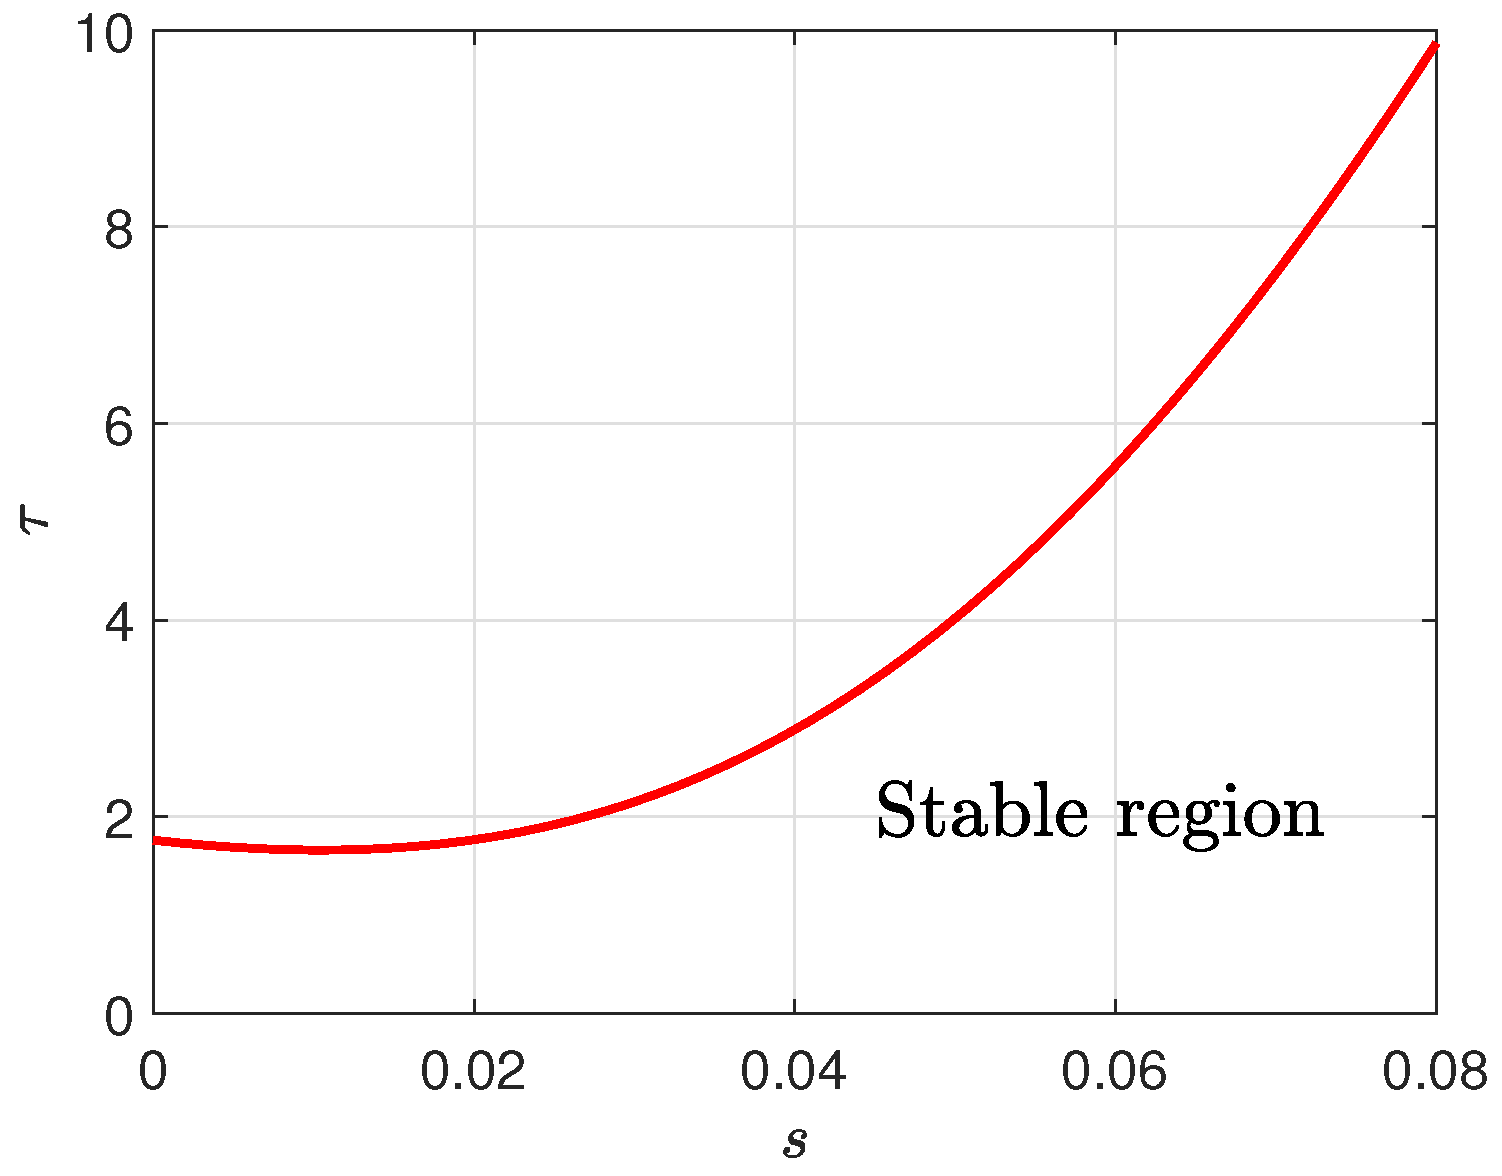
Since intestinal permeability serves as a critical pathological marker in Crohn’s disease, we analyze the interactions between the parameter s and the time delay τ to elucidate their effects on system dynamics. As illustrated in Figure 6, at fixed τ , increased intestinal permeability can prolong the time required to reach steady state, manifesting as a postponement in the onset of oscillations. This phenomenon may correspond to the early stage of Crohn’s disease, where despite impaired barrier function, dynamic balance is temporarily maintained through immune regulation. Conversely, when intestinal permeability is constant, an increase in time delay can lead to a decrease in system stability, making oscillations more likely. This reflects the immune regulatory dysfunction observed clinically: delayed immune responses fail to suppress inflammation in time, leading to disease progression.
To identify which parameters have a greater impact on the system’s behavior, a local sensitivity and elasticity analysis is performed [29]. The analysis focuses on the equilibrium point E = ( m 0 , n 0 ) of the system (3). The sensitivity coefficient S measures the absolute change in a component of E resulting from an infinitesimal change in a parameter, i.e., S = E i p E where E i is a component of the equilibrium. In contrast, the elasticity coefficient I is a dimensionless measure, representing the percentage change in an equilibrium component in response to a 1% change in a parameter, i.e., I = p E i · S = p E i · E i p E . This normalization allows for a direct comparison of the relative importance of parameters with different units.
The results in Table 2 reveal key drivers of the system’s dynamics. The high elasticity ( I ) of the intestinal permeability coefficient a and phagocyte mortality rate v signifies that proportional changes in these parameters will cause the most pronounced proportional shifts in the system’s steady state. This highlights their roles as potential control points in the pathological process. Conversely, while the bacterial growth rate p has a lower relative impact (low I ), its substantial absolute effect (high S ) suggests it acts as a powerful direct driver of bacterial load.
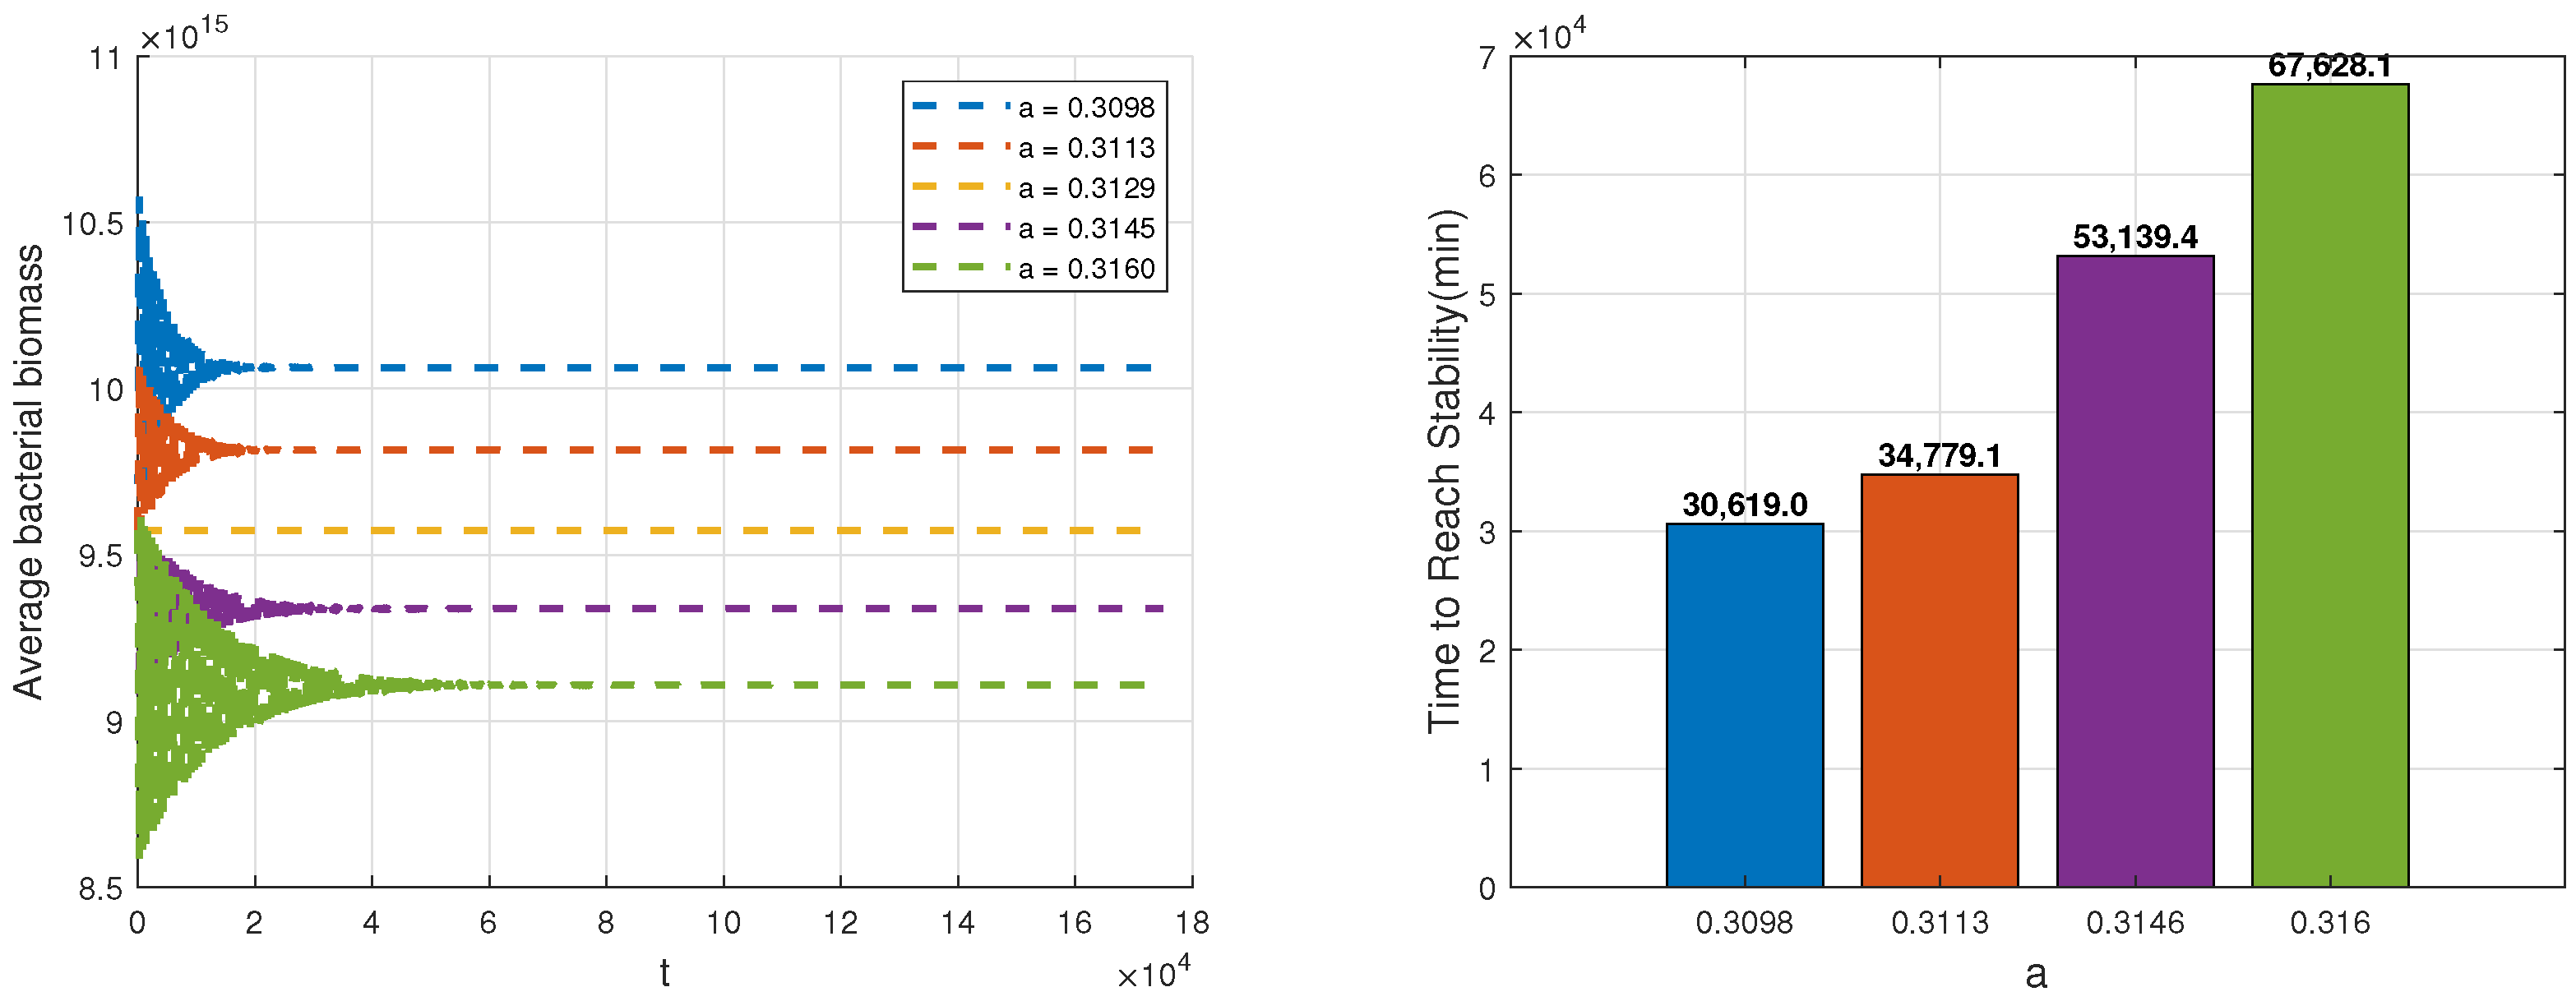
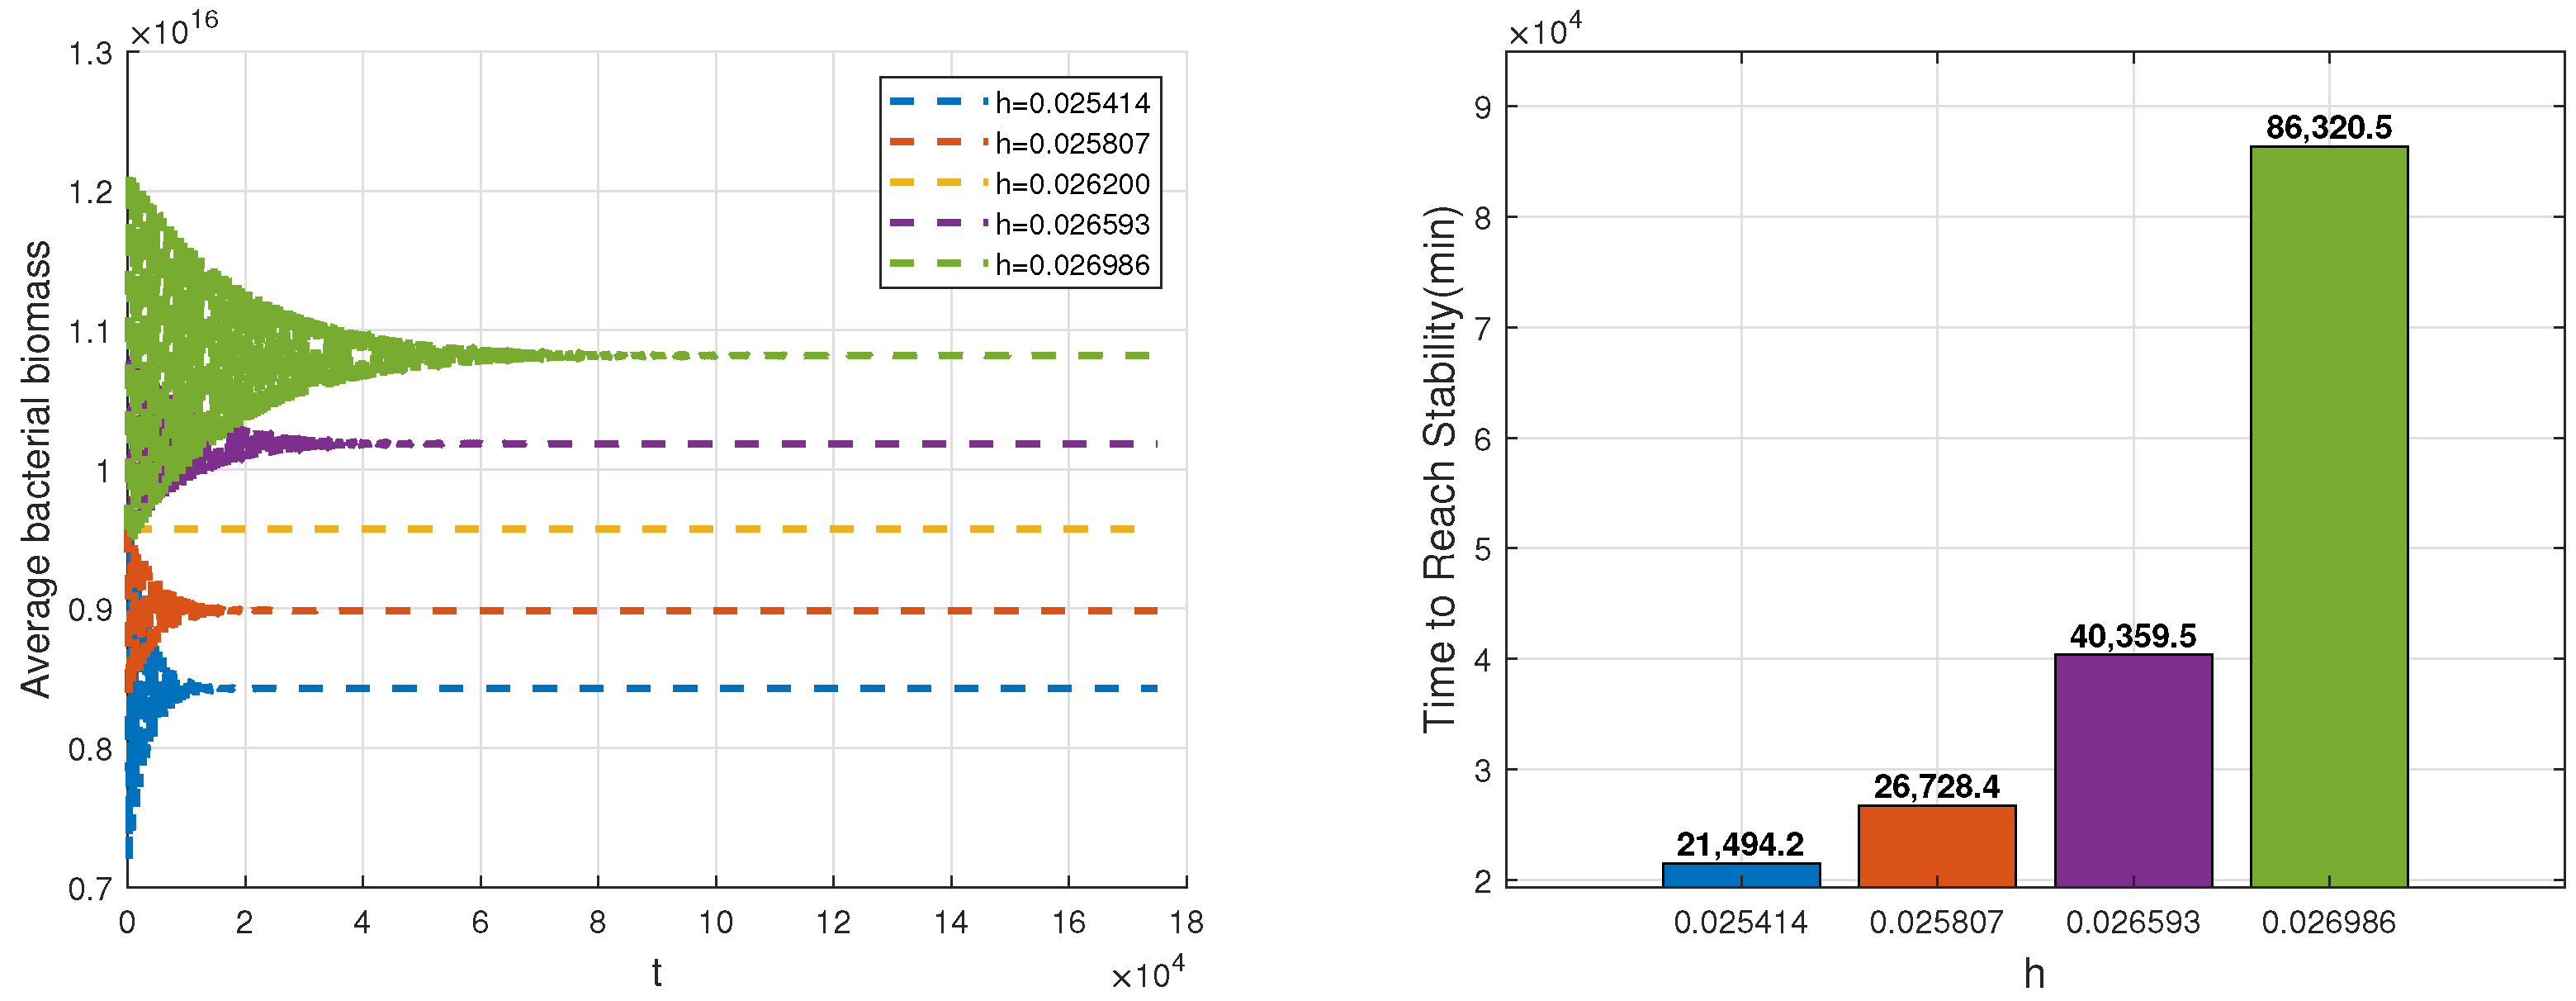
Based on the above analysis, we examine the influence of parameters a, v and p on both the spatial average biomass of bacteria and the time required to reach equilibrium. A step size of 0.35 is used to determine the time to reach stability. We consider the system to reach equilibrium when the variation in average bacterial biomass remains below 3 × 10 7 for 50 consecutive steps. As shown in Figure 7, an increase in maximum engulfment rate by phagocytes can reduce bacterial biomass but also prolongs the stabilization time, indicating that phagocytes require more time to regulate the inflammatory response. For example, when a = 0.316 , the average bacterial biomass is relatively low, but the system takes 67,628.1 min, approximately 4.7 days, to reach stability. Figure 8 demonstrates that when the phagocytosis death rate increases, the average bacterial biomass rises, and the time for bacteria to stabilize shortens. However, despite the rapid stabilization of bacteria, the infection is not effectively cleared. At last, Figure 9 reveals that an increase in the rate of bacterial increase leads to higher average bacterial biomass and a longer stabilization time. The persistent stimulation of the immune system by bacteria prolongs the duration of infection.

6. Conclusions

Crohn’s disease, a chronic inflammatory bowel disorder, arises from dysregulated interactions between intestinal phagocytes and gut microbiota. In this paper, we establish a delay differential model of the phagocyte–bacteria interactions to study the dynamic behavior of these interactions. First, we prove the positivity, boundedness, existence, uniqueness, and global stability of the solutions for the ordinary differential system without a time delay. We investigate the stability of the positive equilibrium point and analyze the existence of Hopf bifurcation for the partial differential system with a time delay. Our study reveals that when the delay τ exceeds a critical value τ 0 , a forward Hopf bifurcation occurs, provided that μ 2 > 0 , destabilizing the positive equilibrium E ( m 0 , n 0 ) and giving rise to periodic oscillations. By applying normal form theory and center manifold theory, we systematically derive the bifurcation direction and stability criteria for the bifurcating periodic solutions.
Numerical simulations verify the theoretical results. Comparing the temporal changes in average biomass of bacteria and phagocytes with and without time delay, we find that the delay significantly slows down the system’s approach to a steady state. This indicates that the time delay in immune regulation may prolong inflammation recovery time. We analyze the interactions between intestinal permeability s (a key pathological marker of Crohn’s disease) and time delay τ from different perspectives. When τ is fixed, increased intestinal permeability prolongs the time required for the system to reach steady state, corresponding to the early stage of Crohn’s disease. When s remains constant, increased time delay makes the system more susceptible to oscillations, matching clinically observed immune regulation dysfunctions. Finally, we conduct sensitivity analysis on other parameters to study their effects on average bacterial biomass and the time required to reach stability. The results show that an increased maximum engulfment rate by phagocytes a reduces bacterial biomass but prolongs stabilization time, while an increased phagocyte death rate v shortens stabilization time but increases average bacterial biomass. Additionally, an increased rate of bacterial increase p leads to higher average bacterial biomass and longer stabilization time. These findings provide insights into the dynamic equilibrium in immune systems.
Author Contributions

Conceptualization, R.Y. and Y.S.; methodology, R.Y.; software, Y.S.; Investigation, Y.S. and R.Y.; writing-original draft preparation, Y.S.; writing-review and editing, R.Y. and Y.S.; Supervision, R.Y. All authors have read and agreed to the published version of the manuscript.

Funding

This research is supported by Heilongjiang Provincial Natural Science Foundation (PL2024A002).

Institutional Review Board Statement

Not applicable.

Informed Consent Statement

Not applicable.

Data Availability Statement

The original contributions presented in this study are included in the article. Further inquiries can be directed to the corresponding author.

Acknowledgments

The authors wish to express their gratitude to the editors and the reviewers for their helpful comments.

Conflicts of Interest

The authors declare no conflict of interest.

Appendix A. Detailed Analysis of the Direction and Stability of Hopf Bifurcation

Name the corresponding characteristic function of τ D Δ as β n 1 , 2 ( x ) , where
β n 1 ( x ) = cos n l x 0 ,     β n 2 ( x ) = 0 cos n l x
with n N .
Next, we study functional differential equation
d z ( t ) d t = τ ˜ D n 2 l 2 z ( t )   +   L τ ˜ ( z t ) .
Using Riesz representation theorem, there exists a 2 × 2 matrix-valued function of bounded variation η n ( θ , τ ˜ ) ( θ [ 1 , 0 ] ) such that
τ ˜ D n 2 l 2 ϕ ( 0 )   +   L τ ˜ ( ϕ ) = 1 0 d η n ( σ , τ ) ϕ ( σ )
for ϕ C ( [ 1 , 0 ] , R 2 ) , where
η n ( θ , τ ) = τ E , θ = 0 , 0 , θ ( 1 , 0 ) , τ W , θ = 1 ,
and
E = a 11 d 1 n 2 l 2 a 12 0 a 22 d 2 n 2 l 2 ,                       W = 0 0 b 21 0 .
Define a bilinear relation
( ψ , ϕ ) = ψ ( 0 ) ϕ ( 0 ) 1 0 ξ = 0 σ ψ ( ξ σ ) d η n ( σ , τ ˜ ) ϕ ( ξ ) d ξ   = ψ ( 0 ) ϕ ( 0 )   +   τ ˜ 1 0 ψ ( ξ   +   1 ) W ϕ ( ξ ) d ξ ,
ϕ C 1 ( [ 1 , 0 ] , R 2 ) , ψ C 1 ( [ 1 , 0 ] , R 2 ) . Let A ( τ ˜ ) be the infinitesimal minimal generator of the semigroup generated by the solutions of (25) and A be its normal adjoint operator. ± i ω n τ ˜ is a pair of simple pure imaginary roots of A ( τ ˜ ) and A . Let P = span { h ( θ ) , h ( θ ) ¯ } and P = span { h ( s ) , h ( s ) ¯ } be the subspace of the linearized system. This refers to the generalized eigenspace of A ( τ ˜ ) and A corresponding to Λ n . In this case, P is the dual of P. The dimensions of P and P are both 2.
We demonstrate that the functions
h ( θ ) = ( 1 , ξ ) e i ω n τ ˜ θ ,   θ [ 0 , 1 ] , h ( s ) = ( 1 , η ) e i ω n τ ˜ s ,   s [ 0 , 1 ] ,
with their complex conjugates h ( θ ) ¯ and h ( s ) ¯ , form bases for A ( τ ˜ ) and A respectively, in conjunction with Λ n , where
ξ = d 1 n 2 l 2   +   i ω n a 11 a 12 = b 21 e i τ ˜ ω n s d 2 n 2 l 2 a 22   +   i ω n ,         η = d 1 n 2 l 2 a 11 i ω n b b 21 e i τ ˜ ω n = a 12 d 2 n 2 l 2 a 22 i ω n .
Let Ψ = ( Ψ 1 , Ψ 2 ) and Φ = ( Φ 1 , Φ 2 ) T with
Ψ 1 ( σ ) = h ( θ )   +   h ¯ ( θ ) 2 = R e e i ω n τ ˜ θ R e ξ e i ω n τ ˜ θ = cos ω n τ ˜ θ 1 a 12 d 1 n 2 l 2 a 11 cos θ τ ˜ ω n   +   ω n 2 a 12 sin θ τ ˜ ω n ,
Ψ 2 ( θ ) = h ( θ ) h ¯ ( θ ) 2 i = I m e i ω n τ ˜ θ I m ξ e i ω n τ ˜ θ = sin ω n τ ˜ θ ω n a 12 a 11 d 1 n 2 l 2 sin θ τ ˜ ω n ω n a 12 cos θ τ ˜ ω n ,
and
Φ 1 ( s ) = h ( s )   +   h ¯ ( s ) 2 = R e e i ω n τ ˜ s R e η e i ω n τ ˜ s   = cos ω n τ ˜ s a 12 l 2 d 2 n 2 l 2 a 12 2   +   l 4 ω n 2 d 2 n 2 a 22 l 2 cos s τ ˜ ω n   +   l 2 ω n sin r τ ˜ ω n ,
Φ 2 ( s ) = h ( r ) h ¯ ( s ) 2 i = I m e i ω n τ ˜ s I m η e i ω n τ ˜ s   = sin ω n τ ˜ r a 12 l 2 ω n d 2 n 2 a 22 l 2 2   +   l 4 ω n 2 l 2 cos r τ ˜ ω n   +   a 22 l 2 d 2 n 2 sin r τ ˜ ω n .
Let
G 1 = ( Φ 1 , Ψ 1 ) ,   G 2 = ( Φ 1 , Ψ 2 ) ,   G 3 = ( Φ 2 , Ψ 1 ) ,   G 4 = ( Φ 2 , Ψ 2 ) ,
and define ( Φ , Ψ ) = ( Φ j , Ψ k ) = G 1     G 2 G 3     G 4 according to the linear relationship. Construct a basis for P by
Φ = ( Φ 1 , Φ 2 ) T = ( Φ , Ψ ) 1 Φ .
Then ( Φ , Ψ ) = I 2 .
Defining f n as a vector with components β n 1 and = β n 2 , we obtain b · f n = b 1 β n 1   +   b 2 β n 2 ,     for     b = ( b 1 , b 2 ) T C ( [ 1 , 0 ] , X ) . And the central subspace of Equation (25) at μ = 0 is P C N C P S C . Specifically, P S C is the subspace in C that complements P C N C .
< U 1 , U 2 > : = 1 l π 0 l π m 1 n 1 ¯ d x   +   1 l π 0 l π m 2 n 2 ¯ d x
for U 1 = ( m 1 , m 2 ) , U 2 = ( n 1 , n 2 ) , m , n X and < ϕ , f n > = ( < ϕ , f n 1 > , < ϕ , f n 2 > ) T .
Consider A τ ˜ as the generator of infinitesimal transformations corresponding to the analytic semigroup associated with system (25) when μ = 0 , and Equation (21) can be expressed abstractly by
d U ( t ) d t = A τ ˜ U t   +   R ( U t , μ ) ,
where
R ( U t , μ ) = 0 , θ [ 1 , 0 ) , W ( U t , μ ) , θ = 0 .
By P C N C P S C , the solution of (A6) can be expressed as
U t = Ψ x 1 ( t ) x 2 ( t ) f 1   +   h ( x 1 , x 2 , 0 ) ,
where
x 1 x 2 = ( Φ , < U t , f 1 > ) .
Express z in terms of x 1 i x 2 . From h = Ψ 1   +   i Ψ 2 , the solution of Equation (A7) can be represented as
Ψ x 1 x 2 f n = ( Ψ 1 , Ψ 2 ) z   +   z ¯ 2 i ( z z ¯ ) 2 f n = 1 2 ( h z   +   h ¯ z ¯ ) f n   +   V ( z , z ¯ ) ,
where
V ( z , z ¯ ) = h ( z   +   z ¯ 2 , i ( z z ¯ ) 2 , 0 ) .
In the region of the center manifold,
V ( z , z ¯ ) = V 20 z 2 2   +   V 11 z z ¯   +   V 02 z ¯ 2 2   +   .
From [27], at τ = τ ˜ ,
z ˙ = i ω n τ ˜ z   +   g ( z , z ¯ ) ,
where
g ( z , z ¯ ) = ( Φ 1 ( 0 ) i Φ 2 ( 0 ) ) < W ( U t , 0 ) , f n > = g 20 z 2 2   +   g 11 z z ¯   +   g 02 z ¯ 2 2   +   .
from Equations (A8) and (A9), we can obtain
m t ( 0 ) = 1 2 ( z   +   z ¯ ) cos n x l   +   V 20 ( 1 ) ( 0 ) z 2 2   +   V 11 ( 1 ) ( 0 ) z z ¯   +   V 02 ( 1 ) ( 0 ) z ¯ 2 2   +   ,
n t ( 0 ) = 1 2 ( ξ   +   ξ ¯ z ¯ ) cos n x l   +   V 20 ( 2 ) ( 0 ) z 2 2   +   V 11 ( 2 ) ( 0 ) z z ¯   +   V 02 ( 2 ) ( 0 ) z ¯ 2 2   +   ,
m t ( 1 ) = 1 2 ( z e i ω n τ ˜   +   z ¯ e i ω n τ ˜ ) cos ( n x l )   +   V 20 ( 1 ) ( 1 ) z 2 2   +   V 11 ( 1 ) ( 1 ) z z ¯   +   V 02 ( 1 ) ( 1 ) z ¯ 2 2   +   ,
and
W ¯ 1 ( U t , 0 ) = 1 τ ˜ W 1 = 1 2 f m m m t 2 ( 0 )   +   f m n m t ( 0 ) v t ( 0 )   +   ,
W ¯ 2 ( U t , 0 ) = 1 τ ˜ W 2 = 1 2 g m m m t 2 ( 1 )   +   g m n m t ( 1 ) v t ( 0 )   +   1 2 g n n n t 2 ( 0 )   +   ,
where
f m m = 2 p K 2 m 0 n 0 r ( 1   +   ω ) 2 m 0   +   r   +   m 0 ω 3   +   2 n 0 r ( 1   +   ω ) ( m 0   +   r   +   m 0 ω ) 2 ,     f m n = s K   +   m 0 r ( 1   +   ω ) ( m 0   +   r   +   m 0 ω ) 2 r m 0   +   r   +   m 0 ω , g m m = g m n = g n n = 0 .
Thus,
W ¯ 1 ( U t , 0 ) = z 2 2 [ 1 4 cos 2 n x l f m m   +   2 ξ f m n ]   +   z z ¯ [ 1 4 cos 2 n x l f m m   +   ( ξ ¯   +   ξ ) f m n ]     +   z ¯ 2 2 [ 1 4 cos 2 n x l f m m   +   2 ξ ¯ f m n ]     +   z 2 z ¯ 2 cos n x l [ V 11 ( 1 ) ( 0 ) f m m   +   ξ f m n   +   V 11 ( 2 ) ( 0 ) f m n   +   V 20 ( 1 ) ( 0 ) f m m   +   ξ ¯ f m n 2     +   V 20 ( 2 ) ( 0 ) f m n 2 ]   +   ,
W ¯ 2 ( U t , 0 ) = 0 ,
< W ( U t , 0 ) , f n > = τ ˜ ( W ¯ 1 ( U t , 0 ) f n 1   +   W ¯ 2 ( U t , 0 ) f n 2 ) = z 2 2 τ ˜ 1 4 f m m   +   2 ξ f m n 0 Γ     +   z z ¯ τ ˜ 1 4 f m m   +   ( ξ ¯   +   ξ ) f m n 0 Γ     +   z ¯ 2 2 τ ˜ 1 4 f m m   +   2 ξ ¯ f m n 0 Γ   +   z 2 z ¯ 2 τ ˜ κ 1 κ 2   +   .
and
Γ = 1 l π 0 l π cos 3 ( n x l ) d x ,
κ 1 = ( f m m   +   ξ f m n ) < V 11 ( 1 ) ( 0 ) cos n x l , cos n x l >   +   f m n < V 11 ( 2 ) ( 0 ) cos n x l , cos n x l >     +   1 2 ( f m m   +   ξ ¯ f m n ) < V 20 ( 1 ) ( 0 ) cos n x l , cos n x l >   +   1 2 f m n < V 20 ( 2 ) ( 0 ) cos n x l , cos n x l > ,
κ 2 = 0 ,
( Φ 1 ( 0 ) i Φ 2 ( 0 ) ) < W ( U t , 0 ) , f n > =   z 2 2 [ γ 1 4 f m m   +   2 ξ f m n   +   γ 2 4 e 2 i τ ˜ ω n g m m   +   2 e i τ ˜ ω n ξ g m n   +   ξ 2 g n n ] Γ τ ˜     +   z z ¯ [ γ 1 4 f m m   +   ( ξ ¯   +   ξ ) f m n   +   γ 2 4 ( g m m   +   e i τ ˜ ω n ξ ¯   +   e i τ ˜ ω n ξ g m n   +   ξ ¯ ξ g n n ) ] Γ τ ˜     +   z ¯ 2 2 [ γ 1 4 f m m   +   2 ξ ¯ f m n   +   γ 2 4 ( e 2 i τ ˜ ω n g m m   +   2 e i τ ˜ ω n ξ ¯ g m n   +   ξ ¯ 2 g n n ) ] Γ τ ˜     +   z 2 z ¯ 2 τ ˜ [ γ 1 κ 1   +   γ 2 κ 2 ]   +   ,
Then by (A11), (A9) and (A17), when n = 1 , 2 , 3 , , g 20 = g 11 = g 02 = 0 . When n = 0 ,
g 20 = γ 1 4 f m m   +   2 ξ f m n ,
g 11 = γ 1 4 f m m   +   ( ξ ¯   +   ξ ) f m n ,
g 02 = γ 1 4 f m m   +   2 ξ ¯ f m n .
When n N 0 , g 21 = τ ˜ ( γ 1 κ 1   +   γ 2 κ 2 ) .
From [27], we have
V ˙ ( z , z ¯ ) = V 20 z z ˙   +   V 11 z ˙ z ¯   +   V 11 z z ¯ ˙   +   V 02 z ¯ z ¯ ˙   +   ,
A τ ˜ V ( z , z ¯ ) = A τ ˜ V 20 z 2 2   +   A τ ˜ V 11 z z ¯   +   A τ ˜ V 02 z ¯ 2 2   +   ,
and
V ˙ ( z , z ¯ ) = A τ ˜ V   +   H ( z , z ¯ ) ,
where
H ( z , z ¯ ) = H 20 z 2 2   +   V 11 z z ¯   +   H 02 z ¯ 2 2   +     = X 0 W ( U t , 0 ) Ψ ( Φ , < X 0 W ( U t , 0 ) , f n > · f n ) .
Thus,
( 2 i ω n τ ˜ A τ ˜ ) V 20 = H 20 ,     A τ ˜ V 11 = H 11 ,     ( 2 i ω n τ ˜ A τ ˜ ) V 02 = H 02 ,
which means
V 20 = ( 2 i ω n τ ˜ A τ ˜ ) 1 H 20 ,     V 11 = A τ ˜ 1 H 11 ,     V 02 = ( 2 i ω n τ ˜ A τ ˜ ) 1 H 02 .
By (A17), when 1 θ < 0 ,
H ( z , z ¯ ) = Ψ ( 0 ) Φ ( 0 ) < W ( U t , 0 ) , f n > · f n = ( h ( θ )   +   h ( θ ) ¯ 2 , h ( θ ) h ( θ ) ¯ 2 i ) Ψ 1 ( 0 ) Ψ 2 ( 0 ) < W ( U t , 0 ) , f n > · f n = 1 2 [ h ( θ ) ( Ψ 1 ( 0 ) i Ψ 2 ( 0 ) )   +   h ( θ ) ¯ ( Ψ 1 ( 0 )   +   i Ψ 2 ( 0 ) ) ] < W ( U t , 0 ) , f n > · f n = 1 2 [ ( h ( θ ) g 20   +   h ( θ ) ¯ g ¯ 02 ) z 2 2   +   ( h ( θ ) g 11   +   h ( θ ) ¯ g ¯ 11 ) z z ¯   +   ( h ( θ ) g 02   +   h ( θ ) ¯ g ¯ 20 ) z ¯ 2 2 ]   +   .
Therefore by (A21),
H 20 ( θ ) = 0 , n = 1 , 2 , 3 , , 1 2 ( h ( θ ) g 20   +   h ( θ ) ¯ g ¯ 02 ) · f 0 , n = 0 ,
H 11 ( θ ) = 0 , n = 1 , 2 , 3 , , 1 2 ( h ( θ ) g 11   +   h ( θ ) ¯ g ¯ 11 ) · f 0 , n = 0 ,
H 02 ( θ ) = 0 , n = 1 , 2 , 3 , , 1 2 ( h ( θ ) g 02   +   h ( θ ) ¯ g ¯ 20 ) · f 0 , n = 0 ,
and
H ( z , z ¯ ) ( 0 ) = W ( U t , 0 ) Ψ ( Φ , < W ( U t , 0 ) , f n > ) · f n ,
where
H 20 ( 0 ) = τ ˜ 1 4 f m m   +   2 ξ f m n 0 cos 2 ( n x l ) , n = 1 , 2 , 3 , , τ ˜ 1 4 f m m   +   2 ξ f m n 0     1 2 ( h ( 0 ) g 20   +   h ( θ ) ¯ g ¯ 02 ) · f 0 , n = 0 .
H 11 ( 0 ) = τ ˜ 1 4 f m m   +   ( ξ ¯   +   ξ ) f m n 0 cos 2 ( n x l ) , n = 1 , 2 , 3 , , τ ˜ 1 4 f m m   +   ( ξ ¯   +   ξ ) f m n 0     1 2 ( h ( 0 ) g 11   +   h ( θ ) ¯ g ¯ 11 ) · f 0 , n = 0 .
With the definition of A τ ˜ and (A22), it follows that
d V 20 d θ = A τ ˜ V 20 = 2 i ω n τ ˜ V 20   +   1 2 ( h ( θ ) g 20   +   h ( θ ) ¯ g ¯ 02 ) · f n ,     θ ( 0 , 1 ] .
In other words,
V 20 ( θ ) = i 2 i ω n τ ˜ ( g 20 h ( θ )   +   g ¯ 02 3 h ( θ ) ¯ ) · f n   +   1 e 2 i ω n τ ˜ θ ,
where
E 1 = V 20 ( 0 ) , n = 1 , 2 , 3 , , V 20 ( 0 ) i 2 i ω n τ ˜ ( g 20 h ( θ )   +   g ¯ 02 3 h ( θ ) ¯ ) · f 0 , n = 0 .
Furthermore, by using the definition of A τ ˜ and combining it with (A22) again, we have
  ( g 20 h ( 0 )   +   g ¯ 02 3 p 2 ( 0 ) ) · f 0   +   2 i ω n τ ˜ E 1 A τ ˜ ( i 2 ω n τ ˜ ( g 20 h ( 0 )   +   g ¯ 02 3 p 2 ( 0 ) ) · f 0 )   A τ ˜ E 1 L τ ˜ ( i 2 ω n τ ˜ ( g 20 h ( 0 )   +   g ¯ 02 3 p 2 ( 0 ) ) · f n   +   E 1 e 2 i ω n τ ˜ θ )   = τ ˜ 1 4 f m m   +   2 ξ f m n 0 1 2 ( h ( 0 ) g 20   +   p 2 ( 0 ) g ¯ 02 ) · f 0 .
After simplification,
2 i ω n E 1 A τ ˜ E 1 L τ ˜ E 1 e 2 i ω n = τ ˜ 1 4 f m m   +   2 ξ f m n 0 cos 2 ( n x l ) ,     n = 0 , 1 , 2 , .
Therefore
E 1 = τ ˜ E 1 4 f m m   +   2 ξ f m n 0 cos 2 ( n x l ) ,
where
E = 2 i ω n τ ˜   +   d 1 n 2 l 2 a 11 a 12 b 21 e 2 i ω n τ ˜ 2 i ω n τ ˜   +   d 2 n 2 l 2 a 12 1 .
Likewise, by using (A23), it is found that
d V 11 d θ = i 2 ω n τ ˜ ( h ( θ ) g 11   +   h ( θ ) ¯ g ¯ 11 ) · f n ,     θ ( 0 , 1 ] .
Thus
V 11 ( θ ) = i 2 i ω n τ ˜ ( h ( θ ) g ¯ 11 h ( θ ) g 11 )   +   E 2 .
Following a similar approach of computing V 20 ( θ ) , we obtain
E 2 = τ ˜ E 1 4 f m m   +   ( ξ ¯   +   ξ ) f m n 0 cos 2 ( n x l ) ,
where
E = d 1 n 2 l 2 a 11 a 12 b 21 d 2 n 2 l 2 a 22 1 .
Up to this point, V 20 ( θ ) and V 11 ( θ ) have been fully expressed in terms of the parameters of system (3), and thus the coefficient g 21 is also determined.

References

  1. Dolinger, M.; Torres, J.; Vermeire, S. Crohn’s disease. Lancet 2024, 403, 1177–1191. [Google Scholar] [CrossRef]
  2. Qiu, P.; Ishimoto, T.; Fu, L.; Zhang, J.; Zhang, Z.; Liu, Y. The gut microbiota in inflammatory bowel disease. Front. Cell. Infect. Microbiol. 2022, 12, 733992. [Google Scholar] [CrossRef]
  3. Lichtner, S.; Schunck, K.; Frey, J.; Osti, J.; Dannheimer, S.; Schnur, S.; Lehr, C.M.; Schneider, M.; Hittinger, M. Proteomic profiling of macrophages: Effects of inflammatory activation and anti-inflammatory treatment with IBD therapeutics. Eur. J. Pharm. Biopharm. 2025, 216, 114869. [Google Scholar] [CrossRef]
  4. Shahir, A.; Yunus, N.; Musa, M. The genetics of pediatric inflammatory bowel disease: Towards precision medicine. Biocell 2025, 49, 149–160. [Google Scholar] [CrossRef]
  5. Wu, Y.; Gettler, K.; Kars, M.E.; Giri, M.; Li, D.; Bayrak, C.S.; Zhang, P.; Jain, A.; Maffucci, P.; Sabic, K.; et al. Identifying high-impact variants and genes in exomes of Ashkenazi Jewish inflammatory bowel disease patients. Nat. Commun. 2023, 14, 2256. [Google Scholar] [CrossRef] [PubMed]
  6. Del Sordo, R.; Lougaris, V.; Bassotti, G.; Armuzzi, A.; Villanacci, V. Therapeutic agents affecting the immune system and drug-induced inflammatory bowel disease (IBD): A review on etiological and pathogenetic aspects. Clin. Immunol. 2022, 234, 108916. [Google Scholar] [CrossRef]
  7. Wang, F.; Yang, R.Z.; Zhang, X. Turing patterns in a predator-prey model with double Allee effect. Math. Comput. Simul. 2024, 220, 170–191. [Google Scholar] [CrossRef]
  8. Zhu, F.Y.; Yang, R.Z. Bifurcation in a modified Leslie-Gower model with nonlocal competition and fear effect. Discret. Contin. Dyn. Syst.-B 2025, 30, 2865–2893. [Google Scholar] [CrossRef]
  9. Guxholli, D.; Shehu, V. Hopf Bifurcation as a Driver of Oscillatory Dynamics in Predator-Prey Systems with Holling Type II Response. J. Sci. Math. Lett. 2025, 13, 140–154. [Google Scholar] [CrossRef]
  10. Shao, Y.; Zhao, J. Analysis of Stability and Hopf Bifurcation of a Delayed Predator-prey System with Fear and Additional Food. Acta Math. Appl. Sin. Engl. Ser. 2025, 41, 1–38. [Google Scholar] [CrossRef]
  11. Cavani, M.; Farkas, M. Bifurcations in a predator-prey model with memory and diffusion. I: Andronov-Hopf bifurcation. Acta Math. Hung. 1994, 63, 213–229. [Google Scholar] [CrossRef]
  12. Nadin, G.; Ogier-Denis, E.; Toledo, A.I.; Zaag, H. A Turing mechanism in order to explain the patchy nature of Crohn’s disease. J. Math. Biol. 2021, 83, 12. [Google Scholar] [CrossRef]
  13. Shi, Y.; Luo, X.F.; Zhang, Y.X.; Sun, G.Q. An indicator of Crohn’s disease severity based on Turing patterns. Chaos Solitons Fractals 2023, 171, 113455. [Google Scholar] [CrossRef]
  14. Shi, Y.; Luo, X.F.; Zhang, Y.X.; Sun, G.Q. Effect of intestinal permeability and phagocytes diffusion rate on pattern structure of Crohn’s disease based on the Turing-Hopf bifurcation. Nonlinear Dyn. 2024, 112, 11419–11445. [Google Scholar] [CrossRef]
  15. Malka, R.; Rom-Kedar, V. Bacteria–phagocyte dynamics, axiomatic modelling and mass-action kinetics. Math. Biosci. Eng. 2011, 8, 475–502. [Google Scholar]
  16. Kayan, Ş.; Merdan, H.; Yafia, R.; Goktepe, S. Bifurcation analysis of a modified tumor-immune system interaction model involving time delay. Math. Model. Nat. Phenom. 2017, 12, 120–145. [Google Scholar] [CrossRef]
  17. Cherraf, A.; Li, M.; Moulai-Khatir, A.; Hamidaoui, M. Mathematical modeling of the tumor-immune system with time delay and diffusion. Axioms 2023, 12, 184. [Google Scholar] [CrossRef]
  18. Yang, Y.; Huang, G.; Dong, Y. Stability and Hopf bifurcation of an HIV infection model with two time delays. Math. Biosci. Eng. 2023, 20, 1938–1959. [Google Scholar] [CrossRef]
  19. Rihan, F.A.; Velmurugan, G. Dynamics of fractional-order delay differential model for tumor-immune system. Chaos Solitons Fractals 2020, 132, 109592. [Google Scholar] [CrossRef]
  20. Yu, Y.; Zhang, Z.; Yu, Y. Timing of phagosome maturation depends on their transport switching from actin to microtubule tracks. J. Phys. Chem. B 2023, 127, 9312–9322. [Google Scholar] [CrossRef]
  21. Sakurai, C.; Yamashita, N.; Azuma, K.; Hatsuzawa, K. VAMP5 promotes F receptor-mediated phagocytosis and regulates phagosome maturation in macrophages. Mol. Biol. Cell 2024, 35, Ar44. [Google Scholar] [CrossRef] [PubMed]
  22. Cao, J.; Mu, K.; Hao, P. Hopf bifurcation in a delayed reaction-diffusion-advection Nicholson’s blowfly model. Commun. Nonlinear Sci. Numer. Simul. 2025, 152, 109205. [Google Scholar] [CrossRef]
  23. Sans, E.; Akdemir, M.; Tiryakioglu, A.; Peker-Dobie, A.; Ozemir, C. Hopf bifurcation in a generalized Goodwin model with delay. Math. Comput. Simul. 2025, 237, 86–106. [Google Scholar] [CrossRef]
  24. Kuang, Y. Delay Differential Equations With Applications in Dynamics; Academic Press: New York, NY, USA, 1993; pp. 345–550. [Google Scholar]
  25. Hartman, P. Ordinary Differential Equations; Society for Industrial and Applied Mathematics: Philadelphia, PA, USA, 2002. [Google Scholar]
  26. Hale, J.K. Ordinary Differential Equations; Courier Corporation: North Chelmsford, MA, USA, 2009. [Google Scholar]
  27. Wu, J. Theory and Applications of Partial Functional Differential Equations; Springer Science & Business Media: New York, NY, USA, 2012. [Google Scholar]
  28. Hassard, B.D.; Kazarinoff, N.D.; Wan, Y.H. Theory and Applications of Hopf Bifurcation; Cambridge University Press Archive: Cambridge, UK, 1981. [Google Scholar]
  29. Caswell, H. Matrix Population Models: Construction, Analysis, and Interpretation; Sinauer Associates: Sunderland, MA, USA, 2001; p. 722. [Google Scholar]
Figure 1. Simulations of the system (3) for τ = 3.5 with initial values ( 9.57334 × 10 15 , 9.57334 × 10 14 ) . m are displayed on the left, while n are shown on the right.
Axioms 14 00861 g001
Figure 2. Simulations of the system (3) for τ = 4.2 with initial values ( 9.57334 × 10 15 , 9.57334 × 10 14 ) . m are displayed on the left, while n are shown on the right.
Axioms 14 00861 g002
Figure 3. The change in the average biomass of bacteria and phagocytes in space over time without considering the time delay. Bacteria are displayed on the left, while phagocytes are shown on the right. In these instances, the system gradually stabilizes at the equilibrium point E ( m 0 , n 0 ) .
Axioms 14 00861 g003
Figure 4. The average biomass of bacteria and phagocytes in space varies over time at τ = 3 , τ = 3.25 , and τ = 3.5 . Bacteria are displayed on the left, while phagocytes are shown on the right. In these instances, the system gradually stabilizes at the equilibrium point E ( m 0 , n 0 ) .
Axioms 14 00861 g004
Figure 5. The average biomass of bacteria and phagocytes in space changes over time at τ = 4.2 . Bacteria are displayed on the left, while phagocytes are shown on the right. In these instances, the system exhibits periodic oscillations.
Axioms 14 00861 g005
Figure 6. The effect of s on τ , with the lower-right part being the stable region.
Axioms 14 00861 g006
Figure 7. (Left): The variation in the average bacterial biomass over time for various values of a. (Right): The time it takes for the average biomass of bacteria to stabilize for different values of a.
Axioms 14 00861 g007
Figure 8. (Left): The variation in the average bacterial biomass over time for various values of v. (Right): The time it takes for the average biomass of bacteria to stabilize for different values of v.
Axioms 14 00861 g008
Figure 9. (Left): The variation in the average bacterial biomass over time for various values of p. (Right): The time it takes for the average biomass of bacteria to stabilize for different values of p.
Axioms 14 00861 g009
Table 1. Parameters for model (1), (2), and (3).
ParameterDefinitionValueSource
pRate of bacterial increase0.262 u/min[14]
KMaximum number of bacteria the gut can accommodate 10 17 u/min[12]
aMaximum engulfment rate by phagocytes0.3129 u/min[12]
ω Extent of phagocyte activity interference 1.232 × 10 7 u/min[15]
rBaseline half-saturation constant for engulfment 10 15 u/m3[12]
sIntestinal permeability coefficient0.0513 u/min[14]
cImmune response rate0.002 u/m3[14]
vPhagocyte death rate0.02 u/min[14]
d 1 Diffusion coefficient of bacteria0.01 m2/min[14]
d 2 Diffusion coefficient of phagocytes0.0293 m2/min[14]
Table 2. Sensitivity coefficients of the model (3)’s parameters with respect to the equilibrium point E ( m 0 , n 0 ) .
Parameter S I
p 5 . 59239 14 0.0153051
K 0.0000185492 0.00193759
a 2 . 79977 16 0.915091
ω 7.93193 × 10 15 1 . 10362 8
r 0.828544 −0.086547
v 4 . 3788 17 −0.914791
s 5 . 59239 13 −0.000299676
c 1.4345 × 10 15 −0.000165709
Disclaimer/Publisher’s Note: The statements, opinions and data contained in all publications are solely those of the individual author(s) and contributor(s) and not of MDPI and/or the editor(s). MDPI and/or the editor(s) disclaim responsibility for any injury to people or property resulting from any ideas, methods, instructions or products referred to in the content.