Article

Modulation Transfer between Microwave Beams: Asymptotic Evaluation of Integrals with Pole Singularities near a First-Order Saddle Point

by
Ilaria Cacciari
*,† and
Anedio Ranfagni
Istituto di Fisica Applicata “Nello Carrara”, Consiglio Nazionale delle Ricerche, Via Madonna del Piano 10, 50019 Sesto Fiorentino, Italy
*
Author to whom correspondence should be addressed.
These authors contributed equally to this work.
Axioms 2024, 13(3), 178; https://doi.org/10.3390/axioms13030178
Submission received: 11 January 2024 / Revised: 27 February 2024 / Accepted: 4 March 2024 / Published: 7 March 2024
(This article belongs to the Special Issue Stochastic Processes in Quantum Mechanics and Classical Physics)

Abstract

:
Experimental results of delay-time measurements in the transfer of modulation between microwave beams, as reported in previous articles, were interpreted on a competition (interference) between two waves, one of which is modulated and the other is a continuous wave (c.w.). The creation of one of these waves was attributed to a saddle-point contribution, while the other was attributed to pole singularities. In this paper, such an assumption is justified by a quantitative field-amplitude analysis in order to make the modeling plausible. In particular, two ways of calculating field amplitudes are considered. These lead to results that are quantitatively markedly different, although qualitatively similar.

1. Introduction

This paper has to be considered as a continuation of two previously published works, as Refs. [1,2].
In particular, in Ref. [1], a series of experimental results was reported in which the delay-time measurements exhibited a modulation transfer from a modulated beam to an unmodulated c.w., both of which were obtained from the same microwave source. This anomalous phenomenon was interpreted calling into use a stochastic process of classically forbidden nature, supported by a photon–photon scattering mechanism. The hypothesis presented in Ref. [1] was demonstrated to be plausible by taking into account a relativistic approach, which led the way to a virtual mass of the photon large enough to support the hypothesized model [2]. The reader could delve deeper into the arguments in favor of the relativistic approach in Ref. [3] and in other references containing related topics [4,5,6,7,8].
The stochastic-process modeling was invoked by exploiting the equivalence of the telegrapher’s Equation [9] with a zig-zag motion of the particle, as already described by Kac [10]. His solution has since been reexamined, generalized and applied to various problems [11,12,13,14,15,16], and in particular, De Witt-Morette and Foong devoted part of their works to this equivalence, demonstrating that a possible solution of the telegrapher’s equation can be expressed making use of a quadrature in which a density distribution g ( r , t ) of a randomized time r enters (t being the true time) [17,18,19,20].
The inversion of the roles of r and t proposed in an innovative way in Ref. [1] has allowed us to consider r as an observable and measurable quantity, in line with what usually happens in classically prohibited phenomena. Still according to Ref. [1], we confirm that the observed temporal behavior turns out to be decidedly subluminal.
The analysis of the transfer of modulation was further studied in Ref. [2], reporting new measurements of the delay time, exploring the angular dependence in the orientation of the c.w. beam source. These new experimental results allowed us to develop a more accurate interpretation compared to what was preliminarily shown in [1]. This new analysis was considered more accurate since it takes into account the presence of pole singularities in field amplitude evaluated according to the saddle-point method. The model proposed in [1], consisting, as mentioned above, of a photon–photon scattering mechanism as concomitant with a classically forbidden stochastic process, was confirmed.
The present work aims to go beyond the qualitative analysis presented in Ref. [2], obtaining quantitative assessments of the field amplitudes due to the polar singularities and the saddle point, respectively.
As will be demonstrated in the following sections, two approaches, based on different grounds that are hence nominally different, and that will be considered, do not lead to identical results. Thus, a question arises about what procedure has to be preferred. As will be discussed in the following sections, this question does not find a definitive answer; although, a slight preference will be declared. However, the discrepancy is not so important, since the obtained results are qualitatively similar being, in both cases, dependent on the same quantities.
Furthermore, the adoption of both models is fully justified, even in consideration of the authoritativeness of the relative sources, Refs. [21,22]. As will be shown, in both cases, we obtain, for plausible values of the parameters, reliable numerical results, capable of interpreting the experimental data available.
The present work, in addition to the previous ones [1,2], supplies a comprehensive and plausible interpretation of the modulation transfer experimentally observed in the microwave domain.
Firstly, in Section 2, we summarize the results of delay time, as occurring in the modulation transfer, reported in Ref. [2]. Subsequent Section 3 will be devoted to field evaluations, while Section 4 will be devoted to interpreting the experimental results. The closing remarks will be given in Section 5. The analytical details will be presented in the Appendix A.

2. Summary of the Experimental Results

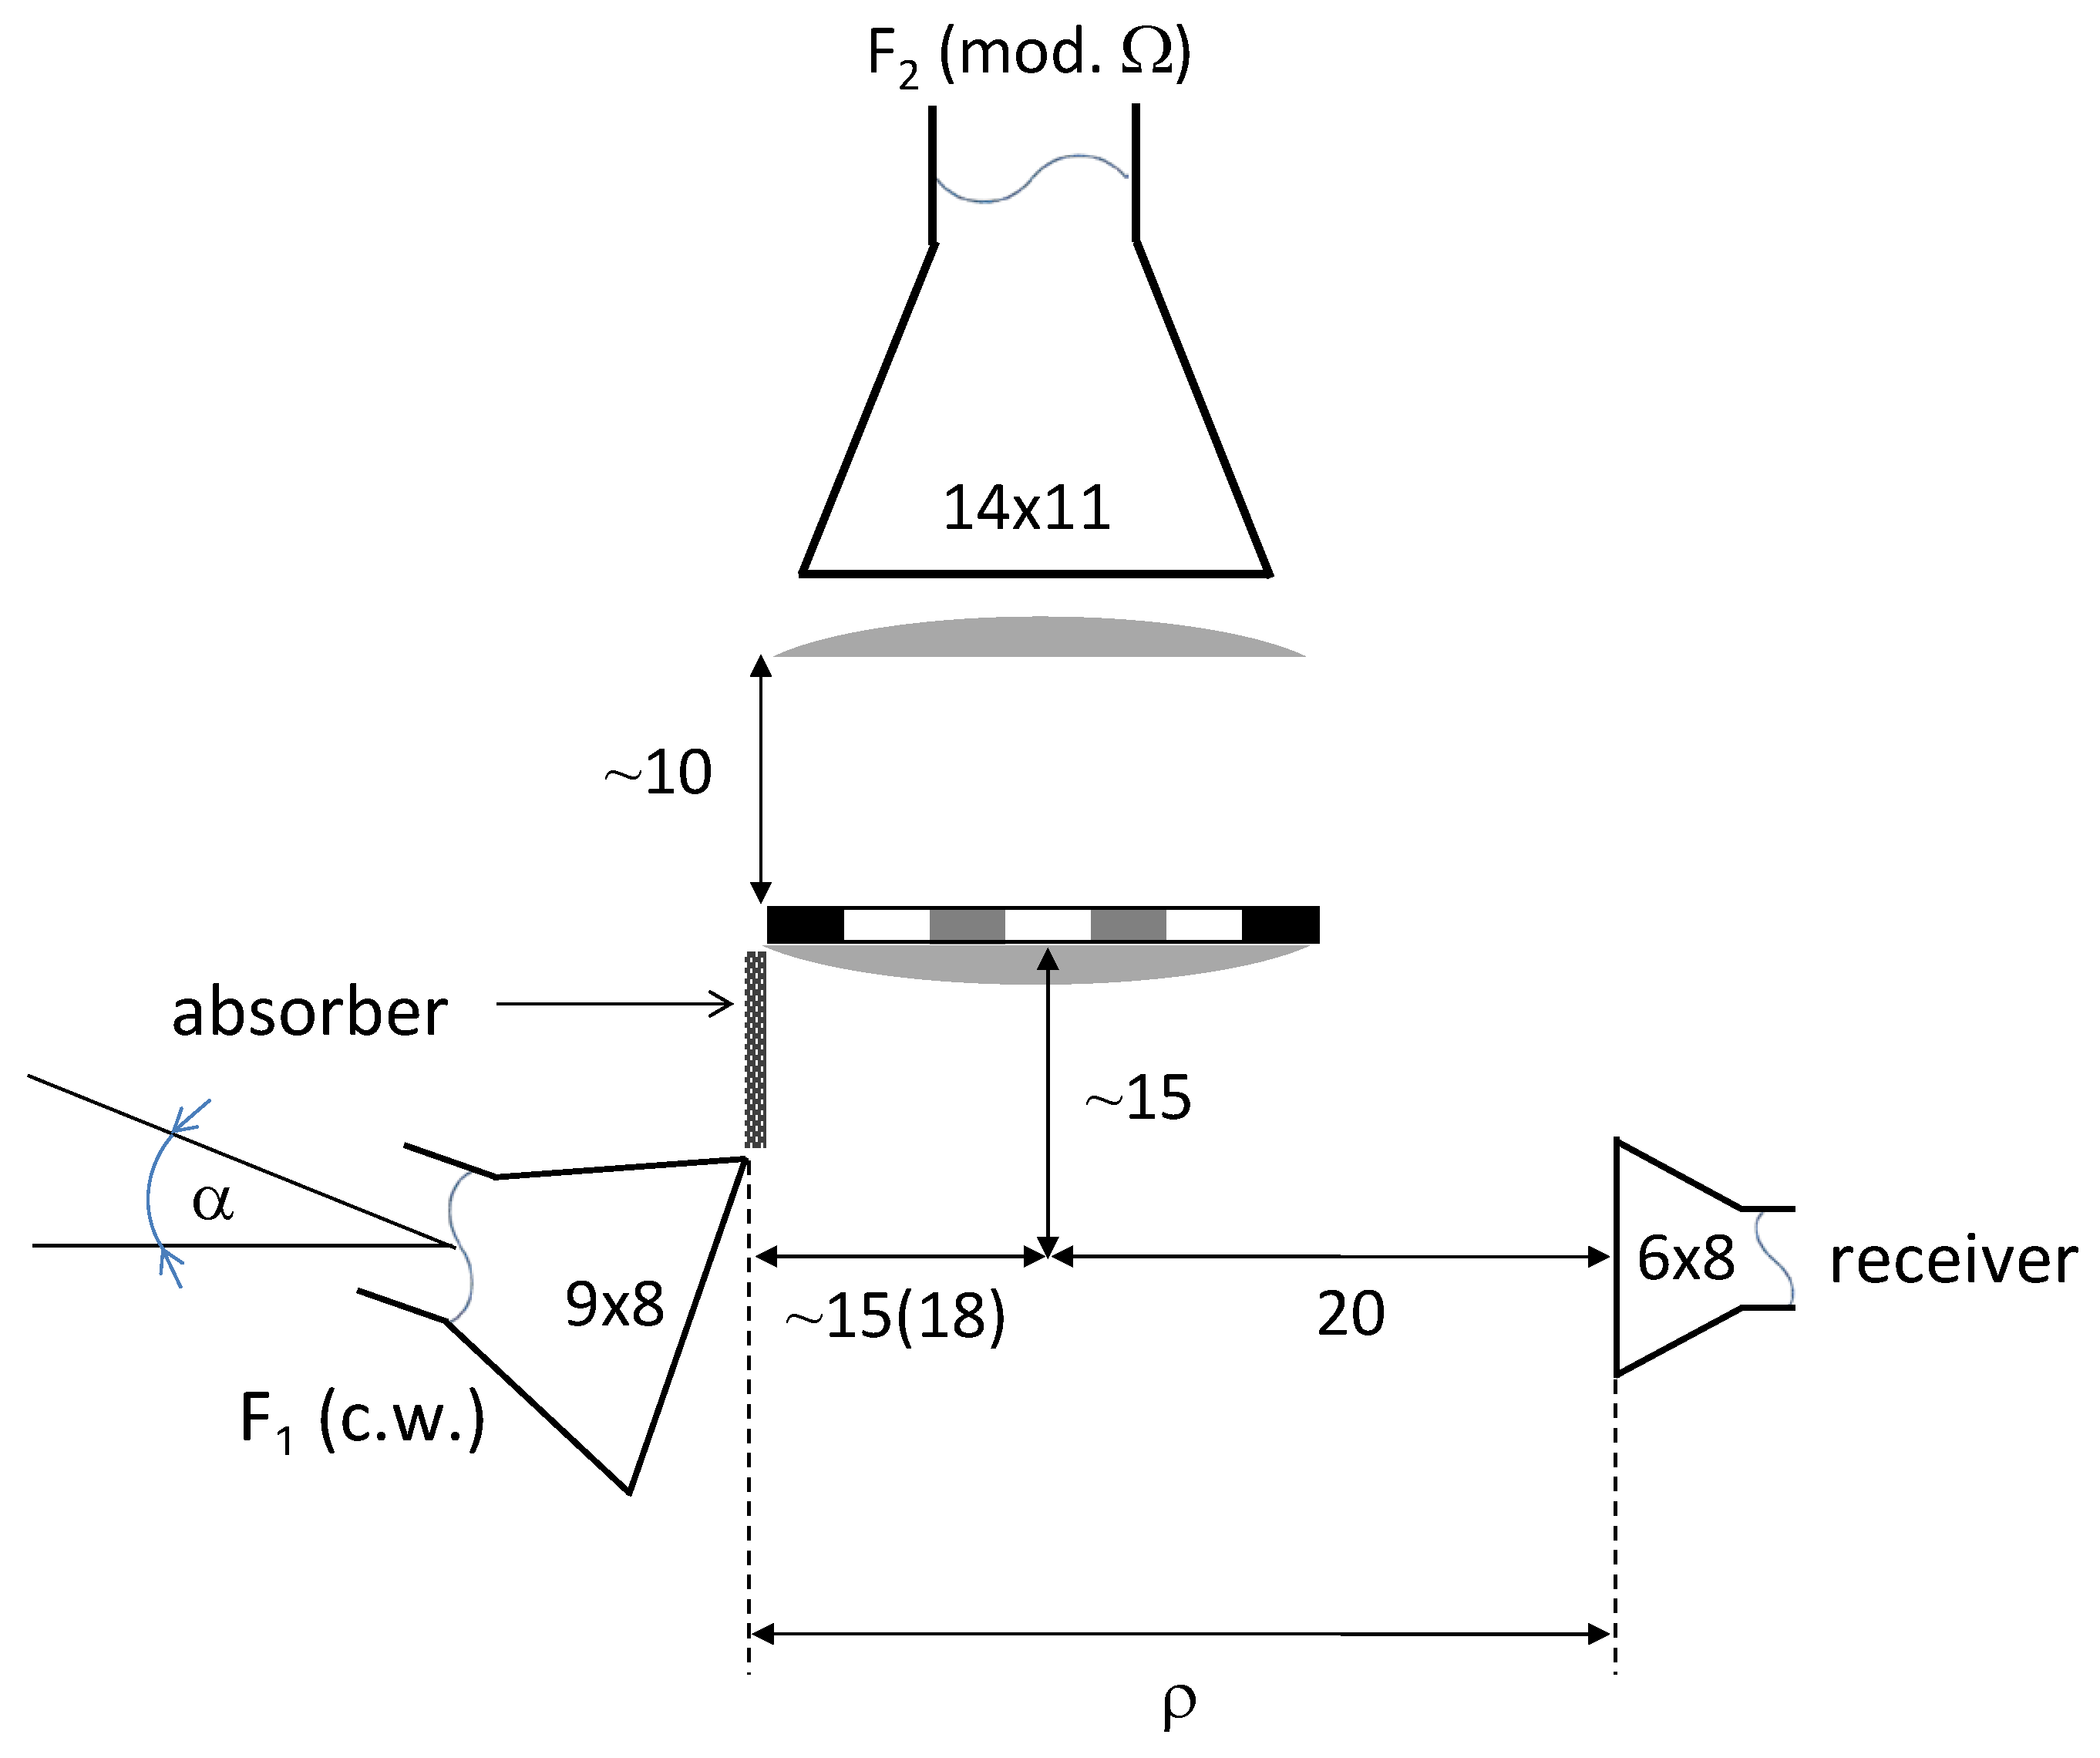
The results can be summarized as follows. According to the experimental setup depicted schematically in Figure 1, the same as adopted in Refs. [1,2], when the orientation angle α of the F 1 (c.w.) beam launcher is equal to zero, a rather regular oscillating behavior with a spatial periodicity of about 8 cm was observed in measuring the delay time vs. the distance ρ , as sketched in Figure 2 in Ref. [2].
The experimental results provided in Ref. [2] were analyzed by calling into use a model grounded on the competition (interference) of two waves propagating along two directions forming an angle δ between them. In [2], we also arrived at the conclusion that a spatial period Δ ρ 8 cm corresponds to an angle δ 34 ° : see Table 1 in Ref. [2].
In addition to the above results, delay-time measurements were made for the cases in which the tilting angle α was about ± 20 ° : see Figures 3 and 4 in [2].
A less regular behavior resulted from the data obtained in these cases. However, the resulting spatial periodicity is certainly increased up to Δ ρ 15 20 cm, which can be attributed to values of δ 25 ° 20 ° , still according to Table 1 in [2].

Technical Details

Microwaves emitted by a generator at 9.3 GHz are divided in two beams: F 1 in c.w. and F 2 modulated. What we call “transfer of modulation” between the two beams is that the unmodulated F 1 beam turns out to be partially modulated, as revealed by the signal detected after the receiver horn. This fact cannot be merely attributed to spurious effects [25].
The X-band microwave setup operated in a T E 10 mode, hence with vertical polarization. The F 2 beam was modulated by a square wave sent to a pin modulator, whose rise and fall time of about 10 ns is suitable to measure delay times down to less than 1 ns.
The signals were taken, one before the F 2 horn, the other after the receiver horn, and sent to a high-temporal resolution oscilloscope capable of measuring the delay time with an accuracy of a few tens of picoseconds.
The pulse modulation frequency of ∼800 Hz and the finite value of the rise and fall time appreciably modify the spectrum of the emission [26]. However, for our purpose, it can be considered as nearly monochromatic.

3. Field Amplitude Evaluation

The problem we face now is the evaluation of the field amplitude in order to overcome the qualitative interpretation of the experimental results reported above and to offer a plausible quantitative one.
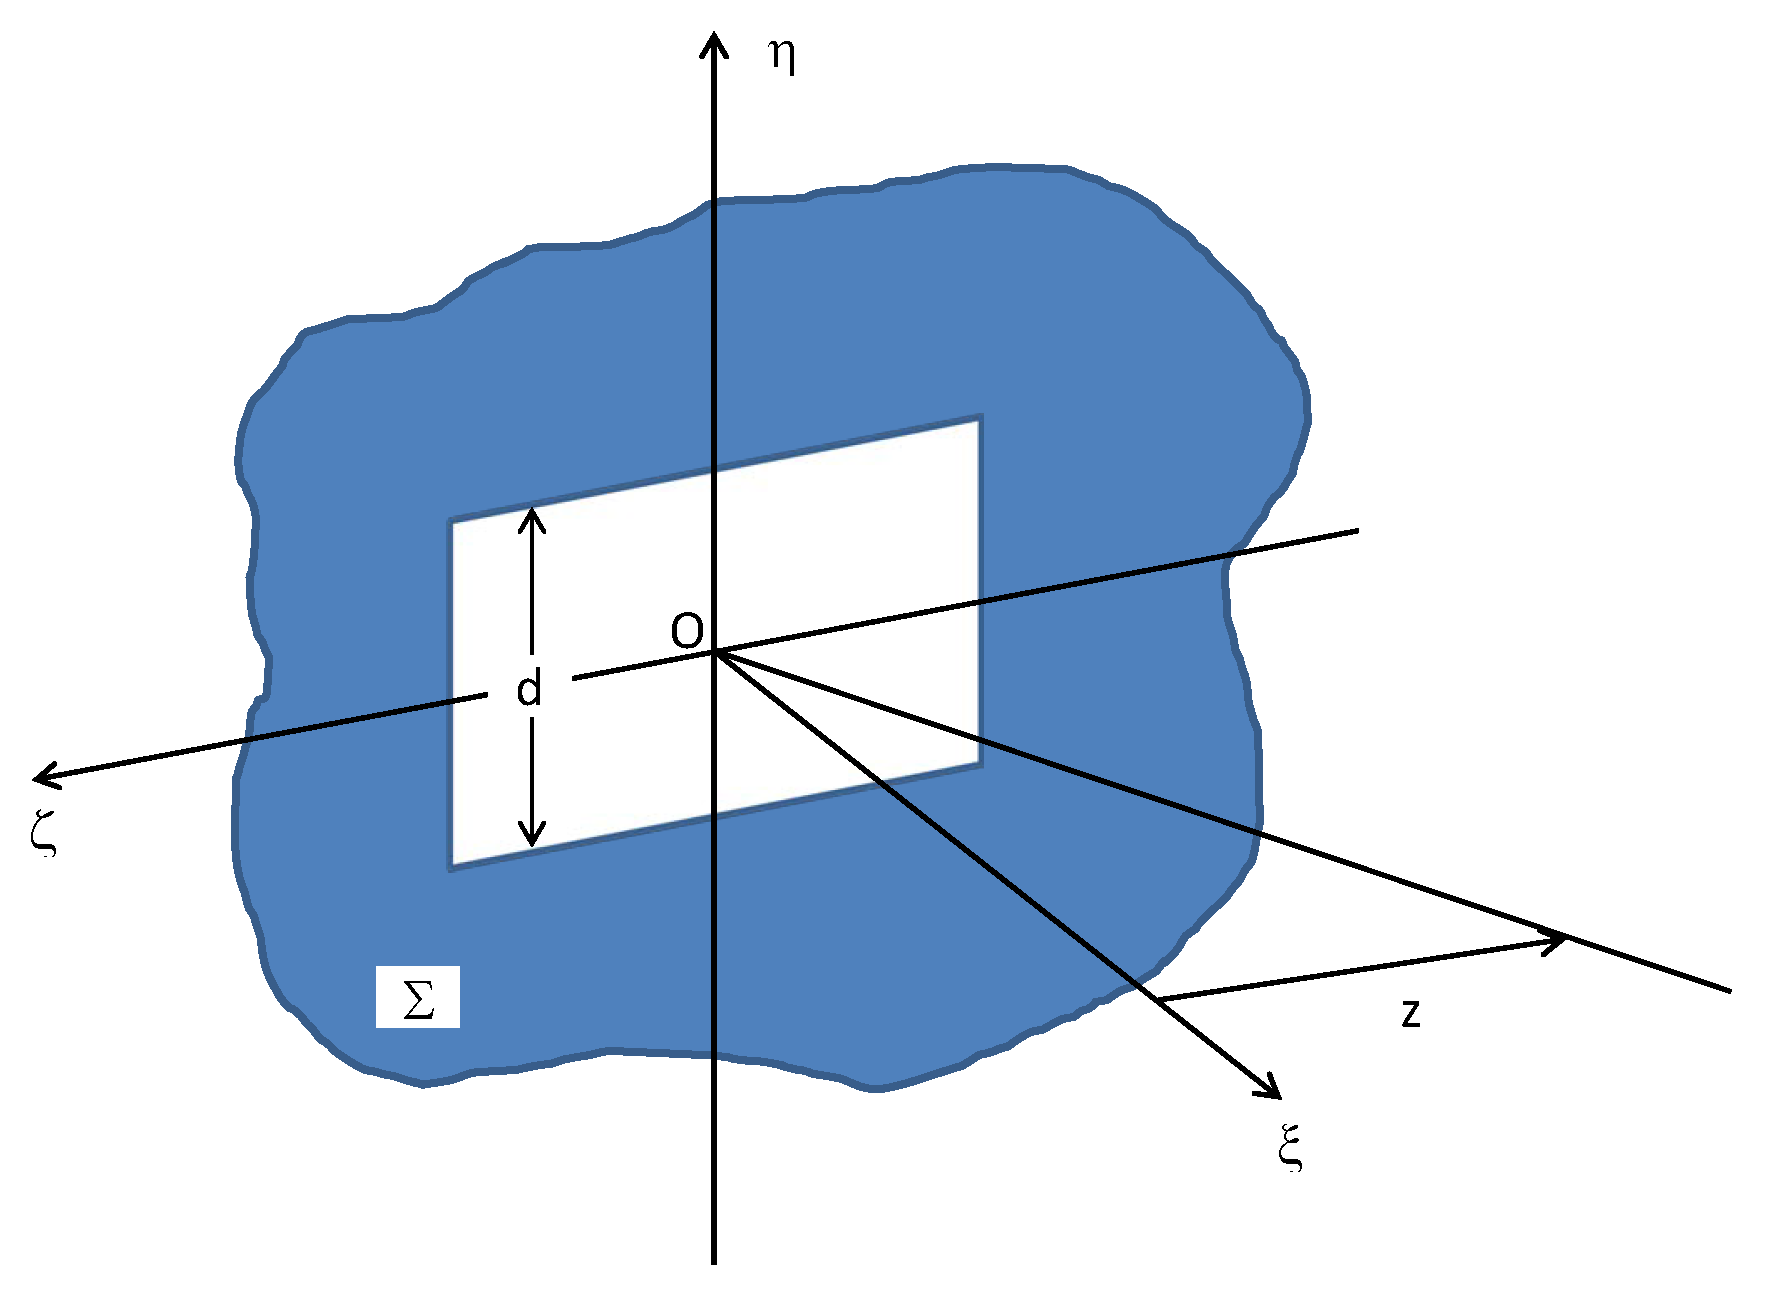
It was assumed that the radiated field emitted by the F 1 launcher could be expressed as that of a rectangular aperture, having the dimensions of the mouth of the horn launcher [27,28], see Figure 2.
Let us also assume that the aperture dimensions are very large with respect to the wavelength λ even along η ( d λ ). Under these assumptions, the field amplitude in the semi-space ξ > 0 can be expressed as [2,29]
C A ( z ) exp i k ρ cos ( z α ) d z ,
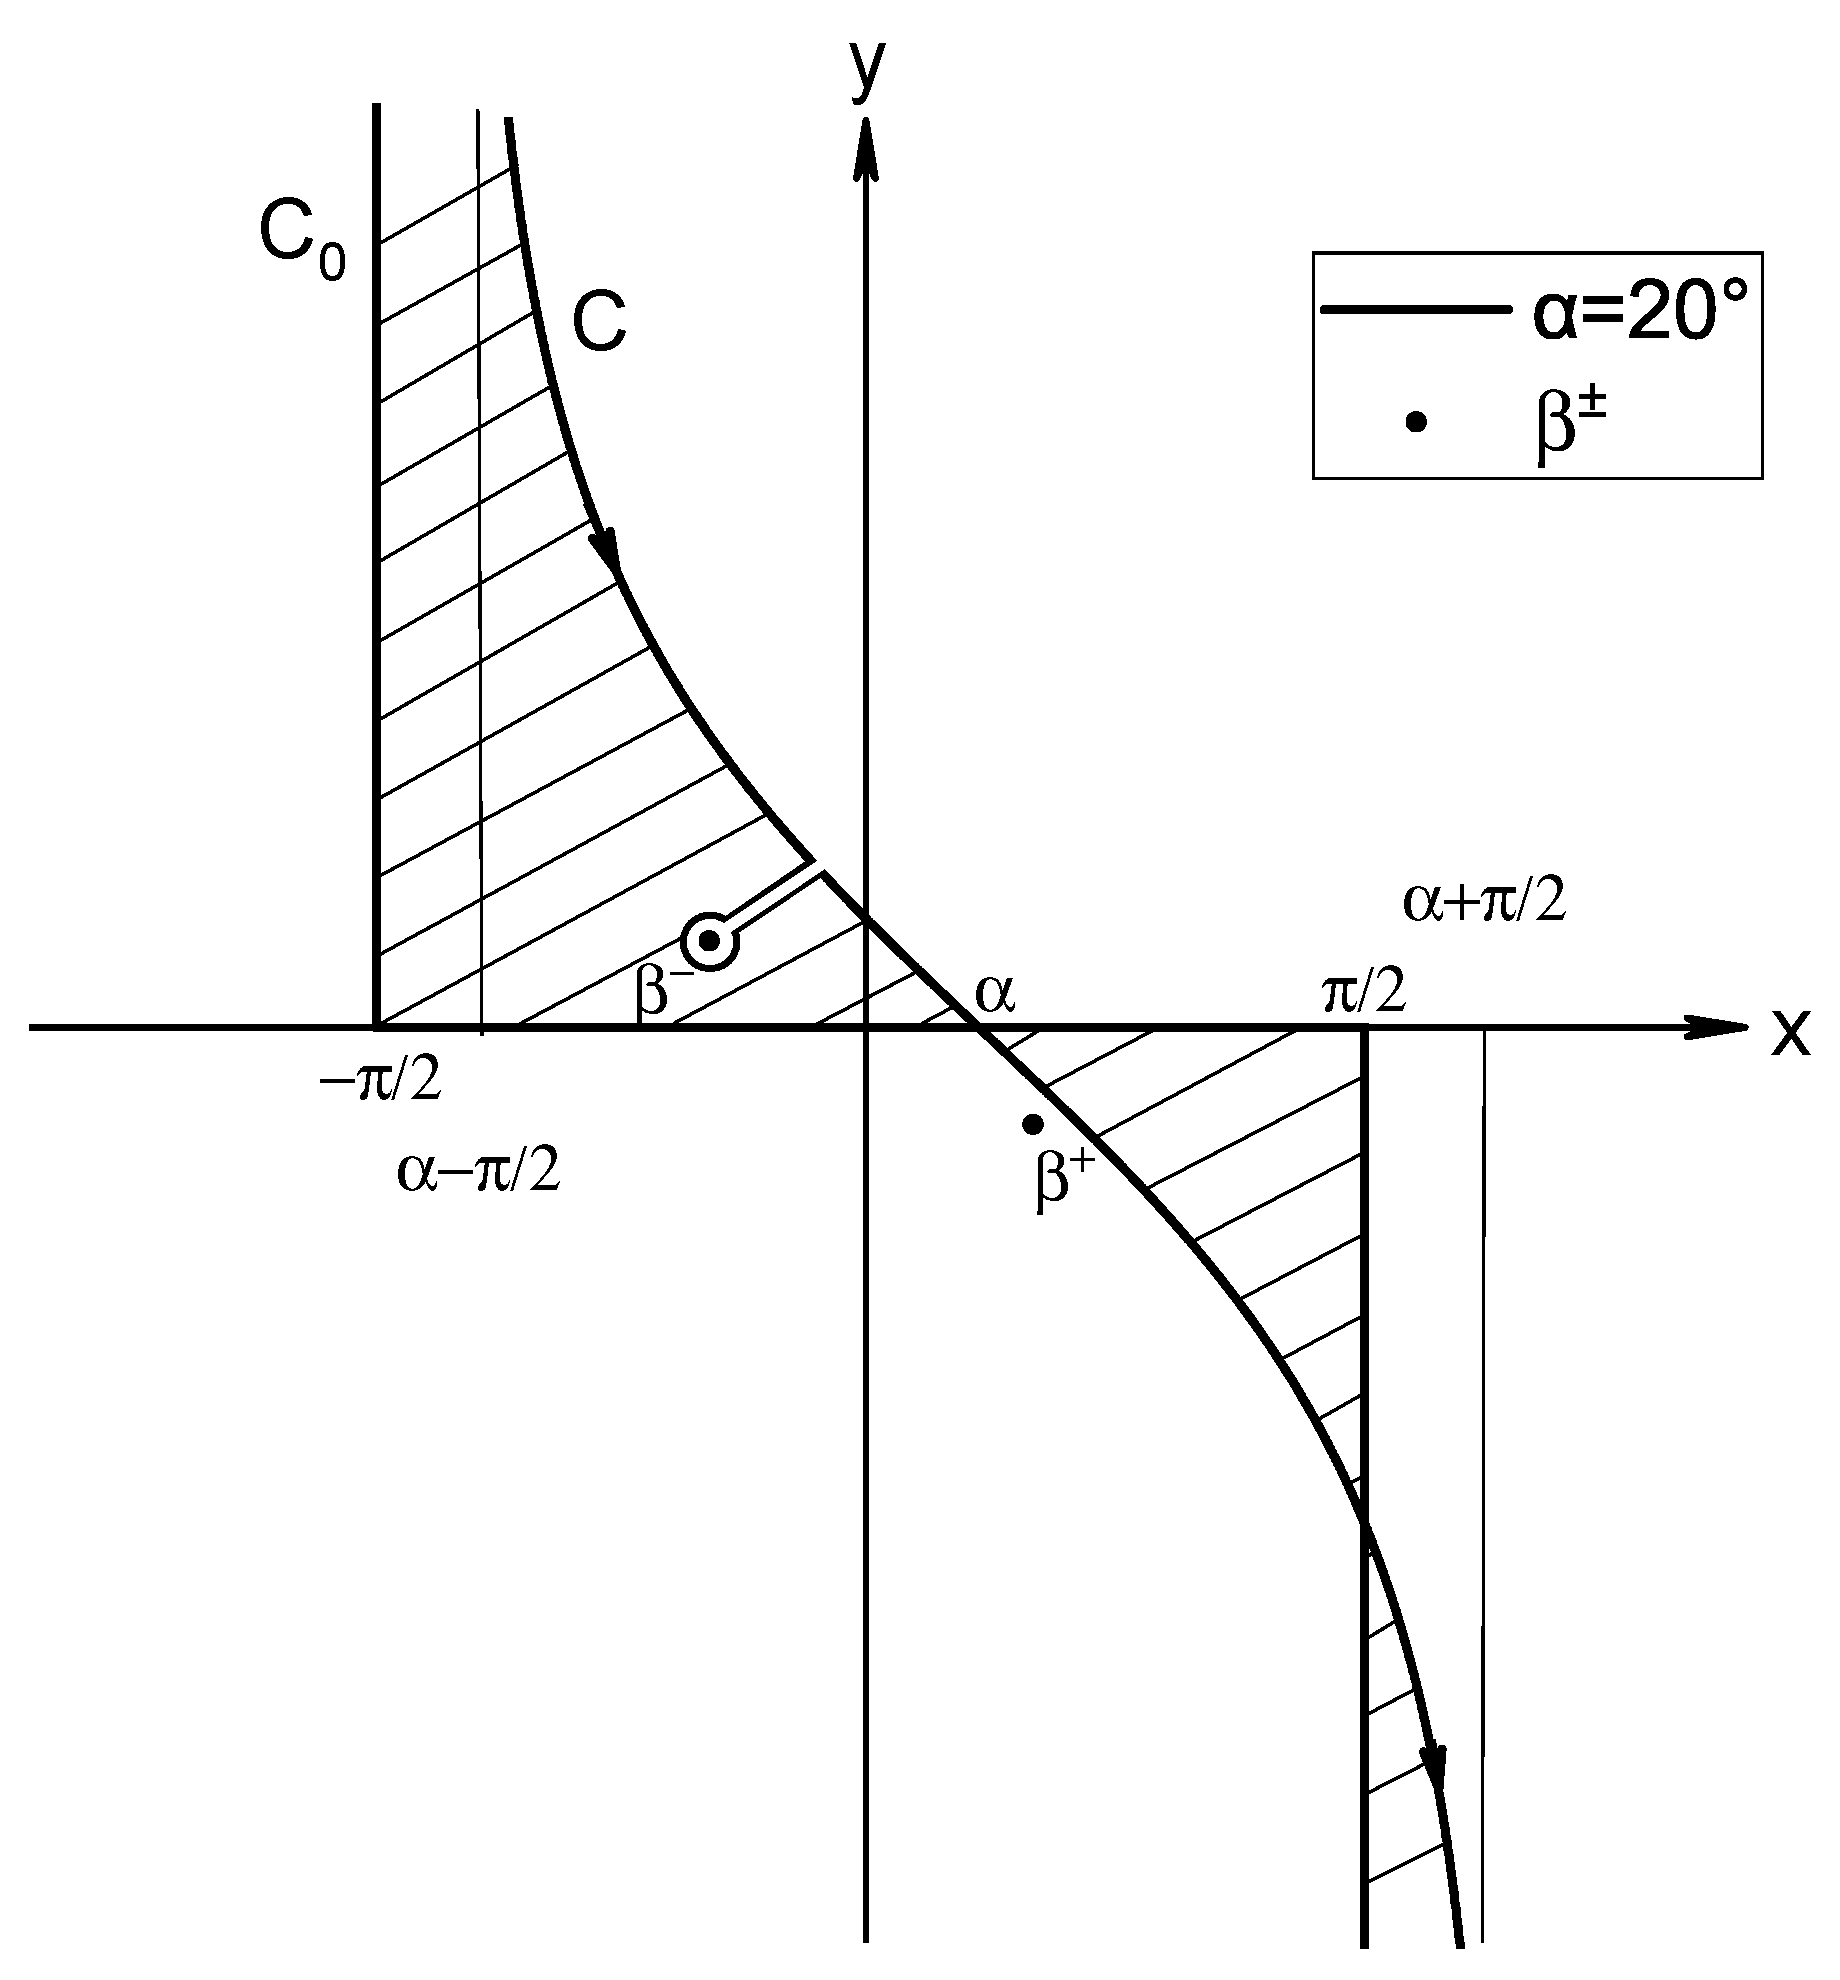
where the limits of integration of the z angle are extended to the complex plane through z = x + i y , A ( z ) is the amplitude of the elementary wave, k = 2 π / λ is the wave number, and ρ and α are the polar coordinates of the observation point in the ς , ξ plane. The original integration path C 0 is deformed into the steepest-descent path C in order to perform an asymptotic evaluation [30], for ρ λ , of the field amplitude according to the saddle-point approximation. The integration path is given by one branch of the equation cos ( x α ) cosh y = 1 , which crosses the real axis at x = α , which is the position of the saddle point, with an angle equal to π / 4 , as sketched in Figure 3.
In deforming the integration path, we have to consider the pole contribution if there are singularities at complex angles β ± = ± ( β r i β i ) situated in the region of the path deformation.
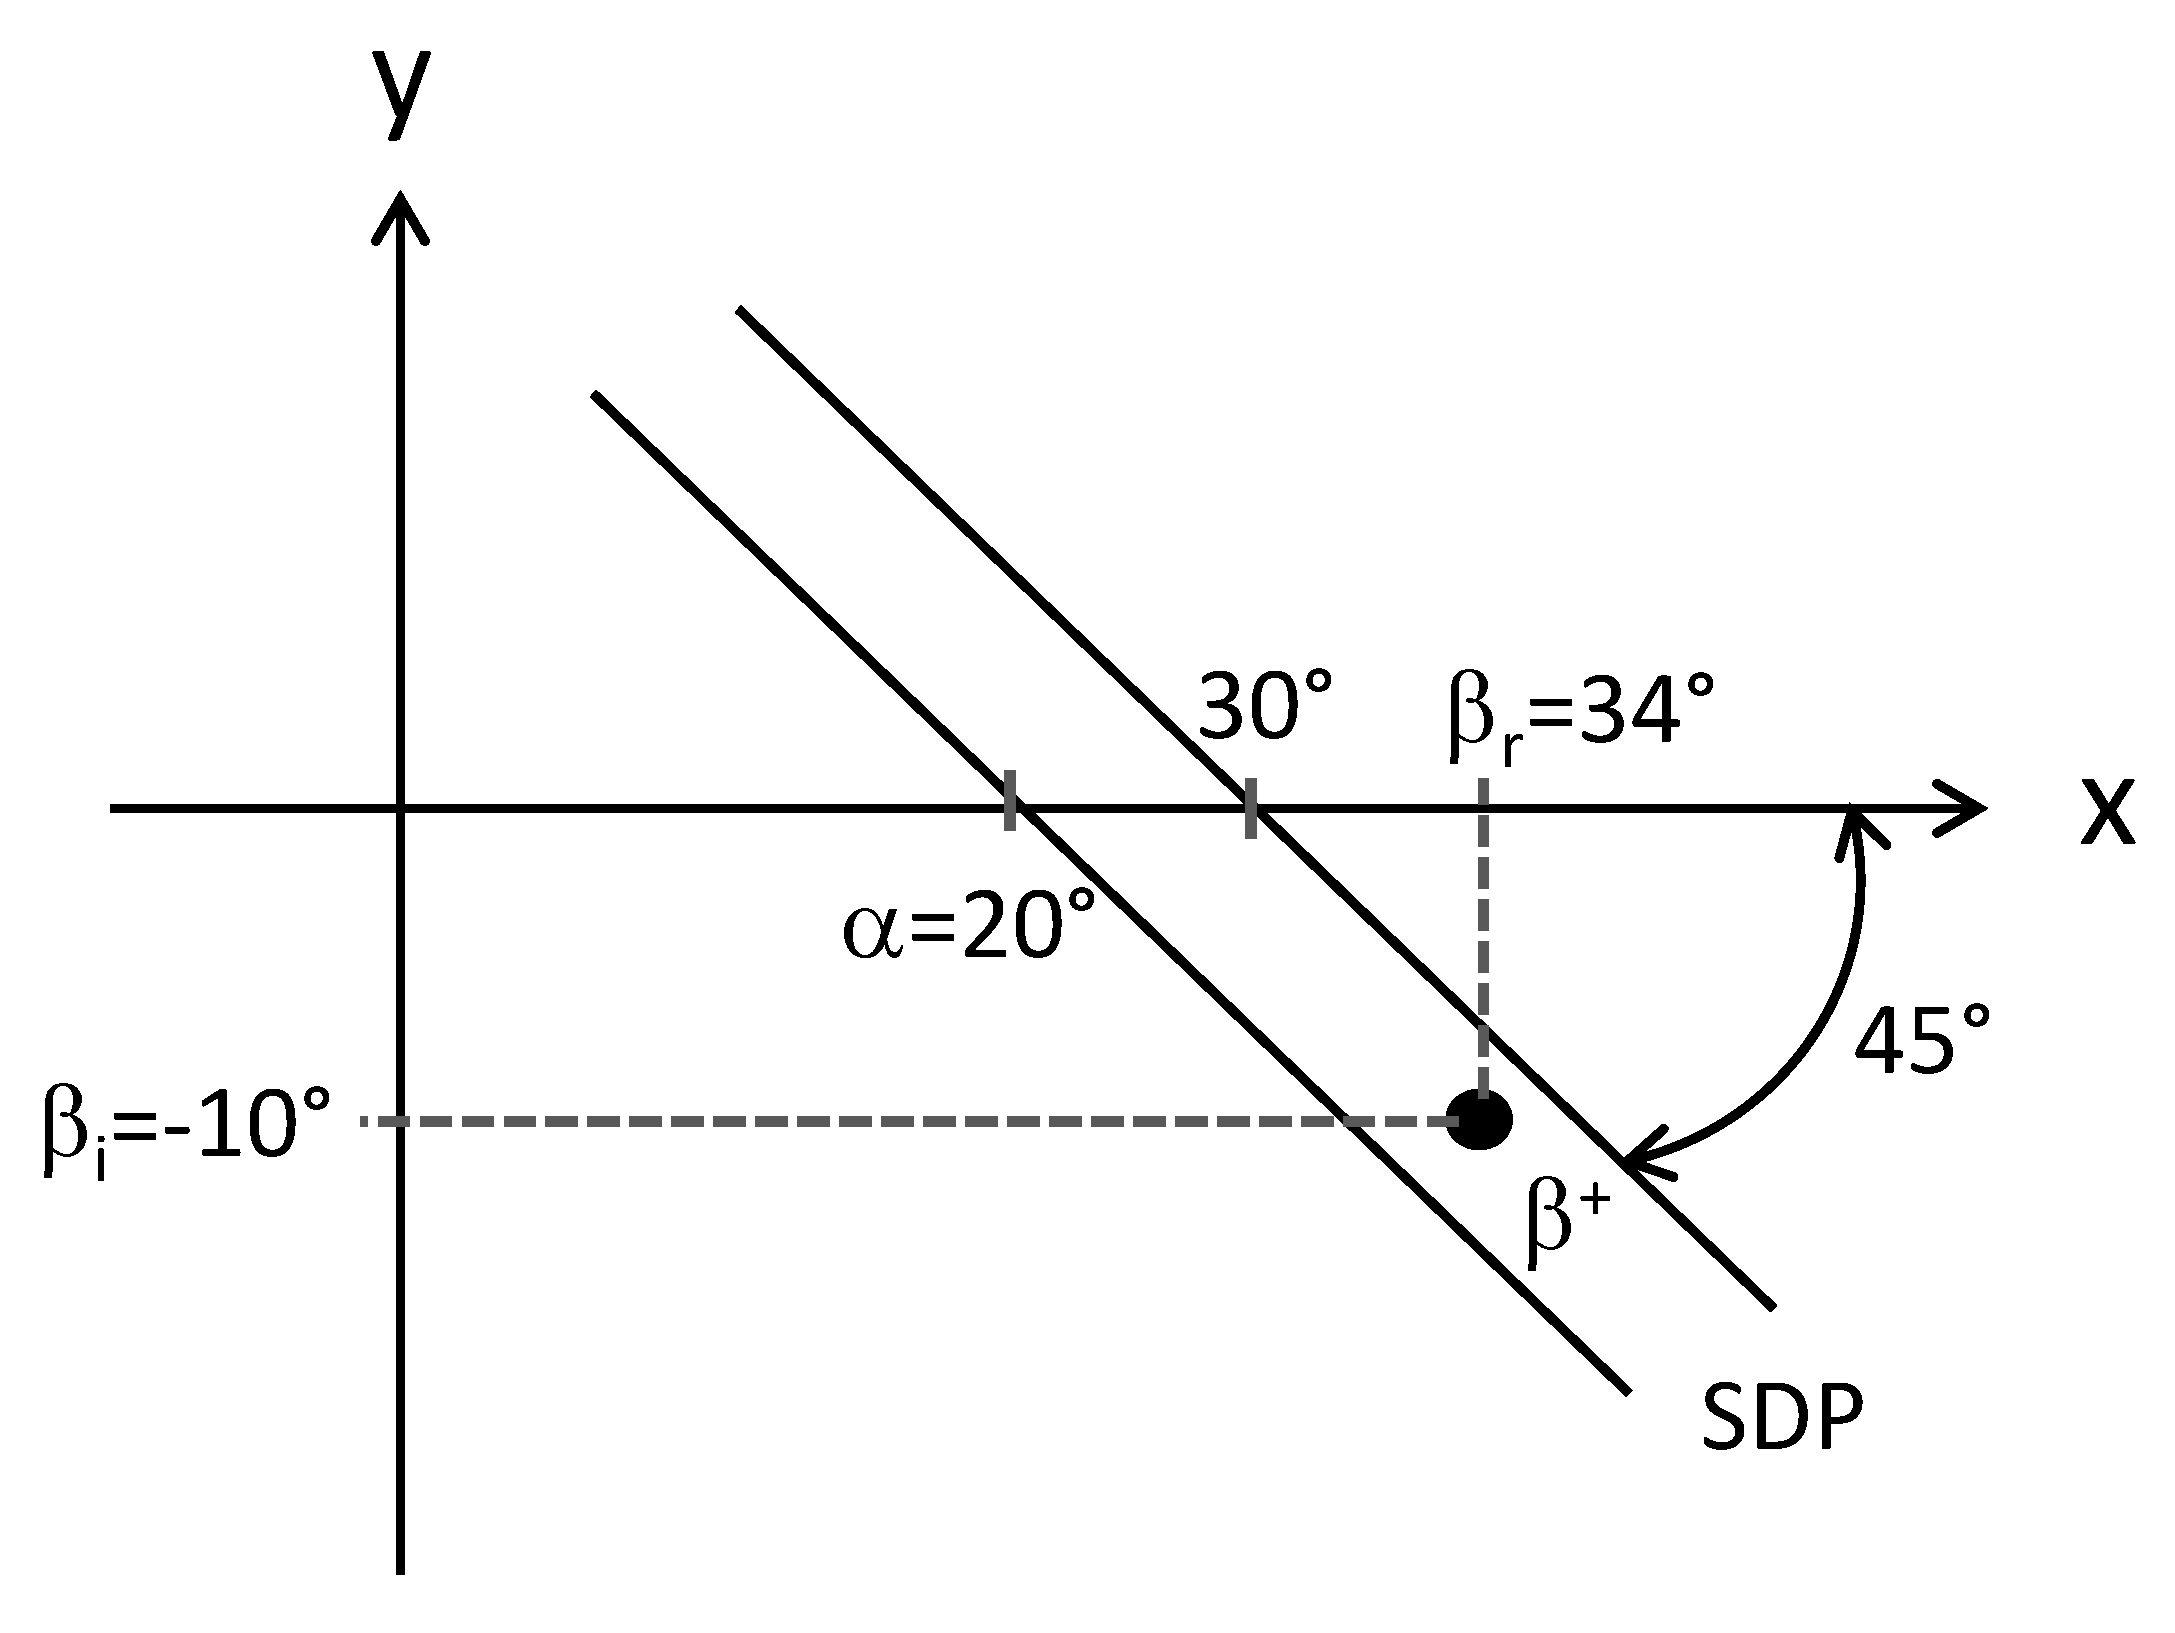
The values assumed by α determine whether the deformed path can capture one or both poles. In the example of Figure 3 with β r 30 ° and β i 10 ° , for α = 20 ° , only the pole at β is captured; analogously, for α = 20 ° , only the pole at β + should be captured; whereas for α = 0 ° , both poles at β ± would result in being captured.
In the case in which one pole is captured, the integral (1) turns out to be expressed, for k ρ 1 , as [29]
A ( α ) λ ρ 1 / 2 exp i k ρ π / 4 + 2 π i res A ( z β ) exp i k ρ cos β α .
Equation (2) is composed of two terms, the first is due to the saddle-point contribution and represents a cylindrical wave due to this unidimensional model; the second one, due to the pole, represents a complex wave. Denoting res A ( z β ) = A ¯ ( β ) , the contribution of the pole, by developing cos ( β α ) , becomes
2 π i A ¯ ( β ) exp i k ρ cos β r α cosh β i + k ρ sin β r α sinh β i ,
which represents a wave propagating in the β r direction and attenuating with α and ρ . The values assumed by these two quantities determine if the contribution of the pole could become or not dominant in Equation (2).
The case of a pole not captured but located near the steepest-descent path represents a very interesting situation because the contribution is not vanished. The details about this case are presented in the next sub-section.

3.1. Pole Singularities near the Steepest-Descent Path

There are two ways for evaluating this situation [21,22]: in both cases, the contribution due to the pole turns out to be the same, while it is different when considering the saddle point.
The solution of the field amplitude, apart from the saddle-point contribution, can be expressed as [21,22]
I ( Ω ) e i Ω ± 2 i π e Ω b 2 Q ± i b Ω ,
where Ω = k ρ , b = { i 1 cos ( β α ) } 1 / 2 = 2 e i π / 4 sin β α 2 , Im b 0 , and Q ( y ) = 0 e x 2 d x is the complementary error-function times π / 2 . By substituting, we have that e i Ω e Ω b 2 = exp i k ρ cos β α .
Moreover, by evaluating the discontinuity in the Q-function (that is when the pole crosses the integration path, in going from being captured to not being captured) as [22] Q ( i b Ω ) + Q ( i b Ω ) = π , Equation (4) becomes
I ( Ω ) 2 π i exp i k ρ cos β α ,
which exactly reproduces the contribution of the captured pole, for unitary amplitude, in Equation (2).
More generally, the evaluation of the function Q in Equation (4) will give a suitable fraction of the result. In fact, according to Ref. [22], for the evaluation of I ( Ω ) , we can adopt a different procedure by considering the function product
e Ω b 2 Q ( ± i b Ω ) = e Ω b 2 π 2 1 Erf ( i b Ω
which is tabulated for real and complex values of b Ω [31] and shown in Figure 4.4.3 of [22]. By substituting, the term in parenthesis of Equation (4) becomes ± i π F ( ξ ) with
F ( ξ ) = e 2 i ξ 2 1 Erf ( 1 i ) ξ e i π / 4 2 π ξ , for ξ = Ω sin β α 2 1 .
However, in this case, a problem arises for recovering the exponential attenuation vs. ρ and α , as presented in Equation (3), see below.

3.2. Saddle-Point Contribution

As anticipated in the Introduction, there are different approaches for the evaluation of the saddle-point contribution to the field amplitude.
If we follow the procedure in Ref. [21], which holds for pole singularity near the saddle point, but is not coincident with it, we find that such a contribution is given by
e i ( Ω π / 4 ) 2 π / Ω ,
which, for Ω = 2 π ρ / λ , exactly reproduces, for unitary amplitude, the first term in Equation (2). The analytical details are given in the Appendix A.
Following a different approach, as given in Ref. [22], the result obtained is as follows (see Appendix A for an explanation of this discrepancy)
e i ( Ω π / 4 ) π / Ω T ( 0 ) ,
where in our case, T ( 0 ) , according to Ref. [22], can be rewritten as
T ( 0 ) = 2 α β + 1 2 sin β α 2 .
This form results to be the difference of two quantities (one in α β , the other in β α ) that, for small values of α β , tend to be nearly equal and opposite. More exactly, by developing sin ( β α ) / 2 up to the second term, we obtain T ( 0 ) 2 24 ( β α ) , which vanishes for β = α , that is, when the pole position is coincident with the saddle points.

4. Interpretation of the Experimental Results

The plausibility of the model, in order to interpret the experimental results recalled in Section 2, is mainly based on the field-amplitude evaluation of both contributions: one relative to the saddle point and the other to pole singularity. Since the model is based on competition (interference) between them, the model requirement is that both amplitudes have to be, at least, roughly comparable.
For this aim, we perform some preliminary evaluation of field amplitudes, by means of the relations (2)–(9) in the previous section, for the initial-value position of the detector, ρ = 15 cm, see Figures 2–4 in Ref. [2].
According to Equations (2) and (8), the saddle contribution in absolute value is simply given, for unitary amplitude, by λ / ρ = 0.447 , with λ 3 cm.
The absolute value of a single pole singularity, if captured, still for a unitary amplitude, is given by the second exponential function in Equation (3), namely as
B 1 / 2 = e x p Ω sin ( β r α ) sinh β i ,
(to be multiplied by 2 π ) which for β r ( δ ) = 34 ° , α = 0 ° , β i = 10 ° , Ω = 2 π ρ / λ = 31.42 turns out to be 0.046 , which becomes 2 π B 1 / 2 = 0.291 .
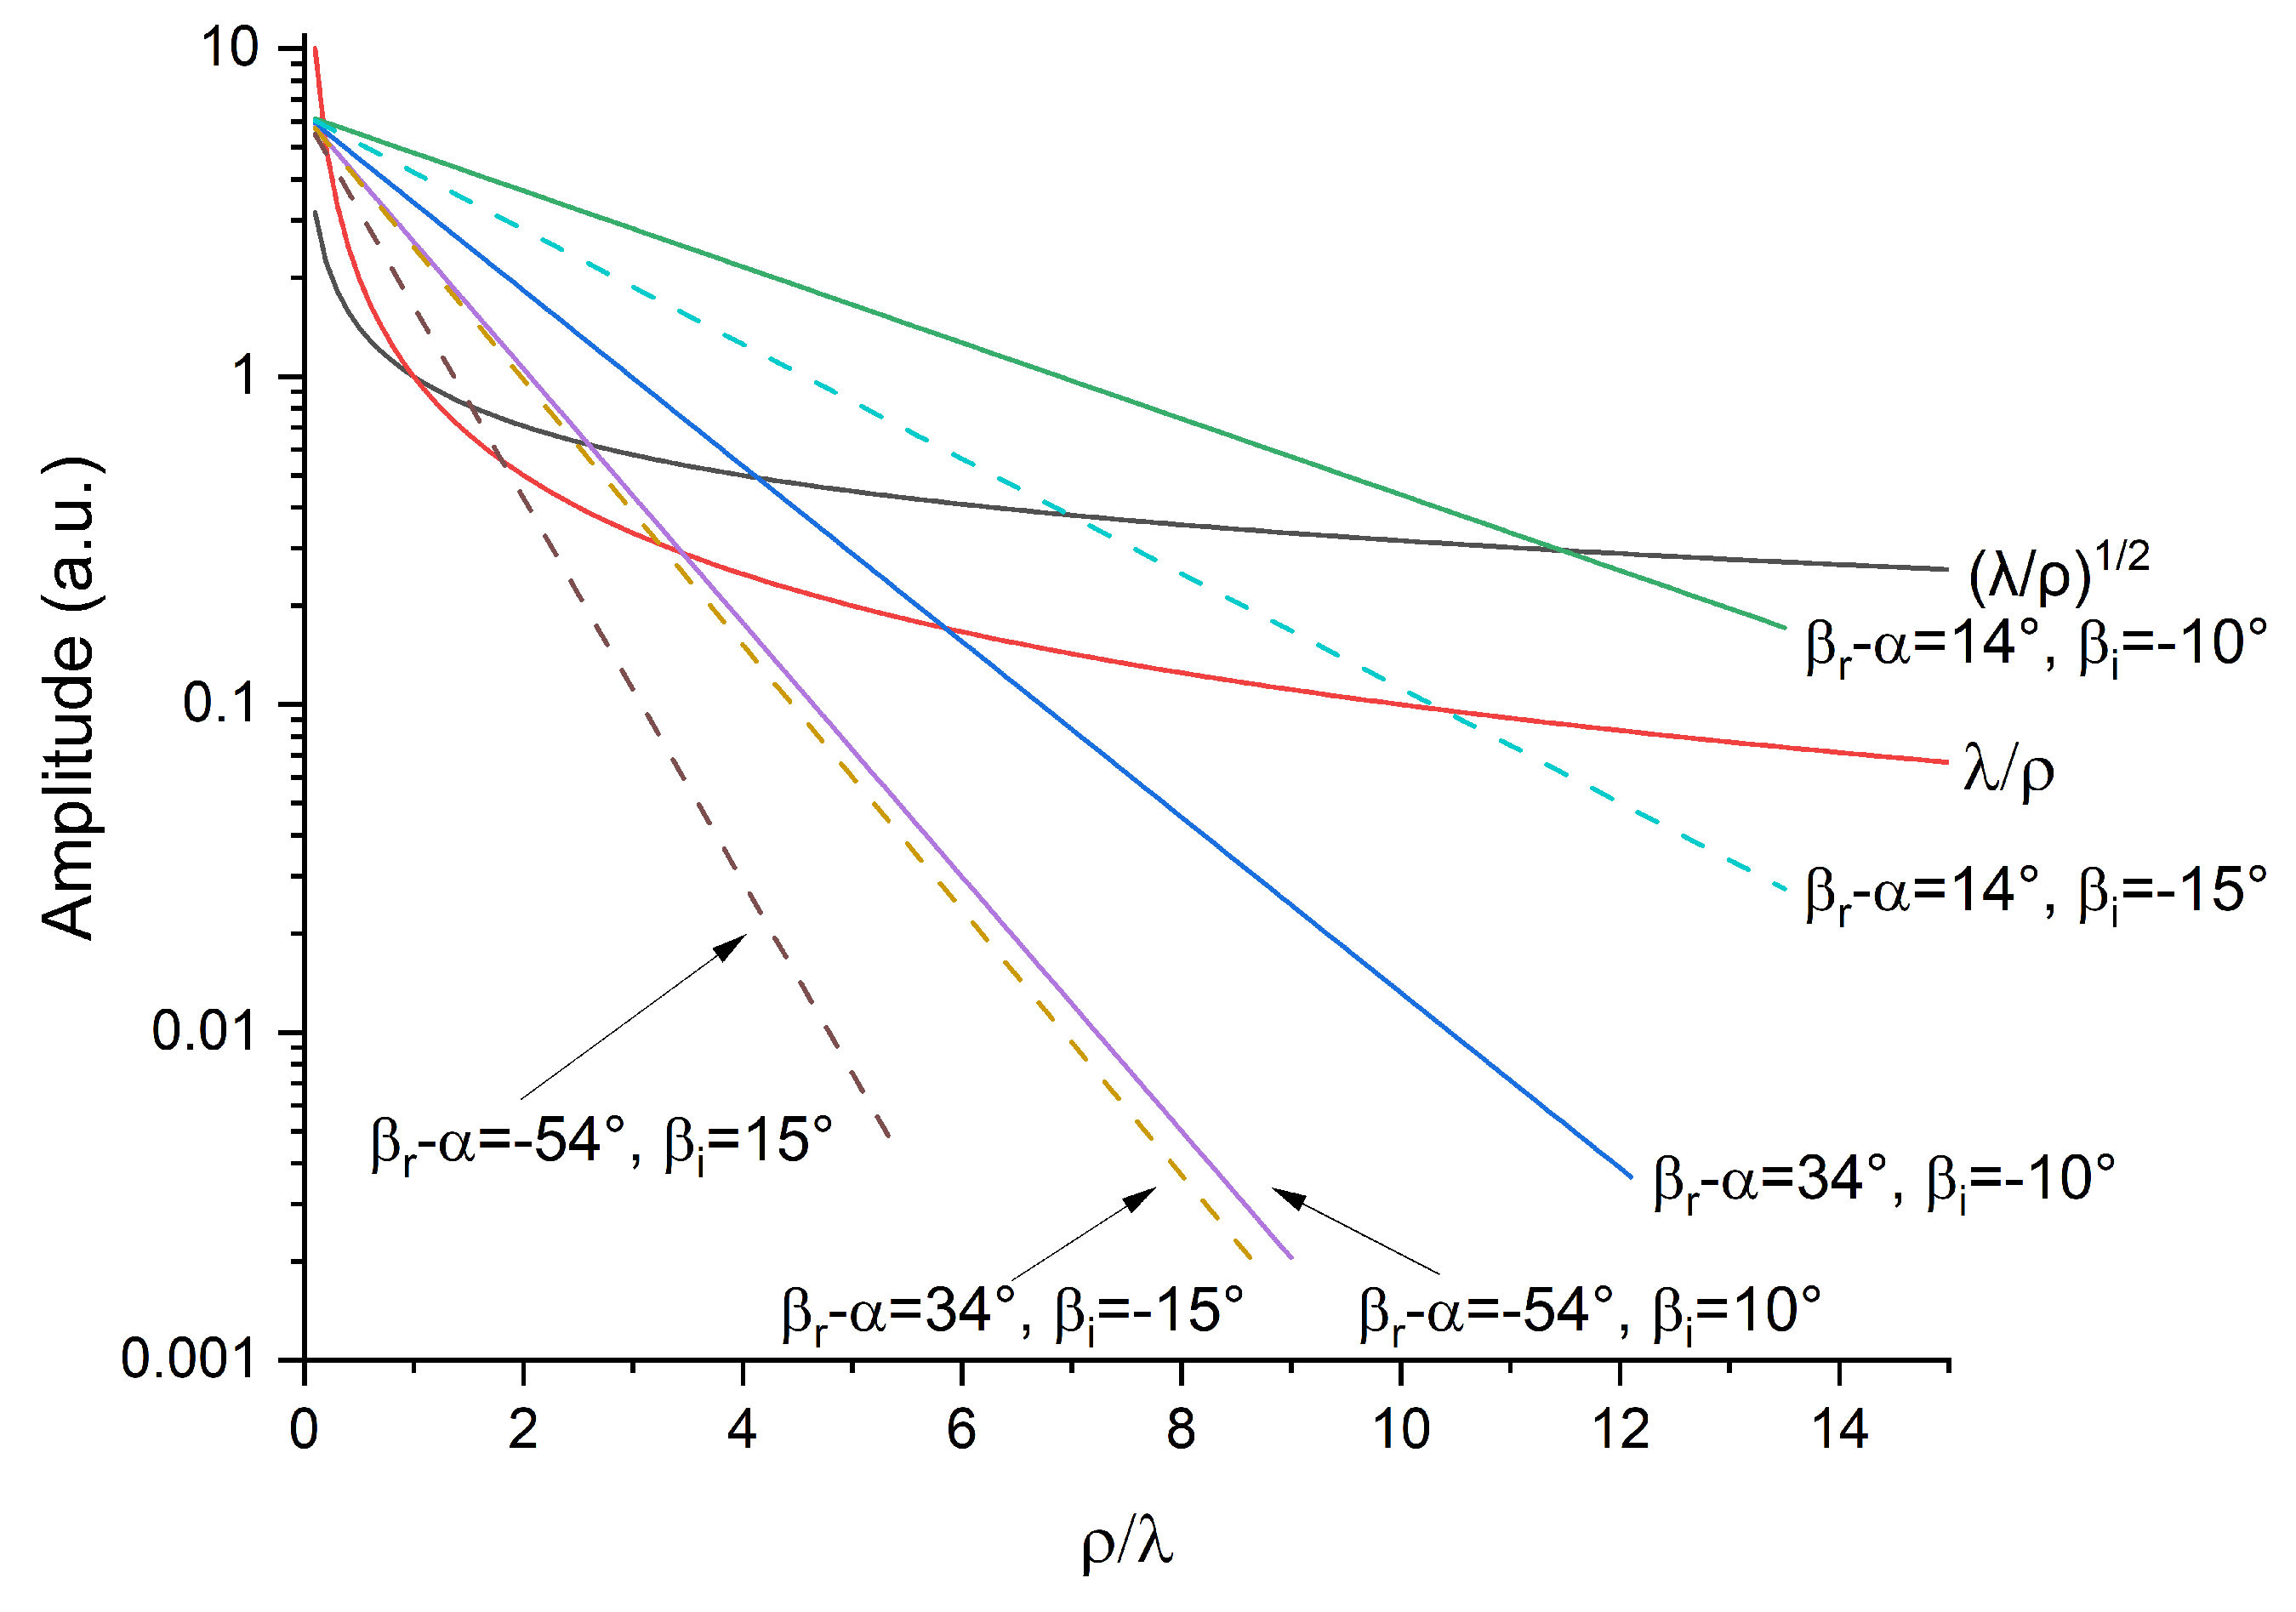
If both poles are captured, this contribution is doubled ( 0.582 ) , resulting very comparable, even greater than the above saddle-point contribution ( 0.447 ) . The complete behavior when ρ is increased is shown in Figure 4.
On the contrary, if the saddle-point contribution is evaluated by Equation (10), we find that, for β β r = 34 ° ( = 0.593 ) and α = 0 ° , T ( 0 ) 2 24 ( β α ) = 0.0349 , which, multiplied by π / Ω = 0.316 , turns out to be π Ω T ( 0 ) = 0.011 , a value decidedly not comparable with the captured-pole contribution ( 0.291 ) .
However, if the pole contribution is evaluated by Equation (7), for ξ = 1.64 , F ( ξ ) 0.243 , and the pole contribution, in absolute value, becomes π F ( ξ ) = 0.764 . This latter value is surely overestimated, due to the absence of the exponential attenuation of Equation (11). If this effect is taken into account [32], as a result, we obtain
π F ( ξ ) B 1 / 2 0.764 × 0.046 = 0.035 ,
a value that is of the same order of magnitude as the last saddle-point contribution ( 0.011 ) .
Therefore, we have obtained that the amplitude evaluations following two different approaches, in Refs. [21,22], although leading to different numerical results, have similar characteristics. In both cases, the contribution due to the saddle point is characterized by the quantity π / Ω , as presented in Equations (8) and (9), while the pole contribution is governed by the exponential dependence of Equation (11), once included in the relative evaluation, according to Equation (7), which leads to Equation (12).
As for the dependence on the distance ρ , we evaluate the saddle point and the pole contributions by means of Equation (8) and Equation (11), once multiplied by 2 π , which for unity amplitude reproduce the two terms of Equation (2).
In Figure 4, we show the obtained amplitudes vs. ρ / λ for several values of the quantities β r , β i and α , under the assumption that one pole is captured.
For comparison, we report also the amplitude relative to the saddle point, namely λ / ρ , for a cylindrical wave, and λ / ρ which corresponds to a spherical wave as resulting in the case of a bidimensional model [33].
The straight line for β r = 34 ° , β i = 10 ° , and α = 0 ° is the case in which two poles are captured (the other symmetrical one is at β r = 34 ° , and β i = 10 ° ) represents one-half of a total, appreciable contribution.
The straight line for β r α = 14 ° , β i = 10 ° , hence α = 20 ° , represents the case as if the β + pole would be captured, while in Figure 3, it is not, but the relative contribution remains important, see below.
The straight line for β r α = 54 ° and β i = + 10 ° , still for α = 20 ° , represents the contribution of the captured pole β and the resulting amplitude is almost negligible.
The same cases, evaluated for an augmented β i up to 15 ° , naturally show an evident more pronounced attenuation. Therefore, it seems that the cases for β i = 10 ° appear as those more suitable to interpret the experimental results.

Pole Contribution in Passing from Captured to Uncaptured Position

According to what was presented after Equations (4) and (5), we have to evaluate the function Q in order to determine how the result of Equation (5) is modified in passing from the captured to uncaptured pole. For doing this, it is sufficient to evaluate the error-function complement θ ± .
In the case of β r = 34 ° , β i = 10 ° , α = 0 ° , we obtain the results reported in Table 1, where ± i b Ω = ± ( x + i y ) , and θ ± = 1 Erf ± ( x + i y ) for some values of ρ comprised between 15 and 55 cm. We have that θ + is practically zero, while θ is nearly constant and equal to two. These values of θ , times π / 2 , confirm the result of Equation (5), and they represent the captured pole situation.
In passing to a situation of β r = 34 ° , β i = 10 ° , α = 20 ° , the results are reported in Table 2. They are very similar to the previous ones, hence the pole is still captured, as evidenced even in Figure 5.
By increasing α up to 30 ° , we obtain the results reported in Table 3 where | θ | is lowered to ∼0.36 for ρ = 15 cm. This value, once multiplied by π / 2 and substituted in Equation (4), gives the result I ( Ω ) 0.36 π i exp i k ρ cos ( β α ) . Smaller values are obtained by increasing ρ . These values represent the situation of a pole not captured as depicted schematically in Figure 5.
The values of θ + represent a situation of a captured pole β + when Im b changes sign in crossing the SDP, thanks to the discontinuity of the error-function in Equation (4), see Figure 4.4.1 in Ref. [22].
As for the contribution of the conjugated pole β , which in this case is indeed captured, we have that the angular distance results of β r α = 34 ° 30 ° = 64 ° . Hence, according to Equation (4), its contribution turns out to be completely negligible.

5. Concluding Remarks

We can therefore draw a conclusion that the interpretation of the modulation transfer, based on the competition of two waves, one due to the saddle point and the other to the pole singularity, is supported by both the theoretical models based on the analysis of Refs. [21,22].
Although the two approaches supply different numerical results, they are substantially similar since the contribution due to the saddle point is, in both cases, characterized by the quantity π / Ω , while the one relative to the pole is characterized by B 1 / 2 , Equation (11).
However, in the case of Ref. [22], this occurs when the quantity B 1 / 2 is introduced in the evaluation of the pole contribution as in Equation (12); otherwise, the relative result would be decidedly overestimated. This fact oriented us to favor the approach of Ref. [21], as it is capable of providing reliable results in a simpler way.
In the light of these considerations, the discrepancy between the two approaches (seemingly due to different formulations of the problem) is not too serious since the results are almost similar being, in both cases, dependent on the same quantities (see Appendix A).
We emphasize that this result is raised provided that, in both models, the exponential attenuation of the signal vs. the distance ( B 1 / 2 quantity) has to be present.
From the reported quantitative evaluations shown in Figure 4, we have obtained, for a plausible selection of the parameters, field amplitudes compatible with the model requirements.
Depending on whether the poles are captured or not, the relative contributions evidently change and have been evaluated.
Author Contributions

Conceptualization, I.C. and A.R.; Methodology, I.C. and A.R.; Investigation, I.C. and A.R.; Writing—original draft, I.C. and A.R.; Writing—review and editing, I.C. and A.R. All authors have read and agreed to the published version of the manuscript.

Funding

This research received no external funding.

Data Availability Statement

The data that support the findings of this study are available from the corresponding author upon reasonable request.

Acknowledgments

The authors wish to thank P.L. Emiliani for providing some interesting bibliographical material.

Conflicts of Interest

The authors declare no conflicts of interest.

Appendix A. Analytical Details

We have to evaluate the integral (1), rewritten as
F ( Ω ) C g ( z ) e Ω f ( z ) d z ,
with Ω = k ρ . By a change of variable from z to s, around a first-order saddle point at z = z 0 , we put f ( z ) = f ( z 0 ) s 2 and (A1) becomes
F ( Ω ) e Ω f ( z 0 ) C G ( s ) e Ω s 2 d s ,
where G ( s ) = g z ( s ) d z / d s .
By differentiating f ( z ) , we obtain f ( z ) d z d s = 2 s , or d z d s = 2 s f ( z ) which, for s = 0 , according to the Hospital theorem, becomes d z d s s = 0 = 2 f ( z 0 ) d z d s s = 0 , and hence, d z d s s = 0 = 2 f ( z 0 ) 1 / 2 . By integrating (A2), we have
F ( Ω ) 2 π Ω f ( z 0 ) 1 / 2 e Ω f 0 g ( z 0 ) .
In our case, with f ( z ) = i cos ( z α ) , we have f ( z 0 ) = i and f 0 = i , g ( z 0 ) = A ( α ) , and (A3) turns out to be
F ( Ω ) g ( z 0 ) 2 π Ω e i ( Ω π / 4 ) A ( α ) λ ρ 1 / 2 e x p i ( k ρ π / 4 ) ,
which is the first term of Equation (2) and represents a cylindrical wave.
The second term in Equation (2), namely
2 π i Re A ( z β ) exp i Ω cos ( β α ) ,
represents, as indicated in Section 3, the contribution of a pole, situated at β angle as depicted in Figure 3, if captured in deforming the integration path from C 0 to C.
Moreover, when the pole is close to the saddle point, its contribution can be evaluated according to two different procedures.
Following the procedure as described in Ref. [21], in analogy with the previous case of the pole situated not near the saddle point, we start by considering that, in the vicinity of the pole, we can write
G ( s ) = a s b + H ( s )
where, as before, s = f 0 f ( z ) , a is a constant, b = s ( β ) , and H ( s ) is regular and can be identified with G ( s ) of (A2).
In such a way, we have that F ( Ω ) is given by the following sum of two integrals, namely
F ( Ω ) e Ω f 0 C a s b e Ω s 2 d s + C H ( s ) e Ω s 2 d s ,
where the first term supplies the pole contribution while the second one continues to give, in a first approximation, the same contribution of (A4) for the saddle point.
The integration of the first term in (A7) is more complicated and leads to the result expressed by Equation (4). The reader can refer to Refs. [21,22] for a detailed description of the computation.
On the contrary, if we follow the procedure of Ref. [22], we start by considering that g ( z ) in (A1) is written as
g ( z ) = A ( z ) z β or G ( s ) = A ( s ) s b .
However, a problem arises for the saddle-point contribution which would result, for the unitary amplitude, in
F S P ( Ω ) π Ω e i Ω π / 4 2 α β ,
which evidently diverges (to ) for α β .
This trouble is avoided by introducing the function T ( s ) in G ( s ) as
G ( s ) = a s b + T ( s ) .
Note that H ( s ) in (A6) and T ( s ) do not represent the same function. They are not identical for the presence or not of the counter term a / b . The discrepancy appears due to the different formulations of the problem.
In fact, in Ref. [22], we have that
| T ( 0 ) | = g ( z 0 ) 2 f ( z 0 ) + a b
which, indeed, contains the counter term a / b .
In our case, this leads to Equation (10) in Section 3.2 and relative comments. In particular, we have that the saddle-point contribution tends to zero for α β . After integrating in d s , Equation (A9) is replaced by (9) of Section 3.2, namely
F S P ( Ω ) e i ( Ω π / 4 ) π Ω | T ( 0 ) | .
The first term in (A10) continues to give the same contribution of Equation (4) for the pole.
Therefore, the question posed in Section 1, about which procedure has to be preferred, is not definitely answered; although, as declared in Section 5, the approach of Ref. [21] seems to be preferable.

References

  1. Ranfagni, A.; Cacciari, I. Modulation Transfer between Microwave Beams: A Hypothesized Case of a Classically-Forbidden Stochastic Process. Axioms 2022, 11, 416. [Google Scholar] [CrossRef]
  2. Cacciari, I.; Ranfagni, A. Modulation Transfer between Microwave Beams: Angular Dependance of the Delay-Time. Axioms 2023, 12, 492. [Google Scholar] [CrossRef]
  3. Toraldo di Francia, G. L’indagine del Mondo Fisico; Giulio Einaudi: Torino, Italy, 1976; p. 338. [Google Scholar]
  4. Radice, M. One-dimensionale telegraphic process with noninstantaneous stochastic resetting. Phys. Rev. E 2021, 104, 044126. [Google Scholar] [CrossRef]
  5. Giona, M.; Cairoli, A.; Klages, R. Extended Poisson–Kac theory: A unifying framework for stochastic processes with finite propagation velocity. Phys. Rev. X 2022, 2, 021004. [Google Scholar] [CrossRef]
  6. Luo, J.; Tu, L.C.; Hu, Z.K.; Luan, E.J. New Experimental Limit on the Photon Rest Mass with a Rotating Torsion Balance. Phys. Rev. Lett. 2003, 90, 081801. [Google Scholar] [CrossRef] [PubMed]
  7. Jacobson, T.; Schulman, L.S. Quantum stochastics: The passage from a relativistic to a non-relativistic path integral. J. Phys. A 1984, 17, 375–383. [Google Scholar] [CrossRef]
  8. Feynman, E.R.P.; Hibbs, A.R. Quantum Mechanics and Path Integrals; McGraw-Hill: New York, NY, USA, 1965; Chapter 7. [Google Scholar]
  9. Heaviside, O. Electromagnetic Theory, Volume III; Cosimo Inc.: New York, NY, USA, 2013; ISBN 97-1-60206-262-7. [Google Scholar]
  10. Kac, M. A Stochastic Model Related to the Telegrapher’s Equation. Rocky Mt. J. Math. 1974, 4, 497–509. [Google Scholar] [CrossRef]
  11. Kaplan, S. Differential equations in which the Poisson process plays a role. Bull. Am. Math. Soc. 1964, 70, 264–81964. [Google Scholar] [CrossRef]
  12. Gaveau, B.; Jacobson, T.; Kac, M.; Schulman, L.S. Relativistic extension of the analogy between quantum mechanics and brownian motion. Phys. Rev. Lett. 1984, 53, 419. [Google Scholar] [CrossRef]
  13. Orsingher, E. A planar random motion governed by the two-dimensional telegrapher equation. J. Appl. Prob. 1986, 23, 385–397. [Google Scholar] [CrossRef]
  14. McKeon, D.G.C.; Ord, G.N. Time reversal in stochastic processes and the Dirac equation. Phys. Rev. Lett. 1992, 69, 3–4. [Google Scholar] [CrossRef] [PubMed]
  15. Zastawniak, T. Evaluation of the distribution of the random variable S(t) = 0 t (−1)N(u)du Lectures on Path Integration. In Proceedings of the Trieste 1991 Adriatico Research Conference, Trieste, Italy, 26 August–6 September 1991; pp. 446–448. [Google Scholar]
  16. Masoliver, J.; Porra, J.M.; Weiss, G.H. Solutions of the telegrapher’s equation in the presence of reflecting and partly reflecting boundaries. Phys. Rev. E 1993, 48, 939–944. [Google Scholar] [CrossRef] [PubMed]
  17. DeWitt-Morette, C.; Foong, S.K. Path-integral solutions of wave equations with dissipation. Phys. Rev. Lett. 1989, 62, 2001–2004. [Google Scholar] [CrossRef] [PubMed]
  18. DeWitt-Morette, C.; Foong, S.K. Kac’s Solution of the Telegrapher Equation, Revisited: Part I Developments in General Relativity, Astrophysics and Quantum Theory, a Jubilee Volume in Honour of Nathan Rosen ed F Cooperstock, L Horwitz and J Rosen; IOP: Bristol, UK, 1990; pp. 351–366. [Google Scholar]
  19. Foong, S.K. Kac’s Solution of the Telegrapher Equation, Revisited: Part II Developments in General Relativity, Astrophysics and Quantum Theory, a Jubilee Volume in Honour of Nathan Rosen ed F Cooperstock, L Horwitz and J Rosen; IOP: Bristol, UK, 1990; pp. 367–377. [Google Scholar]
  20. Cartier, P.; DeWitt-Morette, C. A Rigorous Mathematical Foundation of Functional Integration Functional Integration: Basics and Applications ed C DeWitt-Morette, P Cartier and A Folacci; Plenum: New York, NY, USA, 1997; Chapter 1; pp. 1–50. [Google Scholar]
  21. Toraldo di Francia, G. Metodi Matematici Della Fisica; Consortini, A., Emiliani, P.L., Mugnai, D., Eds.; IFAC—Istituto di Fisica Applicata Nello Carrara: Firenze, Italy, 2014; Chapter II 5; ISBN 9788890685910. [Google Scholar]
  22. Felsen, L.B.; Marcovitz, N. Radiation and Scattering of Waves; Prentice Hall: Englewood Cliffs, NJ, USA, 1973; Chapter 4. [Google Scholar]
  23. Welford, W.D. Use of Annular Apertures to Increase Focal Depth. J. Opt. Soc. Am. 1960, 50, 749–753. [Google Scholar] [CrossRef]
  24. Cacciari, I.; Mugnai, D.; Ranfagni, D. On the nature of the microwave field emerging from a composite pupil. J. Opt. Soc. Am. M Phys. Let. B 2020, 34, 2050247. [Google Scholar] [CrossRef]
  25. Cacciari, I.; Ranfagni, A. On the origin of the transfer of modulation between microwae beams. Mod. Phys. Lett. B 2022, 36, 2250096. [Google Scholar] [CrossRef]
  26. Papoulis, A. The Fourier Integral and Its Applications; McGraw-Hill Book Company, Inc.: New York, NY, USA, 1962. [Google Scholar]
  27. Kobayashi, H. Horn Antenna. In Analyzing the Physics of Radio Telescopes and Radio Astronomy, 1st ed.; Yeap, K.H., Hirasawa, K., Eds.; Engineering Science Reference: Hersey, PA, USA, 2020; pp. 144–177. [Google Scholar]
  28. Barrow, W.L.; Chu, L.J. Theory of the Electromagnetic Horn. Proc. IRE 1939, 27, 51–64. [Google Scholar] [CrossRef]
  29. Ranfagni, A.; Fabeni, P.; Pazzi, G.P.; Mugnai, D. Anomalous pulse delay in microwave propagation: A plausible connection to the tunneling time. Phys. Rev. E 1993, 48, 1453–1460. [Google Scholar] [CrossRef] [PubMed]
  30. Debye, P. Näherungsformeln für die Zylinderfunktionen für große Werte des Arguments und unbeschränkt veränderliche Werte des Index. Math. Ann. 1909, 67, 535–558. [Google Scholar] [CrossRef]
  31. Abramovitz, M.; Stegun, I.A. Handbook of Mathematical Functions; Abramowitz, M., Stegun, I.A., Eds.; Dover Publications: New York, NY, USA, 1965; ISBN 9780486612720. [Google Scholar]
  32. Ranfagni, A.; Ricci, A.M.; Ruggeri, R.; Agresti, A. Diffraction effects in microwave propagation at the origin of superluminal behaviors. Phys. Lett. A 2008, 372, 6541–6544. [Google Scholar] [CrossRef]
  33. Ranfagni, A.; Agresti, A.; Cacciari, I. Angular dependence in anomalous microwave propagation: A bidimensional treatment. J. Appl. Phys. 2014, 115, 104902. [Google Scholar] [CrossRef]
Figure 1. The experimental setup consisted of three horn antennas; two antennas are used as launchers and one as receiver. The launchers are represented by the F 1 c.w. beam and the F 2 modulated beam, both derived from the same generator operating at 9.3 GHz. In the F 2 modulated beam, a composed pupil has been introduced with the purpose to reduce the beam width [23,24]. The receiver horn antenna was placed at a distance ρ from the F 1 launcher, where α represents its tilting angle. All the dimensions are expressed in centimeters. Taken from Ref. [2].
Axioms 13 00178 g001
Figure 2. Schematic representation of the mouth of the F 1 horn launcher as an aperture in the Σ plane with the adopted coordinate axes. Taken from Ref. [2].
Axioms 13 00178 g002
Figure 3. The original integration path C 0 is deformed into the steepest-descent path C taking into account the presence of pole singularities. In the case of α + 20 ° , only the pole at β is captured, while the one at β + is not, but it contributes to Equation (4). In the shaded areas, we have superluminal behavior. Taken from Ref. [2].
Axioms 13 00178 g003
Figure 4. Comparison of the field amplitude vs. ρ / λ , relative to the pole contribution as computed for different values of β r , β i , and α , as 2 π B 1 / 2 Equation (11), and the amplitude relative to the saddle contribution for the case of the unidimensional λ / ρ and bidimensional λ / ρ model.
Axioms 13 00178 g004
Figure 5. Position of the β + pole in the x y plane with respect to the steepest-descent path (SDP). For α = 20 ° , the pole is captured, while for α = 30 ° , it is not.
Axioms 13 00178 g005
Table 1. Error-function complement θ ± , computed for some values of ρ , in the case of the captured pole, α = 0 ° , β r = 34 ° , β i = 10 ° .
θ + θ
ρ = 15 + 6.65 · 10 3 i 7.73 · 10 3 1.99 + i 7.73 · 10 3
ρ = 25 8.12 · 10 4 + i 6.38 · 10 4 2.01 i 6.38 · 10 4
ρ = 35 + 9.99 · 10 5 i 5.23 · 10 5 2.00 + i 5.23 · 10 5
ρ = 45 1.22 · 10 5 + i 3.82 · 10 6 2.00 i 3.82 · 10 6
ρ = 55 + 1.48 · 10 6 i 1.85 · 10 7 2.00 + i 1.85 · 10 7
Table 2. Same as Table 1 for α = 20 ° , β r = 34 ° , β i = 10 ° , but the pole is still captured, see Figure 5.
θ + θ
ρ = 15 + 8.41 · 10 2 + i 5.57 · 10 2 1.92 i 5.57 · 10 2
ρ = 25 + 2.56 · 10 2 + i 2.18 · 10 2 1.97 i 2.18 · 10 2
ρ = 35 + 4.15 · 10 3 + i 1.17 · 10 3 1.96 i 1.17 · 10 3
ρ = 45 + 1.16 · 10 4 + i 4.58 · 10 3 2.00 i 4.58 · 10 3
ρ = 55 1.89 · 10 4 + i 1.68 · 10 3 2.00 i 1.68 · 10 3
Table 3. Same as Table 1 for α = 30 ° , β r = 34 ° , β i = 10 ° , for the case in which the pole is not captured, see Figure 5.
θ + θ
ρ = 15 + 1.71 + i 2.07 · 10 1 + 2.89 · 10 1 i 2.07 · 10 1
ρ = 25 + 1.89 + i 2.21 · 10 1 + 1.15 · 10 1 i 2.21 · 10 1
ρ = 35 + 1.94 + i 1.54 · 10 1 + 5.74 · 10 2 i 1.54 · 10 1
ρ = 45 + 1.99 + i 1.16 · 10 1 + 8.44 · 10 3 i 1.16 · 10 1
ρ = 55 + 2.02 + i 8.17 · 10 2 1.72 · 10 2 i 8.17 · 10 2
Disclaimer/Publisher’s Note: The statements, opinions and data contained in all publications are solely those of the individual author(s) and contributor(s) and not of MDPI and/or the editor(s). MDPI and/or the editor(s) disclaim responsibility for any injury to people or property resulting from any ideas, methods, instructions or products referred to in the content.