Abstract
In order to study the dynamic mechanism of the impact of technological innovation diffusion on enterprise population networks, a corresponding relationship between enterprise population networks and predatory models was established based on a predatory model. Without considering the impact of technological innovation diffusion, the stability of the enterprise population network was analyzed, and the results showed that it has the characteristic of local asymptotic stability at a positive equilibrium point. Considering the influence of technological innovation diffusion, the stability of the enterprise population network becomes complex, and its stability at the positive equilibrium point is also affected by the eigenvalue of the Laplacian matrix and technological innovation diffusion coefficient. The simulation experimental results indicate that in addition to the influence of technological innovation diffusion coefficient, the connection probability density of enterprise population networks has an important impact on stability. Only when the connection probability density is very small can the enterprise population network resist the impact of technological innovation diffusion and maintain stability.
Keywords:
enterprise community; technological innovation diffusion; dynamic mechanism; connection probability density MSC:
91D30
1. Introduction
With the continuous expansion of economic scale and the rapid development of information technology, the connections between various enterprises are becoming increasingly close, gradually forming a group of enterprises containing numerous enterprises [1]. Within the enterprise community, mergers and acquisitions between enterprises continue to occur, constantly changing the structure and operational rules of the enterprise community [2]. Technological innovation not only brings about technological upgrades and product upgrades, but also provides a unique driving mechanism for the operation of enterprise communities.
If we examine the operation of enterprise communities from the perspective of merger behavior, the predator–prey relationship in ecosystems is a good analogy [3]. There are abundant food chains and food relationship networks in ecosystems, where various types of predators and prey not only maintain their own survival but also maintain a relatively stable operation of the ecosystem through predation relationships [4]. Therefore, if the predator–prey relationship in the ecosystem can be mapped to the merger behavior in the enterprise community, it can open up a new research perspective for the dynamic mechanism of technological innovation diffusion on the enterprise community.
Predation models are mainly used to describe the interactions between prey and predator in ecosystems [5]. Due to the rich dynamic behavior of predator–prey models, they have attracted the attention of a large number of scholars. The predation model was first proposed based on the predation relationship between large and small fish, and the dynamic mechanism of a school of fish was deduced through the periodic proportional changes of the two [6]. Subsequently, various factors, including predation ability and natural conditions, were incorporated into the predation model, and the predation model and its dynamic theory were continuously enriched and improved [7,8]. When an ecosystem suddenly encounters a mutation, the mutation will gradually affect the entire system due to the diffusion behavior of the mutation source. For the predatory model, diffusion is mainly used to describe the random walk of individuals in the habitat, taking into account the discrete distribution of population habitats in the ecosystem and the interaction between populations in different habitats [9]. Diffusion is indispensable in predator–prey models, and the introduction of diffusion leads to more bifurcations and richer pattern dynamics in the system [10]. Song used bifurcation theory and energy methods to study the existence and stability of non-normal number solutions for predator–prey models with diffusion terms [11]. Jennifer studied the pattern dynamics mechanism of a modified predator–prey diffusion model based on the functional response function, and analyzed the linear stability of the reaction diffusion equation in Fourier space [12]. Zhang obtained the conditions for the occurrence of Turing bifurcation and derived the influence of diffusion on the system pattern [13]. Annosi used normal form theory and the central manifold theorem to study the direction of bifurcation and the stability of bifurcation periodic solutions, and also provided the mechanism of pattern formation under specific parameter conditions [14].
In this paper, a merger model of enterprise communities is built based on the predator prey model, which corresponds to the ecosystem of enterprise population networks. While mathematically interpreting the stability of enterprise communities, it examines the dynamic mechanism of the impact of technological innovation diffusion on enterprise communities. The main purpose of our research is to explore the impact of technological innovation diffusion on the originally balanced enterprise community, including whether it will cause instability in the enterprise community and the subsequent evolution patterns of the enterprise community after instability occurs.
2. Materials and Methods
Our research focuses on the basic operating laws of enterprise communities, attempting to map the merger behavior between enterprises based on the relationship between predators and prey in a predator–prey model, thereby analyzing the dynamic equilibrium laws achieved by enterprise communities. On this basis, we further use technological innovation diffusion as a new influencing factor to analyze how the enterprise community under the predator–prey model changes its inherent equilibrium state and produces new operating laws.
2.1. Predator–Prey Model
The study of population dynamics shows that various populations in an ecosystem cannot exist independently without any impact due to the shared enjoyment of the same ecological environment. Various interactions occur between different populations, such as predator–prey relationships, competitive relationships, parasitic relationships, symbiotic relationships, and so on [15]. The predator–prey model is a classic model that describes the predator–prey relationship between populations, and its rich dynamic behavior characteristics have attracted widespread attention in the field.
Among various predatory models, the HT model (Holling–Tanner) is a very classic one, with its mathematical form as follows:
Here, represents the number or density of predators during the predation process, represents the number or density of predators during the predation process, represents the growth rate of predators in the ecological environment, represents the growth rate of predators in the ecological environment, represents the maximum capacity of predators that the ecological environment can provide, represents the functional response function during the predation process, represents the maximum capture rate during the predation process, is a semisaturated constant, represents the correction term of the functional response function during the predation process and reflects the changes in the number of predators affected by changes in the number of prey, represents the number of prey required by the predator in an equilibrium state, and reflects the degree of protection of the ecological environment against predators.
2.2. Correspondence between Merger Behavior of Enterprise Community and Predation Model
For a business community composed of multiple similar enterprises, it can also be regarded as an ecological population. The merger behavior between enterprises can correspond to the predator–prey relationship expressed in the predator–prey model, as shown in Table 1.

Table 1.
Correspondence between enterprise community merger behavior and predation model.
The merger behavior model of enterprise communities constructed on the basis of the predator prey model can achieve a balance in dynamic evolution. However, when technological innovation spreads, the original equilibrium state of the enterprise community will be affected. Therefore, the assumption made in this article is that the diffusion of technological innovation will break the original equilibrium state of the enterprise community and continuously evolve towards a new equilibrium state.
2.3. Analysis of the Stability of Enterprise Communities without Technological Innovation Diffusion
Firstly, it is assumed that there is no diffusion of technological innovation in the normal survival and evolution process of the enterprise community, and only the stability of the enterprise community under the presence of enterprise merger behavior is considered. Based on this assumption, in order to facilitate mathematical interpretation, Formula (1) is dimensionlessly transformed as follows:
Here, , , , , , , .
For the dimensionless pure mathematical system described in Formula (2), the position of the equilibrium point satisfies the following equation:
Correspondingly to the real situation, as the density of enterprises is non-negative. When , there will be a unique positive equilibrium point in the system shown in Formula (3):
Below, consider the stability of the system near the positive equilibrium point when it is determined to exist. According to the linear analysis method of stability, the Jacobian matrix at the position of the positive equilibrium point can be obtained, as follows:
The characteristic equation of the Jacobian matrix is as follows:
According to the characteristic equation, two characteristic roots can be obtained, as follows:
According to the expressions of the two eigenvalues, it can be seen that the real part of the eigenvalues of the characteristic equation is always less than 0, and the system shown in Formula (2) is locally asymptotically stable near the positive equilibrium point when , , and .
2.4. Analysis of Enterprise Community Dynamics under the Influence of Technological Innovation Diffusion
After the enterprise community reaches a stable state based on the predator–prey model, the focus is on analyzing the impact of technological innovation diffusion on the formation of the enterprise community. If the original equilibrium state of the enterprise community is regarded as an initial state, then the diffusion behavior of technological innovation becomes an important disturbance factor. Here, in order to facilitate mathematical analysis and elaboration, we provide the following conditions and definition settings:
Condition 1:
The operational laws of the enterprise community are mapped to a two-dimensional plane, and the impact of technology diffusion behavior also occurs within this two-dimensional plane.
Definition 1:
The diffusion of technological innovation in the x-direction within the two-dimensional operational plane of the enterprise community is called the horizontal diffusion of technological innovation.
Definition 2:
The vertical diffusion of technological innovation in the y-direction within the two-dimensional operational plane of the enterprise community is called the vertical diffusion of technological innovation.
In the following work, considering the normal survival and evolution process of enterprise communities, there is a diffusion behavior of technological innovation, and the HT model evolves into the following form:
Here, represents the x-direction diffusion coefficient of technological innovation in the two-dimensional enterprise community network, represents the y-direction diffusion coefficient of technological innovation in the two-dimensional enterprise community network, and represents the Laplace operator.
In order to make Formula (8) have a more specific form, the Laplacian matrix is used instead of the Laplace operator, and Formula (8) becomes the form of Formula (9):
Here, represents the element of the Laplacian matrix at position (i, j) is. The relationship between the eigenvalues corresponding to the Laplacian matrix and the eigenvectors corresponding to the Laplacian matrix satisfies the following relationship:
Since is a seminegative definite matrix, there is eigenvalue corresponding to the Laplacian matrix. When the enterprise population network is constructed, the degree of each network node is arranged in the order from large to small, which will form where the eigenvalue sequence corresponding to the Laplacian matrix decreases monotonically.
Below, we will analyze the stability of the two-dimensional enterprise community network under the influence of technological innovation diffusion shown in Formula (9), assuming that Formula (9) has the following solution:
Returning the solution shown in Formula (11) to the equation shown in Formula (9) yields the following results:
At this point, the characteristic equation of the two-dimensional enterprise community network under the influence of technological innovation diffusion at the positive equilibrium point can be obtained, as follows:
The characteristic roots obtained from this characteristic equation are as follows:
Here, , .
Based on this, the stability determination of the two-dimensional enterprise community network considering the impact of technological innovation diffusion shown in Formula (9) can be divided into three situations:
First, since , is constant under the aforementioned condition. For , which is a univariate quadratic equation with variables , is constant when . At this point, all eigenroots in Formula (13). According to the linear stability discrimination theory, the two-dimensional enterprise community network shown in Formula (9) considering the influence of technological innovation diffusion is gradually stable at the positive equilibrium point .
Second, if and takes the negative half axis as the axis of symmetry, the eigenvalue of the Laplacian matrix satisfies , where , , . It is known that cannot be consistently established. At this point, all eigenroots of Formula (13) cannot satisfy . According to the linear stability discrimination theory, the two-dimensional enterprise community network shown in Formula (9) considering the impact of technological innovation diffusion is unstable at the positive equilibrium point .
Third, since is also a univariate quadratic equation with variables , is constant. When , is constant, where . When , is constant. If , even if , the two-dimensional enterprise community network shown in Formula (9) considering the impact of technological innovation diffusion is still stable. It can be seen that the stability of the two-dimensional enterprise community network at the position of the positive equilibrium point under the influence of technological innovation diffusion, as shown in Formula (9), is jointly affected by the eigenvalue of the Laplacian matrix and the technological innovation diffusion coefficient.
3. Results
Firstly, based on the enterprise population network model shown in Formula (2), set four key parameters as follows: , , , . Under such parameter configurations, observe the stability curve of the enterprise population network, as shown in Figure 1.
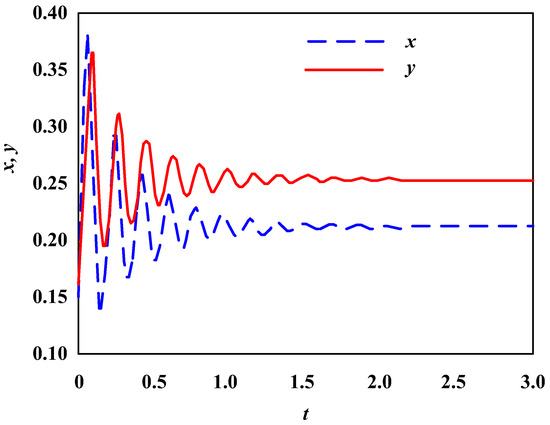
Figure 1.
Stability results of enterprise population network with , , , .
From Figure 1, it can be seen that under such parameter configurations , , , , the density of the merged enterprise and the enterprise executing the merger behavior in the entire network initially exhibits significant fluctuations, and then the fluctuation gradually decreases. After 2.0 time units, the density of the merged enterprise and the enterprise executing the merger behavior in the entire network reaches a relatively stable state and remains balanced.
Secondly, based on the enterprise population network model shown in Formula (2), set four key parameters as follows: , , , Under such parameter configurations, observe the stability curve of the enterprise population network, as shown in Figure 2.
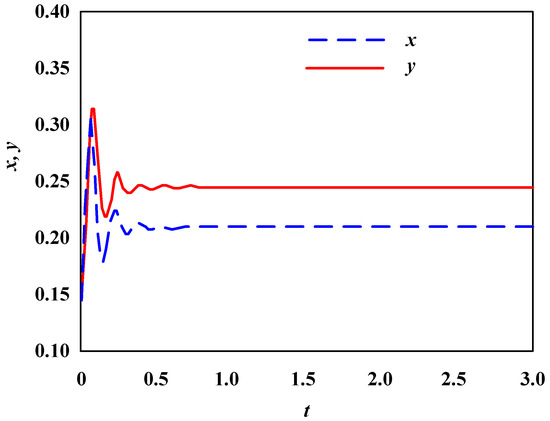
Figure 2.
Stability results of enterprise population network with , , , .
From Figure 2, it can be seen that under such parameter configurations , , , , the density of the merged enterprise and the enterprise executing the merger behavior in the entire network initially exhibits significant fluctuations in a short period of time. After 0.5 time units, the density of the merged enterprise and the enterprise executing the merger behavior in the entire network quickly reaches a stable state and maintains balance.
Based on the simulation results in Figure 1 and Figure 2, it can be seen that without the influence of technological innovation behavior, the enterprise population network exists in a balanced state and exhibits different speeds of achieving equilibrium states due to different parameter configurations.
4. Discussion
In the theoretical analysis section, it can be seen that the stability of the enterprise population network is much more complex when there is the impact of technological innovation diffusion. In order to facilitate the simulation and verification of this process, some more specific conditions are given here. The number of merged enterprises and the number of enterprises executing the merger behavior are set to be . In the enterprise population network, these enterprises are randomly distributed, and the connection probability density of the entire network is . Still, set , , , . At the same time, set the x-direction diffusion coefficient in technological innovation in the enterprise population network, and observe the patch pattern that characterizes the stability of the enterprise population network, as shown in Figure 3.
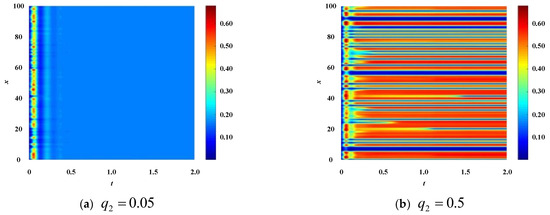
Figure 3.
The pattern of enterprise population network when .
From the results in Figure 3, it can be seen that under such parameter configurations , , , , , , the stability of the enterprise population network changes as the y-direction diffusion coefficient of technological innovation in the enterprise population network changes. When , due to , the enterprise population network is stable. So, the color plane of the patch pattern in Figure 3a presents a uniform homogeneous color. When , due to , the enterprise population network is unstable. So, the color plane of the spot pattern in Figure 3b presents a situation of multicolor parallel stripes.
Further, observe the critical point of instability in the enterprise population network, as shown in Figure 4.
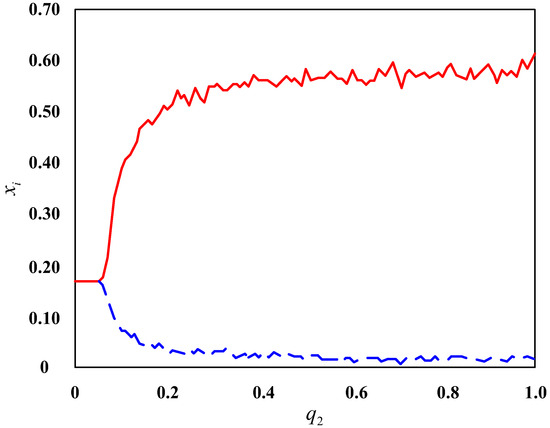
Figure 4.
Bifurcation trajectories of enterprise population networks when . The red line is the main line, and the blue line is the resulting bifurcation.
From Figure 4, it can be seen that with the change in , the trajectory of the merged enterprise in the enterprise population network changes from a stable horizontal line to two bifurcation trajectories, with their critical positions at . This is also the reason why the enterprise population network is stable when and unstable when .
Maintain other parameters unchanged, adjust the connection probability density , and observe the patch pattern that characterizes the stability of the enterprise population network, as shown in Figure 5.
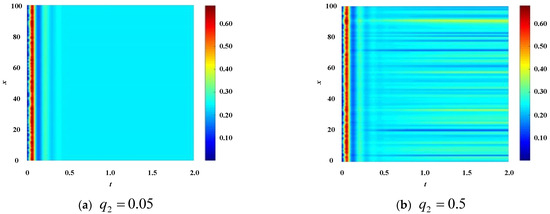
Figure 5.
The pattern of enterprise population network when .
From the results in Figure 5, it can be seen that under such parameter configurations , , , , , , the stability of the enterprise population network changes as the y-direction diffusion coefficient of technological innovation in the enterprise population network changes. When , due to , the enterprise population network is stable. So, the color plane of the patch pattern in Figure 5a presents a uniform homogeneous color. When , due to the enterprise population network is unstable.
So, in Figure 5b, the color plane of the patch pattern presents a situation where multiple parallel stripes of colors are present. From the color comparison with Figure 3b, it can be seen that the enterprise population network shown in Figure 5b is more unstable.
Further, observe the critical point of instability in the enterprise population network, as shown in Figure 6.
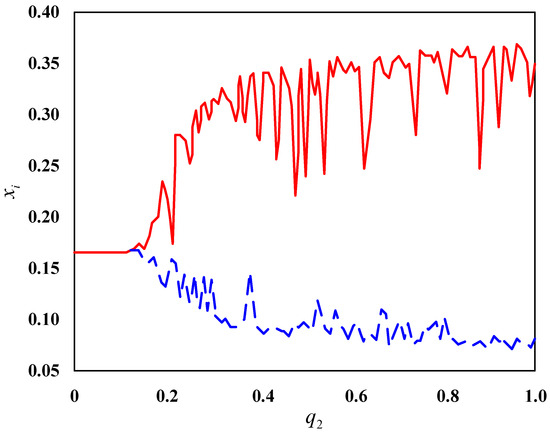
Figure 6.
Bifurcation trajectories of enterprise population networks when . The red line is the main line, and the blue line is the resulting bifurcation.
From Figure 6, it can be seen that with the change in , the trajectory of the merged enterprise in the enterprise population network changes from a stable horizontal line to two bifurcation trajectories, with their critical positions at . This is also the reason why the enterprise population network is stable when and unstable when . Comparing Figure 4 and Figure 6, it can be seen that the bifurcation trajectory of fluctuates more violently in Figure 6.
Maintain the other parameters unchanged, adjust the connection probability density , and observe the patch pattern that characterizes the stability of the enterprise population network, as shown in Figure 7.
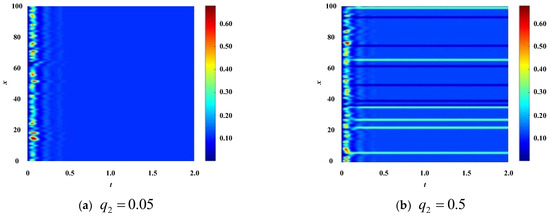
Figure 7.
The pattern of enterprise population network when .
From the results in Figure 7, it can be seen that under the parameter configurations , , , , , , the stability of the enterprise population network changes as the y-direction diffusion coefficient of technological innovation in the enterprise population network changes. When , due to , the enterprise population network is stable. So, the color plane of the patch pattern in Figure 5a presents a uniform homogeneous color. When , due to , the enterprise population network is unstable.
So, in Figure 7b, the color plane of the speckle pattern presents a situation where small and mottled stripes are used to segment the area of the uniform color plane. From the color comparison with Figure 3b and Figure 5b, it can be seen that the enterprise population network shown in Figure 7b is relatively more stable.
Further, observe the critical point of instability in the enterprise population network, as shown in Figure 8.
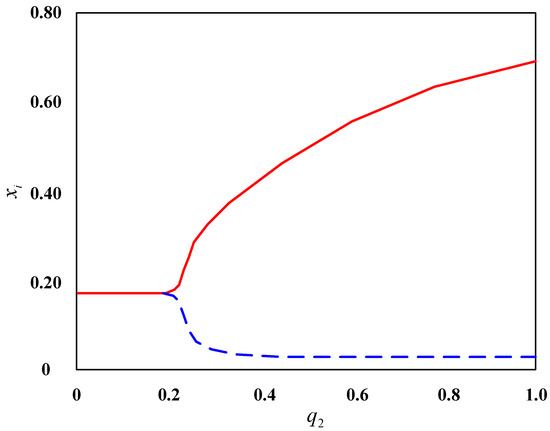
Figure 8.
Bifurcation trajectories of enterprise population networks when . The red line is the main line, and the blue line is the resulting bifurcation.
From Figure 8, it can be seen that with the change in , the trajectory of the merged enterprise in the enterprise population network changes from a stable horizontal line to two bifurcation trajectories, with their critical positions at . This is also the reason why the enterprise population network is stable when and unstable when . Comparing Figure 4, Figure 6 and Figure 8, it can be seen that the bifurcation trajectory of is smoother in Figure 8.
Further analysis shows that when , keeping other parameters unchanged, the enterprise population network remained stable no matter how it changed.
The results of this series of simulation experiments indicate that in the presence of technological innovation diffusion, the stability of the enterprise population network is clearly influenced by the connection probability density. The higher the connection probability density, the greater the possibility of instability of the enterprise population network under the influence of technological innovation diffusion. The smaller the connection probability density, the more stable the enterprise population network can remain under the influence of technological innovation diffusion.
The above research process indicates that technological innovation diffusion behavior, as a disturbance factor, will have an impact on the original equilibrium state of enterprise communities, leading them to enter a new dynamic evolution cycle. These studies have mathematical explanatory value for explaining the development and changes of technological innovation output, especially the formation and diffusion of enterprise communities.
5. Conclusions
Based on the predator–prey model, the corresponding relationship is established between the enterprise population network and the predator–prey model. Furthermore, the dynamic mechanism of the impact of technological innovation diffusion on the enterprise population network is studied. Firstly, without considering the impact of technological innovation diffusion, the stability of the enterprise population network was analyzed, and the results showed that it has the characteristic of local asymptotic stability at a positive equilibrium point. Secondly, considering the influence of technological innovation diffusion, the stability of the enterprise population network becomes complex. Its stability at the positive equilibrium point is also affected by the eigenvalue of the Laplacian matrix and technological innovation diffusion coefficient. The validation process and results of simulation experiments show that in addition to the influence of technological innovation diffusion coefficient, the connection probability density of enterprise population networks has an important impact on stability. Only when the connection probability density is very small can the enterprise population network resist the impact of technological innovation diffusion and maintain stability. The research work of this article mathematically elaborates on the impact of technological innovation diffusion on enterprise population networks. In the context of enterprise community relationships in the information age, the connections between enterprises are becoming increasingly close, making it difficult to achieve minimal connection probability density. Therefore, the emergence of breakthrough technological innovation achievements and their dissemination among enterprise communities will likely cause the enterprise community to break the original equilibrium state, thus leading to an unstable process of establishing a new order. It can be seen that our research has great practical value in analyzing the operational patterns of enterprise communities in the economic field. On the one hand, our research can analyze and elaborate on how new operating patterns of enterprise communities arise after the diffusion of technological innovation occurs; On the other hand, our research can quantify the impact of technological innovation diffusion on enterprise communities, thus formulating more targeted countermeasures and suggestions for the development of enterprise communities.
Author Contributions
J.C. was responsible for writing the paper. G.T. assisted in sorting out the simulation results. All authors have read and agreed to the published version of the manuscript.
Funding
This research was funded by Heilongjiang Province Philosophy and Social Science Research Planning Project, grant number 19GJD208 and Central Support for Local University Reform and Development Fund Talent Training Project, grant number 14011202101.
Data Availability Statement
The datasets used and analyzed during the current study are available from the corresponding author on reasonable request.
Conflicts of Interest
The authors declare no conflict of interest.
References
- Ottlewski, L. Building and Strengthening Community at the Margins of Society through Social Enterprise. Sustainability 2021, 21, 12046. [Google Scholar] [CrossRef]
- Toerien, D.F. Linking Entrepreneurial Activities and Community Prosperity/Poverty in United States Counties: Use of the Enterprise Dependency Index. Sustainability 2022, 22, 2812. [Google Scholar] [CrossRef]
- Li, J.; Liu, X.; Wei, C. Stationary distribution of a stage-structure predator-prey model with prey’s counter-attack and higher-order perturbations. Appl. Math. Lett. 2022, 129, 107921. [Google Scholar] [CrossRef]
- Almeida, J.P.A.; Guizzardi, G. An ontological analysis of the notion of community in the RM-ODP enterprise language. Comput. Stand. Interfaces 2013, 35, 257–268. [Google Scholar] [CrossRef]
- Leconte, M.; Masson, P.; Qi, L. Limit cycle oscillations, response time, and the time-dependent solution to the Lotka-Volterra predator-prey model. Phys. Plasmas 2022, 29, 022302. [Google Scholar] [CrossRef]
- Zhang, X.A.; Chen, L.; Neumann, A.U. The stage-structured predator-prey model and optimal harvesting policy. Math. Biosci. 2000, 168, 201–210. [Google Scholar] [CrossRef] [PubMed]
- Shi, Q.; Song, Y. Spatially nonhomogeneous periodic patterns in a delayed predator–prey model with predator-taxis diffusion. Appl. Math. Lett. 2022, 131, 108062. [Google Scholar] [CrossRef]
- Tello, J.I.; Wrzosek, D. Predator–prey model with diffusion and indirect prey-taxis. Math. Models Methods Appl. Sci. 2016, 26, 2129–2162. [Google Scholar] [CrossRef]
- Saiti, F. Stochastic Dynamics Analysis of a Predator-Prey Model with Stage Structure and Allee Effect. Adv. Appl. Math. 2021, 10, 909–922. [Google Scholar]
- Mishra, P.; Wrzosek, D. Repulsive chemotaxis and predator evasion in predator-prey models with diffusion and prey-taxis. Math. Models Methods Appl. Sci. 2022, 32, 1–42. [Google Scholar] [CrossRef]
- Song, Y.; Tang, X. Stability, Steady-State Bifurcations, and Turing Patterns in a Predator–Prey Model with Herd Behavior and Prey-taxis. Stud. Appl. Math. 2017, 139, 371–404. [Google Scholar] [CrossRef]
- Rehren, J.; Coll, M.; Jiddawi, N.; Kluger, L.C.; Omar, O.; Christensen, V.; Pennino, M.G.; Wolff, M. Evaluating ecosystem impacts of gear regulations in a data-limited fishery—Comparing approaches to estimate predator–prey interactions in Ecopath with Ecosim. ICES J. Mar. Sci. 2022, 79, 1624–1636. [Google Scholar] [CrossRef]
- Zhang, X.; Yan, L.; Jiang, D. Dynamics of a stochastic Holling type II predator–prey model with hyperbolic mortality. Nonlinear Dyn. 2016, 87, 2011–2020. [Google Scholar] [CrossRef]
- Annosi, M.C.; Ráez, R.M.O.; Appio, F.P.; Del Giudice, T. An integrative review of innovations in the agricultural sector: The roles of agency, structure, and their dynamic interplay. Technol. Forecast. Soc. Chang. 2022, 185, 122035. [Google Scholar] [CrossRef]
- Jin, P.; Mangla, S.K.; Song, M. The power of innovation diffusion: How patent transfer affects urban innovation quality. J. Bus. Res. 2022, 145, 414–425. [Google Scholar] [CrossRef]
Disclaimer/Publisher’s Note: The statements, opinions and data contained in all publications are solely those of the individual author(s) and contributor(s) and not of MDPI and/or the editor(s). MDPI and/or the editor(s) disclaim responsibility for any injury to people or property resulting from any ideas, methods, instructions or products referred to in the content. |
© 2023 by the authors. Licensee MDPI, Basel, Switzerland. This article is an open access article distributed under the terms and conditions of the Creative Commons Attribution (CC BY) license (https://creativecommons.org/licenses/by/4.0/).