Author Contributions
Conceptualization, N.A., A.S.H., M.E., C.C. and A.R.E.-S.; methodology, N.A., A.S.H., M.E., C.C. and A.R.E.-S.; software, N.A., A.S.H., M.E., C.C. and A.R.E.-S.; validation, N.A., A.S.H., M.E., C.C. and A.R.E.-S.; formal analysis, N.A., A.S.H., M.E., C.C. and A.R.E.-S.; investigation, N.A., A.S.H., M.E., C.C. and A.R.E.-S.; writing—original draft preparation, N.A., A.S.H., M.E., C.C. and A.R.E.-S.; writing—review and editing, N.A., A.S.H., M.E., C.C. and A.R.E.-S.; visualization, N.A., A.S.H., M.E., C.C. and A.R.E.-S.; funding acquisition, N.A. All authors have read and agreed to the published version of the manuscript.
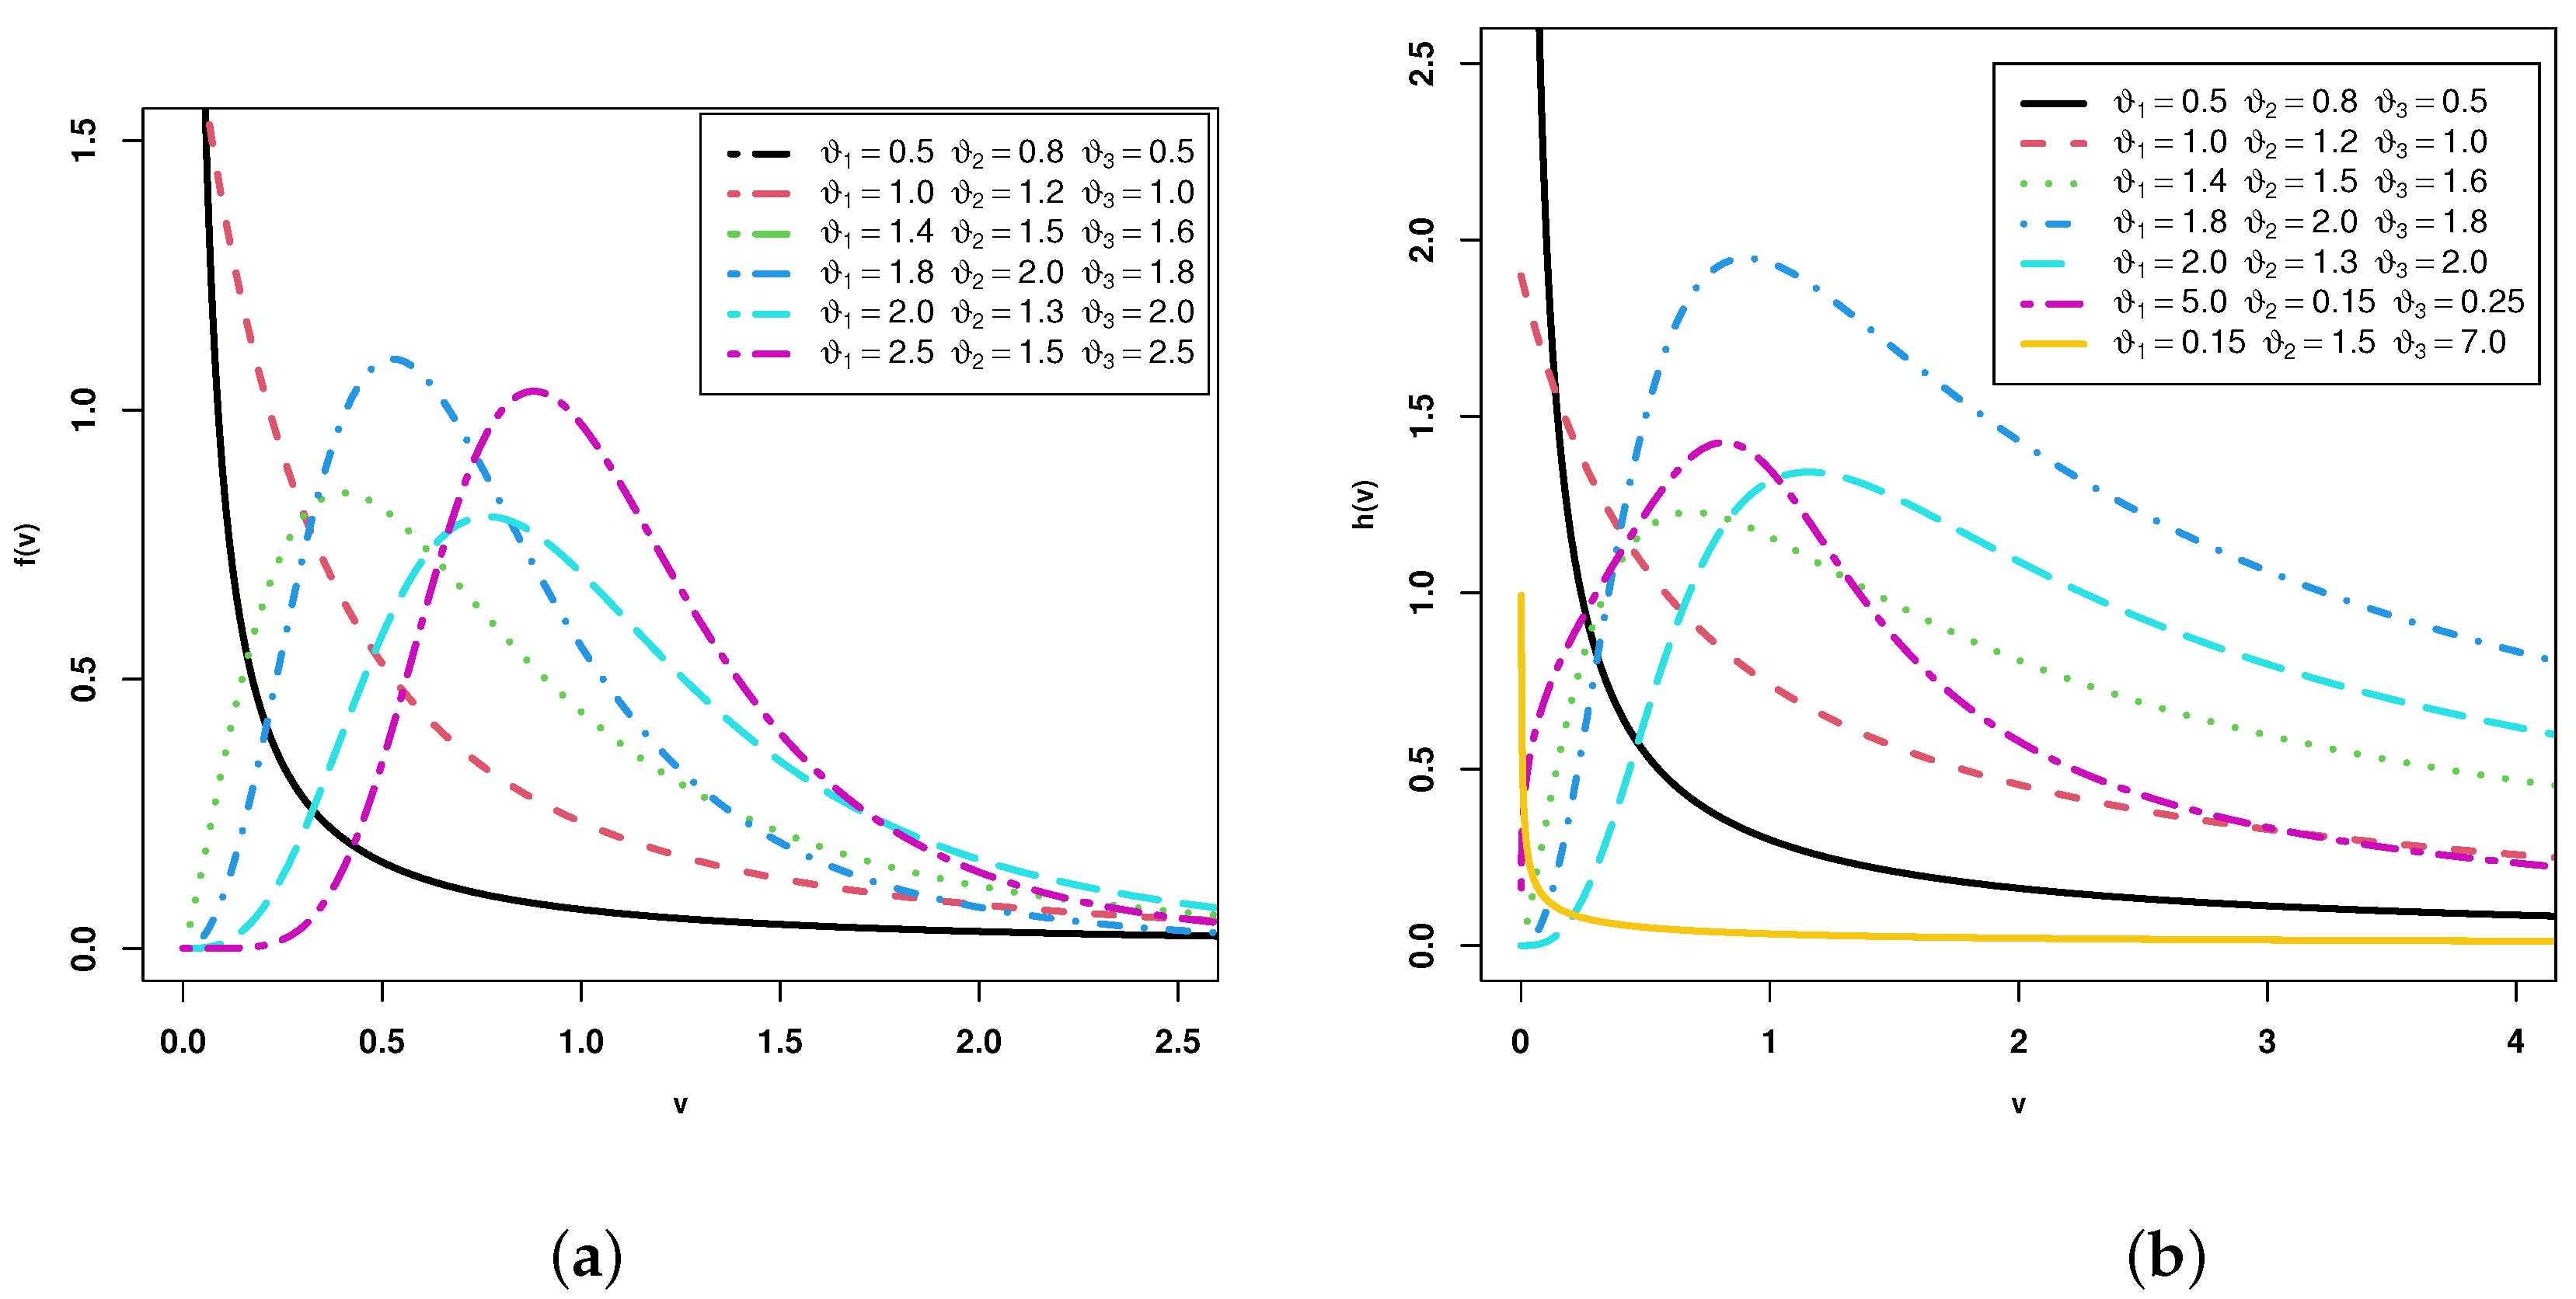
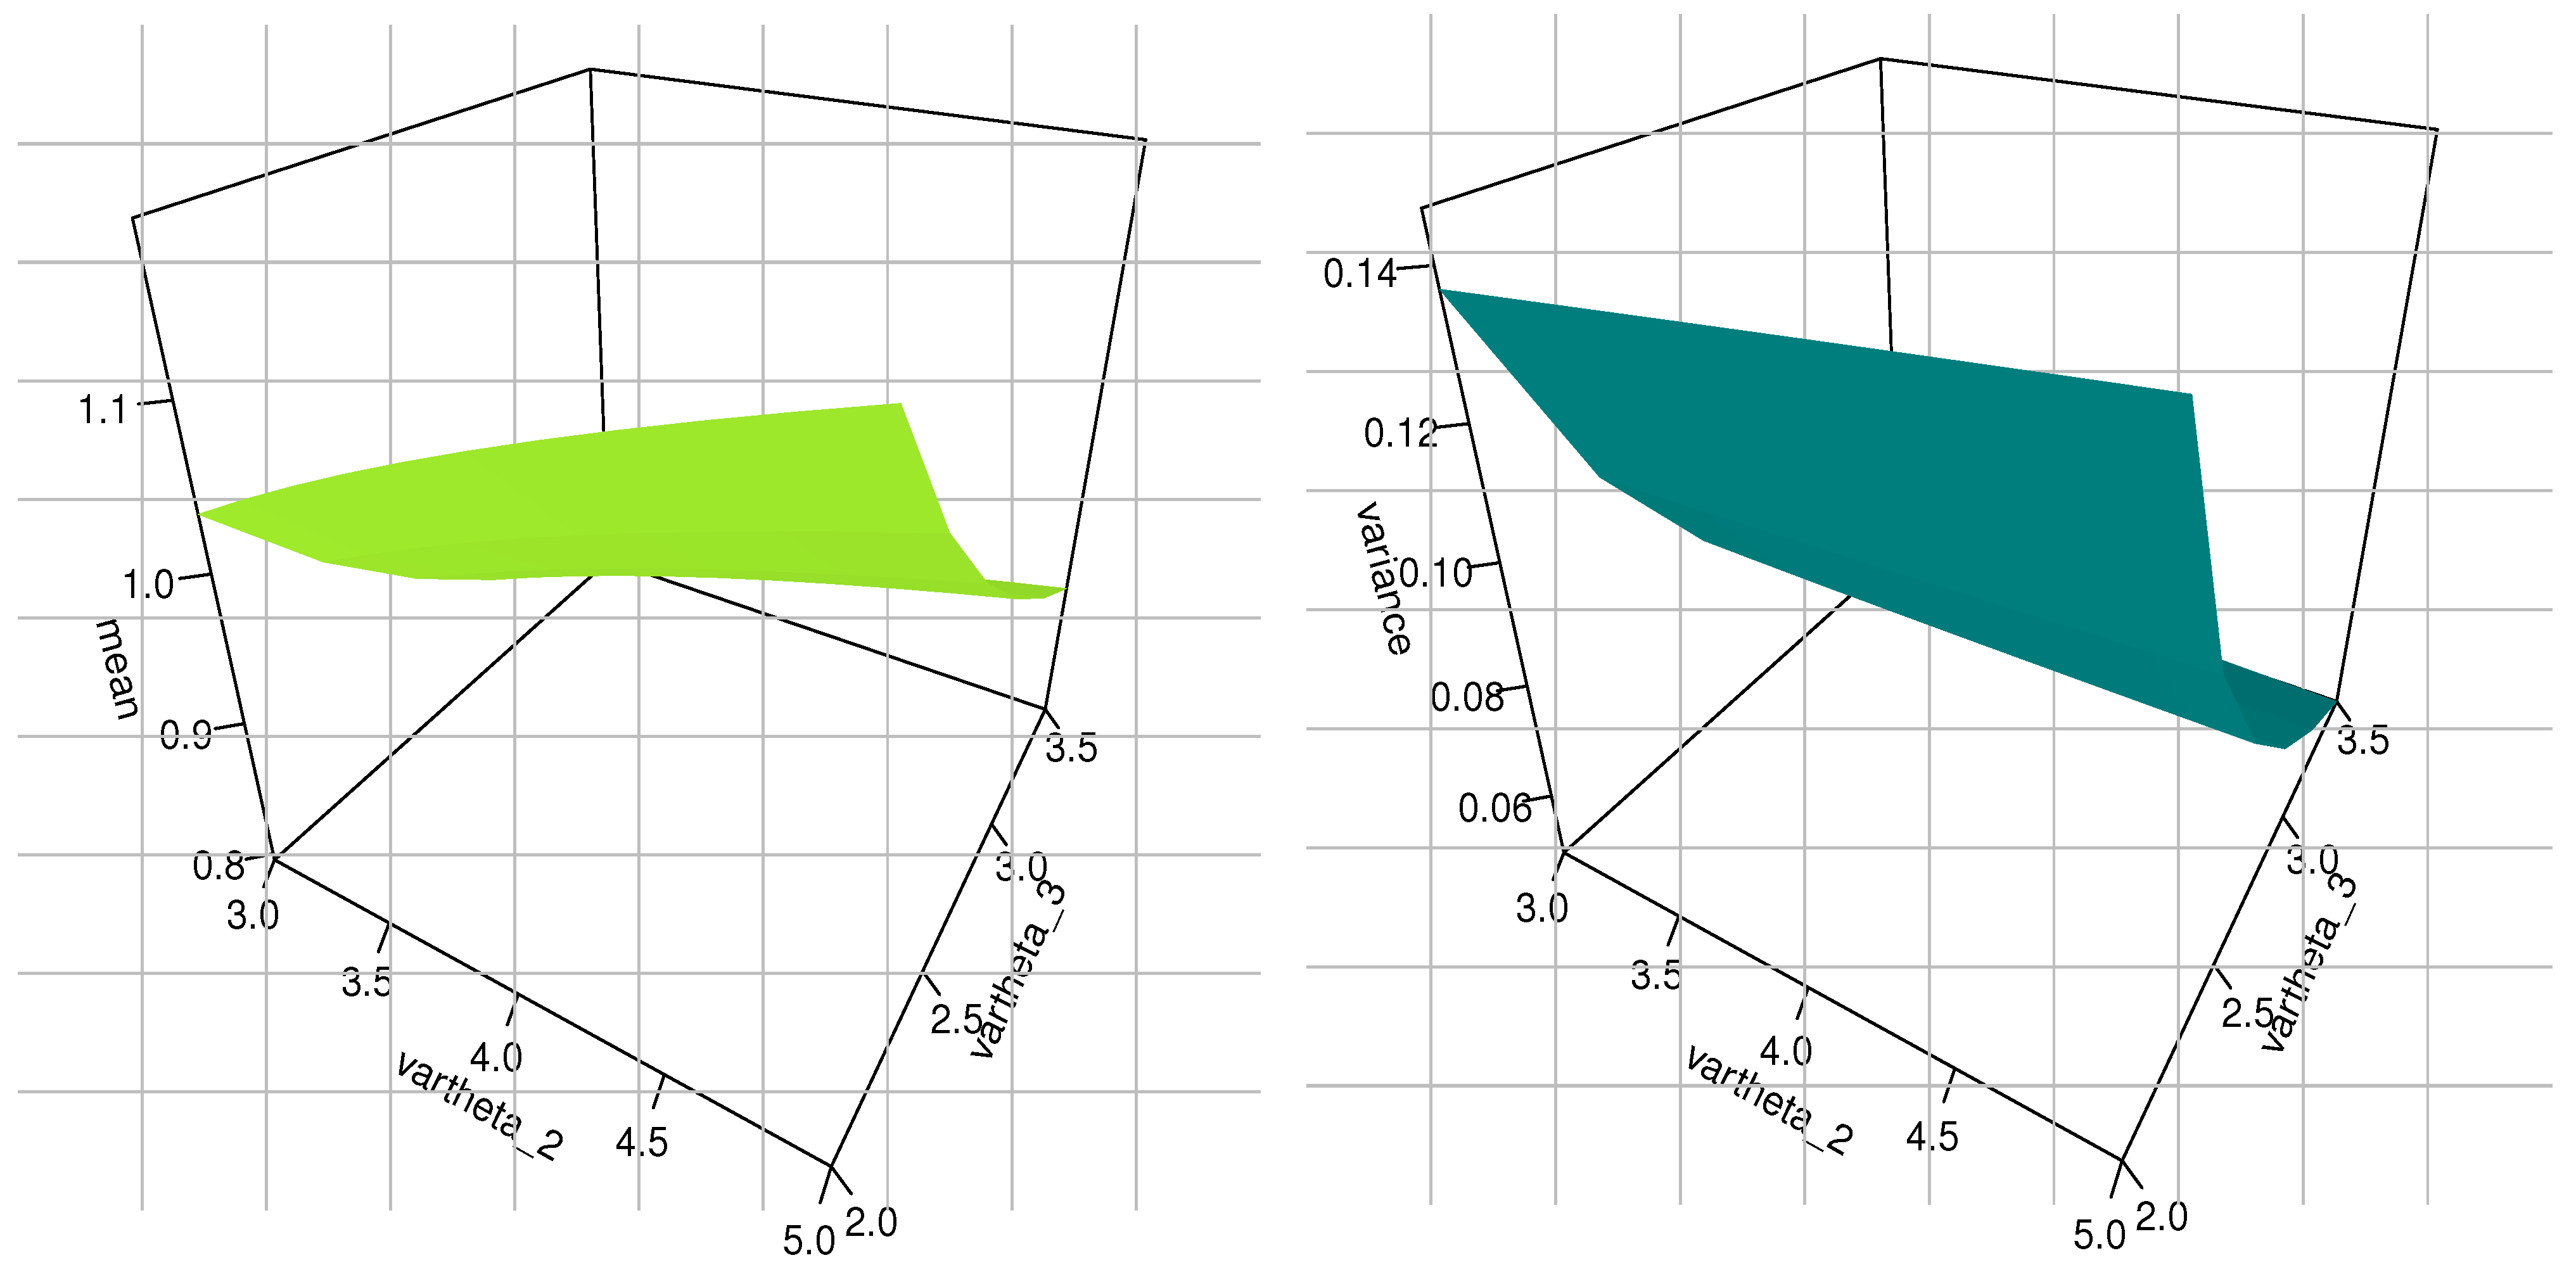
Figure 1.
Selected plots of (a) and (b) .
Figure 1.
Selected plots of (a) and (b) .
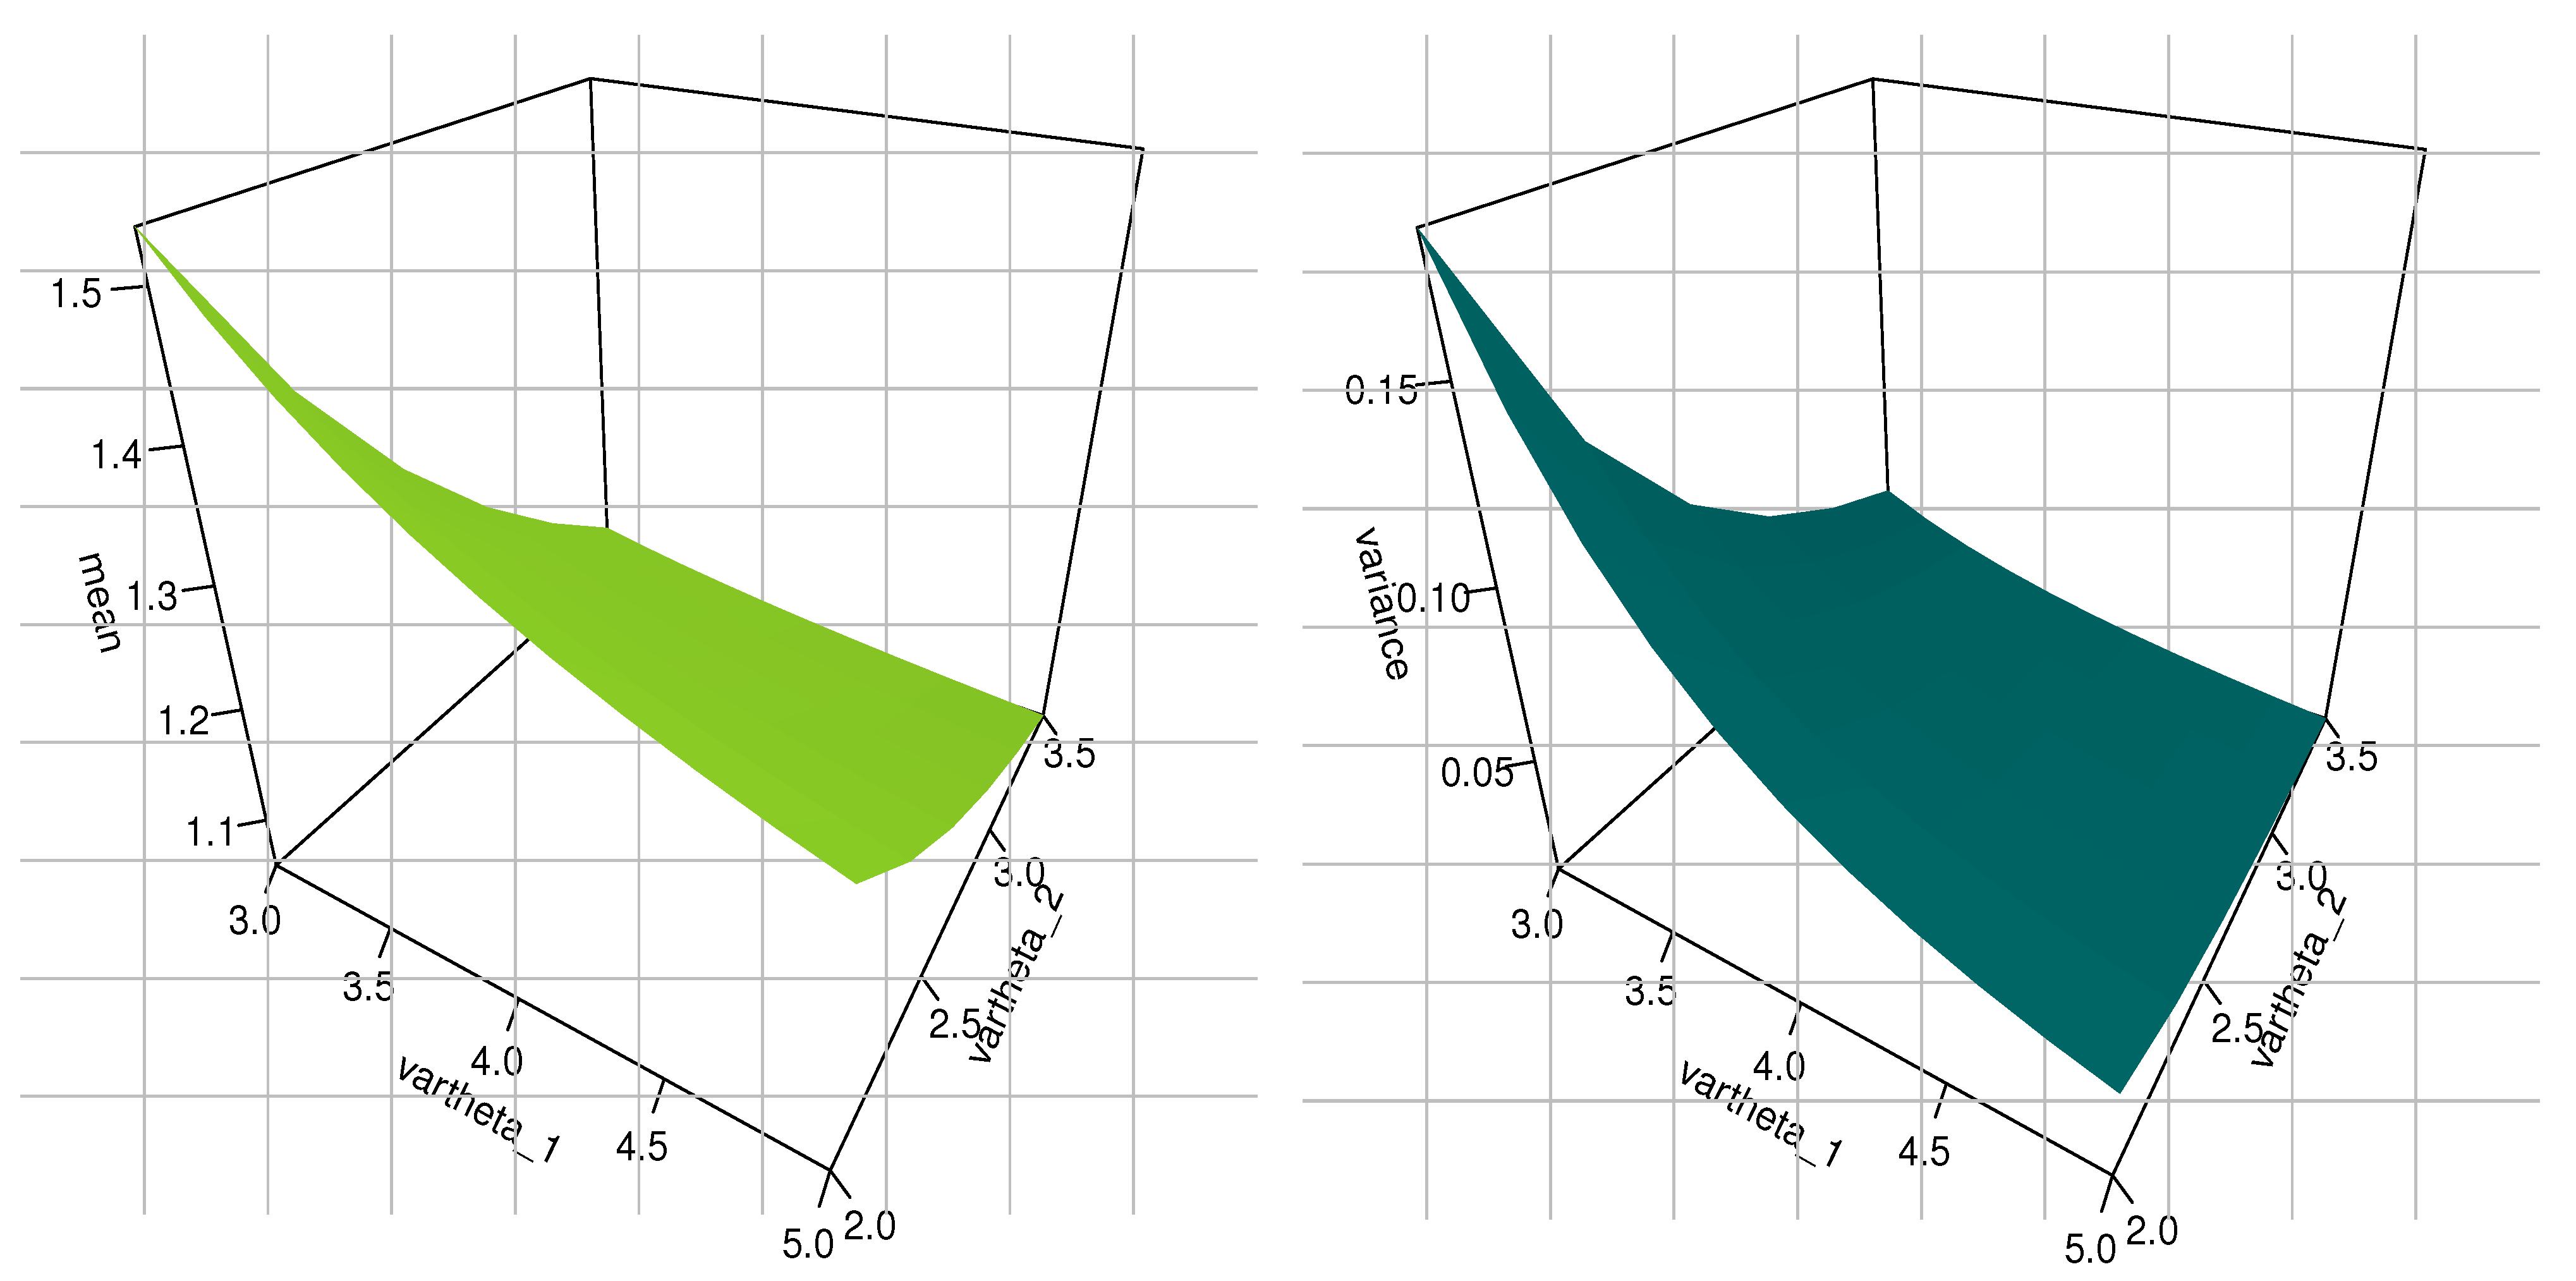
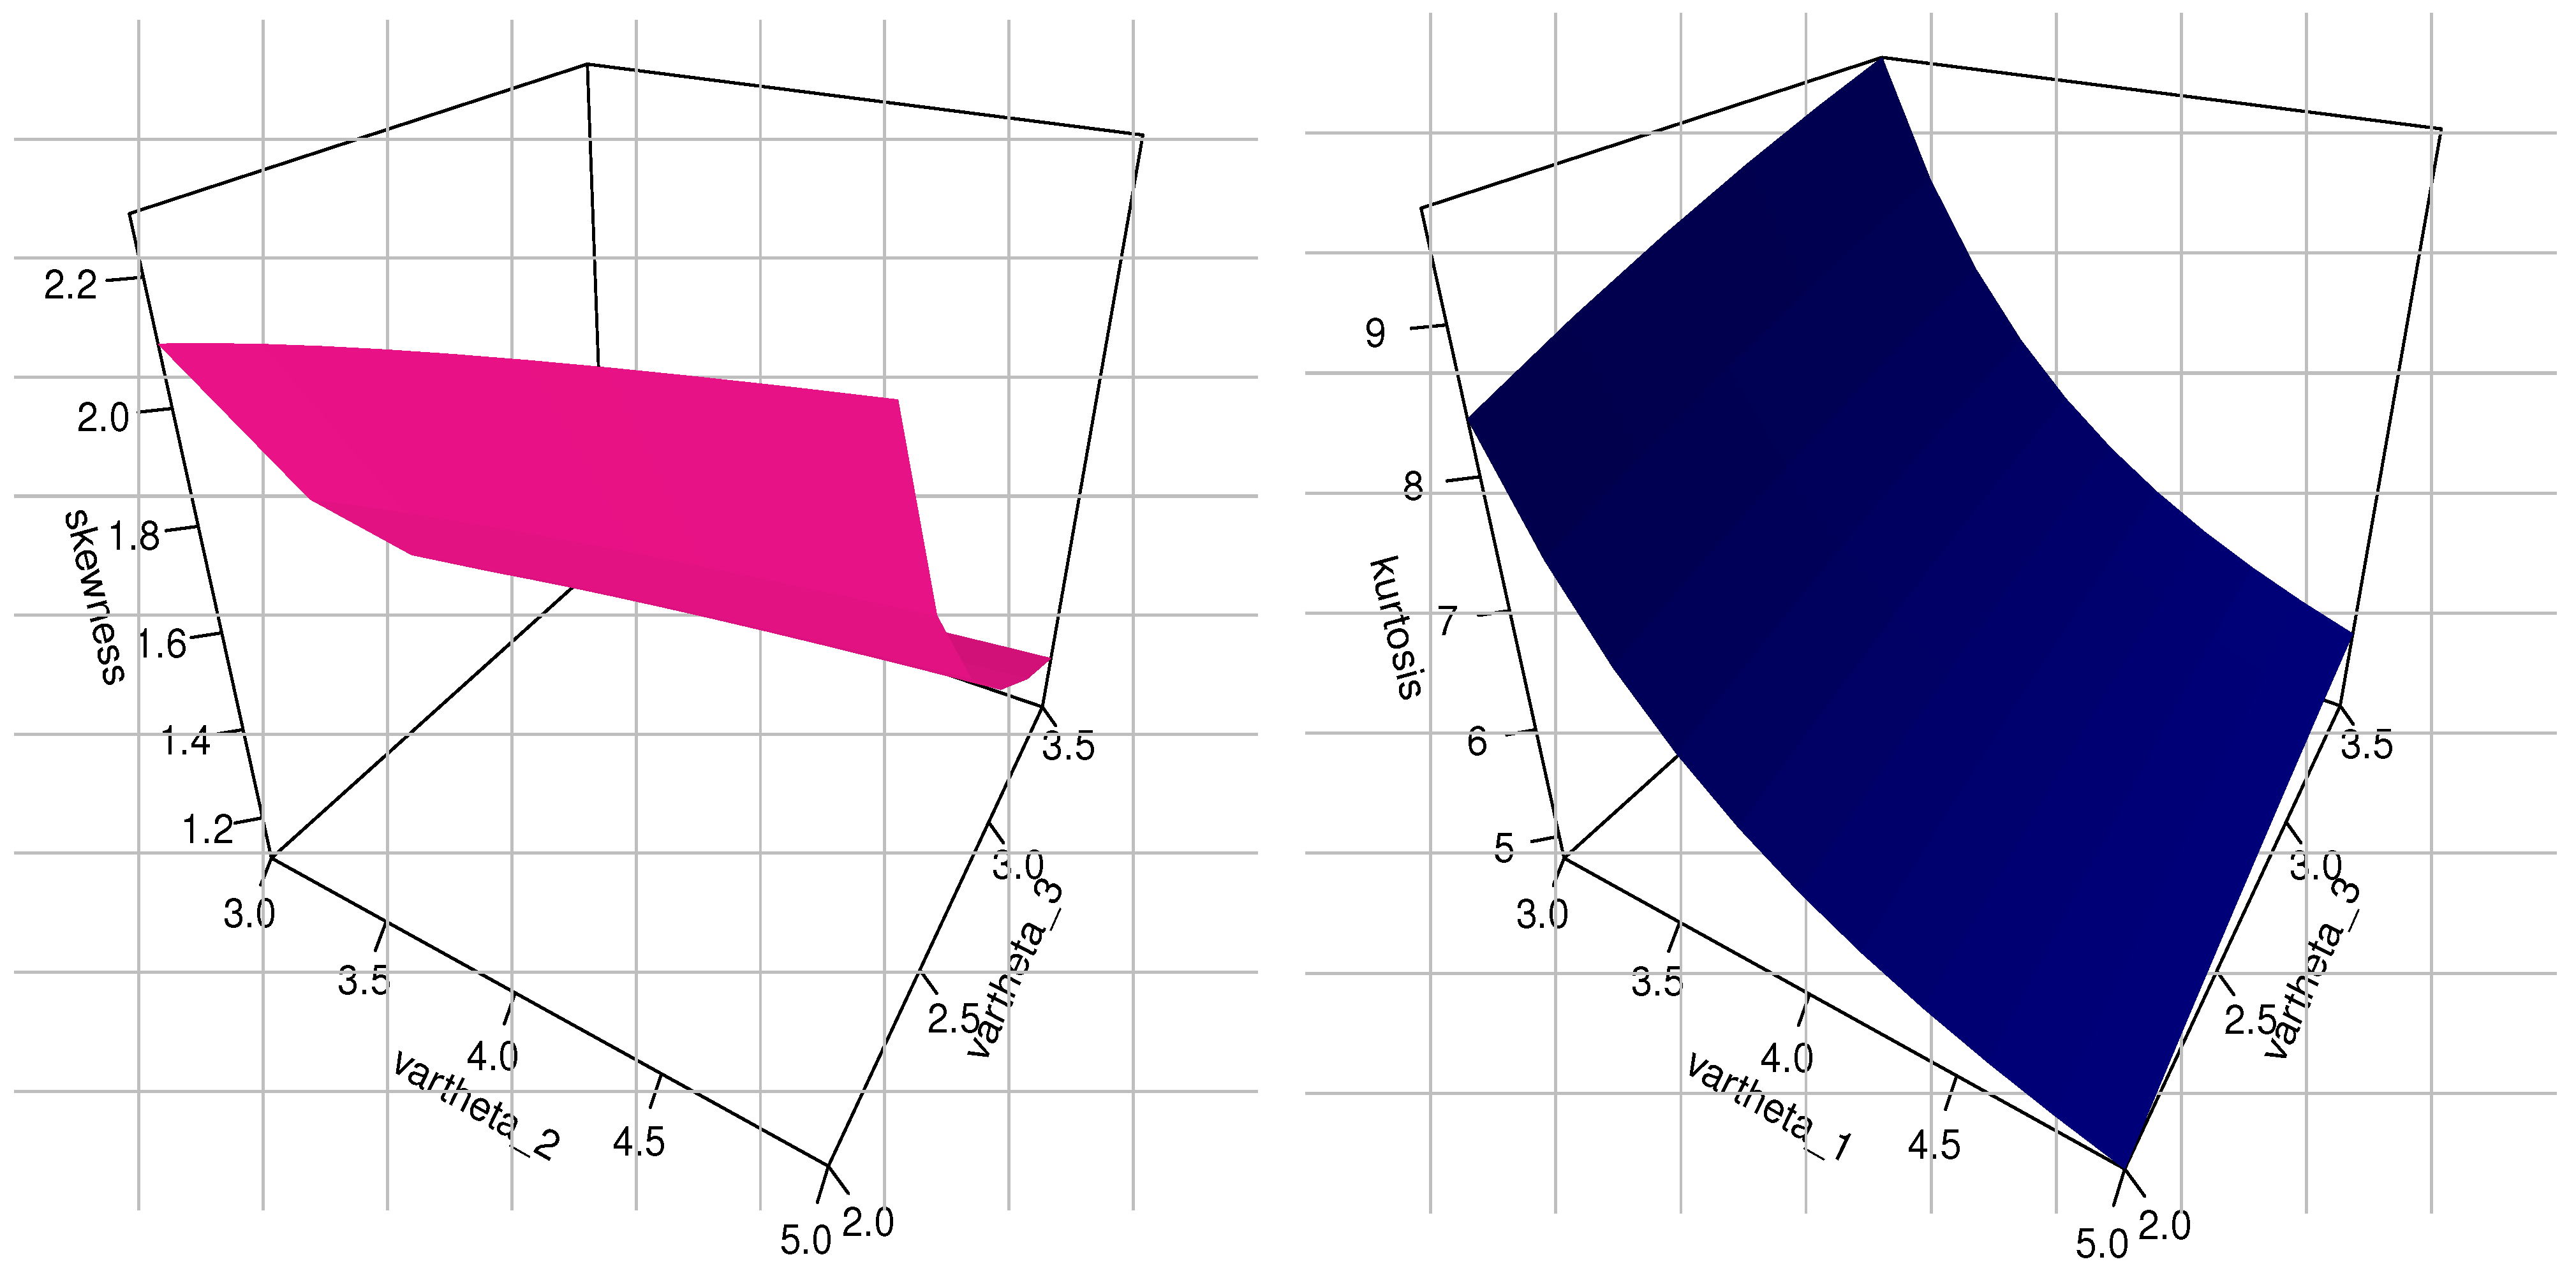
Figure 2.
The 3D plots of the mean (light green), variance (dark green), skewness (dark pink), and kurtosis (dark blue) associated with the KM-GIKw distribution at = 15.0.
Figure 2.
The 3D plots of the mean (light green), variance (dark green), skewness (dark pink), and kurtosis (dark blue) associated with the KM-GIKw distribution at = 15.0.
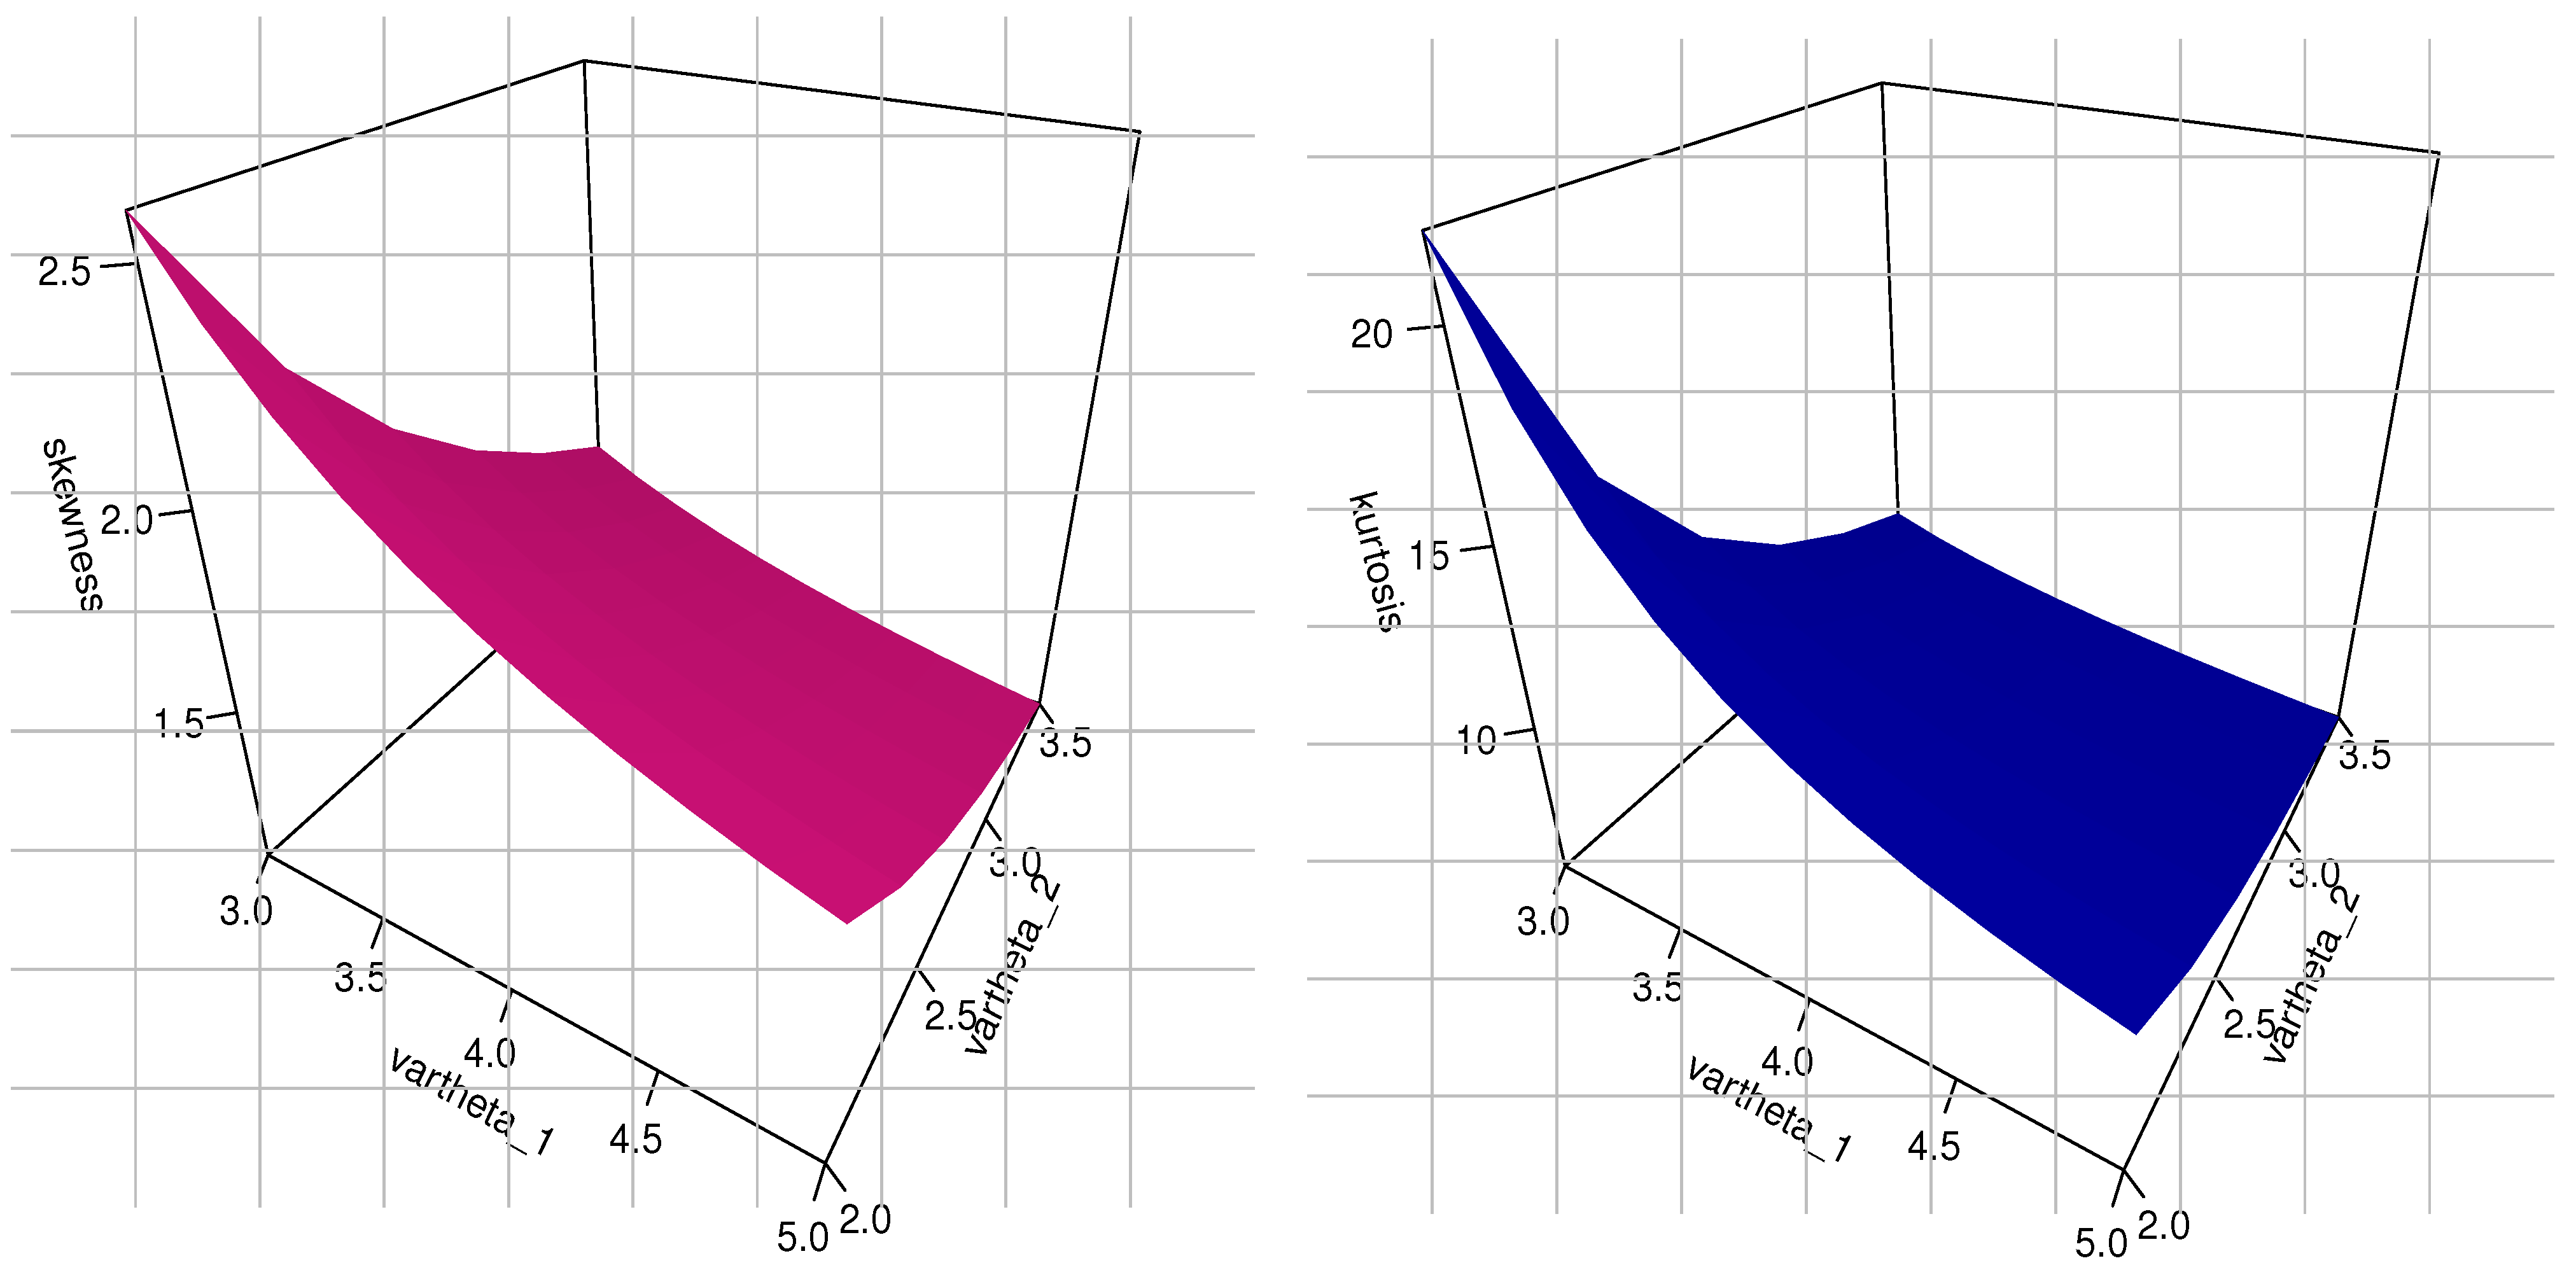
Figure 3.
The 3D plots of the mean (light green), variance (dark green), skewness (dark pink), and kurtosis (dark blue) associated with the KM-GIKw distribution at = 2.5.
Figure 3.
The 3D plots of the mean (light green), variance (dark green), skewness (dark pink), and kurtosis (dark blue) associated with the KM-GIKw distribution at = 2.5.
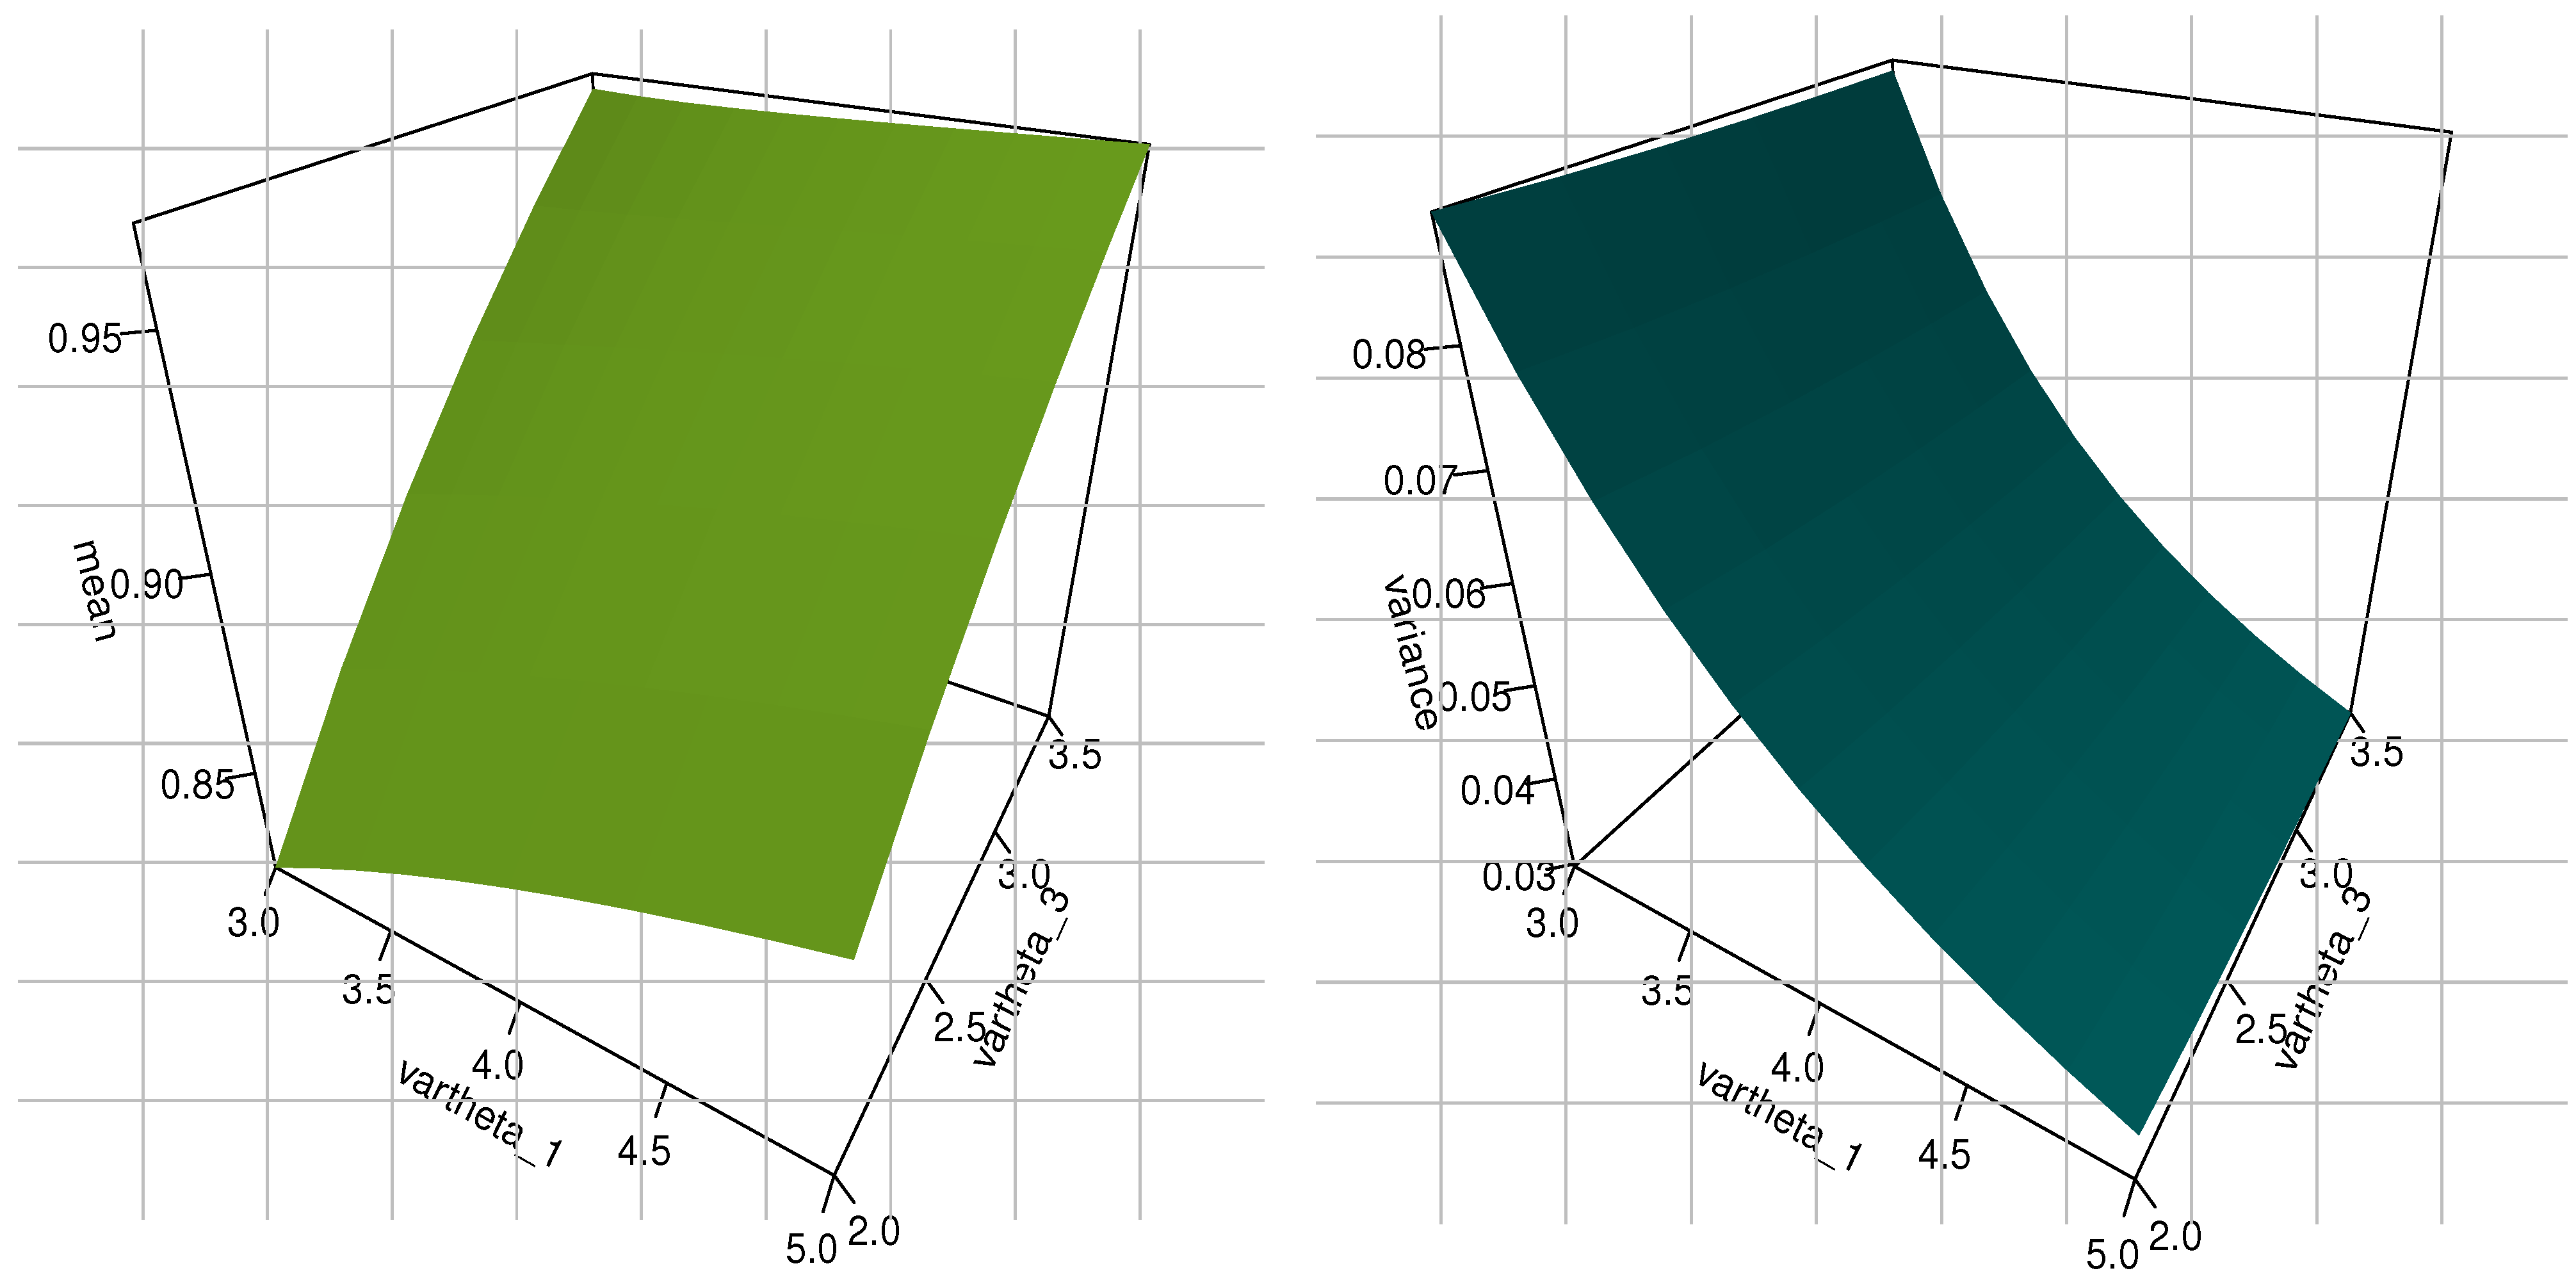
Figure 4.
The 3D plots of the mean (light green), variance (dark green), skewness (dark pink), and kurtosis (dark blue) associated with the KM-GIKw distribution at = 3.0.
Figure 4.
The 3D plots of the mean (light green), variance (dark green), skewness (dark pink), and kurtosis (dark blue) associated with the KM-GIKw distribution at = 3.0.
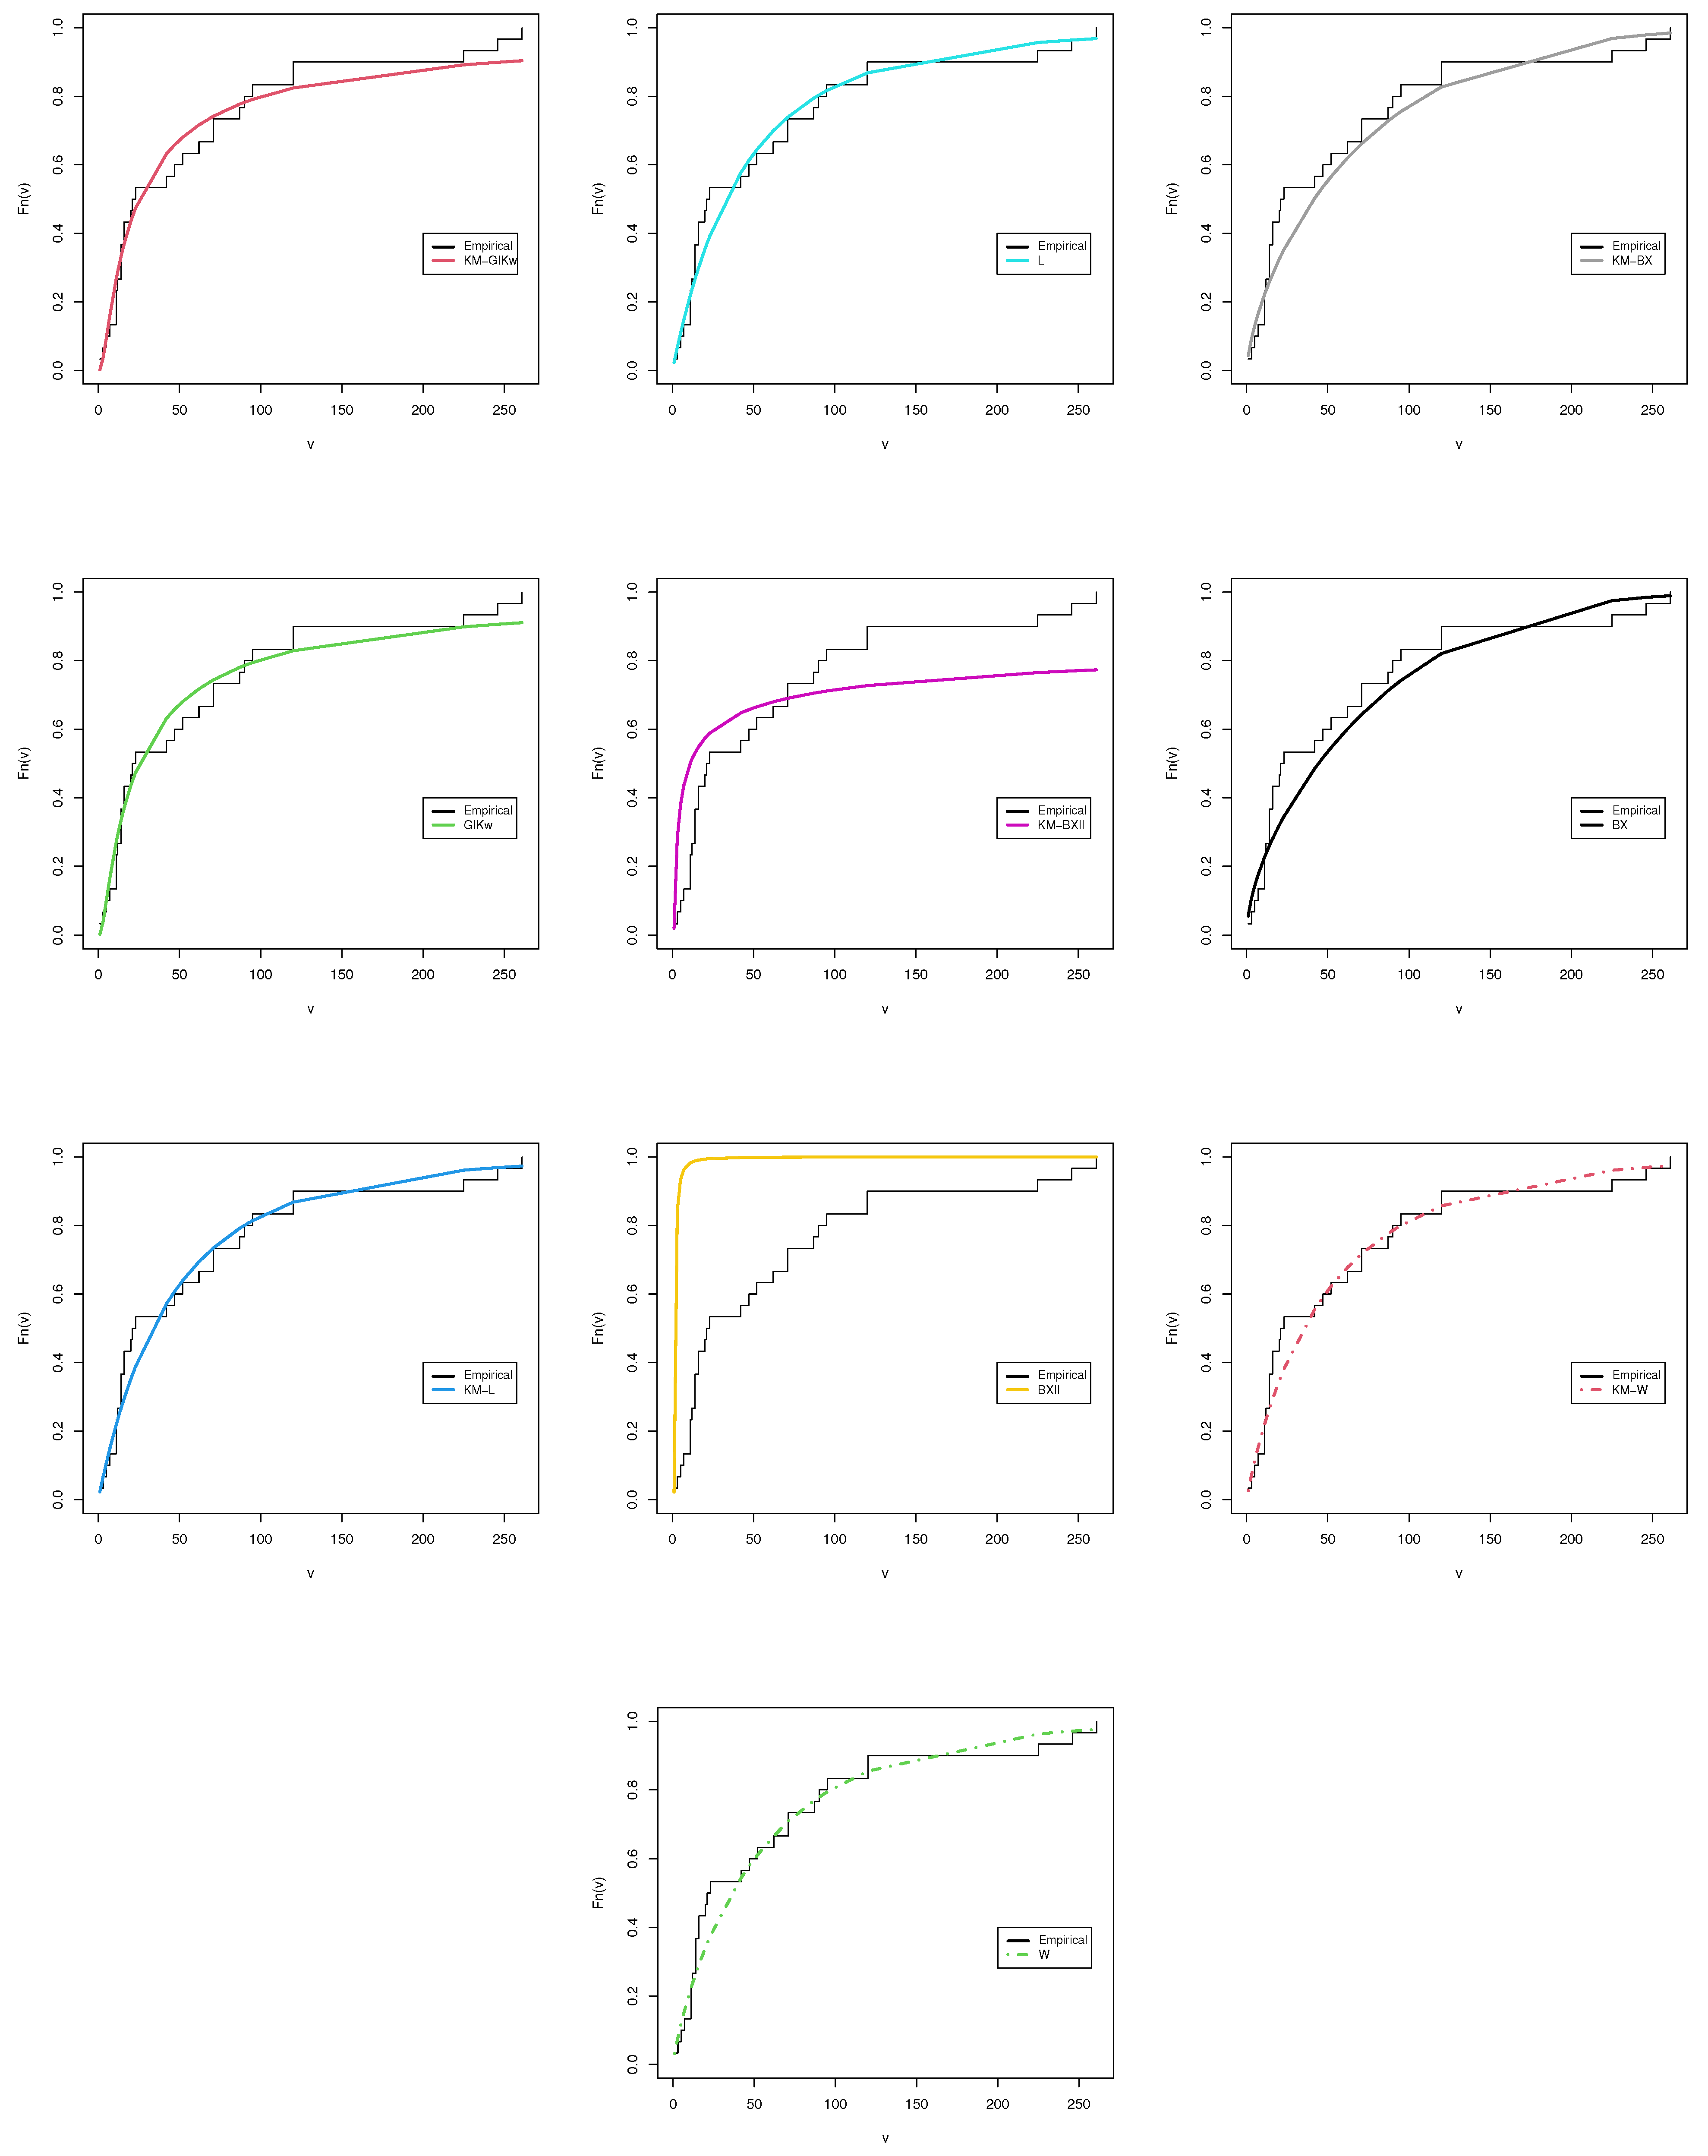
Figure 5.
ECDF plots of all the competitive models for the first dataset.
Figure 5.
ECDF plots of all the competitive models for the first dataset.
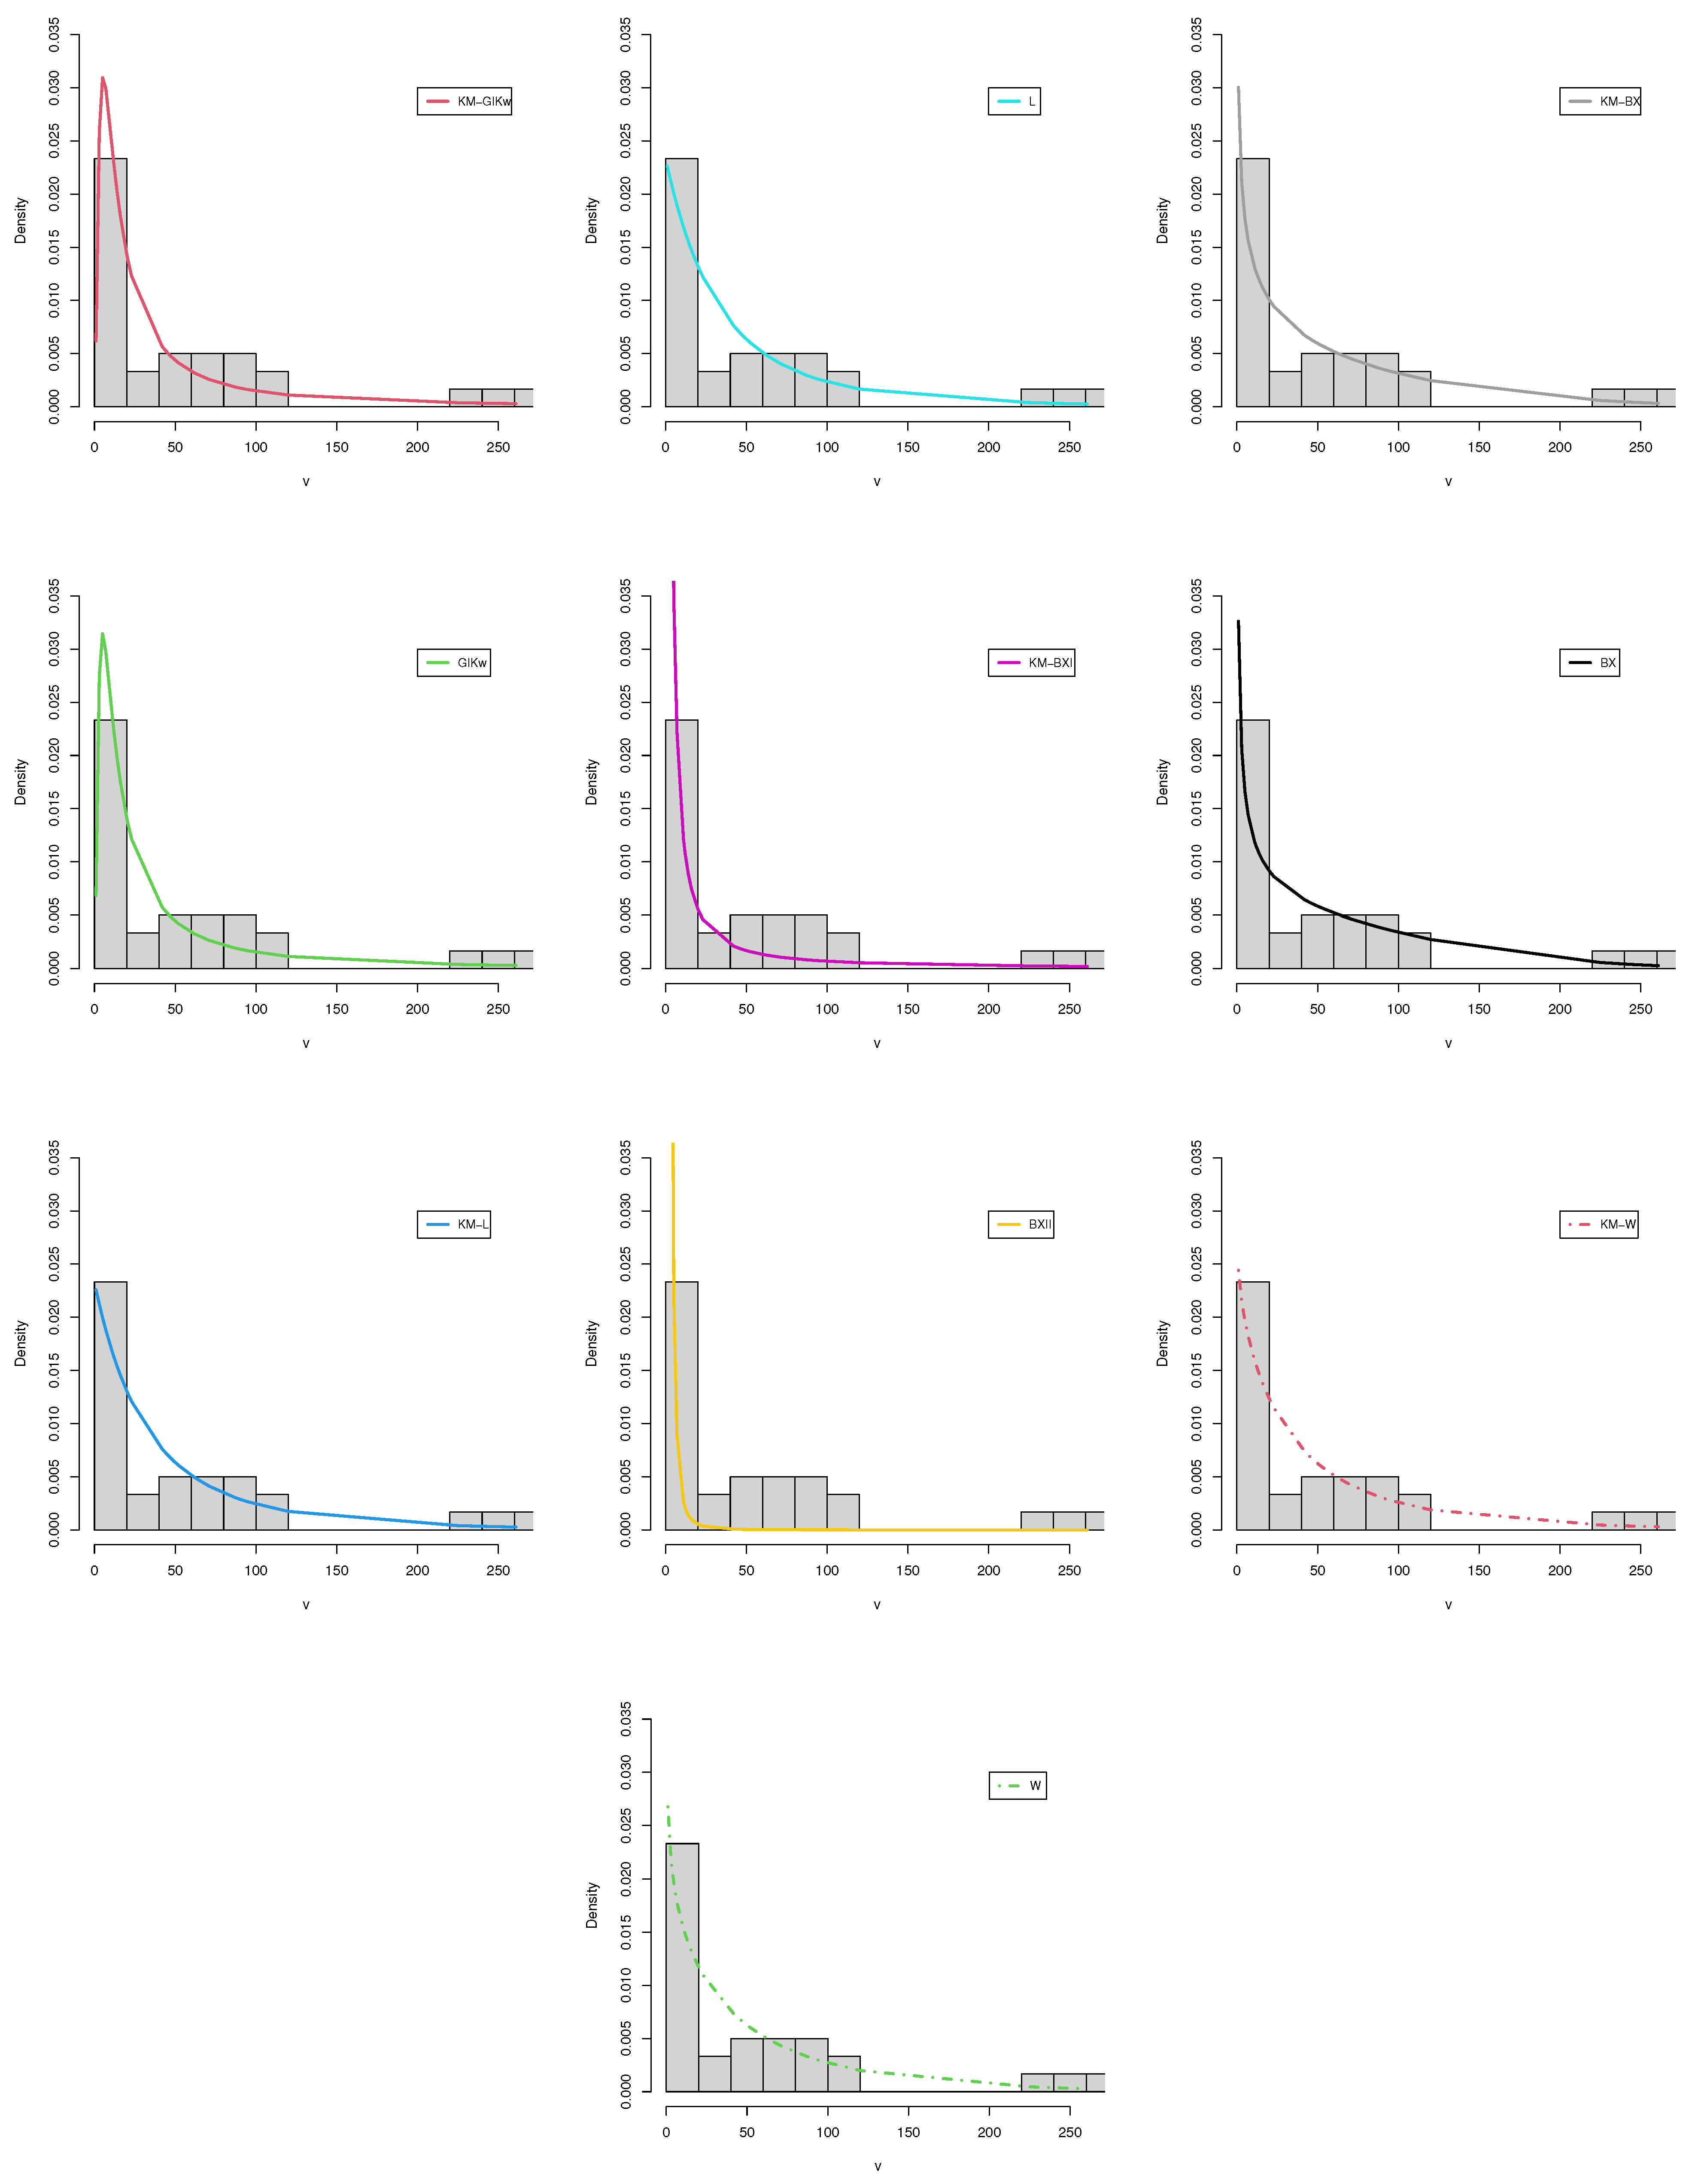
Figure 6.
EPDF plots of all the competitive models for the first dataset.
Figure 6.
EPDF plots of all the competitive models for the first dataset.
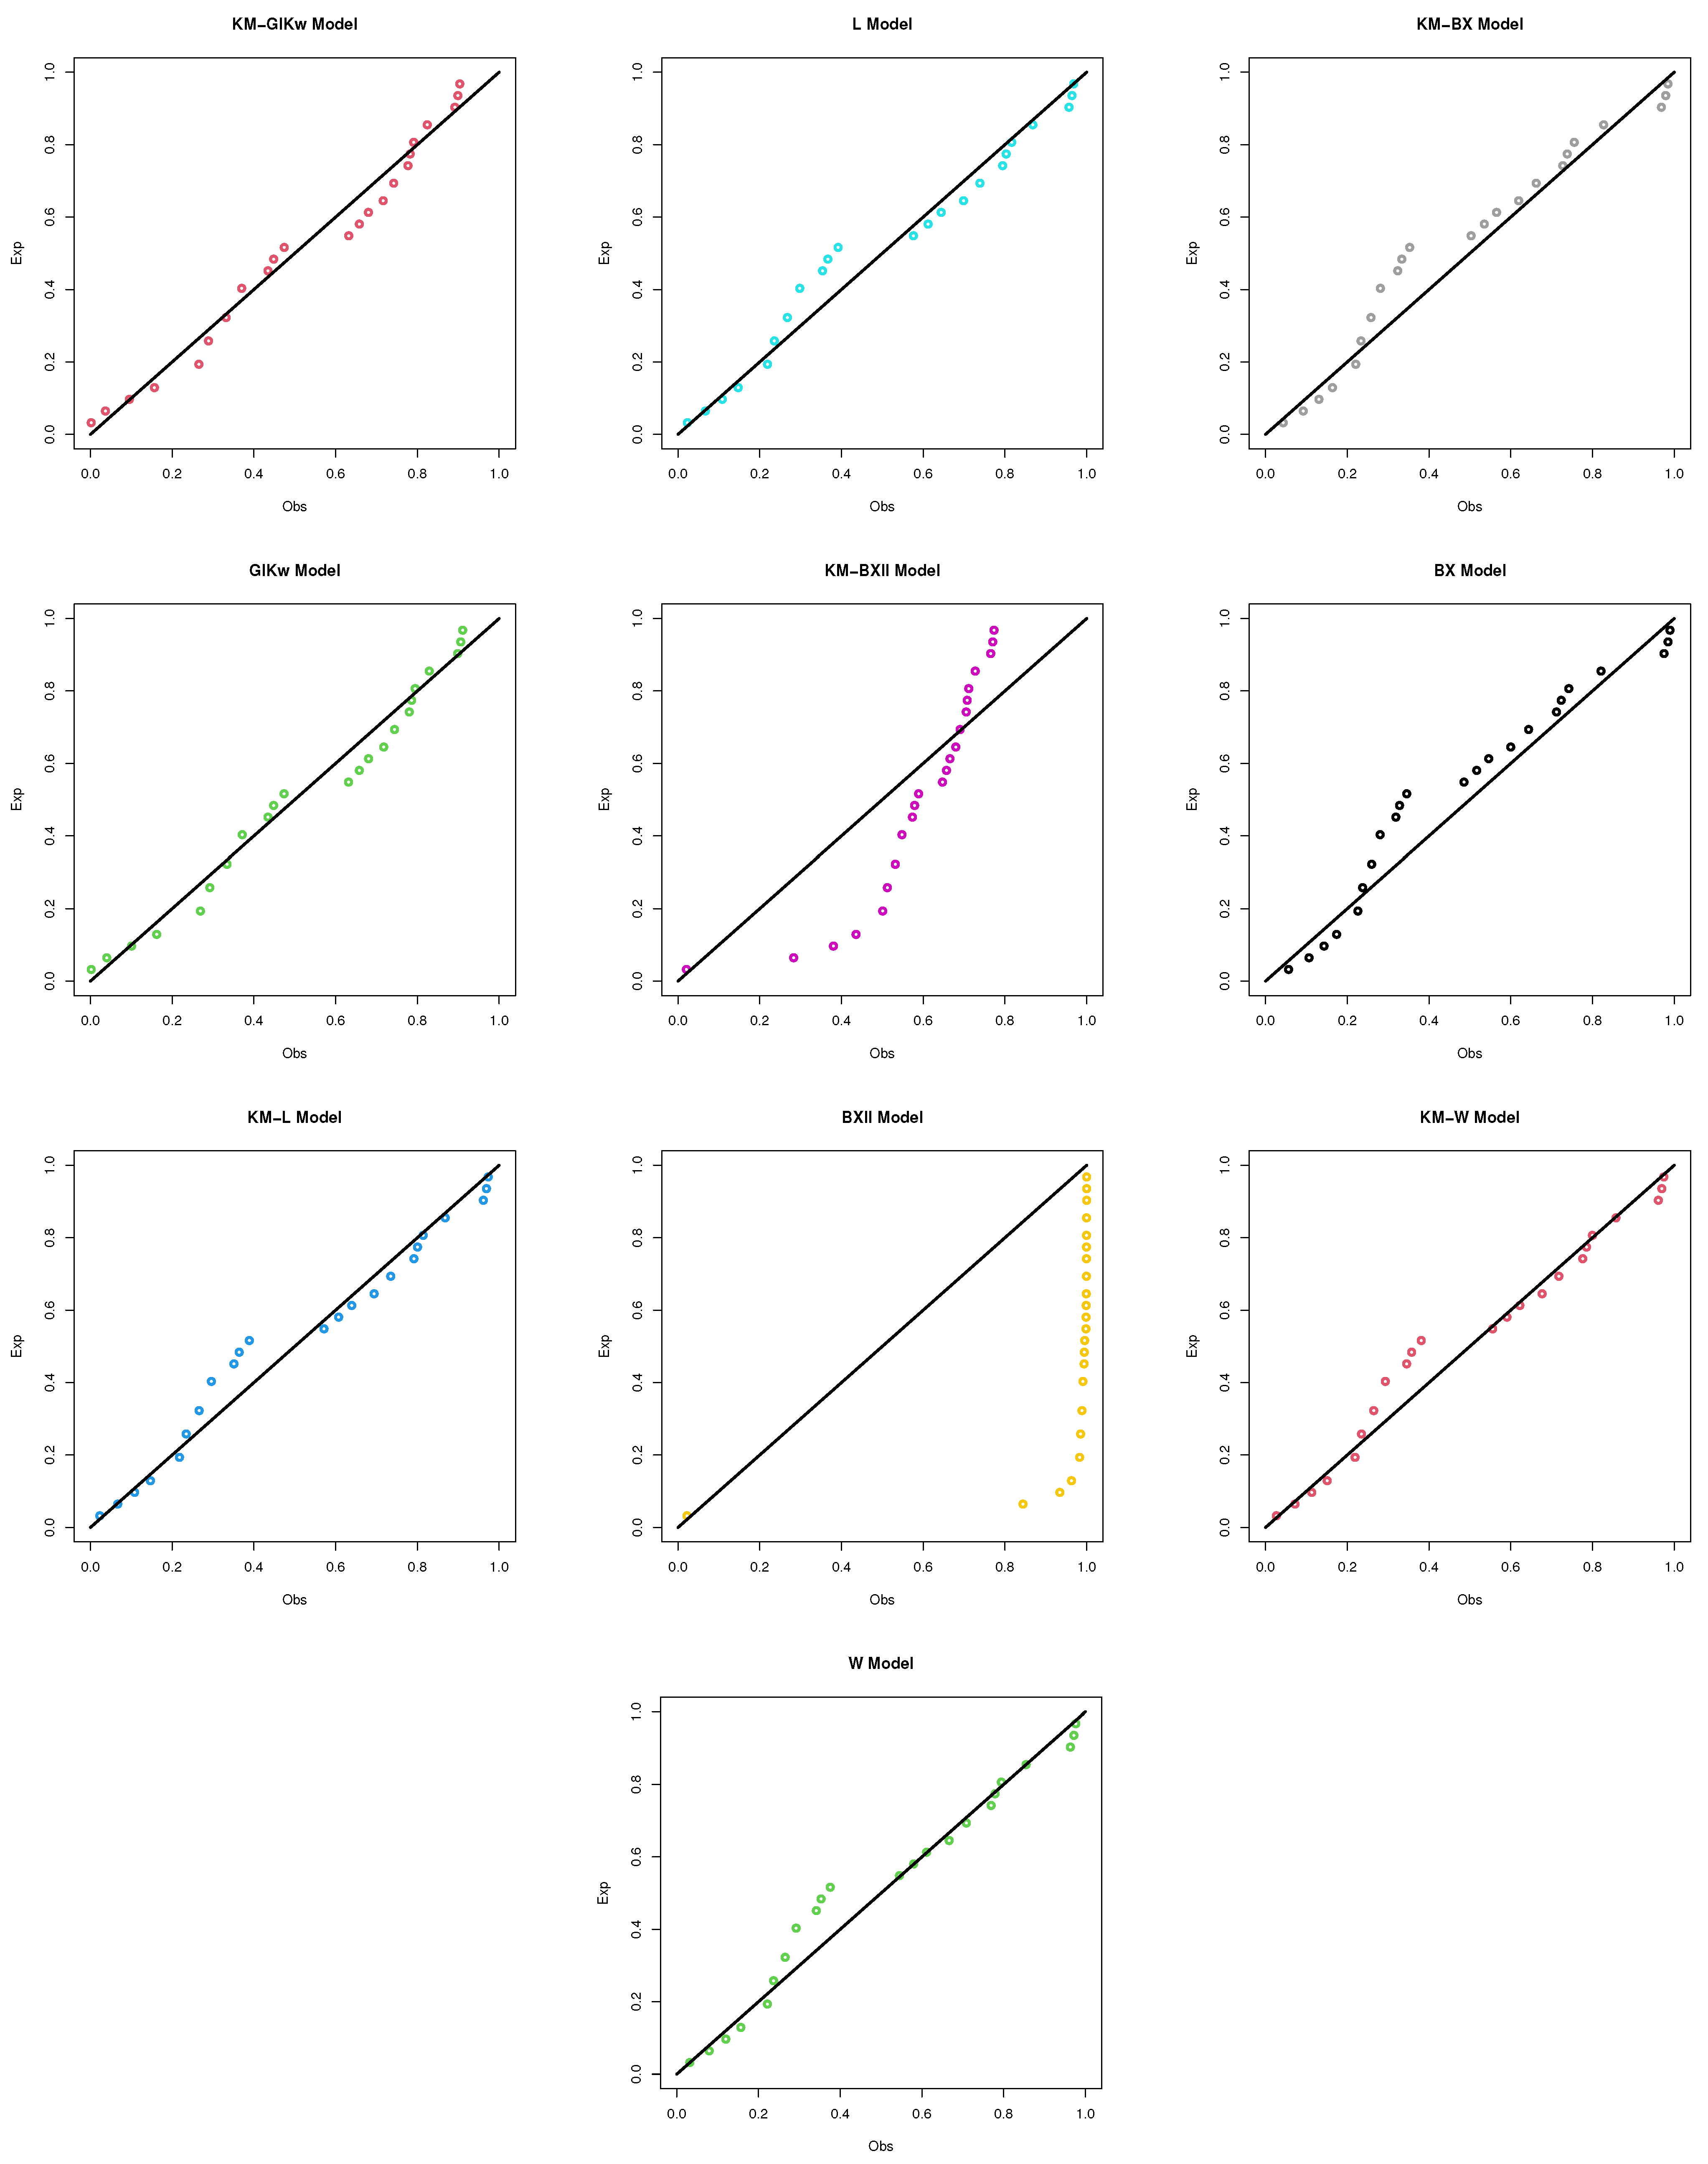
Figure 7.
PP plots of all the competitive models for the first dataset.
Figure 7.
PP plots of all the competitive models for the first dataset.
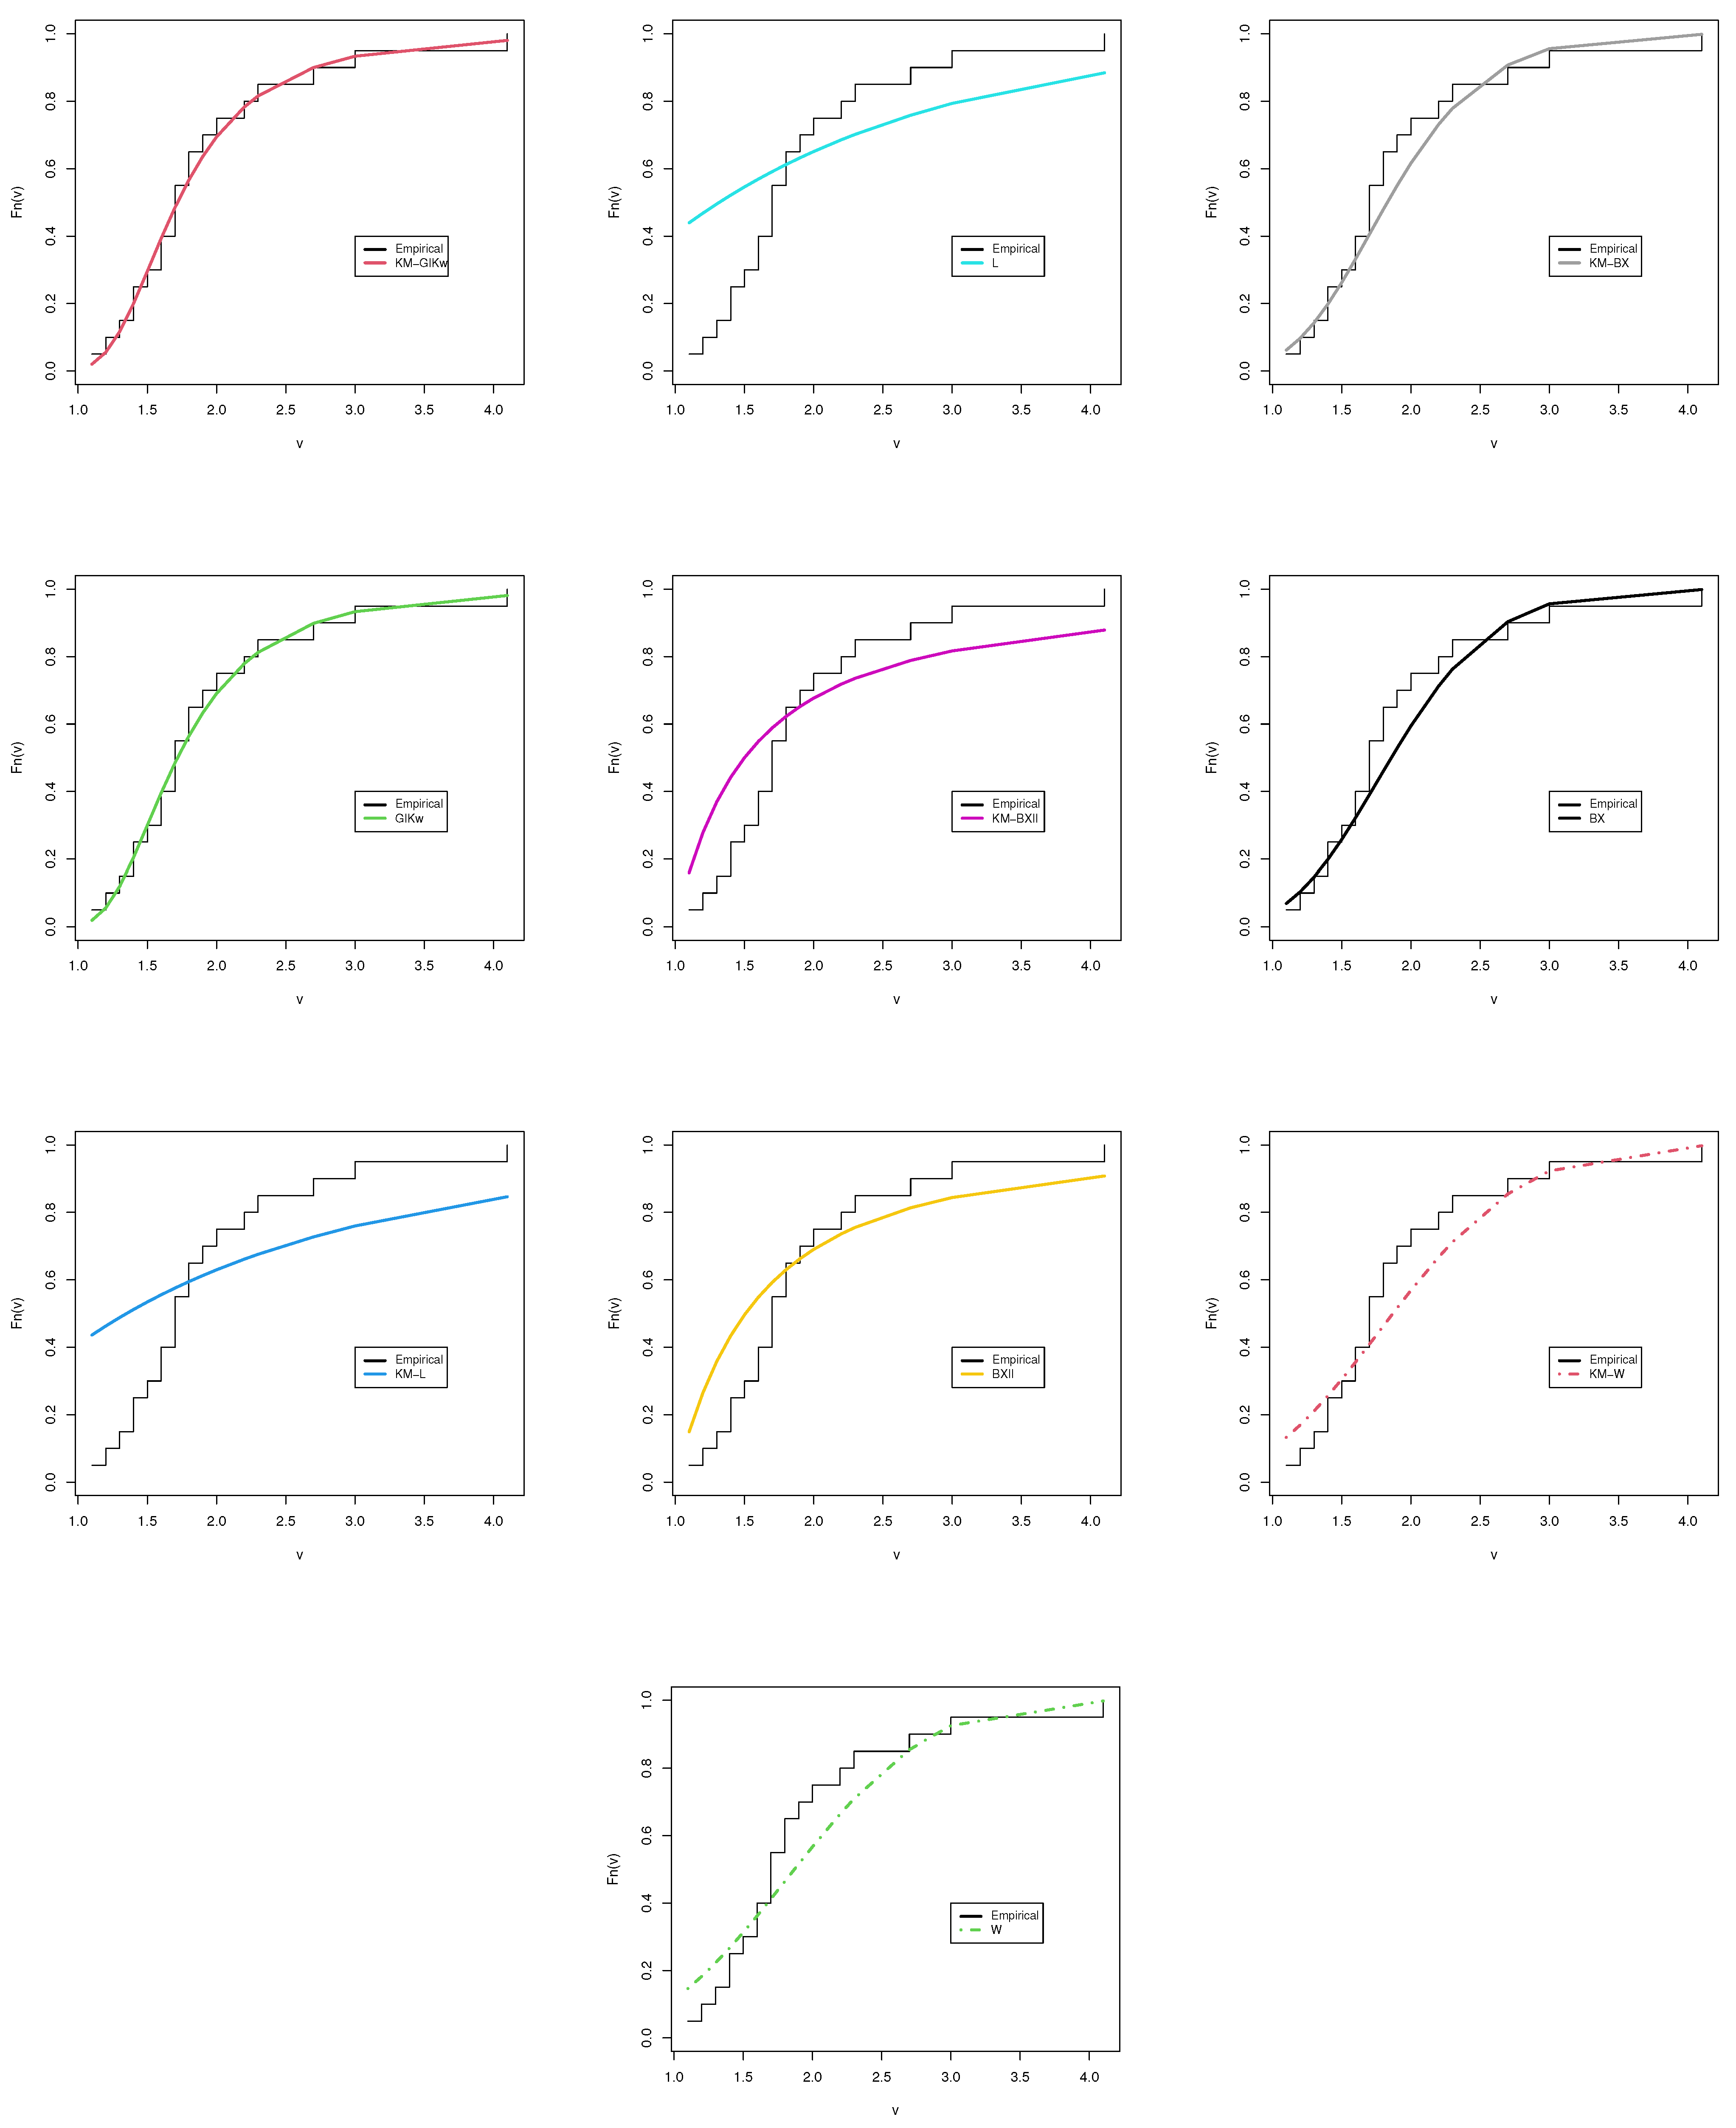
Figure 8.
ECDF plots of all the competitive models for the second dataset.
Figure 8.
ECDF plots of all the competitive models for the second dataset.
Figure 9.
EPDF plots of all the competitive models for the second dataset.
Figure 9.
EPDF plots of all the competitive models for the second dataset.
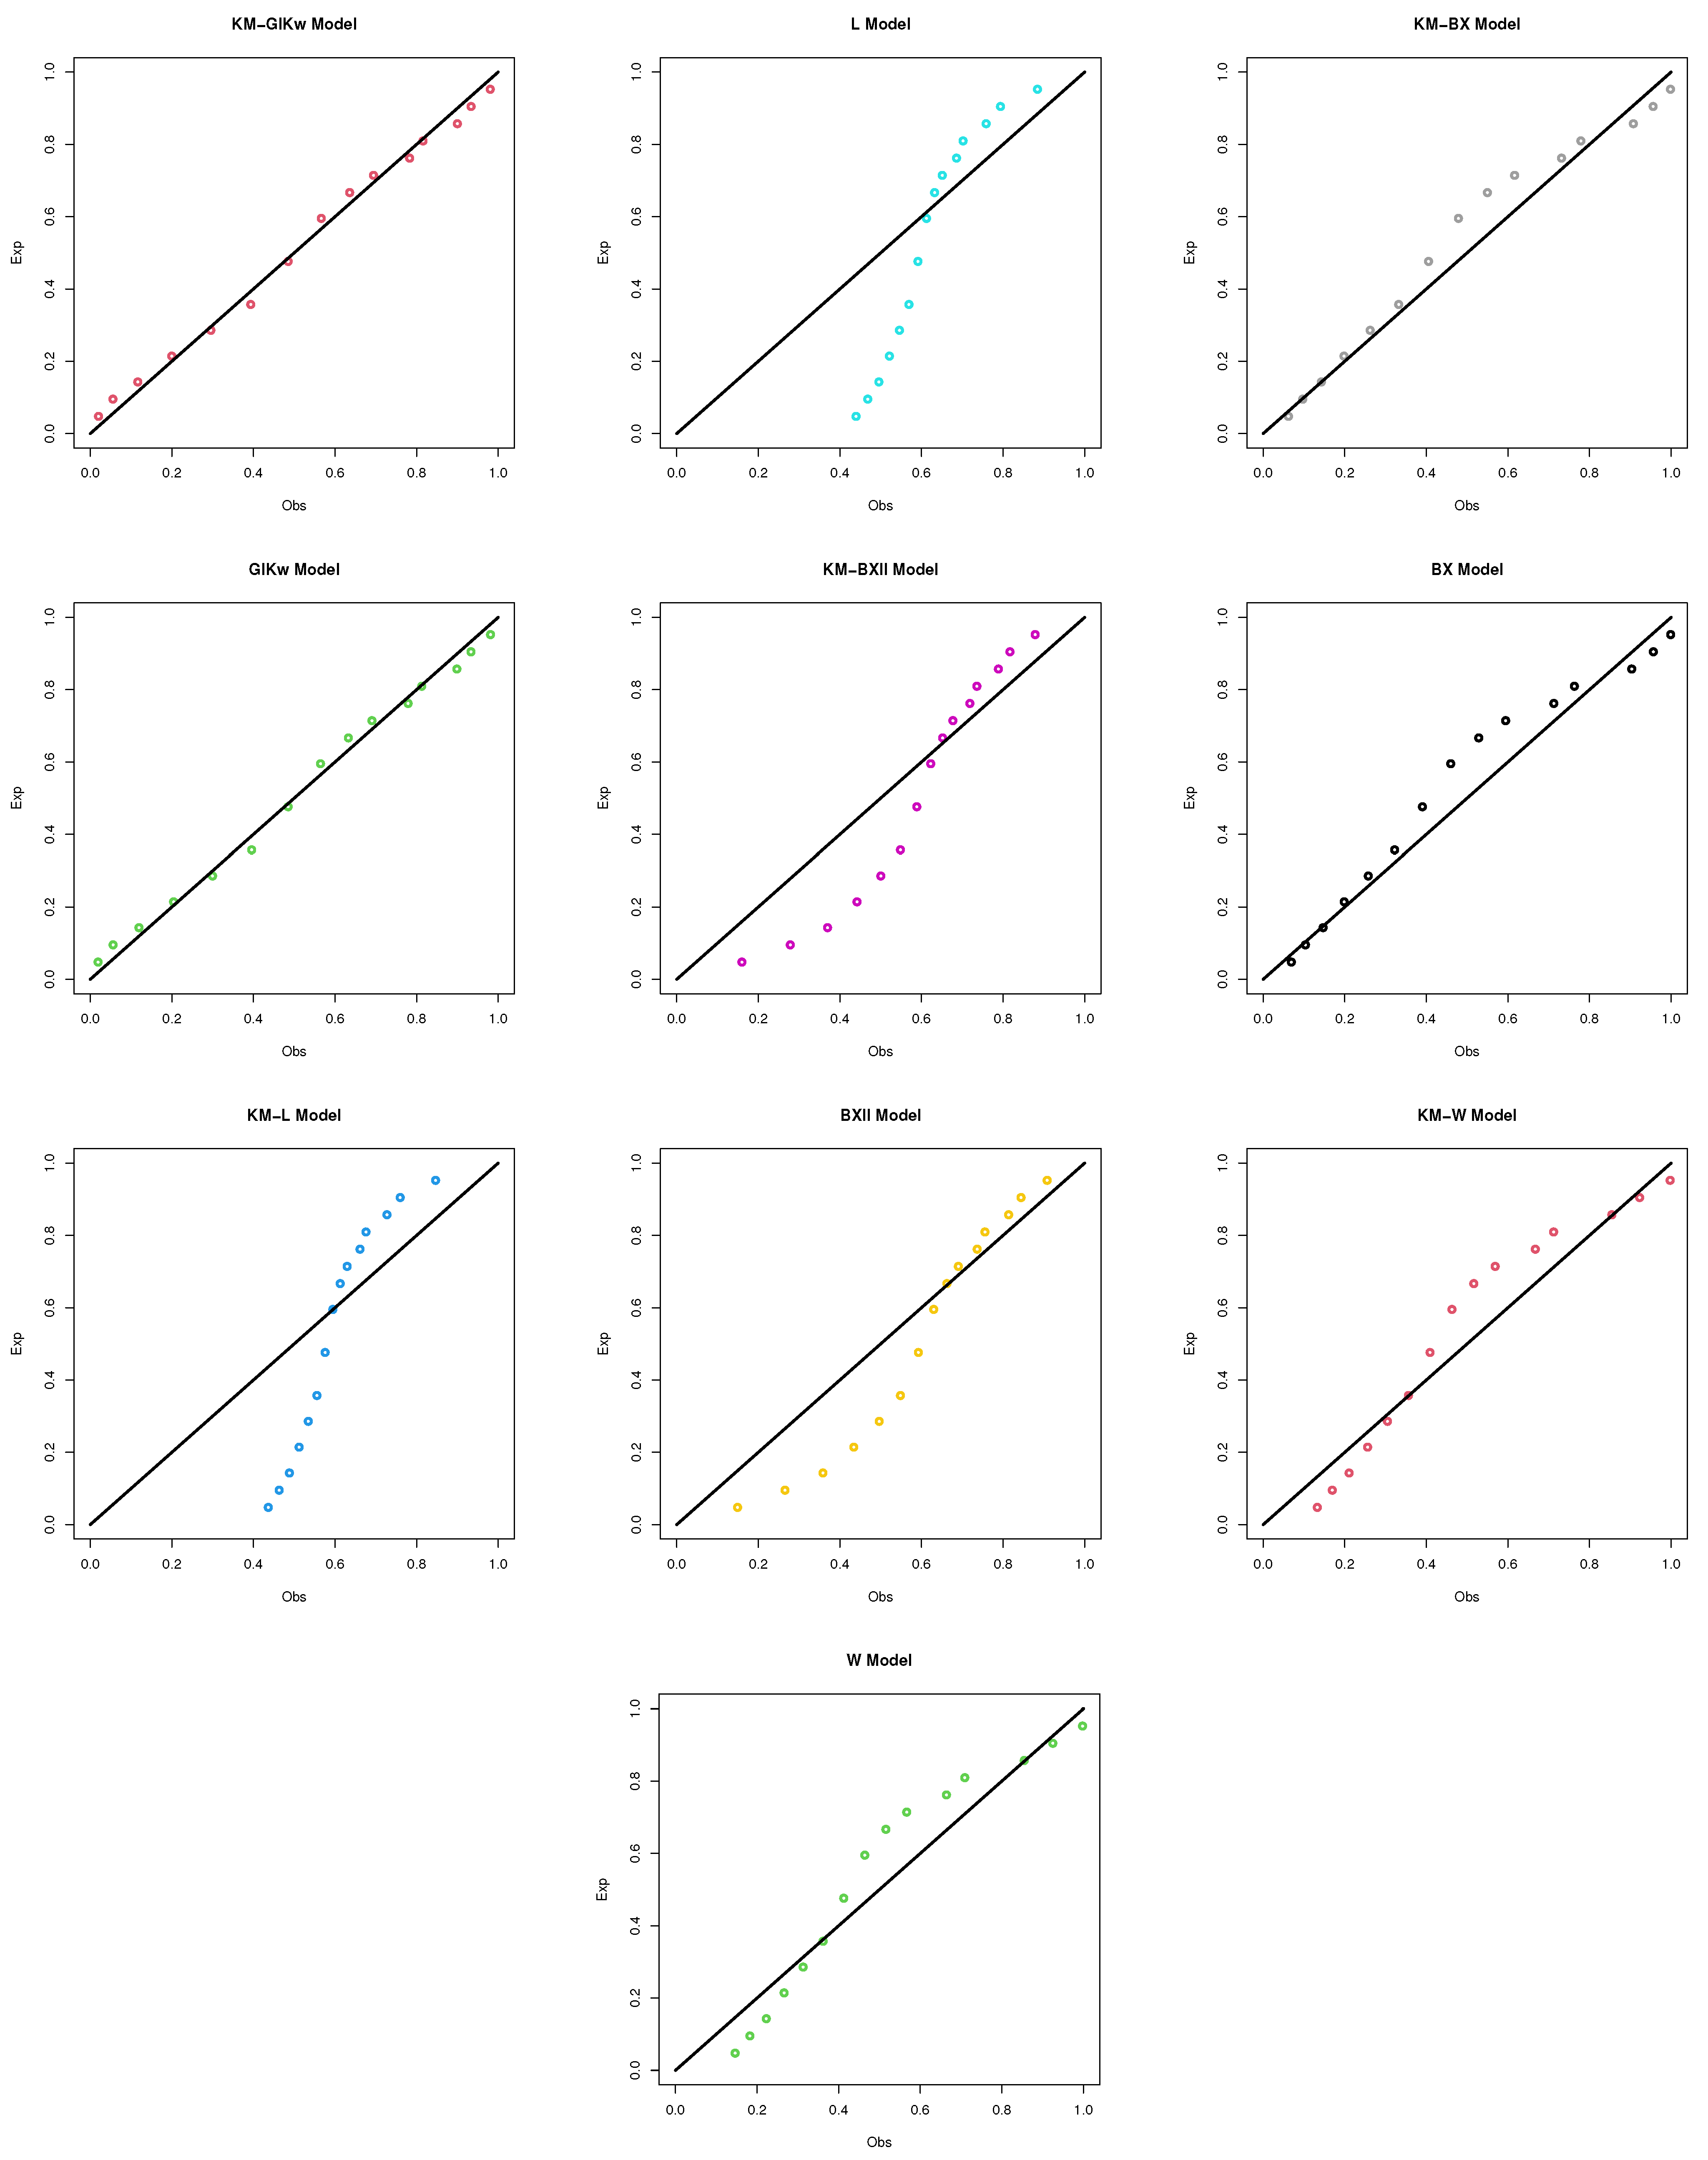
Figure 10.
PP plots of all the competitive models for the second dataset.
Figure 10.
PP plots of all the competitive models for the second dataset.
Table 1.
Numerical values of certain moments associated with the KM-GIKw distribution.
Table 1.
Numerical values of certain moments associated with the KM-GIKw distribution.
| | | | | | | var | SK | KU | CV | ID |
|---|
| 3.0 | 2.0 | 2.0 | 0.915 | 0.969 | 1.222 | 1.955 | 0.139 | 1.938 | 14.148 | 0.398 | 0.145 |
| 3.0 | 1.036 | 1.211 | 1.645 | 2.778 | 0.137 | 2.101 | 15.927 | 0.357 | 0.132 |
| 4.0 | 1.123 | 1.402 | 2.011 | 3.539 | 0.132 | 2.211 | 17.162 | 0.336 | 0.126 |
| 5.0 | 1.190 | 1.563 | 2.337 | 4.252 | 0.127 | 2.289 | 18.081 | 0.322 | 0.123 |
| 3.0 | 2.0 | 0.759 | 0.644 | 0.613 | 0.660 | 0.068 | 1.172 | 6.412 | 0.344 | 0.090 |
| 3.0 | 0.851 | 0.790 | 0.804 | 0.911 | 0.065 | 1.279 | 7.035 | 0.300 | 0.077 |
| 4.0 | 0.915 | 0.901 | 0.963 | 1.132 | 0.064 | 1.358 | 7.495 | 0.276 | 0.070 |
| 5.0 | 0.963 | 0.991 | 1.099 | 1.331 | 0.063 | 1.418 | 7.852 | 0.261 | 0.066 |
| 4.0 | 2.0 | 0.673 | 0.500 | 0.409 | 0.368 | 0.047 | 0.897 | 4.896 | 0.322 | 0.070 |
| 3.0 | 0.751 | 0.608 | 0.530 | 0.501 | 0.043 | 0.982 | 5.279 | 0.277 | 0.058 |
| 4.0 | 0.804 | 0.688 | 0.629 | 0.616 | 0.041 | 1.047 | 5.566 | 0.252 | 0.051 |
| 5.0 | 0.845 | 0.753 | 0.712 | 0.718 | 0.040 | 1.099 | 5.794 | 0.236 | 0.047 |
| 5.0 | 2.0 | 2.0 | 0.932 | 0.914 | 0.946 | 1.039 | 0.045 | 1.017 | 6.036 | 0.228 | 0.048 |
| 3.0 | 1.008 | 1.058 | 1.161 | 1.341 | 0.042 | 1.198 | 6.844 | 0.203 | 0.042 |
| 4.0 | 1.059 | 1.163 | 1.328 | 1.589 | 0.040 | 1.313 | 7.409 | 0.190 | 0.038 |
| 5.0 | 1.098 | 1.246 | 1.467 | 1.803 | 0.040 | 1.394 | 7.832 | 0.181 | 0.036 |
| 3.0 | 2.0 | 0.836 | 0.728 | 0.660 | 0.623 | 0.029 | 0.602 | 4.199 | 0.203 | 0.034 |
| 3.0 | 0.899 | 0.832 | 0.796 | 0.786 | 0.025 | 0.750 | 4.606 | 0.175 | 0.028 |
| 4.0 | 0.940 | 0.906 | 0.898 | 0.915 | 0.023 | 0.850 | 4.911 | 0.161 | 0.024 |
| 5.0 | 0.970 | 0.963 | 0.980 | 1.023 | 0.022 | 0.923 | 5.150 | 0.152 | 0.022 |
| 4.0 | 2.0 | 0.779 | 0.629 | 0.527 | 0.456 | 0.022 | 0.423 | 3.680 | 0.192 | 0.029 |
| 3.0 | 0.835 | 0.716 | 0.630 | 0.570 | 0.019 | 0.554 | 3.952 | 0.164 | 0.022 |
| 4.0 | 0.871 | 0.776 | 0.707 | 0.658 | 0.017 | 0.645 | 4.159 | 0.148 | 0.019 |
| 5.0 | 0.898 | 0.822 | 0.767 | 0.731 | 0.015 | 0.712 | 4.327 | 0.139 | 0.017 |
Table 2.
Some numerical values of the considered entropy measures.
Table 2.
Some numerical values of the considered entropy measures.
| | | = 0.5 | = 0.8 | = 1.2 |
|---|
| | | | | | | | | | | |
|---|
| 3.0 | 2.0 | 2.0 | 0.265 | 0.714 | 0.842 | 2.033 | 0.153 | 0.366 | 0.369 | 0.621 | 0.083 | 0.187 | 0.188 | 0.241 |
| 3.0 | 0.271 | 0.733 | 0.868 | 2.095 | 0.155 | 0.369 | 0.372 | 0.626 | 0.081 | 0.184 | 0.184 | 0.237 |
| 4.0 | 0.277 | 0.751 | 0.891 | 2.152 | 0.157 | 0.375 | 0.379 | 0.637 | 0.082 | 0.186 | 0.187 | 0.240 |
| 5.0 | 0.282 | 0.767 | 0.914 | 2.207 | 0.160 | 0.384 | 0.387 | 0.651 | 0.085 | 0.191 | 0.192 | 0.247 |
| 3.0 | 2.0 | 0.122 | 0.302 | 0.325 | 0.785 | 0.033 | 0.077 | 0.077 | 0.130 | −0.027 | −0.063 | −0.063 | −0.081 |
| 3.0 | 0.114 | 0.281 | 0.301 | 0.726 | 0.021 | 0.048 | 0.048 | 0.080 | −0.042 | −0.098 | −0.098 | −0.126 |
| 4.0 | 0.109 | 0.267 | 0.285 | 0.688 | 0.013 | 0.030 | 0.030 | 0.051 | −0.051 | −0.120 | −0.119 | −0.154 |
| 5.0 | 0.106 | 0.259 | 0.276 | 0.666 | 0.008 | 0.019 | 0.019 | 0.031 | −0.057 | −0.133 | −0.133 | −0.171 |
| 4.0 | 2.0 | 0.040 | 0.093 | 0.096 | 0.231 | −0.039 | −0.090 | −0.090 | −0.151 | −0.095 | −0.224 | −0.223 | −0.287 |
| 3.0 | 0.024 | 0.056 | 0.057 | 0.138 | −0.059 | −0.134 | −0.134 | −0.225 | −0.117 | −0.277 | −0.276 | −0.355 |
| 4.0 | 0.013 | 0.031 | 0.031 | 0.076 | −0.072 | −0.163 | −0.163 | −0.274 | −0.132 | −0.312 | −0.311 | −0.400 |
| 5.0 | 0.006 | 0.013 | 0.013 | 0.032 | −0.081 | −0.184 | −0.183 | −0.308 | −0.142 | −0.337 | −0.335 | −0.432 |
| 5.0 | 2.0 | 2.0 | 0.045 | 0.106 | 0.108 | 0.262 | −0.046 | −0.106 | −0.105 | −0.177 | −0.108 | −0.256 | −0.255 | −0.328 |
| 3.0 | 0.025 | 0.059 | 0.060 | 0.145 | −0.070 | −0.158 | −0.158 | −0.265 | −0.134 | −0.318 | −0.316 | −0.407 |
| 4.0 | 0.015 | 0.035 | 0.035 | 0.084 | −0.083 | −0.186 | −0.186 | −0.312 | −0.148 | −0.352 | −0.350 | −0.451 |
| 5.0 | 0.009 | 0.020 | 0.020 | 0.049 | −0.090 | −0.203 | −0.202 | −0.340 | −0.156 | −0.373 | −0.371 | −0.478 |
| 3.0 | 2.0 | −0.056 | −0.125 | −0.121 | −0.292 | −0.134 | −0.299 | −0.297 | −0.499 | −0.189 | −0.455 | −0.452 | −0.582 |
| 3.0 | −0.088 | −0.193 | −0.183 | −0.442 | −0.169 | −0.375 | −0.372 | −0.625 | −0.227 | −0.550 | −0.545 | −0.702 |
| 4.0 | −0.108 | −0.233 | −0.219 | −0.530 | −0.191 | −0.421 | −0.416 | −0.700 | −0.249 | −0.608 | −0.602 | −0.776 |
| 5.0 | −0.121 | −0.260 | −0.243 | −0.587 | −0.206 | −0.452 | −0.447 | −0.751 | −0.265 | −0.648 | −0.642 | −0.826 |
| 4.0 | 2.0 | −0.114 | −0.245 | −0.230 | −0.556 | −0.186 | −0.410 | −0.406 | −0.682 | −0.238 | −0.579 | −0.574 | −0.739 |
| 3.0 | −0.152 | −0.322 | −0.296 | −0.714 | −0.227 | −0.497 | −0.491 | −0.825 | −0.281 | −0.692 | −0.684 | −0.881 |
| 4.0 | −0.177 | −0.368 | −0.334 | −0.807 | −0.254 | −0.551 | −0.543 | −0.914 | −0.309 | −0.764 | −0.755 | −0.972 |
| 5.0 | −0.194 | −0.400 | −0.360 | −0.870 | −0.272 | −0.589 | −0.580 | −0.975 | −0.328 | −0.815 | −0.804 | −1.036 |
Table 3.
The ASP for the KM-GIKw distribution with parameters: for selected values of , c, and a.
Table 3.
The ASP for the KM-GIKw distribution with parameters: for selected values of , c, and a.
| c | | | | | | 1 |
|---|
| | | | | | | | | | | | | |
| 0.10 | 0 | | 1 | 1.0000 | 1 | 1.0000 | 1 | 1.0000 | 1 | 1.0000 | 1 | 1.0000 |
| | 2 | | 3 | 1.0000 | 3 | 1.0000 | 3 | 1.0000 | 3 | 1.0000 | 3 | 1.0000 |
| | 4 | | 7 | 0.9181 | 7 | 0.9048 | 6 | 0.9685 | 6 | 0.9652 | 6 | 0.9643 |
| | 10 | | 17 | 0.9351 | 17 | 0.9164 | 16 | 0.9399 | 16 | 0.9302 | 16 | 0.9274 |
| | 20 | | 36 | 0.9191 | 35 | 0.9174 | 34 | 0.9171 | 33 | 0.9298 | 33 | 0.9258 |
| 0.25 | 0 | | 1 | 1.0000 | 1 | 1.0000 | 1 | 1.0000 | 1 | 1.0000 | 1 | 1.0000 |
| | 2 | | 4 | 0.8977 | 4 | 0.8865 | 4 | 0.8743 | 4 | 0.8667 | 4 | 0.8647 |
| | 4 | | 8 | 0.8230 | 8 | 0.7986 | 8 | 0.7720 | 8 | 0.7553 | 8 | 0.7508 |
| | 10 | | 20 | 0.7712 | 19 | 0.8000 | 19 | 0.7573 | 18 | 0.8104 | 18 | 0.8044 |
| | 20 | | 40 | 0.7662 | 39 | 0.7526 | 37 | 0.7944 | 37 | 0.7586 | 36 | 0.8036 |
| 0.50 | 0 | | 2 | 0.5323 | 2 | 0.5159 | 1 | 1.0000 | 1 | 1.0000 | 1 | 1.0000 |
| | 2 | | 6 | 0.5604 | 6 | 0.5297 | 5 | 0.6862 | 5 | 0.6711 | 5 | 0.6671 |
| | 4 | | 10 | 0.5791 | 10 | 0.5390 | 9 | 0.6348 | 9 | 0.6128 | 9 | 0.6070 |
| | 10 | | 23 | 0.5377 | 22 | 0.5585 | 21 | 0.5849 | 21 | 0.5495 | 21 | 0.5402 |
| | 20 | | 44 | 0.5486 | 43 | 0.5211 | 41 | 0.5582 | 41 | 0.5079 | 40 | 0.5599 |
| 0.75 | 0 | | 3 | 0.2834 | 3 | 0.2661 | 2 | 0.4991 | 2 | 0.4892 | 2 | 0.4866 |
| | 2 | | 8 | 0.2829 | 8 | 0.2534 | 7 | 0.3421 | 7 | 0.3237 | 7 | 0.3189 |
| | 4 | | 13 | 0.2623 | 12 | 0.3113 | 12 | 0.2724 | 12 | 0.2505 | 11 | 0.3444 |
| | 10 | | 27 | 0.2583 | 26 | 0.2614 | 25 | 0.2677 | 24 | 0.3013 | 24 | 0.2926 |
| | 20 | | 49 | 0.2875 | 48 | 0.2558 | 46 | 0.2717 | 45 | 0.2755 | 45 | 0.2641 |
| 0.99 | 0 | | 8 | 0.0121 | 7 | 0.0188 | 7 | 0.0155 | 7 | 0.0137 | 7 | 0.0133 |
| | 2 | | 15 | 0.0123 | 14 | 0.0150 | 14 | 0.0110 | 13 | 0.0160 | 13 | 0.0153 |
| | 4 | | 21 | 0.0128 | 20 | 0.0137 | 19 | 0.0152 | 19 | 0.0122 | 19 | 0.0115 |
| | 10 | | 38 | 0.0113 | 36 | 0.0136 | 35 | 0.0118 | 34 | 0.0128 | 34 | 0.0119 |
| | 20 | | 64 | 0.0111 | 61 | 0.0130 | 59 | 0.0119 | 58 | 0.0109 | 57 | 0.0134 |
Table 4.
The ASP for the KM-GIKw distribution with parameters for selected values of , c, and a.
Table 4.
The ASP for the KM-GIKw distribution with parameters for selected values of , c, and a.
| c | | | | | | 1 |
|---|
| | | | | | | | | | | | | |
| 0.10 | 0 | | 1 | 1.0000 | 1 | 1.0000 | 1 | 1.0000 | 1 | 1.0000 | 1 | 1.0000 |
| | 2 | | 4 | 0.9481 | 4 | 0.9278 | 4 | 0.9005 | 3 | 1.0000 | 3 | 1.0000 |
| | 4 | | 8 | 0.9276 | 7 | 0.9509 | 7 | 0.9213 | 6 | 0.9711 | 6 | 0.9687 |
| | 10 | | 21 | 0.9183 | 19 | 0.9235 | 17 | 0.9393 | 17 | 0.9057 | 16 | 0.9407 |
| | 20 | | 44 | 0.9189 | 40 | 0.9159 | 36 | 0.9265 | 35 | 0.9017 | 34 | 0.9186 |
| 0.25 | 0 | | 1 | 1.0000 | 1 | 1.0000 | 1 | 1.0000 | 1 | 1.0000 | 1 | 1.0000 |
| | 2 | | 5 | 0.8505 | 5 | 0.8013 | 4 | 0.9005 | 4 | 0.8806 | 4 | 0.8750 |
| | 4 | | 10 | 0.7873 | 9 | 0.7998 | 8 | 0.8290 | 8 | 0.7858 | 8 | 0.7734 |
| | 10 | | 24 | 0.7978 | 22 | 0.7824 | 20 | 0.7825 | 19 | 0.7796 | 19 | 0.7596 |
| | 20 | | 49 | 0.7823 | 44 | 0.7895 | 40 | 0.7823 | 38 | 0.7734 | 37 | 0.7974 |
| 0.50 | 0 | | 2 | 0.6270 | 2 | 0.5835 | 2 | 0.5366 | 2 | 0.5076 | 1 | 1.0000 |
| | 2 | | 7 | 0.6003 | 7 | 0.5102 | 6 | 0.5683 | 6 | 0.5143 | 5 | 0.6874 |
| | 4 | | 13 | 0.5163 | 11 | 0.5913 | 10 | 0.5894 | 10 | 0.5188 | 9 | 0.6366 |
| | 10 | | 29 | 0.5156 | 26 | 0.5189 | 23 | 0.5537 | 22 | 0.5282 | 21 | 0.5880 |
| | 20 | | 56 | 0.5034 | 50 | 0.5141 | 45 | 0.5147 | 42 | 0.5392 | 41 | 0.5625 |
| 0.75 | 0 | | 3 | 0.3932 | 3 | 0.3405 | 3 | 0.2879 | 3 | 0.2577 | 2 | 0.5000 |
| | 2 | | 10 | 0.2861 | 9 | 0.2820 | 8 | 0.2908 | 7 | 0.3582 | 7 | 0.3437 |
| | 4 | | 16 | 0.2857 | 14 | 0.3088 | 13 | 0.2721 | 12 | 0.2919 | 12 | 0.2743 |
| | 10 | | 34 | 0.2609 | 30 | 0.2790 | 27 | 0.2727 | 25 | 0.2962 | 25 | 0.2705 |
| | 20 | | 62 | 0.2783 | 56 | 0.2569 | 50 | 0.2645 | 47 | 0.2635 | 46 | 0.2756 |
| 0.99 | 0 | | 10 | 0.0150 | 9 | 0.0134 | 8 | 0.0128 | 7 | 0.0171 | 7 | 0.0156 |
| | 2 | | 20 | 0.0103 | 17 | 0.0133 | 15 | 0.0133 | 14 | 0.0129 | 14 | 0.0112 |
| | 4 | | 27 | 0.0137 | 24 | 0.0129 | 21 | 0.0141 | 20 | 0.0114 | 19 | 0.0154 |
| | 10 | | 49 | 0.0113 | 43 | 0.0125 | 38 | 0.0129 | 36 | 0.0106 | 35 | 0.0121 |
| | 20 | | 82 | 0.0112 | 73 | 0.0105 | 65 | 0.0101 | 60 | 0.0125 | 59 | 0.0124 |
Table 5.
The ASP for the KM-GIKw distribution with parameters for selected values of , c, and a.
Table 5.
The ASP for the KM-GIKw distribution with parameters for selected values of , c, and a.
| c | | | | | | 1 |
|---|
| | | | | | | | | | | | | |
| 0.10 | 0 | | 1 | 1.0000 | 1 | 1.0000 | 1 | 1.0000 | 1 | 1.0000 | 1 | 1.0000 |
| | 2 | | 4 | 0.9215 | 4 | 0.9059 | 3 | 1.0000 | 3 | 1.0000 | 3 | 1.0000 |
| | 4 | | 7 | 0.9445 | 7 | 0.9275 | 7 | 0.9074 | 6 | 0.9699 | 6 | 0.9687 |
| | 10 | | 19 | 0.9076 | 18 | 0.9111 | 17 | 0.9202 | 17 | 0.9005 | 16 | 0.9408 |
| | 20 | | 39 | 0.9166 | 37 | 0.9161 | 35 | 0.9227 | 34 | 0.9251 | 34 | 0.9186 |
| 0.25 | 0 | | 1 | 1.0000 | 1 | 1.0000 | 1 | 1.0000 | 1 | 1.0000 | 1 | 1.0000 |
| | 2 | | 5 | 0.7868 | 5 | 0.7520 | 4 | 0.8887 | 4 | 0.8779 | 4 | 0.8750 |
| | 4 | | 9 | 0.7797 | 8 | 0.8407 | 8 | 0.8033 | 8 | 0.7798 | 8 | 0.7734 |
| | 10 | | 21 | 0.8097 | 20 | 0.8043 | 19 | 0.8073 | 19 | 0.7699 | 19 | 0.7597 |
| | 20 | | 43 | 0.7844 | 41 | 0.7686 | 39 | 0.7646 | 38 | 0.7593 | 37 | 0.7975 |
| 0.50 | 0 | | 2 | 0.5718 | 2 | 0.5452 | 2 | 0.5190 | 2 | 0.5039 | 1 | 1.0000 |
| | 2 | | 6 | 0.6328 | 6 | 0.5843 | 6 | 0.5355 | 6 | 0.5073 | 5 | 0.6875 |
| | 4 | | 11 | 0.5611 | 10 | 0.6100 | 10 | 0.5466 | 10 | 0.5095 | 9 | 0.6367 |
| | 10 | | 25 | 0.5406 | 24 | 0.5091 | 22 | 0.5698 | 22 | 0.5144 | 21 | 0.5881 |
| | 20 | | 48 | 0.5469 | 46 | 0.5058 | 43 | 0.5371 | 42 | 0.5199 | 41 | 0.5627 |
| 0.75 | 0 | | 3 | 0.3270 | 3 | 0.2972 | 3 | 0.2693 | 3 | 0.2539 | 2 | 0.5000 |
| | 2 | | 9 | 0.2594 | 8 | 0.3071 | 8 | 0.2588 | 7 | 0.3511 | 7 | 0.3437 |
| | 4 | | 14 | 0.2791 | 13 | 0.2926 | 12 | 0.3187 | 12 | 0.2832 | 12 | 0.2744 |
| | 10 | | 29 | 0.2874 | 27 | 0.3028 | 26 | 0.2716 | 25 | 0.2835 | 25 | 0.2706 |
| | 20 | | 54 | 0.2730 | 51 | 0.2633 | 48 | 0.2696 | 46 | 0.2935 | 46 | 0.2757 |
| 0.99 | 0 | | 9 | 0.0114 | 8 | 0.0143 | 8 | 0.0101 | 7 | 0.0164 | 7 | 0.0156 |
| | 2 | | 17 | 0.0105 | 15 | 0.0156 | 14 | 0.0159 | 14 | 0.0121 | 14 | 0.0112 |
| | 4 | | 23 | 0.0141 | 22 | 0.0113 | 20 | 0.0147 | 20 | 0.0105 | 19 | 0.0154 |
| | 10 | | 42 | 0.0113 | 39 | 0.0122 | 37 | 0.0105 | 35 | 0.0136 | 35 | 0.0122 |
| | 20 | | 71 | 0.0100 | 66 | 0.0111 | 62 | 0.0111 | 60 | 0.0107 | 59 | 0.0124 |
Table 6.
The ASP for the KM-GIKw distribution with parameters for selected values of , c, and a.
Table 6.
The ASP for the KM-GIKw distribution with parameters for selected values of , c, and a.
| c | | | | | | 1 |
|---|
| | | | | | | | | | | | | |
| 0.10 | 0 | | 1 | 1.0000 | 1 | 1.0000 | 1 | 1.0000 | 1 | 1.0000 | 1 | 1.0000 |
| | 2 | | 5 | 0.9280 | 4 | 0.9527 | 4 | 0.9135 | 3 | 1.0000 | 3 | 1.0000 |
| | 4 | | 10 | 0.9197 | 8 | 0.9362 | 7 | 0.9359 | 7 | 0.9012 | 6 | 0.9688 |
| | 10 | | 27 | 0.9094 | 22 | 0.9047 | 18 | 0.9269 | 17 | 0.9111 | 16 | 0.9408 |
| | 20 | | 57 | 0.9113 | 46 | 0.9037 | 38 | 0.9141 | 35 | 0.9096 | 34 | 0.9186 |
| 0.25 | 0 | | 1 | 1.0000 | 1 | 1.0000 | 1 | 1.0000 | 1 | 1.0000 | 1 | 1.0000 |
| | 2 | | 7 | 0.7735 | 5 | 0.8621 | 5 | 0.7688 | 4 | 0.8836 | 4 | 0.8750 |
| | 4 | | 13 | 0.7649 | 10 | 0.8080 | 9 | 0.7543 | 8 | 0.7922 | 8 | 0.7734 |
| | 10 | | 32 | 0.7554 | 25 | 0.7824 | 21 | 0.7727 | 19 | 0.7898 | 19 | 0.7597 |
| | 20 | | 64 | 0.7702 | 51 | 0.7634 | 42 | 0.7724 | 38 | 0.7881 | 37 | 0.7975 |
| 0.50 | 0 | | 3 | 0.5128 | 2 | 0.6383 | 2 | 0.5578 | 2 | 0.5117 | 2 | 0.5000 |
| | 2 | | 10 | 0.5063 | 8 | 0.5056 | 6 | 0.6074 | 6 | 0.5219 | 6 | 0.5000 |
| | 4 | | 17 | 0.5071 | 13 | 0.5492 | 11 | 0.5246 | 10 | 0.5287 | 10 | 0.5000 |
| | 10 | | 38 | 0.5099 | 30 | 0.5090 | 24 | 0.5579 | 22 | 0.5432 | 22 | 0.5000 |
| | 20 | | 73 | 0.5136 | 57 | 0.5324 | 47 | 0.5209 | 42 | 0.5599 | 42 | 0.5000 |
| 0.75 | 0 | | 5 | 0.2629 | 4 | 0.2601 | 3 | 0.3111 | 3 | 0.2618 | 3 | 0.2500 |
| | 2 | | 13 | 0.2933 | 10 | 0.3107 | 8 | 0.3317 | 7 | 0.3659 | 7 | 0.3438 |
| | 4 | | 21 | 0.2885 | 17 | 0.2568 | 13 | 0.3239 | 12 | 0.3014 | 12 | 0.2744 |
| | 10 | | 45 | 0.2573 | 35 | 0.2642 | 28 | 0.2906 | 25 | 0.3102 | 25 | 0.2706 |
| | 20 | | 83 | 0.2511 | 64 | 0.2773 | 52 | 0.2827 | 47 | 0.2819 | 46 | 0.2757 |
| 0.99 | 0 | | 14 | 0.0130 | 11 | 0.0112 | 8 | 0.0168 | 7 | 0.0179 | 7 | 0.0156 |
| | 2 | | 27 | 0.0106 | 20 | 0.0132 | 16 | 0.0124 | 14 | 0.0139 | 14 | 0.0112 |
| | 4 | | 37 | 0.0121 | 28 | 0.0135 | 23 | 0.0101 | 20 | 0.0125 | 19 | 0.0154 |
| | 10 | | 66 | 0.0110 | 51 | 0.0104 | 40 | 0.0132 | 36 | 0.0120 | 35 | 0.0122 |
| | 20 | | 110 | 0.0109 | 85 | 0.0107 | 68 | 0.0114 | 61 | 0.0110 | 59 | 0.0124 |
Table 7.
The ASP for the KM-GIKw distribution with parameters for selected values of , c, and a.
Table 7.
The ASP for the KM-GIKw distribution with parameters for selected values of , c, and a.
| c | | | | | | 1 |
|---|
| | | | | | | | | | | | | |
| 0.10 | 0 | | 1 | 1.0000 | 1 | 1.0000 | 1 | 1.0000 | 1 | 1.0000 | 1 | 1.0000 |
| | 2 | | 6 | 0.9124 | 5 | 0.9012 | 4 | 0.9261 | 3 | 1.0000 | 3 | 1.0000 |
| | 4 | | 12 | 0.9090 | 9 | 0.9259 | 7 | 0.9492 | 7 | 0.9056 | 6 | 0.9688 |
| | 10 | | 32 | 0.9112 | 24 | 0.9185 | 19 | 0.9194 | 17 | 0.9175 | 16 | 0.9408 |
| | 20 | | 69 | 0.9021 | 51 | 0.9141 | 40 | 0.9093 | 35 | 0.9190 | 34 | 0.9186 |
| 0.25 | 0 | | 2 | 0.7657 | 1 | 1.0000 | 1 | 1.0000 | 1 | 1.0000 | 1 | 1.0000 |
| | 2 | | 8 | 0.7883 | 6 | 0.8108 | 5 | 0.7974 | 4 | 0.8872 | 4 | 0.8750 |
| | 4 | | 15 | 0.7861 | 11 | 0.8152 | 9 | 0.7944 | 8 | 0.8000 | 8 | 0.7734 |
| | 10 | | 38 | 0.7666 | 28 | 0.7846 | 22 | 0.7734 | 19 | 0.8021 | 19 | 0.7597 |
| | 20 | | 78 | 0.7503 | 57 | 0.7770 | 44 | 0.7768 | 39 | 0.7561 | 37 | 0.7975 |
| 0.50 | 0 | | 3 | 0.5863 | 2 | 0.6809 | 2 | 0.5803 | 2 | 0.5168 | 2 | 0.5000 |
| | 2 | | 12 | 0.5048 | 9 | 0.5037 | 7 | 0.5036 | 6 | 0.5314 | 6 | 0.5000 |
| | 4 | | 20 | 0.5302 | 15 | 0.5218 | 11 | 0.5831 | 10 | 0.5412 | 10 | 0.5000 |
| | 10 | | 46 | 0.5067 | 34 | 0.5049 | 26 | 0.5058 | 22 | 0.5618 | 22 | 0.5000 |
| | 20 | | 88 | 0.5209 | 65 | 0.5151 | 49 | 0.5445 | 43 | 0.5258 | 42 | 0.5000 |
| 0.75 | 0 | | 6 | 0.2632 | 4 | 0.3157 | 3 | 0.3368 | 3 | 0.2671 | 3 | 0.2500 |
| | 2 | | 16 | 0.2813 | 12 | 0.2661 | 9 | 0.2757 | 8 | 0.2550 | 7 | 0.3438 |
| | 4 | | 26 | 0.2698 | 19 | 0.2719 | 14 | 0.3005 | 12 | 0.3135 | 12 | 0.2744 |
| | 10 | | 54 | 0.2733 | 40 | 0.2563 | 30 | 0.2673 | 26 | 0.2644 | 25 | 0.2706 |
| | 20 | | 100 | 0.2656 | 73 | 0.2693 | 55 | 0.2774 | 48 | 0.2598 | 46 | 0.2757 |
| 0.99 | 0 | | 18 | 0.0107 | 12 | 0.0146 | 9 | 0.0129 | 7 | 0.0190 | 7 | 0.0156 |
| | 2 | | 33 | 0.0112 | 23 | 0.0132 | 17 | 0.0125 | 14 | 0.0153 | 14 | 0.0112 |
| | 4 | | 46 | 0.0110 | 33 | 0.0108 | 24 | 0.0119 | 20 | 0.0140 | 19 | 0.0154 |
| | 10 | | 81 | 0.0110 | 58 | 0.0115 | 43 | 0.0112 | 36 | 0.0140 | 35 | 0.0122 |
| | 20 | | 135 | 0.0105 | 97 | 0.0112 | 72 | 0.0115 | 62 | 0.0102 | 59 | 0.0124 |
Table 8.
The ASP for the KM-GIKw distribution with parameters for selected values of , c, and a.
Table 8.
The ASP for the KM-GIKw distribution with parameters for selected values of , c, and a.
| c | | | | | | 1 |
|---|
| | | | | | | | | | | | | |
| 0.10 | 0 | | 2 | 0.9441 | 1 | 1.0000 | 1 | 1.0000 | 1 | 1.0000 | 1 | 1.0000 |
| | 2 | | 21 | 0.9022 | 9 | 0.9041 | 4 | 0.9670 | 4 | 0.9017 | 3 | 1.0000 |
| | 4 | | 45 | 0.9025 | 18 | 0.9135 | 9 | 0.9243 | 7 | 0.9227 | 6 | 0.9687 |
| | 10 | | 128 | 0.9007 | 51 | 0.9025 | 24 | 0.9157 | 18 | 0.9017 | 16 | 0.9408 |
| | 20 | | 278 | 0.9017 | 110 | 0.9002 | 51 | 0.9099 | 37 | 0.9029 | 34 | 0.9186 |
| 0.25 | 0 | | 6 | 0.7501 | 2 | 0.8557 | 1 | 1.0000 | 1 | 1.0000 | 1 | 1.0000 |
| | 2 | | 32 | 0.7509 | 13 | 0.7552 | 6 | 0.8084 | 4 | 0.9017 | 4 | 0.8750 |
| | 4 | | 61 | 0.7565 | 24 | 0.7696 | 11 | 0.8119 | 8 | 0.8317 | 8 | 0.7734 |
| | 10 | | 155 | 0.7562 | 61 | 0.7582 | 28 | 0.7788 | 20 | 0.7875 | 19 | 0.7596 |
| | 20 | | 319 | 0.7540 | 125 | 0.7527 | 57 | 0.7685 | 40 | 0.7894 | 37 | 0.7975 |
| 0.50 | 0 | | 13 | 0.5016 | 5 | 0.5361 | 2 | 0.6792 | 2 | 0.5385 | 1 | 1.0000 |
| | 2 | | 48 | 0.5074 | 19 | 0.5074 | 8 | 0.5996 | 6 | 0.5719 | 5 | 0.6875 |
| | 4 | | 84 | 0.5027 | 33 | 0.5009 | 15 | 0.5162 | 10 | 0.5940 | 9 | 0.6367 |
| | 10 | | 191 | 0.5042 | 74 | 0.5114 | 33 | 0.5445 | 23 | 0.5609 | 21 | 0.5881 |
| | 20 | | 370 | 0.5027 | 143 | 0.5122 | 65 | 0.5033 | 45 | 0.5249 | 41 | 0.5626 |
| 0.75 | 0 | | 25 | 0.2516 | 9 | 0.2874 | 4 | 0.3134 | 3 | 0.2900 | 2 | 0.5000 |
| | 2 | | 70 | 0.2517 | 27 | 0.2544 | 12 | 0.2621 | 8 | 0.2944 | 7 | 0.3437 |
| | 4 | | 112 | 0.2510 | 43 | 0.2560 | 19 | 0.2668 | 13 | 0.2767 | 12 | 0.2744 |
| | 10 | | 232 | 0.2523 | 89 | 0.2590 | 39 | 0.2836 | 27 | 0.2793 | 25 | 0.2706 |
| | 20 | | 426 | 0.2517 | 164 | 0.2550 | 73 | 0.2591 | 50 | 0.2734 | 46 | 0.2757 |
| 0.99 | 0 | | 81 | 0.0101 | 30 | 0.0109 | 12 | 0.0142 | 8 | 0.0131 | 7 | 0.0156 |
| | 2 | | 148 | 0.0101 | 55 | 0.0112 | 23 | 0.0127 | 15 | 0.0138 | 14 | 0.0112 |
| | 4 | | 204 | 0.0103 | 77 | 0.0106 | 33 | 0.0103 | 21 | 0.0147 | 19 | 0.0154 |
| | 10 | | 356 | 0.0101 | 135 | 0.0103 | 58 | 0.0107 | 38 | 0.0137 | 35 | 0.0121 |
| | 20 | | 586 | 0.0102 | 223 | 0.0104 | 97 | 0.0102 | 65 | 0.0109 | 59 | 0.0124 |
Table 9.
The ASP for the KM-GIKw distribution with parameters for selected values of , c, and a.
Table 9.
The ASP for the KM-GIKw distribution with parameters for selected values of , c, and a.
| c | | | | | | 1 |
|---|
| | | | | | | | | | | | | |
| 0.10 | 0 | | 6 | 0.9067 | 2 | 0.9196 | 1 | 1.0000 | 1 | 1.0000 | 1 | 1.0000 |
| | 2 | | 58 | 0.9010 | 15 | 0.9031 | 5 | 0.9395 | 4 | 0.9099 | 3 | 1.0000 |
| | 4 | | 127 | 0.9004 | 32 | 0.9008 | 11 | 0.9013 | 7 | 0.9319 | 6 | 0.9687 |
| | 10 | | 364 | 0.9004 | 89 | 0.9052 | 29 | 0.9004 | 18 | 0.9195 | 16 | 0.9408 |
| | 20 | | 795 | 0.9009 | 194 | 0.9029 | 61 | 0.9043 | 38 | 0.9017 | 34 | 0.9186 |
| 0.25 | 0 | | 15 | 0.7601 | 4 | 0.7777 | 1 | 1.0000 | 1 | 1.0000 | 1 | 1.0000 |
| | 2 | | 90 | 0.7508 | 22 | 0.7641 | 7 | 0.8039 | 5 | 0.7607 | 4 | 0.8750 |
| | 4 | | 174 | 0.7533 | 43 | 0.7537 | 14 | 0.7512 | 8 | 0.8492 | 8 | 0.7734 |
| | 10 | | 445 | 0.7519 | 108 | 0.7589 | 34 | 0.7550 | 21 | 0.7555 | 19 | 0.7597 |
| | 20 | | 917 | 0.7501 | 223 | 0.7503 | 68 | 0.7715 | 41 | 0.7931 | 37 | 0.7975 |
| 0.50 | 0 | | 36 | 0.5036 | 9 | 0.5115 | 3 | 0.5383 | 2 | 0.5517 | 1 | 1.0000 |
| | 2 | | 138 | 0.5022 | 33 | 0.5194 | 10 | 0.5550 | 6 | 0.5962 | 5 | 0.6875 |
| | 4 | | 241 | 0.5013 | 58 | 0.5121 | 18 | 0.5116 | 11 | 0.5087 | 9 | 0.6367 |
| | 10 | | 550 | 0.5010 | 133 | 0.5040 | 40 | 0.5277 | 24 | 0.5342 | 21 | 0.5881 |
| | 20 | | 1065 | 0.5011 | 257 | 0.5058 | 78 | 0.5074 | 46 | 0.5407 | 41 | 0.5627 |
| 0.75 | 0 | | 71 | 0.2537 | 17 | 0.2617 | 5 | 0.2897 | 3 | 0.3043 | 2 | 0.5000 |
| | 2 | | 202 | 0.2502 | 48 | 0.2604 | 14 | 0.2855 | 8 | 0.3197 | 7 | 0.3437 |
| | 4 | | 323 | 0.2504 | 77 | 0.2594 | 23 | 0.2639 | 13 | 0.3085 | 12 | 0.2744 |
| | 10 | | 670 | 0.2506 | 161 | 0.2532 | 48 | 0.2577 | 28 | 0.2691 | 25 | 0.2706 |
| | 20 | | 1229 | 0.2509 | 296 | 0.2508 | 88 | 0.2623 | 52 | 0.2538 | 46 | 0.2757 |
| 0.99 | 0 | | 235 | 0.0102 | 55 | 0.0108 | 15 | 0.0131 | 8 | 0.0155 | 7 | 0.0156 |
| | 2 | | 430 | 0.0101 | 102 | 0.0102 | 29 | 0.0105 | 16 | 0.0110 | 14 | 0.0112 |
| | 4 | | 595 | 0.0100 | 141 | 0.0103 | 40 | 0.0112 | 22 | 0.0131 | 19 | 0.0154 |
| | 10 | | 1033 | 0.0101 | 246 | 0.0102 | 71 | 0.0104 | 40 | 0.0109 | 35 | 0.0122 |
| | 20 | | 1700 | 0.0100 | 406 | 0.0101 | 118 | 0.0104 | 67 | 0.0113 | 59 | 0.0124 |
Table 10.
The ASP for the KM-GIKw distribution with parameters for selected values of , c, and a.
Table 10.
The ASP for the KM-GIKw distribution with parameters for selected values of , c, and a.
| c | | | | | | 1 |
|---|
| | | | | | | | | | | | | |
| 0.10 | 0 | | 91 | 0.9008 | 7 | 0.9056 | 1 | 1.0000 | 1 | 1.0000 | 1 | 1.0000 |
| | 2 | | 951 | 0.9000 | 68 | 0.9023 | 8 | 0.9097 | 4 | 0.9268 | 3 | 1.0000 |
| | 4 | | 2098 | 0.9000 | 150 | 0.9004 | 16 | 0.9174 | 7 | 0.9499 | 6 | 0.9688 |
| | 10 | | 6052 | 0.9001 | 430 | 0.9009 | 45 | 0.9090 | 19 | 0.9211 | 16 | 0.9408 |
| | 20 | | 13259 | 0.9000 | 941 | 0.9005 | 97 | 0.9079 | 40 | 0.9120 | 34 | 0.9186 |
| 0.25 | 0 | | 248 | 0.7507 | 18 | 0.7550 | 2 | 0.8373 | 1 | 1.0000 | 1 | 1.0000 |
| | 2 | | 1489 | 0.7502 | 106 | 0.7522 | 11 | 0.7861 | 5 | 0.7990 | 4 | 0.8750 |
| | 4 | | 2904 | 0.7501 | 206 | 0.7524 | 22 | 0.7516 | 9 | 0.7966 | 8 | 0.7734 |
| | 10 | | 7430 | 0.7500 | 527 | 0.7509 | 54 | 0.7641 | 22 | 0.7771 | 19 | 0.7597 |
| | 20 | | 15302 | 0.7501 | 1085 | 0.7502 | 111 | 0.7541 | 44 | 0.7820 | 37 | 0.7975 |
| 0.50 | 0 | | 597 | 0.5006 | 42 | 0.5078 | 4 | 0.5869 | 2 | 0.5816 | 2 | 0.5000 |
| | 2 | | 2305 | 0.5000 | 163 | 0.5032 | 17 | 0.5041 | 7 | 0.5063 | 6 | 0.5000 |
| | 4 | | 4025 | 0.5002 | 285 | 0.5018 | 29 | 0.5121 | 11 | 0.5864 | 10 | 0.5000 |
| | 10 | | 9194 | 0.5001 | 651 | 0.5009 | 66 | 0.5049 | 26 | 0.5111 | 22 | 0.5000 |
| | 20 | | 17811 | 0.5001 | 1261 | 0.5005 | 127 | 0.5105 | 50 | 0.5032 | 42 | 0.5000 |
| 0.75 | 0 | | 1194 | 0.2503 | 84 | 0.2536 | 8 | 0.2884 | 3 | 0.3383 | 3 | 0.2500 |
| | 2 | | 3378 | 0.2501 | 239 | 0.2504 | 24 | 0.2528 | 9 | 0.2782 | 7 | 0.3438 |
| | 4 | | 5407 | 0.2500 | 382 | 0.2512 | 38 | 0.2584 | 14 | 0.3039 | 12 | 0.2744 |
| | 10 | | 11219 | 0.2500 | 793 | 0.2509 | 79 | 0.2568 | 30 | 0.2720 | 25 | 0.2706 |
| | 20 | | 20580 | 0.2501 | 1455 | 0.2509 | 145 | 0.2586 | 55 | 0.2839 | 46 | 0.2757 |
| 0.99 | 0 | | 3967 | 0.0100 | 279 | 0.0101 | 26 | 0.0118 | 9 | 0.0131 | 7 | 0.0156 |
| | 2 | | 7241 | 0.0100 | 510 | 0.0101 | 49 | 0.0105 | 17 | 0.0128 | 14 | 0.0112 |
| | 4 | | 9997 | 0.0100 | 705 | 0.0100 | 68 | 0.0105 | 24 | 0.0123 | 19 | 0.0154 |
| | 10 | | 17356 | 0.0100 | 1224 | 0.0101 | 119 | 0.0105 | 43 | 0.0117 | 35 | 0.0122 |
| | 20 | | 28521 | 0.0100 | 2013 | 0.0100 | 197 | 0.0105 | 72 | 0.0121 | 59 | 0.0124 |
Table 11.
ABiases and RMSEs of different estimation methods for the KM-GIKw distribution with at different sample sizes n.
Table 11.
ABiases and RMSEs of different estimation methods for the KM-GIKw distribution with at different sample sizes n.
| n | | MLE | MPSE | BE-SELF | BE-LELF: | BE-LELF: |
|---|
| | | ABias | RMSE | ABias | RMSE | ABias | RMSE | ABias | RMSE | ABias | RMSE |
|---|
| 20 | | 0.7316 | 1.7584 | −0.0425 | 1.3785 | −0.5916 | 0.6724 | −0.5532 | 0.7331 | −0.6225 | 0.6705 |
| | | 1.8898 | 4.7333 | 0.8544 | 4.0574 | −0.5588 | 0.5863 | −0.5327 | 0.5676 | −0.5808 | 0.6038 |
| | | 0.3424 | 1.5112 | 1.0926 | 2.2619 | 0.8328 | 0.9379 | 0.9602 | 1.0804 | 0.7827 | 1.2488 |
| 30 | | 0.6693 | 1.6406 | −0.0303 | 1.3035 | −0.5440 | 0.6488 | −0.5281 | 0.5777 | −0.5823 | 0.6159 |
| | | 1.9725 | 4.7845 | 0.6817 | 3.3038 | −0.5182 | 0.5532 | −0.4917 | 0.5356 | −0.5407 | 0.5700 |
| | | 0.2547 | 1.2547 | 0.8893 | 1.8100 | 0.9111 | 1.4813 | 0.8869 | 0.9990 | 0.7977 | 1.3782 |
| 50 | | 0.4162 | 1.2621 | −0.0479 | 1.1619 | −0.4874 | 0.5438 | −0.4558 | 0.5424 | −0.5127 | 0.5614 |
| | | 1.3037 | 3.6018 | 0.5193 | 3.0619 | −0.4504 | 0.5064 | −0.4218 | 0.4925 | −0.4748 | 0.5212 |
| | | 0.1706 | 0.8818 | 0.6128 | 1.2320 | 0.8205 | 1.6151 | 0.8234 | 1.1918 | 0.7281 | 1.2419 |
| 100 | | 0.4184 | 1.0113 | 0.0026 | 0.8663 | −0.3717 | 0.4531 | −0.3459 | 0.4475 | −0.3952 | 0.4653 |
| | | 1.0295 | 2.5959 | 0.3959 | 2.2452 | −0.3434 | 0.4337 | −0.3149 | 0.4260 | −0.3684 | 0.4437 |
| | | −0.0175 | 0.5828 | 0.2960 | 0.7670 | 0.5166 | 0.6365 | 0.5651 | 0.6879 | 0.4915 | 0.7394 |
| 200 | | 0.2137 | 0.7564 | −0.0919 | 0.6796 | −0.3350 | 0.4342 | −0.3137 | 0.4240 | −0.3552 | 0.4451 |
| | | 0.5632 | 1.8495 | 0.1247 | 1.4341 | −0.2966 | 0.4204 | −0.2686 | 0.4202 | −0.3211 | 0.4253 |
| | | 0.0361 | 0.5049 | 0.2805 | 0.6553 | 0.4592 | 0.5961 | 0.4996 | 0.6502 | 0.4240 | 0.5587 |
Table 12.
ABiases and RMSEs of different estimation methods for the KM-GIKw distribution with at different sample sizes n.
Table 12.
ABiases and RMSEs of different estimation methods for the KM-GIKw distribution with at different sample sizes n.
| n | | MLE | MPSE | BE-SELF | BE-LELF: | BE-LELF: |
|---|
| | | ABias | RMSE | ABias | RMSE | ABias | RMSE | ABias | RMSE | ABias | RMSE |
|---|
| 20 | | 0.5246 | 1.6695 | −0.3838 | 1.3168 | −0.7705 | 0.7938 | −0.7391 | 0.7666 | −0.7991 | 0.8192 |
| | | 2.3495 | 6.3725 | 0.4480 | 4.6099 | −0.8761 | 0.8986 | −0.8374 | 0.8665 | −0.9085 | 0.9268 |
| | | 0.4631 | 1.5513 | 1.5144 | 2.5522 | 1.0225 | 1.1076 | 1.1902 | 1.2888 | 0.8873 | 0.9657 |
| 30 | | 0.5510 | 1.6154 | −0.1520 | 1.4451 | −0.7220 | 0.7483 | −0.6932 | 0.7237 | −0.7487 | 0.7716 |
| | | 2.6210 | 6.6031 | 1.1645 | 5.7568 | −0.8251 | 0.8504 | −0.7863 | 0.8193 | −0.8575 | 0.8782 |
| | | 0.3648 | 1.5363 | 1.1933 | 2.2814 | 1.0141 | 1.1110 | 1.1632 | 1.2751 | 0.8924 | 0.9809 |
| 50 | | 0.4939 | 1.4495 | −0.0869 | 1.2708 | −0.6301 | 0.6669 | −0.6020 | 0.6438 | −0.6561 | 0.6890 |
| | | 2.3578 | 6.1063 | 0.9671 | 4.7559 | −0.7399 | 0.7775 | −0.6984 | 0.7468 | −0.7748 | 0.8057 |
| | | 0.2193 | 1.1584 | 0.7910 | 1.6130 | 0.9391 | 1.4851 | 0.9978 | 1.1121 | 0.8195 | 1.0244 |
| 100 | | 0.3337 | 1.0898 | −0.1169 | 0.9897 | −0.5622 | 0.6114 | −0.5377 | 0.5925 | −0.5853 | 0.6299 |
| | | 1.3954 | 3.9828 | 0.4382 | 3.0738 | −0.6601 | 0.7196 | −0.6202 | 0.6962 | −0.6944 | 0.7431 |
| | | 0.0970 | 0.8204 | 0.5065 | 1.0929 | 0.7672 | 0.8745 | 0.8401 | 0.9510 | 0.7015 | 0.8066 |
| 200 | | 0.2369 | 0.8830 | −0.1593 | 0.8164 | −0.4943 | 0.5620 | −0.4720 | 0.5471 | −0.5158 | 0.5771 |
| | | 0.9288 | 2.8265 | 0.1694 | 2.1749 | −0.5844 | 0.6790 | −0.5437 | 0.6690 | −0.6194 | 0.6943 |
| | | 0.0641 | 0.6343 | 0.4225 | 0.8734 | 0.6613 | 0.7745 | 0.7171 | 0.8335 | 0.6108 | 0.7222 |
Table 13.
ABiases and RMSEs of different estimation methods for the KM-GIKw distribution with at different sample sizes n.
Table 13.
ABiases and RMSEs of different estimation methods for the KM-GIKw distribution with at different sample sizes n.
| n | | MLE | MPSE | BE-SELF | BE-LELF: | BE-LELF: |
|---|
| | | ABias | RMSE | ABias | RMSE | ABias | RMSE | ABias | RMSE | ABias | RMSE |
|---|
| 20 | | 0.5611 | 1.7686 | −0.1133 | 1.7178 | −.8147 | 0.8634 | −0.7595 | 0.8172 | -0.8653 | 0.9073 |
| | | 2.7515 | 7.3533 | 1.8432 | 6.6930 | −0.7407 | 0.7662 | −0.6887 | 0.7238 | −0.7834 | 0.8033 |
| | | 0.9808 | 3.7088 | 2.4913 | 5.5586 | 0.9436 | 1.0320 | 1.2018 | 1.3005 | 0.8197 | 1.8058 |
| 30 | | 0.4477 | 1.6176 | −0.1606 | 1.5830 | −0.7126 | 0.7578 | −0.6616 | 0.7147 | −0.7599 | 0.7991 |
| | | 2.1123 | 6.0099 | 1.0897 | 5.1813 | −0.6580 | 0.6906 | −0.6014 | 0.6479 | −0.7041 | 0.7292 |
| | | 0.6810 | 2.8021 | 2.0666 | 4.6228 | 0.9620 | 1.0637 | 1.1915 | 1.3043 | 0.7798 | 0.8808 |
| 50 | | 0.3479 | 1.2937 | −0.1061 | 1.2867 | −0.5821 | 0.6500 | −0.5380 | 0.6158 | −0.6240 | 0.6839 |
| | | 1.5401 | 4.5769 | 0.8561 | 4.0290 | −0.5681 | 0.6308 | −0.5122 | 0.5986 | −0.6144 | 0.6630 |
| | | 0.3670 | 2.0177 | 1.2711 | 3.2743 | 0.9065 | 1.0394 | 1.0907 | 1.2393 | 0.7583 | 0.8870 |
| 100 | | 0.1935 | 0.9246 | −0.1235 | 0.9579 | −0.4646 | 0.5504 | −0.4277 | 0.5240 | −0.5002 | 0.5773 |
| | | 0.8289 | 2.7821 | 0.3507 | 2.3355 | −0.4700 | 0.5689 | −0.4178 | 0.5480 | −0.5150 | 0.5933 |
| | | 0.1523 | 1.0608 | 0.6896 | 1.8525 | 0.7481 | 0.8986 | 0.8733 | 1.0322 | 0.6417 | 0.7910 |
| 200 | | 0.1686 | 0.7778 | −0.0629 | 0.7797 | −.3791 | 0.5035 | −0.3462 | 0.4838 | −0.4111 | 0.5243 |
| | | 0.5959 | 1.7857 | 0.2476 | 1.5078 | −0.3603 | 0.5352 | −0.3060 | 0.5352 | −0.4072 | 0.5463 |
| | | 0.0954 | 1.0296 | 0.4097 | 1.4428 | 0.6088 | 0.8107 | 0.7064 | 0.9182 | 0.5245 | 0.7242 |
Table 14.
ABiases and RMSEs of different estimation methods for the KM-GIKw distribution with at different sample sizes n.
Table 14.
ABiases and RMSEs of different estimation methods for the KM-GIKw distribution with at different sample sizes n.
| n | | MLE | MPSE | BE-SELF | BE-LELF: | BE-LELF: |
|---|
| | | ABias | RMSE | ABias | RMSE | ABias | RMSE | ABias | RMSE | ABias | RMSE |
|---|
| 20 | | 0.4491 | 1.9251 | −0.3490 | 1.9073 | −1.1529 | 1.2137 | −1.0588 | 1.3444 | −1.2202 | 1.2509 |
| | | 4.2616 | 11.3458 | 2.1601 | 8.7924 | −1.3623 | 1.3793 | −1.3010 | 1.3237 | −1.4125 | 1.4263 |
| | | 1.2525 | 4.0293 | 3.0214 | 6.2343 | 1.2724 | 1.3530 | 1.5482 | 1.6413 | 1.2070 | 2.4814 |
| 30 | | 0.3770 | 1.6916 | −0.1718 | 1.7480 | −1.0427 | 1.0855 | −0.9886 | 1.0367 | −1.0931 | 1.1317 |
| | | 3.5462 | 9.6190 | 1.9969 | 7.6894 | −1.2911 | 1.3116 | −1.2258 | 1.2535 | −1.3438 | 1.3604 |
| | | 0.9190 | 3.2612 | 2.2280 | 5.3408 | 1.3217 | 1.4105 | 1.5663 | 1.6703 | 1.1262 | 1.2085 |
| 50 | | 0.4073 | 1.4816 | −0.0103 | 1.5210 | −0.8714 | 0.9164 | −0.8239 | 0.8745 | −0.9168 | 0.9573 |
| | | 2.7688 | 7.6290 | 1.7529 | 6.7930 | −1.1285 | 1.1640 | −1.0582 | 1.1073 | −1.1869 | 1.2144 |
| | | 0.4457 | 2.3392 | 1.2457 | 3.5957 | 1.1896 | 1.2912 | 1.3756 | 1.4911 | 1.0390 | 1.1345 |
| 100 | | 0.1672 | 0.9408 | −0.1319 | 0.9760 | −0.7570 | 0.8105 | −0.7170 | 0.7753 | −0.7959 | 0.8453 |
| | | 1.1330 | 4.2257 | 0.5191 | 3.5660 | −1.0104 | 1.0638 | −0.9429 | 1.0121 | −1.0679 | 1.1111 |
| | | 0.1391 | 0.9752 | 0.5157 | 1.6269 | 1.0352 | 1.1518 | 1.1717 | 1.3014 | 0.9207 | 1.0307 |
| 200 | | 0.1454 | 0.8496 | −0.0860 | 0.8652 | −0.6253 | 0.7003 | −0.5902 | 0.6713 | −0.6598 | 0.7296 |
| | | 0.8290 | 3.0290 | 0.4561 | 3.3005 | −0.8457 | 0.9369 | −0.7745 | 0.8957 | −0.9067 | 0.9798 |
| | | 0.1127 | 1.0067 | 0.3814 | 1.4589 | 0.8284 | 0.9687 | 0.9288 | 1.0842 | 0.7429 | 0.8758 |
Table 15.
ABiases and RMSEs of different estimation methods for the KM-GIKw distribution with at different sample sizes n.
Table 15.
ABiases and RMSEs of different estimation methods for the KM-GIKw distribution with at different sample sizes n.
| n | | MLE | MPSE | BE-SELF | BE-LELF: | BE-LELF: |
|---|
| | | ABias | RMSE | ABias | RMSE | ABias | RMSE | ABias | RMSE | ABias | RMSE |
|---|
| 20 | | 0.4693 | 1.8287 | −0.2074 | 1.8708 | −0.9543 | 0.9991 | −0.8896 | 0.9418 | −1.0147 | 1.0538 |
| | | 3.4209 | 9.1172 | 2.3421 | 8.9577 | −1.1298 | 1.1524 | −1.0441 | 1.0763 | −1.1980 | 1.2156 |
| | | 1.4743 | 4.7706 | 3.5656 | 7.9989 | 1.0206 | 1.1420 | 1.3566 | 1.4808 | 0.8484 | 2.1064 |
| 30 | | 0.4582 | 1.6699 | −0.1520 | 1.6820 | −0.8169 | 0.8657 | −0.7596 | 0.8158 | −0.8711 | 0.9140 |
| | | 2.9969 | 8.1020 | 1.7638 | 7.3588 | −1.0134 | 1.0451 | −0.9206 | 0.9677 | −1.0868 | 1.1106 |
| | | 0.8390 | 3.6453 | 2.5670 | 6.5515 | 1.1261 | 1.2277 | 1.4255 | 1.5356 | 0.8874 | 0.9900 |
| 50 | | 0.3047 | 1.4393 | −0.1342 | 1.5184 | −0.6835 | 0.7323 | −0.6352 | 0.6895 | -0.7302 | 0.7744 |
| | | 2.1835 | 6.9038 | 1.4187 | 6.5544 | −0.8928 | 0.9375 | −0.8033 | 0.8663 | −0.9667 | 1.0008 |
| | | 0.5551 | 2.4754 | 1.8370 | 4.7715 | 1.0950 | 1.2145 | 1.3467 | 1.4806 | 0.8930 | 1.0108 |
| 100 | | 0.1940 | 0.9748 | −0.1029 | 1.0387 | −0.5449 | 0.6194 | −0.5035 | 0.5858 | −0.5851 | 0.6532 |
| | | 1.1916 | 3.7559 | 0.5906 | 3.3470 | −0.7221 | 0.8177 | −0.6244 | 0.7661 | −0.8012 | 0.8731 |
| | | 0.1698 | 1.3761 | 0.7391 | 2.3793 | 0.9181 | 1.0719 | 1.0980 | 1.2616 | 0.7669 | 0.9200 |
| 200 | | 0.1452 | 0.8401 | −0.0928 | 0.8728 | −0.4836 | 0.5750 | −0.4498 | 0.5495 | −0.5168 | 0.6011 |
| | | 0.8788 | 3.1260 | 0.4142 | 2.7938 | −0.6414 | 0.7807 | −0.5578 | 0.7475 | −0.7124 | 0.8211 |
| | | 0.1242 | 1.2396 | 0.5395 | 2.0225 | 0.8120 | 0.9940 | 0.9476 | 1.1376 | 0.6945 | 0.8747 |
Table 16.
Descriptive analysis for both datasets.
Table 16.
Descriptive analysis for both datasets.
| Datasets | Minimum | Var | Median | Mean | Standard Deviation | Maximum | SK | KU |
|---|
| Dataset 1 | 1.00 | 4995.173 | 22.00 | 59.60 | 70.677 | 261.00 | 1.784 | 2.569 |
| Dataset 2 | 1.10 | 0.471 | 1.70 | 1.90 | 0.686 | 4.10 | 1.862 | 0.686 |
Table 17.
The failure time dataset.
Table 17.
The failure time dataset.
| 246 | 21 | 120 | 23 | 261 | 87 | 7 | 14 | 62 | 47 | 225 | 71 | 42 | 20 | 5 |
| 12 | 71 | 11 | 14 | 120 | 11 | 3 | 16 | 52 | 95 | 14 | 11 | 16 | 90 | 1 |
Table 18.
The values of the relief-time data.
Table 18.
The values of the relief-time data.
| 1.5 | 1.2 | 1.4 | 1.9 | 1.8 | 1.6 | 2.2 | 1.1 | 1.4 | 1.3 | 1.7 | 1.7 | 2.7 | 4.1 | 1.8 |
| 2.3 | 1.6 | 2 | 3 | 1.7 | | | | | | | | | | |
Table 19.
Numerical results of the MLE, SE, KS, and PVKS for the first dataset.
Table 19.
Numerical results of the MLE, SE, KS, and PVKS for the first dataset.
| Measures | KM-GIKw | GIKw | KM-L | L | KM-BXII | BXII | KM-BX | BX | KM-W | W |
|---|
| 0.331 | 0.352 | | | | | 0.006 | 0.007 | 0.013 | 0.018 |
| 2.803 | 2.958 | 7.533 | 3.296 | 0.019 | 0.029 | | | | |
| 43.765 | 45.251 | | | | | 0.353 | 0.290 | | |
| | | 511.530 | 141.265 | 10.513 | 10.198 | | | 0.938 | 0.854 |
| SE() | 0.250 | 0.265 | | | | | 0.001 | 0.001 | 0.003 | 0.004 |
| SE() | 2.727 | 2.844 | 18.296 | 3.075 | 0.083 | 0.142 | | | | |
| SE() | 91.054 | 97.513 | | | | | 0.063 | 0.059 | | |
| SE() | | | 1365.278 | 168.443 | 45.141 | 49.620 | | | 0.128 | 0.119 |
| KS | 0.131 | 0.135 | 0.145 | 0.142 | 0.372 | 0.377 | 0.181 | 0.196 | 0.146 | 0.153 |
| PVKS | 0.680 | 0.641 | 0.557 | 0.585 | <0.001 | <0.001 | 0.282 | 0.201 | 0.546 | 0.481 |
Table 20.
Numerical results of the MLE, SE, KS, and PVKS for the second dataset.
Table 20.
Numerical results of the MLE, SE, KS, and PVKS for the second dataset.
| Measures | KM-GIKw | GIKw | KM-L | L | KM-BXII | BXII | KM-BX | BX | KM-W | W |
|---|
| 3.628 | 5.111 | | | | | 0.655 | 0.691 | 0.422 | 0.469 |
| 1.093 | 0.809 | 1670.930 | 1405.725 | 0.022 | 0.032 | | | | |
| 9.050 | 6.470 | | | | | 3.563 | 3.246 | | |
| | | 4716.450 | 2669.973 | 53.623 | 52.862 | | | 3.114 | 2.787 |
| SE() | 6.075 | 6.631 | | | | | 0.085 | 0.086 | 0.033 | 0.040 |
| SE() | 2.418 | 1.316 | 19,573.048 | 12,641.637 | 0.053 | 0.077 | | | | |
| SE() | 19.360 | 7.799 | | | | | 1.338 | 1.321 | | |
| SE() | | | 55,248.332 | 24,014.725 | 129.668 | 125.750 | | | 0.458 | 0.427 |
| KS | 0.094 | 0.096 | 0.436 | 0.440 | 0.291 | 0.285 | 0.172 | 0.190 | 0.186 | 0.185 |
| PVKS | 0.995 | 0.993 | 0.001 | 0.001 | 0.068 | 0.078 | 0.595 | 0.465 | 0.492 | 0.501 |
Table 21.
Different methods of estimation of the KM-GIKw distribution for the first dataset.
Table 21.
Different methods of estimation of the KM-GIKw distribution for the first dataset.
| | MLE | MPSE | BE-LELF: | BE-LELF: | BE-SELF |
|---|
| 0.3310 | 0.0117 | 0.0090 | 0.0090 | 0.0090 |
| 2.8030 | 4.8698 | 2.7485 | 2.7346 | 2.7417 |
| 43.7650 | 45.7956 | 59.8282 | 35.2123 | 43.2794 |
Table 22.
Different methods of estimation of the KM-GIKw distribution for the second dataset.
Table 22.
Different methods of estimation of the KM-GIKw distribution for the second dataset.
| | MLE | MPSE | BE-LELF: | BE-LELF: | BE-SELF |
|---|
| 3.6280 | 0.8197 | 1.0706 | 1.0687 | 1.0696 |
| 1.0930 | 5.6366 | 10.1222 | 9.6864 | 9.9097 |
| 9.0500 | 3.9271 | 3.8744 | 3.7049 | 3.7908 |
