Article

Thermo-Optical Measurements and Simulation in a Fibre-Optic Circuit Using an Extrinsic Fabry–Pérot Interferometer under Pulsed Laser Heating

by
Artem N. Kotov
*,
Aleksandr A. Starostin
,
Vladimir I. Gorbatov
and
Pavel V. Skripov
Institute of Thermal Physics, Ural Branch, Russian Academy of Sciences, Yekaterinburg 620016, Russia
*
Author to whom correspondence should be addressed.
Axioms 2023, 12(6), 568; https://doi.org/10.3390/axioms12060568
Submission received: 6 May 2023 / Revised: 1 June 2023 / Accepted: 6 June 2023 / Published: 8 June 2023
(This article belongs to the Special Issue Applied Mathematics in Energy and Mechanical Engineering)

Abstract

:
Advantages of using an external Fabry–Pérot interferometer (EFPI) as a high-speed local temperature deformation sensor are demonstrated for the fibre-optic circuit combining a powerful laser beam for surface heating with a low-power probing radiation. The difference in the formation of the heating and probing radiation provides a simple basis for varying the gap between the fibre end and the surface in order to change the ratio between the heating and EFPI measuring areas. Using an example of modelling the laser heating by radiation from a standard single-mode fibre, we demonstrate the possibility of employing the EFPI to measure the temperature deformation of the surface on a quasi-isothermal area with the temperature close to the maximum at gap values of more than 100 μm. With the condition of preliminary calibration, the proposed scheme can be used to evaluate the heat treatment of the surface with the speed of the applied photodetector. The practical possibilities of the method are demonstrated on examples of heating some metal and semiconductor samples by laser pulses of microsecond duration.

1. Introduction

As a general rule, destructive processes leading to the failure of materials begin from the surface. Thus, the solution to the problem of improving the quality of machines and devices largely depends on the technological quality assurance of the surface layer of parts, including their geometric characteristics and physicochemical properties [1]. When using concentrated energy flows for the surface treatment of materials, it is necessary to convert the energy of the source into thermal energy with a certain efficiency. The application of this energy produces changes in the structural phase state of the surface layer to achieve the desired quality. The quality of surface heat treatment mainly depends on the rigour with which the specified heating and cooling modes are applied. Popular pulsed laser processing methods provide unique opportunities for thermally hardening the surface layers of parts [2,3,4]. One of the main advantages of laser processing is the high spatial resolution of the impact on the material.
This method provides the formation of structures or impact on functional elements with geometric dimensions characteristic of microtechnology (10−4–10−6 m). Thus, it becomes necessary to develop a means of measuring fast processes during pulsed heat treatment of such microelements. The diverse physical processes taking place during laser processing depend on the power density of the laser radiation on the surface. Pulsed laser heating begins with rapid thermal expansion of the surface layer of the base material to induce mechanical stresses in the heated layer [4,5,6]. Thermal expansion occurs in a thin surface layer having a thickness of the order of (d)1/2, where a is the thermal diffusivity of the surface layer material, while τd is the duration of the radiation pulse (for a microsecond pulse (d)1/2 is on the order of units of micrometres). The force arising from the accelerated displacement of the centre of mass of this layer compresses it during the action of the leading edge of the pulse and stretches it during the action of the trailing edge. The radial thermal expansion of the elastic layer leads to the occurrence of thermal compression stresses and surface deformation. In order to perform the specified heat treatment modes, it is necessary to monitor the maximum values of temperature, stress and strain achieved in the centre of the irradiated area. Similar problems arise when using laser methods in the field of thermal control of the properties of materials and products. For example, the reaction of a material upon exposure to a short laser pulse is investigated in the well-known pump–probe method [7,8,9,10]. In particular, the thermophysical properties of the material or defects in its structure are determined by changing the temperature of its surface [10]. For non-contact measurements of rapidly changing temperatures, optical sensors are widely used based on a number of thermo-optical effects [11], see below:
Thermal radiation of a heated body;
Temperature dependence of the refractive index;
Temperature change of the absorption coefficient;
Temperature change of the reflection coefficient as a result of changes in refraction and absorption, as well as thermal deformation of the surface.
However, for these effects, the thermo-optical coefficients are small, and measurements are possible either at large temperature differences or in special cases, for example, at the edge of the material’s own optical absorption. For increasing the sensitivity of optical circuits for thermo-optical measurements, interferometers can be used. However, the bulky circuits generally used for this purpose involve large-sized optics and inconvenient settings.
In this connection, the use of fibre optics in laser processing opens up new technological possibilities, especially when using robots. Accordingly, there is a demand for the development of methods for the remote control of thermal processes by fibre-optic means [7,8,9]. By configuring low-coherence interferometry with fibre optics, sensors can be miniaturised and placed at some distance from the electronics [7,12]. Chemically inert, compact and durable optical fibre integrated in the process of production is affordable due to the relatively inexpensive optical components. The purpose of the present work is to demonstrate the possibilities of combining low-coherence interferometry with fibre optics to create compact circuits for the high-speed control of thermal processes during pulsed laser processing.

2. Materials and Methods

2.1. Thermal Mirror and Interferometry Method

Photothermal methods are based on the various secondary effects that occur following the absorption of a non-stationary light flux by a sample [13,14]. In the case of photo reflection from a “thermal mirror”, a spatial resolution of up to 1 µm is provided [15,16,17,18,19,20]. The method consists of detecting changes in the reflection coefficient of the sample as a result of heating. The most significant changes occur as a result of thermo-optical and thermoelastic effects. In order to determine the local thermoelastic properties, an interferometer is included in the experimental setup. This is used to detect the displacement of the sample surface due to thermal expansion caused by an increase in temperature. The main feature of the used optical scheme consists of the difference in the sizes of the heating and probing rays. In this case, the heating beam has a diameter several times larger than the probing beam [18]. The narrow probing beam reads information from the central part of the heating spot at temperature and deformation parameters close to the maximum values. The scheme of using optical fibre for radiation transmission is shown in Figure 1.
The change in the optical path due to the thermoelastic deformation of the surface is determined from the interferometric signal using semi-analytical and numerical tools. As a result of the influence of both thermo-optical and thermoelastic effects, a signal can typically contain both contributions. However, by using an interferometer as an amplifier and detector of the phase of the reflected signal, it becomes possible to isolate the effects of surface displacement and radiation phase changes during reflection.
Temporal and spatial distributions of temperature and deformations under local heating are considered elsewhere [6,15,16,17,18,19,20]. In our case, we apply the model [19,20] with a Gaussian power distribution in a heating beam having radius ω:
I ( r , t ) = E π ω 2 exp ( r 2 ω 2 ) f ( t )
where r is the radial distance from the heating centre; E is the pulse energy; f(t) is the normalised dependence of the pulse amplitude on time; and ω is the radius of the Gaussian light beam.
With a surface absorption of radiation, the size of the heated site is much larger than the absorption depth; thus, it is possible to proceed from the model of a local surface heat source using:
W ( r , t ) = ( 1 R ) c p ρ 0 I ( r , t ) δ ( z )
where R, cp, and ρ0 are the average reflection coefficient, specific heat capacity and density of the material, respectively, and δ(z) is the delta function.
Temperature change T(r, t) for a thermally insulated surface can be calculated with:
T ( r , t ) = 2 E 0 c p ρ 0 0 t exp ( z 2 4 a Δ t ) exp ( r 2 ω 2 + 4 a Δ t ) ( 4 π a Δ t ) 1 / 2 π ( ω 2 + 4 a Δ t ) f ( t ) d t
where E 0 = E ( 1 R ) ; Δ t = t t ; z = 0—depth from the heating surface.
Associated thermal deformations along the normal to the heated surface:
u z = u 0 exp ( r 2 / ω 2 ) F ( t ) u 0 2 π 0 t 0 π / 2 exp ( r 2 cos 2 β / ω 2 1 + Δ t / τ ) ( 1 + Δ t / T ) 3 / 2 ( Δ t / τ ) 1 / 2 × ( r 2 cos 2 β / ω 2 ( 1 + Δ t / τ ) 1 ) F ( t ) τ cos 2 β d β d t ,
where u 0 = 2 ( 1 + ν ) α T E c p ρ 0 π ω 2 ; F ( t ) = 0 t f ( t ) d t ; u 0 —quasi-one-dimensional mode amplitude; τ = ω 2 / 4 a —characteristic thermal time; α T —coefficient of linear thermal expansion; and ν —Poisson’s ratio.
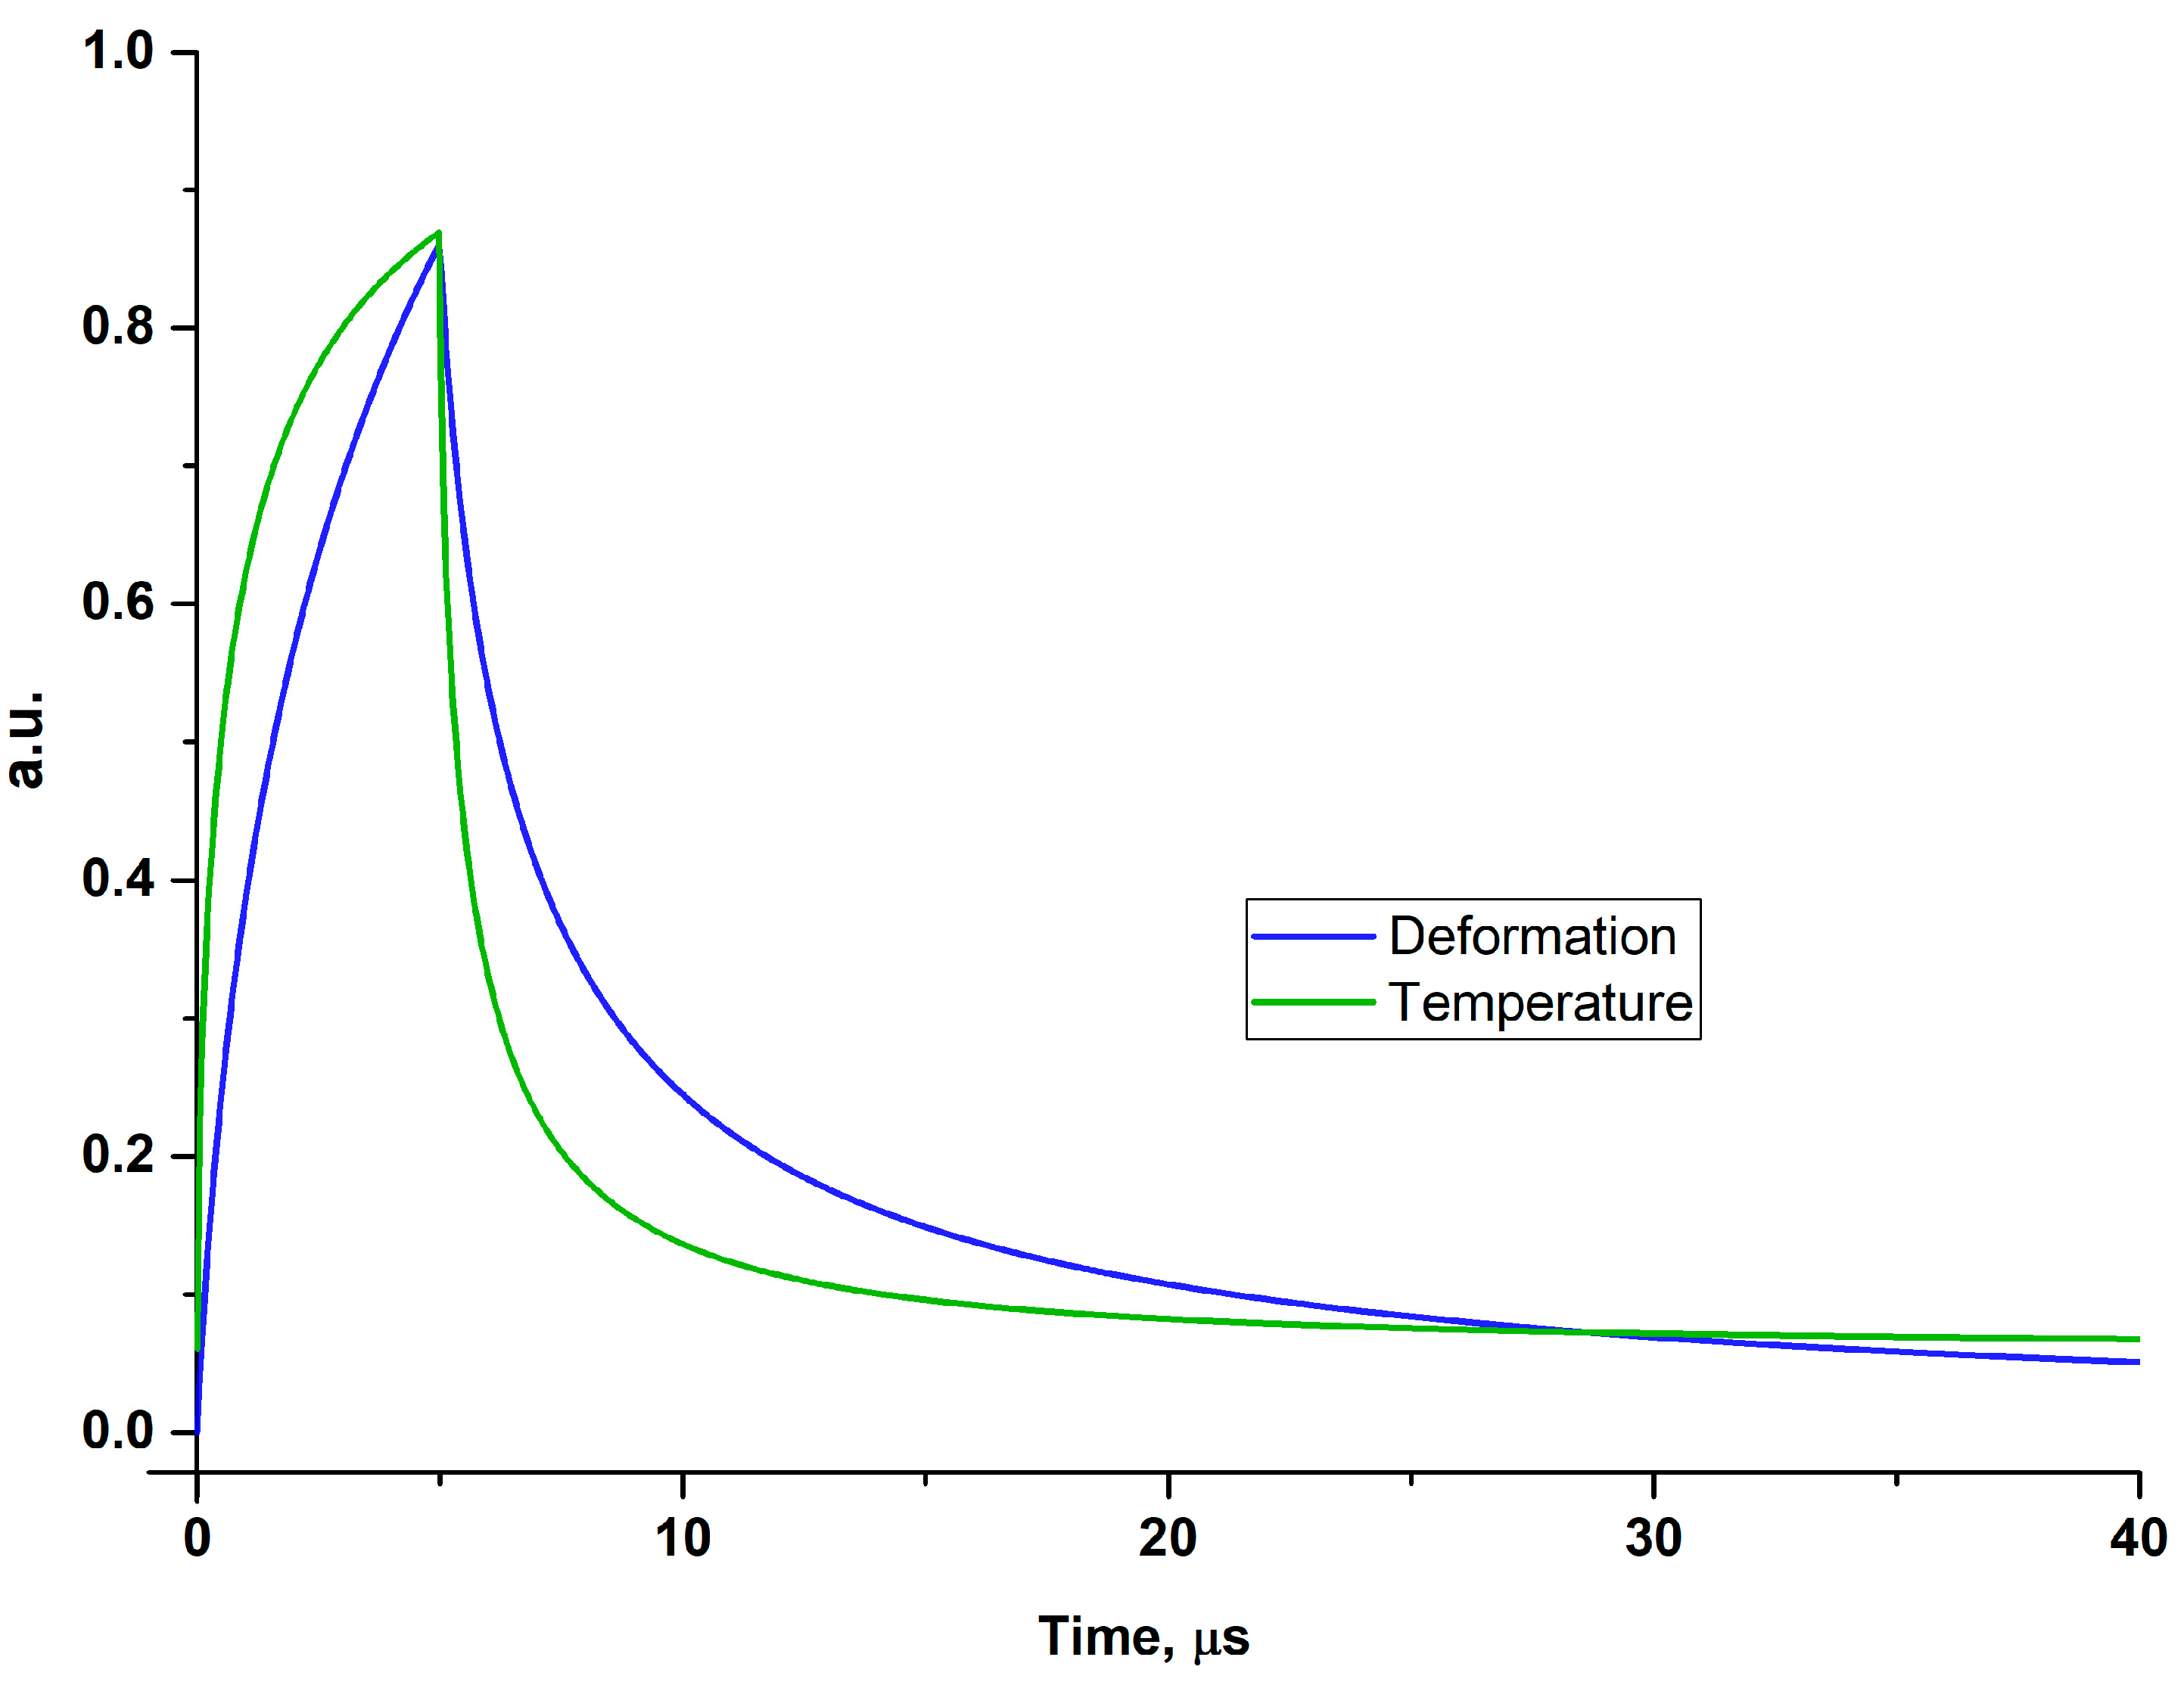
As shown in [19], surface displacements due to thermal expansion are retarded with respect to temperature changes. Figure 2 shows an example of relative temperature T(0, t) and deformation uz (0, t) changes in the centre of the heating spot. The retardation of deformation with respect to temperature depends on the size of the heating spot and the thermal diffusivity of the sample.

2.2. Interferometer

When irradiated by means of a light guide, a natural gap is formed between the end of the light guide and the surface of the sample. If the planes of the end face and surface are approximately parallel, then a Fabry–Pérot interferometer is generated in the gap. The Fabry–Pérot interferometric fibre-optic sensor is one of the most commonly used types of fibre-optic sensors due to its versatility, simplicity, speed, accuracy and immunity to environmental noise [21]. The extrinsic Fabry–Pérot interferometer (EFPI) is a fibre-optic modification of the Fabry–Pérot interferometer. The fibre-optic EFPI is formed by the fibre end face (having a typical reflection coefficient of about 3.5% for a wavelength range of 1.55 µm) and the outer surface [22]. As a rule, the intensity of the reflected light registered in the EFPI demonstrates an oscillating relationship to the interferometer baseline due to interferometric effects [23]. The short base of such an interferometer makes it very convenient for measuring various physical quantities. Sensors based on a fibre-optic EFPI have become widely used in science and industry due to their low cost, small dimensions, electromagnetic protection and high performance over a wide range of applications [24]. There are two main classes of measurement methods using EFPI: those that track only the deviations of the interferometer signal and those used to analyse the spectral function of the interferometer (interferometry in the wavelength region). Although deviation tracking approaches offer relatively high speed and resolution, their main disadvantage is the uncertainty of the initial value. The slower method of recording the transmission spectrum of the interferometer has a high absolute accuracy and a wide dynamic range of measurement [25]. In our case, we apply the first method to track the deviations of the interferometer signal from the operating point when the reflecting thermally deformable surface is displaced.
The operation of EFPI as a displacement sensor of the reflecting surface involves two mechanisms: interference and intensity.
The interference-based mechanism is described by the Fabry–Pérot interference of reflected beams between the two surfaces of the gap [26]. A low-coherence version of the interferometer is obtained if the average reflection coefficient R = (R1·R2)1/2 << 1 for reflections from both sides of the gap L. Then, multiple reflections can be disregarded and the interference equation for the probing beam is expressed in a known form associated with the harmonic approximation of the Airy function:
I r ( t ) = I 0 · ( 1 R ) 2 · [ 1 + 2 R · cos ( 4 π n L ( t ) λ + φ ( t ) ) ]
where Ir(t)—dependence of the radiation intensity on the time at the EFPI output; I0—the initial radiation intensity at the EFPI input; n—refractive index of the medium in the interferometer gap (n ≈ 1); L(t)—dependence of the gap size on time; λ—wavelength of the probing radiation; φ(t)—dependence of the phase shift of the radiation reflected from the sample on time; and η—attenuation coefficient of the radiation intensity due to beam divergence in the interferometer gap.
The mechanism of attenuation of the radiation intensity in the EFPI gap is associated with the expansion of the radiation beam at the output of the fibre in accordance with its numerical aperture NA. The propagation of radiation behind the fibre occurs within the framework of the Gaussian beam model with a constriction at the end of the fibre. The width of the Gaussian beam is characterised by a radius ω, which varies (diverges) along the beam axis and corresponds to the radius of the constriction ω0 at its minimum at the end of the fibre. In the case under consideration, ω0 is given by half the diameter of the mode spot of the light guide. The approach based on the Gaussian beam model assumes that the beam passes the length of the interferometer gap twice: in the forward and reverse directions, it remains Gaussian, while at the boundary with the fibre, it has a radius exceeding ω0. The Rayleigh beam length L0 is determined by the distance at which the beam expands twice. The relative fraction η of the power of the probing radiation reflected from the sample, which will be “captured” by the fibre in the form of radiation of the main mode, will be determined by the integral of the overlap of the mode field and the radiation incident at the end [27]:
η = 1/(1+(L/L0)2)
For a standard single-mode SMF-28 light guide, the diameter of the mode field is about 10 µm. At a numerical aperture of 0.12, the divergence of the heating radiation will increase the diameter of the heating spot by approximately 10 µm for every 42 µm of the gap (L0 ≈ 42 µm). For a gap value of L ≈ 100 µm, we have: ≈ 34 µm and η ≈ 0.15. At the same time, the information platform of the interferometer on the treated surface corresponds to the field 0 ≈ 10 µm of the main mode of the light guide. In this case, it follows Formula (1), whereby the heating power on the information platform changes by less than 8%. Therefore, it is possible to select such a gap value L at which the heating intensity will be sufficient for processing, and the interferometer readings will correspond with an acceptable attenuation η to a quasi-isothermal site in the centre of the heating spot.

2.3. Laser Surface Heating Control Unit with Fibre-Optic EFPI

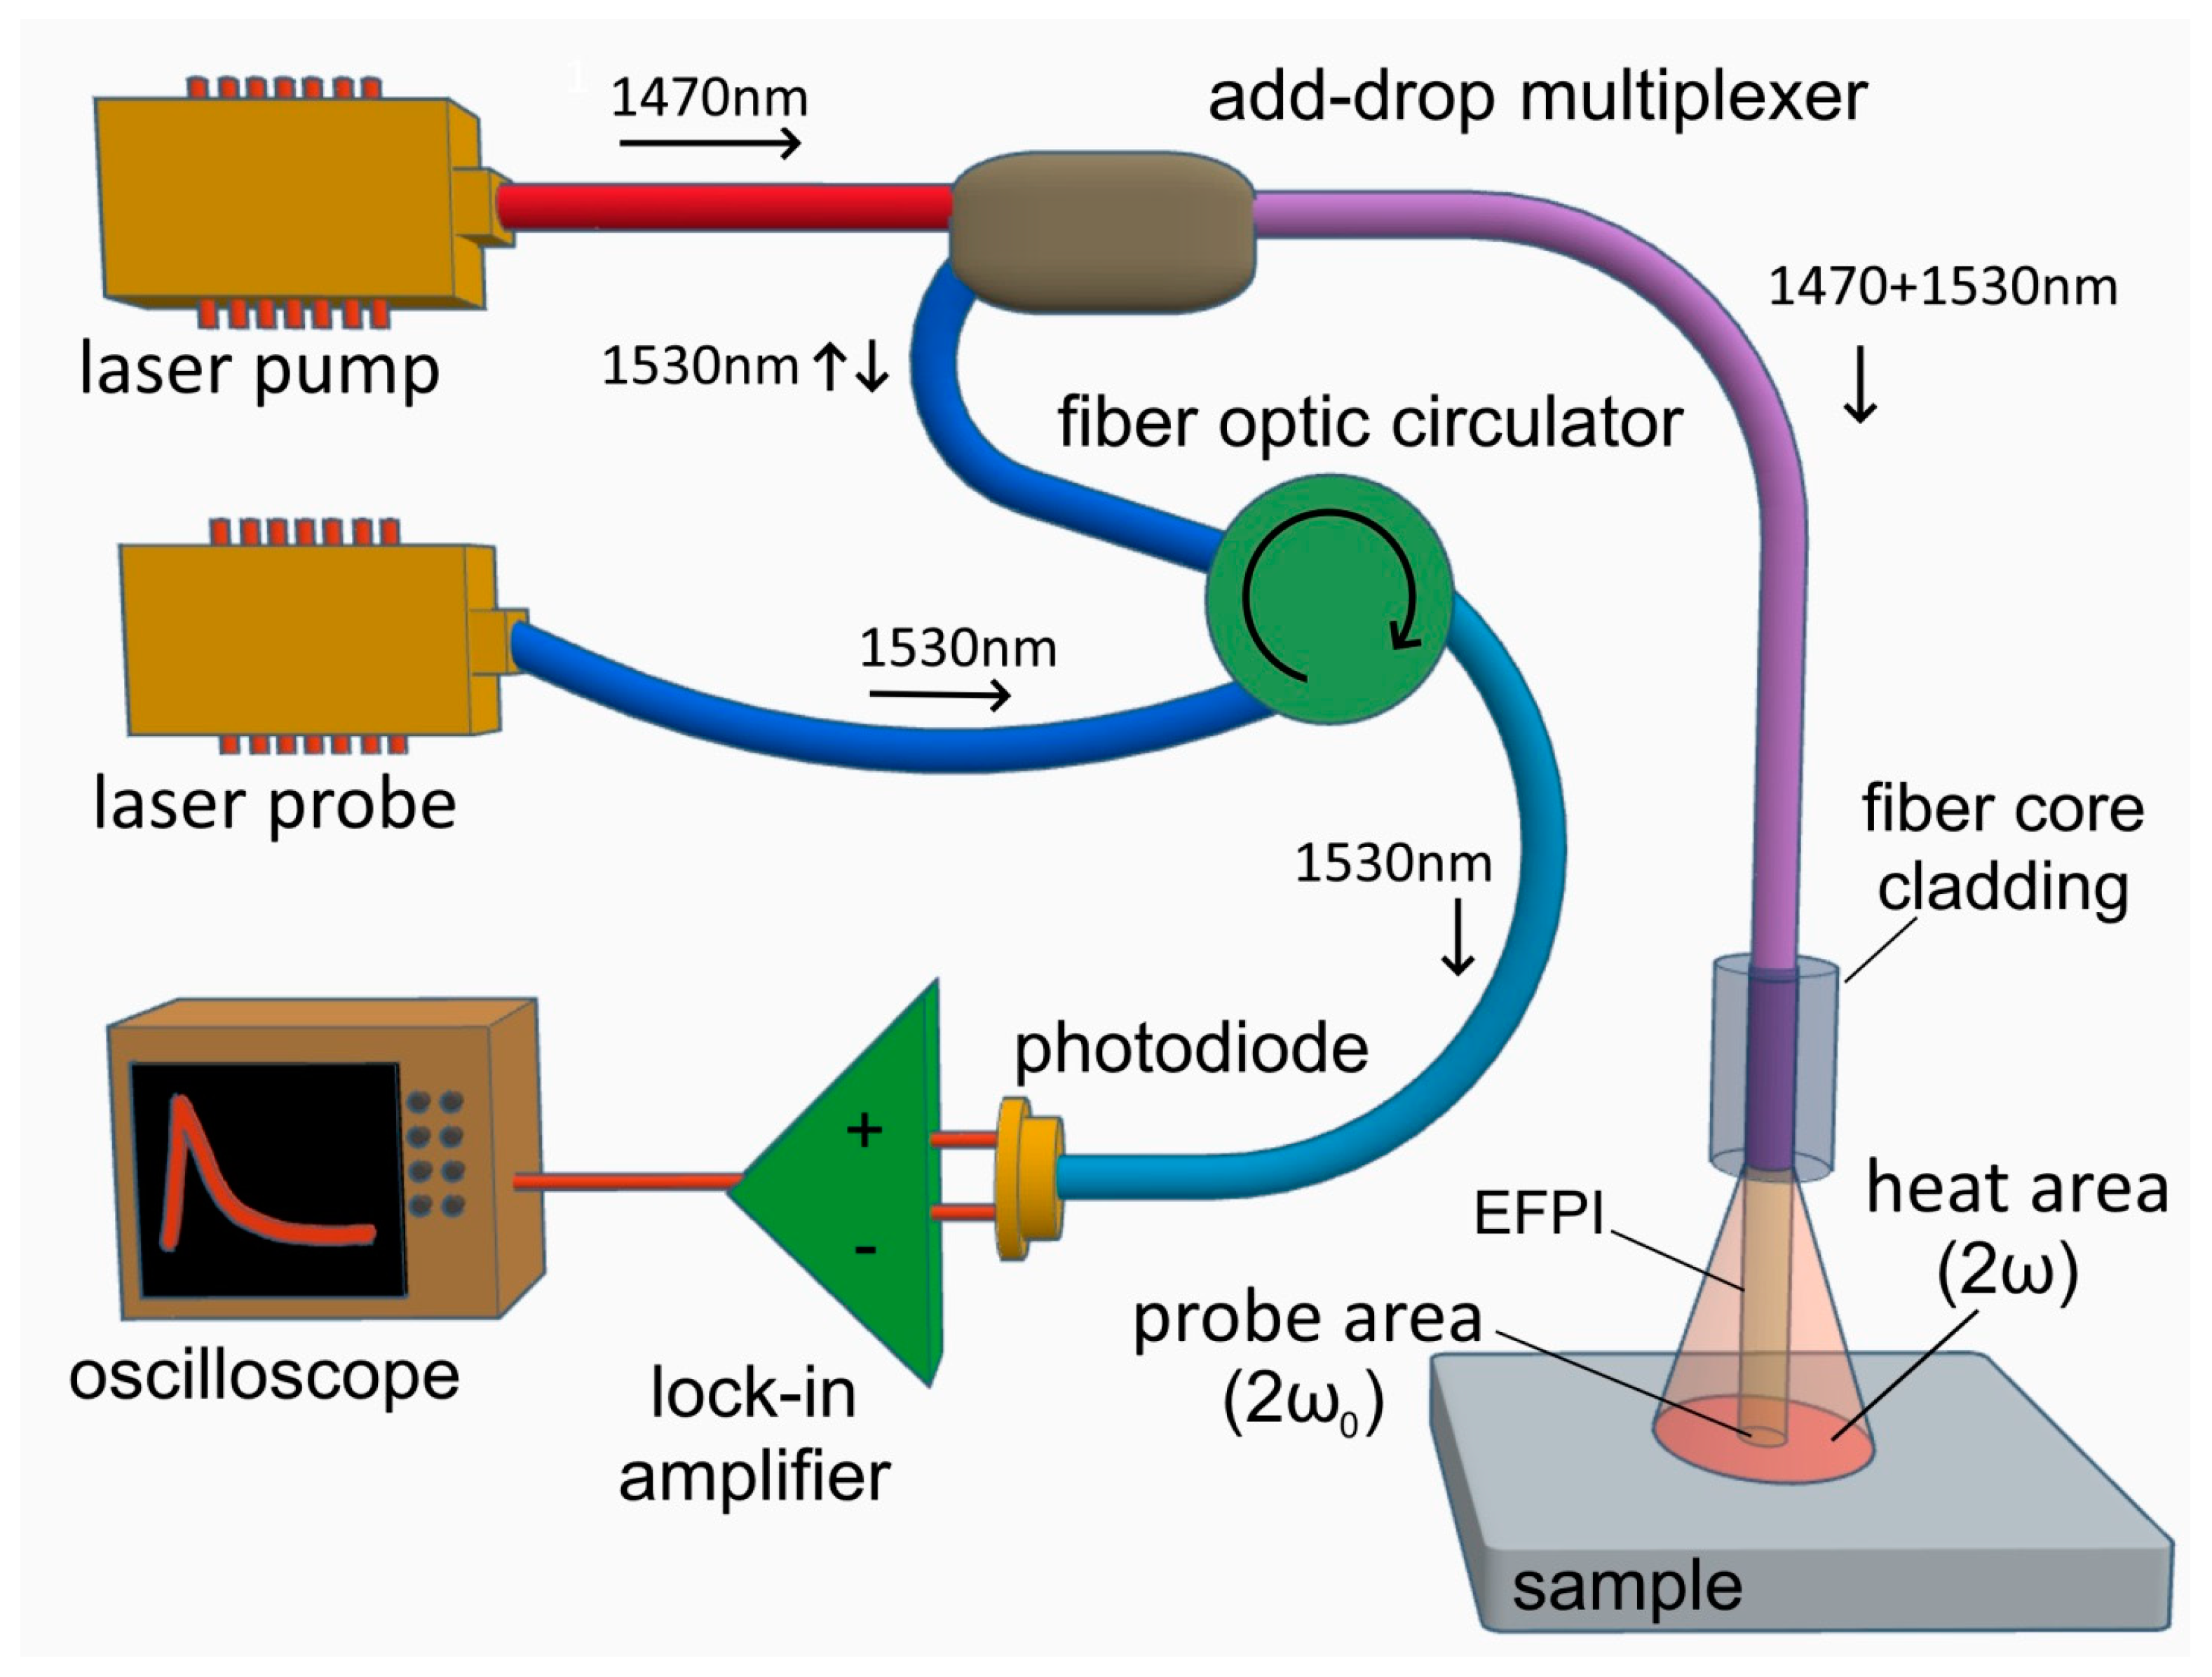
The optical scheme of the installation contains only fibre-optic elements (see Figure 3). An add-drop multiplexer is used to combine and separate the heating and probing rays. The separation of the reflections of the probing radiation from the sample and the end of the light guide in the EFPI interferometer is carried out by a fibre-optic circulator. From the output of the circulator, interfering rays are fed to a pulsed photodetector. The function of a lock-in amplifier is performed by a digital oscilloscope with external synchronisation from the pulse of the heating laser pump source. Semiconductor laser diodes with a fibre-optic output are used as radiation sources. Pulsed heating of the sample is provided by a 0.1–0.2 W pulse-pumped laser diode operating at a wavelength of 1470 nm. The source of probing radiation, which is based on a distributed feedback (DFB) laser diode, operates at a wavelength of 1530 nm with a continuous power of 0.001 W. The use of the DFB laser diode fulfils the requirement of a constant wavelength of probing radiation to stabilise the operating point of the interferometer for a measurement cycle.
Preliminary adjustment of the interferometer operating point is carried out by adjusting the gap using a piezoelectric actuator. When installing the operating point in the middle of the linear section of the interferometer, sensitivity to surface displacements of about 10 mV/nm was achieved with a noise intensity of no more than 1 mV. The average value of the recorded signals was 10–30 mV at the length of the characteristic linear section, at about 3 V [7].

3. Results

Experimental Section

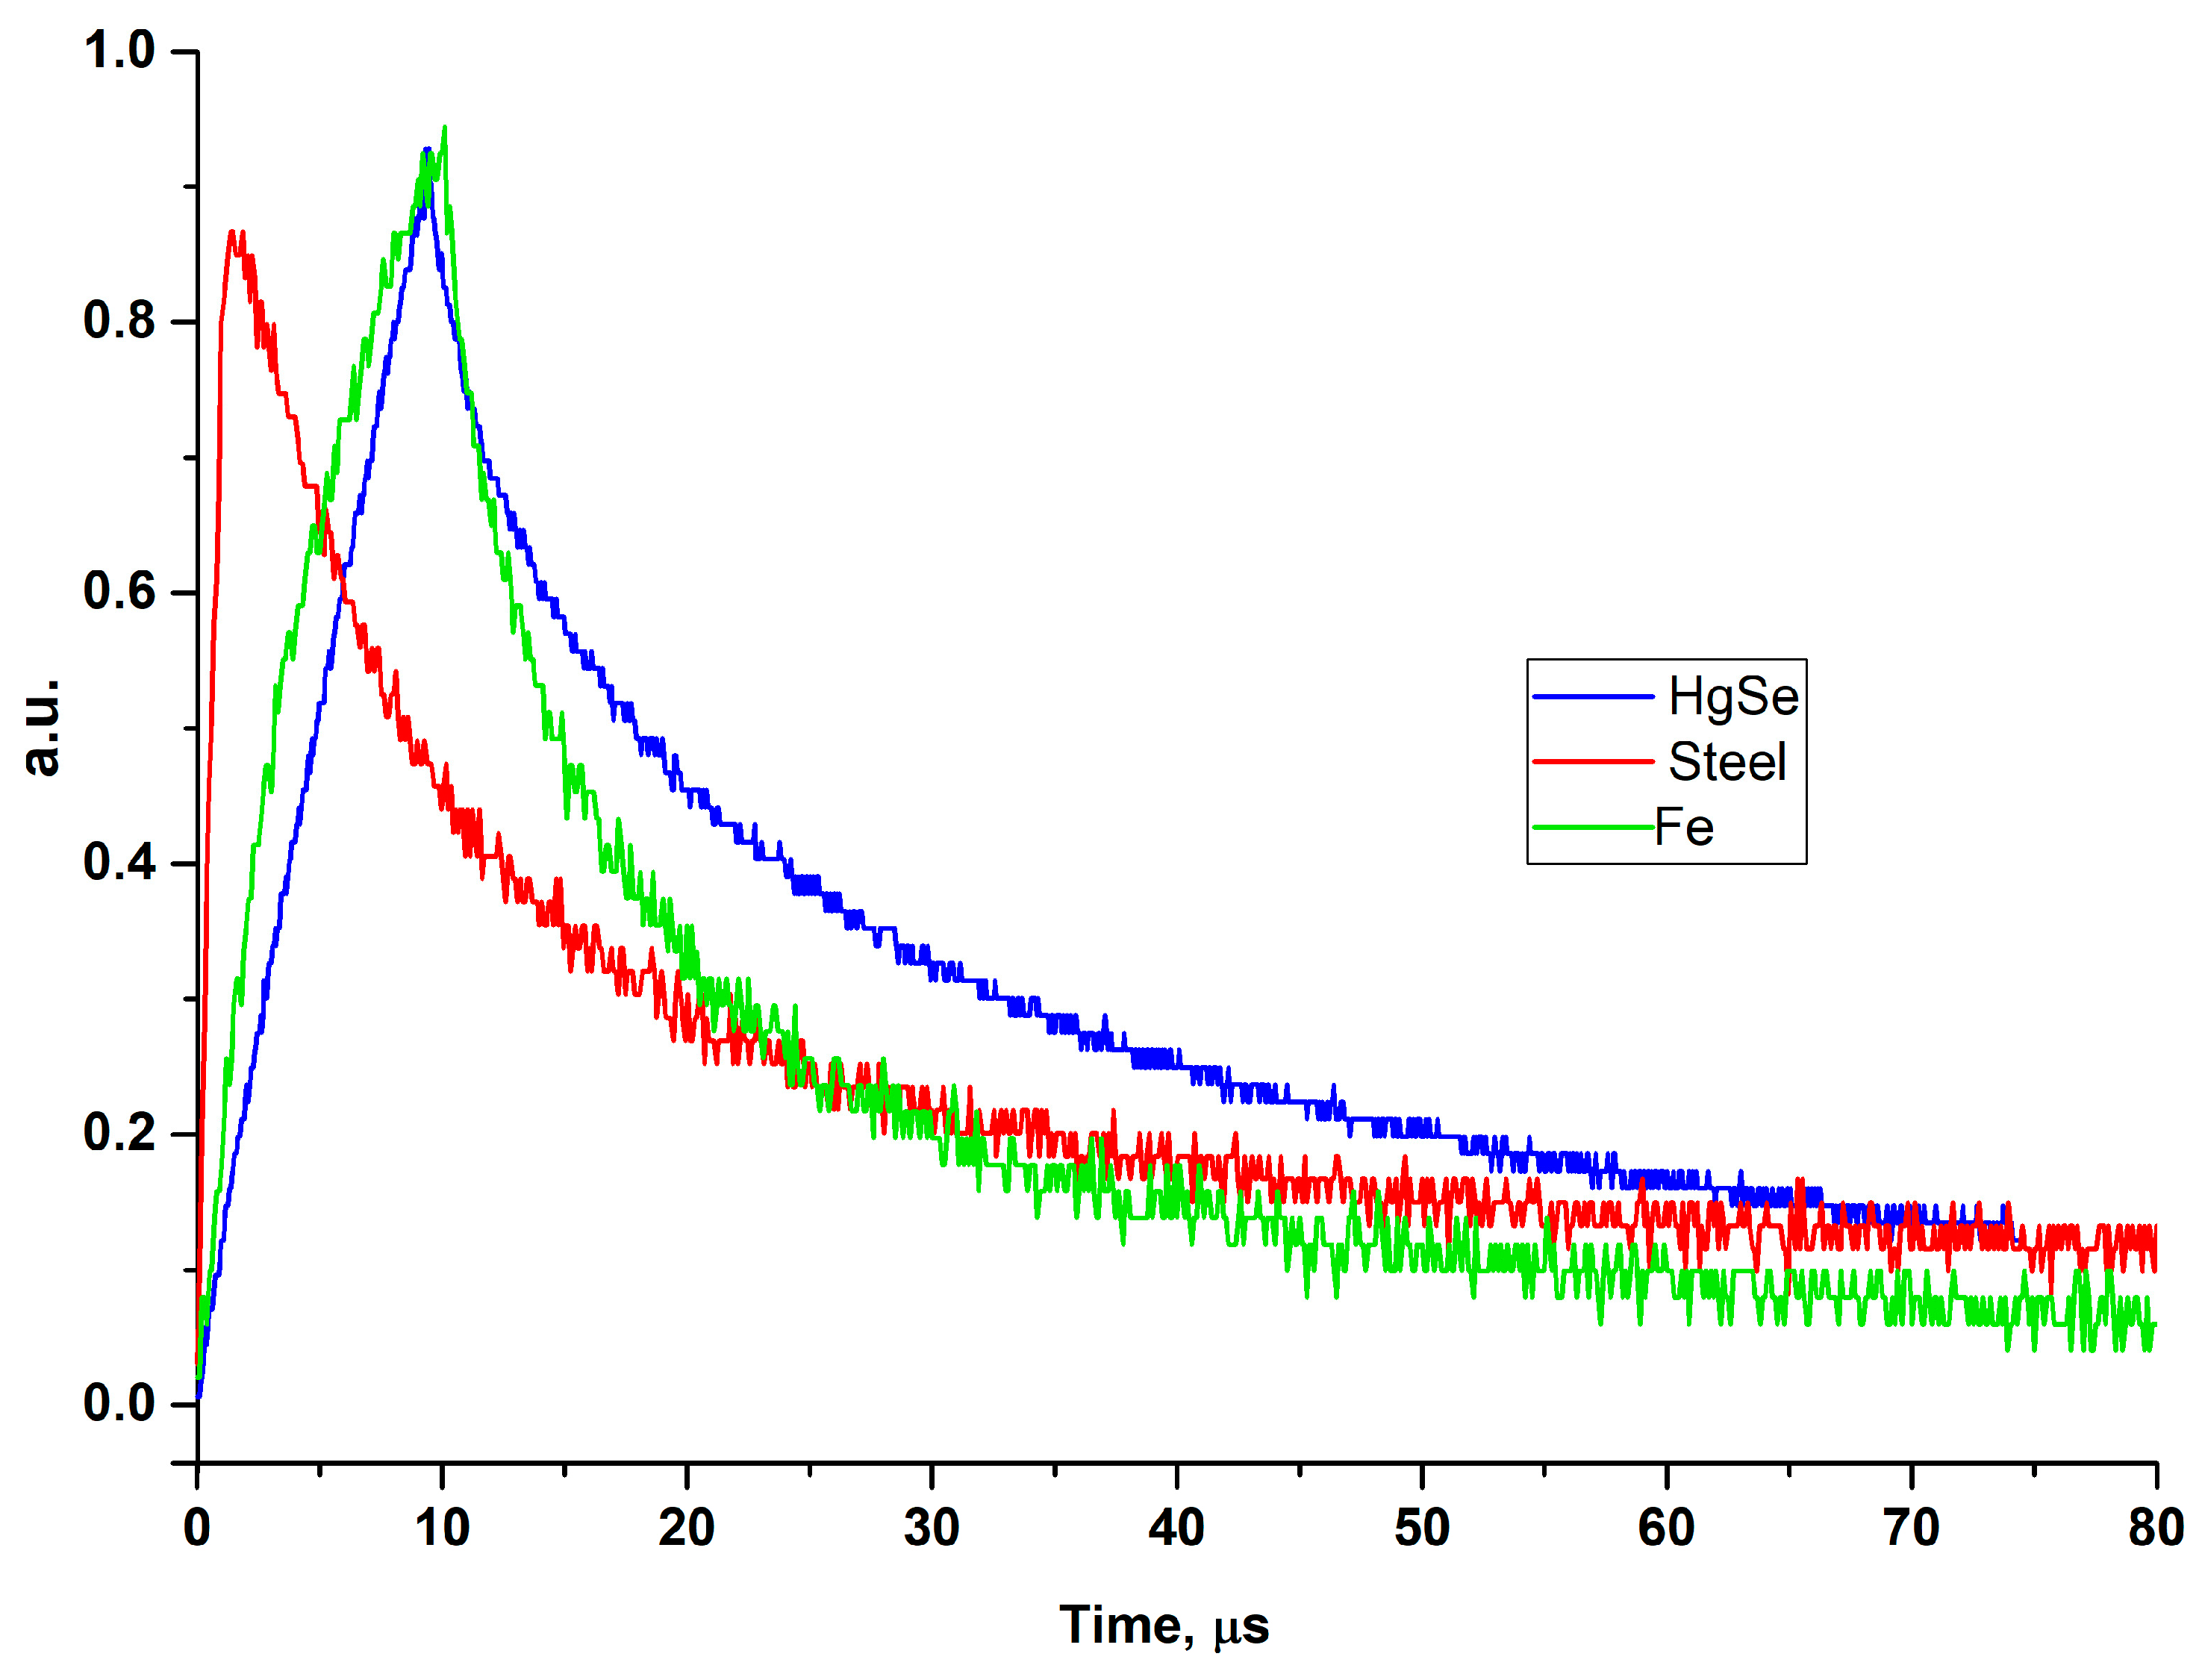
The experiments were carried out on small-sized samples of metals and semiconductors, having a surface area measured in units to tens of square millimetres. The size of the heated spot on the sample surface was up to 100 µm, while the measuring area of the EFPI interferometer in the centre of the heating spot corresponded to the size of a single light-guide mode of about 10 µm. According to estimates available elsewhere [19,20], the average values of temperature and deformation differ from the actual values by less than 10% when heated by a Gaussian beam at a site three times larger than that of the measuring site. The piezoelectric-driven measuring cell was designed in such a way so as to permit experiments to be conducted across a wide temperature range [7]. After setting the average temperature of the sample, the interferometer operating point was adjusted. Then, a series of heating pulses was applied with simultaneous control of the interferometer signal. The signal observed on the oscilloscope contained heating and cooling sections. The amplitude and speed of transients depended on the duration of the heating pulse, the properties of the sample and the size of the heating spot. Figure 4 shows the characteristic dependences of the recorded signals for the selected samples of metals and semiconductors. Higher values of the thermal diffusivity of metals contribute to faster processes of heat relaxation and, accordingly, higher values of the rate of change of the recorded signals.

4. Discussion

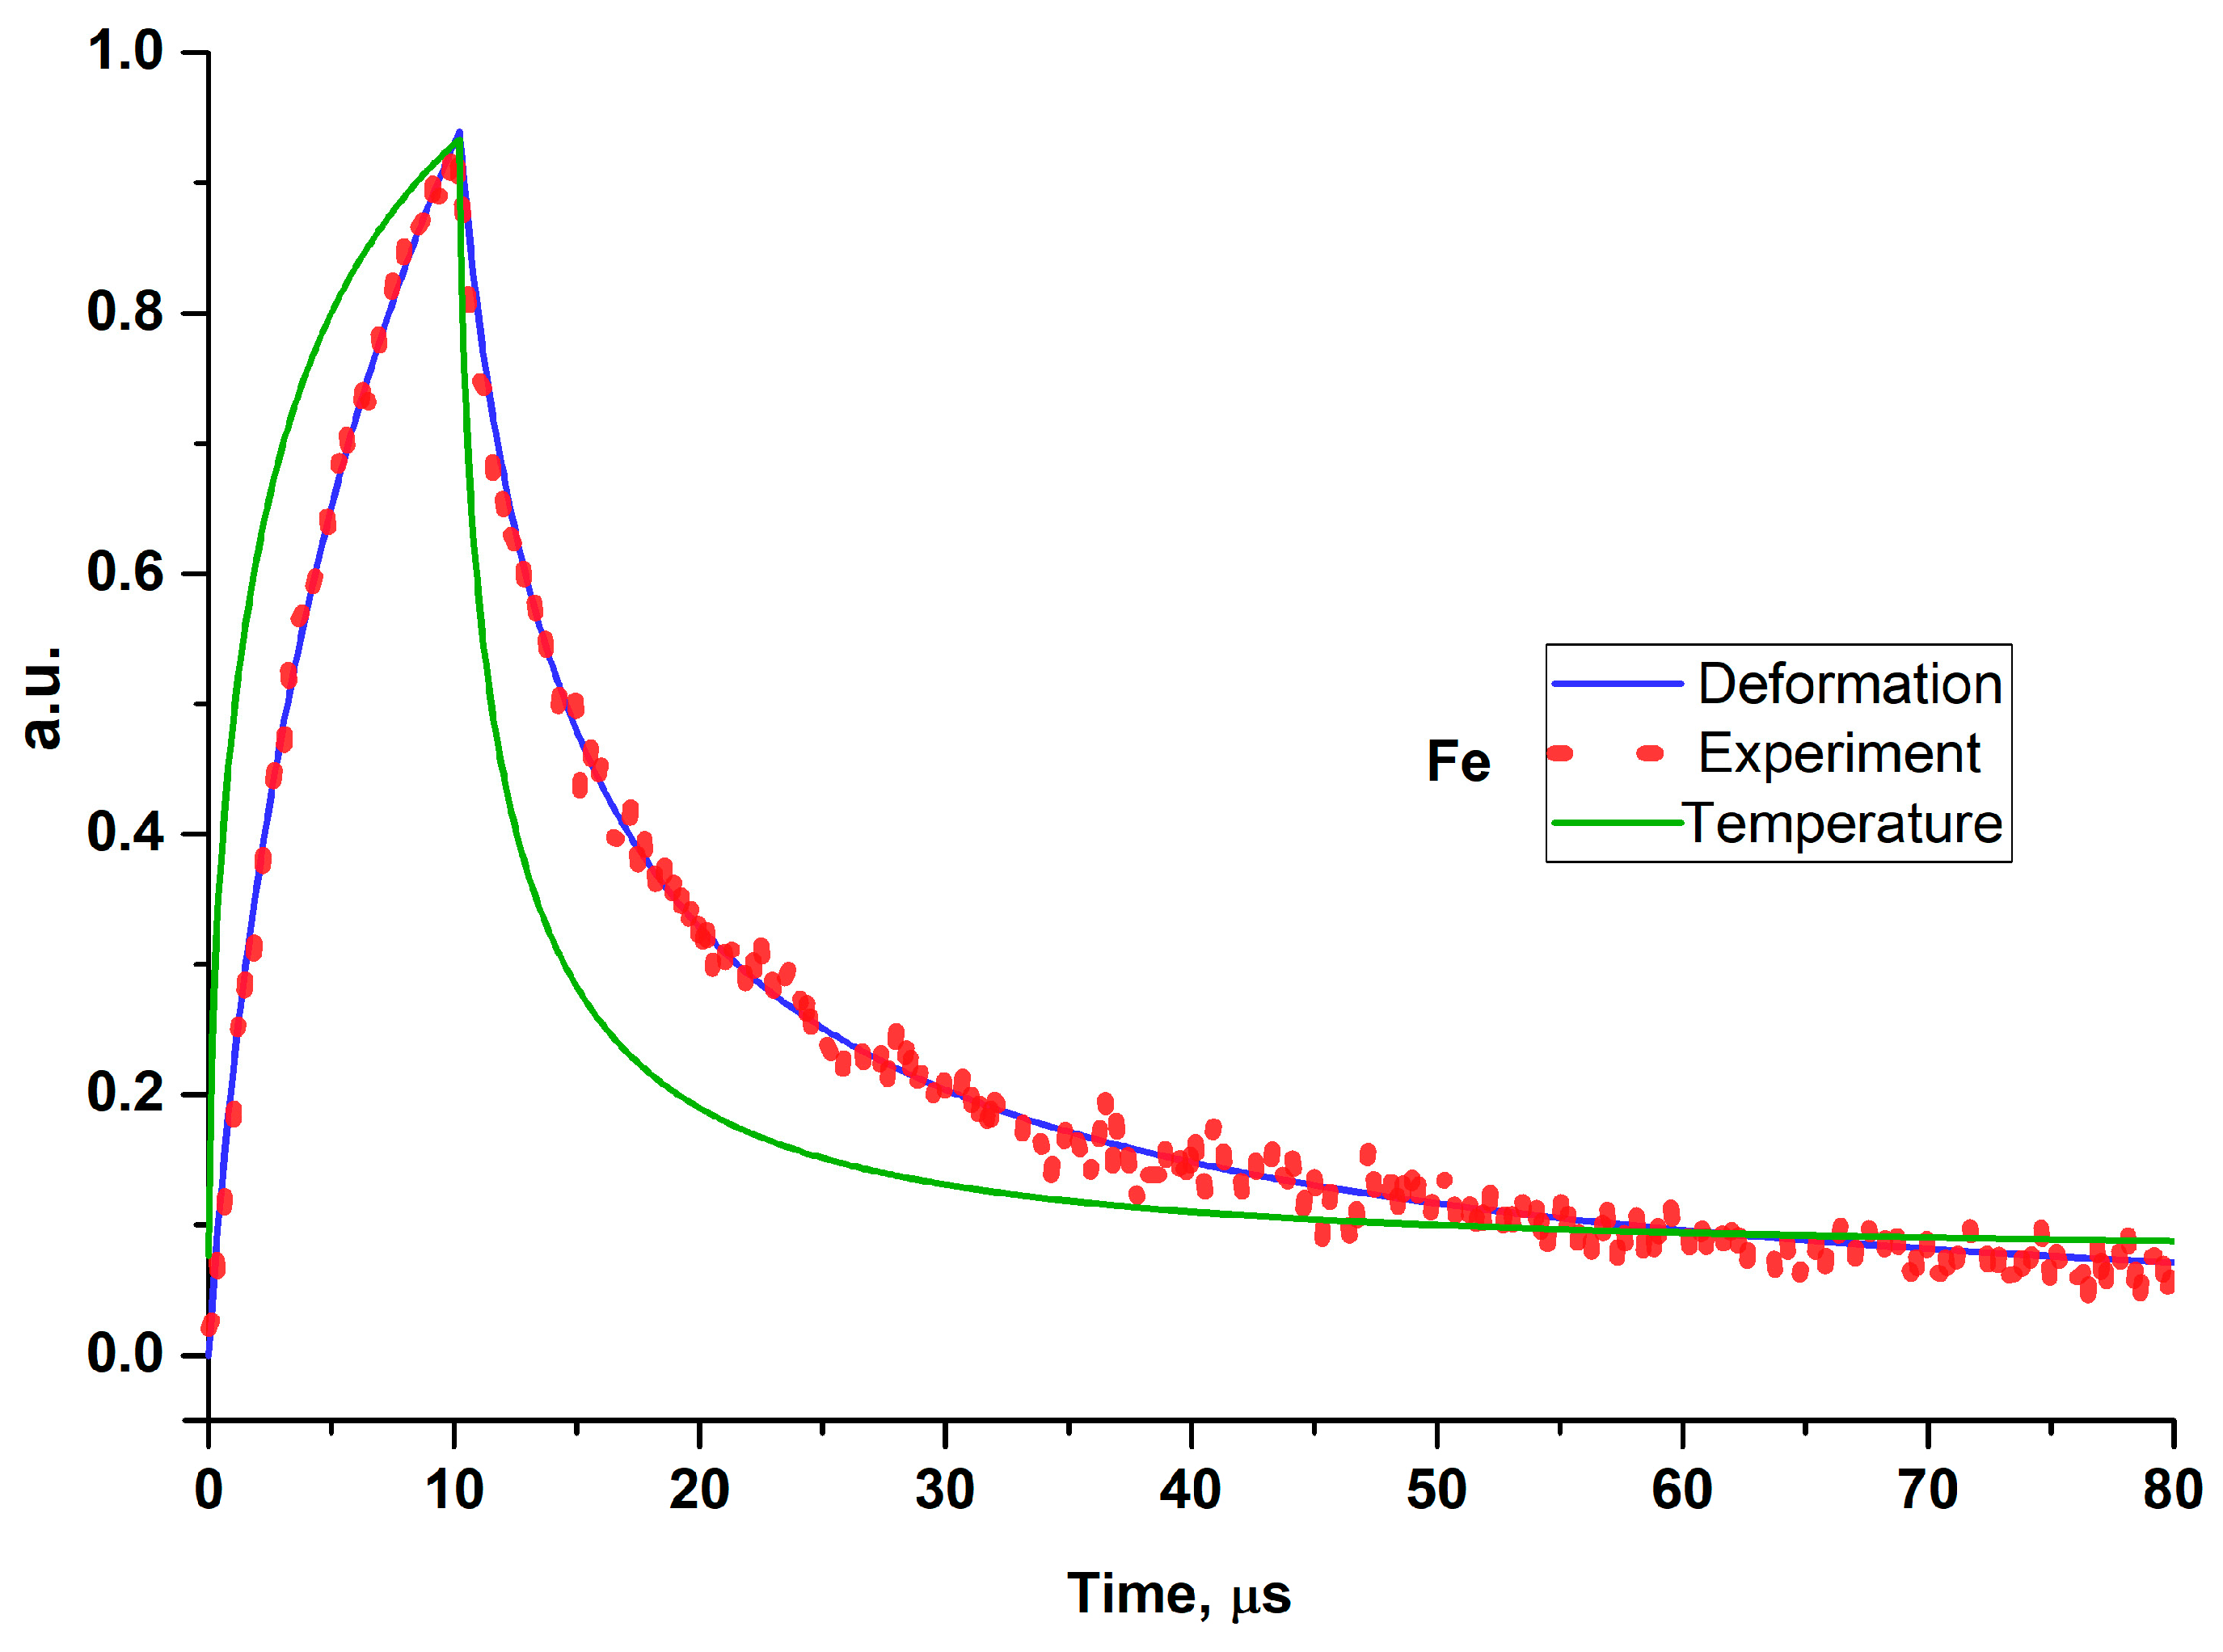
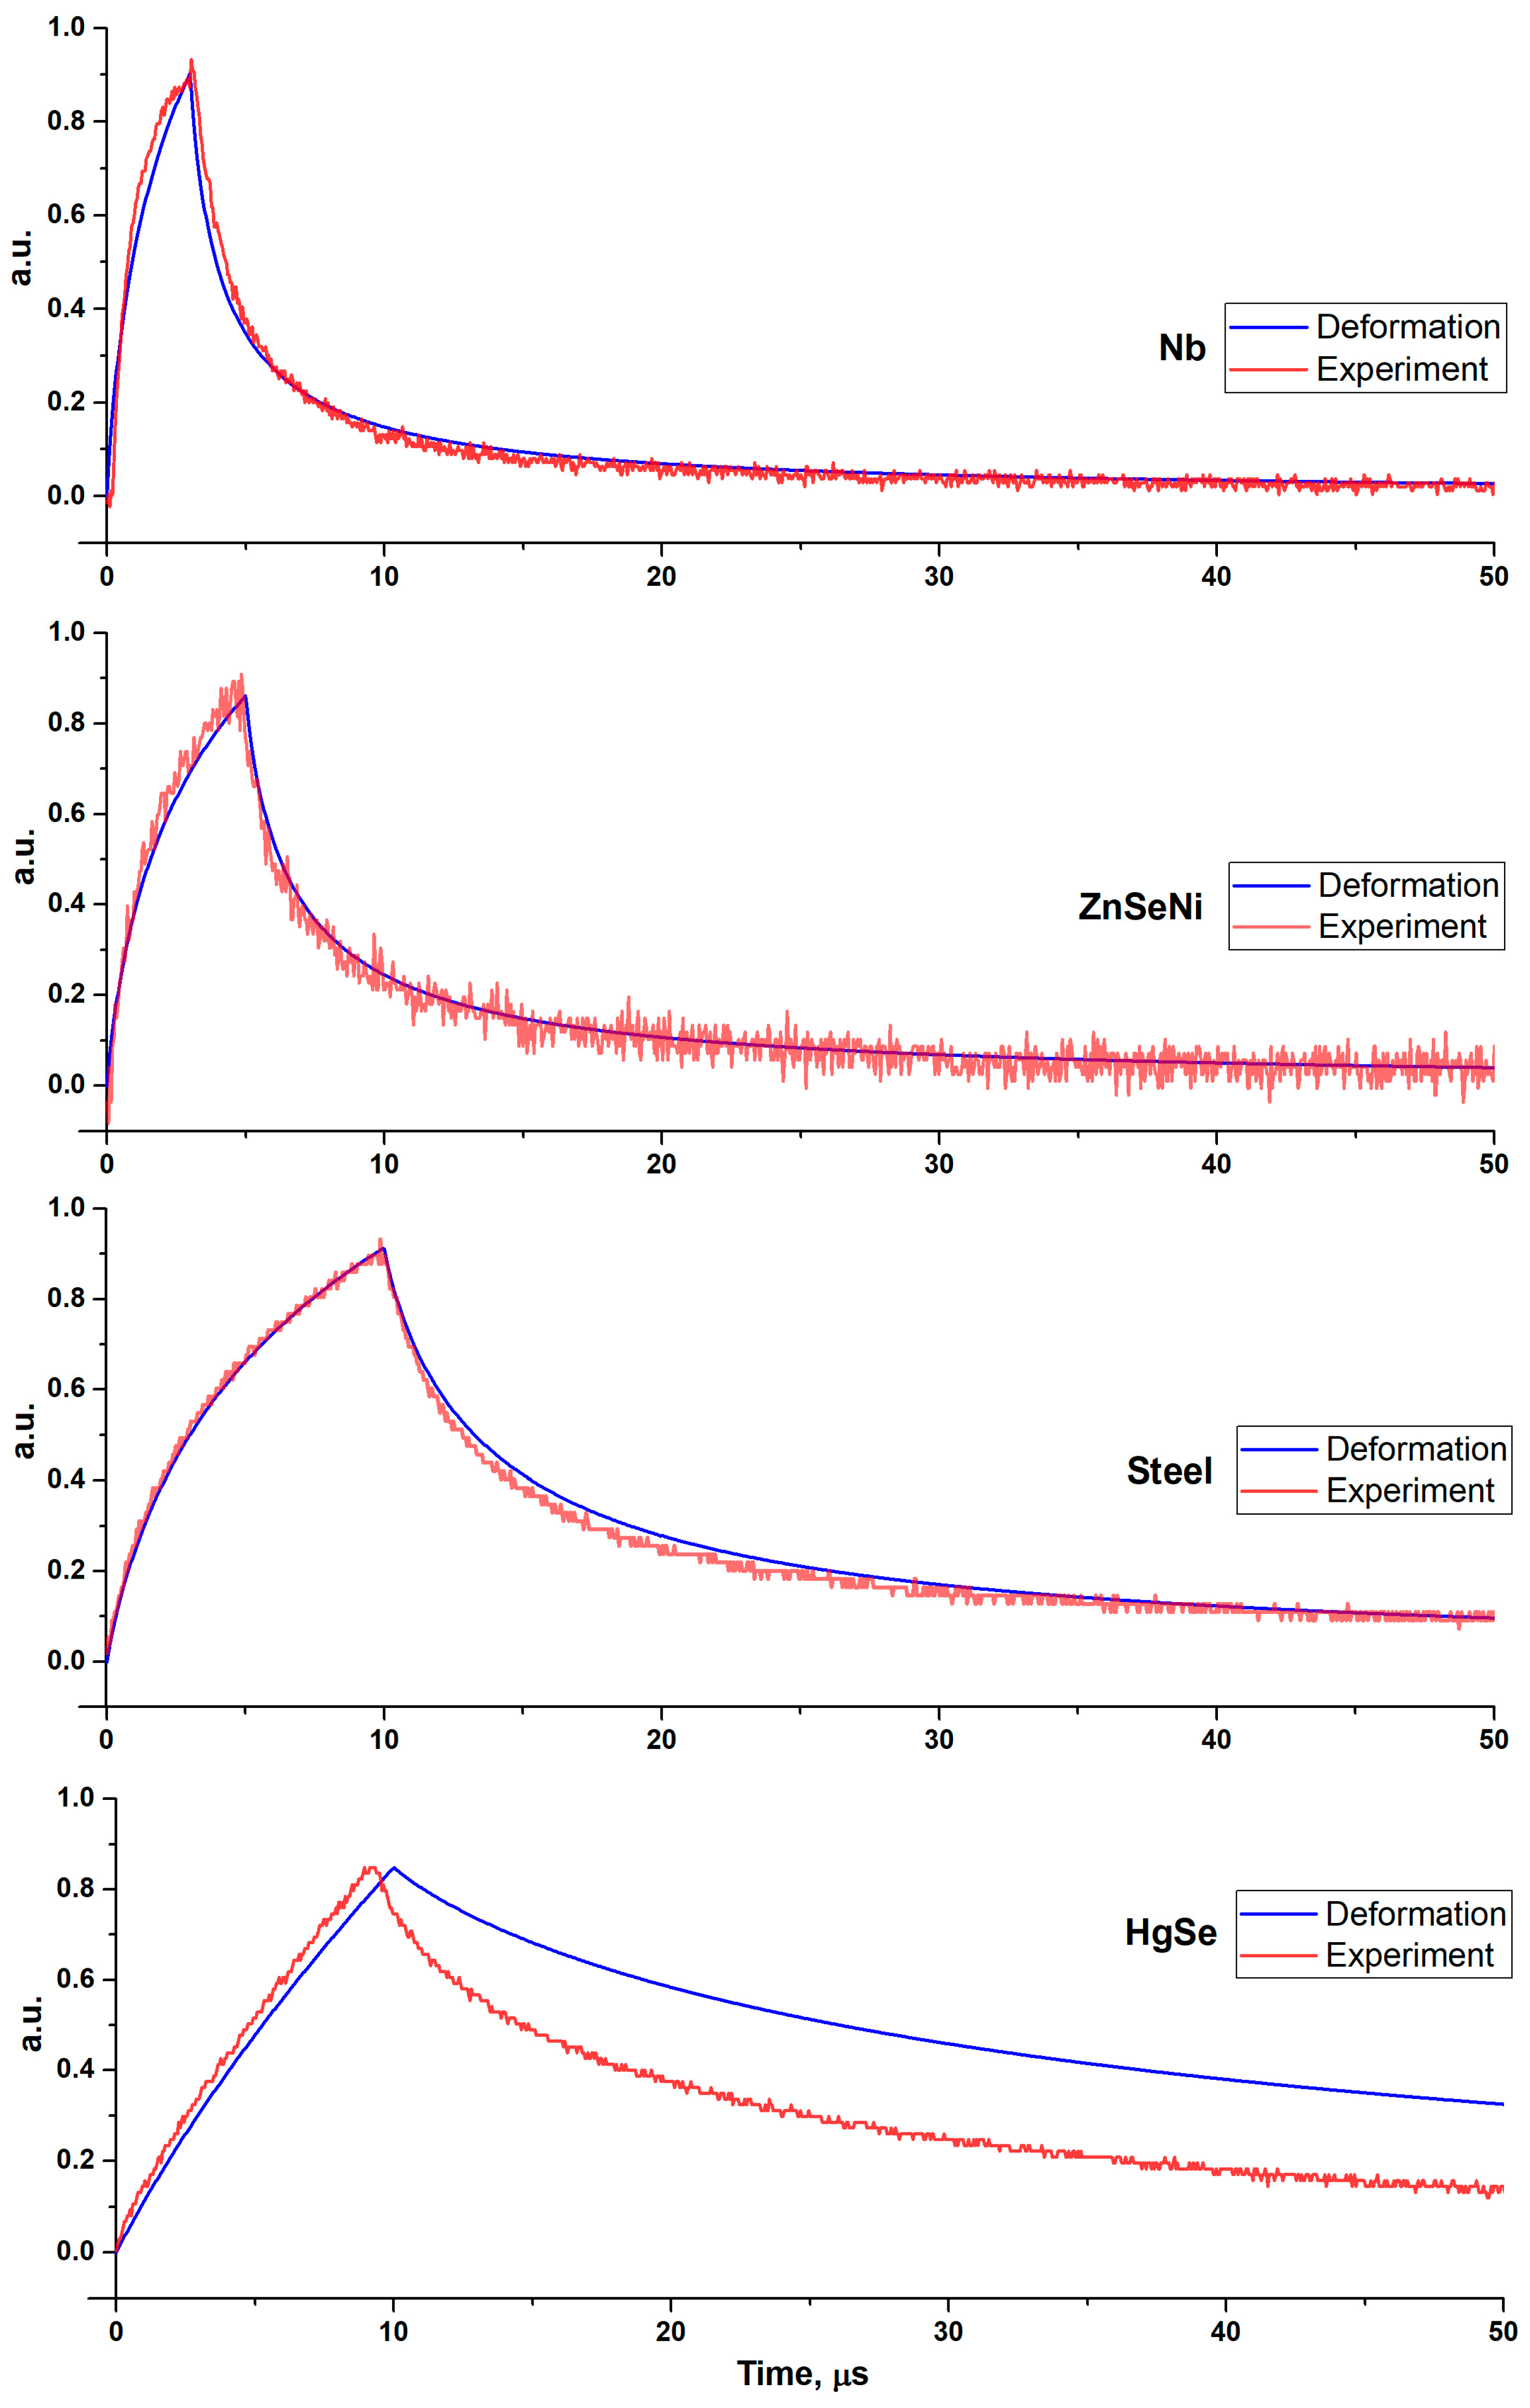
The formation of the interferometer signal is possible both when the heated surface is deformed and when its optical characteristics change with temperature. In both cases, there is a change in the phase characteristic of reflections in the interferometer. The amplitude at the level of 1% of the magnitude of the linear section of the interferometer characteristic of the observed signals suggests the additive influence of both factors. The experimental data presented in Figure 5 show the relationship between the shape of the recorded signals and the normalised calculated dependences of temperature change and deformation in the centre of the heating spot.
Our first hypothesis with regard to the direct dependence of the recorded signal on temperature changes was not confirmed. On the contrary, the second hypothesis on the existence of a relationship between the signal change and the heated surface thermal deformations has been confirmed by the mathematical model of the surface displacement.
Figure 5 shows the better correspondence between experimental data and the model of the thermal deformation process, with respect to the temperature change.
To obtain a better agreement between the calculation result and the experiment, the procedure of the iterative fitting of the deformation curve uz to the experimental data were carried out. The target fitting criterion was to minimise the standard deviation of the difference between values calculated and revealed in the experiment.
In the used model, the main influence on the signal shape is assumed to be due to changes in the thermal diffusivity of the sample and the size of the heated area. Deformations of the sample are delayed relative to temperature changes. Comparing experimental data with model data, it is possible to estimate the influence of each factor on the formation of the resulting signal. Figure 6 depicts the corresponding dependences, which demonstrate the predominance of the mechanism of thermal deformations in the case of metal samples and the total effect of both factors in the case of semiconductors.
The reflected optical signal is recorded as voltage fluctuations of the photodetector. However, the results (Figure 4, Figure 5 and Figure 6) are given in relative units. The signal scale significantly depends on the heating conditions of the sample, which are also affected by the settings of the measuring system and the local optical properties of the material. The normalised signals obtained in a series of successive experiments can be used to study the mechanical effects of thermal deformation and the dynamics of thermal processes. The results presented in the graphs were obtained by accumulating and averaging 256 pulsed experiments with appropriate synchronisation. Deviations in a series of measurements did not exceed a few percent. An additional advantage of signal averaging and accumulation is the possibility of improving the quality of the obtained experimental data. Thermo-optical signals have a small amplitude (appeared to be in the range of 10–50 mV) with a noise level of about 5 mV. Accumulation with averaging allows an increase in the signal-to-noise ratio by over 10 times.
Statistical results for the studied materials are presented in Table 1. The data show correspondence between the model prediction and the experimental data. To calculate the standard deviation, a preliminary calculation of the difference between the values of the strain uz and the normalised reflection signal for each time interval of the experiment was performed. Then, for the obtained data, the standard deviation, expressed as a percentage, was calculated. The Pearson criterion was calculated for two discrete datasets for the strain curves uz and the experimental data.
Experiments carried out with various materials revealed a strong dependence of the amplitude of the recorded signal on the size of the gap between the light guide and the sample in accordance with Formulas (5) and (6). Nevertheless, relative changes in the gap over the linear section of the characteristic are experimentally controlled with respect to the position of the interferometer baseline. The absolute value of the gap can be determined by analysing the spectral characteristics of the interferometer at different probing radiation wavelengths. In this work, relative measurements of the thermo-optical signal were carried out at one wavelength. In addition, the amplitude and shape of the signal depended on the relative position of the studied area on the sample surface. Thus, the thermo-optical signal carries information on the changes in the optical and thermophysical properties of the sample surface [13,28]. Prompt receipt and analysis of this information allow the intensity of the impact (in particular, the thermal one) on the sample to be regulated for various purposes, including the creation and preservation of selected structures on the surface, as well as their modification and destruction.

5. Conclusions

In the course of the study, the possibility of assessing the intensity of pulse heat treatment processes on the microsites of the surface of samples by means of low-coherence interferometry was revealed. This was implemented in a compact fibre-optic circuit with a simultaneous supply of heating and probing radiation through a single-mode light guide. The structure of fibre optics in the pump–probing circuit with an extrinsic Fabry–Pérot interferometer for a high-speed thermo-optical control of thermal processes during pulsed laser heating was investigated. By adjusting the EFPI gap, it is possible to increase the size of the heating area to 50 µm with a constant size of the measuring area in the centre of the heating spot of about 10 µm. Experiments were carried out on metal and semiconductor samples. In the case of metal samples, a comparison of experimental data with modelling calculations showed that the recorded signal corresponds to the temporal dependences of thermal deformations. In the case of semiconductors, a more complex combination of thermo-optical effects was identified. The applicability of the proposed scheme for the characterisation of near-surface properties on microsites of the sample by the relaxation rate of a pulsed thermal disturbance was demonstrated.
For the presented samples, differences in the rate of signal change are clearly visible depending on their thermal diffusivity and the size of the heating area. If the gap between the end of the fibre and the surface of the sample has been fixed, then the size of the heating area will be close to a constant value. As a result, if we analyse the rate of signal change in the course of cooling stage, we can draw conclusions on the differences of the thermal diffusivity of several samples. It is also possible to evaluate the change in the local values of thermal diffusivity on the surface of an inhomogeneous sample.
The ongoing work will develop in the direction of isolating contributions from surface displacement and changes in the optical characteristics of semiconductor samples due to differences in the rate of their manifestation in the interferometer signal.

Author Contributions

Conceptualisation, A.A.S. and P.V.S.; methodology, A.N.K. and A.A.S.; software V.I.G.; hardware A.N.K. and V.I.G.; validation, A.N.K., A.A.S. and P.V.S.; writing—original draft preparation, A.A.S., P.V.S. and A.N.K.; writing—review and editing, A.A.S. and P.V.S. All authors have read and agreed to the published version of the manuscript.

Funding

The investigation has been conducted at the expense of a grant by the Russian Science Foundation (project no. 22-29-00789).

Data Availability Statement

Data available on request due to organisation rules.

Conflicts of Interest

The authors declare no conflict of interest.

List of Symbols and Abbreviations

Definition
Subscripts
AAperture
pPressure
dDuration
rRadiation
TThermal
zz-axis direction
Variables and functions
αTCoefficient of linear thermal expansion
βVariable of integration
δDelta function
ηAttenuation coefficient of the radiation intensity
λWavelength of the probing radiation
νPoisson’s ratio
ππ number
ρ0Density of the material
τCharacteristic thermal time
τdDuration of the radiation pulse
φPhase shift of the radiation reflected from the sample
ωRadius of the Gaussian light beam
ω0Half diameter of the mode spot of the light guide
aThermal diffusivity
cpSpecific heat capacity
EPulse energy
E0Absorbed pulse energy
FHeating source function
fNormalised dependence of the pulse amplitude on time
IGaussian power distribution
IrRadiation intensity in time at the EFPI output
I0Initial radiation intensity at the EFPI input
LInterferometer gap size
L0Rayleigh beam length
NAFibre core numerical aperture
nRefractive index of the medium in the interferometer gap
RAverage reflection coefficient
rRadial distance from heating centre
TTemperature change
tTime
tVariable of integration
ΔtIntegration time
u0Quasi-one-dimensional mode amplitude
uzNormal thermal deformations along heated surface
WLocal surface heat source
Abbreviations
DFBDistributed feedback laser diode
EFPIExternal Fabry–Pérot interferometer

References

  1. Kennedy, D.; Xue, Y.; Mihaylova, M. Current and Future Applications of Surface Engineering. Eng. J. 2005, 59, 287–292. [Google Scholar]
  2. Kannatey-Asibu, E. Laser surface modification. In Principles of Laser Materials Processing, 2nd ed.; Wiley: Hoboken, NJ, USA, 2023; pp. 568–616. [Google Scholar]
  3. Kwok, C.T. Pulsed laser surface treatment of multilayer gold-nickel-copper (Au/Ni/Cu) coatings to improve the corrosion resistance of components in electronics. In Laser Surface Modification of Alloys for Corrosion and Erosion Resistance; Kwok, C.T., Ed.; Elsevier Science: Amsterdam, The Netherlands, 2012. [Google Scholar]
  4. Orazi, L.; Rota, A.; Reggiani, B. Experimental investigation on a novel approach for laser surface hardening modelling. Int. J. Mech. Mater. Eng. 2021, 16, 2. [Google Scholar] [CrossRef]
  5. Malinauskas, M.; Žukauskas, A.; Hasegawa, S.; Hayasaki, Y.; Mizeikis, V.; Buividas, R.; Juodkazis, S. Ultrafast laser processing of materials: From science to industry. Light Sci. Appl. 2016, 5, e16133. [Google Scholar] [CrossRef] [PubMed] [Green Version]
  6. Shugaev, M.V.; He, M.; Levy, Y.; Mazzi, A.; Miotello, A.; Bulgakova, N.M.; Zhigilei, L.V. Laser-Induced Thermal Processes: Heat Transfer, Generation of Stresses, Melting and Solidification, Vaporization, and Phase Explosion. In Handbook of Laser Micro—And Nano-Engineering; Sugioka, K., Ed.; Springer: Cham, Switzerland, 2020; pp. 83–163. [Google Scholar] [CrossRef]
  7. Starostin, A.A.; Shangin, V.V.; Lonchakov, A.T.; Kotov, A.N.; Bobin, S.B. Laser Pump Probe Fiber Optic Technique for Characterization of Near Surface Layers of Solids: Development and Application Prospects for Studying Semiconductors and Weyl Semimetals. Annal. der Physik. 2020, 532, 1900586–1900593. [Google Scholar] [CrossRef]
  8. Lipnyagov, E.V.; Gurashkin, A.L.; Starostin, A.A.; Skripov, P.V. Going to Spontaneous Boiling-Up Onset. J. Eng. Thermophys. 2018, 27, 307–318. [Google Scholar] [CrossRef]
  9. Kotov, A.N.; Gurashkin, A.L.; Starostin, A.A.; Skripov, P.V. Low-Energy Activation of Superheated N-pentane Booling-Up by Laser Pulse at the Fiber-Liquid Interface. Interfacial Phenom. Heat Transf. 2022, 10, 15–23. [Google Scholar] [CrossRef]
  10. Zhu, J.; Wu, X.; Lattery, D.M.; Zheng, W.; Xi, W. The Ultrafast Laser Pump-Probe Technique for Thermal Characterization of Materials with Micro/nanostructures. Nanoscale Microscale Thermophys. Eng. 2017, 21, 177–198. [Google Scholar] [CrossRef]
  11. Magunov, A.N. Laser Thermometry of Solids: State of the Art and Problems. Meas. Tech. 2002, 45, 173–181. [Google Scholar] [CrossRef]
  12. Hovell, T.; Petzing, J.; Justham, L.; Kinnell, P. From Light to Displacement: A Design Framework for Optimising Spectral-Domain Low-Coherence Interferometric Sensors for In Situ Measurement. Appl. Sci. 2020, 10, 8590. [Google Scholar] [CrossRef]
  13. Escola, F.Z.; Kunik, D.; Martinez, O.E.; Mingolo, N. Photothermal Microscopy. Procedia Mater. Sci. 2015, 8, 665–673. [Google Scholar] [CrossRef] [Green Version]
  14. Proskurnin, M.A.; Khabibullin, V.R.; Usoltseva, L.O.; Vyrko, E.A.; Mikheev, I.V.; Volkov, D.S. Photothermal and optoacoustic spectroscopy: State of the art and prospects. Phys.-Uspekhi 2022, 65, 270–312. [Google Scholar] [CrossRef]
  15. Capeloto, O.A.; Lukasievicz, G.V.B.; Zanuto, V.S.; Herculano, L.S.; Souza Filho, N.E.; Novatski, A.; Malacarne, L.C.; Bialkowski, S.E.; Baesso, M.L.; Astrath, N.G.C. Pulsed photothermal mirror technique: Characterization of opaque materials. Appl. Opt. 2014, 53, 7985–7991. [Google Scholar] [CrossRef] [PubMed]
  16. Marcano, A.; Gwanmesia, G.; Workie, B. Photothermal Mirror Method for the Study of Thermal Diffusivity and Thermo-Elastic Properties of Opaque Solid Materials. Int. J. Thermophys. 2017, 38, 136. [Google Scholar] [CrossRef]
  17. Sato, F.; Malacarne, L.C.; Pedreira, P.R.B.; Belancon, M.P.; Mendes, R.S.; Baesso, M.L.; Astrath, N.G.C.; Shen, J. Time-resolved thermal mirror method: A theoretical study. J. Appl. Phys. 2008, 104, 053520. [Google Scholar] [CrossRef]
  18. Flizikowski, G.A.S.; Anghinoni, B.; Rohling, J.H.; Belançon, M.P.; Mendes, R.S.; Baesso, M.L.; Malacarne, L.C.; Požar, T.; Bialkowski, S.E.; Astrath, N.G.C. Influence of edge effects on laser-induced surface displacement of opaque materials by photothermal interferometry. J. Appl. Phys. 2020, 128, 044509. [Google Scholar] [CrossRef]
  19. Vintsents, S.V.; Dmitriev, S.G.; Shagimuratov, O.G. Instantaneous profiles of quasistatic deformations and displacements of solid surfaces during local laser irradiation. Phys. Solid State 1996, 38, 552–557. [Google Scholar]
  20. Vintsents, S.V.; Dmitriev, S.G.; Spiridonov, K.I. Quasi-one-dimensional thermal deformation and displacement of the surface of a solid in a pulsed laser beam. Phys. Solid State 1997, 39, 1985–1988. [Google Scholar] [CrossRef]
  21. Huang, Y.W.; Tao, J.; Huang, X.G. Research Progress on F-P Interference—Based Fiber-Optic Sensors. Sensors 2016, 16, 1424. [Google Scholar] [CrossRef] [Green Version]
  22. Liokumovich, L.; Markvart, A.; Ushakov, N. Utilization of extrinsic Fabry-Perot interferometers with spectral interferometric interrogation for microdisplacement measurement. J. Electron. Sci. Technol. 2020, 18, 100030. [Google Scholar] [CrossRef]
  23. Jiang, Y.; Ding, W. Recent developments in fiber optic spectral white-light interferometry. Photonic Sens. 2011, 1, 62–71. [Google Scholar] [CrossRef] [Green Version]
  24. Lee, B.H.; Kim, Y.H.; Park, K.S.; Eom, J.B.; Kim, M.J.; Rho, B.S.; Choi, H.Y. Interferometric Fiber Optic Sensors. Sensors 2012, 12, 2467–2486. [Google Scholar] [CrossRef] [PubMed] [Green Version]
  25. Ushakov, N.; Liokumovich, L. Resolution limits of extrinsic Fabry—Perot interferometric displacement sensors utilizing wavelength scanning interrogation. Appl. Opt. 2014, 53, 5092–5099. [Google Scholar] [CrossRef] [PubMed]
  26. Chin, K.K.; Sun, Y.; Feng, G.; Georgiou, G.E.; Guo, K.; Niver, E.; Roman, H.; Noe, K. Fabry-Perot diaphragm fiber-optic sensor. Appl. Opt. 2007, 46, 7614–7619. [Google Scholar] [CrossRef] [PubMed]
  27. Liokumovich, L.B.; Ushakov, N.A.; Markvart, A.A.; Evdokimenko, E.Y. The spectral characteristic of a multilayer extrinsic fiber Fabry—Perot interferometer, St. Petersburg State Polytechnical University. J. Phys. Mat. 2022, 15, 129–146. [Google Scholar] [CrossRef]
  28. Zhukovsky, K. Operational Approach and Solutions of Hyperbolic Heat Conduction Equations. Axioms 2016, 5, 28. [Google Scholar] [CrossRef] [Green Version]
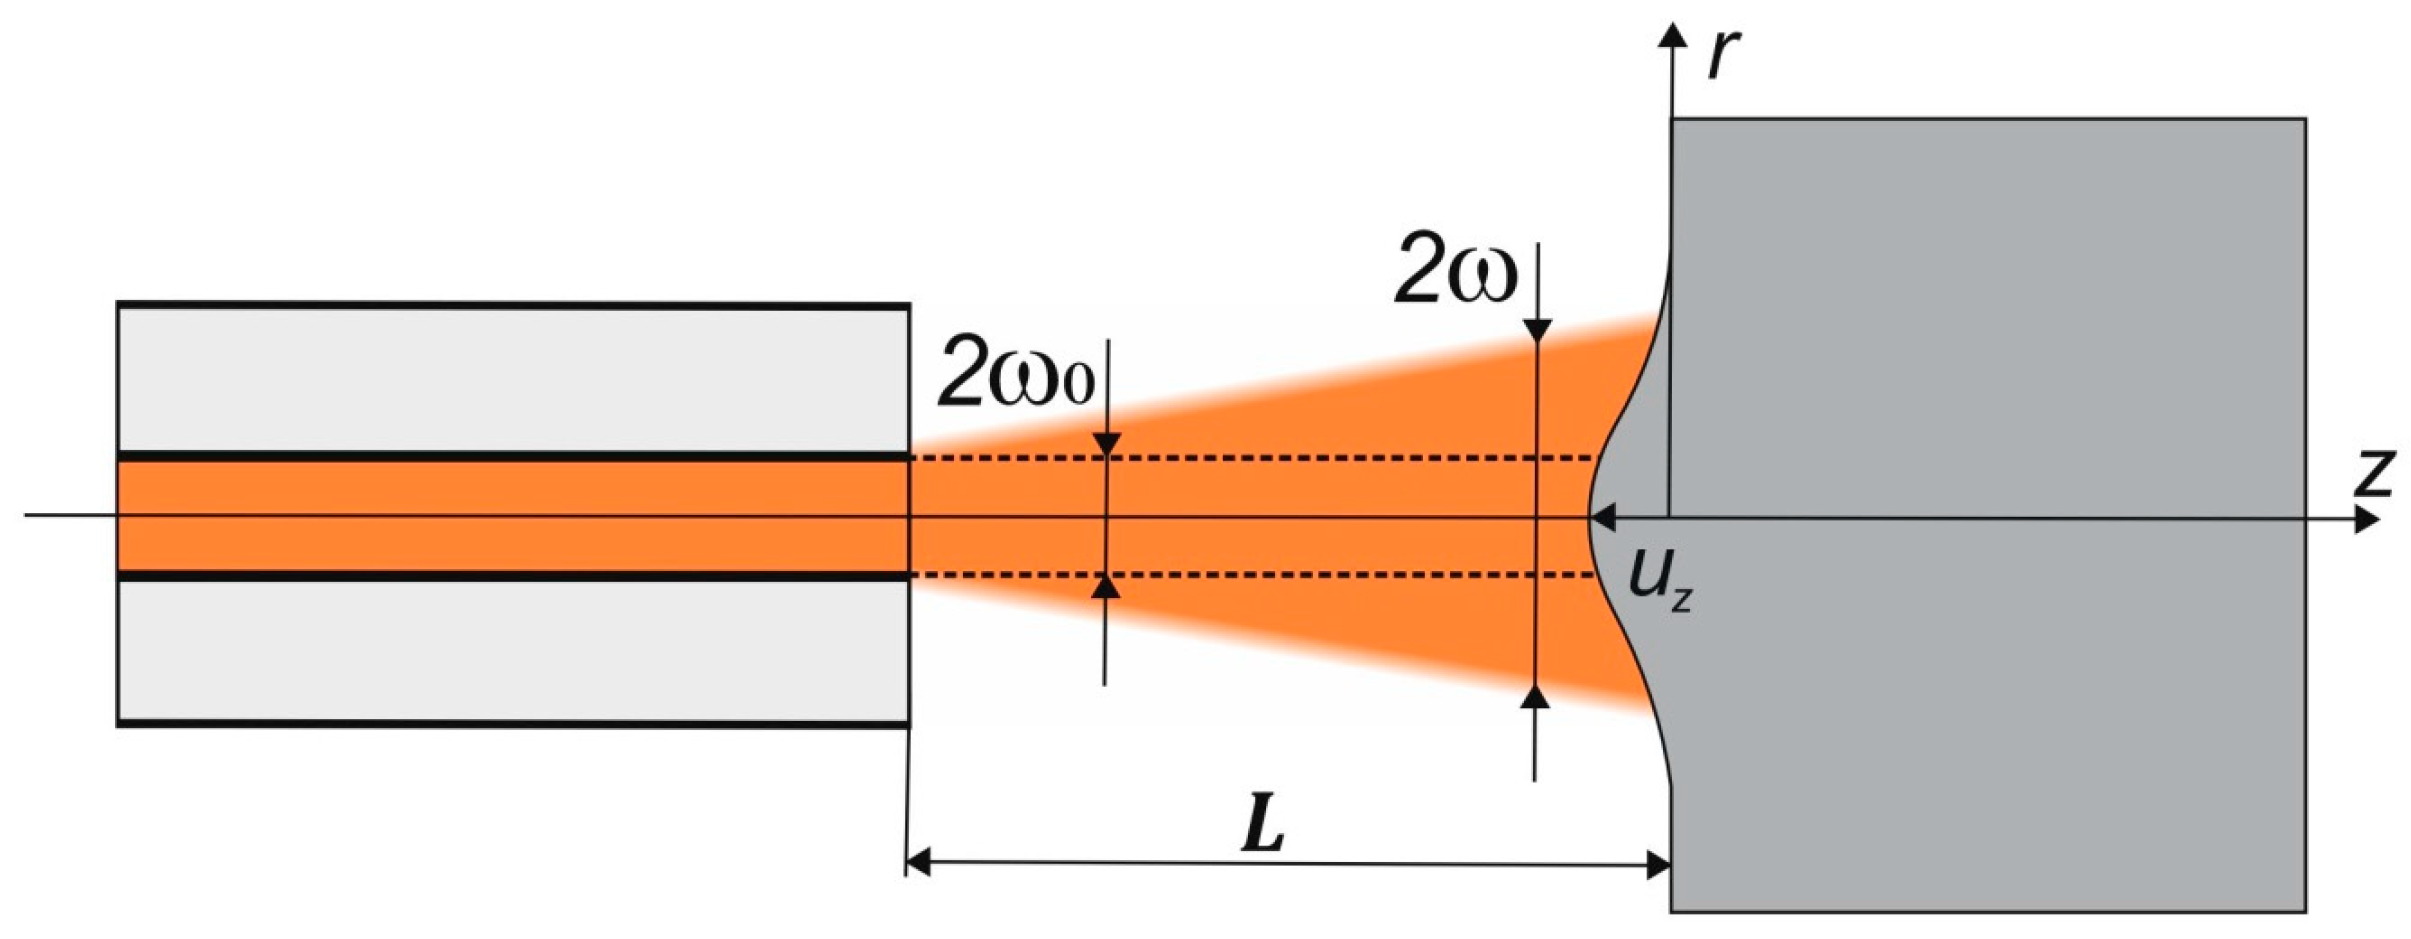
Figure 1. Geometric diagram of the procedures for heating and testing the sample surface.
Axioms 12 00568 g001
Figure 2. Retardation of thermal deformation in the centre of the heating spot with respect to temperature change.
Axioms 12 00568 g002
Figure 3. Experimental setup of a laser surface heating with an EFPI fibre-optic interferometer.
Axioms 12 00568 g003
Figure 4. Experimental data of laser heating with EFPI interferometer for different samples. Typical response signals to laser heating with EFPI interferometer for samples under investigation.
Axioms 12 00568 g004
Figure 5. Comparison of normalised calculated dependences of temperature change and deformation in the centre of the heating spot with experimental data.
Axioms 12 00568 g005
Figure 6. Experimental results and normalised calculation of deformation in the centre of the heating spot for different samples.
Axioms 12 00568 g006
Table 1. Correlation statistics and fitting parameter data.
ParameterNbZnSeNiSteelHgSeFe
Standard deviation, %2.1923.3411.5938.9352.068
Pearson correlation coefficient0.99450.98560.99730.90620.9960
Thermal diffusivity a, m2/s2.48·10−51.05·10−54·10−61.18·10−62.2·10−5
Disclaimer/Publisher’s Note: The statements, opinions and data contained in all publications are solely those of the individual author(s) and contributor(s) and not of MDPI and/or the editor(s). MDPI and/or the editor(s) disclaim responsibility for any injury to people or property resulting from any ideas, methods, instructions or products referred to in the content.