


Uncovering the Impact of Local and Global Interests in Artists on Stock Prices of K-Pop Entertainment Companies: A SHAP-XGBoost Analysis


Abstract
1. Introduction
2. Literature Review
2.1. Social Network Service Data
2.2. Entertainment Stock
2.3. XAI
3. Methods
3.1. Extreme Gradient Boosting (XGBoost)
3.2. Shapley Value
4. Data Description
5. SHAP-XGBoost Analysis Results
6. Concluding Remarks
Author Contributions
Funding
Data Availability Statement
Conflicts of Interest
References
- Moussa, F.; BenOuda, O.; Delhoumi, E. The use of open source internet to analysis and predict stock market trading volume. Res. Int. Bus. Financ. 2017, 41, 399–411. [Google Scholar] [CrossRef]
- Chen, Y.; Zhao, H.; Li, Z.; Lu, J. A dynamic analysis of the relationship between investor sentiment and stock market realized volatility: Evidence from China. PLoS ONE 2020, 15, e0243080. [Google Scholar] [CrossRef] [PubMed]
- Lee, C.C.; Chen, M.P.; Lee, C.C. Investor attention, ETF returns, and country-specific factors. Res. Int. Bus. Financ. 2021, 56, 101386. [Google Scholar] [CrossRef]
- Bijl, L.; Kringhaug, G.; Molnár, P.; Sandvik, E. Google searches and stock returns. Int. Rev. Financ. Anal. 2016, 45, 150–156. [Google Scholar] [CrossRef]
- Swamy, V.; Dharani, M.; Takeda, F. Investor attention and Google Search Volume Index: Evidence from an emerging market using quantile regression analysis. Res. Int. Bus. Financ. 2019, 50, 1–17. [Google Scholar] [CrossRef]
- Costola, M.; Iacopini, M.; Santagiustina, C.R. Google search volumes and the financial markets during the COVID-19 outbreak. Financ. Res. Lett. 2021, 42, 101884. [Google Scholar] [CrossRef]
- Klein, T. A note on GameStop, short squeezes, and autodidactic herding: An evolution in financial literacy? Financ. Res. Lett. 2022, 46, 102229. [Google Scholar] [CrossRef]
- Koch, S.; Dimpfl, T. Attention and retail investor herding in cryptocurrency markets. Financ. Res. Lett. 2023, 51, 103474. [Google Scholar] [CrossRef]
- Han, J.; Miao, S.; Li, Y.; Yang, W.; Yin, H. Faulted-Phase classification for transmission lines using gradient similarity visualization and cross-domain adaption-based convolutional neural network. Electr. Power Syst. Res. 2021, 191, 106876. [Google Scholar] [CrossRef]
- Bhatnagar, M.; Yadav, A.; Swetapadma, A. Enhancing the resiliency of transmission lines using extreme gradient boosting against faults. Electr. Power Syst. Res. 2022, 207, 107850. [Google Scholar] [CrossRef]
- Bentéjac, C.; Csörgő, A.; Martínez-Muñoz, G. A comparative analysis of gradient boosting algorithms. Artif. Intell. Rev. 2021, 54, 1937–1967. [Google Scholar] [CrossRef]
- Nasiri, H.; Homafar, A.; Chelgani, S.C. Prediction of uniaxial compressive strength and modulus of elasticity for Travertine samples using an explainable artificial intelligence. Results Geophys. Sci. 2021, 8, 100034. [Google Scholar] [CrossRef]
- Fatahi, R.; Nasiri, H.; Dadfar, E.; Chehreh Chelgani, S. Modeling of energy consumption factors for an industrial cement vertical roller mill by SHAP-XGBoost: A “conscious lab” approach. Sci. Rep. 2022, 12, 7543. [Google Scholar] [CrossRef] [PubMed]
- Yang, Y.; Huang, Q.; Li, P. Online prediction and correction control of static voltage stability index based on Broad Learning System. Expert Syst. Appl. 2022, 199, 117184. [Google Scholar] [CrossRef]
- Zhang, J.; Ma, X.; Zhang, J.; Sun, D.; Zhou, X.; Mi, C.; Wen, H. Insights into geospatial heterogeneity of landslide susceptibility based on the SHAP-XGBoost model. J. Environ. Manag. 2023, 332, 117357. [Google Scholar] [CrossRef]
- Rathnayaka, R.K.T.; Jianguo, W.; Seneviratna, D.N. Geometric Brownian motion with Ito’s lemma approach to evaluate market fluctuations: A case study on Colombo Stock Exchange. In Proceedings of the 2014 International Conference on Behavioral, Economic, and Socio-Cultural Computing (BESC2014), Shanghai, China, 30 October–1 November 2014; pp. 1–6. [Google Scholar]
- Agustini, W.F.; Affianti, I.R.; Putri, E.R. Stock price prediction using geometric Brownian motion. J. Phys. Conf. Ser. 2018, 974, 012047. [Google Scholar] [CrossRef]
- Liu, Z.; Huang, S. Carbon option price forecasting based on modified fractional Brownian motion optimized by GARCH model in carbon emission trading. N. Am. J. Econ. Financ. 2021, 55, 101307. [Google Scholar] [CrossRef]
- Hu, H.; Zhao, C.; Li, J.; Huang, Y. Stock prediction model based on mixed fractional Brownian motion and improved fractional-order particle swarm optimization algorithm. Fractal Fract. 2022, 6, 560. [Google Scholar] [CrossRef]
- Kim, W.J.; Jung, G.; Choi, S.Y. Forecasting Cds term structure based on nelson–siegel model and machine learning. Complexity 2020, 2020, 2518283. [Google Scholar] [CrossRef]
- Shin, S.; Austin, P.C.; Ross, H.J.; Abdel-Qadir, H.; Freitas, C.; Tomlinson, G.; Chicco, D.; Mahendiran, M.; Lawler, P.R.; Billia, F.; et al. Machine learning vs. conventional statistical models for predicting heart failure readmission and mortality. Esc Heart Fail. 2021, 8, 106–115. [Google Scholar] [CrossRef]
- Grendas, L.N.; Chiapella, L.; Rodante, D.E.; Daray, F.M. Comparison of traditional model-based statistical methods with machine learning for the prediction of suicide behaviour. J. Psychiatr. Res. 2022, 145, 85–91. [Google Scholar] [CrossRef] [PubMed]
- Chae, S.C.; Choi, S.Y. Analysis of the Term Structure of Major Currencies Using Principal Component Analysis and Autoencoders. Axioms 2022, 11, 135. [Google Scholar] [CrossRef]
- Barber, B.M.; Odean, T. All that glitters: The effect of attention and news on the buying behavior of individual and institutional investors. Rev. Financ. Stud. 2008, 21, 785–818. [Google Scholar] [CrossRef]
- Da, Z.; Engelberg, J.; Gao, P. In search of attention. J. Financ. 2011, 66, 1461–1499. [Google Scholar] [CrossRef]
- Li, J.; Yu, J. Investor attention, psychological anchors, and stock return predictability. J. Financ. Econ. 2012, 104, 401–419. [Google Scholar] [CrossRef]
- Zhang, W.; Shen, D.; Zhang, Y.; Xiong, X. Open source information, investor attention, and asset pricing. Econ. Model. 2013, 33, 613–619. [Google Scholar] [CrossRef]
- Han, L.; Lv, Q.; Yin, L. Can investor attention predict oil prices? Energy Econ. 2017, 66, 547–558. [Google Scholar] [CrossRef]
- Halousková, M.; Stašek, D.; Horváth, M. The role of investor attention in global asset price variation during the invasion of Ukraine. Financ. Res. Lett. 2022, 50, 103292. [Google Scholar] [CrossRef]
- Bank, M.; Larch, M.; Peter, G. Google search volume and its influence on liquidity and returns of German stocks. Financ. Mark. Portf. Manag. 2011, 25, 239–264. [Google Scholar] [CrossRef]
- Alexander Dietzel, M.; Braun, N.; Schäfers, W. Sentiment-based commercial real estate forecasting with Google search volume data. J. Prop. Invest. Financ. 2014, 32, 540–569. [Google Scholar] [CrossRef]
- Liu, Y.; Chen, Y.; Wu, S.; Peng, G.; Lv, B. Composite leading search index: A preprocessing method of internet search data for stock trends prediction. Ann. Oper. Res. 2015, 234, 77–94. [Google Scholar] [CrossRef]
- Li, X.; Ma, J.; Wang, S.; Zhang, X. How does Google search affect trader positions and crude oil prices? Econ. Model. 2015, 49, 162–171. [Google Scholar] [CrossRef]
- Hu, H.; Tang, L.; Zhang, S.; Wang, H. Predicting the direction of stock markets using optimized neural networks with Google Trends. Neurocomputing 2018, 285, 188–195. [Google Scholar] [CrossRef]
- Huang, M.Y.; Rojas, R.R.; Convery, P.D. Forecasting stock market movements using Google Trend searches. Empir. Econ. 2020, 59, 2821–2839. [Google Scholar] [CrossRef]
- Fan, M.H.; Chen, M.Y.; Liao, E.C. A deep learning approach for financial market prediction: Utilization of Google trends and keywords. Granul. Comput. 2021, 6, 207–216. [Google Scholar] [CrossRef]
- El Ouadghiri, I.; Guesmi, K.; Peillex, J.; Ziegler, A. Public attention to environmental issues and stock market returns. Ecol. Econ. 2021, 180, 106836. [Google Scholar] [CrossRef]
- Dharani, M.; Hassan, M.K.; Abedin, M.Z.; Ismail, M.A. Does a search attention index explain portfolio returns in India? Borsa Istanb. Rev. 2022, 22, 226–239. [Google Scholar] [CrossRef]
- Joshi, A.M.; Hanssens, D.M. Movie advertising and the stock market valuation of studios: A case of “great expectations?”. Mark. Sci. 2009, 28, 239–250. [Google Scholar] [CrossRef]
- Joshi, A. Movie stars and the volatility of movie revenues. J. Media Econ. 2015, 28, 246–267. [Google Scholar] [CrossRef]
- Ltaifa, M.B.; Jamel, L.; Elnagar, A.K.; Derbali, A. Which is Determining in the Fluctuation of Stock Market Risk of Entertainment Compagnies in Viet Nam: Financial and Economic Crisis or Low Inflation Rate? Risk Financ. Manag. 2020, 2, p76. [Google Scholar] [CrossRef]
- Edwards Barros, C.M.; França Lopes, I.; Simão Kaveski, I.D. Pokémon Go!: Stock valuation and disruptive innovation in entertainment industry. Rev. Contemp. Contab. 2021, 18, 47–63. [Google Scholar] [CrossRef]
- Chen, Y. COVID-19 and the Dynamics of Disney’s Stock Price. In Proceedings of the 2022 7th International Conference on Social Sciences and Economic Development (ICSSED 2022), Wuhan, China, 25–27 March 2022; pp. 1425–1431. [Google Scholar]
- Wu, C.; Chen, Z. Media Coverage and the Noneffective Investment. In Proceedings of the 6th International Conference on E-Commerce, E-Business and E-Government, Plymouth, UK, 27–29 April 2022; pp. 10–14. [Google Scholar]
- Hayduk, T., III. Who Benefitted from the PyeongChang Olympic Announcement? Evidence from the South Korean Stock Market. J. Sport. Econ. 2022, 23, 39–75. [Google Scholar] [CrossRef]
- Yun, K.K.; Yoon, S.W.; Won, D. Prediction of stock price direction using a hybrid GA-XGBoost algorithm with a three-stage feature engineering process. Expert Syst. Appl. 2021, 186, 115716. [Google Scholar] [CrossRef]
- Antwarg, L.; Miller, R.M.; Shapira, B.; Rokach, L. Explaining anomalies detected by autoencoders using Shapley Additive Explanations. Expert Syst. Appl. 2021, 186, 115736. [Google Scholar] [CrossRef]
- Weng, F.; Zhu, J.; Yang, C.; Gao, W.; Zhang, H. Analysis of financial pressure impacts on the health care industry with an explainable machine learning method: China versus the USA. Expert Syst. Appl. 2022, 210, 118482. [Google Scholar] [CrossRef]
- Lin, B.; Bai, R. Machine learning approaches for explaining determinants of the debt financing in heavy-polluting enterprises. Financ. Res. Lett. 2022, 44, 102094. [Google Scholar] [CrossRef]
- Zou, Y.; Gao, C.; Gao, H. Business Failure Prediction Based on a Cost-Sensitive Extreme Gradient Boosting Machine. IEEE Access 2022, 10, 42623–42639. [Google Scholar] [CrossRef]
- Sairam, S.; Seshadhri, S.; Marafioti, G.; Srinivasan, S.; Mathisen, G.; Bekiroglu, K. Edge-based Explainable Fault Detection Systems for photovoltaic panels on edge nodes. Renew. Energy 2022, 185, 1425–1440. [Google Scholar] [CrossRef]
- Feng, Y.; Duan, Q.; Chen, X.; Yakkali, S.S.; Wang, J. Space cooling energy usage prediction based on utility data for residential buildings using machine learning methods. Appl. Energy 2021, 291, 116814. [Google Scholar] [CrossRef]
- Alsahaf, A.; Petkov, N.; Shenoy, V.; Azzopardi, G. A framework for feature selection through boosting. Expert Syst. Appl. 2022, 187, 115895. [Google Scholar] [CrossRef]
- Shapley, L.S. Stochastic games. Proc. Natl. Acad. Sci. USA 1953, 39, 1095–1100. [Google Scholar] [CrossRef]
- Bloch, L.; Friedrich, C.M. Data analysis with Shapley values for automatic subject selection in Alzheimer’s disease data sets using interpretable machine learning. Alzheimer’s Res. Ther. 2021, 13, 1–30. [Google Scholar] [CrossRef]
- Dong, H.; Sun, J.; Sun, X. A multi-objective multi-label feature selection algorithm based on shapley value. Entropy 2021, 23, 1094. [Google Scholar] [CrossRef]
- Rozemberczki, B.; Sarkar, R. The shapley value of classifiers in ensemble games. In Proceedings of the 30th ACM International Conference on Information & Knowledge Management, Gold Coast, Queensland, Australia, 1 November 2021; pp. 1558–1567. [Google Scholar]
- Li, Z. Extracting spatial effects from machine learning model using local interpretation method: An example of SHAP and XGBoost. Comput. Environ. Urban Syst. 2022, 96, 101845. [Google Scholar] [CrossRef]
- Aas, K.; Jullum, M.; Løland, A. Explaining individual predictions when features are dependent: More accurate approximations to Shapley values. Artif. Intell. 2021, 298, 103502. [Google Scholar] [CrossRef]
- Lundberg, S.M.; Lee, S.I. A unified approach to interpreting model predictions. In Proceedings of the Annual Conference on Neural Information Processing Systems 2017, Long Beach, CA, USA, 4–9 December 2017; pp. 4765–4774. [Google Scholar]
- Chang, V.; Li, T.; Zeng, Z. Towards an improved Adaboost algorithmic method for computational financial analysis. J. Parallel Distrib. Comput. 2019, 134, 219–232. [Google Scholar] [CrossRef]
- Chang, V.; Man, X.; Xu, Q.; Hsu, C.H. Pairs trading on different portfolios based on machine learning. Expert Syst. 2021, 38, e12649. [Google Scholar] [CrossRef]


| HYBE | SM | YG | JYP |
|---|---|---|---|
| BTS | Baekhyun (EXO) | BLACKPINK | TWICE |
| Tomorrow X Together (TXT) | Taeyeon (SNSD) | JENNIE | ITZY |
| ENHYPEN | Red Velvet | ROSÉ | NiZiU |
| ZICO | NCT 127 | LISA | DAY6 |
| SEVENTEEN | NCT DREAM | WINNER | Stray Kids |
| NewJeans | aespa | AKMU | |
| LE SSERAFIM | SuperM | TREASURE |
| Mean | Max. | Min. | Std.Dev. | Skewness | Kurtosis | |
|---|---|---|---|---|---|---|
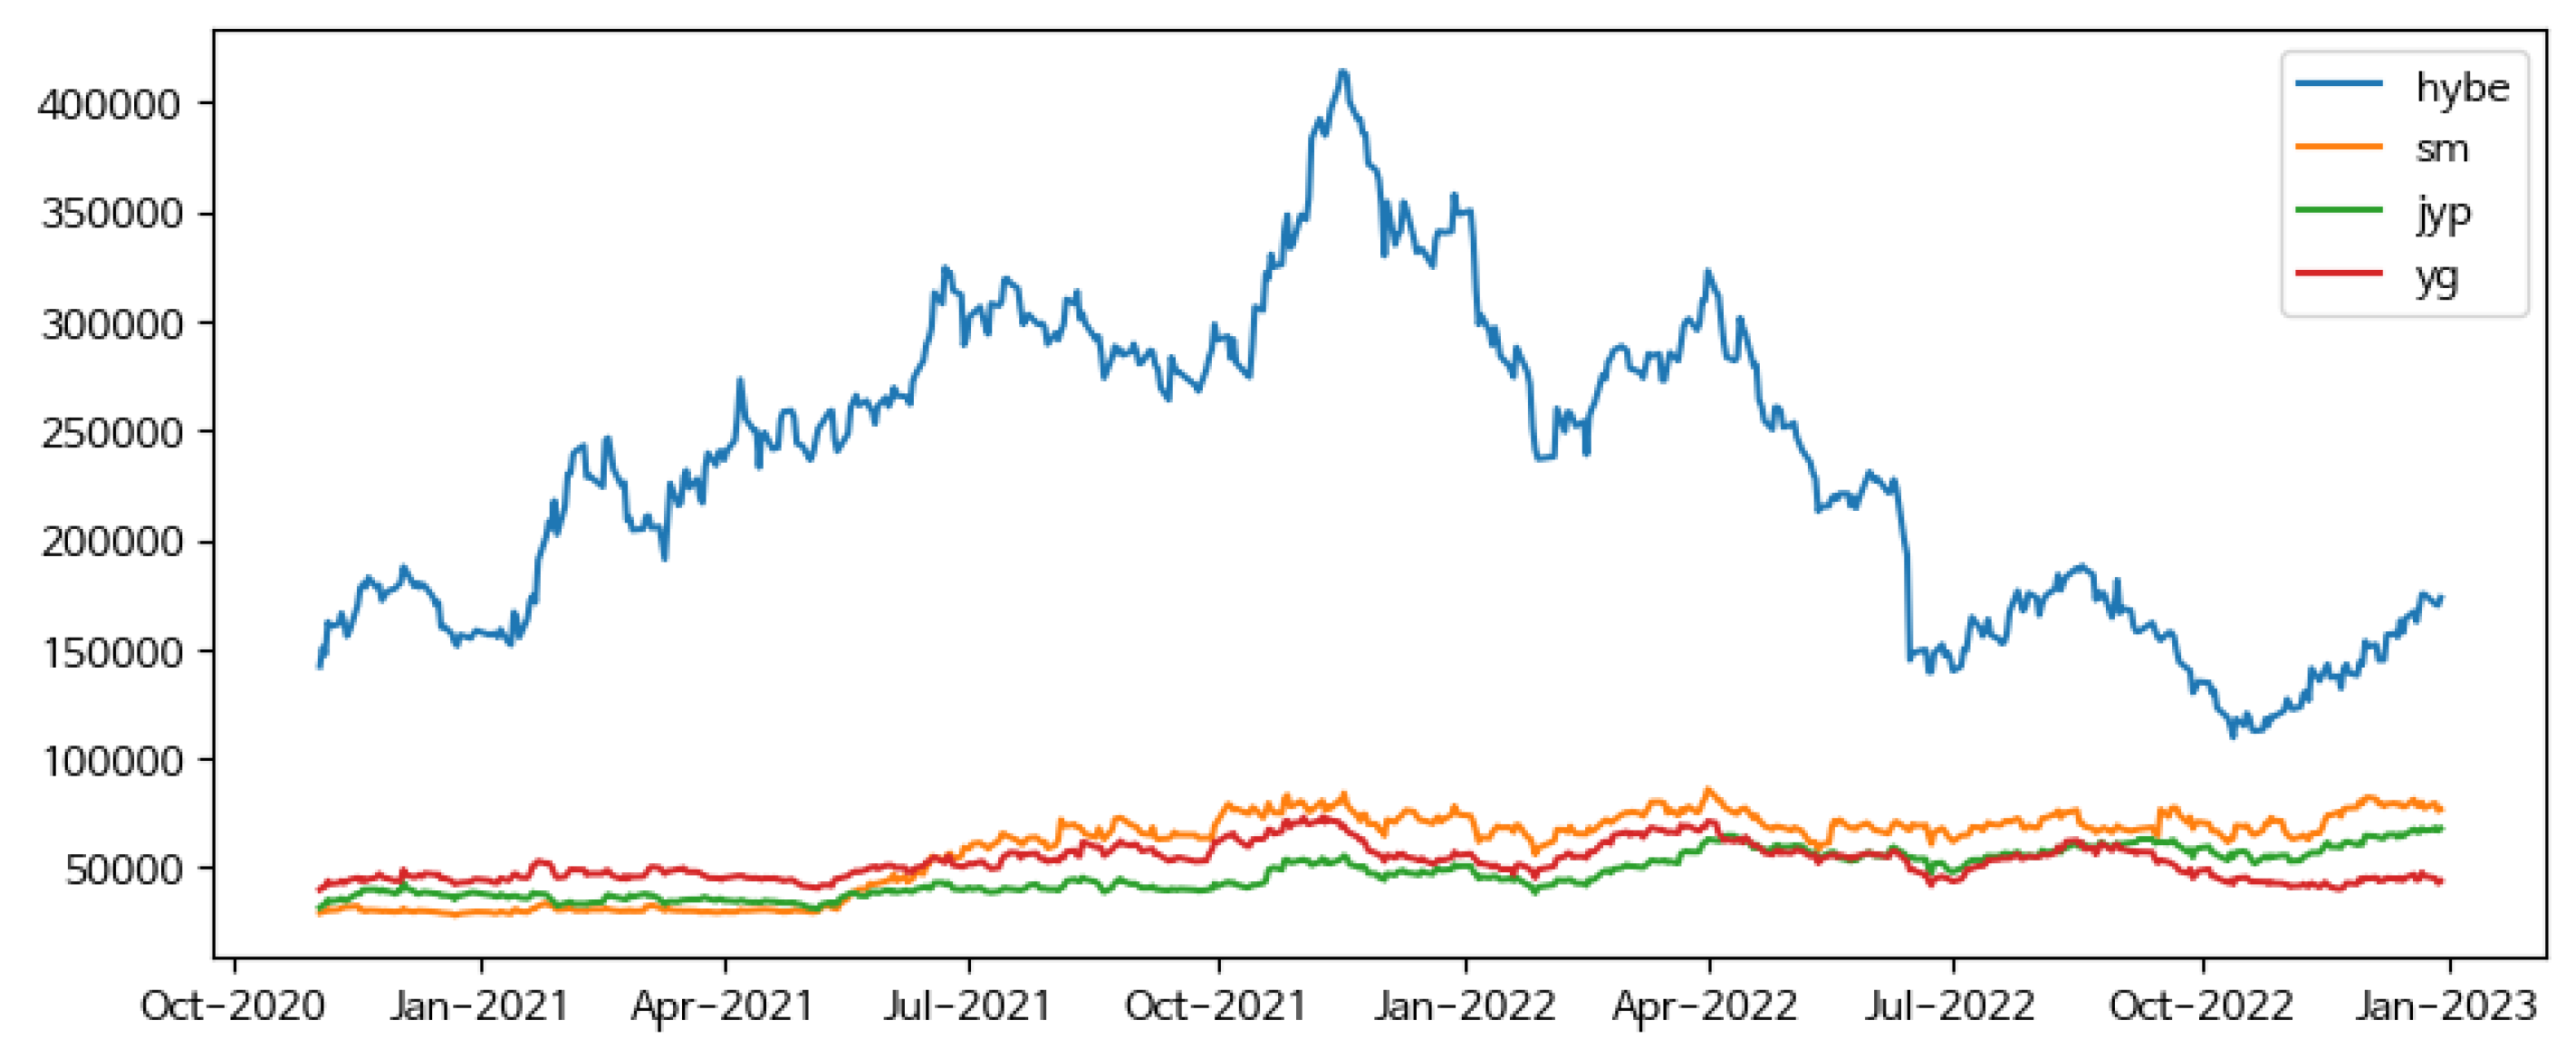
| HYBE | 234,576.05 | 414,000 | 109,500 | 70,962.81 | 0.176 | 2.13 |
| SM | 59,092.88 | 85,900 | 28,100 | 18,078.03 | −0.72 | 1.92 |
| YG | 52,446.08 | 73,100 | 39,850 | 7764.52 | 0.59 | 2.59 |
| JYP | 47,369.40 | 68,200 | 30,950 | 9749.14 | 0.22 | 1.76 |
| KOSPI | 2803.24 | 3305.21 | 2155.49 | 327.40 | −0.20 | −1.30 |
| VKOSPI | 20.06 | 35.73 | 12.55 | 4.31 | 1.08 | 1.09 |
| S&P 500 | 4142.95 | 4796.56 | 3310.24 | 327.77 | 0.03 | −1 |
| VIX | 22.99 | 38.57 | 15.02 | 4.92 | 0.60 | −0.26 |
| Parameter | SM | HYBE | YG | JYP |
|---|---|---|---|---|
| Learning rate | 0.05 | 0.05 | 0.05 | 0.05 |
| Number of gradient-boosted trees | 1000 | 500 | 1000 | 1000 |
| Maximum depth of trees | 7 | 7 | 5 | 5 |
| L1 regularization term on weights | 0.05 | 0 | 0 | 0 |
| L2 regularization term on weights | 0 | 0 | 0 | 0 |
| Subsample ratio of columns for each level | 0.9 | 0.9 | 0.9 | 0.9 |
| Parameter | SM | HYBE | YG | JYP |
|---|---|---|---|---|
| Learning rate | 0.05 | 0.05 | 0.1 | 0.05 |
| Number of gradient-boosted trees | 1000 | 800 | 1000 | 1000 |
| Maximum depth of trees | 7 | 5 | 7 | 3 |
| L1 regularization term on weights | 0.05 | 0.05 | 0.05 | 0 |
| L2 regularization term on weights | 0 | 0 | 0 | 0 |
| Subsample ratio of columns for each level | 0.9 | 0.9 | 0.9 | 0.9 |
Disclaimer/Publisher’s Note: The statements, opinions and data contained in all publications are solely those of the individual author(s) and contributor(s) and not of MDPI and/or the editor(s). MDPI and/or the editor(s) disclaim responsibility for any injury to people or property resulting from any ideas, methods, instructions or products referred to in the content. |
© 2023 by the authors. Licensee MDPI, Basel, Switzerland. This article is an open access article distributed under the terms and conditions of the Creative Commons Attribution (CC BY) license (https://creativecommons.org/licenses/by/4.0/).
Share and Cite
Yu, D.; Choi, S.-Y. Uncovering the Impact of Local and Global Interests in Artists on Stock Prices of K-Pop Entertainment Companies: A SHAP-XGBoost Analysis. Axioms 2023, 12, 538. https://doi.org/10.3390/axioms12060538
Yu D, Choi S-Y. Uncovering the Impact of Local and Global Interests in Artists on Stock Prices of K-Pop Entertainment Companies: A SHAP-XGBoost Analysis. Axioms. 2023; 12(6):538. https://doi.org/10.3390/axioms12060538
Chicago/Turabian StyleYu, Daeun, and Sun-Yong Choi. 2023. "Uncovering the Impact of Local and Global Interests in Artists on Stock Prices of K-Pop Entertainment Companies: A SHAP-XGBoost Analysis" Axioms 12, no. 6: 538. https://doi.org/10.3390/axioms12060538
APA StyleYu, D., & Choi, S.-Y. (2023). Uncovering the Impact of Local and Global Interests in Artists on Stock Prices of K-Pop Entertainment Companies: A SHAP-XGBoost Analysis. Axioms, 12(6), 538. https://doi.org/10.3390/axioms12060538