1. Introduction
Recently, the performance of water distribution systems (WDSs) has been investigated using graph theory and statistical models [
1]. In the past, WDSs were created using mathematical models to determine their ideal system layout in terms of satisfying each node’s water demand and pressure level [
2]. This approach is now considered conventional. Moreover, the role of reliable mathematical models has been investigated, showing them to be vital to achieving excellence in the future planning and control of water supply networks [
3]. The study of the complex WDS representation can provide insights into its vulnerability, for instance by detecting the critical elements that simulate attacks on its structure [
4]. It has been exposed that the networks derived from WDSs present some randomness, which can be positive for the topological robustness, but the geographical constraints can make their structure close to planar graphs [
5]. Topological attributes such as connectivity, efficiency, centrality, robustness, and modularity have also been applied to predict the resilience of WDSs [
6]. It has been found that the selection of the topological attributes to describe the resilience of the WDS has to be careful and that these metrics are meaningful for assessing the network under stress conditions [
7]. A holistic analysis framework has been presented for decision-making in water distribution networks based on graph spectral techniques, exploiting the properties of the eigenvalues and eigenvectors of graph matrices [
8]. This kind of framework is more useful when combining topological (structural) attributes with performance measures to represent the behaviour of the grid and when they are applied to network models based on real conditions [
9]. Similarly, a number of important attributes of WDSs and their relationship with vulnerability have also been studied in power systems [
10] and, then, have been successfully applied to water networks [
11].
The implications of the above-mentioned references are more relevant to the unique geographical characteristics of the Kingdom of Saudi Arabia (KSA) due to the year-round scarcity of water resources and because the weather conditions in this region favour droughts. Despite such circumstances, this country is an important agricultural producer in the region, using a large percentage of the available water for such activities [
12]. However, there is a large disparity in the access to piped water supply and sewage across the provinces [
13]. The government of the KSA has proposed several strategic objectives related to the preservation, optimisation, and management of water resources in its Saudi Vision 2030 strategic framework and the National Transformation Program 2020. In order to boost agricultural output and create efficient production systems for plants, livestock, and fisheries, the Ministry of Environment, Water, and Agriculture has set strategic goals for guaranteeing the long-term security of food [
14]. To ensure the continuous supply of water, it is crucial to understand the vulnerabilities of the water distribution network. Such a network connects the sources with the consumers, ensuring that the conditions of the water flow and pressure are appropriate. Water distribution systems (WDSs) can be modelled as weighted graphs using complex network theory to represent the operation of the grid under particular conditions, as has been performed on other real networks [
15]. Before describing this article’s findings and problem statement, it is important to familiarise ourselves with the following terms, which will be used repeatedly in the remaining text.
Vulnerability framework: This provides a vulnerability prediction measure that can be compared with other networks or with the same network under different conditions.
Centrality metrics: These are the most widely employed indicators for identifying important nodes in a network.
Structural features: These are based merely on the connections between nodes, which in this case represent how the pipes and the junctions are connected.
Operational features: These are based on the operation of the system, considering the demand, the supply, and the water flows in a particular state.
Malware profile: This is an ordered collection of network elements (nodes or links).
Functional damage: This is measured as the fraction of unsatisfied demand determined after removing the faulty elements.
Physical damage: This is measured by determining the fraction of removed elements in a particular stage of the failure sequence.
Vulnerability curve: This is a graph in which the axis along the horizontal direction indicates a physical damage metric and the vertical axis a functional damage measure.
Vulnerability prediction measure (VPM): This is derived from the area under the vulnerability curve and expresses the degree of damage using the physical damage measure.
On the one hand, the optimisation model has suggested new chlorine booster locations to improve water quality in the water distribution network of the city of Al-Khobar [
16]. On the other hand [
11], a vulnerability assessment was performed on different benchmarks to evaluate the metrics of centrality in different regions of the USA. However, these benchmarks did not include tanks, pumps, or external sources. Motivated by the above review and discussion, we used graph modelling to develop a vulnerability framework that allows assessing the vulnerability of the network proposed in [
16] by considering the missing sources of [
11], i.e., tanks, pumps, or external sources. We considered both structural and operational features. Our vulnerability framework studies the impact that removing certain nodes or links of the network has over the satisfied water demand. It employs centrality measures and different failure strategies to test the network. The framework provides a vulnerability prediction measure that can be compared with other networks or with the same network under different conditions. We give an application of this vulnerability framework and provide recommendations to improve the robustness of such networks.
The plan of this paper is as follows: After providing water distribution network modelling in
Section 2, we add a necessary discussion about vulnerability framework and centrality metrics in
Section 3 and
Section 4, respectively. Degree, eigenvector, betweenness, closeness PageRank, and Katz metric of centralities are considered. The representation of our model using line graphs is worked out in
Section 5. A general methodology of vulnerability assessment on benchmarks is provided in
Section 6, while
Section 7 also addresses these benchmarks for a case study in an urban water distribution system based in KSA.
Section 8 provides a comprehensive discussion and analysis of the results obtained leading to a conclusion and future directions in
Section 9.
2. Water Distribution Network Modelling
This section presents the fundamentals of the simplified WDS graph model proposed in this article, which is based on representing its elements through nodes and links. The nodes represent the points where there can be a water input or output (sources, treatment plants, tanks, reservoirs, consumers, connections), and links represent elements that carry water from one node to another (pipes, pumps, valves).
The WDS weighted graph consists of a set of nodes and a set of links . Each link is related to a corresponding weight , which represents the water flow calculated using the quasi-static flow equations.
The steady-state hydraulic model is based on the mass and energy balance equations:
where
are the unknown flows in all
links/pipes connected to the
i-th network node,
is the demand known at the node
i,
is the unknown total head at the upstream node of the
i-th pipe, and
is the calculated difference between the
i-th pipe’s total head loss and pumping head.
The change in total energy across each link is determined by
where
K is the coefficient of local head loss and
R is the resistance coefficient of pipe, whose value is dependent upon the friction head loss model in use. The value of
n also depends on this model and
is the head delivered by a pump placed at link
i, which is a function of the flow delivered [
17].
The expressions (
1), (
2) and (
3) are a set of nonlinear equations whose solution requires numerical methods, for instance, the gradient algorithm, which is applied in this article through the EPANET-Matlab Toolkit [
18]. The EPANET-Matlab Toolkit allows importing and exporting calculations from EPANET using Matlab, which is a powerful tool for managing and analysing the data of the WDS [
19]. Since its creation in 1993 by the United States Environmental Protection Agency (USEPA), EPANET has been the most widely used water modelling program. It has been used extensively for the last 30 years to simulate hydraulic and water quality systems. Pumps, valves, reservoirs, nodes, and pipes make up the WDS’s hydraulic system. All input data for parameters including pipe length, diameter, water head, and coefficient values are needed by the EPANET’s hydraulics model [
16]. Velocities, junction pressures, and head losses in the network make up the output values of the model.
3. Vulnerability Framework
The vulnerability evaluation approach is based on the prior work [
11] for electric power system vulnerabilities, which included individually concentrated attacks and sequential profiles of attacks on connections and nodes of the related graph model. In this sense, a malware profile is an ordered collection of network elements (nodes or links) [
10]. The framework proposes the vulnerability curve, which is helpful in determining the amount of functional damage caused by a fault profile. The vulnerability curve is a graph that represents a physical damage measure on the horizontal axis and a functional damage measure on the vertical axis. Both measures are zero in the initial stage when the network works normally, as the network is affected by physical or functional damage. The measures increase gradually until they reach one, which represents 100% of damage.
When using WDS, the functional loss is defined by the amount of unsatisfied demand (
) that remains after the defective components have been eliminated. Under the assumption that the first
k components of the malfunctioning sequence are removed, this is calculated by
where
is the water requirement met by the current stage’s sources, and
is the system’s starting total water demand.
Using the proportion of deleted components (
) on the
m-th phase in the failure sequence, the physical damage is calculated by
The vulnerability prediction measure (VPM), which is derived from the area under the vulnerability curve, expresses the degree of damage using physical damage measures. In this regard, it is argued that the assault sequence damages the WDS more severely depending on the VPM, making the network more susceptible to similar attacks. The WDS represented in EPANET is transformed to a Matlab graph object [
20], and based on the type of attack,
is then determined and documented in all stages. Removing the most important component first (RMCEF) and iterating the greatest central element first (IMCEF), two distinct kinds of fault sequences are assessed in this study.
The vector
, which contains arranged components in accordance with centrality and represents the RMCEF fault sequence, is
with
.
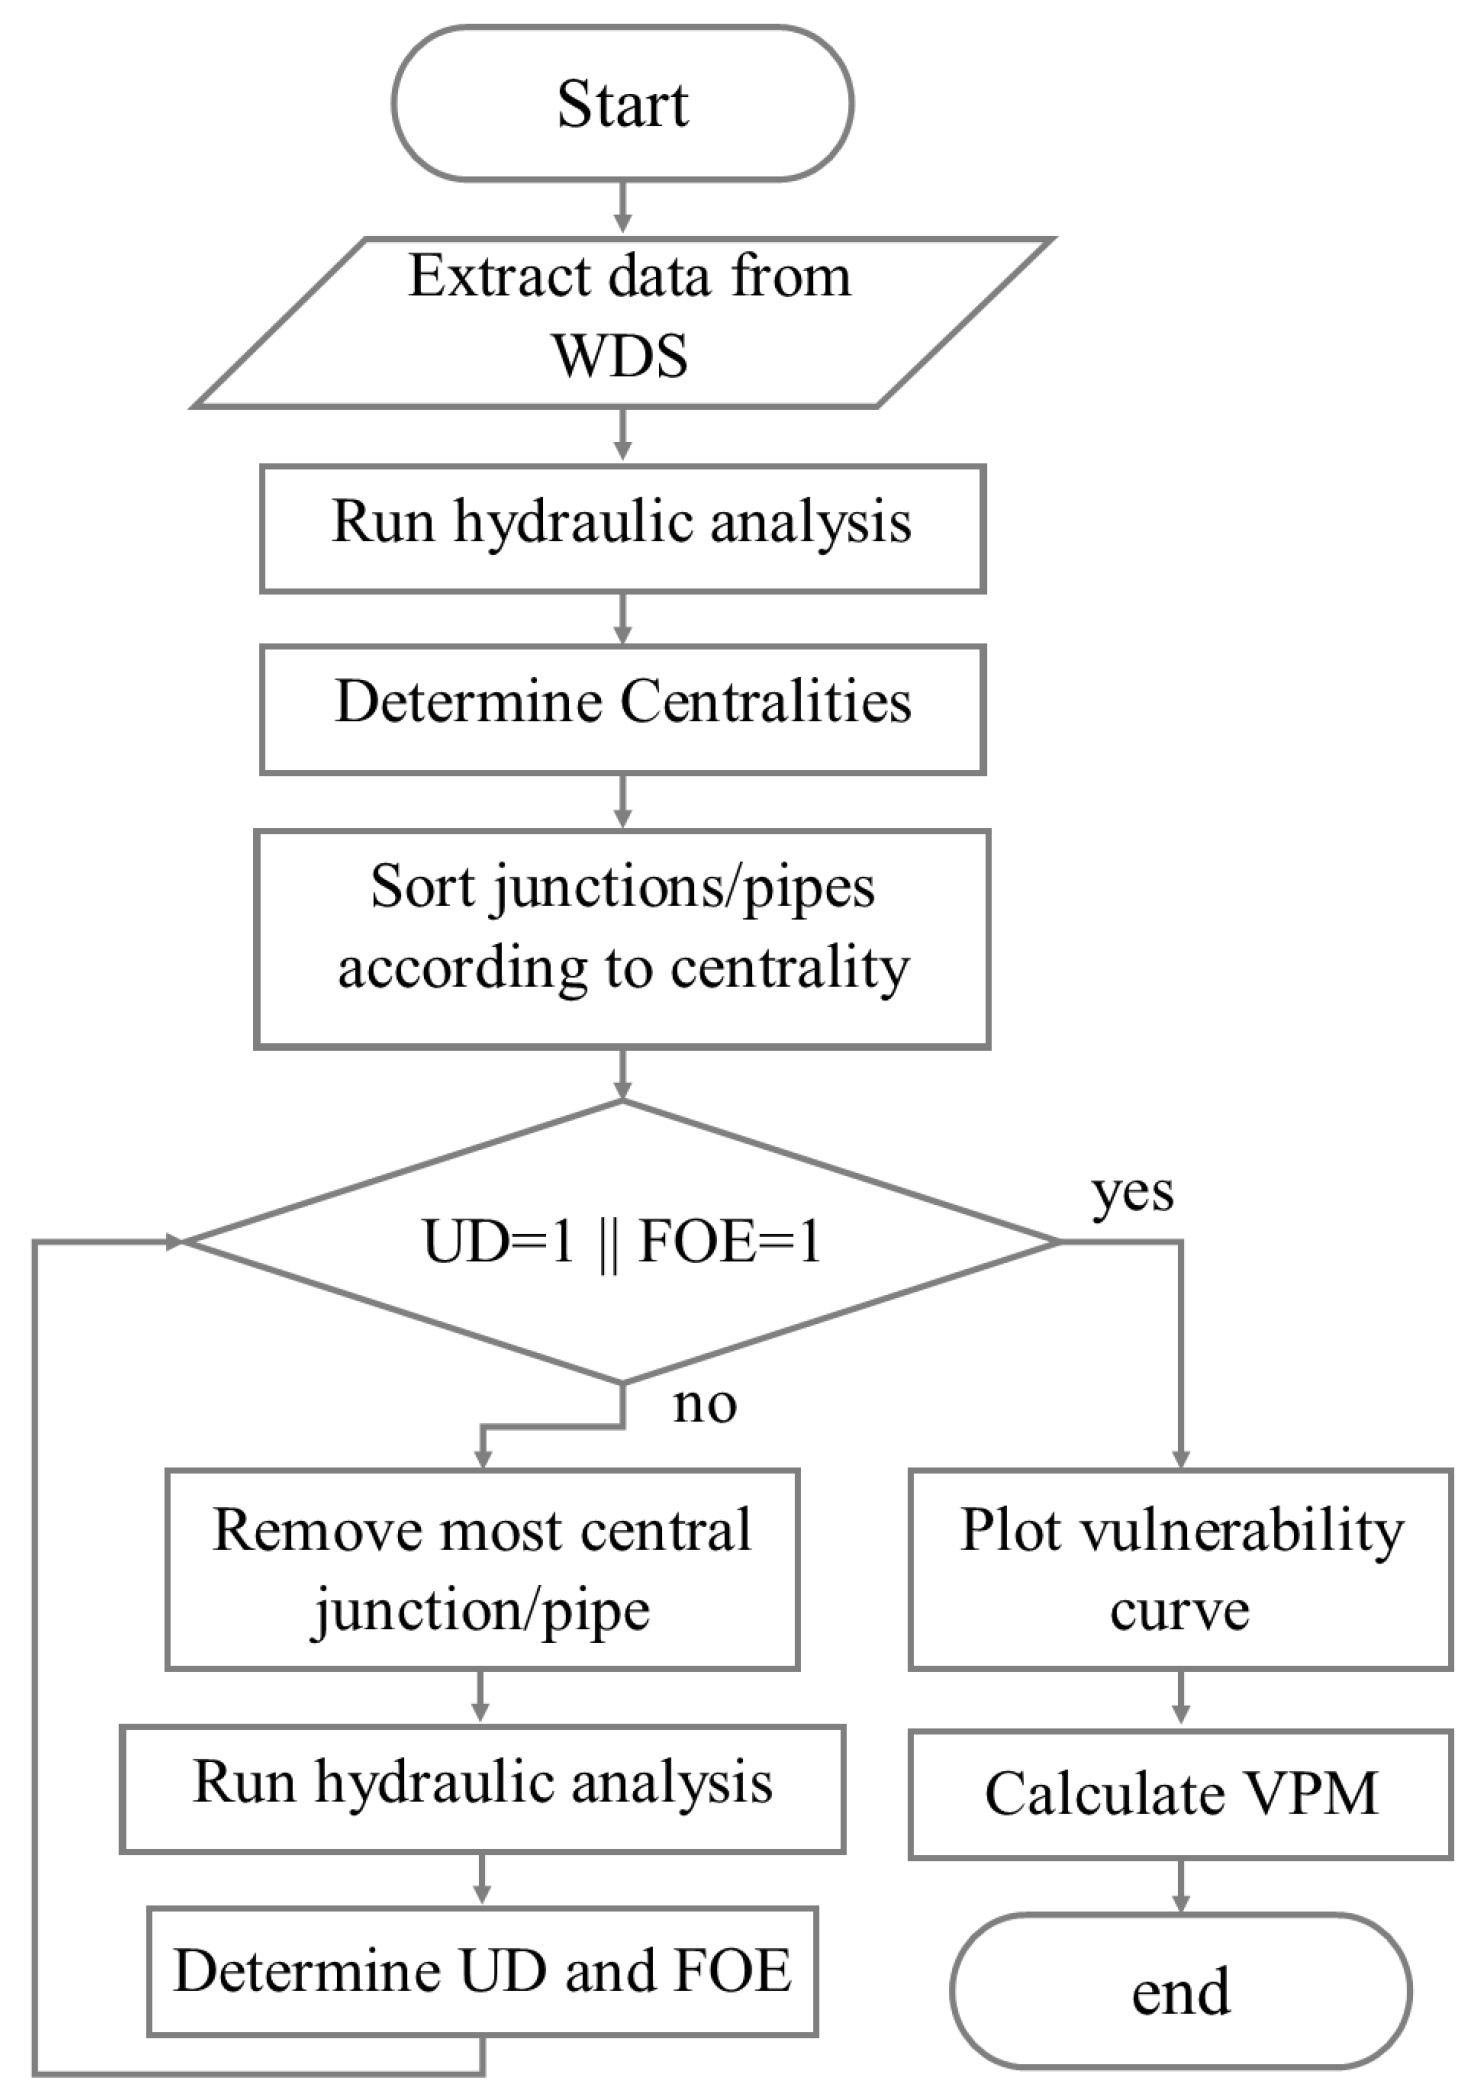
Figure 1 illustrates the RMCEF algorithm’s streamlined flow diagram. The algorithm removes the nodes or pipes according to the vector
, runs the hydraulic analysis, and determines the unsatisfied demand using Equation (
4) and the fraction of removed elements using Equation (
5) until the demand is totally unsatisfied or all the elements are removed, i.e.,
UD(
k) = 1 or
FOE(
k) = 1.
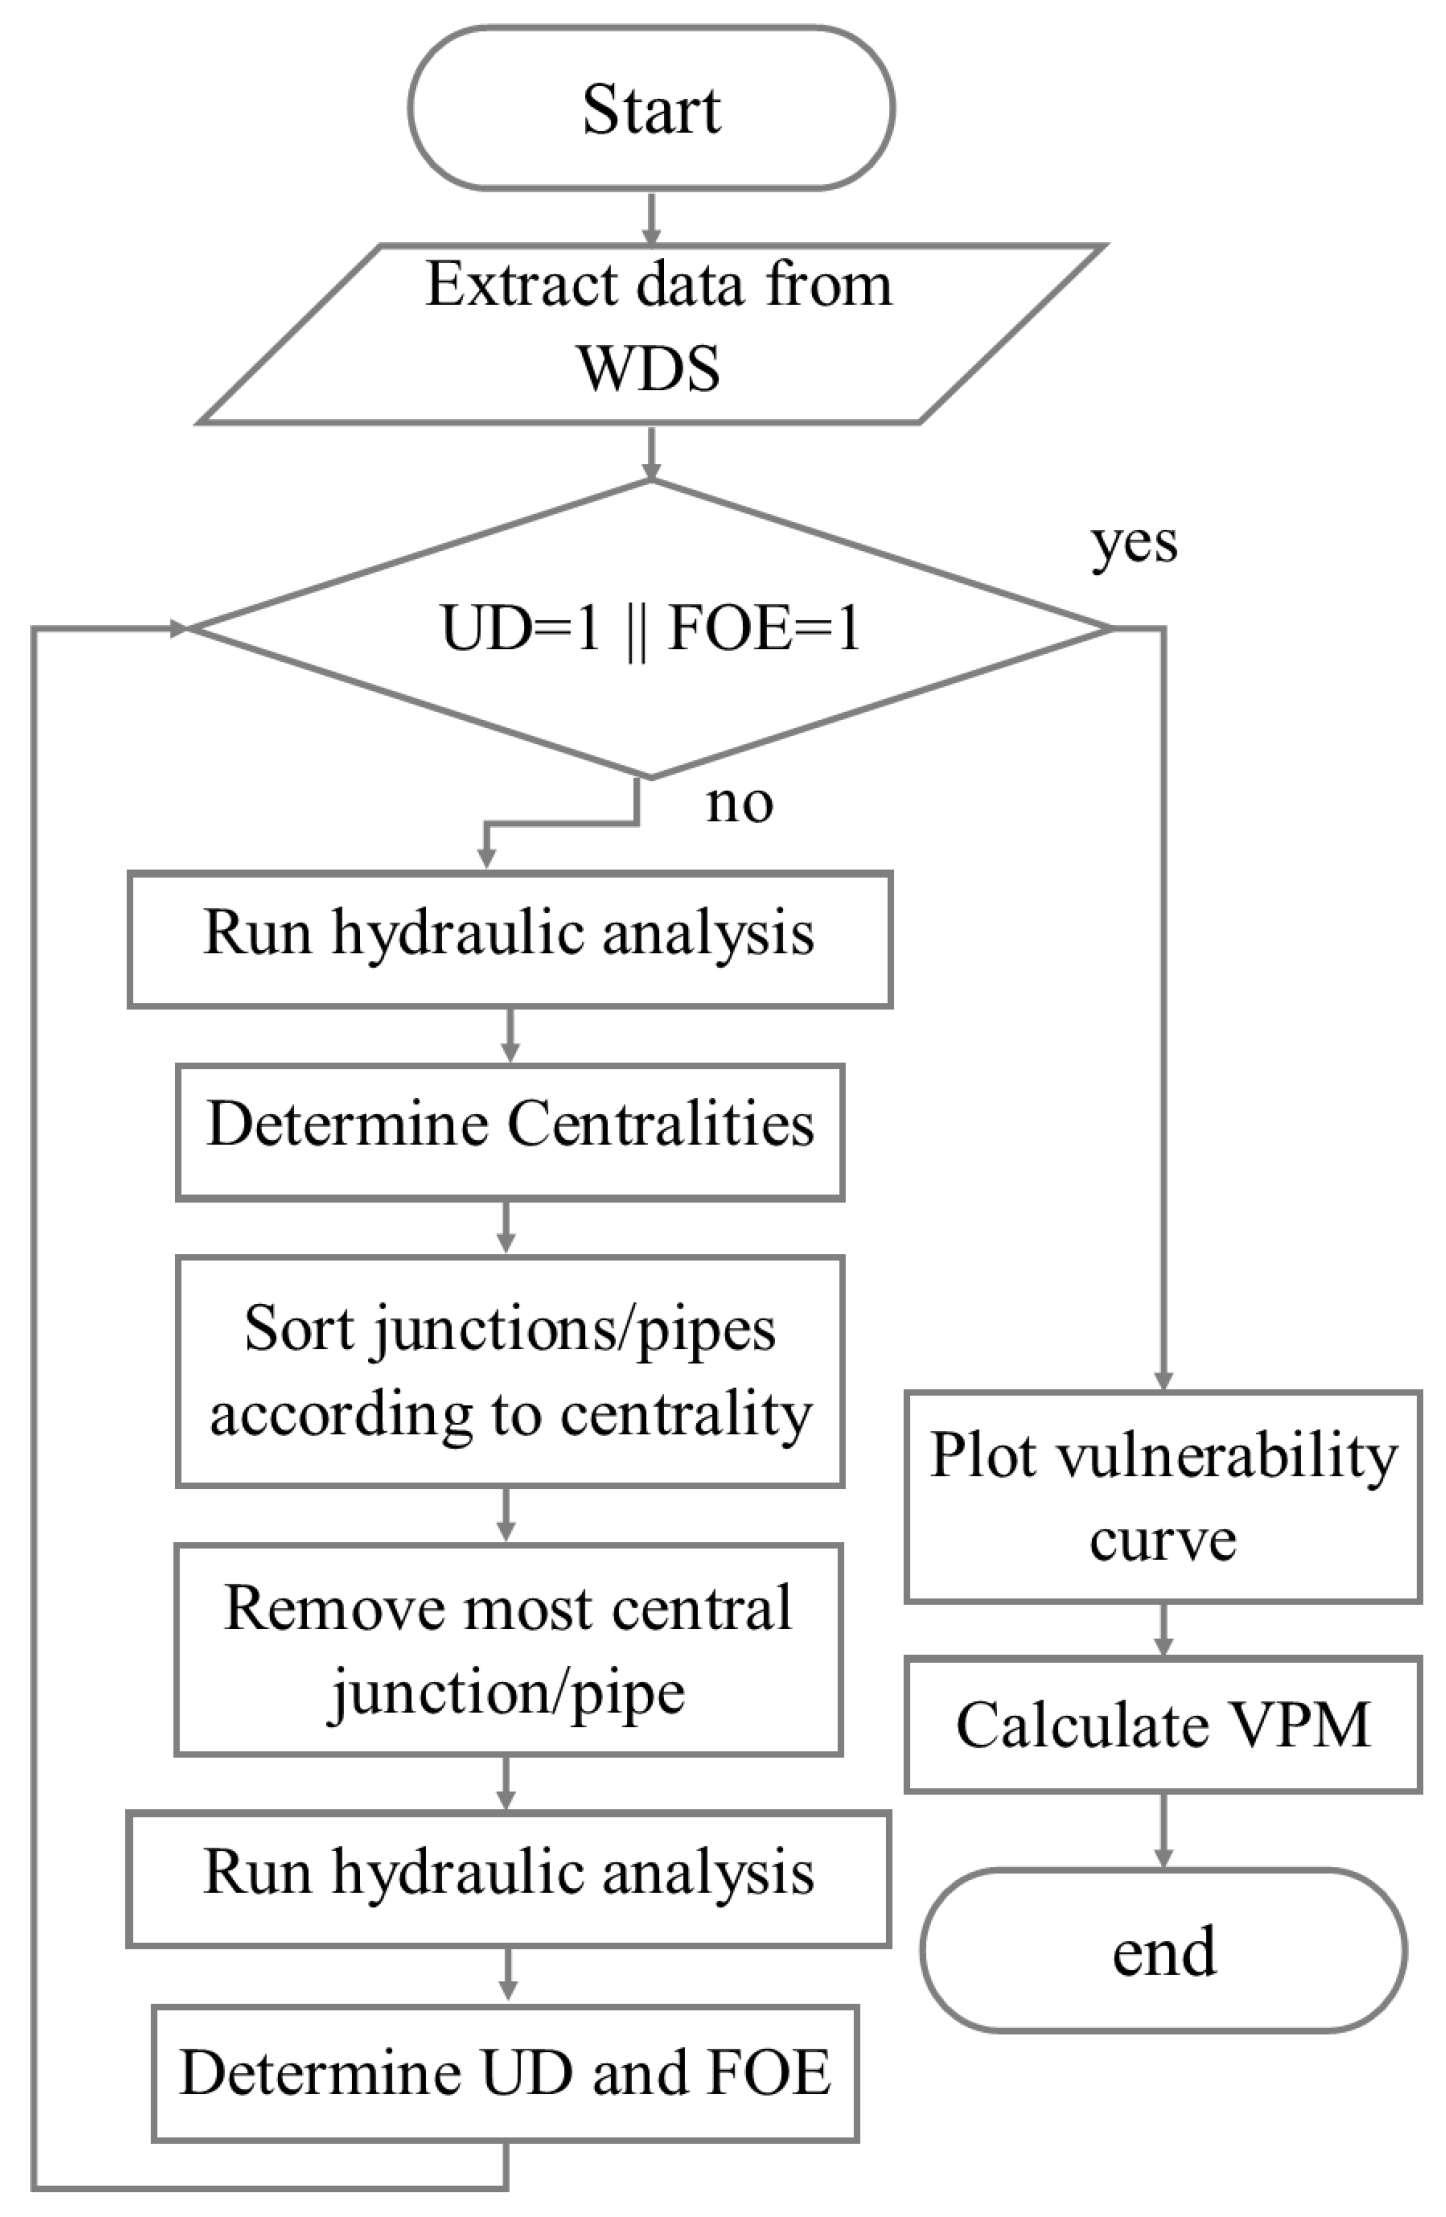
The component with the greatest relevance in the present grid is targeted and eliminated using the IMCEF attack profile. The key characteristic is that after an element is removed, the centrality metrics are recalculated. The concept behind the aforementioned attack profile is that after the most central piece is eliminated, the centrality metrics change and the second-most important component from the original ranking may no longer be of such importance. The order of components according to centrality must then be updated, as shown in
Figure 2, and the centralities vector needs to be recalculated.
4. Centrality Metrics
The most popular pointers for recognising significant points in an arbitrary network are centrality metrics; however, depending on the study case and the type of network, importance may have varied implications [
21]. The centralities used in this study are used to gauge an element’s significance in relation to the water flow that passes through it. When comparing several centrality measures for related applications in electric power systems, past studies found that the degree, Katz, and eigenvector centralities based on power traffic vs. water flow were the most trustworthy. Furthermore, it has been suggested that PageRank centralities, betweenness, and closeness are relevant in contemporary computational applications. It has been suggested that betweenness, closeness, and degree centralities are suitable metrics for examining centrality in spatial networks [
22].
The size, connectivity, and related weights of the network all affect how difficult it is to calculate centrality measurements. The effectiveness of the aforementioned centralities for determining WDS susceptibility is compared in this paper. The weighted graph framework developed in
Section 2 is used to calculate the metric of these centralities. These are normalised for better comparability such that the total of the metrics for all the nodes or links equals one unit.
4.1. Degree Metric of Centrality
The popular centrality metric known as degree centrality (
) provides some understanding of a node’s connectedness. The system’s infrastructure and the node’s location in it still may be overlooked by
, according to [
23]. Generally, it counts the total number of edges that are associated with
, particularly in the case of the weighted graph used in this study, which takes the weights of those edges into account. Accordingly, it can be computed using the following formula:
where
is the stream of water between junction
and
.
4.2. Eigenvector Metric of Centrality
Bonacich suggested the eigenvector centrality (
) in 1972 as a metric of significance based on the notion that a node’s prominence is correlated with the significance of its neighbours. It is determined under the presumption that the node’s
centrality is inversely related to the sum of its neighbours’ centralities [
23]. This metric’s calculation looks like this:
where
represents the j-th component associated with the eigenvector that corresponds to
, and
is the maximum eigenvalue of its weighted matrix of adjacency based on water flows.
4.3. Betweenness Metric of Centrality
The importance of a particular node with regard to its function in tying the other nodes in the system together is measured by Freeman’s centrality of betweenness (
) associated with the node
. As in the instance of WDS, the transit of water amongst the other nodes, betweenness is aimed at conveying the significance of the node being a bridge in the connection with other nodes. Such statistic takes into account the total number of shortest pathways as well as the number of shortest routes that pass the chosen node. We use the following formula:
where
is the number of shortest paths between junction
and
that pass through junction
, but
is the total number of shortest paths between junctions
and
.
4.4. Closeness Metric of Centrality
The network’s overall distance between a node’s
element and the other nodes determines its
closeness centrality. The nodes that require the fewest steps in order to interact with the remaining nodes in the system are the most important nodes when utilising this metric. It can be determined by using:
where the shortest length from junction
to
is
. The harmonic closeness, which is another method of determining the closeness [
23], is an accumulation of the reciprocal distances between nodes, and can be written in the form of the following equation:
This metric can also be standardised to have a range between 0 and 1, giving the following results:
The closeness measure of Equation (
10) is null if a network is not fully connected since the gap between two nodes that are related to distinct components is unlimited. The harmonised proximity Equation (
11) is used as a workaround for this issue; see [
22] for more information.
4.5. PageRank Metric of Centrality
As a statistic to categorise websites in accordance with their relative relevance, the PageRank metric of centrality was put forward. According to [
24,
25], the PageRank metric of centrality grows significantly when the total number of back links or connections pointing to the website, is high. When it comes to WDS, a junction’s PageRank centrality indicates how many additional junctions link to it, or if there are few junctions pointing, then those junctions have a high PageRank. The PageRank centrality formula is given by:
where the damping factor
is a value between 0 and 1, and
is the node’s out-degree. The PageRank centrality (
) computation in this study is done using the Matlab copyright method as an outcome of a network’s random walk. If a node in the graph has no successors, the next node is selected from all of the nodes using 0.85 as probability from the collection of successors of the present node. The average amount of time taken at every node throughout the random walk is the centrality score. Self-loops in this method make the node to which they are attached more central. Edge weights have an impact on the likelihood of selecting a successor junction as well [
20].
4.6. Katz Metric of Centrality
The Katz metric of centrality was developed as a way for estimating a person’s popularity that considers both the status of each person emitting a “vote” as well as the amount of direct “votes” the person receives [
26]. In the context of WDS, the Katz metric of centrality denotes a node’s significance considering the volume of water flowing through it and the significance of the connections from which it originates. The calculation of its centrality is
where the
entries of
are 1,
is the
identity matrix,
is the adjacency matrix of the graph
determined by the water stream weights, and
is the attenuation element, which satisfies the following inequality involving the greatest eigenvalue of
:
When this technique was initially applied to WDS, it failed to converge in some circumstances involving huge networks [
25].
5. Representation Using Line Graphs
In contrast to the preceding part, which focused on the junction or node centralities, the link or pipe centralities are also assessed here using the theory of line graphs [
27]. To determine the pipe centralities, the weighted adjacency matrix
of the graph
is transformed into an analogous line graph adjacency matrix using the following equations:
where
is the weighted incidence matrix, with
, and the other elements of column
are set to zero,
is the diagonal matrix with element
, which is the vector with the sum of weights adjacent to each node in G and
is a vector of ones with the appropriate size. This transformation is due to Yoshida [
28].
In this article, corresponds to a diagonal matrix with the elements in vector w, while is a vector formed by the elements of the diagonal of the matrix .
Self-loops confined in
are eliminated by removing the non-zero elements of its diagonal. This is accomplished by transforming it into
, which has zero diagonal elements by using the following equations:
where
is a matrix with only the diagonal entries
, which has the main diagonal elements of
. Furthermore,
has the off-diagonal elements of
. This method is due to the distribution of non-zero components of
, while it keeps some of its properties.
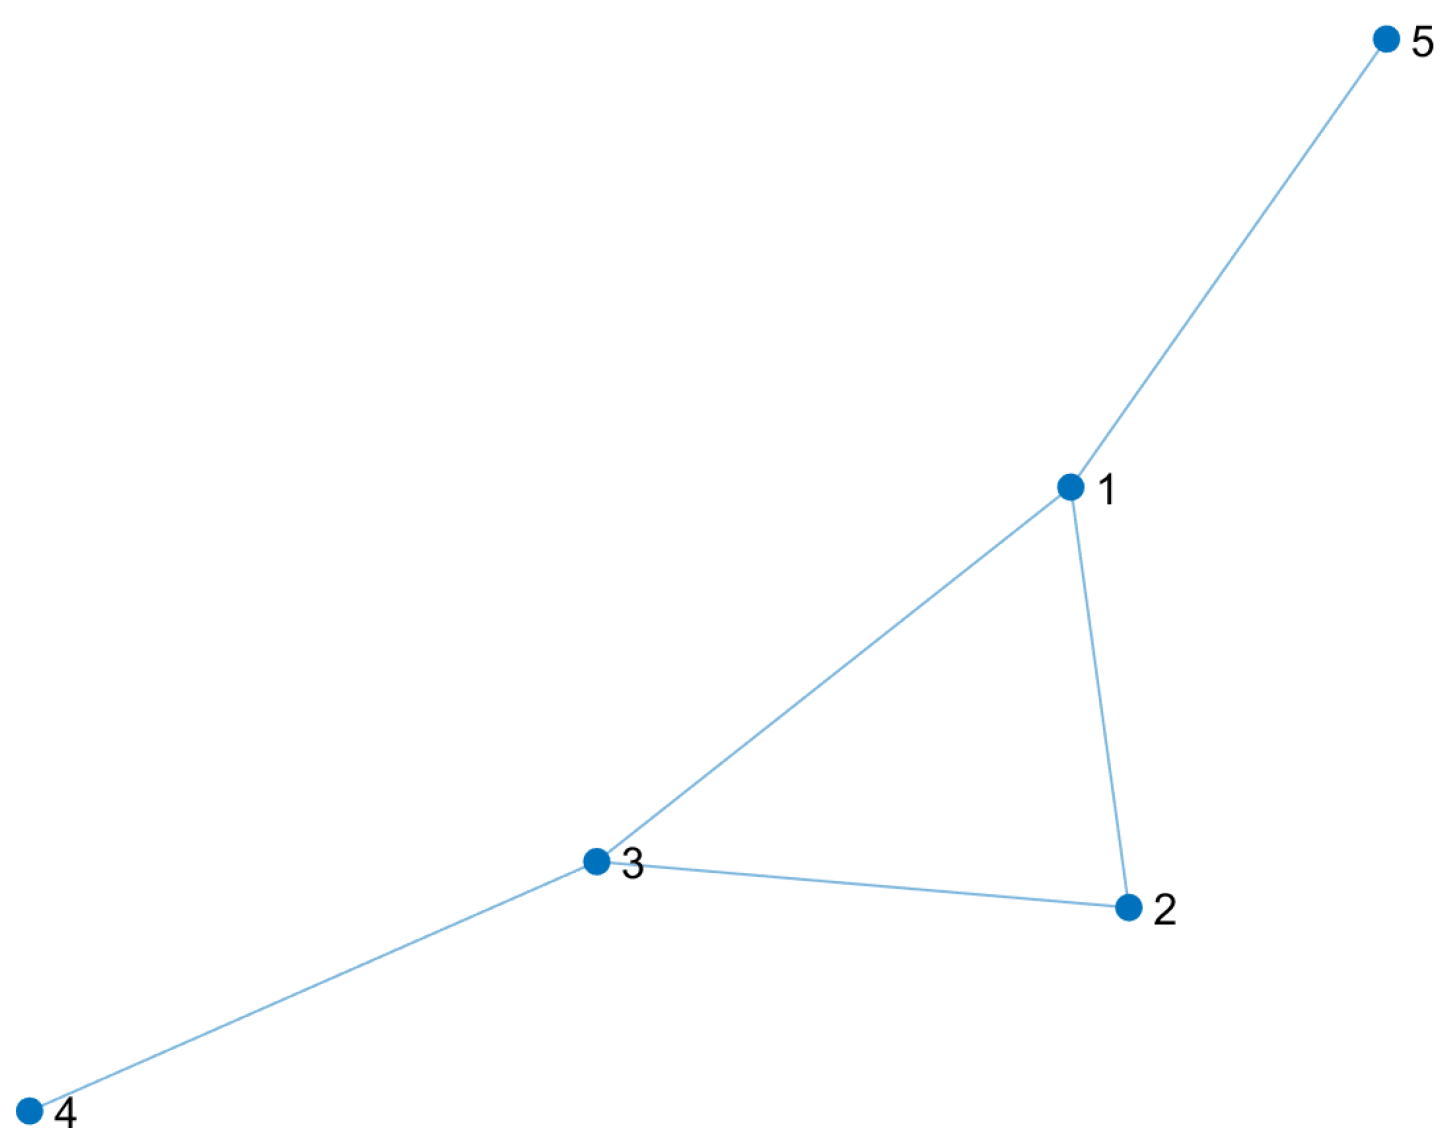
To illustrate the conversion to a line graph we present an example using a small network called the EPANET-MSX Example Network, whose graph is shown in
Figure 3. The edges with their respective weight and the weighted adjacency matrix (
A) of the original graph are shown in
Table 1.
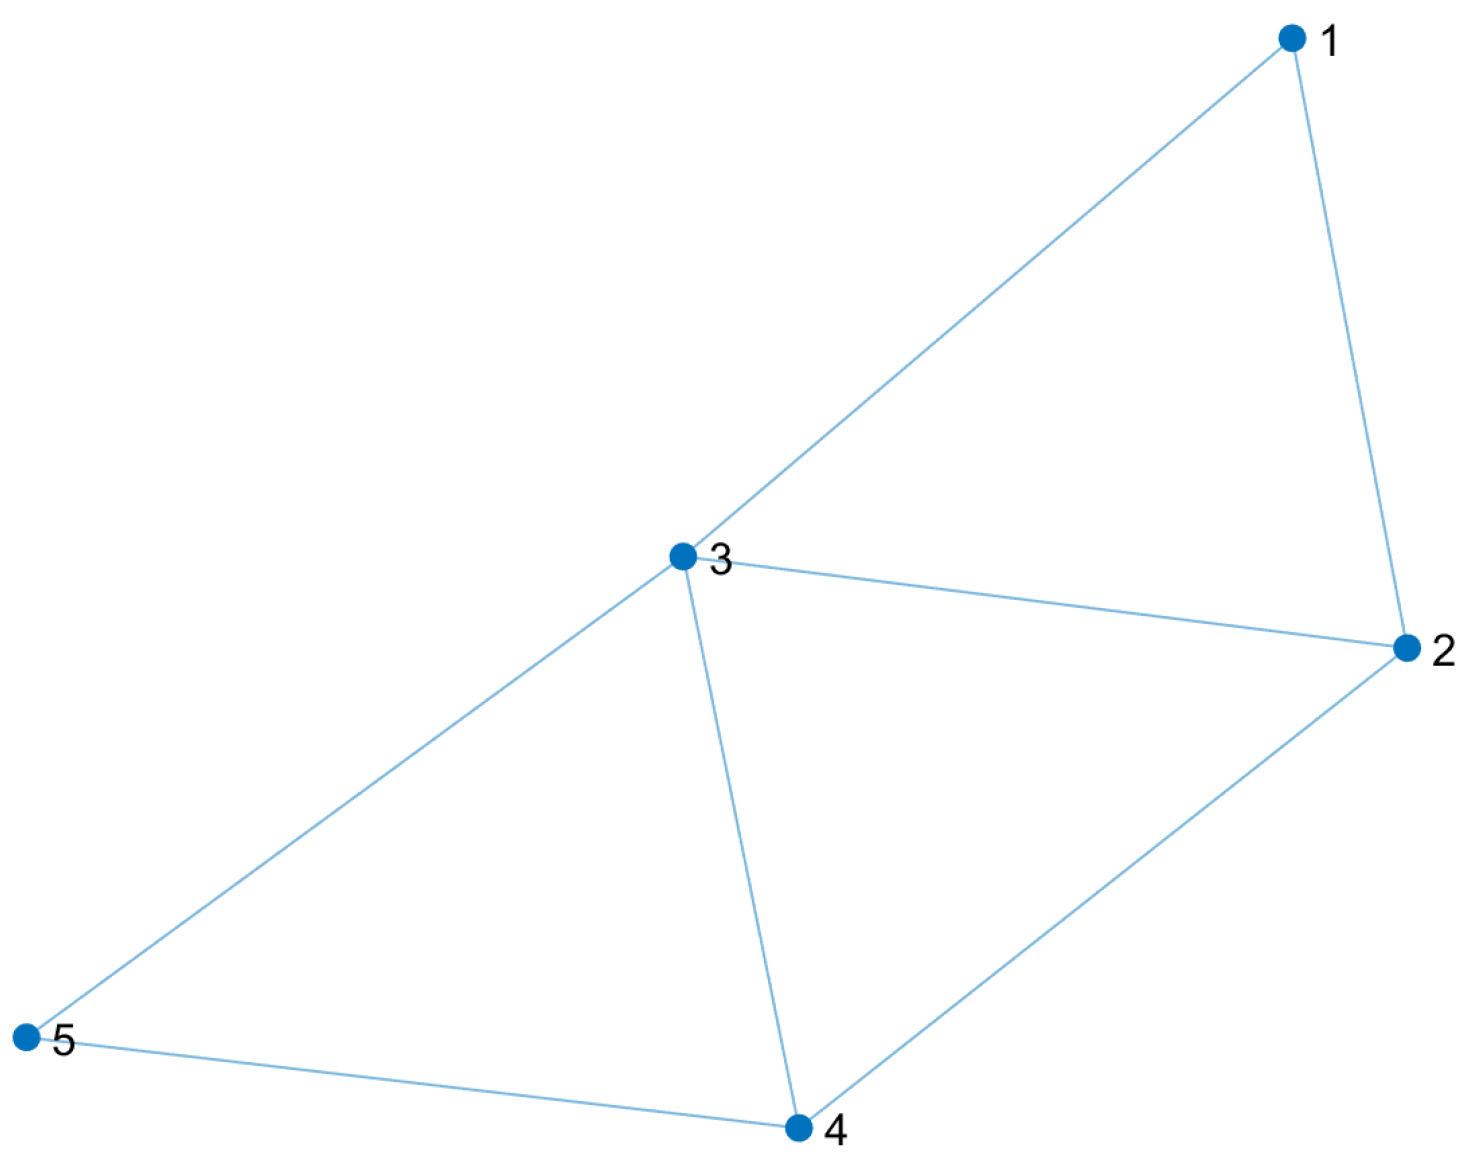
Figure 4 shows the line graph obtained after applying the proposed transformation, where each node represents a line (or pipe) in the original graph; the edges and the adjacency matrix of the transformed graph
M are shown in
Table 2.
6. Vulnerability Assessment on Benchmarks
In a previous study [
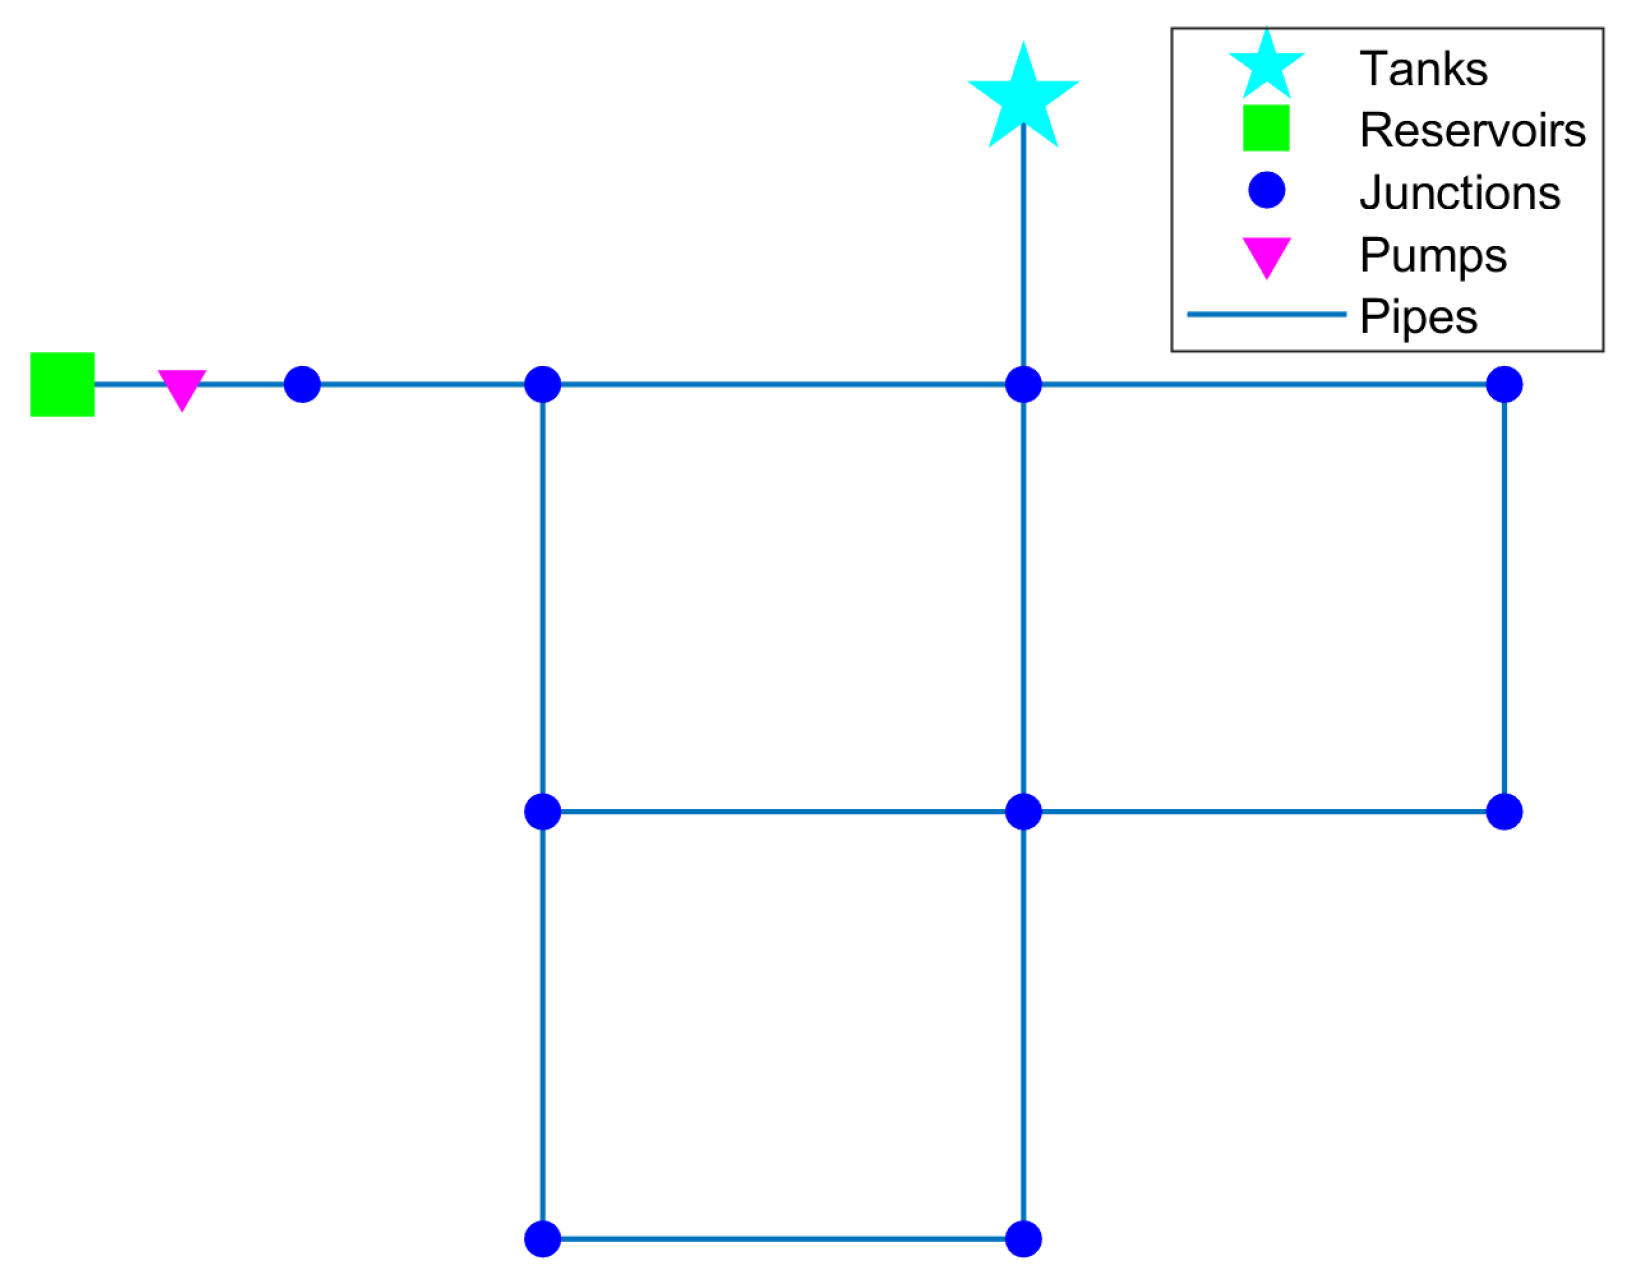
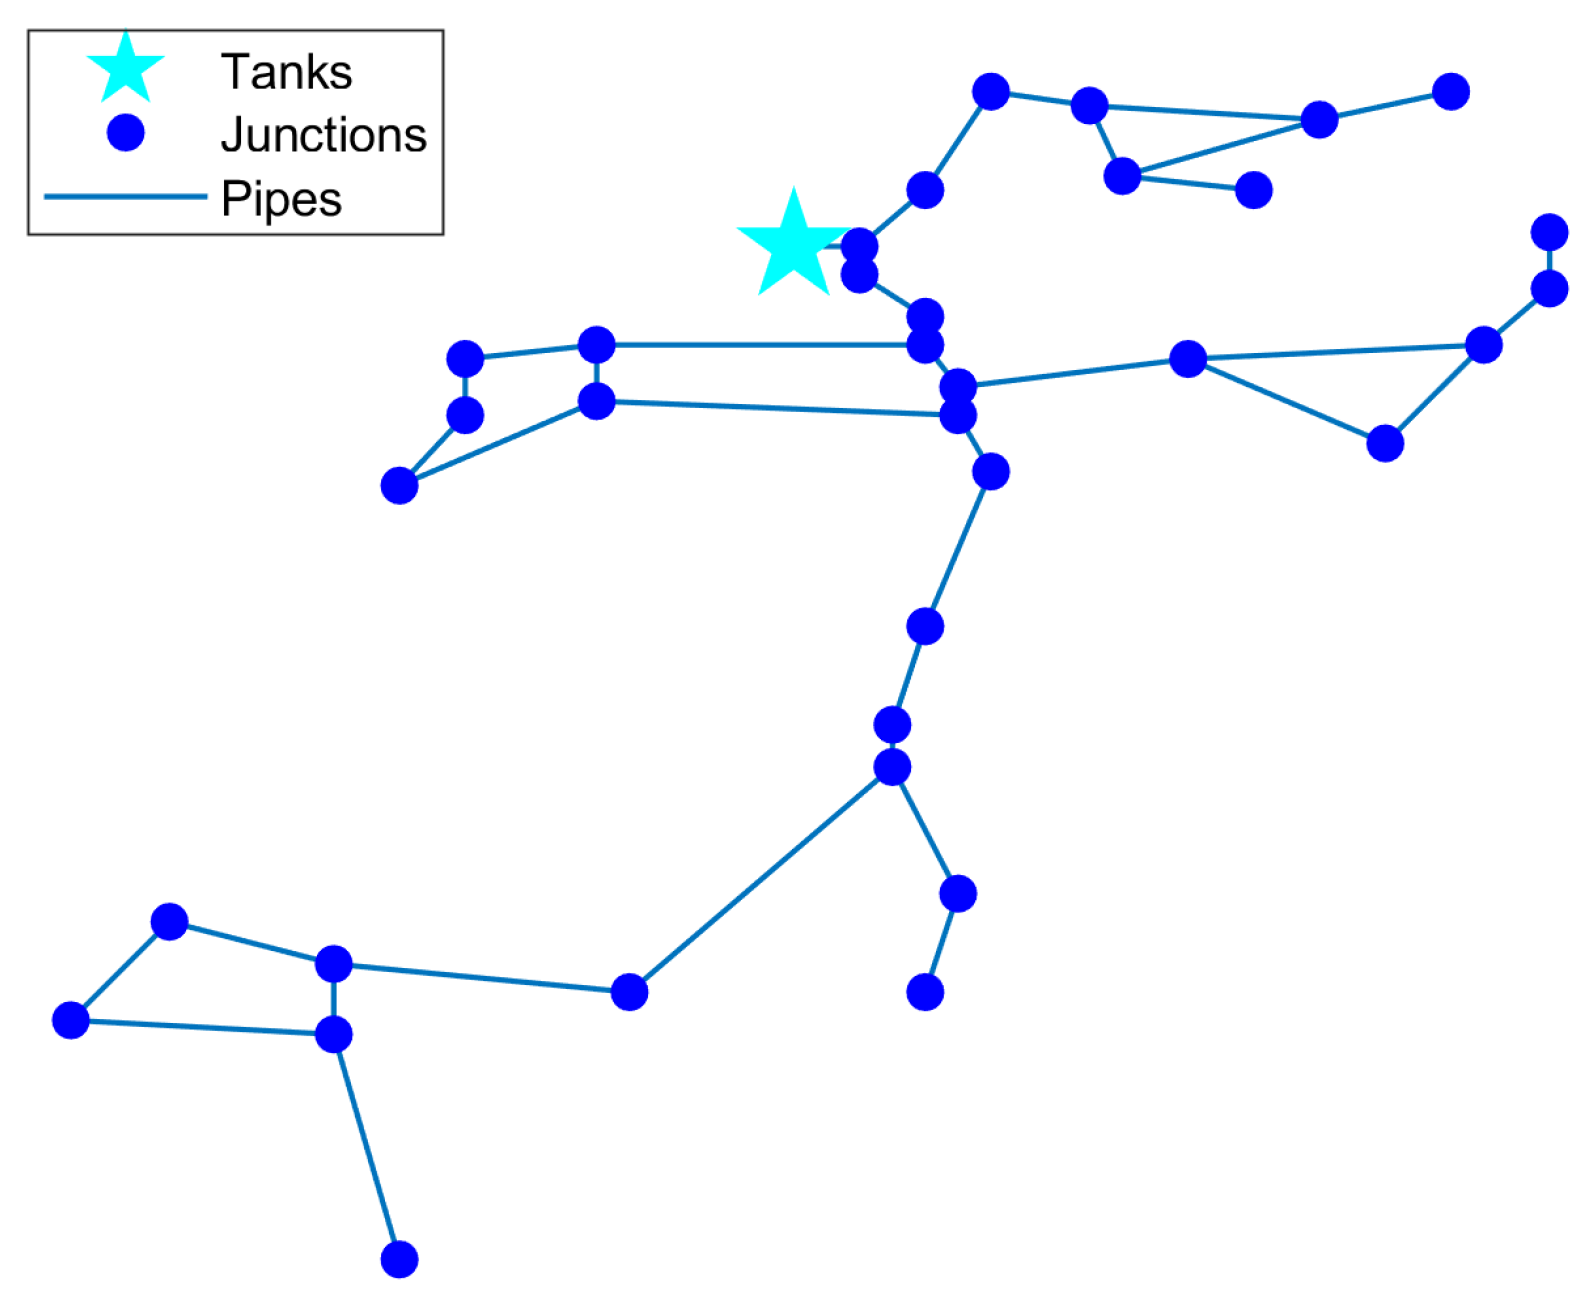
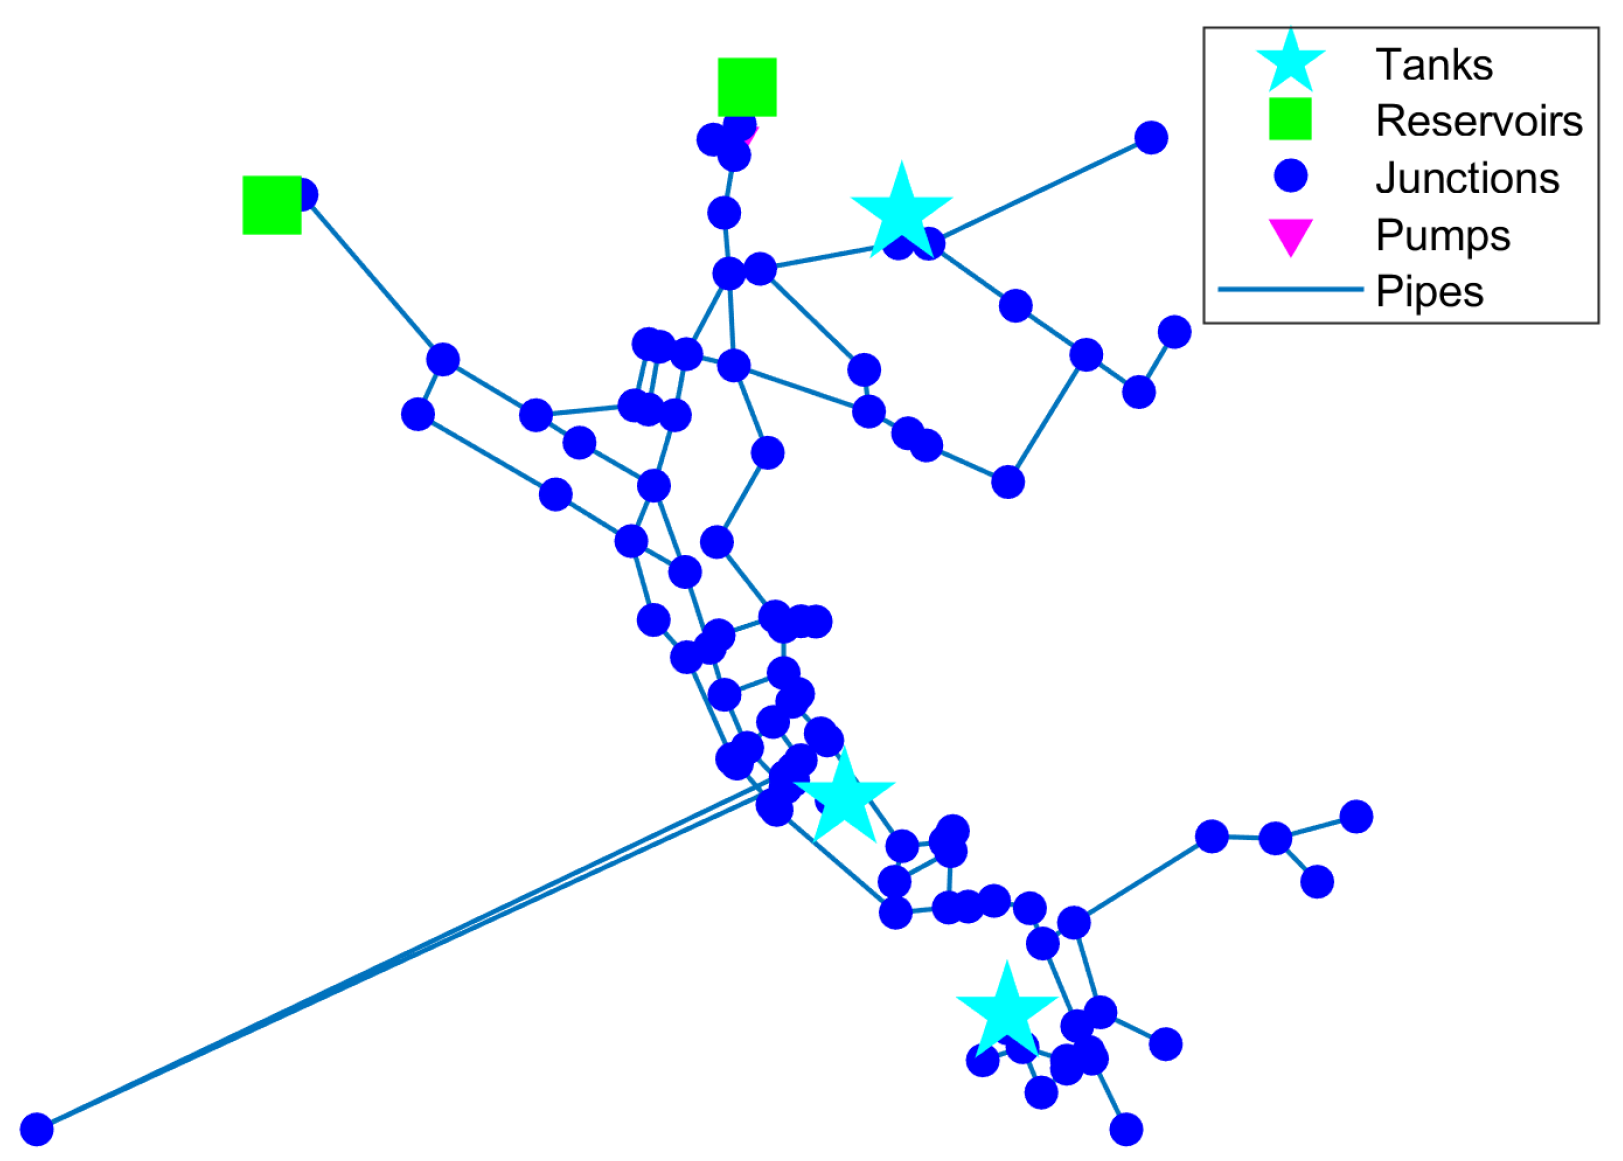
11], a vulnerability assessment was performed on different benchmarks to evaluate the metrics of centrality and such outbreak techniques. However, these benchmarks did not include tanks, pumps, or external sources. In this section, the benchmarks employed include such elements and the Matlab algorithm was extended to be able to simulate their effect.
The experiments on benchmarks validate the Matlab/EPANET algorithms for the application of the vulnerability framework. The benchmarks were selected from the EPANET library [
29] and
Figure 5,
Figure 6 and
Figure 7 present the graphs of each WDS, with the location of their elements. Furthermore,
Table 3 shows the characteristics of the benchmarks.
6.1. Attacks on Junctions
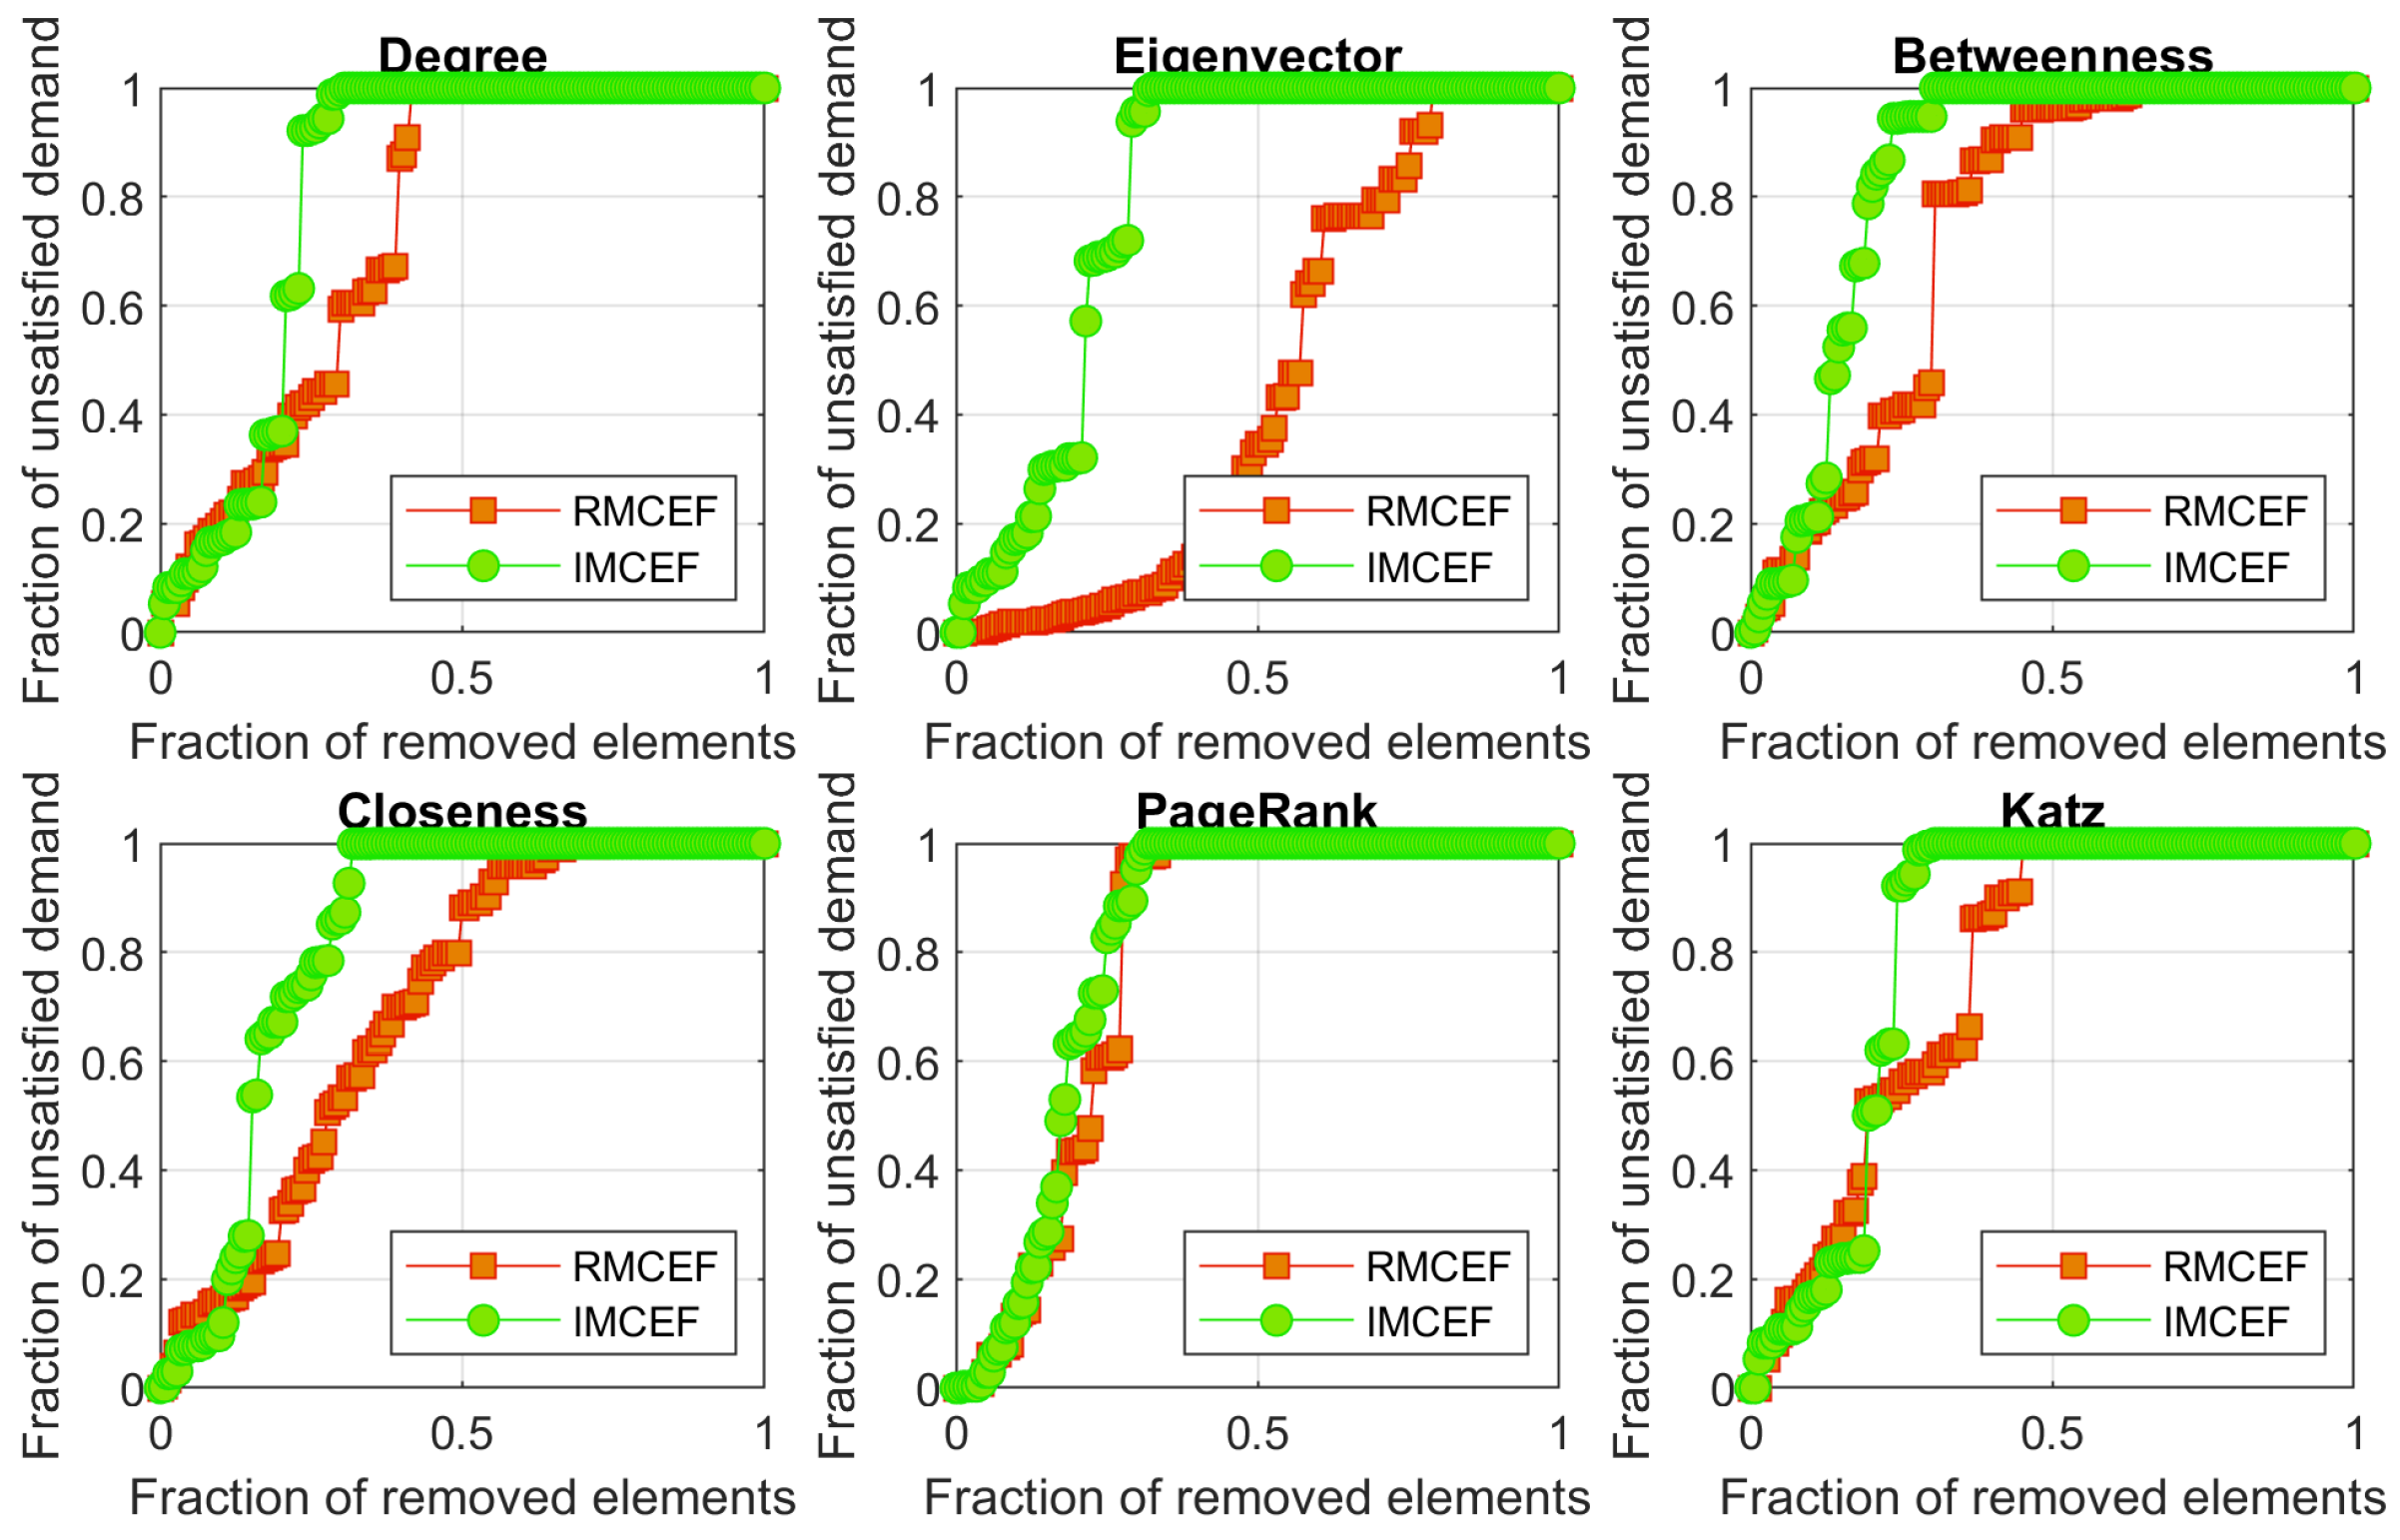
The first experiment consisted of applying the vulnerability framework to the benchmarks using two junction attack sequences to obtain the VPMs with different centrality measures.
Table 4 and
Figure 8 show the simulation results for this experiment.
It is observed that the IMCEF attack strategy predicted a higher vulnerability in most of the cases simulated, with VPMs over 0.8, while the RMCEF strategy presented more variability in the VPM results. PageRank, degree, and Katz centralities were the most consistent in retrieving the highest VPM in the cases studied.
A benchmark that presented the highest VPM was the Net2, which can be related to the fact that this network does not have reservoirs but only one external source.
6.2. Attacks on Pipes
The second experiment with benchmarks consisted of applying the vulnerability framework using two attack sequences on pipes to obtain the VPMs with different centrality measures. In these cases, the attack sequence is applied to the line graph obtained from the original WDS weighted graph model.
Table 5 and
Figure 9 show the simulation results.
One can note that the technique of IMCEF attack also predicted a higher vulnerability in most of the cases simulated, but in this experiment, the variability of the results was similar to the RMCEF strategy. Using centrality metrics, Katz and degree metrics were the most consistent in retrieving the maximum VPM in the majority of the considered types.
In this experiment, the benchmark with the highest VPM was the Net3. This means that this network can be more susceptible to the removal of specific pipes, and observing the topology as shown in
Figure 7, such pipes might be the ones that connect the reservoirs and the tanks.
7. Vulnerability of an Urban Water Distribution System Based in KSA: A Case Study
A WDS model based on the Al-Khobar water network was developed and employed to portray the characteristics of an urban Saudi Arabian WDS. The model was based on previous work developed in such a location, but the existing data had to be completed with values according to the local characteristics since the full model was not available. This resulted in a WDS with the following elements: 144 junctions, 198 pipes, 11 reservoirs, 2 tanks, and 8 external sources.
Figure 10 shows the topology of the representative urban Saudi Arabian WDS.
7.1. Attacks on Junctions
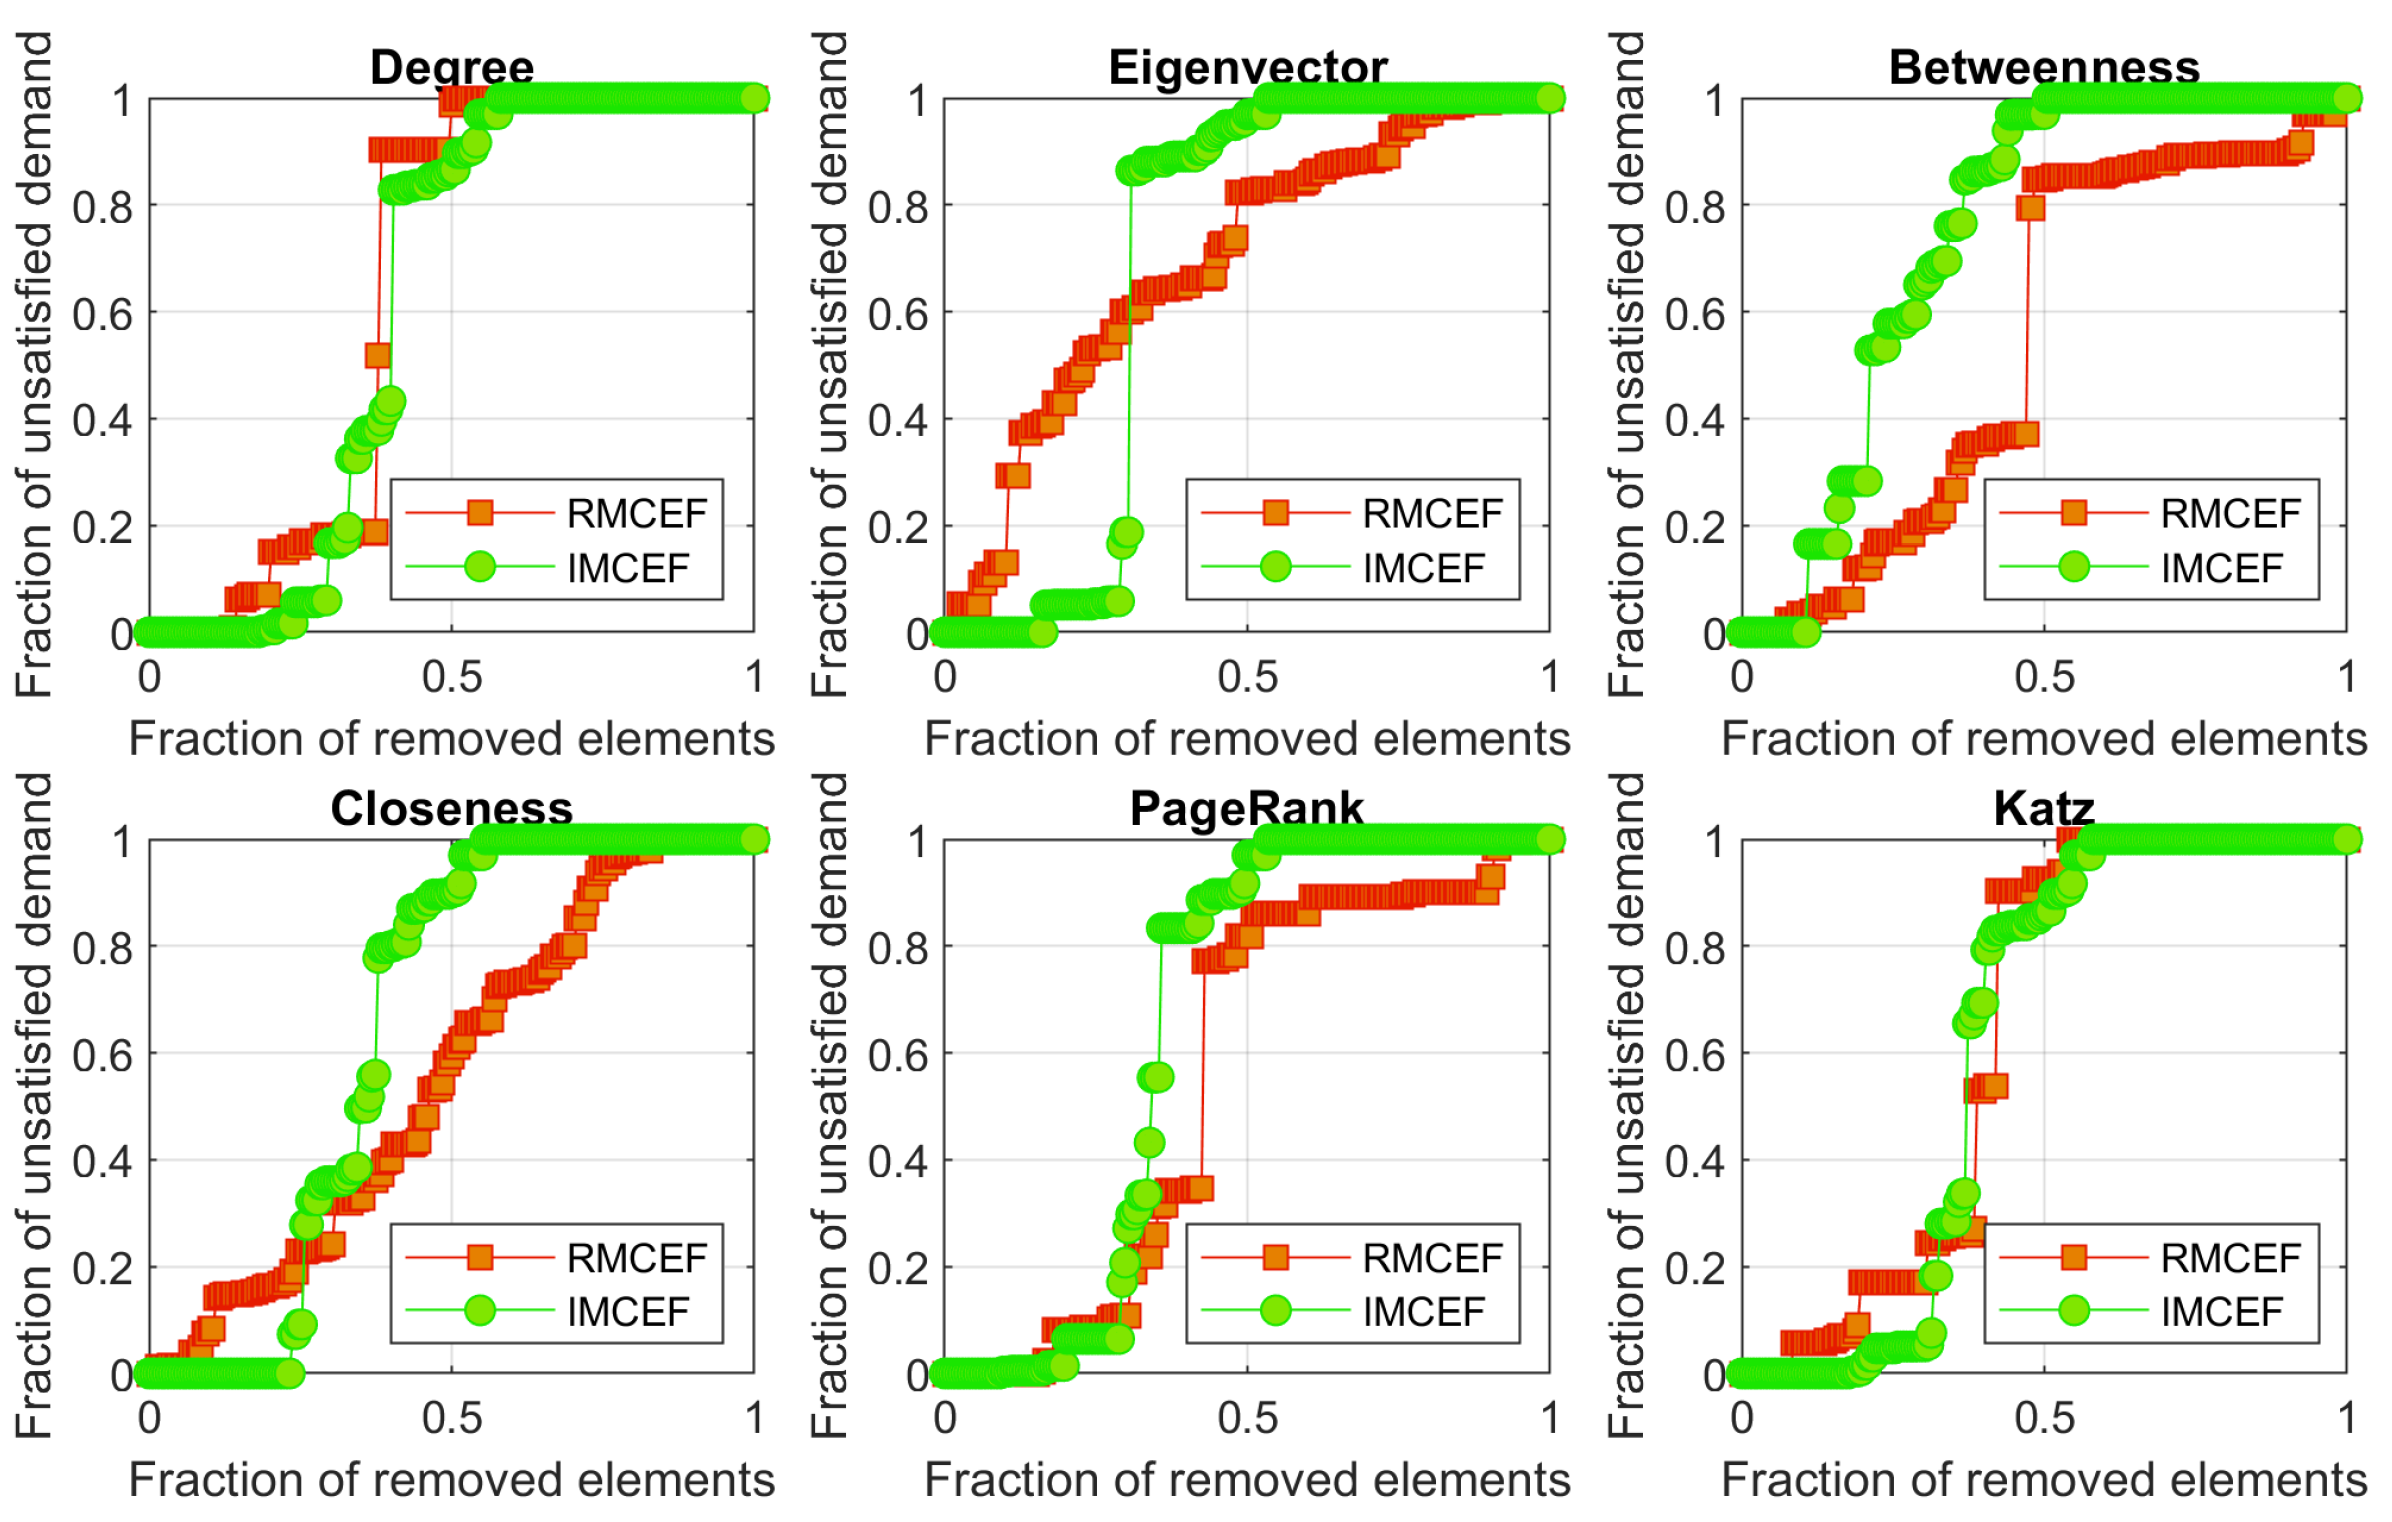
In the same way that it was done with the benchmarks, the vulnerability assessment framework was applied to the representative urban Saudi Arabian WDS. Initially, attacks on junctions were evaluated with different centrality measures and applying both fault sequences (RMCEF and IMCEF).
Figure 11 and
Table 6 show the results of this experiment with different centrality measures.
It is observed that the highest VPM was obtained for the IMCEF fault strategy with the betweenness centrality, followed by closeness and degree. From
Figure 11 it is also noted that the PageRank and the Katz vulnerability curves from both sequences are similar, which can help to predict the IMCEF curve and VPM with a more efficient approach than the RMCEF sequence.
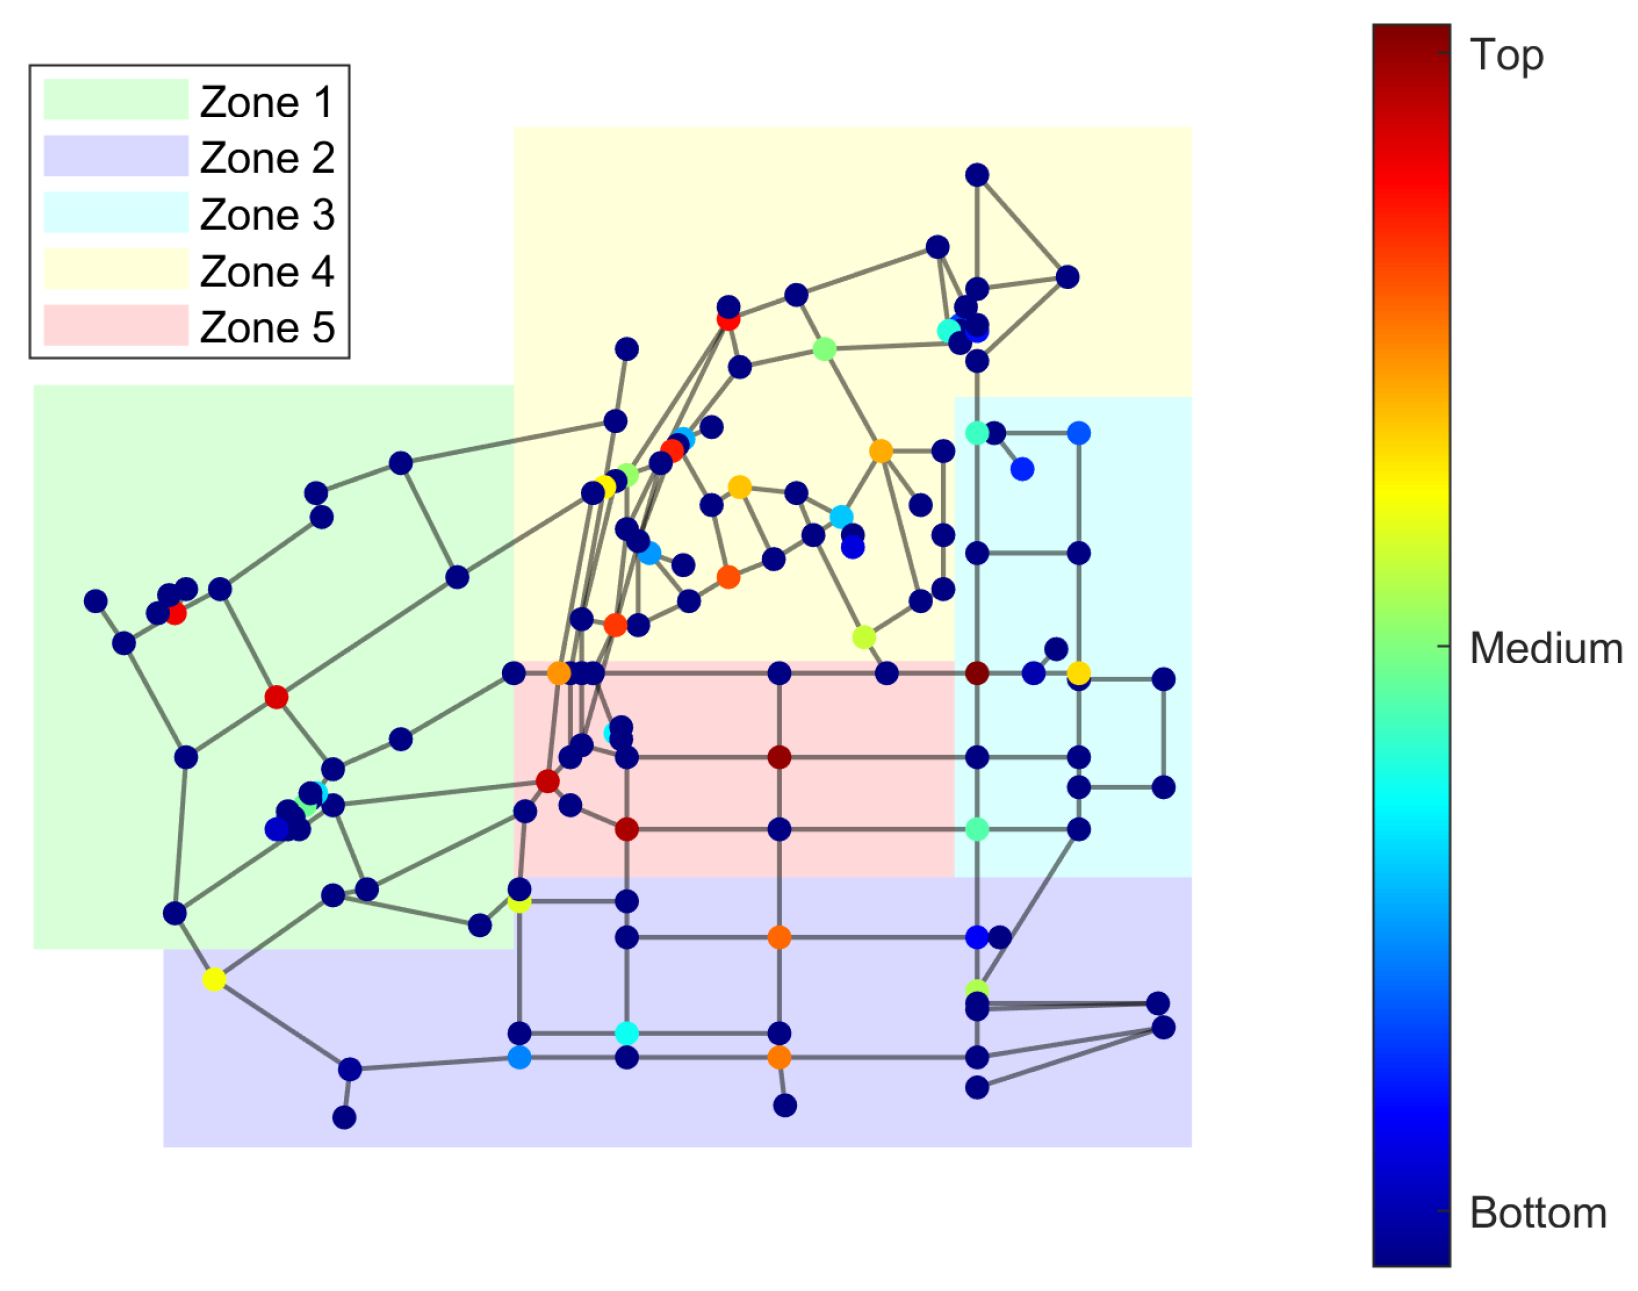
Furthermore, the calculated VPMs were lower than the ones obtained for the benchmarks in most cases, and observing the topology of the Saudi Arabian WDS it is evident that the network is more redundant and has multiple reservoirs, which make it less vulnerable. In the model, different zones were defined according to [
16] to assess their vulnerability as shown in
Figure 12.
Figure 12 shows a ranking of the junctions in the worst-case scenario (betweenness centrality) and they are also classified by zone, where the top nodes are the ones that are iteratively removed first. It is noted that the top nodes are located in different zones, and zones 4 and 5 have the largest amount of top junctions, representing the zones that are more central according to the iterated betweenness centrality.
In addition, the individual damage of removing each junction was evaluated and a ranking based on the
that each node causes is shown in
Figure 13. The nodes with the highest individual damage are located in zones 2 and 5. Thus, zone 5 of the network has two aspects that indicate its vulnerability.
7.2. Attacks on Pipes
The second part of the assessment was carried out on the pipes of the Saudi Arabian WDS. The attack sequence was applied to the line graph obtained by converting it to the simplified weighted graph.
Figure 14 and
Table 7 show the results of the vulnerability curves and the VPMs for the removal of pipes.
In this experiment, the IMCEF with betweenness centrality also presented the highest VPM followed by the eigenvector and PageRank. Examining
Figure 14, the vulnerability curves for the degree, PageRank, and Katz centralities are similar for RMCEF and IMCEF strategies.
8. Discussion
The simulations implemented demonstrate the vulnerability assessment in WDS with pumps, tanks, reservoirs, and external sources. The experiments in benchmarks allowed us to validate the algorithms with such elements for the removal of junctions and pipes. This also leads to confirming the importance of the reservoirs in increasing the robustness of the WDS.
The IMCEF fault sequence detected the worst cases of vulnerability for junctions and pipes. However, the RMCEF is helpful as a fast way to predict the vulnerability when the system is large.
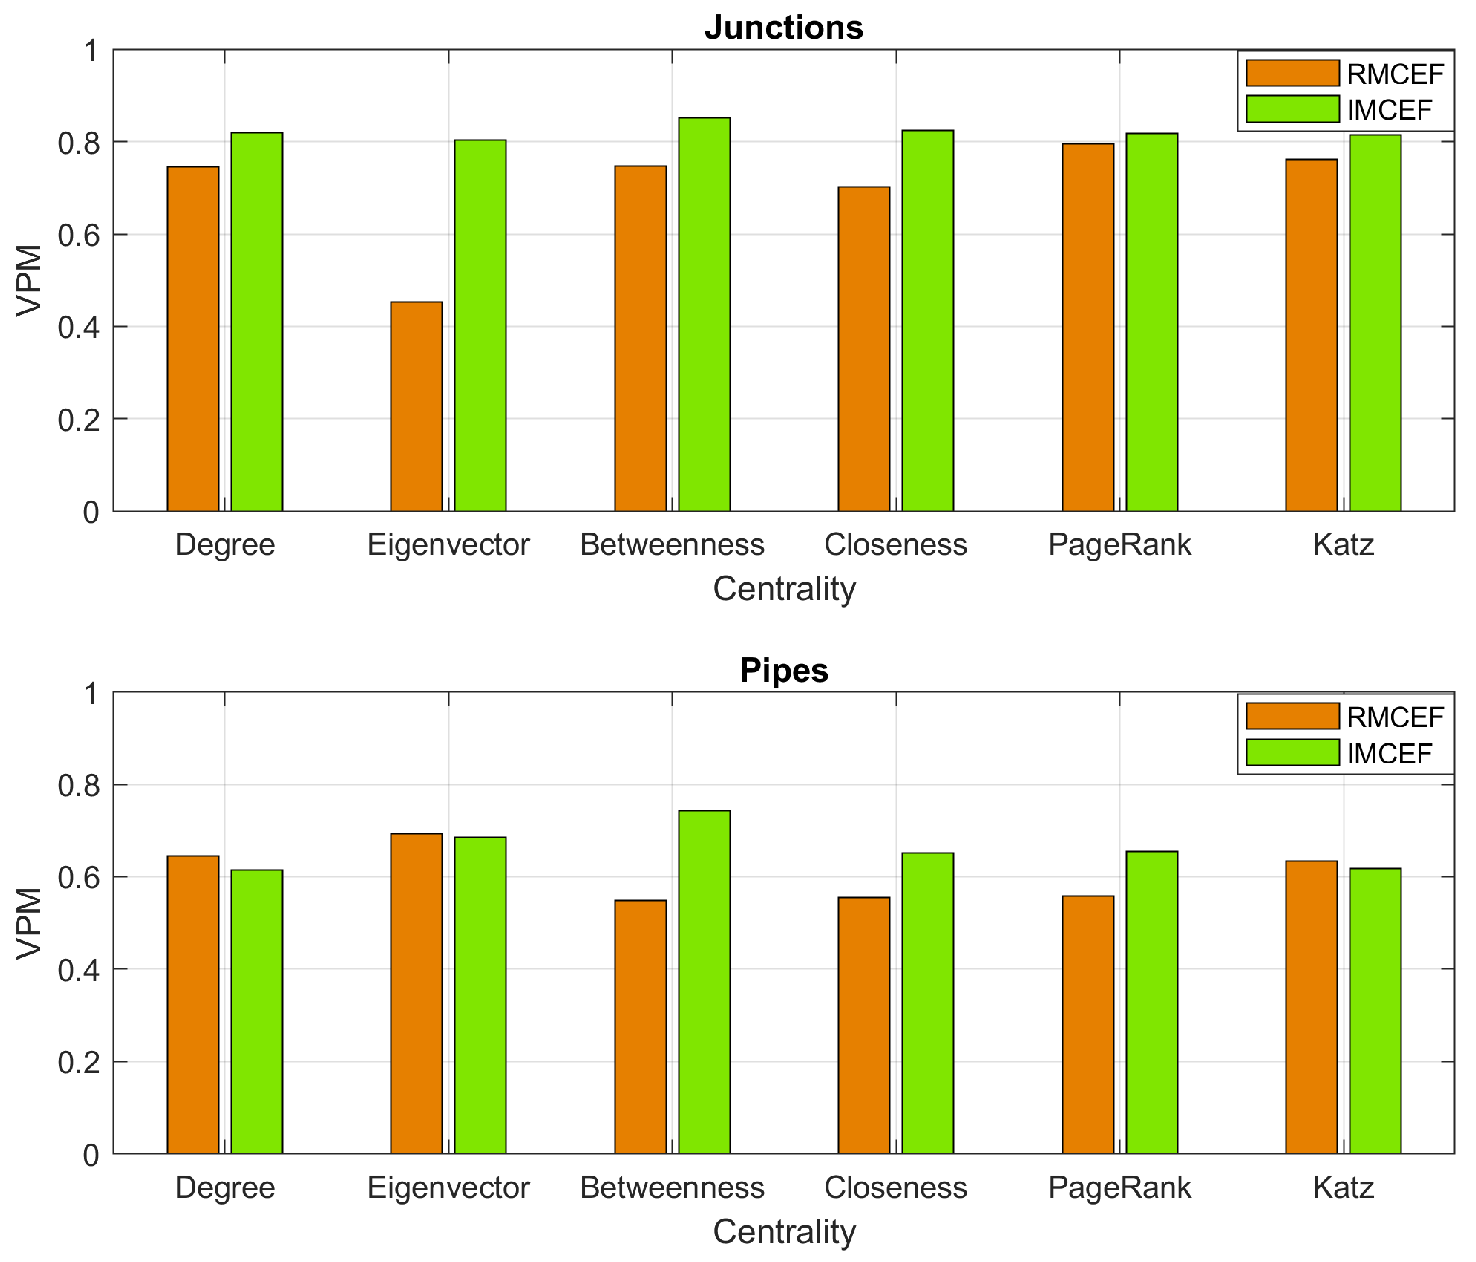
In particular, the assessment of the Saudi Arabian WDS demonstrated the importance of employing different centrality measures, since the betweenness had the highest VPM (
Figure 15), which contradicts some of the previous results in benchmarks. Also, it is important to consider that this model has multiple reservoirs, tanks, and external sources, which makes it more complex than previous models evaluated.
In this case, the betweenness being the most relevant centrality indicates that the robustness of this WDS is related to the high connectivity between the junctions. Zone 5 presented two indicators of being the most vulnerable zone. Factors that are affected, in this case, are that this zone has no reservoirs and is in the centre of the WDS, connecting the rest of the junctions.
In addition, this work shows the results using an individual demand scenario, which is useful to demonstrate the application of the vulnerability framework. Another extension of the work could be the evaluation of different demand scenarios since the VPM is based on dissatisfied demand, which can lead to variable vulnerability conditions.
9. Conclusions
The main contribution of this article is the application of a vulnerability framework based on a simplified weighted graph model to assess the vulnerability of a Saudi Arabian WDS. Hence, we evaluated the vulnerability of a WDS with characteristics that are based on the Al-Khobar WDS [
16]. We provided an application of this vulnerability framework with recommendations to improve the robustness of such networks.
Initially, the algorithm was validated with three benchmarks, including pumps, tanks, reservoirs, and external sources. This validation confirmed that the IMCEF allows obtaining the worst-case scenarios for the vulnerability and identified degree, Katz, and PageRank centralities as more representative. Also, it related the lack of reservoirs to a higher vulnerability, as was expected.
The implementation of the vulnerability framework in the Saudi Arabian WDS provides the vulnerability curves and the VPMs with different attack sequences. The results coincide with the IMCEF providing the worst VPM, but in this case, the fault sequences based on the betweenness centrality provided the highest VPM. This indicates that this network is more susceptible to the removal of the elements that are highly connected with the rest.
In addition, this work demonstrated the identification of vulnerable zones using attacks on junctions and their individual damage. The zones identified as the most vulnerable correspond with the zones with fewer reservoirs and no tanks, supporting the importance of such elements to guarantee the water supply to all consumers.
For future directions of this work, one can focus on the simulation of the vulnerability framework, including the segment networks, and optimising the WDS by minimising the VPM and increasing the robustness of the WDS based on the characteristics of the KSA. Furthermore, conducting empirical research to confirm the viability and efficacy of the suggested approach in realistic settings can be one viable area for further study. Insights can be gained by looking at how the approach can be scaled and used in other situations and locations. To increase the scope and impact of this effort, it is also important to consider possible synergies with adjacent research fields and multidisciplinary collaborations. A confluence of more recent work [
30,
31] with these suggestions will be crucial for future developments.
Author Contributions
Each author equally contributed to writing and finalising the article. Conceptualisation, A.A., A.T. and R.S.; Methodology, A.T. and R.S.; Software, A.A.; Validation, R.S.; Formal analysis, A.A.; Resources, A.A.; Data curation, R.S.; Writing—original draft, A.A.; Writing—review & editing, A.T. and R.S.; Visualisation, A.A.; Supervision, R.S.; Project administration, A.A. All authors have read and agreed to the published version of the manuscript.
Funding
This research received no external funding.
Institutional Review Board Statement
Not applicable.
Data Availability Statement
No new data was created for this research.
Acknowledgments
The authors extend their appreciation to the deputyship for Research & Innovation, Ministry of Education in Saudi Arabia for funding this research work through the project number (IFP-2020-13).
Conflicts of Interest
The authors declare no conflict of interest.
References
- Torres, J.; Duenas-Osorio, L.; Li, Q.; Yazdani, A. Exploring Topological Effects on Water Distribution System Performance Using Graph Theory and Statistical Models. J. Water Resour. Plan. Manag. 2017, 143, 04016068. [Google Scholar] [CrossRef]
- Klempous, R.; Kotowski, J.; Nikodem, J.; Olesiak, M.; Ulasiewicz, J. Some models for water distribution systems. J. Comput. Appl. Math. 1988, 21, 257–269. [Google Scholar] [CrossRef]
- Ko, M.J.; Choi, Y.H. Optimal Design of Water Distribution Systems Considering Topological Characteristics and Residual Chlorine Concentration. Mathematics 2022, 10, 4721. [Google Scholar] [CrossRef]
- Faramondi, L.; Setola, R.; Panzieri, S.; Pascucci, F.; Oliva, G. Finding critical nodes in infrastructure networks. Int. J. Crit. Infrastruct. Prot. 2018, 20, 3–15. [Google Scholar] [CrossRef]
- Giudicianni, C.; Di Nardo, A.; Di Natale, M.; Greco, R.; Santonastaso, G.; Scala, A. Topological taxonomy of water distribution networks. Water 2018, 10, 444. [Google Scholar] [CrossRef]
- Meng, F.; Fu, G.; Farmani, R.; Sweetapple, C.; Butler, D. Topological attributes of network resilience: A study in water distribution systems. Water Res. 2018, 143, 376–386. [Google Scholar] [CrossRef]
- Albarakati, A.; Bikdash, M.; Dai, X. Line-graph based modeling for assessing the vulnerability of transmission lines. In Proceedings of the SoutheastCon 2017, Concord, NC, USA, 30 March–2 April 2017; pp. 1–8. [Google Scholar]
- Gutiérrez-Pérez, J.; Herrera, M.; Pérez-García, R.; Ramos-Martínez, E. Application of graph-spectral methods in the vulnerability assessment of water supply networks. Math. Comput. Model. 2013, 57, 1853–1859. [Google Scholar] [CrossRef]
- Nardo, A.; Giudicianni, C.; Greco, R.; Herrera, M.; Santonastaso, G. Applications of graph spectral techniques to water distribution network management. Water 2018, 10, 45. [Google Scholar] [CrossRef]
- Albarakati, A. Evaluation of the Most Harmful Malicious Attacks in Power Systems Based on a New Set of Centralities. J. Electr. Eng. Technol. 2021, 16, 1929–1939. [Google Scholar] [CrossRef]
- Albarakati, A.; Tassaddiq, A.; Kale, Y. Evaluation of the vulnerability in water distribution systems through targeted attacks. AQUA—Water Infrastruct. Ecosyst. Soc. 2021, 70, 1257–1271. [Google Scholar] [CrossRef]
- Kim, A.; van der Beek, H. Holistic Assessment of the Water-for-Agriculture Dilemma in the Kingdom of Saudi Arabia; Georgetown University Qatar: Doha, Qatar, 2018. [Google Scholar]
- Gazzeh, K.; Abubakar, I. Regional disparity in access to basic public services in Saudi Arabia: A sustainability challenge. Util. Policy 2018, 52, 70–80. [Google Scholar] [CrossRef]
- Government of Saudi Arabia Saudi Vision 2030. 2016. Available online: https://vision2030.gov.sa/en (accessed on 17 January 2023).
- Holme, P.; Kim, B.J.; Yoon, C.N.; Han, S.K. Attack vulnerability of complex networks. Phys. Rev. E 2002, 65, 056109. [Google Scholar] [CrossRef] [PubMed]
- Sharif, M.; Farahat, A.; Al-Zahrani, M.; Islam, N.; Rodriguez, M.; Sadiq, R. Optimization of chlorination boosters in drinking water distribution network for Al-Khobar City in Saudi Arabia. Arab. J. Geosci. 2016, 9, 1–11. [Google Scholar] [CrossRef]
- Kapelan, Z. Modelling in water distribution systems. In Simplicity Complexity And Modelling (Statistics in Practice); John Wiley & Sons: Hoboken, NJ, USA, 2011; pp. 103–124. [Google Scholar]
- Eliades, D.; Kyriakou, M.; Vrachimis, S.; Polycarpou, M. EPANET-MATLAB Toolkit: An Open-Source Software for Interfacing EPANET with MATLAB. In Proceedings of the Computing and Control for the Water Industry CCWI 2016, Amsterdam, The Netherlands, 7–9 November 2016; pp. 1–8. [Google Scholar]
- Eliades, D.; Kyriakou, M.; Vrachimis, S.; Polycarpou, M. OpenWaterAnalytics Epanet-Matlab Toolkit. MathWorks File Exchange. 2021. Available online: https://la.mathworks.com/matlabcentral/fileexchange/25100-openwateranalytics-epanet-matlab-toolkit (accessed on 17 January 2023).
- The Mathworks Inc. Graph and Network Algorithms. Matlab Documentation. 2020. Available online: https://www.mathworks.com/help/matlab/graph-and-network-algorithms.html (accessed on 17 January 2023).
- Agathokleous, A.; Christodoulou, C.; Christodoulou, S. Topological Robustness and Vulnerability Assessment of Water Distribution Networks. Water Resour. Manag. 2017, 31, 4007–4021. [Google Scholar] [CrossRef]
- Giustolisi, O.; Ridolfi, L.; Simone, A. Tailoring Centrality Metrics for Water Distribution Networks. Water Resour. Res. 2019, 55, 2348–2369. [Google Scholar] [CrossRef]
- Bloch, F.; Jackson, M.; Pietro, T. Centrality Measures in Networks. Soc. Choice Welf. 2023, 61, 413–453. [Google Scholar] [CrossRef]
- Page, L.; Brin, S.; Motwani, R.; Winograd, T. The Page Rak Citation Ranking: Bringing Order to the Web. In Technical Report; 1999; pp. 1–17. [Google Scholar]
- Riquelme, F.; Gonzalez-Cantergiani, P.; Molinero, X.; Serna, M. Centrality measure in social networks based on linear threshold model. Knowl.-Based Syst. 2018, 140, 92–102. [Google Scholar] [CrossRef]
- Katz, L. A new status index derived from sociometric analysis. Psychometrika 1953, 18, 39–43. [Google Scholar] [CrossRef]
- Godsil, C.; Royle, G. Algebraic Graph Theory; Springer: New York, NY, USA, 2001; Volume 207. [Google Scholar]
- Yoshida, T. Weighted line graphs for overlapping community discovery. Soc. Netw. Anal. Min. 2013, 3, 1001–1013. [Google Scholar] [CrossRef]
- United States Environmental Protection Agency Epanet Application for Modeling Drinking Water Distribution Systems. Available online: https://www.epa.gov/water-research/epanet (accessed on 17 January 2023).
- Albarakati, A.J.; Boujoudar, Y.; Azeroual, M.; Eliysaouy, L.; Kotb, H.; Aljarbouh, A.; Khalid Alkahtani, H.; Mostafa, S.M.; Tassaddiq, A.; Pupkov, A. Microgrid energy management and monitoring systems: A comprehensive review. Front. Energy Res. 2022, 10, 1097858. [Google Scholar] [CrossRef]
- Albarakati, A.J.; Azeroual, M.; Boujoudar, Y.; EL Iysaouy, L.; Aljarbouh, A.; Tassaddiq, A.; EL Markhi, H. Multi-Agent-Based Fault Location and Cyber-Attack Detection in Distribution System. Energies 2023, 16, 224. [Google Scholar] [CrossRef]
Figure 1.
Flow diagram for the Remove Most Central Element First (RMCEF) fault sequence.
Figure 1.
Flow diagram for the Remove Most Central Element First (RMCEF) fault sequence.
Figure 2.
Flow diagram for the Iterated Most Central Element First (IMCEF) fault sequence.
Figure 2.
Flow diagram for the Iterated Most Central Element First (IMCEF) fault sequence.
Figure 3.
Graph corresponding to the EPANET-MSX Example Network.
Figure 3.
Graph corresponding to the EPANET-MSX Example Network.
Figure 4.
Line graph corresponding to the EPANET-MSX Example Network applying the line graph conversion.
Figure 4.
Line graph corresponding to the EPANET-MSX Example Network applying the line graph conversion.
Figure 5.
Network topology of the selected benchmarks (Net1).
Figure 5.
Network topology of the selected benchmarks (Net1).
Figure 6.
Network topology of the selected benchmarks (Net2).
Figure 6.
Network topology of the selected benchmarks (Net2).
Figure 7.
Network topology of the selected benchmarks (Net3).
Figure 7.
Network topology of the selected benchmarks (Net3).
Figure 8.
VPM resulting from attacks based on junction removal under various fault schemes.
Figure 8.
VPM resulting from attacks based on junction removal under various fault schemes.
Figure 9.
VPM through assaults using various fault methods and pipe removal.
Figure 9.
VPM through assaults using various fault methods and pipe removal.
Figure 10.
Network topology of the representative urban Saudi Arabian WDS.
Figure 10.
Network topology of the representative urban Saudi Arabian WDS.
Figure 11.
Vulnerability curves obtained from attacks on junctions with different centrality measures and attack sequences for the representative urban Saudi Arabian WDS.
Figure 11.
Vulnerability curves obtained from attacks on junctions with different centrality measures and attack sequences for the representative urban Saudi Arabian WDS.
Figure 12.
Zone definition and vulnerability ranking of junctions for the representative urban Saudi Arabian WDS.
Figure 12.
Zone definition and vulnerability ranking of junctions for the representative urban Saudi Arabian WDS.
Figure 13.
Ranking of junctions according to the normalised individual damage.
Figure 13.
Ranking of junctions according to the normalised individual damage.
Figure 14.
Vulnerability curves obtained from attacks on pipes with different centrality measures and attack sequences for the representative urban Saudi Arabian WDS.
Figure 14.
Vulnerability curves obtained from attacks on pipes with different centrality measures and attack sequences for the representative urban Saudi Arabian WDS.
Figure 15.
Summary of the VPM for the representative urban Saudi Arabian WDS.
Figure 15.
Summary of the VPM for the representative urban Saudi Arabian WDS.
Table 1.
Edges and adjacency matrix corresponding to the EPANET-MSX Example Network.
Table 1.
Edges and adjacency matrix corresponding to the EPANET-MSX Example Network.
| From Node | To Node | Weight | Adjacency Matrix (A) |
|---|
| 1 | 2 | 4.0691 | 0 | 4.0691 | 7.1309 | 0 | 15.3000 |
| 1 | 3 | 7.1309 | 4.0691 | 0 | 0.6691 | 0 | 0 |
| 1 | 5 | 15.3000 | 7.1309 | 0.6691 | 0 | 2.3000 | 0 |
| 2 | 3 | 0.6691 | 0 | 0 | 2.3000 | 0 | 0 |
| 3 | 4 | 2.3000 | 15.3000 | 0 | 0 | 0 | 0 |
Table 2.
Edges and adjacency matrix corresponding to the line graph obtained from the EPANET-MSX Example Network.
Table 2.
Edges and adjacency matrix corresponding to the line graph obtained from the EPANET-MSX Example Network.
| From Node | To Node | Weight | Adjacency Matrix (M) |
|---|
| 1 | 2 | 13.8885 | 0 | 13.8885 | 23.7508 | 0 | 0 |
| 1 | 3 | 23.7508 | 13.8885 | 0 | 4.3525 | 1.5449 | 0 |
| 2 | 3 | 4.3525 | 23.7508 | 4.3525 | 0 | 1.2582 | 7.2421 |
| 2 | 4 | 1.5449 | 0 | 1.5449 | 1.2582 | 0 | 0.4354 |
| 3 | 4 | 1.2582 | 0 | 0 | 7.2421 | 0.4354 | 0 |
| 3 | 5 | 7.2421 | | | | | |
| 4 | 5 | 0.4354 | | | | | |
Table 3.
Properties of the WDS benchmarks.
Table 3.
Properties of the WDS benchmarks.
| Benchmark | Junctions | Pipes | Reservoirs | Tanks | External src |
|---|
| Net1 | 11 | 13 | 1 | 1 | 0 |
| Net2 | 36 | 40 | 0 | 1 | 1 |
| Net3 | 97 | 119 | 2 | 3 | 0 |
Table 4.
VPM from various attack profiles applied at junctions.
Table 4.
VPM from various attack profiles applied at junctions.
| Strategy | Centrality | VPM |
|---|
| Net1 | Net2 | Net3 |
|---|
| RMCEF | Degree | 0.785 | 0.783 | 0.768 |
| Eigenvector | 0.706 | 0.723 | 0.627 |
| Betweenness | 0.876 | 0.830 | 0.662 |
| Closeness | 0.876 | 0.750 | 0.612 |
| PageRank | 0.834 | 0.958 | 0.842 |
| Katz | 0.706 | 0.768 | 0.760 |
| IMCEF | Degree | 0.863 | 0.918 | 0.953 |
| Eigenvector | 0.863 | 0.914 | 0.952 |
| Betweenness | 0.863 | 0.926 | 0.901 |
| Closeness | 0.863 | 0.922 | 0.875 |
| PageRank | 0.834 | 0.863 | 0.889 |
| Katz | 0.863 | 0.914 | 0.952 |
Table 5.
VPM through various pipe-targeted attack profiles.
Table 5.
VPM through various pipe-targeted attack profiles.
| Technique | Centrality Metrics | VPM Types |
|---|
| Net1 | Net2 | Net3 |
|---|
| RMCEF | Degree | 0.730 | 0.776 | 0.750 |
| Eigenvector | 0.664 | 0.709 | 0.598 |
| Betweenness | 0.503 | 0.791 | 0.611 |
| Closeness | 0.580 | 0.682 | 0.506 |
| PageRank | 0.569 | 0.690 | 0.681 |
| Katz | 0.664 | 0.778 | 0.749 |
| IMCEF | Degree | 0.884 | 0.932 | 0.962 |
| Eigenvector | 0.884 | 0.921 | 0.961 |
| Betweenness | 0.566 | 0.918 | 0.881 |
| Closeness | 0.723 | 0.894 | 0.798 |
| PageRank | 0.643 | 0.775 | 0.805 |
| Katz | 0.884 | 0.943 | 0.962 |
Table 6.
VPM for various assault profiles carried out for junctions.
Table 6.
VPM for various assault profiles carried out for junctions.
| Centrality Metrics | VPM Types |
|---|
| RMCEF | IMCEF |
|---|
| Degree | 0.745 | 0.819 |
| Eigenvector | 0.452 | 0.802 |
| Betweenness | 0.747 | 0.851 |
| Closeness | 0.701 | 0.824 |
| PageRank | 0.795 | 0.817 |
| Katz | 0.762 | 0.815 |
Table 7.
VPM for various assault profiles carried out for pipes.
Table 7.
VPM for various assault profiles carried out for pipes.
| Centrality Metrics | Kinds of VPM |
|---|
| RMCEF | IMCEF |
|---|
| Degree | 0.644 | 0.613 |
| Eigenvector | 0.692 | 0.684 |
| Betweenness | 0.548 | 0.743 |
| Closeness | 0.554 | 0.651 |
| PageRank | 0.558 | 0.654 |
| Katz | 0.633 | 0.617 |
| Disclaimer/Publisher’s Note: The statements, opinions and data contained in all publications are solely those of the individual author(s) and contributor(s) and not of MDPI and/or the editor(s). MDPI and/or the editor(s) disclaim responsibility for any injury to people or property resulting from any ideas, methods, instructions or products referred to in the content. |
© 2023 by the authors. Licensee MDPI, Basel, Switzerland. This article is an open access article distributed under the terms and conditions of the Creative Commons Attribution (CC BY) license (https://creativecommons.org/licenses/by/4.0/).
