Article

Modified Maximum Likelihood Estimation of the Inverse Weibull Model

by
Mohamed Kayid
1 and
Mashael A. Alshehri
2,*
1
Department of Statistics and Operations Research, College of Science, King Saud University, Riyadh 11451, Saudi Arabia
2
Department of Quantitative Analysis, College of Business Administration, King Saud University, Riyadh 11362, Saudi Arabia
*
Author to whom correspondence should be addressed.
Axioms 2023, 12(10), 961; https://doi.org/10.3390/axioms12100961
Submission received: 23 August 2023 / Revised: 24 September 2023 / Accepted: 11 October 2023 / Published: 12 October 2023
(This article belongs to the Special Issue Mathematical and Statistical Methods and Their Applications)

Abstract

:
The inverse Weibull model is a simple and flexible model used for survival analysis, reliability theory, and other scientific fields. The main problem in this context is the estimation of the model parameters. In this study, a modified version of the maximum likelihood estimator is presented. The idea behind it is that the likelihood equation for the shape parameters of the model is biased; therefore, an unbiased version was defined. The new estimator is based on the definition of an unbiased likelihood equation. Simulation results show that the new modified estimator for the shape parameter has a smaller mean square error. Finally, the proposed estimator and the maximum likelihood estimator were compared in the analysis of the three real data sets.

1. Introduction

The inverse Weibull (IW) model, also known as the Fréchet distribution or extreme value distribution of type II, is a simple and very flexible statistical model and plays an important role in reliability theory, survival analysis, reliability engineering and extreme value analysis. For a working component or living creature, the HR function at time x gives the instantaneous risk of fail or die at x given survival up to x . One of the most important reliability features of the IW model is that its hazard rate (HR) function exhibits a unimodal form (first increasing, then decreasing). The well-known Weibull model, which is another important model in reliability theory and survival analysis. shows increasing or decreasing HR function and is not suitable for data with unimodal HR function. So, we should consider a unimodal HR model like IW for analyzing data with unimodal HR function. In terms of the HR form, the IW model is suitable for lifetime data related to cancer events, floods, and earthquakes (see Jiang et al. [1] for a general study of unimodal HR models). The IW model was used to analyze several real data examples. For example, Keller et al. [2] analyzed engine data sets from six different manufacturers and showed that the model provided a better description of the data under consideration than the Weibull model. Akgul et al. [3] also applied the IW model to wind speed data.
The IW model is the topic of many studies, e.g., Calabria and G. Pulcini [4] studied some statistical properties of the IW distribution specifically related to censored samples, Jiang et al. [5] considered a mixture model, a competing risk model and a multiplicative model with two IW distributions, Mahmoud et al. [6] studied the order statistics of the IW distribution, Sultan et al. [7] considered a mixture of two IW model, studied some reliability properties of it, proved the identifiability property of the mixture model and discussed the estimation of the model by the EM algorithm, Balakrishnan and M. Kateri [8] studied the maximum likelihood estimation of the IW model parameters for complete and censored data. In addition, Kundu and Howlader [9] presented a Bayesian inference regarding the IW distribution for censored data of type II; Gusmão et al. [10] introduced a new generalization of the IW distribution. Sultan et al. [11] investigated Bayesian and maximum likelihood estimation of the IW model under progressive type-II censoring, Kim et al. [12] discussed non-informative priors for the IW distribution, Loganathan and Uma [13] compared maximum likelihood estimators (MLE), least squares errors and weighted least squares error estimators for estimating the parameters of the IW model. Based on their simulation results, the MLE outperformed the other two candidates in terms of mean squared error (MSE), Ramos et al. [14] proposed a new long-term Fréchet distribution and used the MLE to estimate the parameters, Singh and Tripathi [15] estimated the parameters of the IW distribution under progressive type I interval censoring, Pedro et al. [16] studied the IW model from the point of view of estimation and application, Alkarni et al. [17] proposed an extended IW distribution, Kazemi and Azizpoor [18] and Nassar and Abo-Kasem [19] discussed the problem of estimating the parameters of the IW model for censored data, and Jana and Bera [20] compared the MLE with the Bayes estimator for estimating the parameters of the IW model.
Recently, Jokiel-Rokita and Piatek [21] proposed and studied a modified MLE (MMLE) for estimating the parameters of the Weibull model. They modified the likelihood equation for the shape parameter to be unbiased and compared the bias and MSE of the modified estimator with the ordinary MLE.
In this study, we introduce an MMLE to estimate the parameters of the IW model. Simulation results show that this modification improves the MLE in terms of bias and MSE. The remainder of this paper is organized as follows. Section 2 defines the MMLE and discusses its properties. Section 3 summarizes the results of the simulation studies that examined the behavior of the MLE and MMLE, and their comparison. Section 4 analyzes three real data sets and compares the MLE and MMLE. Finally, Section 5 concludes the paper.

2. Modified MLE

The inverse Weibull (IW) model, also known as the Fréchet distribution or extreme value distribution of type II, is characterized by the following probability density function (PDF):
f x = α λ α x α 1 e x p ( x λ ) α , α > 0 , λ > 0 , x 0 .
It is an important model in reliability theory, survival analysis, reliability engineering and extreme value analysis. Its hazard rate (HR) function is
h x = α λ α x α 1 e x p ( x λ ) α 1 , α > 0 , λ > 0 , x 0 .
Assume an independent and identically distributed realization of the IW model (1). The log-likelihood function with respect to the IW model is
l α λ = n l n α + n α l n λ α + 1 i = 1 n   l n x i i = 1 n   λ α x i α .
The likelihood equations for α and λ are
n α + n l n λ i = 1 n   l n x i + i = 1 n   λ α x i α l n x i λ = 0 ,
and
n α λ i = 1 n   α λ α 1 x i α = 0 .
By solving Equation (5) for λ , the MLE for the scale parameter equals
λ ^ = n i = 1 n   x i α ^ 1 α ^ ,
where α ^ is the MLE of α .
Lemma 1. 
The MLE of  α  can be calculated by solving the following equation:
i = 1 n   x i α + 1 n i = 1 n   x i α i = 1 n   l n x i α i = 1 n   x i α l n x i α = 0 .
Proof. 
Equation (4) is considered to provide a new equation just in terms of the shape parameter α .
By (6), we substitute λ by λ = n i = 1 n   x i α 1 α in Equation (4) and multiply both sides by α n i = 1 n   x i α . Then, we obtained the following equation:
i = 1 n   x i α + i = 1 n   x i α ln n i = 1 n   x i α α n i = 1 n   x i α i = 1 n   ln x i + α n i = 1 n   x i α i = 1 n   n i = 1 n   x i α x i α l n x i α n i = 1 n   x i α i = 1 n   n i = 1 n   x i α x i α 1 α l n n i = 1 n   x i α = 0 .
Equation (7) can be obtained after some straightforward simplification. □
A major drawback of Equation (7) is that it is not unbiased for the estimation of α and λ , i.e.,
E α , λ i = 1 n   X i α + 1 n i = 1 n   X i α i = 1 n   l n X i α i = 1 n   X i α l n X i α = λ α 0 .
As a result, the following lemma formulates this problem and proves it. The problem is more strict for larger λ α .
Lemma 2. 
A modified unbiased version (MUV) of Equation (7) is
M U V = n 1 n i = 1 n   X i α + 1 n i = 1 n   X i α i = 1 n   l n X i α i = 1 n   X i α l n X i α = 0 .
Proof. 
It can be checked that, see Appendix A,
E ( X i α ) = λ α ,
E ( l n X i α ) = ψ ( 1 ) l n λ α ,
and
E ( X i α l n X i α ) = λ α ( ψ ( 1 ) + 1 l n λ α ) ,
where ψ is the well-known digamma function. Now, the expectation ( 8 ) could be simplified as in the following:
E i = 1 n   X i α + E 1 n i = 1 n   X i α i = 1 n   l n X i α E i = 1 n   X i α l n X i α   = n λ α + E i = 1 n   j = 1 , i j n   X i α l n X j α + E i = 1 n   X i α l n X i α   n λ α ( ψ ( 1 ) + 1 l n λ α ) = n λ α + ( n 1 ) λ α ( ψ ( 1 ) l n λ α ) + λ α ( ψ ( 1 ) + 1 l n λ α ) n λ α ψ 1 + 1 l n λ α  
= λ α .
Similarly, it is straightforward to check that
E n 1 n i = 1 n   X i α + 1 n i = 1 n   X i α i = 1 n   l n X i α i = 1 n   X i α l n X i α = 0 ,
that is (9) shows an unbiased equation. □
As a general approach, when one or some of the likelihood equations are biased, we may transform them to a MUV. However, the general approach is the same for all scenarios and models, but the transformation may differ.
The following result guarantees the existence of a unique solution for the proposed unbiased equation.
Theorem 1.
The MUV has a unique solution.
Proof. 
The proof follows completely similarly to the problem of existence and uniqueness of the MLE discussed by Balakrishnan and Kateri [8] and Jana and Bera [20]. □
Let α ~ be the answer of the unbiased equation ( 9 ) that is the MMLE of α , then the MMLE of λ is defined by
λ ~ = n i = 1 n   x i α ~ 1 α ~ .
Theorem 2. 
The MMLE of  ( α , λ )  is consistent.
Proof. 
Let
η ( α ; X ) = i = 1 n   X i α + 1 n i = 1 n   X i α i = 1 n   l n X i α i = 1 n   X i α l n X i α .
Clearly, η ( α ; X ) is a continuous function in terms of α . On the other hand the left side of (9) converges almost surely to whatever η ( α ; X ) converges. Now, since α ^ , which is calculated by solving the equation η ( α ; X ) = 0 , is consistent, we can conclude α ~ is consistent too. Then, the consistency of λ ~ follows by the consistency of α ~ . □

3. Simulations

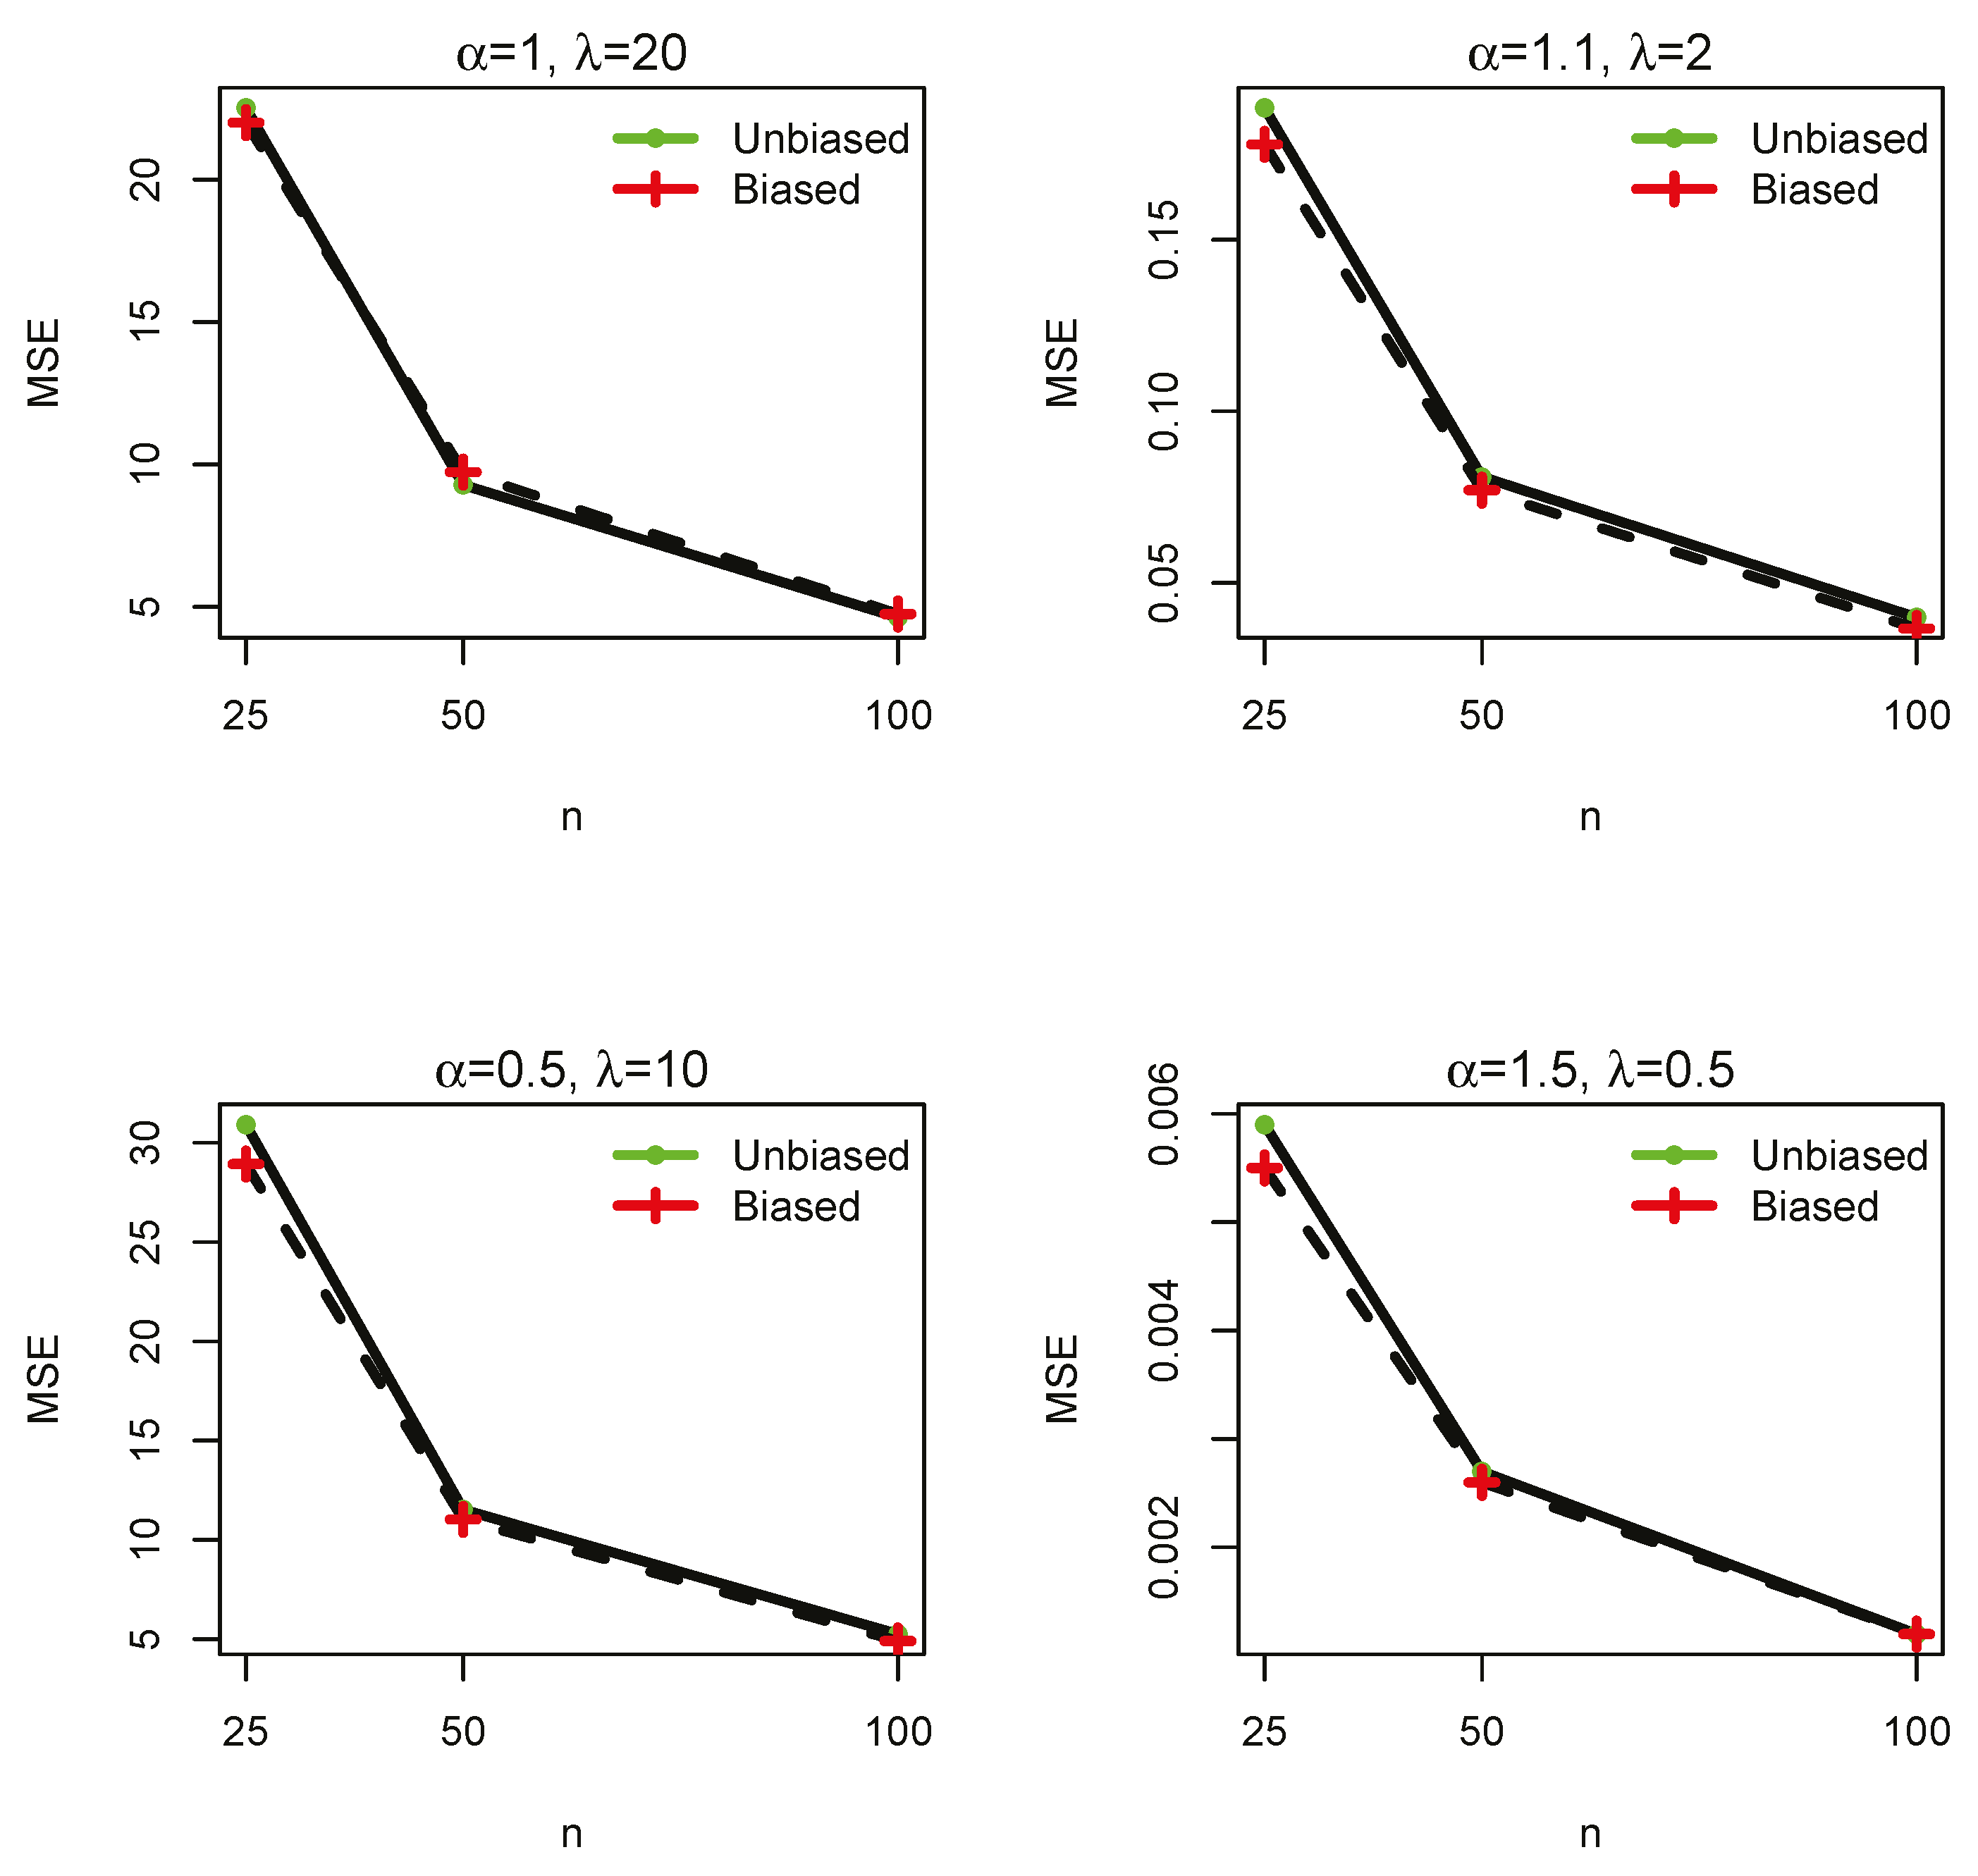
The efficiency and consistency of MLE and MMLE are compared using a simulation study. Three sample sizes, n = 25, 50, 100, and different parameter values are considered. In each run, r = 5000 replicates of samples are simulated with the selected sample size and parameter values. We use the uniroot function built into R to compute the parameter estimates. Table 1 shows the simulation results. For α , MSE shows smaller values for MMLE than for MLE, especially when the sample size is small, suggesting that MMLE improves the estimate of α .
On the other hand, MLE for λ yields smaller MSE values than MMLE for the most frequently selected parameter values. Figure 1 shows the MSE for biased and unbiased estimators of α for different sample sizes and parameter values. It shows a significant improvement of the unbiased estimator, especially for small sample sizes. Figure 1 also shows the MSE for λ . Both figures show how the MSE of MLE and MMLE decrease with sample size.
Applying the bias and MSE in Table 1, the variance of the estimators is computed and gathered in Table 2. However, we expect that reducing the bias may increase the variance, it is observed that the variance of the MMLE of α is smaller than the variance of MLE. But, for λ , the reverse is true.

4. Applications

In this section, three real-world data sets are analyzed. MLE and MMLE are compared using some well-known statistics, including the Akaike Information Criterion (AIC), the Bayesian Information Criterion (BIC), Kolmogorov–Smirnov (KS), Cramer–Von Mises (CVM), and Anderson Darling (AD).

4.1. Repair Times of an Airborne Communication Transceiver

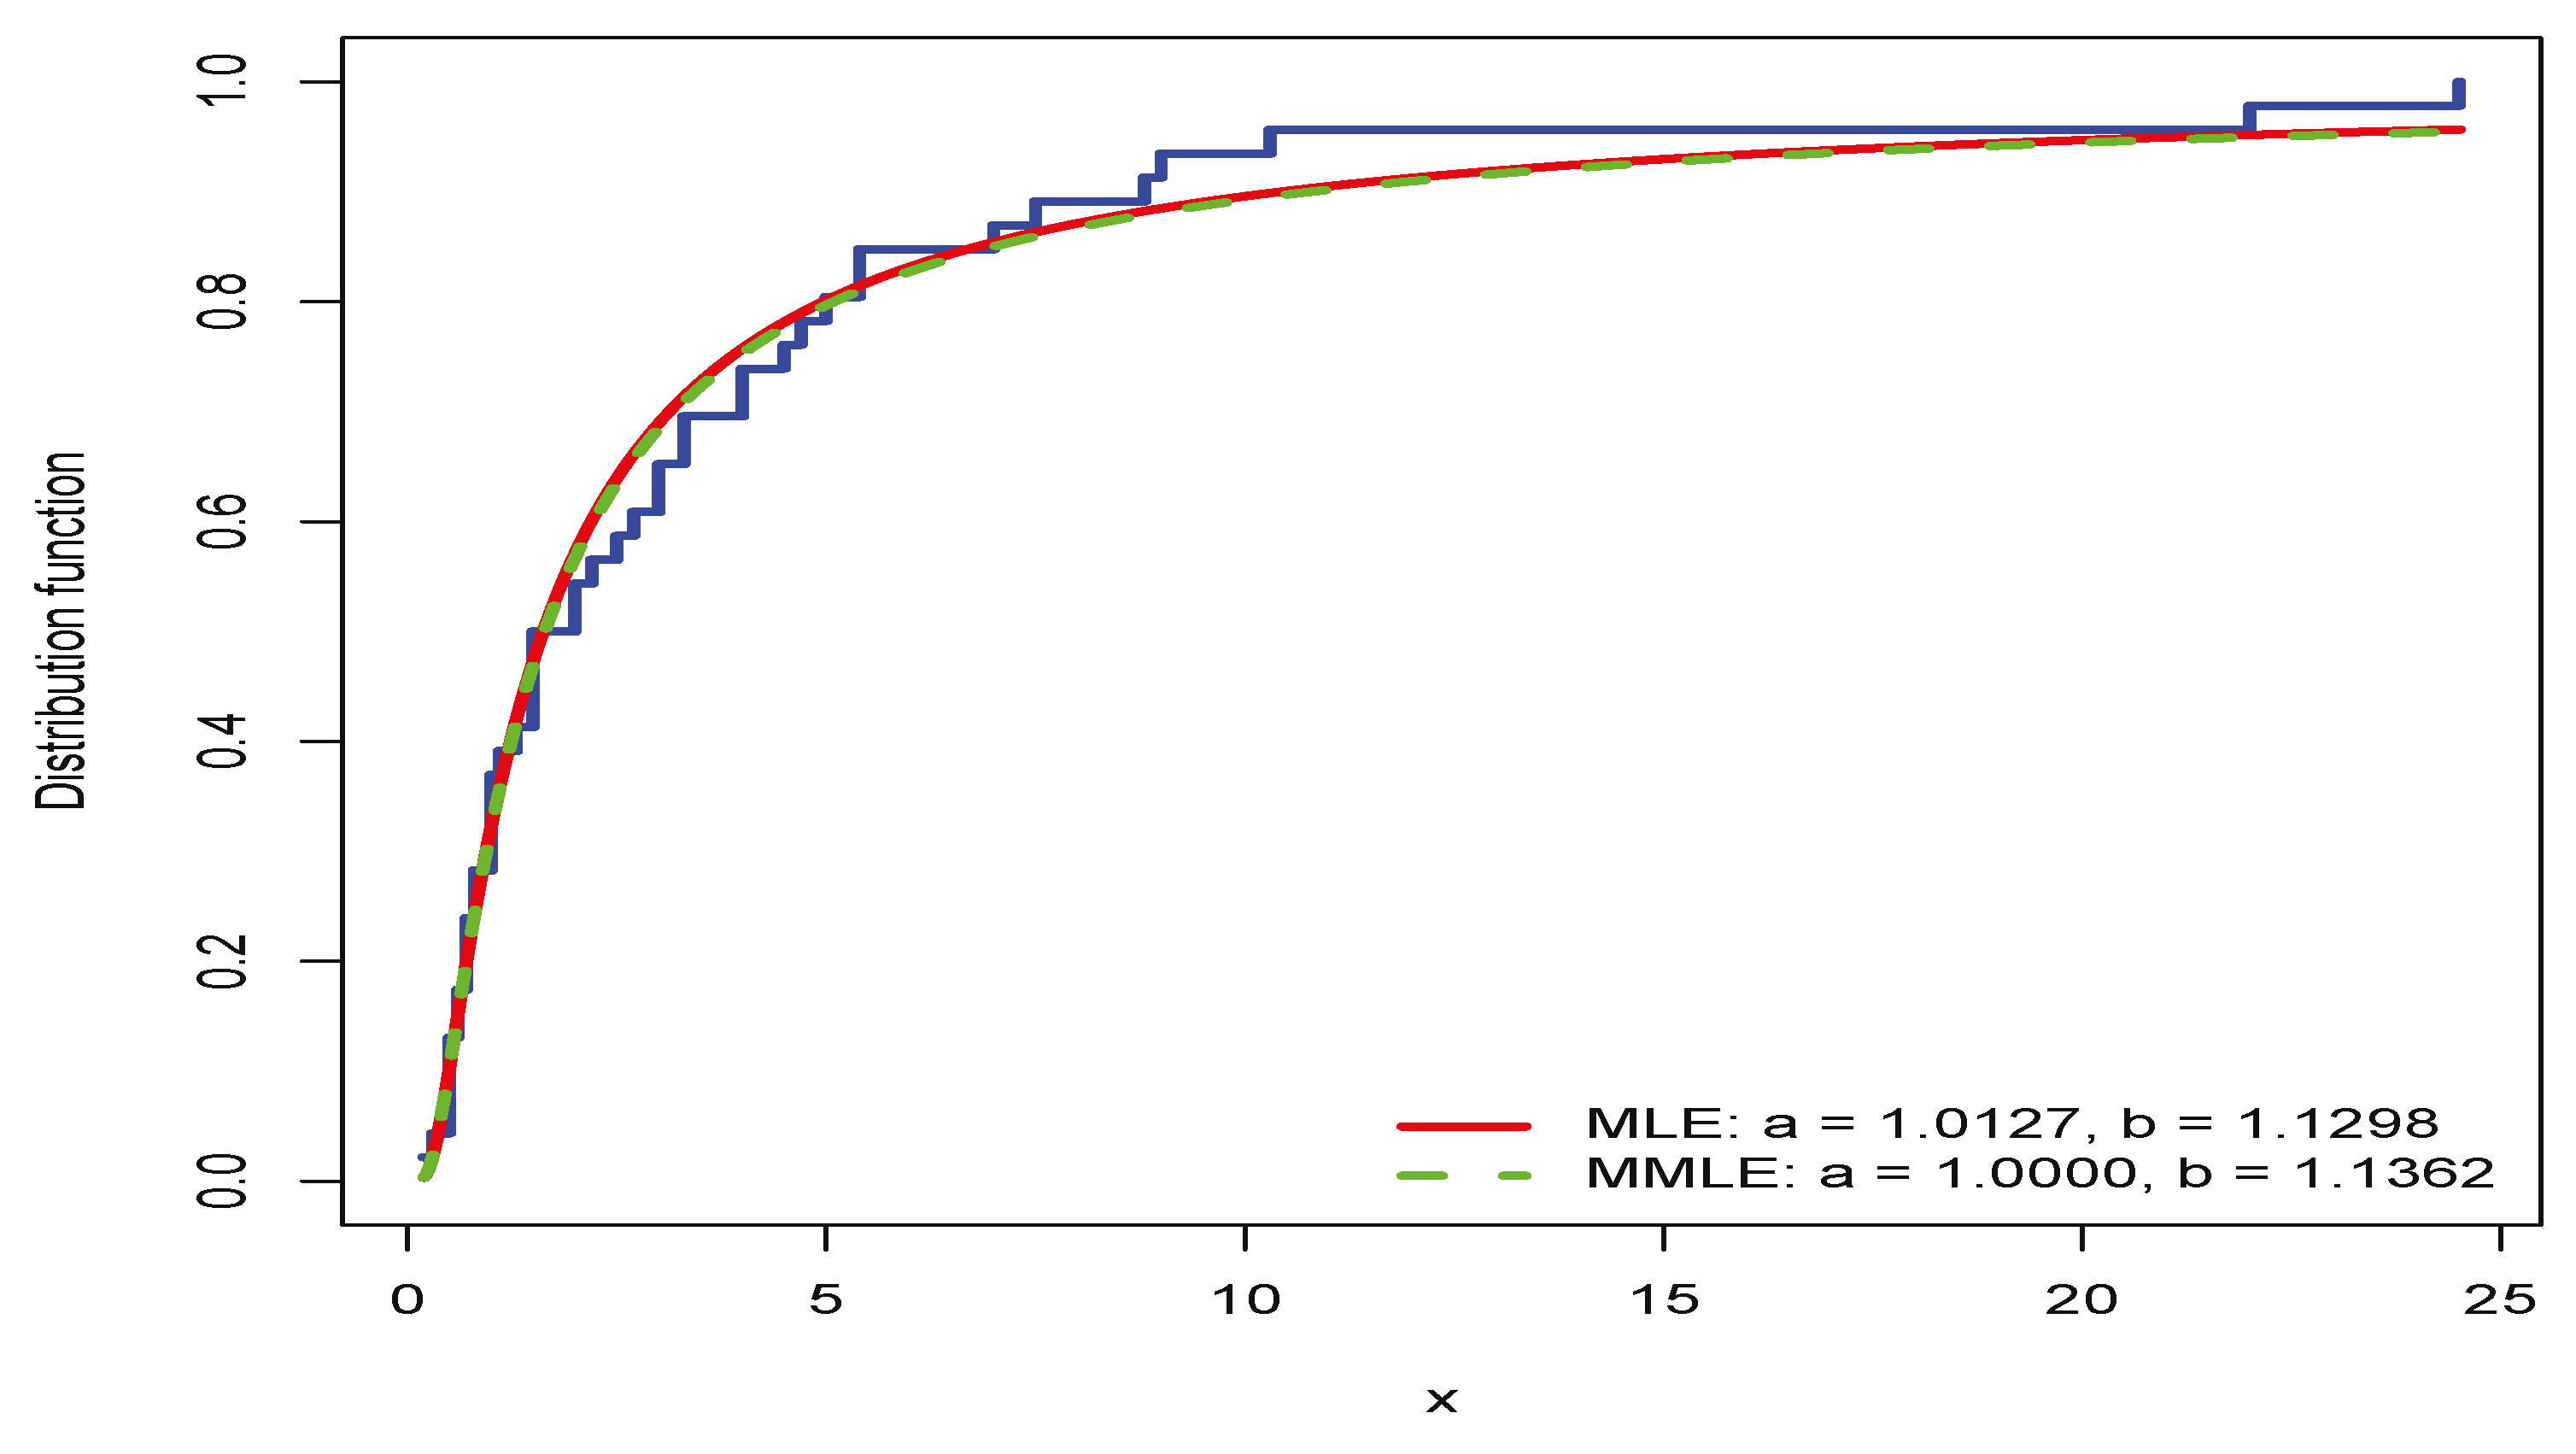
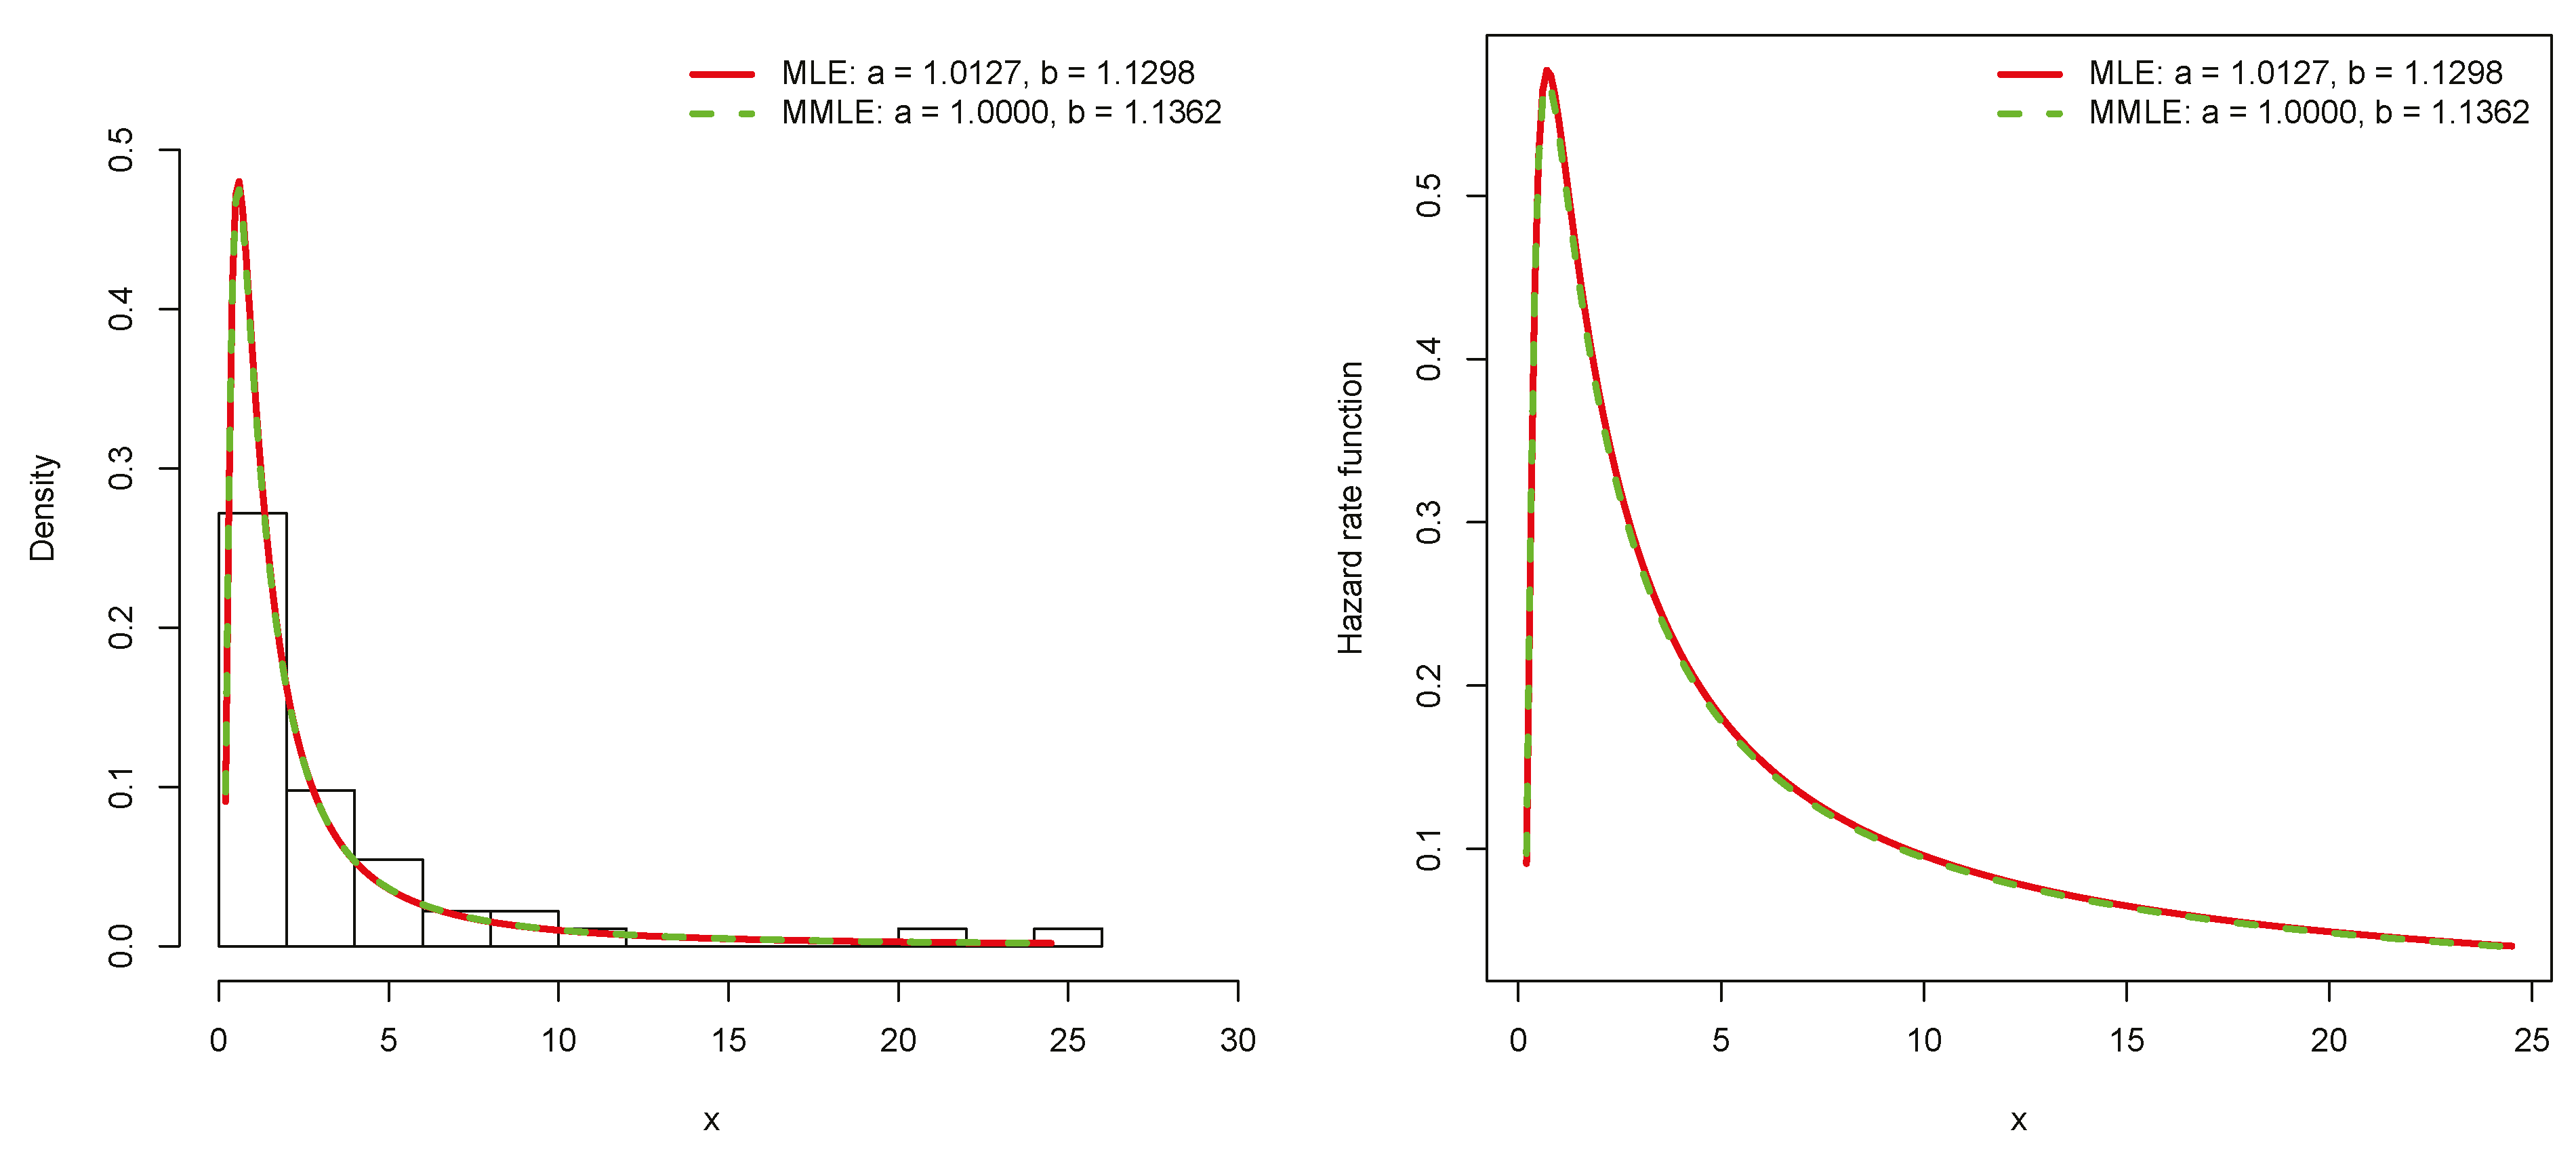
Table 3 contains 46 observations of repair times in hours for an airborne communication transceiver. This data set has been studied by Alven [22] and Meat et al. [23]. Here we fit the IW model to the data and estimate the parameters of the IW model by MLE and MMLE. The AIC, BIC, KS, CVM, and AD statistics were calculated. The results are summarized in Table 4 and show that the MMLE outperforms the MLE based on the KS, CVM, and AD statistics. Also, Table 4 shows the results of fitting the data to the Weibull, gamma and Pareto models. The AIC, BIC, KS, CVM and AD all show that the IW provides a better fit than these alternative models. Figure 2 shows the empirical and estimated model function, which graphically shows a good fit and confirms the small values of the KS, CVM, and AD statistics for both estimators. Figure 3 shows the empirical and estimated CDF for the repair times data and Figure 4 shows the histogram of the repair times data along with estimated PDF and the estimated HR function, which shows an upside down form.
Moreover, three alternative models are fitted to the data and the MLE of the parameters are computed and estimated.

4.2. Maximum Flood Levels of the Susquehenna River

Table 5 shows the maximum flood levels in millions of cubic feet per second of the Susquehanna River at Harrisburg, Pennsylvania, over 20 years from 1890 to 1969. Maswadah [24] and Jana and Bera [20] analyzed this data set using the IW model. Here we compare the MLE and MMLE to estimate the IW parameters.
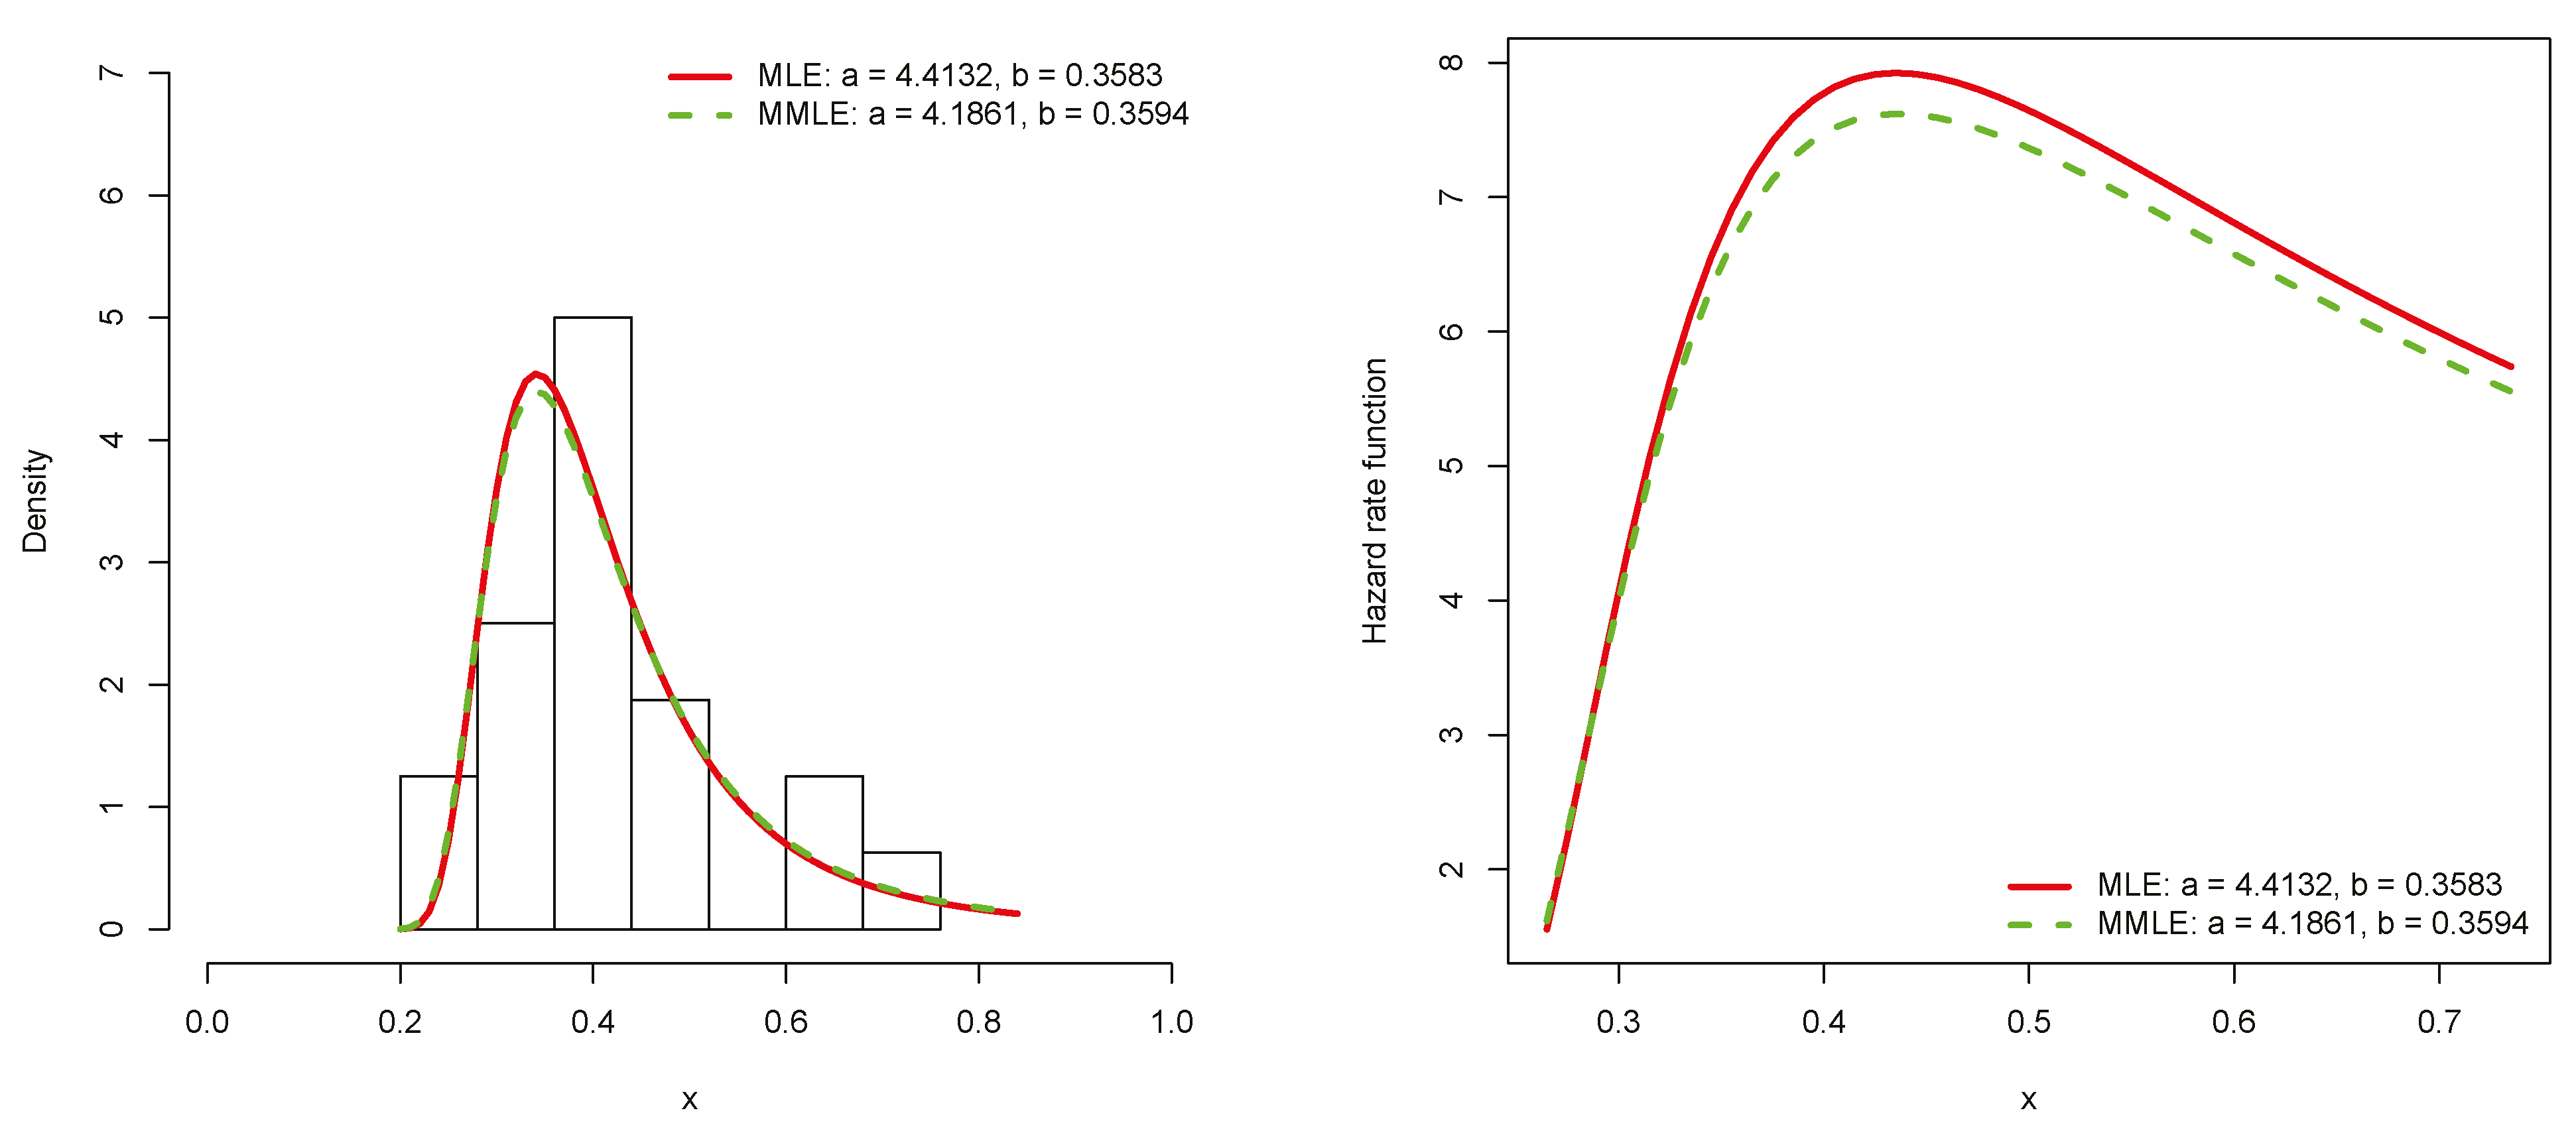
The results of the analysis are summarized in Table 6. Based on the results, the KS, CVM, and AD statistics show that the empirical model is closer to the MMLE estimate of CDF. The results of fitting the data to three alternative models are included in the table too and indicate a better fit for IW. The empirical and estimated CDF, histogram, and HR functions are shown in Figure 5 and Figure 6.

4.3. Duration of Remission Achieved by a Drug

Table 7 reports the duration of remission achieved with a drug used to treat 20 leukemia patients. See Wu and Wu [25] and Jana and Bera [20] for more details. Here we investigate whether the considered data set can be fitted to the IW model. We also compare MLE and MMLE for estimating the parameters.
The results in Table 8 show that MMLE is a better fit based on the KS, CVM, and AD statistics. Moreover, the results show that the IW describes the data better than Weibull, gamma and Pareto models.
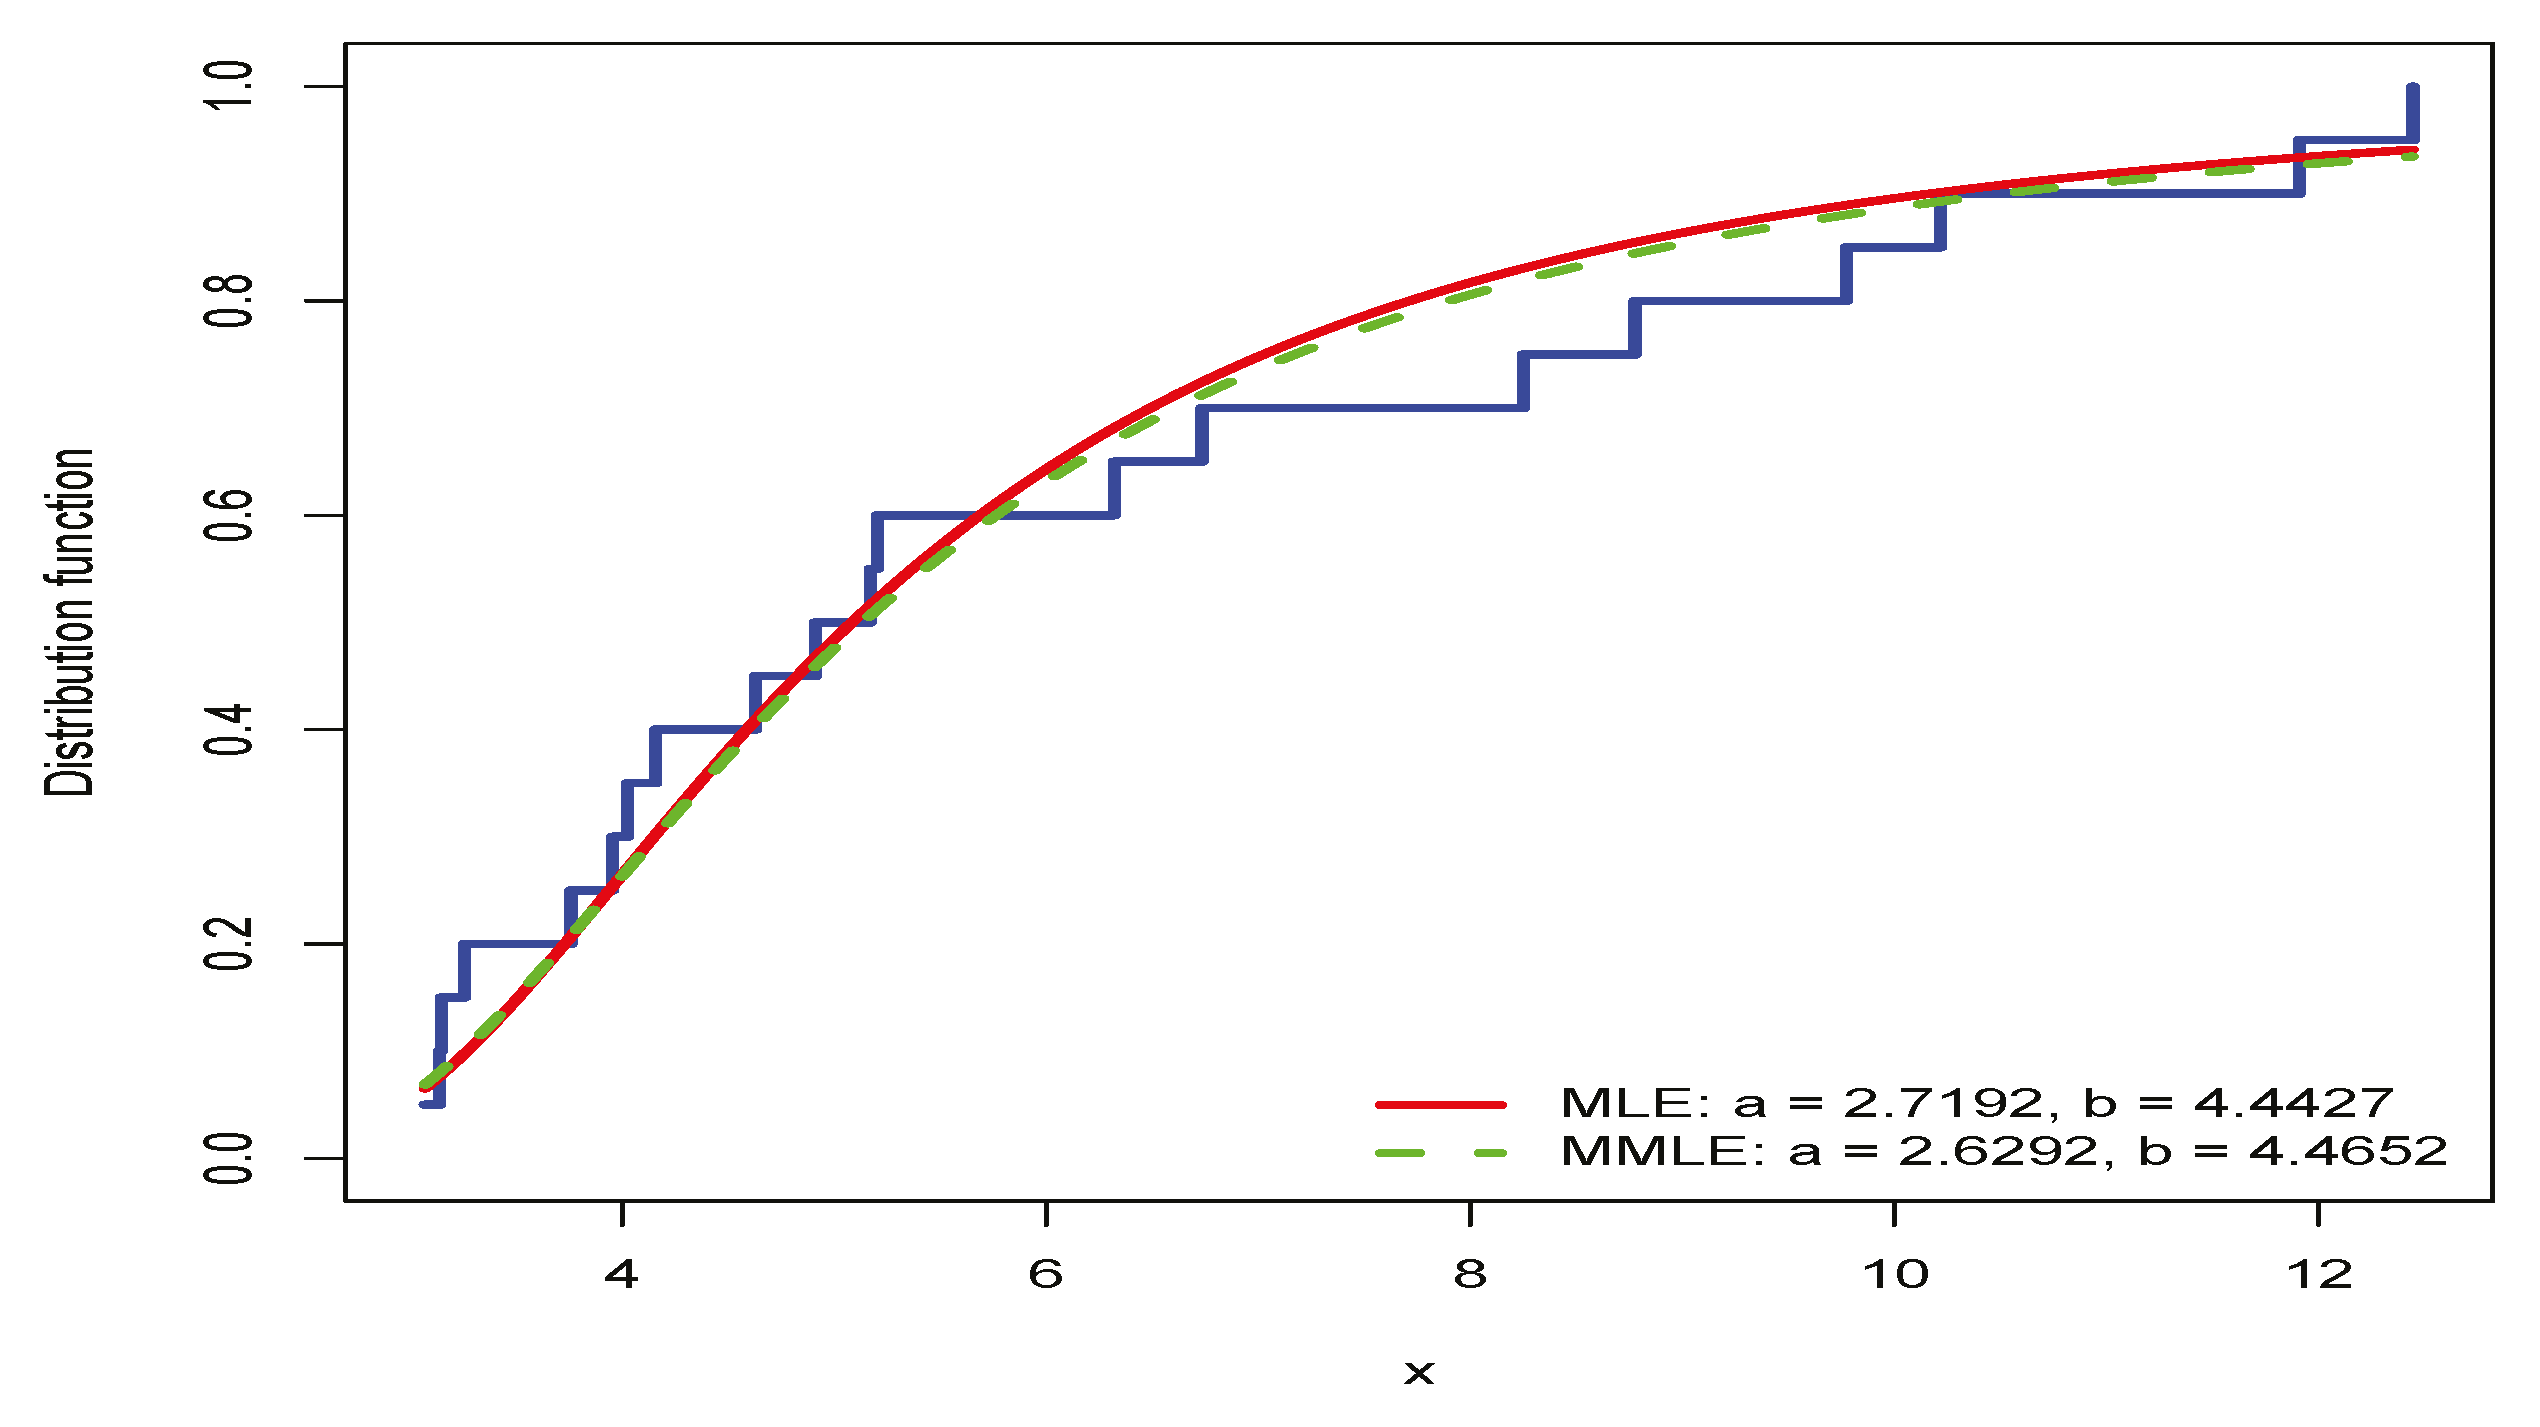
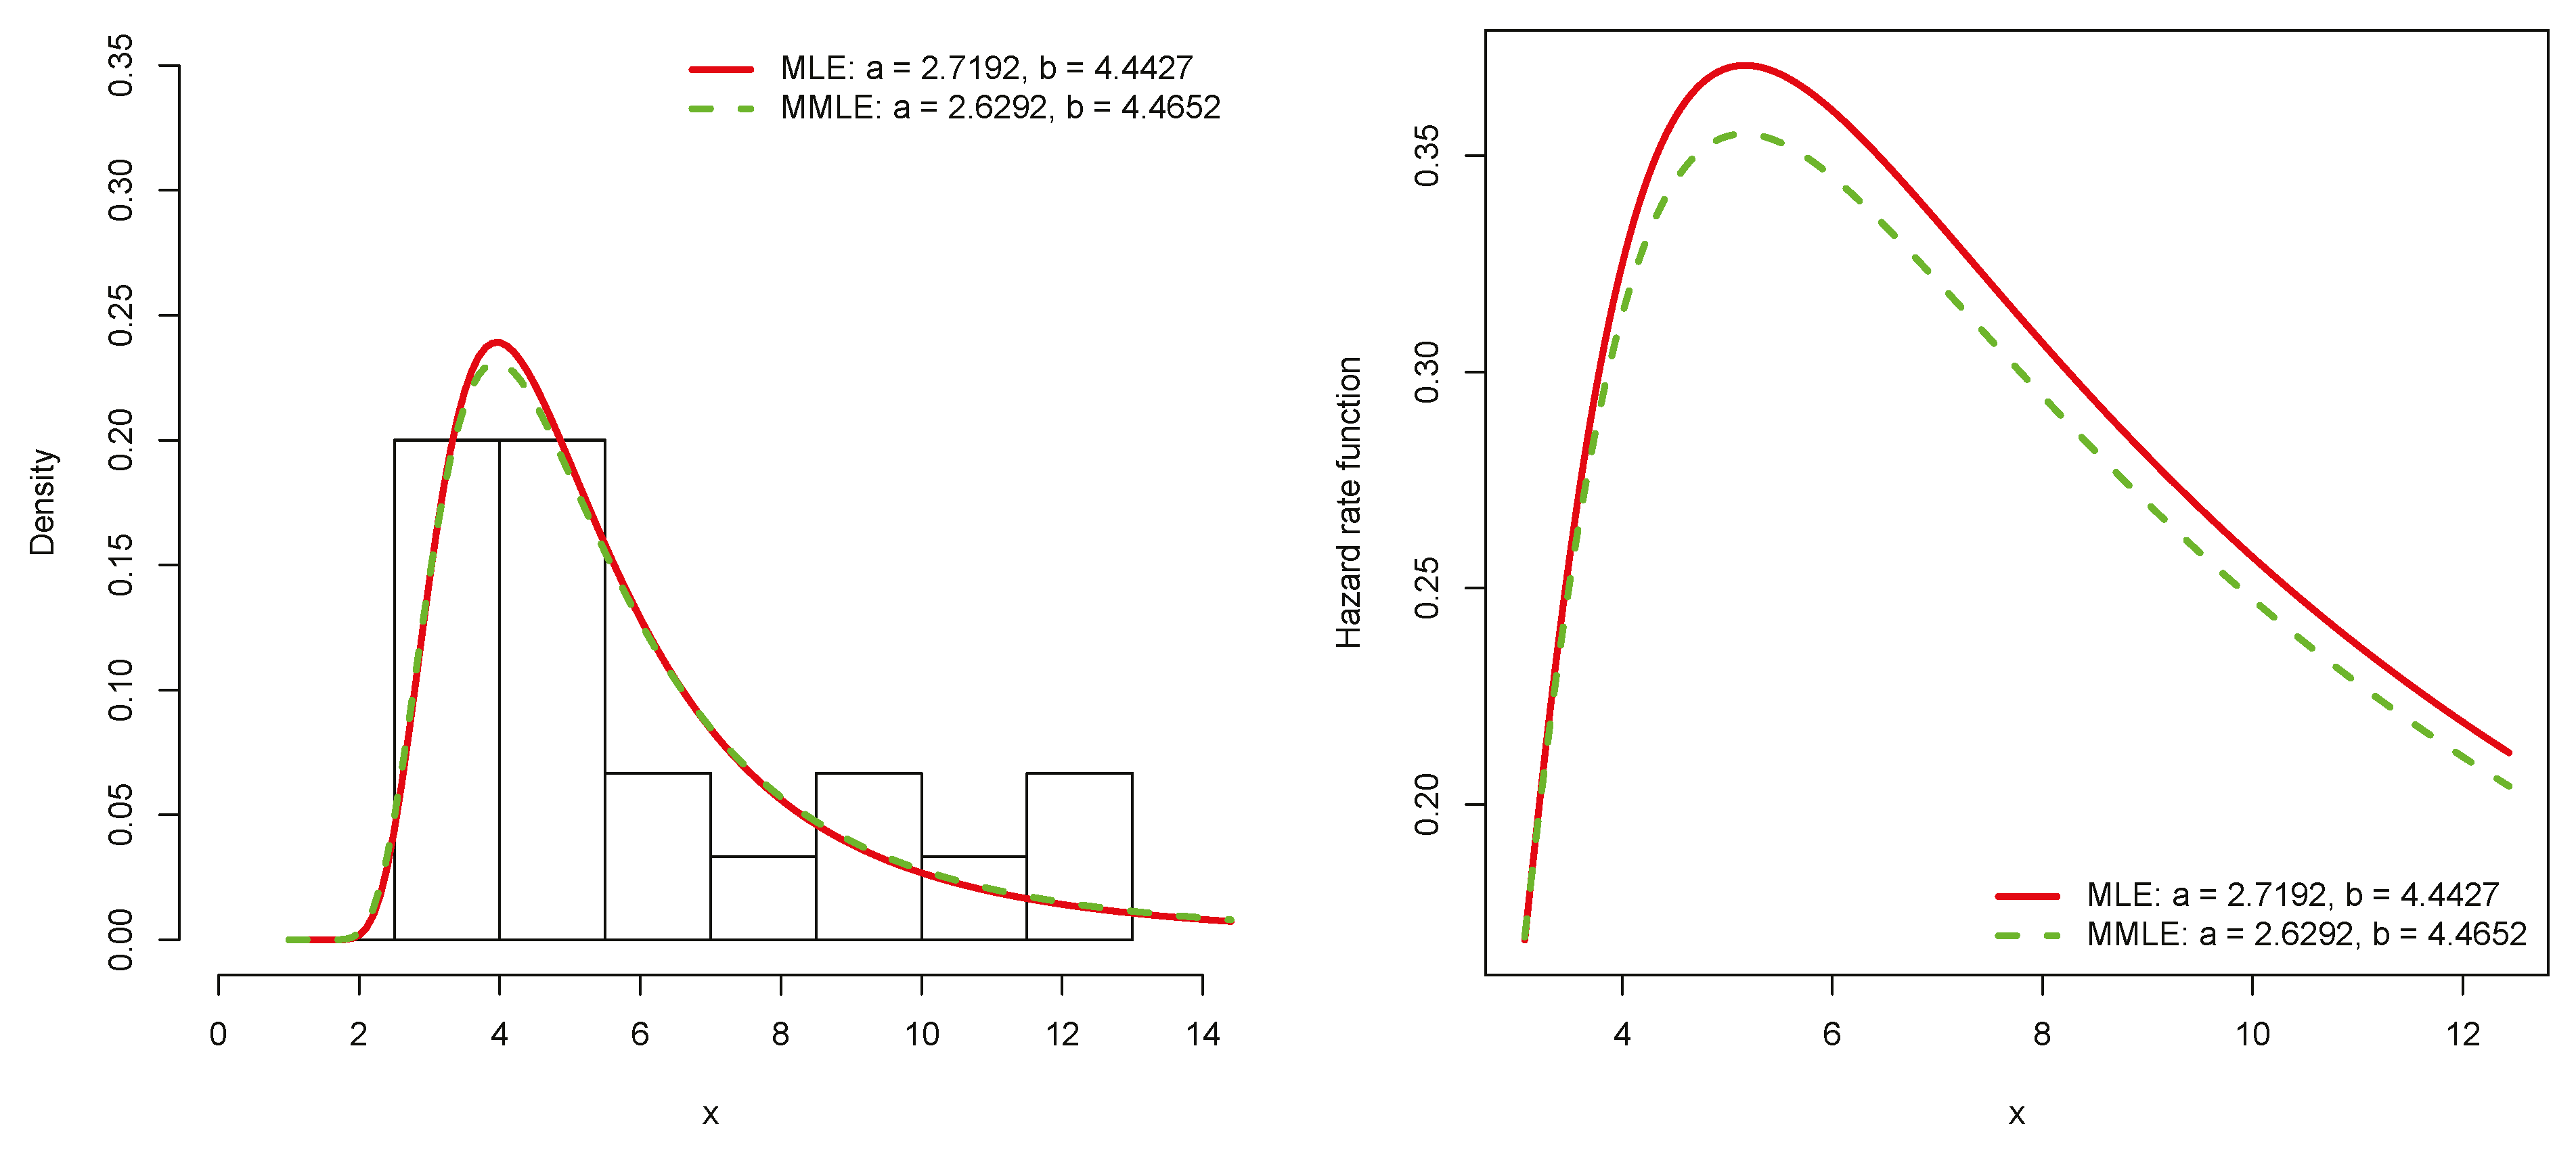
The empirical and estimated CDF, histogram, and HR functions are shown in Figure 7 and Figure 8.

5. Conclusions

The IW model is a simple but sufficiently flexible model for analyzing data from several scientific fields, such as degradation of mechanical components, cancer events, and events related to floods and earthquakes. In addition, several real-world data sets have demonstrated the applicability of the IW model. However, the main problem in this investigation was the estimation of the model parameters. In this study, a modified version of MLE is presented. The idea behind it is that the likelihood equation for the shape parameters of the model is biased; therefore, an unbiased version was defined. Some results of the modified estimator are presented here. The MLE and the modified estimator are compared using a simulation study. The simulation study confirmed that the modified estimator is better than the MLE with respect to the MSE. Finally, the IW was fitted to three real data sets and the MLE and the modified estimator were compared. Recently, the maximum distance product and Bayesian function methods based on distance products have become very popular among researchers in the field of lifetime analysis. In some cases, the distance function product has been shown to have an advantage over the likelihood function in both classical and Bayesian methods. Therefore, we propose to study the estimation problems of the IW distribution using the maximum distance product to estimate unknown parameters and the associated reliability and hazard rate functions. A Bayesian method based on the likelihood and the product of the distance functions was also proposed. For the Bayesian methods, we can use the Lindley approximation and the Markov chain Monte Carlo technique, and find the approximate confidence interval of the maximum likelihood and the maximum distance product, and the highest posterior density of the Bayesian method based on the likelihood and the distance product. In addition, more complex models such as high-dimensional survival data with measurement errors are important in reliability engineering. All these and other topics remain open for future research related to this study.

Author Contributions

Conceptualization, M.K. and M.A.A.; methodology, M.K.; software, M.A.A.; validation, M.K. and M.A.A.; formal analysis, M.K.; investigation, M.A.A.; resources, M.K.; data curation, M.A.A.; writing-original draft preparation, M.K.; writing-review and editing, M.A.A.; visualization, M.A.A.; supervision, M.K.; project administration, M.K.; funding acquisition, M.K. All authors have read and agreed to the published version of the manuscript.

Funding

This research was funded by Researchers Supporting Project number (RSP2023R392), King Saud University, Riyadh, Saudi Arabia.

Data Availability Statement

Data used to support the findings of this study are included in the article.

Acknowledgments

The authors thank the three anonymous reviewers for their suggestions and constructive comments that improved the presentation and readability of the article. This work was supported by Researchers Supporting Project number RSP2023R392, King Saud University, Riyadh, Saudi Arabia.

Conflicts of Interest

There are no conflicts of interest.

Appendix A

Here, the expectations of Equations (10)–(12) are verified. For simplicity, let Y = X i α , where X i follows the IW model. Then, the PDF of Y is
f y = λ α y 2 e λ α y 1 ,   y > 0 .
Now,
E X i α = E Y 1   = 0 λ α y 3 e λ α y 1 d y   = 0 λ α t e λ α t d t = λ α ,  
which shows (10). To verify (11), we can write
E l n X i α = E ln Y 1   = 0 ln y 1 λ α y 2 e λ α y 1 d y   = 0 ln t e t d t ln λ α 0 e t d t     = ψ 1 l n λ α ,
which confirms (11). Note that the third equation applies the transformation t = λ α y 1 and 0 ln t e t d t =   ψ ( 1 ) shows the digamma function. Similarly, to verify (12), we have
E X i α l n X i α = E Y 1 ln Y 1 = 0 ln y 1 λ α y 3 e λ α y 1 d y   = 0 ln t λ α λ α ( t λ α ) 3 e t λ α t 2 d t   = λ α 0 t ln t e t d t ln λ α 0 t e t d t     = λ α ( ψ ( 1 ) + 1 l n λ α ) ,
which confirms (12). The third equation obtains by the transformation t = λ α y 1 . Note that 0 t ln t e t d t =   ψ 2 = 1 + ψ 1 by the digamma function properties.

References

  1. Jiang, R.; Ji, P.; Xiao, X. Aging property of unimodal failure rate models. Reliab. Eng. Syst. Saf. 2003, 79, 113–116. [Google Scholar] [CrossRef]
  2. Keller, A.Z.; Giblin, M.T.; Farnworth, N.R. Reliability analysis of commercial vehicle engines. Reliab. Eng. 1985, 10, 15–25. [Google Scholar] [CrossRef]
  3. Akgul, F.G.; Senoglu, B.; Arslan, T. An alternative distribution to Weibull for modeling the wind speed data: InverseWeibull distribution. Energy Convers. Manag. 2016, 114, 234–240. [Google Scholar] [CrossRef]
  4. Calabria, R.; Pulcini, G. Bayes 2-sample prediction for the inverse weibull distribution. Commun. Stat. Theory Methods 1994, 23, 1811–1824. [Google Scholar] [CrossRef]
  5. Jiang, R.; Murthy, D.N.P.; Ji, P. Models involving two inverse Weibull distributions. Reliab. Eng. Syst. Saf. 2001, 73, 73–81. [Google Scholar] [CrossRef]
  6. Mahmoud, M.A.W.; Sultan, K.S.; Amer, S.M. Order statistics from inverse weibull distribution and associated inference. Comput. Stat. Data Anal. 2003, 42, 149–163. [Google Scholar] [CrossRef]
  7. Sultan, K.S.; Ismail, M.A.; Al-Moisheer, A.S. Mixture of two inverse Weibull distributions: Properties and estimation. Comput. Stat. Data Anal. 2007, 51, 5377–5387. [Google Scholar] [CrossRef]
  8. Balakrishnan, N.; Kateri, M. On the maximum likelihood estimation of Weibull distribution based on complete and censored data. Stat. Probab. Lett. 2008, 78, 2971–2975. [Google Scholar] [CrossRef]
  9. Kundu, D.; Howlader, H. Bayesian inference and prediction of the inverse Weibull distribution for Type-II censored data. Comput. Stat. Data Anal. 2010, 54, 1547–1558. [Google Scholar] [CrossRef]
  10. de Gusmão, F.R.S.; Ortega, E.M.M.; Cordeiro, G.M. The generalized inverse Weibull distribution. Stat. Pap. 2011, 52, 591–619. [Google Scholar] [CrossRef]
  11. Sultan, K.S.; Alsadat, N.H.; Kundu, D. Bayesian and maximum likelihood estimations of the inverse Weibull parameters under progressive type-II censoring. J. Stat. Comp. Simul. 2014, 84, 2248–2265. [Google Scholar] [CrossRef]
  12. Kim, D.H.; Lee, W.D.; Kang, S.G. Non-informative priors for the inverse Weibull distribution. J. Stat. Comp. Simul. 2014, 84, 1039–1054. [Google Scholar] [CrossRef]
  13. Loganathan, A.; Uma, M. Comparison of estimation methods for inverse Weibull parameters. Glob. Stoch. Anal. 2017, 4, 83–93. [Google Scholar]
  14. Ramos, P.L.; Nascimento, D.; Louzada, F. The long term fréchet distribution: Estimation, properties and its application. Biom. Biostat. Int. J. 2017, 6, 357–362. [Google Scholar] [CrossRef]
  15. Singh, S.; Tripathi, Y.M. Estimating the parameters of an inverse Weibull distribution under progressive type-I interval censoring. Stat. Pap. 2018, 59, 21–56. [Google Scholar] [CrossRef]
  16. Ramos, P.L.; Louzada, F.; Ramos, E.; Dey, S. The Fréchet distribution: Estimation and application—An overview. J. Stat. Manag. Syst. 2020, 23, 549–578. [Google Scholar] [CrossRef]
  17. Alkarni, S.; Afify, A.Z.; Elbatal, I.; Elgarhy, M. The Extended Inverse Weibull Distribution: Properties and Applications. Complexity 2020, 2020, 3297693. [Google Scholar] [CrossRef]
  18. Kazemi, M.; Azizpoor, M. Estimation of the inverse Weibull distribution parameters under Type-I hybrid censoring. Aust. J. Stat. 2021, 50, 38–51. [Google Scholar] [CrossRef]
  19. Nassar, M.; Abo-Kasem, O.E. Estimation of the inverse Weibull parameters under adaptive type-II progressive hybrid censoring scheme. J. Comp. App. Math. 2017, 315, 228–239. [Google Scholar] [CrossRef]
  20. Jana, N.; Bera, S. Estimation of parameters of inverse Weibull distribution and application to multi-component stress-strength model. J. App. Stat. 2022, 49, 169–194. [Google Scholar] [CrossRef] [PubMed]
  21. Jokiel-Rokita, A.; Piatek, S. Estimation of parameters and quantiles of the Weibull distribution. Stat. Papers 2022. [Google Scholar] [CrossRef]
  22. Alven, W.H. Reliability Engineering by ARINC; Prentice-Hall: Upper Saddle River, NJ, USA, 1964. [Google Scholar]
  23. Mead, M.; Nassar, M.M.; Dey, S. A Generalization of Generalized Gamma Distributions. Pak. J. Stat. Oper. Res. 2018, 14, 121–138. [Google Scholar] [CrossRef]
  24. Maswadah, M. Conditional confidence interval estimation for the inverse Weibull distribution based on censored generalized order statistics. J. Stat. Comput. Simul. 2003, 73, 887–898. [Google Scholar] [CrossRef]
  25. Wu, S.F.; Wu, C.C. Two stage multiple comparisons with the average for exponential location parameters under heteroscedasticity. J. Statist. Plan Inf. 2005, 134, 392–408. [Google Scholar] [CrossRef]
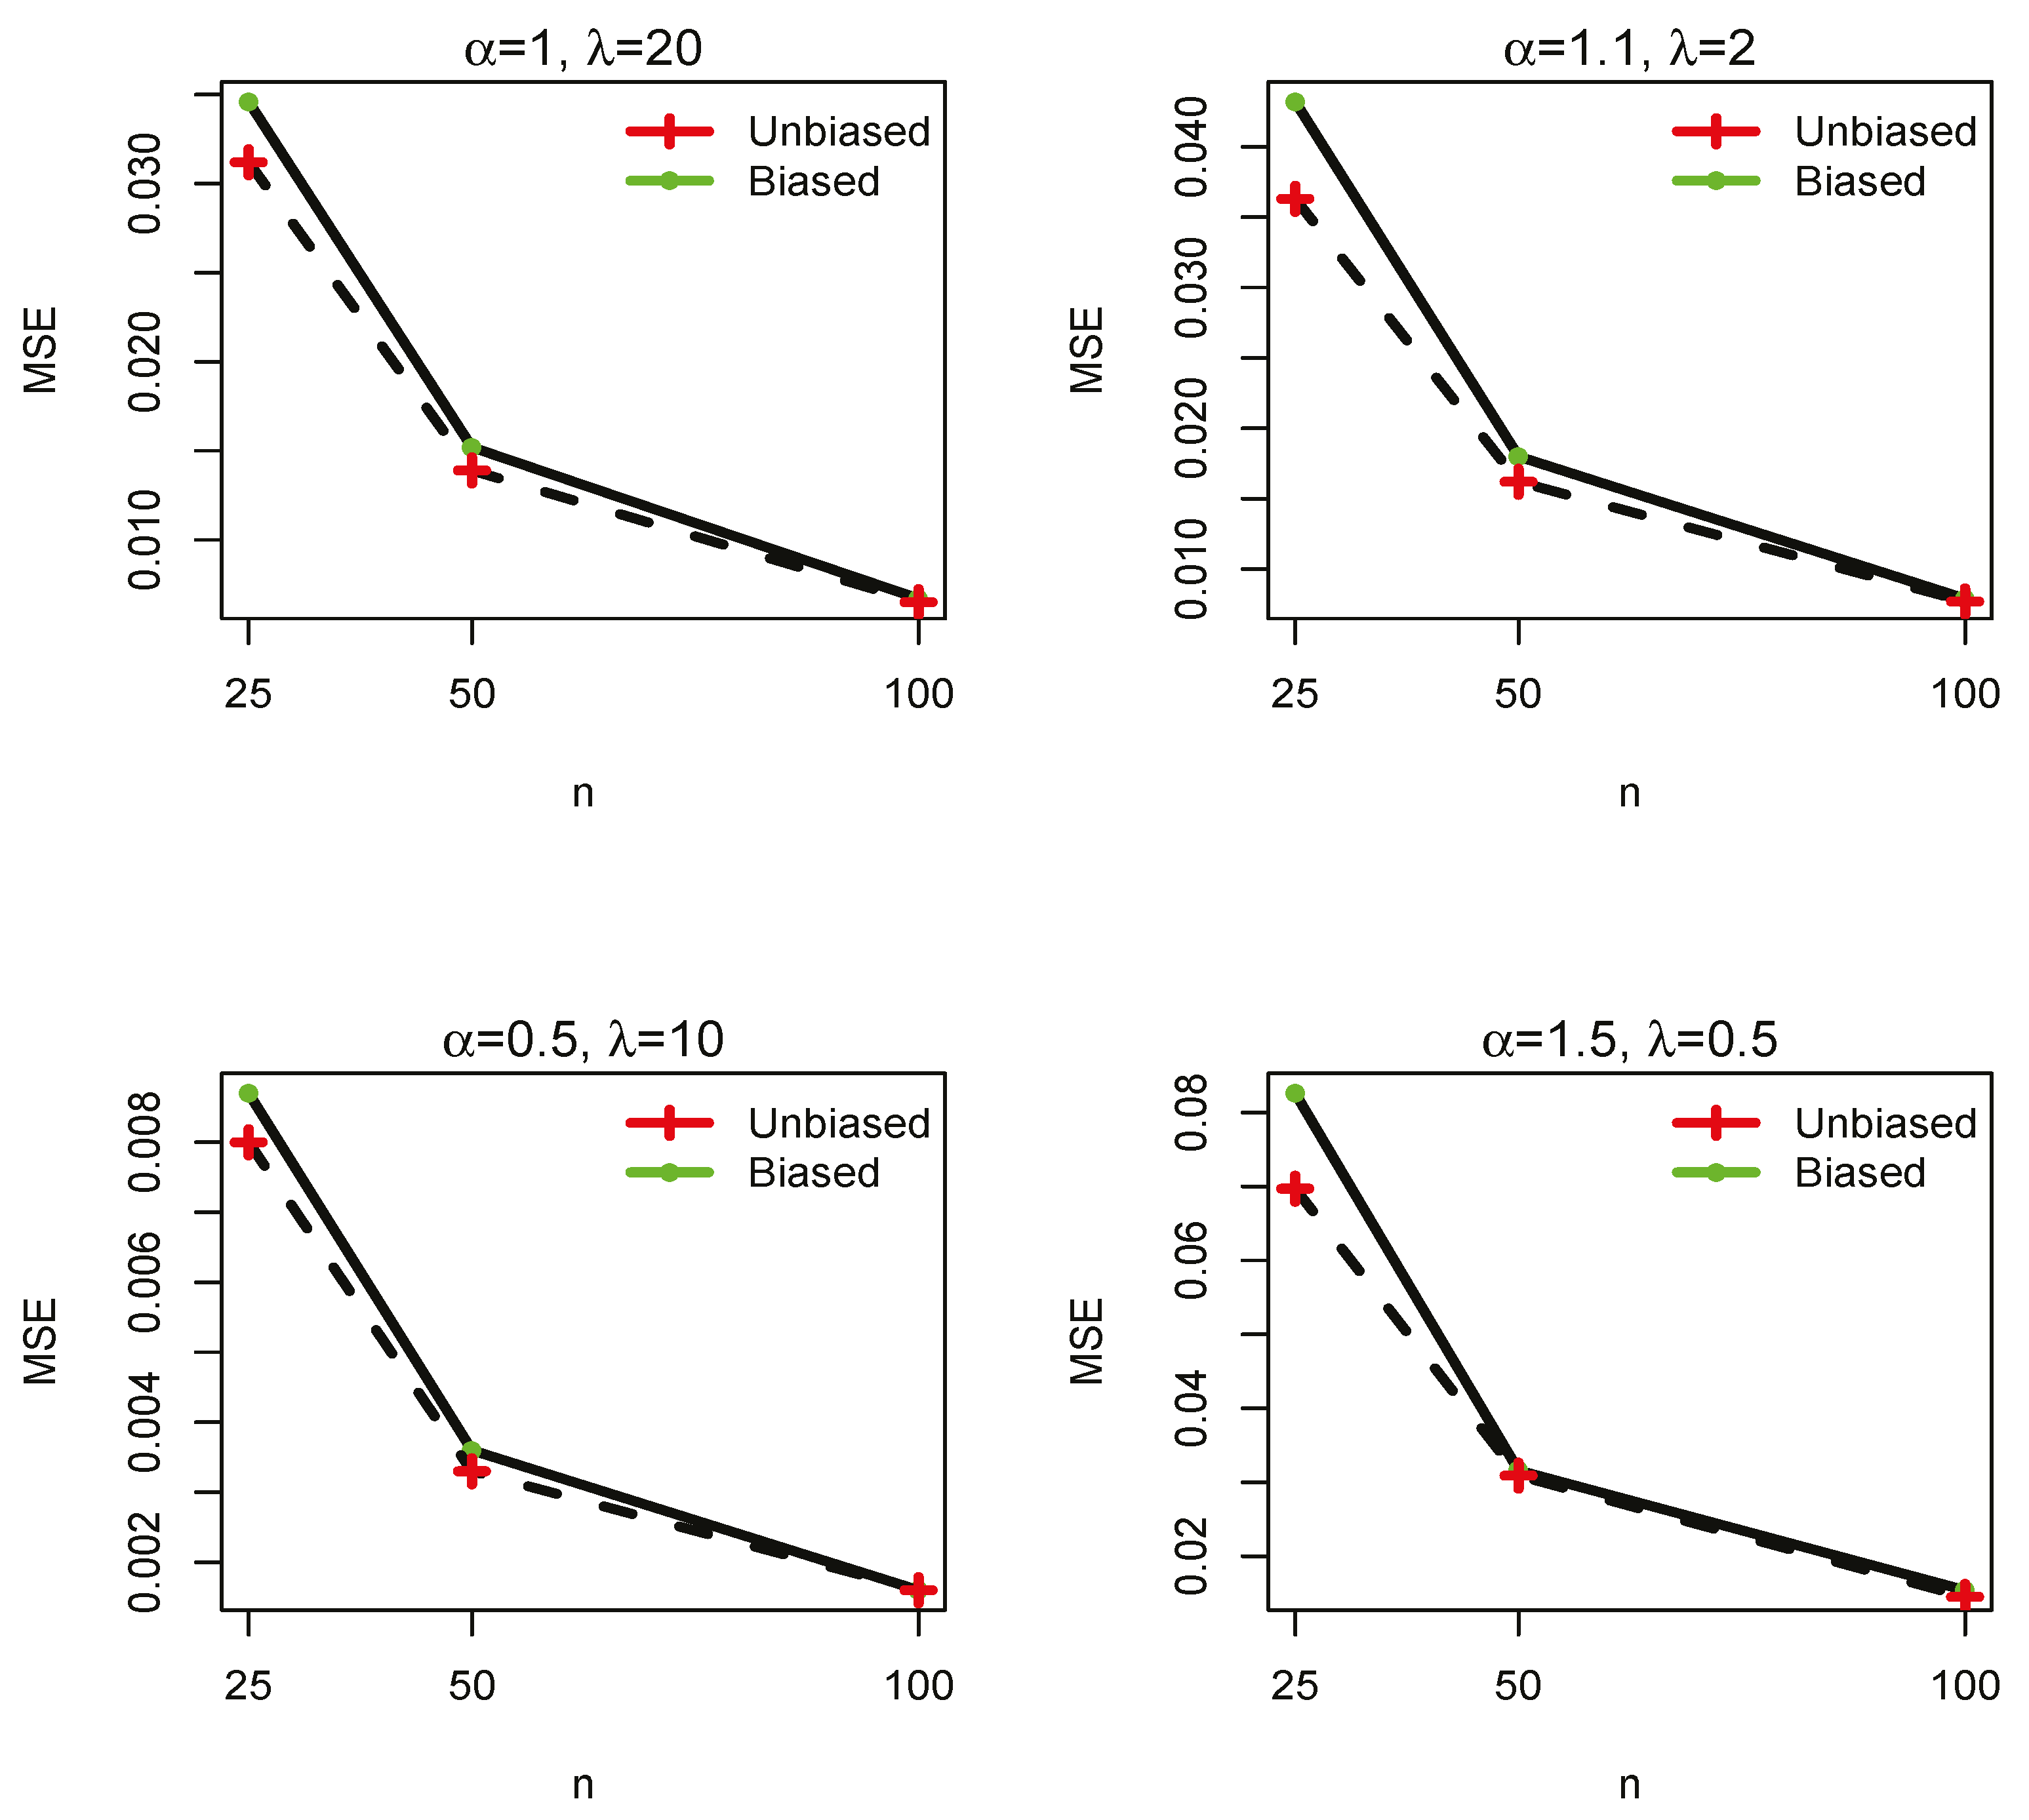
Figure 1. Comparison of MSE for biased and unbiased estimators of α for different sample sizes and parameter values.
Axioms 12 00961 g001
Figure 2. Comparison of MSE for biased and unbiased estimators of λ for different sample sizes and parameter values.
Axioms 12 00961 g002
Figure 3. The empirical and estimated CDF for the repair times data.
Axioms 12 00961 g003
Figure 4. (Left) The histogram of the repair times data along with estimated PDF. (Right) The estimated HR function, which shows an upside down form.
Axioms 12 00961 g004
Figure 5. The empirical and estimated CDF for the maximum flood levels data.
Axioms 12 00961 g005
Figure 6. (Left) The histogram of the maximum flood levels data and the estimated PDF. (Right) The estimated HR function for this data set.
Axioms 12 00961 g006
Figure 7. The empirical and estimated CDF for the duration of remission data.
Axioms 12 00961 g007
Figure 8. (Left) The histogram of the duration of remission data and the estimated PDF. (Right) The estimated HR function for this data set.
Axioms 12 00961 g008
Table 1. The bias and MSE of MMLE and MLE.
n
Method 2550100
α , λ BMSEBMSEBMSE
MLE1, 200.06010.03460.02940.01520.01460.0067
0.840521.99610.36779.73250.18334.7483
1.1, 20.06840.04320.03130.01800.01530.0079
0.06930.17780.03210.07700.01580.0367
0.5, 100.03000.00870.01410.00360.00670.0016
1.268428.92620.624411.02620.27094.9036
1.5, 0.50.09280.08260.03730.03160.02170.0154
0.01060.00550.00520.00260.00210.0012
MMLE1, 200.03070.03120.01570.01390.00730.0065
0.875922.51140.40949.27990.27264.6273
1.1, 20.03500.03630.01610.1620.00880.0077
0.08940.18840.04400.08090.01860.0399
0.5, 100.01810.00800.00650.00330.00410.0016
1.449330.91240.750411.51840.34125.2525
1.5, 0.50.04970.06970.02490.03090.01220.0145
0.01370.00590.00850.00270.00350.0012
Table 2. The variance of MMLE and MLE. In each cell, the first and the second numbers show the variance of α and λ , respectively.
n
Method 2550100
α, λVarVarVar
MLE1, 200.0309, 21.28960.0143, 9.59720.0064, 4.7147
1.1, 20.0385, 0.17290.0170, 0.07590.0076, 0.0364
0.5, 100.0078, 27.31730.0034, 10.63630.0015, 4.8302
1.5, 0.50.0739, 0.00530.0302, 0.00250.0149, 0.0011
MMLE1, 200.0302, 21.74420.0136, 9.11220.0064, 4.5529
1.1, 20.0350, 0.18040.1617, 0.07890.0076, 0.0395
0.5, 100.0076, 28.81190.0032, 10.95530.0015, 5.1360
1.5, 0.50.0672, 0.00570.0302, 0.00260.0143, 0.0011
Table 3. Repair times (hour) for an airborne communication transceiver.
0.20.30.50.50.50.50.60.60.70.7
0.70.80.81.01.01.01.01.11.31.5
0.51.51.52.02.02.22.52.73.03.0
0.33.34.04.04.54.75.05.45.47.0
0.58.89.010.322.024.5
Table 4. Results of estimating IW and some alternative models parameters by MLE and MMLE for repair times data.
ModelMethod α ^ λ ^ AICBICKS
p-Value
CVM
p-Value
AD
p-Value
IWMLE1.01271.1298205.38209.040.0807
0.9256
0.0510
0.8726
0.3570
0.8895
IWMMLE1.00001.1362205.39209.050.0760
0.9530
0.0470
0.8962
0.3461
0.8994
WeibullMLE0.89860.3337212.93216.590.1204
0.5170
0.1203
0.4956
0.8874
0.4214
GammaMLE0.93240.2585213.86217.510.14545
0.2848
0.17532
0.3216
1.1042
0.3066
ParetoMLE0.28252.5981209.90213.560.1274
0.4442
0.0710
0.7478
0.6194
0.6289
Table 5. Maximum flood levels of the Susquehenna river (in millions of cubic feet per second).
0.6540.6130.3150.4490.2970.4020.3790.4230.3790.324
0.2690.7400.4180.4120.4940.4160.3380.3920.4840.265
Table 6. Results of estimating IW and some alternative model parameters by MLE and MMLE for maximum flood level data.
ModelMethod α ^ λ ^ AICBICKS
p-Value
CVM
p-Value
AD
p-Value
IWMLE4.41320.3583−28.19−26.200.1560
0.7151
0.0546
0.8532
0.3104
0.9294
IWMMLE4.18610.3594−28.16−26.170.1488
0.7678
0.0520
0.8692
0.2973
0.9395
WeibullMLE3.525914.45−22.53−20.540.1987
0.4081
0.1400
0.4243
0.8215
0.4641
GammaMLE13.4431.77−26.62−24.630.1641
0.6538
0.0712
0.7498
0.4503
0.7958
ParetoMLE 1.48 × 10 7 0.42399.598911.590.4647
0.0003
1.0582
0.0014
5.053
0.0027
Table 7. Duration of remission achieved by a drug.
0.158 4.025 5.170 11.909 4.912 4.629 3.955 6.735 3.140 12.446
0.777 6.321 3.256 8.250 3.759 5.205 3.071 3.147 9.773 10.218
Table 8. Results of estimating IW and some alternative model parameters by MLE and MMLE for duration of remission data.
ModelMethod α ^ λ ^ AICBICKS
p-Value
CVM
p-Value
AD
p-Value
IWMLE2.71924.442795.8997.890.1304
0.8428
0.0555
0.8478
0.4292
0.8176
IWMMLE2.62924.465295.9397.920.1195
0.9058
0.0503
0.8798
0.3884
0.8586
WeibullMLE2.24340.0128101.06103.060.1957
0.3783
0.1291
0.4633
0.7696
0.5017
GammaMLE4.83000.786398.97100.960.1792
0.4868
0.1140
0.5243
0.6937
0.5621
ParetoMLE 4.01 × 10 7 6.1430116.61118.600.3934
0.0026
0.5500
0.0287
2.8692
0.0324
Disclaimer/Publisher’s Note: The statements, opinions and data contained in all publications are solely those of the individual author(s) and contributor(s) and not of MDPI and/or the editor(s). MDPI and/or the editor(s) disclaim responsibility for any injury to people or property resulting from any ideas, methods, instructions or products referred to in the content.