Article

Experimental Study of Void Fraction Measurement Using a Capacitance-Based Sensor and ANN in Two-Phase Annular Regimes for Different Fluids

by
Aryan Veisi
1,
Mohammad Hossein Shahsavari
1,
Gholam Hossein Roshani
1,*,
Ehsan Eftekhari-Zadeh
2,* and
Ehsan Nazemi
3
1
Electrical Engineering Department, Kermanshah University of Technology, Kermanshah 6715685420, Iran
2
Institute of Optics and Quantum Electronics, Abbe Center of Photonics, Friedrich Schiller University Jena, 07743 Jena, Germany
3
Imec-Vision Laboratory, Department of Physics, University of Antwerp, 2610 Antwerp, Belgium
*
Authors to whom correspondence should be addressed.
Axioms 2023, 12(1), 66; https://doi.org/10.3390/axioms12010066
Submission received: 7 December 2022 / Revised: 28 December 2022 / Accepted: 2 January 2023 / Published: 7 January 2023
(This article belongs to the Special Issue Computational and Experimental Fluid Dynamics)

Abstract

:
One of the most severe problems in power plants, petroleum and petrochemical industries is the accurate determination of phase fractions in two-phase flows. In this paper, we carried out experimental investigations to validate the simulations for water–air, two-phase flow in an annular pattern. To this end, we performed finite element simulations with COMSOL Multiphysics, conducted experimental investigations in concave electrode shape and, finally, compared both results. Our experimental set-up was constructed for water–air, two-phase flow in a vertical tube. Afterwards, the simulated models in the water–air condition were validated against the measurements. Our results show a relatively low relative error between the simulation and experiment indicating the validation of our simulations. Finally, we designed an Artificial Neural Network (ANN) model in order to predict the void fractions in any two-phase flow consisting of petroleum products as the liquid phase in pipelines. In this regard, we simulated a range of various liquid–gas, two-phase flows including crude oil, oil, diesel fuel, gasoline and water using the validated simulation. We developed our ANN model by a multi-layer perceptron (MLP) neural network in MATLAB 9.12.0.188 software. The input parameters of the MLP model were set to the capacitance of the sensor and the liquid phase material, whereas the output parameter was set to the void fraction. The void fraction was predicted with an error of less than 2% for different liquids via our proposed methodology. Using the presented novel metering system, the void fraction of any annular two-phase flow with different liquids can be precisely measured.

1. Introduction

The properties of gas–liquid, two-phase flow patterns are of great importance for designing and realizing industrial-scale research facilities. Nevertheless, it is quite difficult to measure the flow of a two-phase combination accurately [1]. There are currently a variety of commercially accessible meters based on different measurement concepts as solutions for this issue [2,3]. However, every metering technique has its own shortcomings. For instance, nearly all of those measuring techniques are flow regime dependent, and most of them can only attain the required accuracy with homogenous flows. Typically, flow-mixing devices are employed in measurements to mitigate this issue [4]. Typical gas–liquid flow measurement is a separation method, in which two phases are first detached, and then the single-phase flow is measured separately. This method requires expensive equipment and can also disrupt continuous industrial processes, which is undesirable. Furthermore, conventional methods are unable to identify the regime of the measured flow [5]. Reliable porosity measurements and the identification of flow patterns are critical for accurate modelling of two-phase systems. Additionally, the void fraction is the amount of gas in a pipe divided by the total volume of the pipe [6]. Void fractions can be measured using several techniques, including radiative attenuation (by X-rays or γ-rays), optical or electrical contact probes, impedance or capacitive sensing, and direct volumetric measurements via quick-closing valves. While interferometric probes perturb the flow field, radiation attenuation methods are expensive and fairly challenging from a radiation safety perspective to implement [7]. On the other hand, the impedance measurement technique is more practical and inexpensive [7]. Capacitive technology is also used to evaluate the liquid film thickness [8]. A sensor system based on capacitive techniques had been proposed to provide a real-time estimate of the void fraction [9]. This method works on the basis of the difference of electrical properties of phases with varied amounts and compositions in the tube, which leads to distinguishable permittivity distributions. [10]. These variations are measured by electrodes placed on the outer surface of the non-conductive part of the tube, forming a capacitor [11]. The main advantage of the capacitive sensing method is that it is unobtrusive and also does not disrupt the fluid flow [12]. Capacitance-based sensors have progressed with significant results for gas–liquid and liquid–liquid flows in order to acquire void fraction measurements or tomographic reconstructions [13,14], and also in the gas–solid system [15]. Sami and his colleagues compared the results of many capacitance configurations in two-phase, gas–liquid tubes. In a specified flow regime, it was determined that a four-concave-plate architecture outperforms in terms of the sensitivity and ease of manufacturing [16]. Ahmed and his co-employee analyzed two forms of capacitance sensors: ring and concave types. The phase fraction was represented by an equivalent capacitance circuit and estimated the sensitivity of both concave and ring sensors. It was determined that the sensitivity of the ring sensor increases as the distance between the electrodes decreases. Additionally, the sensitivity of the ring type of sensor was higher than the concave type with the exact dimensional resolution [17]. Jaworek et al. used a radio frequency resonance circuit with an 80 MHz frequency to calculate the void fraction using five distinct sensor architectures [18]. Tollefsen and colleagues attempted to optimize the sensitivity and accuracy of a helical capacitive sensor’s flow regime independence. The sensor was modelled via the Finite Element Method (FEM). Their simulation was validated by several sensors and flow regime measurements with a maximum deviation of 5% between the simulated and measured values [19]. Theoretical and experimental studies were conducted to investigate the effect of design factors on the capacitance output for two different sensor configurations, i.e., concave and ring. The output capacitance and porosity for both types of sensors showed a linear correlation. Additionally, a capacitive sensor system was introduced in 2017 to measure the void fraction of a diesel two-phase flow configuration [20]. Double-ring and concave electrodes were selected, among others. The experimental results show that the concave configuration has a special dependency on flow regimes. Salehi and his colleagues investigated specific electrode configurations for oil–air, two-phase flow measurements for different flow regimes [21]. The results show different sensitivities for each electrode shape. The concave shape was more sensitive than the others in the annular structure. Salehi et al. proposed a Rectangular Fork Capacitance Sensor (TRFLC) to recognize the flow pattern of a two-phase, gas–oil flow in a horizontal pipeline [22]. One of the most powerful mathematical tools that is widely used in instrumentation, electrical and control engineering is ANN [23,24,25,26,27]. In this study, we compared experimental data and simulation data for a concave electrode shape in order to validate the simulation data. This research focuses on an annular two-phase, water–air flow; an LCR meter was used to measure the capacitances to produce a precise measurement in the experimental setup, and COMSOL software was also used to run the required simulations. Furthermore, an ANN model was employed to estimate the void fractions in two-phase flows with any petroleum product as the liquid phase in the pipelines. The novelty of this paper is the measurement of the void percentage with high precision in an annular regime using a combination of a capacitance-based sensor and ANN for different fluids. In fact, the void fraction as the ANN output was measured precisely for different liquid phases. Using the novel proposed metering system, the void fraction of every annular two-phase flow with different liquids can be measured precisely. The presented metering system is simple to use and inexpensive.

2. Experimental Setup of the Concave Capacitive Sensor and Measurements

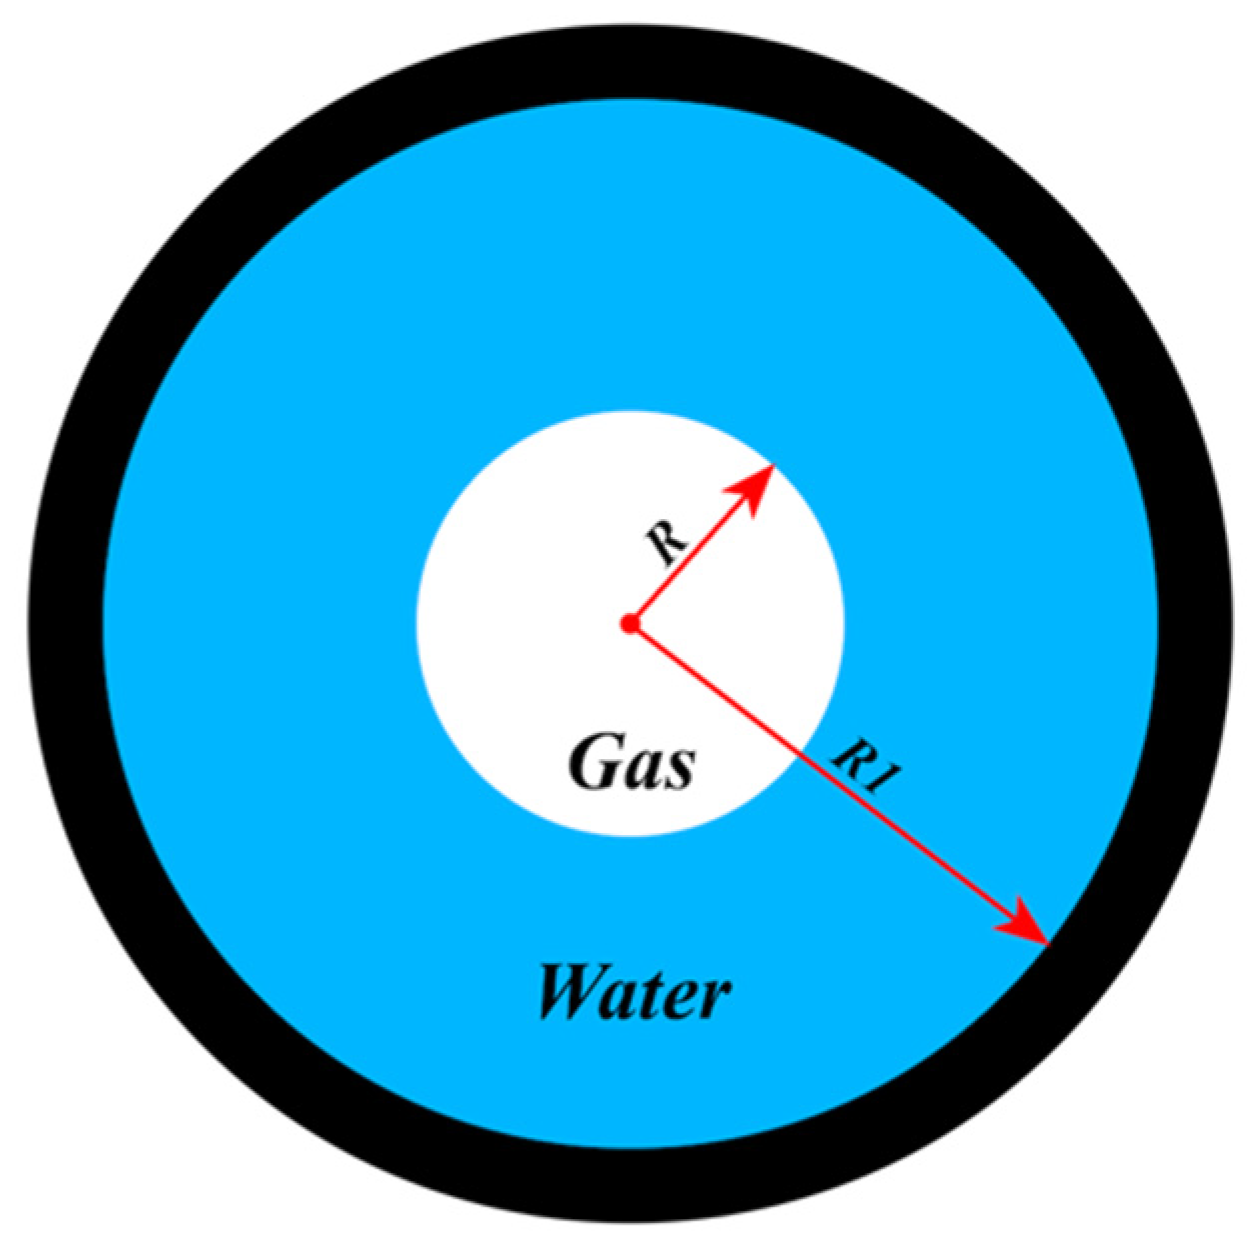
Capacitance sensors consist of a transducer circuit and electrodes. The classification of multiphase flows is mainly based on the observations of two-phase flow in the laboratory. The properties of gas–liquid, two-phase flow patterns can make different flow regimes, such as bubble, plug slug, foam, annular streak and annular, as shown in Figure 1. In annular flow, the liquid flows on the wall in the form of a thin layer, and the gas flow is in the center. Figure 2 shows the scheme of an annular regime. Equations (1) and (2) were used to describe the various volume fractions for the two-phase, water–gas regime in annular flow:
V g a s = π R 2 π R 1 2 = R 2 R 1 2
V w a t e r = π R 1 2 π R 2 π R 1 2 = R 1 2 R 2 R 1 2
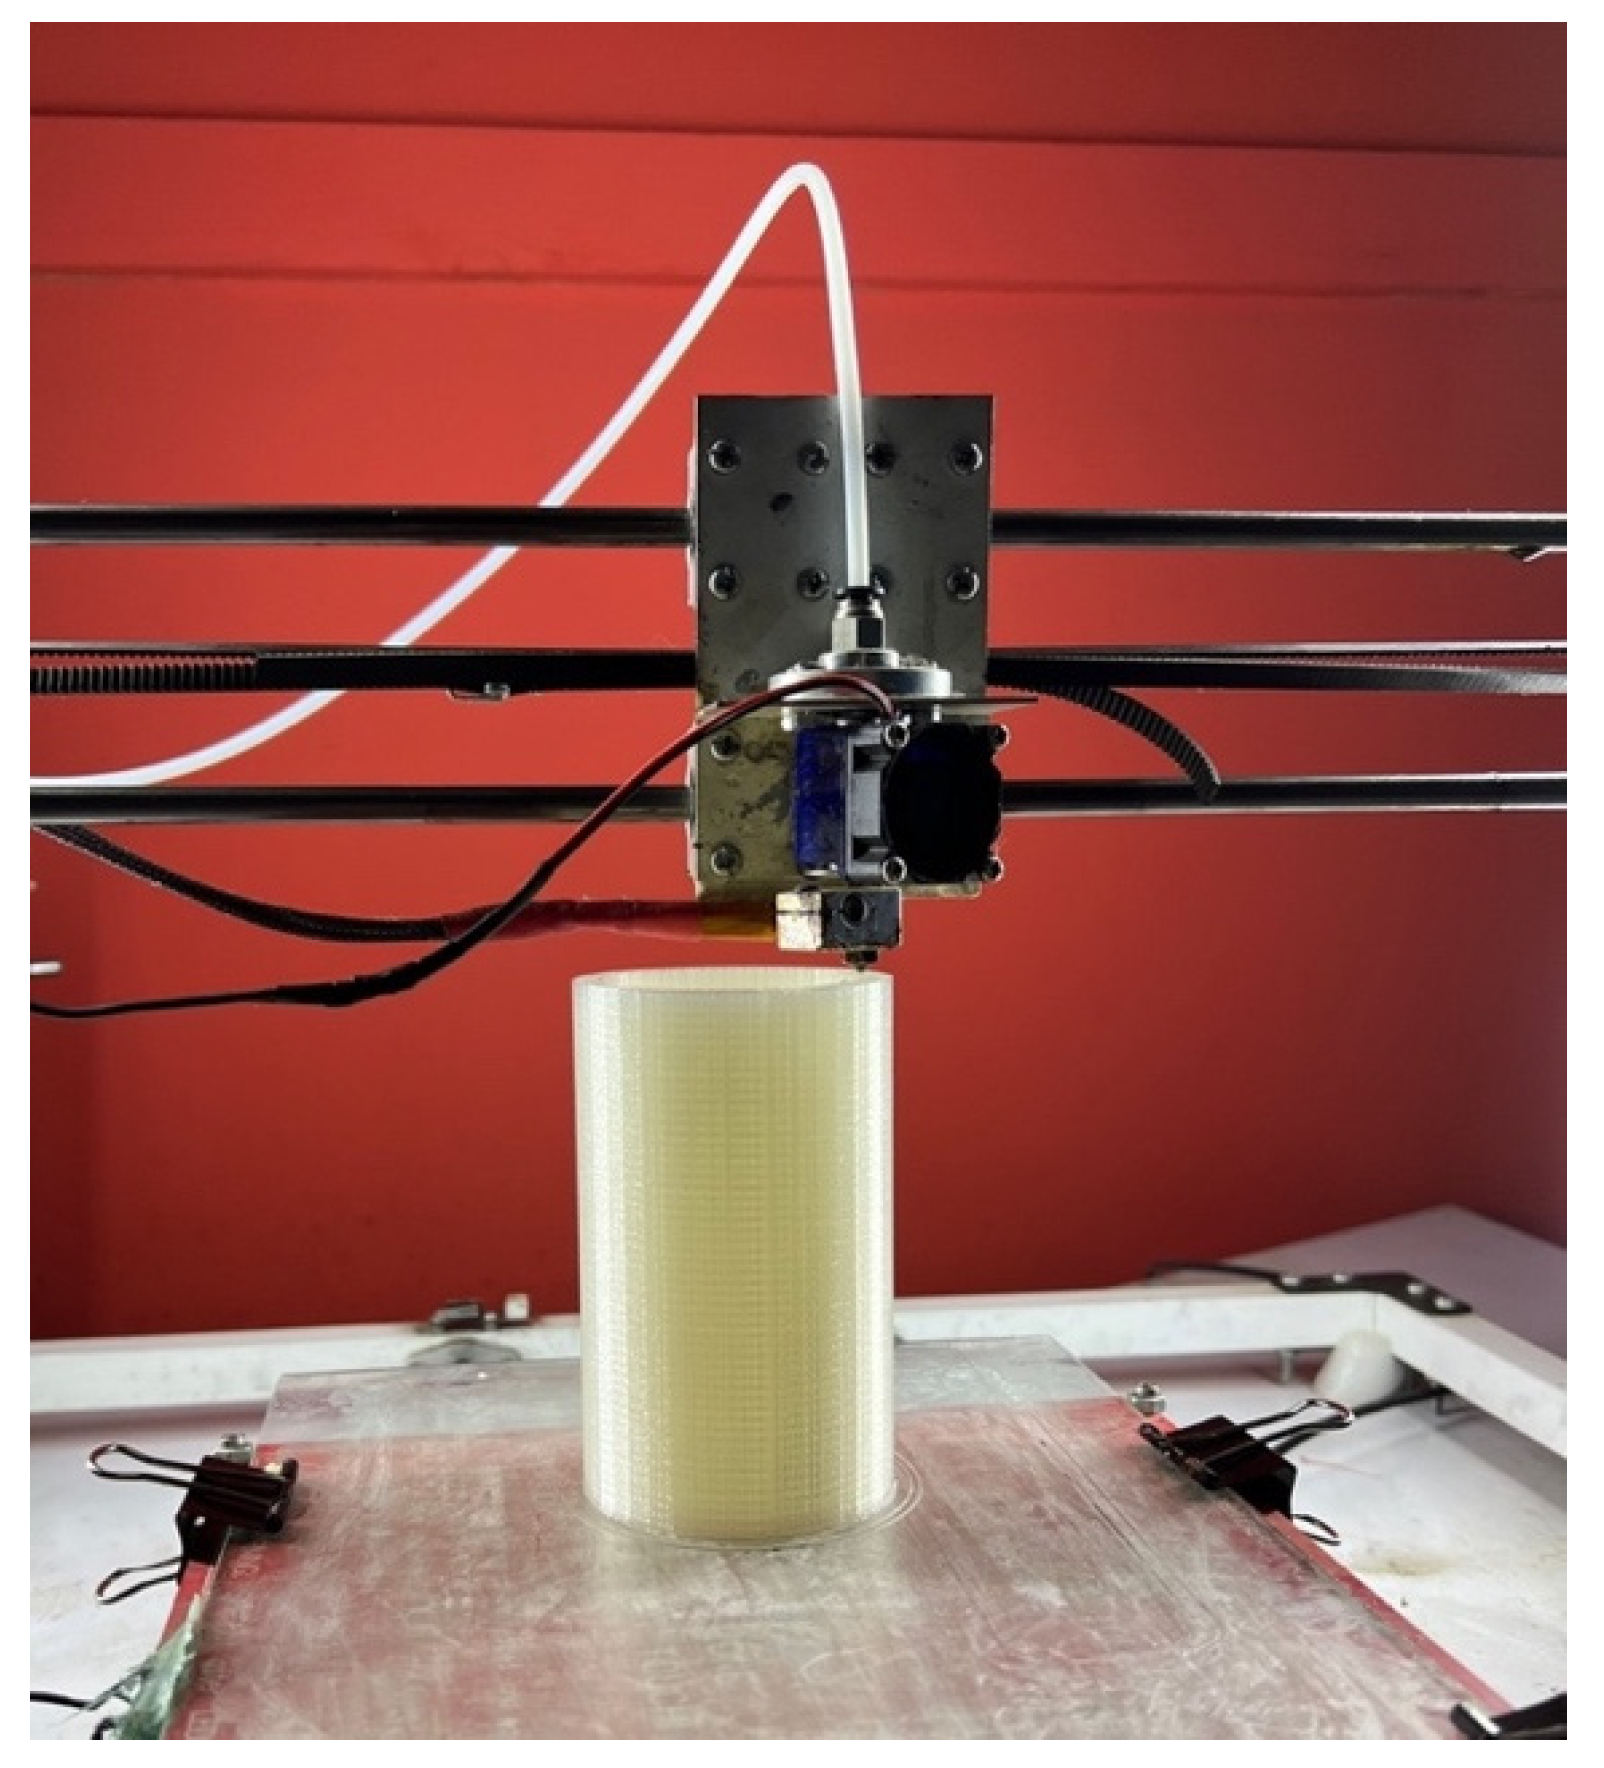
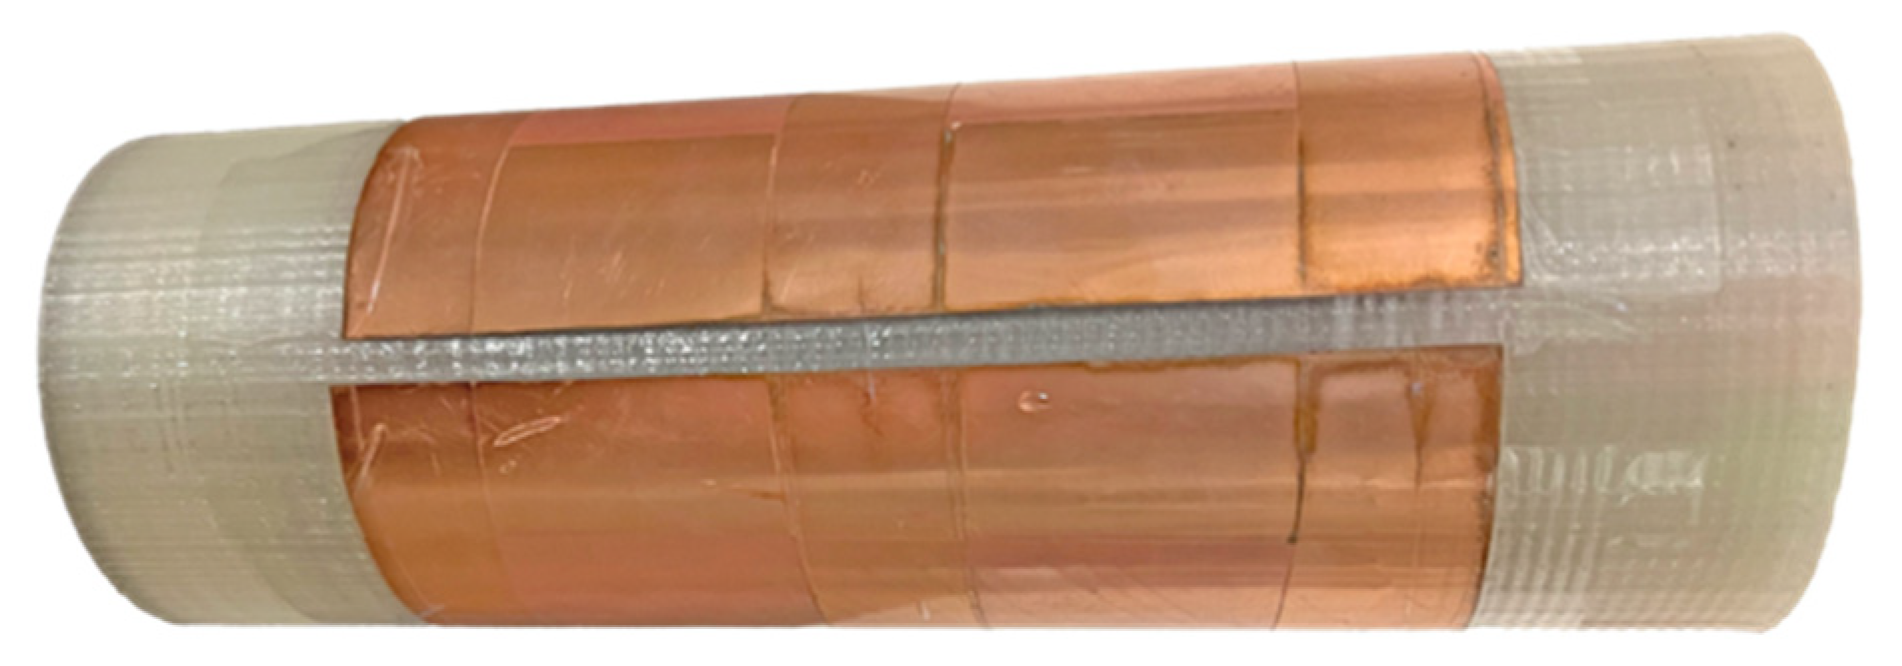
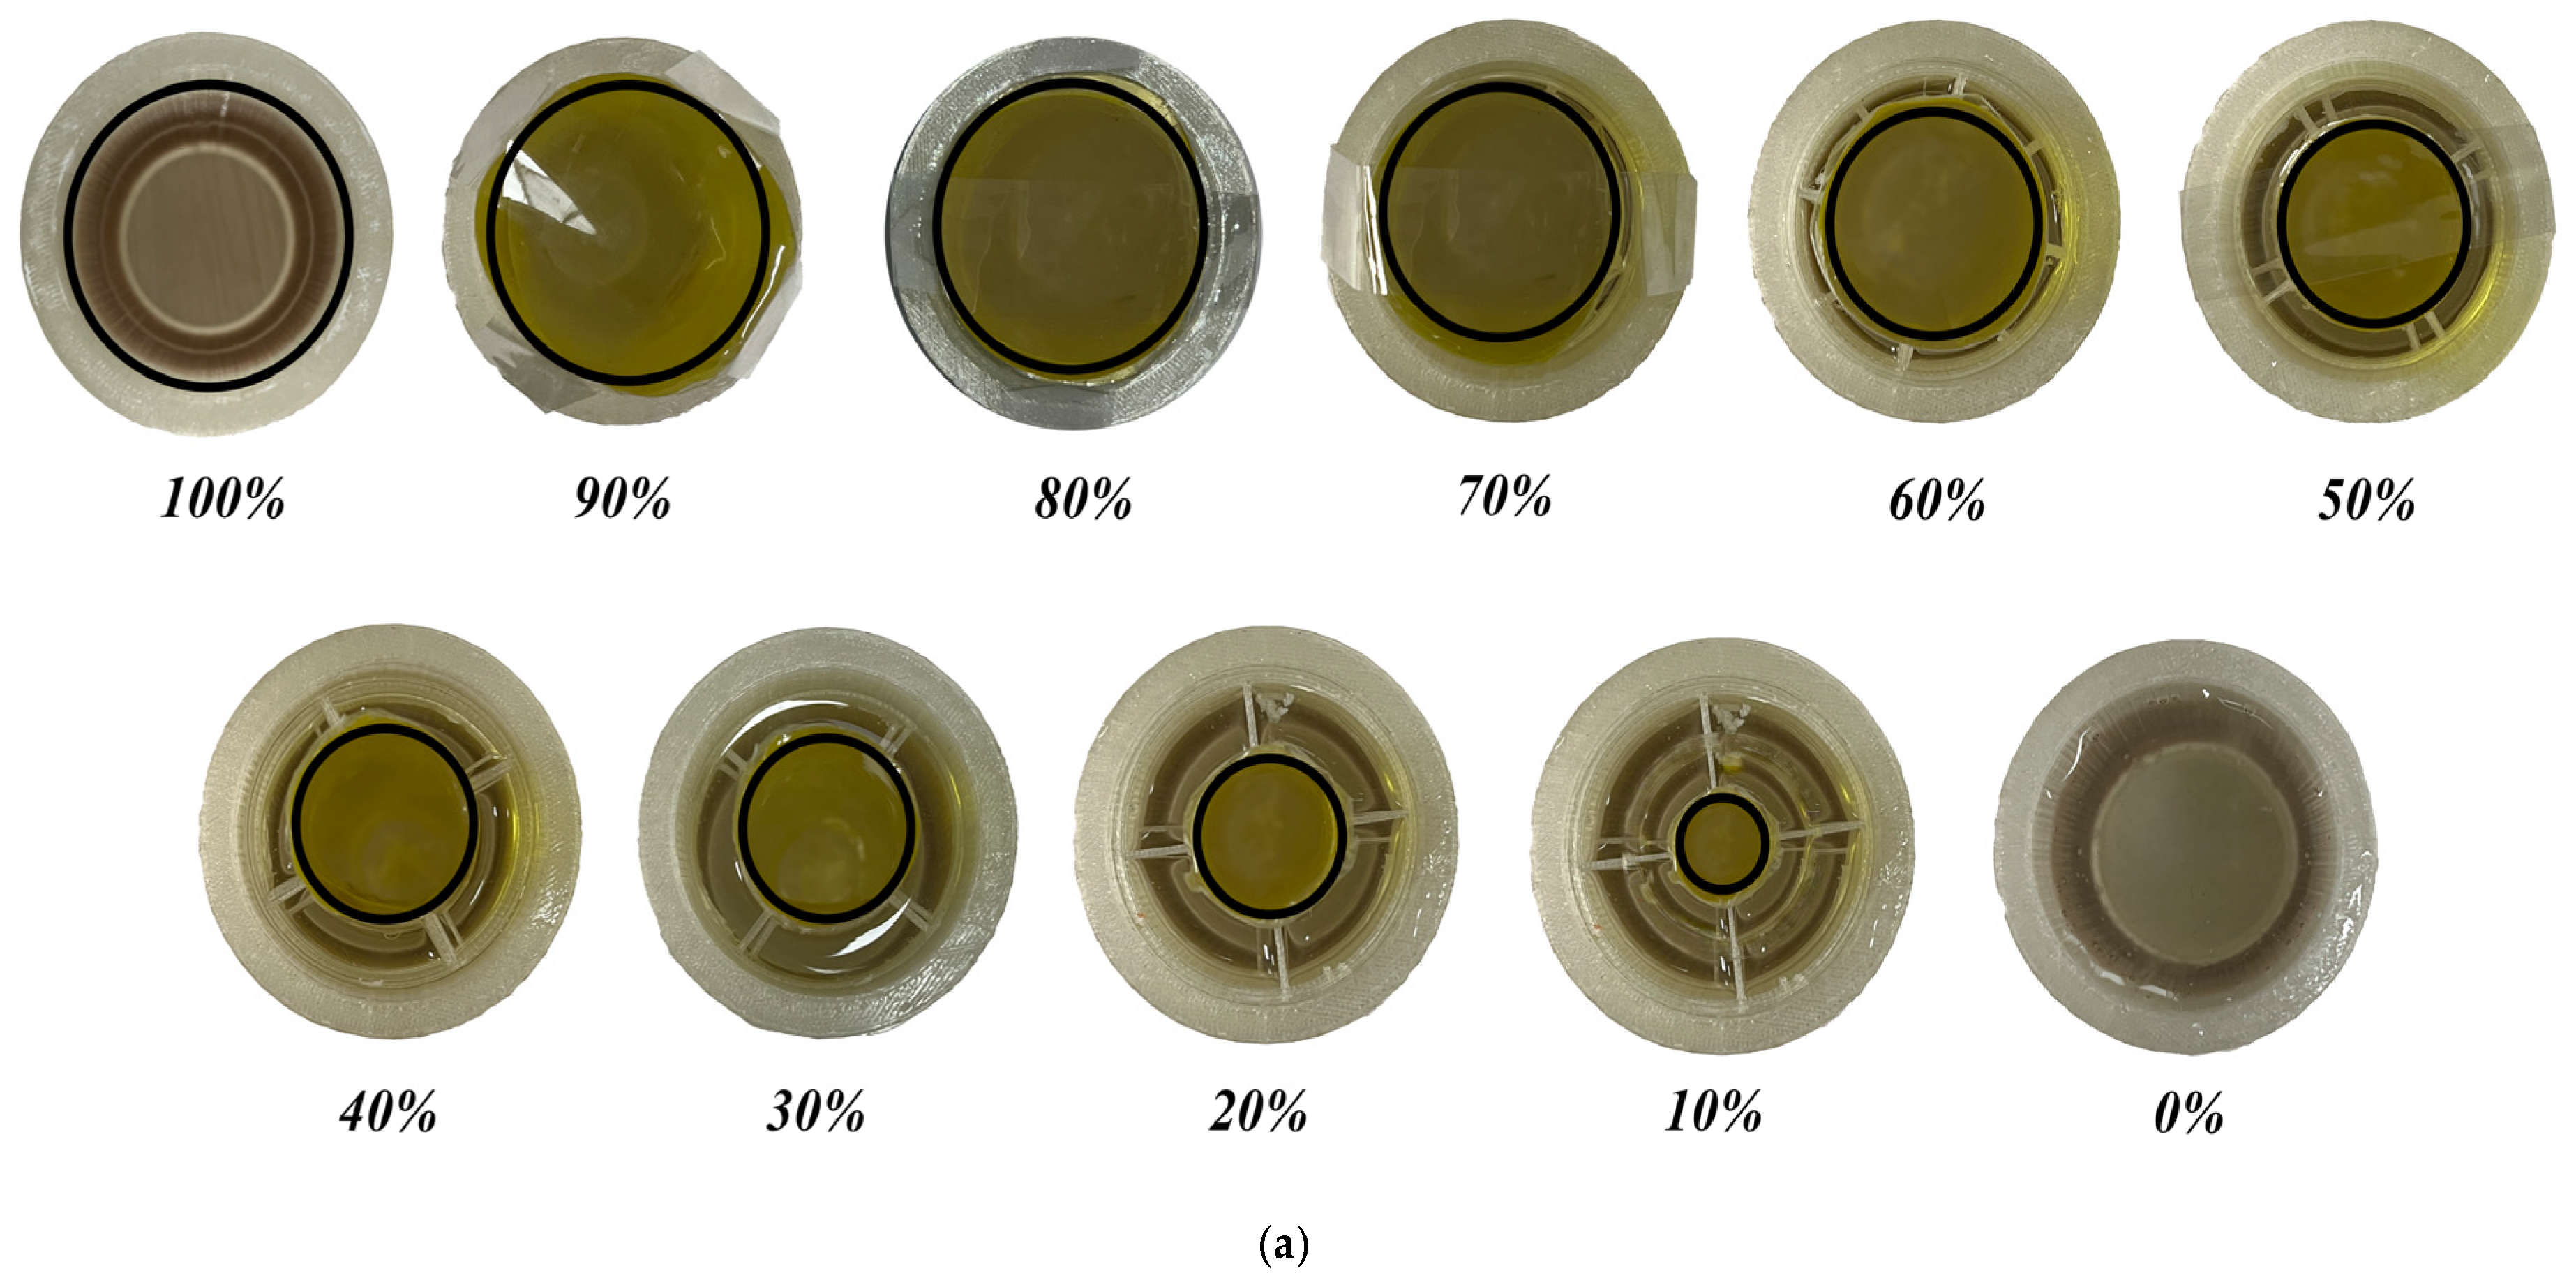
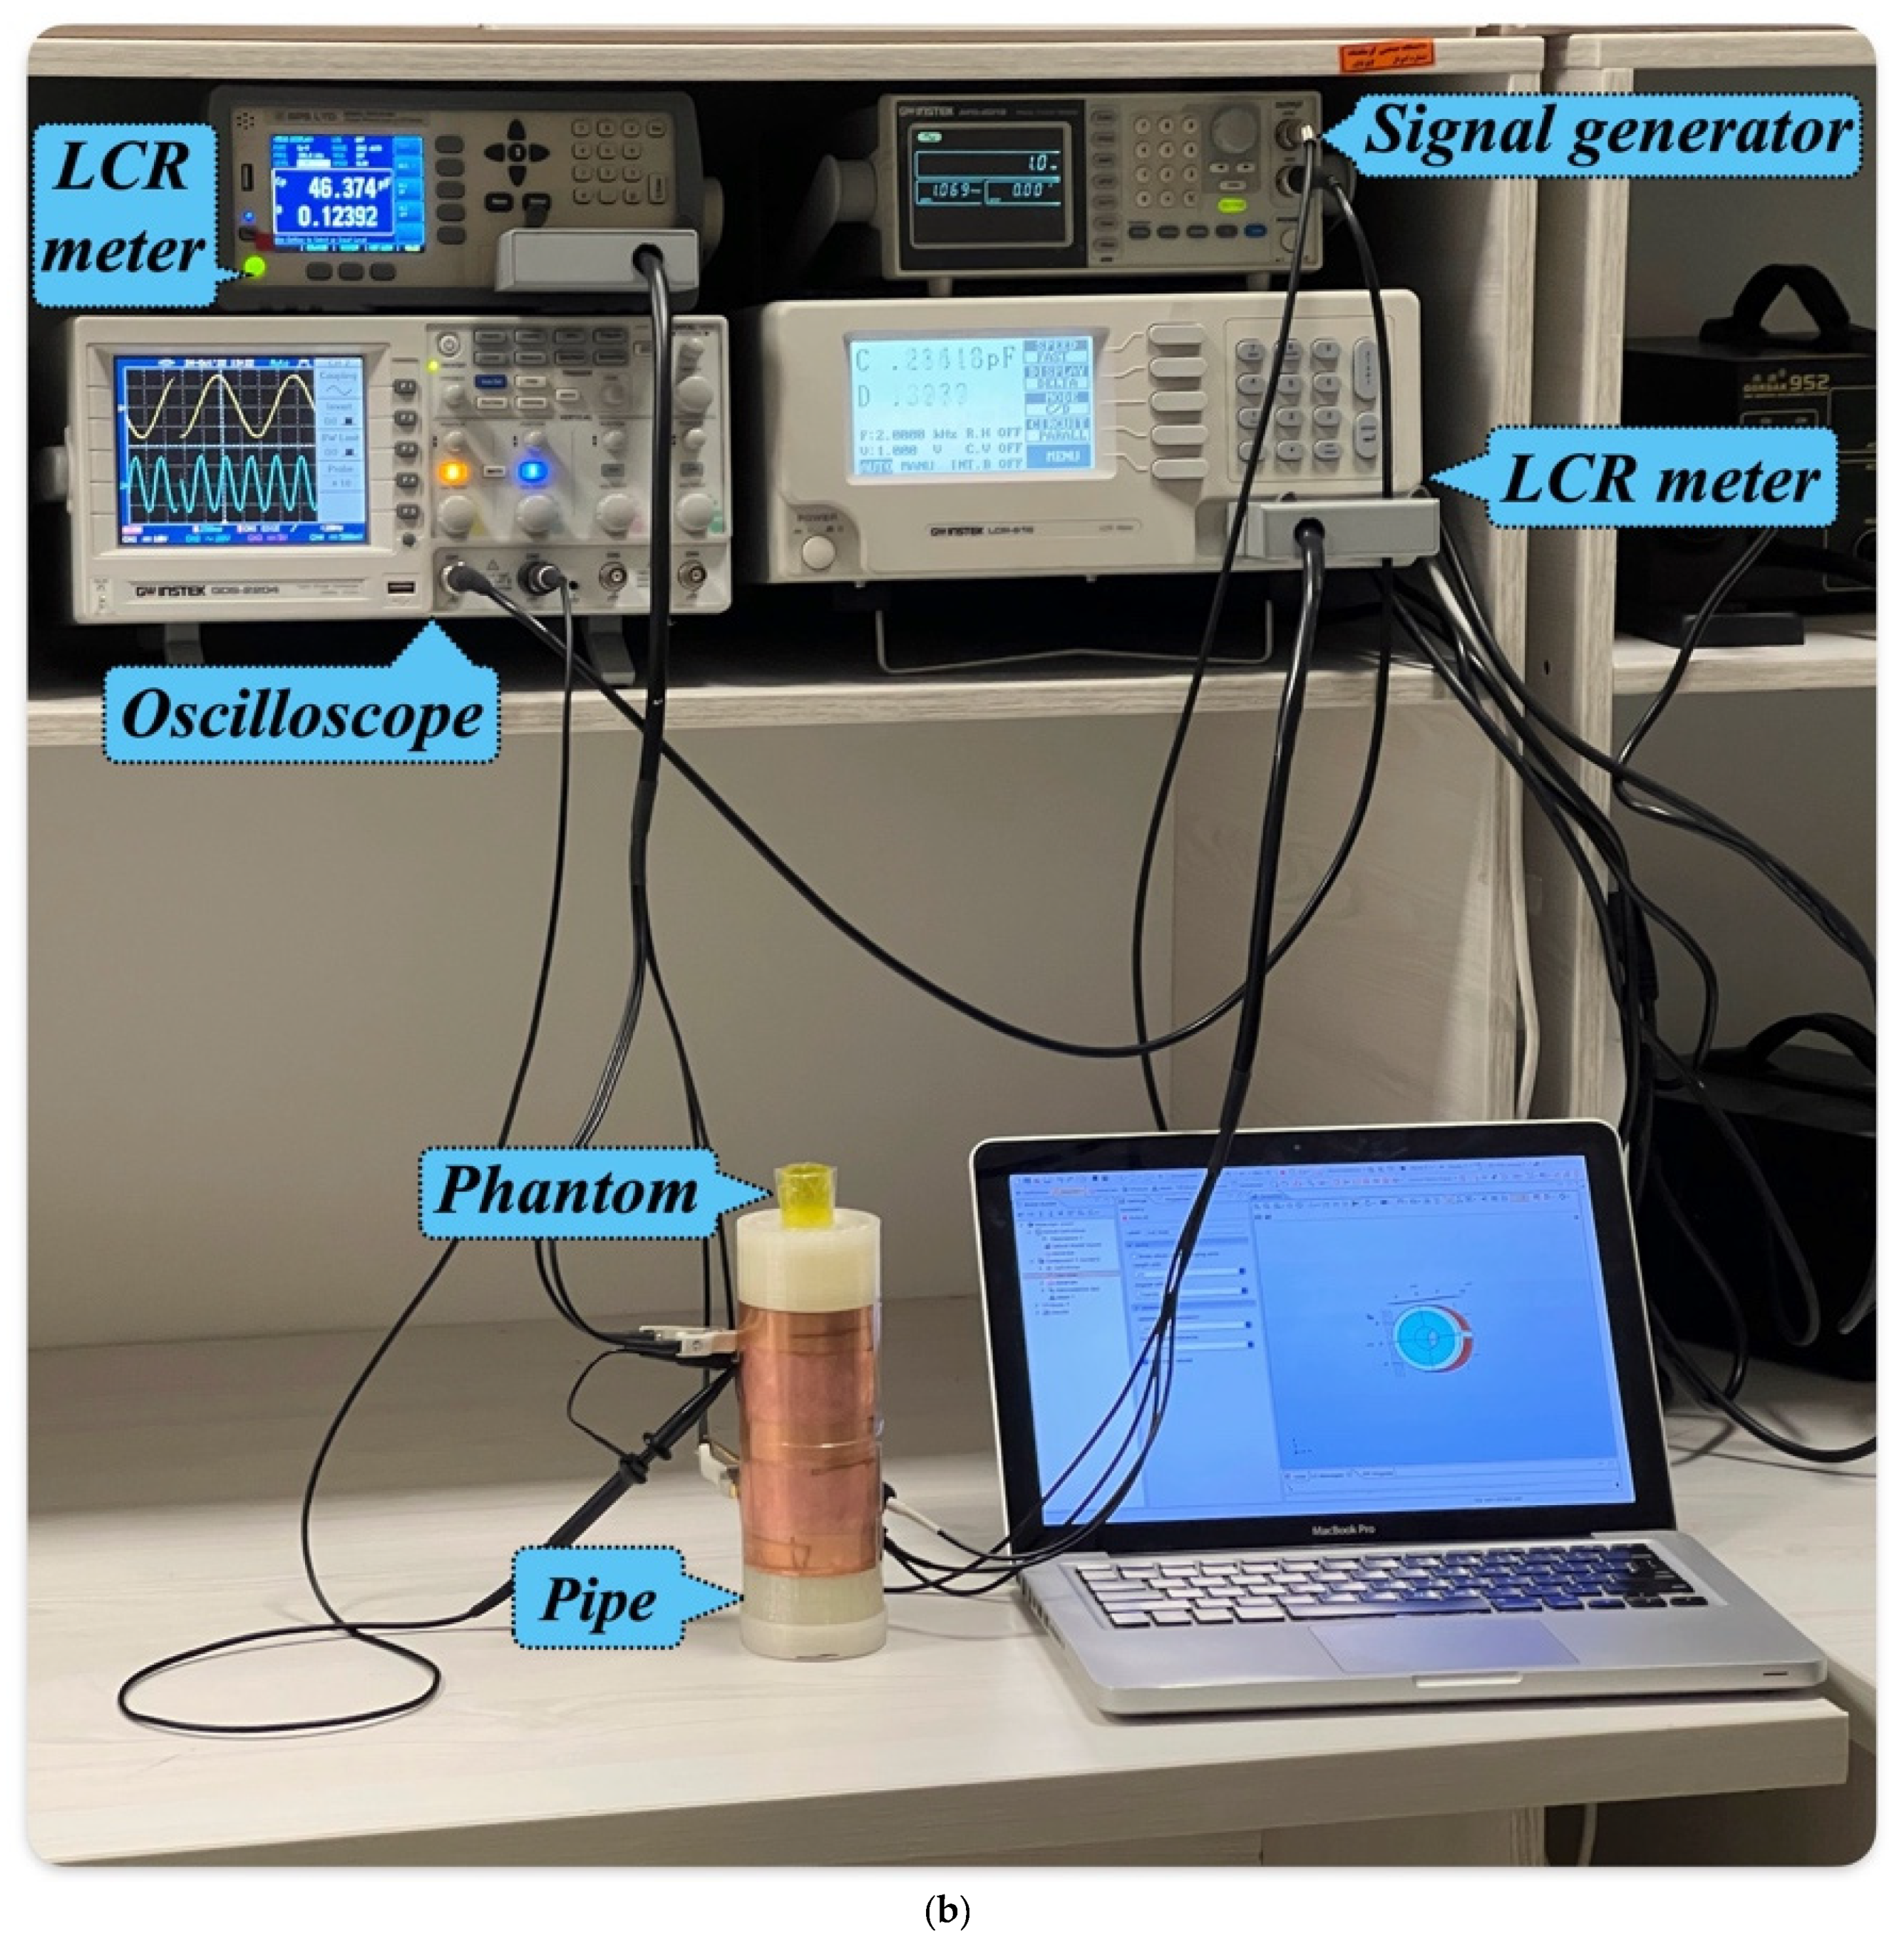
In this paper, we used several annular regimes of two-phase flow tests to validate the simulated data. An annular regime has been investigated by a static setup since simulating the annular flow in a laboratory environment is very complicated. Therefore, phantoms with various diameters were produced with thin PVC films and thin bases to distinguish the liquid from the gas phase, which are shown in Figure 3. However, the separator pipes were ignored in the simulations due to their very thin thicknesses. Furthermore, a transparent PLA pipe with an inner radius of 26 mm, an outer radius of 32 mm, a height of 180 mm and the relative permittivity of PLA (ε PLA) set as 3.34 was constructed with a 3D printer with 0.1 mm accuracy and is shown in Figure 4 [28]. Two electrodes in the middle of the pipe were made of thin, soft copper with an outer radius of 33; the thickness of the wall was 1 mm, and the height was 120 mm. The distance of the electrodes was 5 mm, which was used as an exciting and measuring electrode to measure the capacitance, as shown in Figure 5. Water and air were selected as the liquid and gas phases, respectively. Meanwhile, the relative permittivity of the water (ε water) at a temperature of 27 degrees Celsius and air (ε air), in that order, were set at 81 and 1 [29,30]. Void fractions of 0, 10, 20, 30, 40, 50, 60, 70, 80, 90 and 100 percentage were produced by the phantoms, as shown in Figure 6a, and tested with an LCR meter (GPS LTD 3138C), which is shown in Figure 6b. In addition, the results of the experimental setup are shown in Table 1.

3. Numerical Simulations

3.1. Modelled Configuration

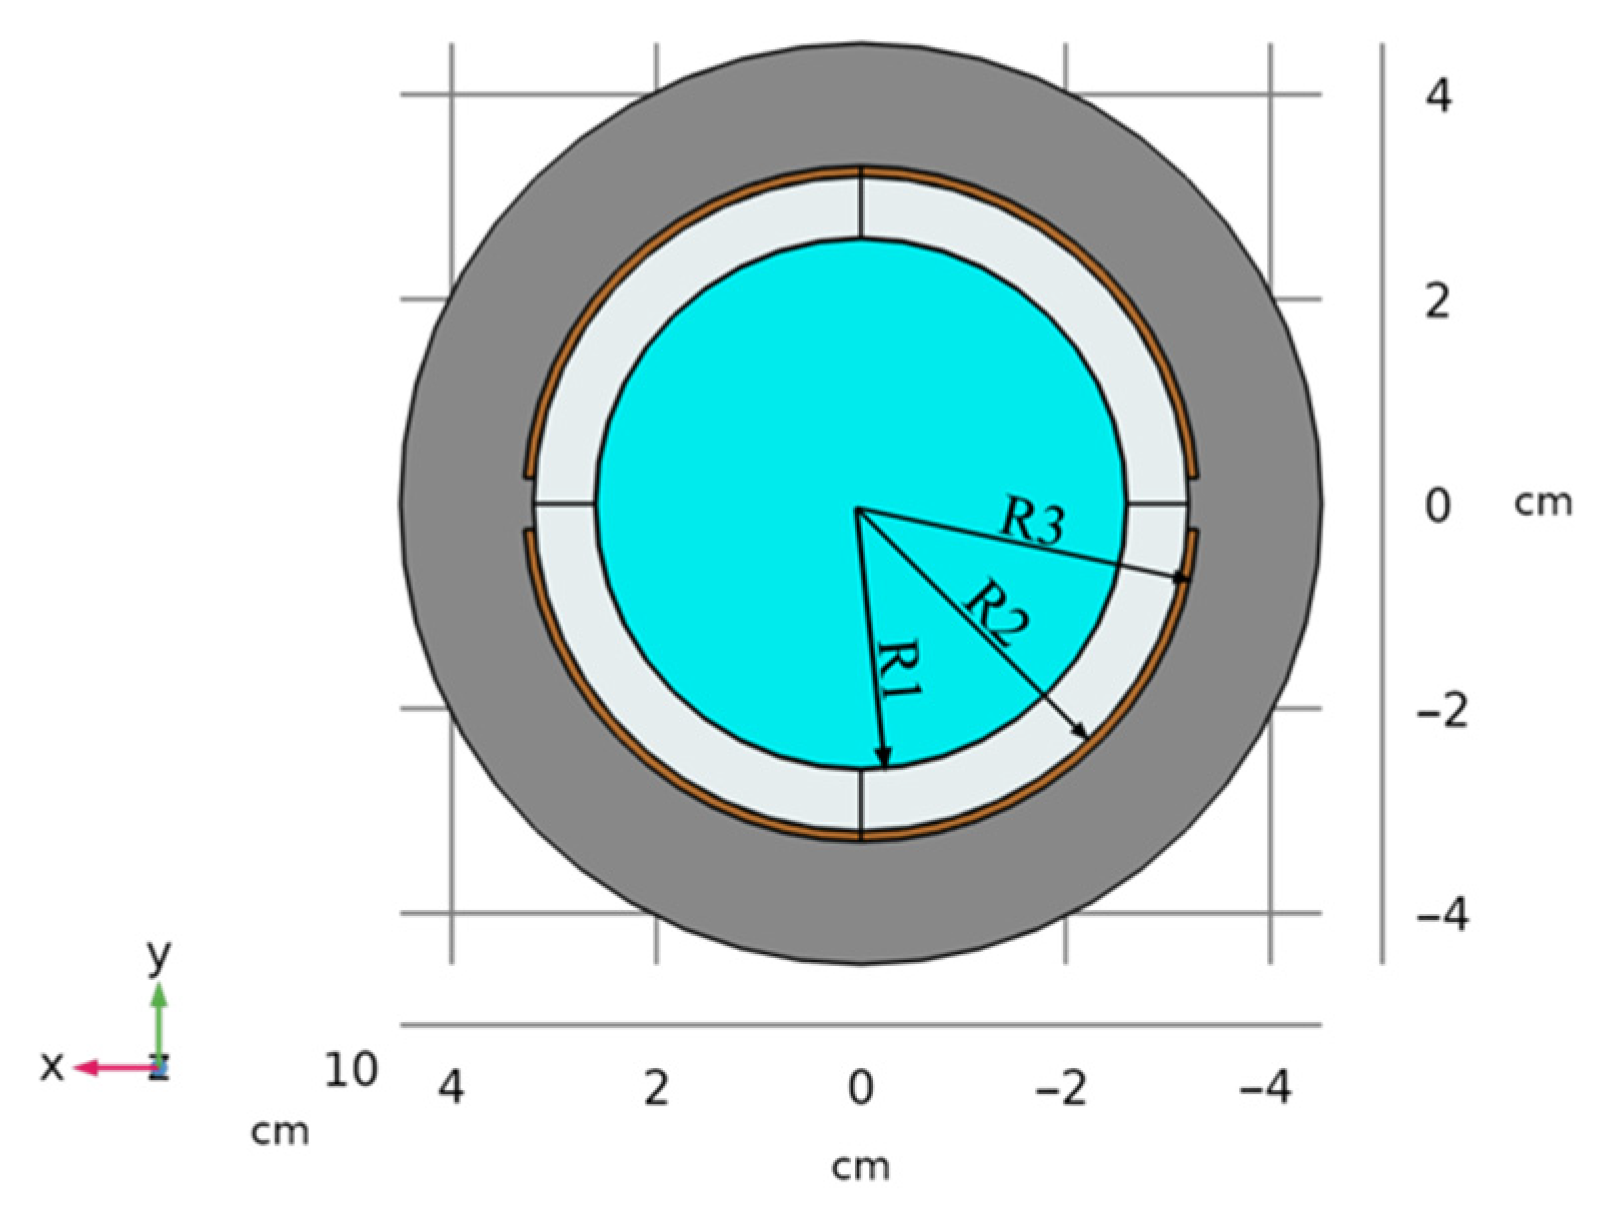
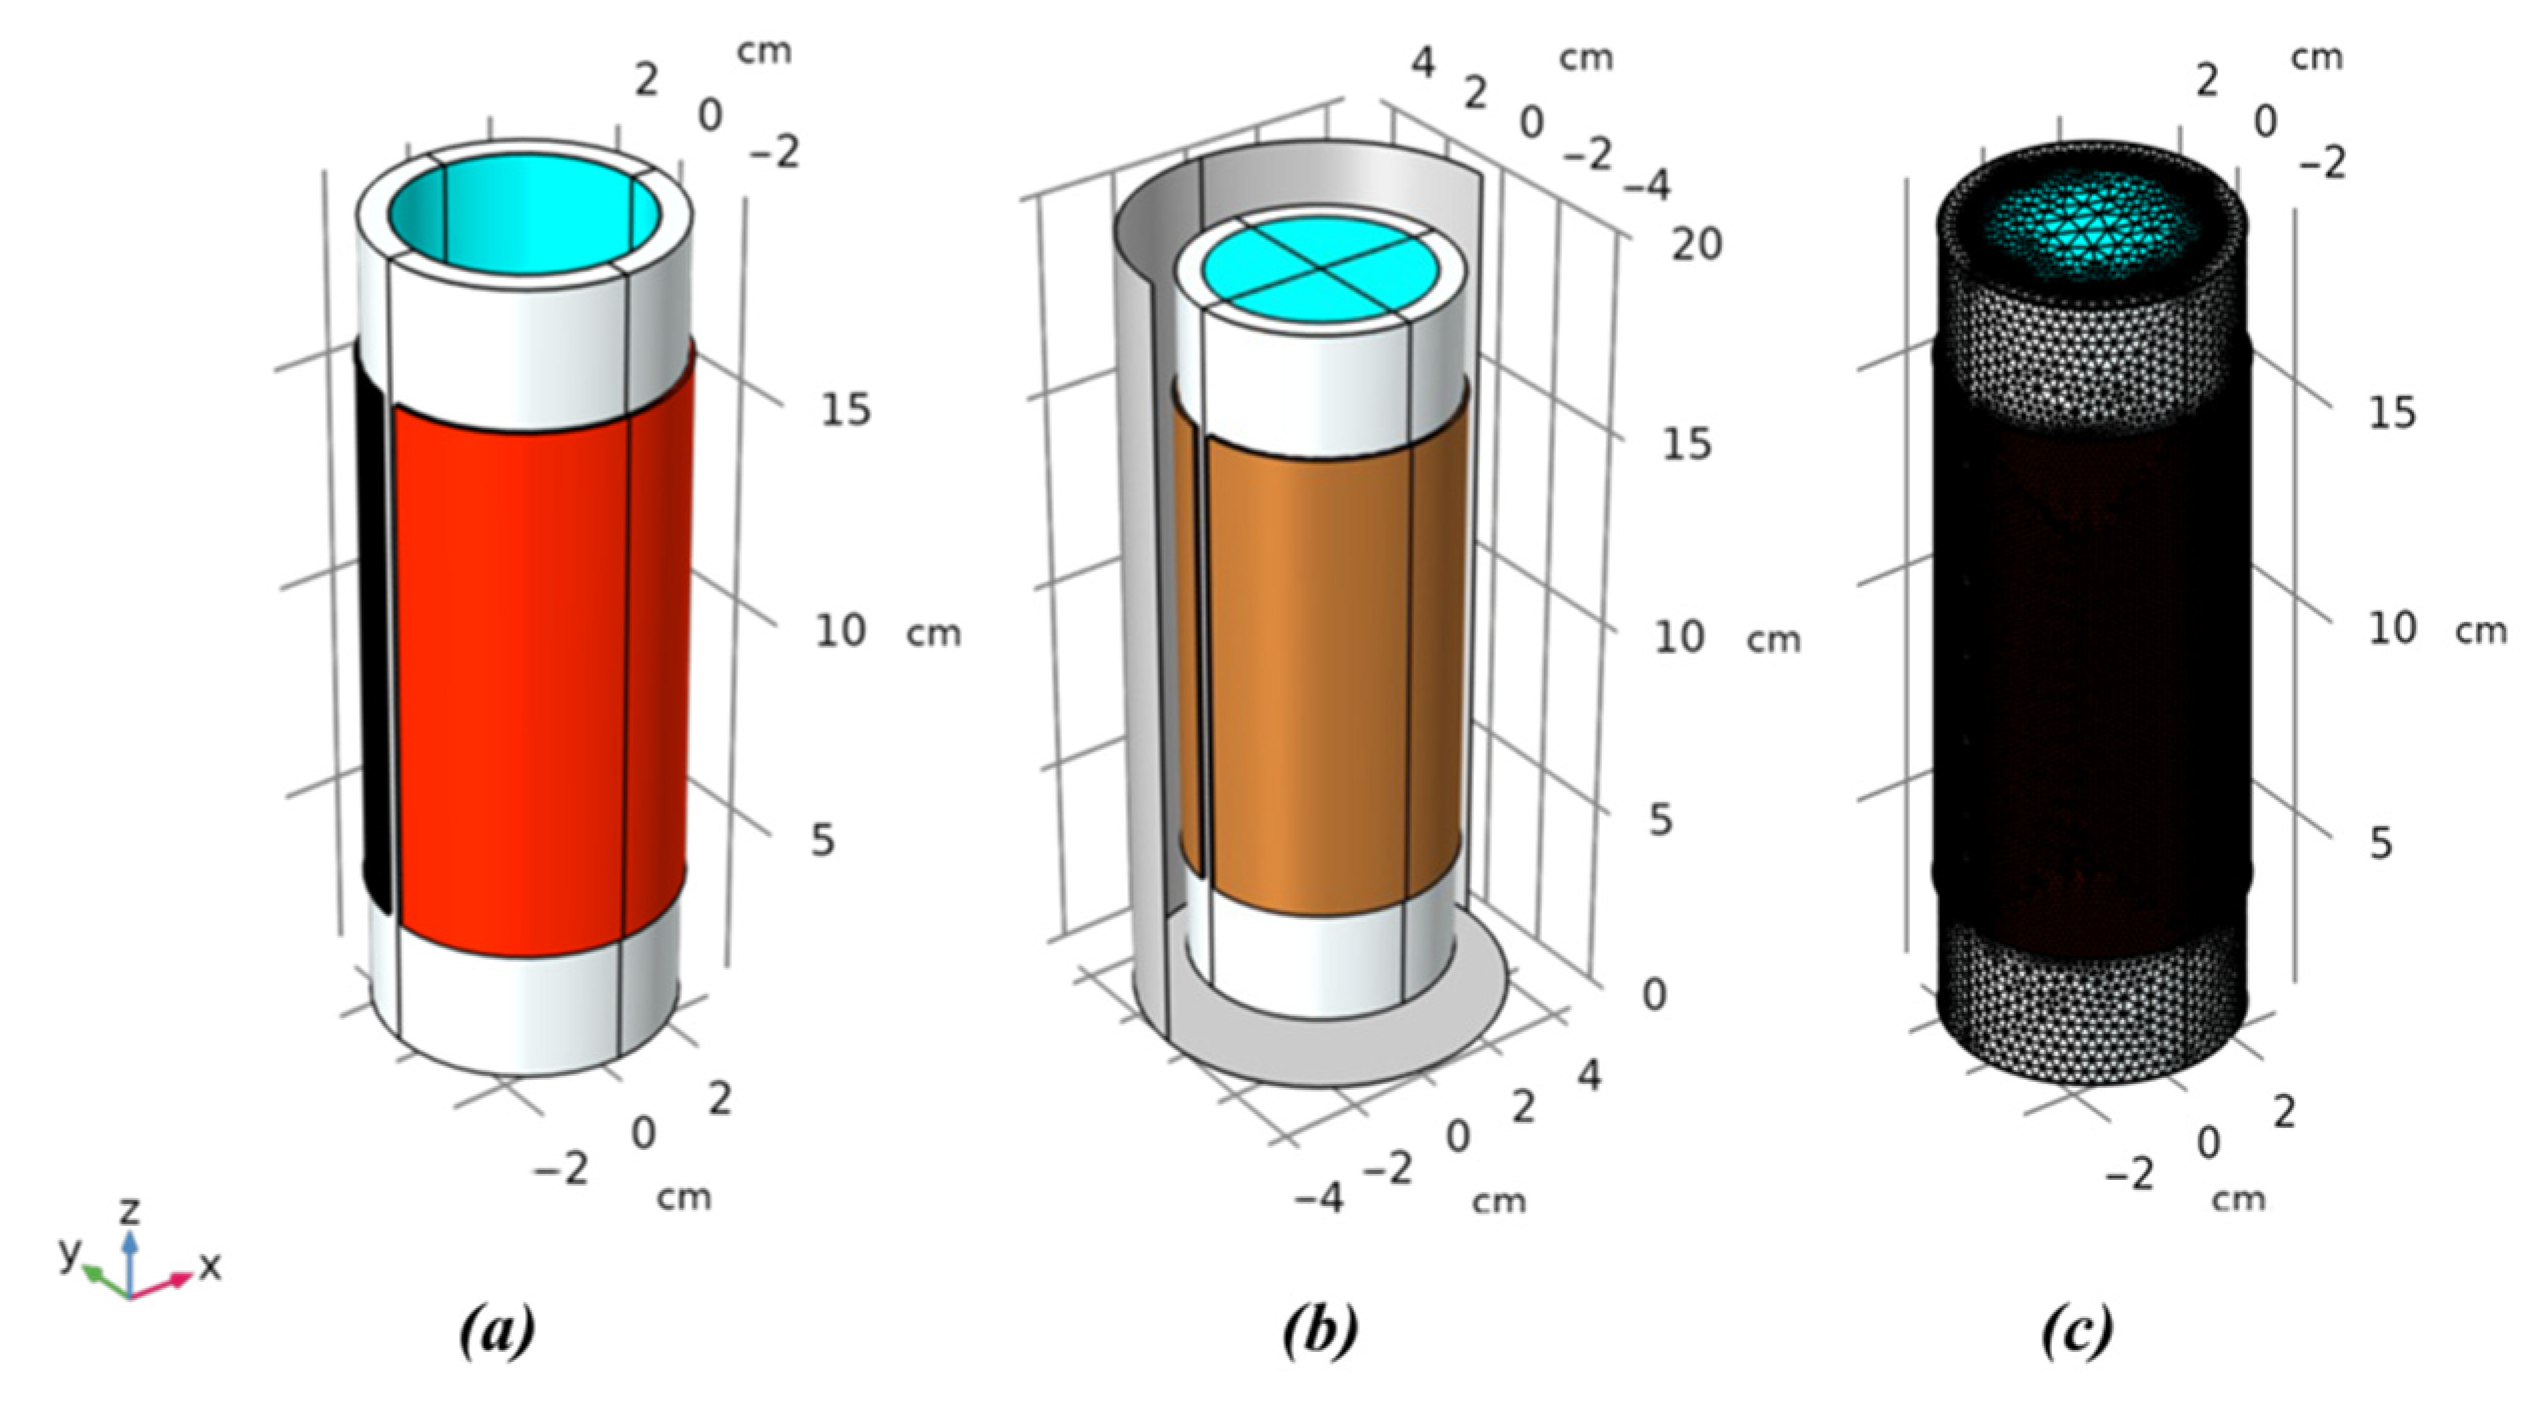
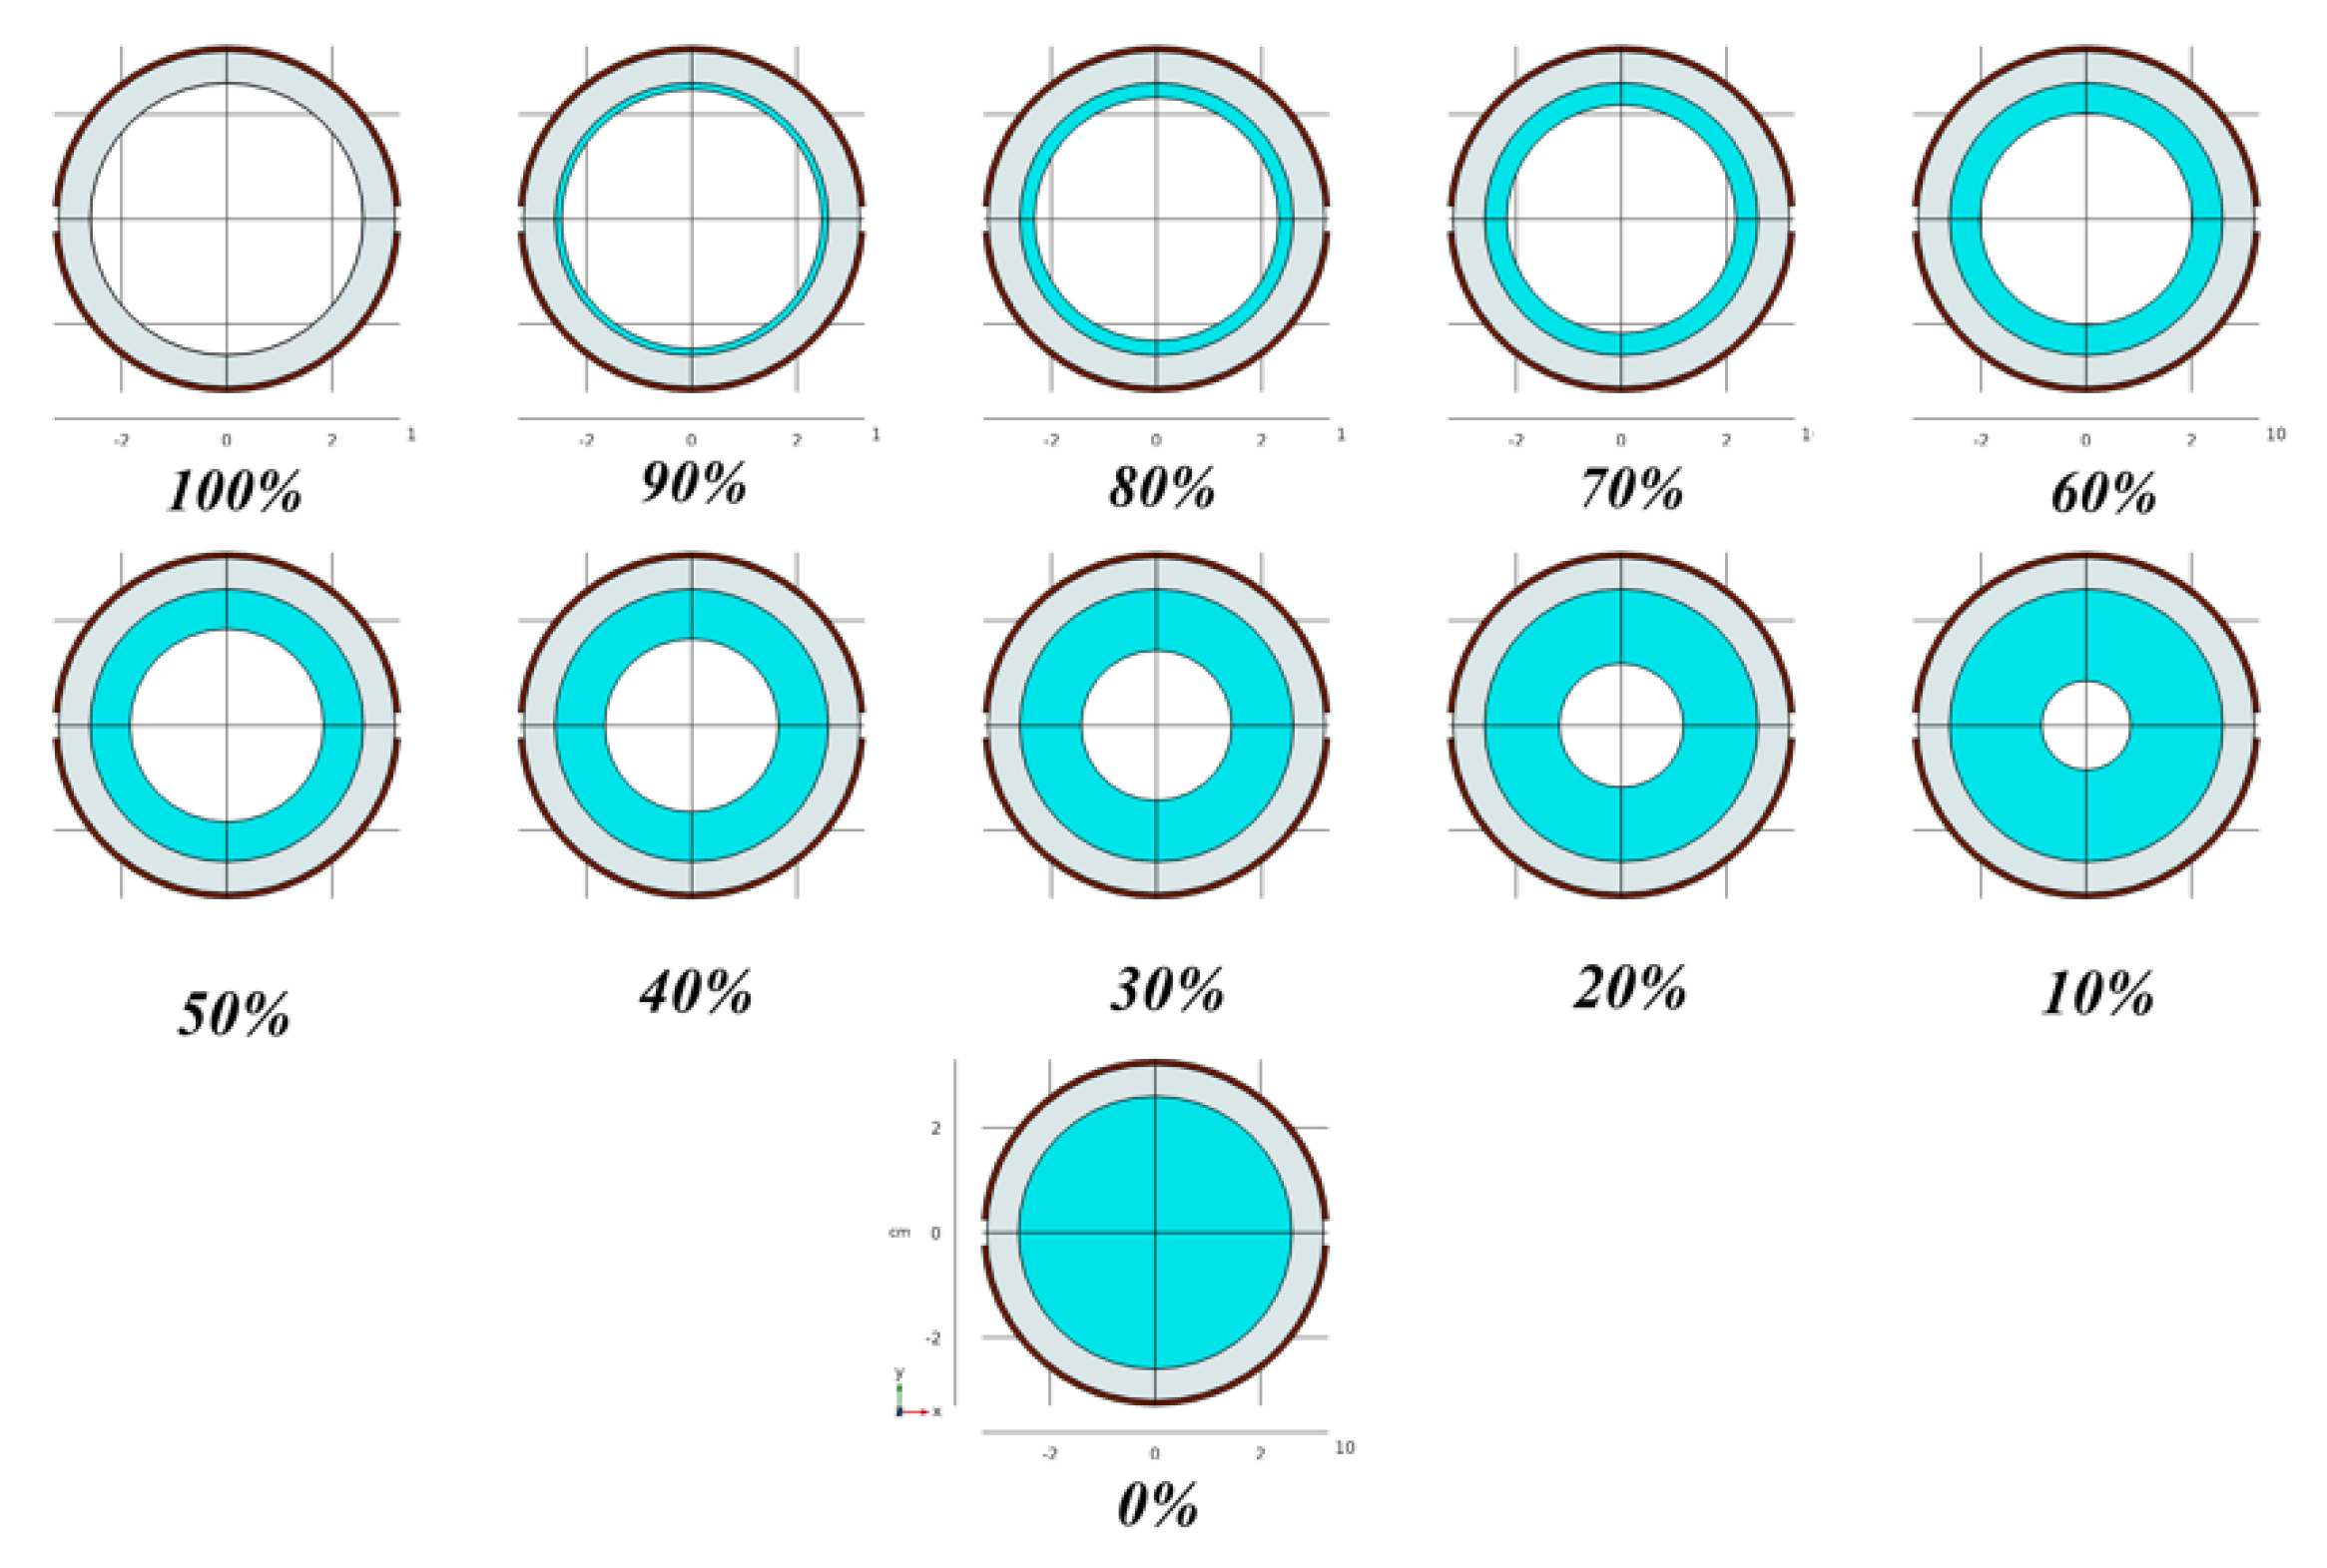
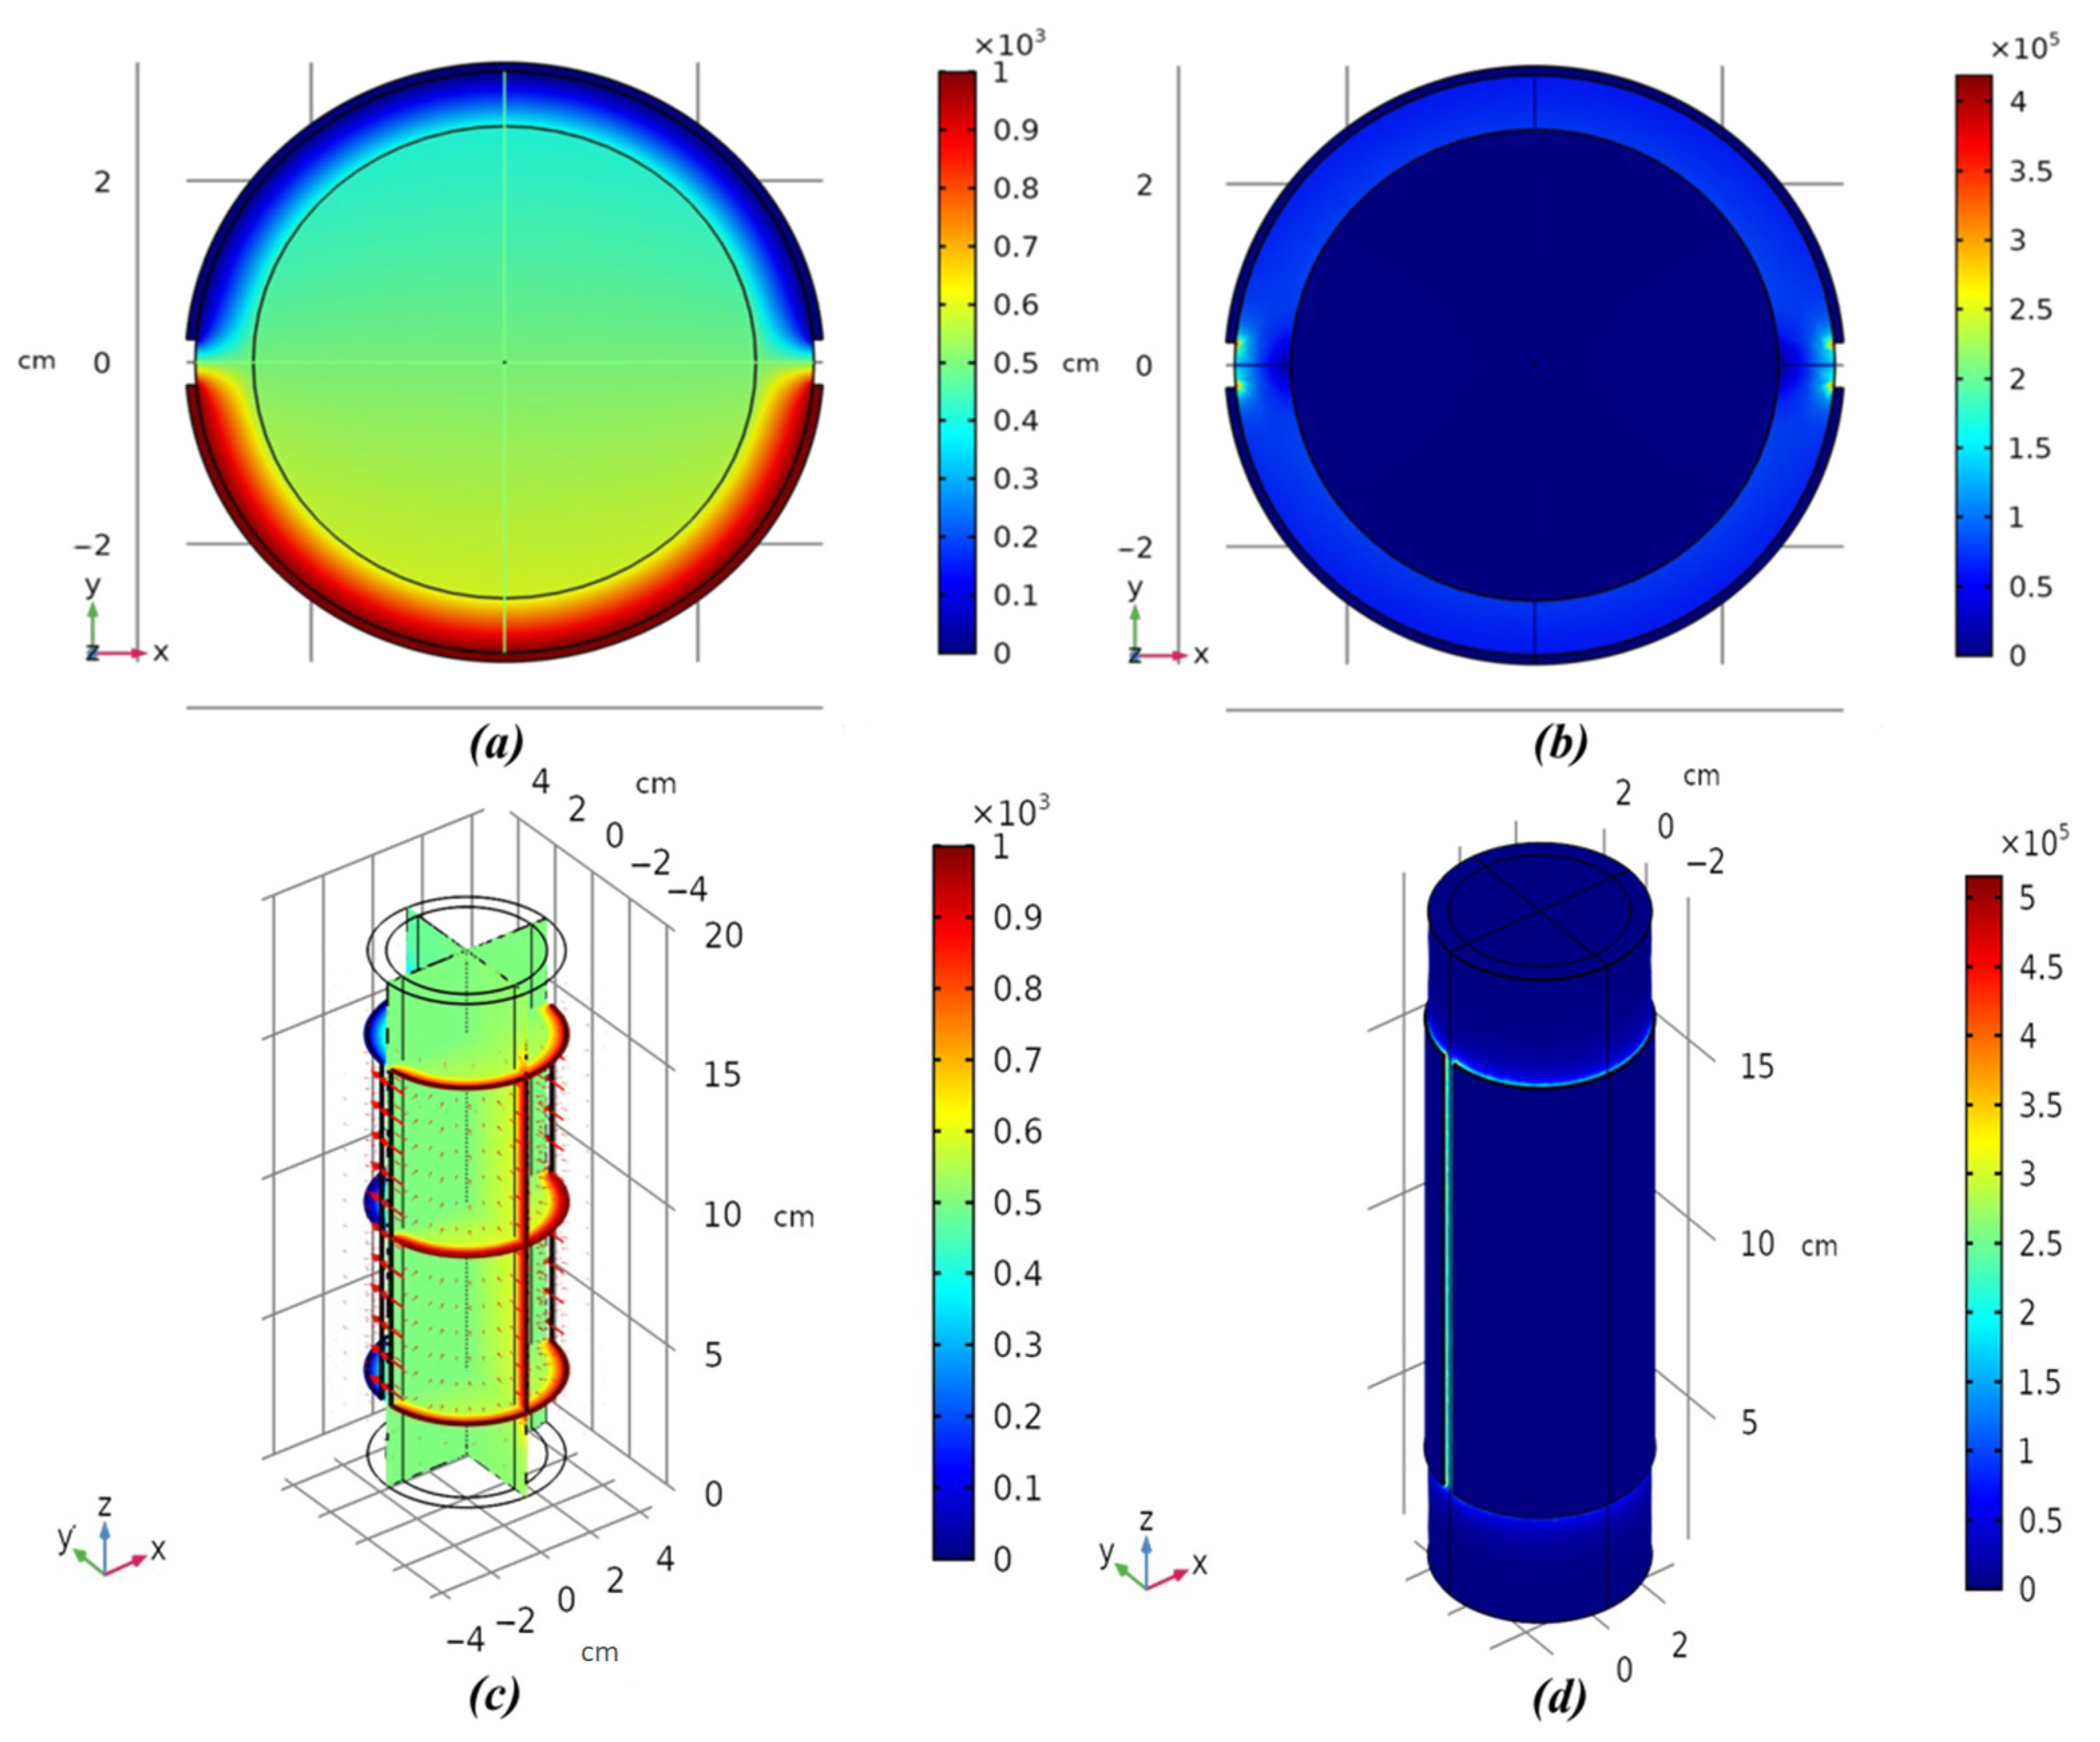
We used COMSOL Multiphysics 5.5 to simulate the experimental environment for the evaluation of the capacitance. We defined an air content in the simulation study because of the considerable fringing fields that can be detected around the capacitor plates. In other words, the surrounding electric fields may rise to infinite, even though they drop by a ratio inversely proportional to the cube of the distance. In stationary regimes, a 3D model of electrostatic physics was created. In addition, the variables related to the field were set to constant over the time in this regime. For comparing the experimental and simulation data, a typical structure was simulated similar to the fabricated setup. A quartz glass with an inner radius of R1 = 26 mm, an outer radius of R2 = 32 mm and a length of 180 mm was designed. Furthermore, the relative permittivity of the main pipe was regarded as 3.4. A capacitance-based sensor was made from soft copper with an inner radius of R2 = 32 mm, an outer radius of R3 = 33 mm and a length of 120 mm. Also, the separation between the electrodes was set at 5 mm, as shown in Figure 7. Water (chemical formula of H2O, relative permittivity of 81 and density of 997.77 kg/cm3) and air (relative permittivity of 1 and density of 1.204 kg/m3) were considered as the liquid and gas phases, separately. A 3-dimensional view of the electrodes pattern, a volumetric view of the simulated setup and the meshed model of the capacitance-based sensor in a typical void fraction are illustrated in Figure 8. Moreover, void fractions of 0, 10, 20, 30, 40, 50, 60, 70, 80, 90 and 100 percentage were also considered in the simulation in the annular flow, as shown in Figure 9. Additionally, the fluid component was divided into 17,832 3D tetrahedral fundamentals using FEM. The voltage and electric field dispersions of the FEM simulation results are illustrated in Figure 10. The results of the simulations are presented in Table 2.

3.2. Validation of Simulations

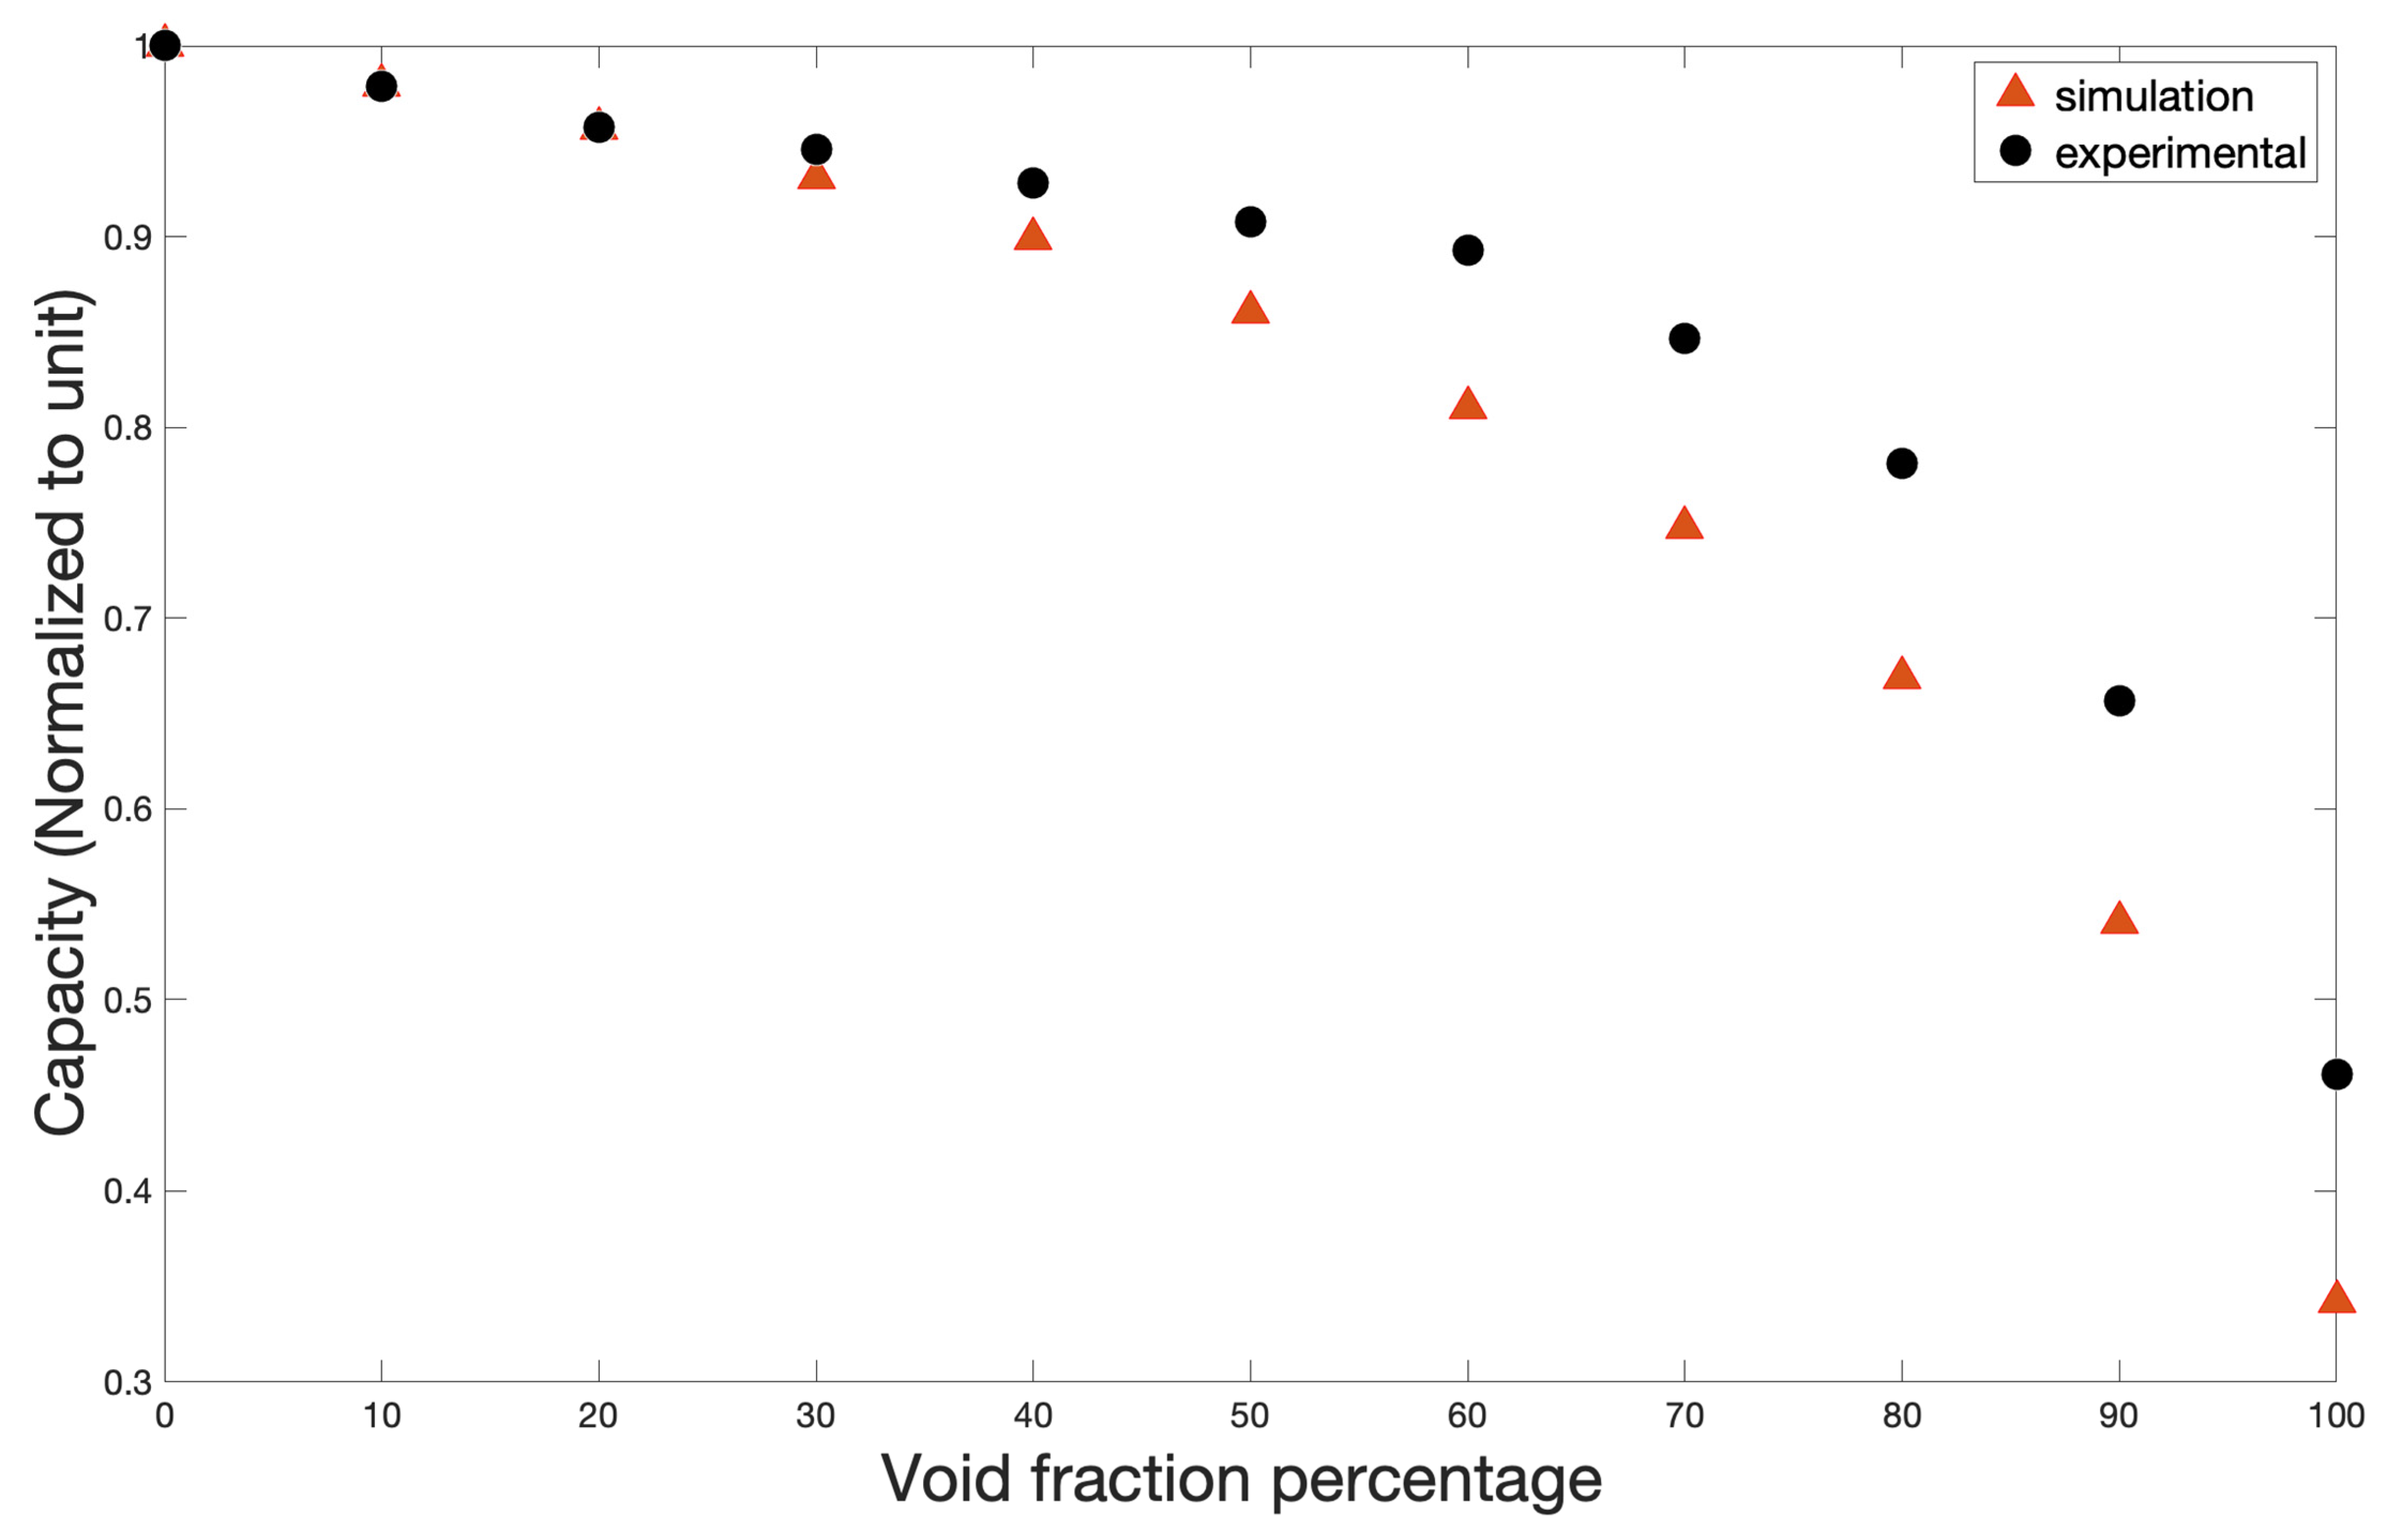
The test frequency range of the used LCR meter was between 50 Hz–200 kHz, and the appropriate frequency to measure the sensor capacitance is approximately 1 MHz. However, to compare the relative behavior of experimental and simulation values, both results were normalized to unity. Normalized capacitance was determined in Equation (3) as follows:
Normalized   capacitance   = M e a s u r e d   o u t p u t   o f   s e n s o r   M a x i m u m   o u t p u t   o f   s e n s o r  
The simulation was validated based on the similarity and coinciding trend of the experimental and simulated data for the annular flow. The low difference between the simulation and experiments is shown in Figure 11. As a result, COMSOL Multiphysics could efficiently simulate any flow regimes and void fractions, avoiding the problems caused by the experimental conditions.

4. Artificial Neural Network

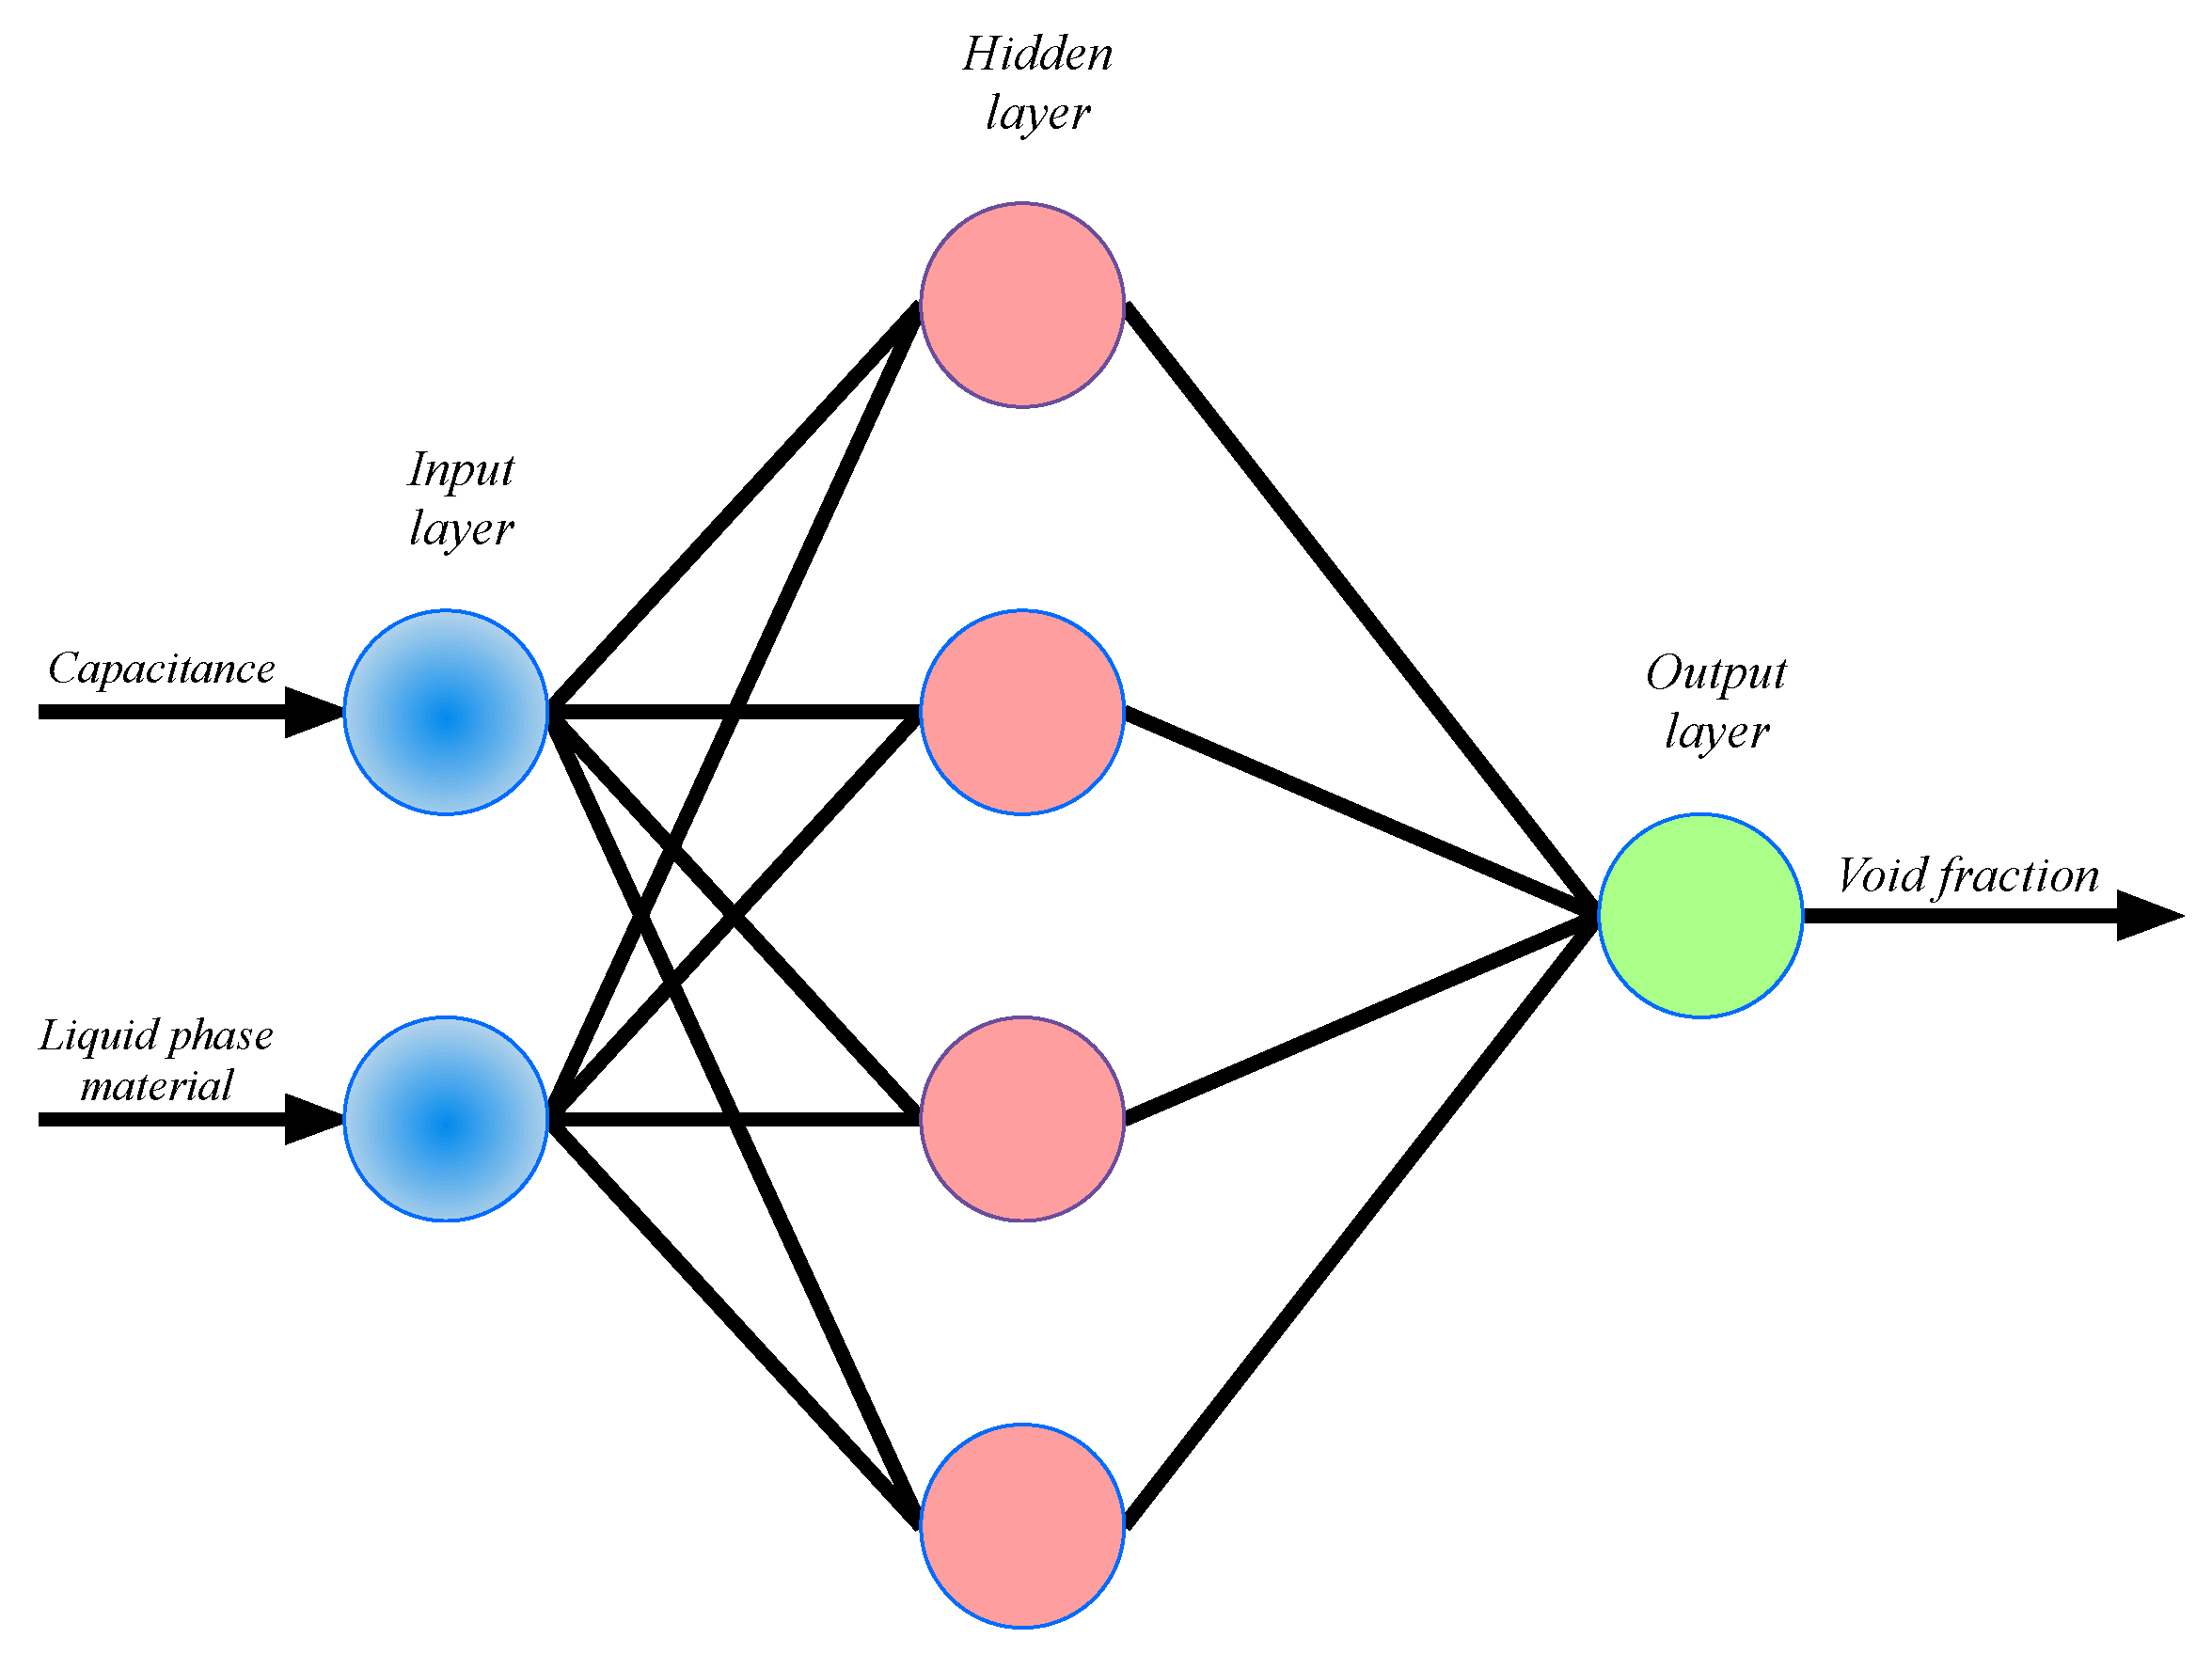
ANNs are mathematical systems made up of simple processing elements called neurons that run parallel and can be generated as one or more layers [31]. Classification and prediction are two significant applications of ANNs. The most common ANNs are multi-layer perceptron (MLP) networks [32]. The primary attribute of this method is the ability to learn by utilizing accurate data. This model can predict behaviors and patterns using a limited number of precise data, known as the MLP’s “training set” [33]. In addition, the testing set is specified in order to evaluate the network’s accuracy and precision. The network has never encountered these data before. Figure 12 illustrates the presented MLP model with the capacitance of the sensor and liquid phase material as inputs and the void fraction percentages as outputs. The main characteristic of this technique is the ability to learn through validated simulated data. The data set for training the network was created using the validated simulation values.
There were 38 (70%) and 17 (30%) samples for the training and testing data, respectively which were selected randomly. According to a prior publication [34], a presented algorithm was used to evaluate various architectures, and the best one was chosen. Actually, the best structure was chosen after testing various layers, epochs, activation functions and the number of neurons in each layer. The number of neurons in the input layer, hidden layer and output layer of the optimal structure was 2, 4 and 1, respectively. There were 375 epochs in total. The activation functions of the neurons in the input layer, hidden layer and output layer were purelin, tansig and purelin, respectively, and Levenberg–Marquardt was the training method [35,36,37,38,39].

5. Results and Discussion

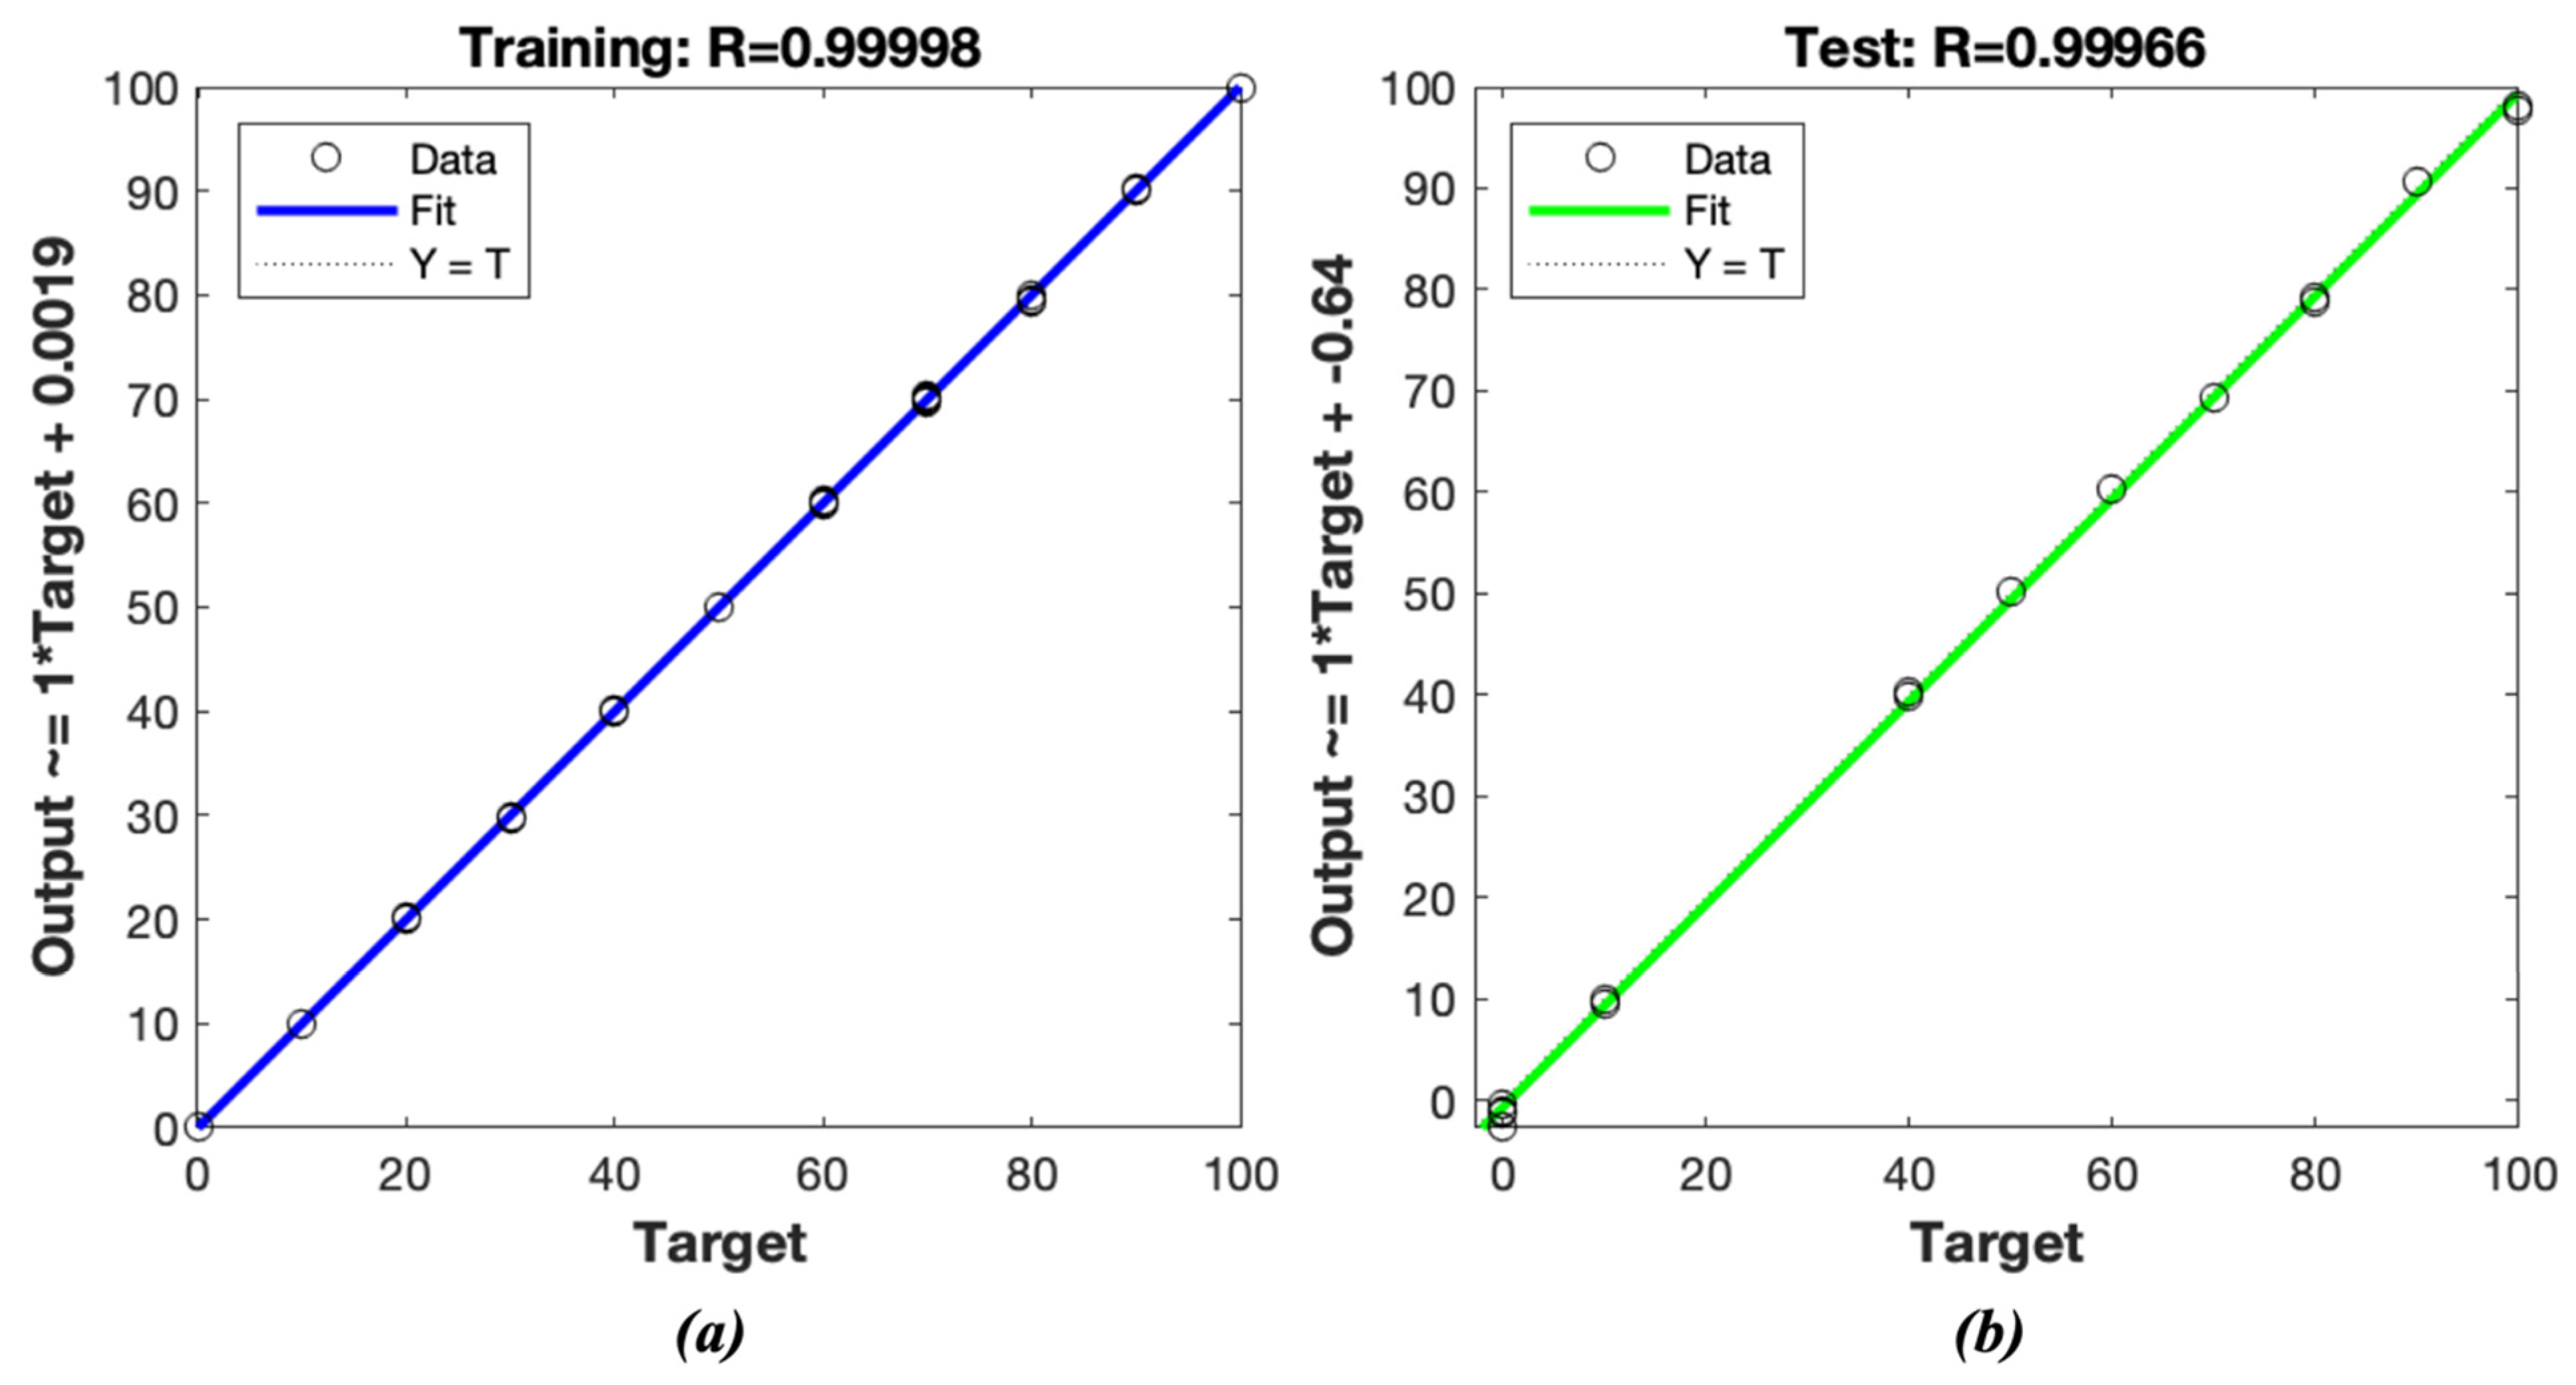
Figure 13 depicts the regression diagrams for the actual data defined in the simulations and the estimated data using the provided MLP-LM model. The targets (desired responses) and outputs (network responses) of this graph demonstrate that the suggested MLP model’s projected values closely match the simulated data with the least degree of error. Regression is a statistical method for determining how strongly two variables are correlated. Equations (4) and (5) calculate the mean relative error percentage (MRE%) and mean absolute error (MAE) of the proposed MLP model, where N is the number of observations, and X (Sim) and X (Pred) represent simulated (COMSOL Multiphysics) and predicted (MLP) values, respectively.
M R E % = 100 × 1 N i = 1 N | x i ( S i m ) x i ( P r e d ) x i ( S i m ) |
M A E = 1 N i = 1 z | x i ( S i m ) x i ( P r e d ) |
In the training set, the MAE and MRE% of the void fractions are 1.2888 and 0.2644%, respectively; for the testing set, these errors for the void fractions are 1.5349 and 0.2013%, respectively. Using the novel proposed metering system, the void fraction of every annular two-phase flow with different liquids can be measured precisely. The presented metering system is simple to use and inexpensive. This metering system with a concave capacitance-based sensor and usage of soft-computing methods could be used in various industries.
In order to combat over-fitting and under-fitting, the accessible data are separated into two categories: training data and test data. The training data includes the information seen by the neural network and is used to create the model. After the neural network has been trained, its performance may be assessed using the test data. As long as the neural network responds appropriately to these two data sets, the proposed network will be safe from over-fitting problems, as shown in Figure 13b, and under-fitting problems, as shown in Figure 13a,b.

6. Conclusions

In this research, we validated an annular water–air, two-phase flow simulation using experimental data. FEM simulations using COMSOL Multiphysics and experimental investigations for concave electrode shape were done to compare the results. The experimental apparatus was designed for two-phase, water–air flow in a vertical tube. Annular water–air simulated models were validated by measurements. Several phantoms for every void fraction were constructed. In fact, the simulations were validated by the low relative error between the simulations and experiments. An ANN model was used in order to predict the void fractions in two-phase flows with different petroleum product materials as a liquid phase in a pipeline. A validated simulation was used to simulate the liquid–gas, two-phase flows with crude oil, oil, deasil fuel, gasoline and water in an annular regime condition. The ANN model was developed in MATLAB 9.12.0.188 using an MLP neural network. The capacitance value of the sensor and the liquid phase material was the MLP model’s inputs, and the output was the void fraction for every material. The MAE of this novel proposed system was 1.53. It can measure the void fraction for different liquid materials with high precision.

Author Contributions

Conceptualization, A.V., M.H.S., G.H.R., E.E.-Z. and E.N.; methodology, A.V., M.H.S. and G.H.R.; software, A.V. and M.H.S.; data curation, A.V. and M.H.S.; writing—original draft preparation, A.V., M.H.S., E.E.-Z., G.H.R. and E.N.; writing—review and editing, A.V., M.H.S., E.E.-Z., G.H.R. and E.N.; investigation, A.V. and M.H.S.; visualization, A.V. and M.H.S.; supervision, G.H.R., E.N. and E.E.-Z.; resource, G.H.R.; validation, A.V. and M.H.S.; funding acquisition, G.H.R. and E.E.-Z. All authors have read and agreed to the published version of the manuscript.

Funding

The authors acknowledge the support from the BMBF project “BMBF-Projekt 05P21SJFA2” Verbundprojekt 05P2021 (ErUM-FSP T05). The authors also acknowledge the support from the German Research Foundation and the Open Access Publication Fund of the Thueringer Universitaets-und Landesbibliothek Jena Projekt-Nr. 433052568.

Data Availability Statement

Not applicable.

Conflicts of Interest

The authors declare no conflict of interest.

References

  1. Huang, G.; Ji, H.; Huang, Z.; Wang, B.; Li, H. Flow regime identification of mini-pipe gas-liquid two-phase flow based on textural feature series. In Proceedings of the 2011 IEEE International Instrumentation and Measurement Technology Conference, Hangzhou, China, 10–12 May 2011; pp. 1–4. [Google Scholar]
  2. Hewitt, G.F. Developments in multiphase metering. In Proceedings of the Conference on Developments in Production Separation Systems, London, UK, 4 March 1993. [Google Scholar]
  3. Thorn, R.; Johansen, G.; Hammer, E. Recent developments in three-phase flow measurement. Meas. Sci. Technol. 1997, 8, 691–701. [Google Scholar] [CrossRef]
  4. Ismail, I.; Gamio, J.; Bukhari, S.A.; Yang, W. Tomography for multi-phase flow measurement in the oil industry. Flow Meas. Instrum. 2005, 16, 145–155. [Google Scholar] [CrossRef]
  5. Wang, D.; Liang, F.C.; Peng, Z.Q.; Wang, Y.G.; Lin, Z.H. Gas-liquid two-phase flow measurements by full stream batch sampling. Int. J. Multiph. Flow 2012, 40, 113–125. [Google Scholar] [CrossRef]
  6. Yang, H.; Kim, D.; Kim, M. Void fraction measurement using impedance method. Flow Meas. Instrum. 2003, 14, 151–160. [Google Scholar] [CrossRef]
  7. Lowe, D.; Rezkallah, K.S. A capacitance sensor for the characterization of microgravity two-phase liquid-gas flows. Meas. Sci. Technol. 1999, 10, 965–975. [Google Scholar] [CrossRef]
  8. Özgü, M.R.; Chen, J.C.; Eberhardt, N. A capacitance method for measurement of film thickness in two-phase flow. Rev. Sci. Instrum. 1973, 44, 1714–1716. [Google Scholar] [CrossRef]
  9. Reinecke, N.; Mewes, D. Recent developments and industrial/research applications of capacitance tomography. Meas. Sci. Technol. 1996, 7, 233–246. [Google Scholar] [CrossRef]
  10. Geraets, J.; Borst, J. A capacitance sensor for two-phase void fraction measurement and flow pattern identification. Int. J. Multiph. Flow 1988, 14, 305–320. [Google Scholar] [CrossRef]
  11. Strizzolo, C.N.; Converti, J. Capacitance sensors for measurement of phase volume fraction in two-phase pipelines. IEEE Trans. Instrum. Meas. 1993, 42, 726–729. [Google Scholar] [CrossRef]
  12. Yang, W.; Peng, L. Image reconstruction algorithms for electrical capacitance tomography. Meas. Sci. Technol. 2002, 14, R1–R13. [Google Scholar] [CrossRef]
  13. Olmos, A.M.; Carvajal, M.; Morales, D.; García, A.; Palma, A. Development of an electrical capacitance tomography system using four rotating electrodes. Sens. Actuators A Phys. 2008, 148, 366–375. [Google Scholar] [CrossRef]
  14. dos Reis, E.; Goldstein, L., Jr. A non-intrusive probe for bubble profile and velocity measurement in horizontal slug flows. Flow Meas. Instrum. 2005, 16, 229–239. [Google Scholar] [CrossRef]
  15. Dyakowski, T.; Edwards, R.; Xie, C.; Williams, R.A. Application of capacitance tomography to gas-solid flows. Chem. Eng. Sci. 1997, 52, 2099–2110. [Google Scholar] [CrossRef]
  16. Abouelwafa, M.S.A.; Kendall, E.J.M. The use of capacitance sensors for phase percentage determination in multiphase pipelines. IEEE Trans. Instrum. Meas. 1980, 29, 24–27. [Google Scholar] [CrossRef]
  17. Ahmed, H. Capacitance sensors for void-fraction measurements and flow-pattern identification in air–oil two-phase flow. IEEE Sens. J. 2006, 6, 1153–1163. [Google Scholar] [CrossRef]
  18. Demori, M.; Ferrari, V.; Strazza, D.; Poesio, P. A capacitive sensor system for the analysis of two-phase flows of oil and conductive water. Sens. Actuators A Phys. 2010, 163, 172–179. [Google Scholar] [CrossRef]
  19. Tollefsen, J.; Hammer, E.A. Capacitance sensor design for reducing errors in phase concentration measurements. Flow Meas. Instrum. 1998, 9, 25–32. [Google Scholar] [CrossRef]
  20. Salehi, S.M.; Karimi, H.; Dastranj, A.A. A capacitance sensor for gas/oil two-phase flow measurement: Exciting frequency analysis and static experiment. IEEE Sens. J. 2016, 17, 679–686. [Google Scholar] [CrossRef]
  21. Salehi, S.M.; Karimi, H.; Moosavi, R.; Dastranj, A.A. Different configurations of capacitance sensor for gas/oil two phase flow measurement: An experimental and numerical study. Exp. Therm. Fluid Sci. 2017, 82, 349–358. [Google Scholar] [CrossRef]
  22. Salehi, S.M.; Karimi, H.; Dastranj, A.A.; Moosavi, R. Twin rectangular fork-like capacitance sensor to flow regime identification in horizontal co-current gas–liquid two-phase flow. IEEE Sens. J. 2017, 17, 4834–4842. [Google Scholar] [CrossRef]
  23. Zych, M.; Petryka, L.; Kępński, J.; Hanus, R.; Bujak, T.; Puskarczyk, E. Radioisotope investigations of compound two-phase flows in an ope channel. Flow Meas. Instrum. 2014, 35, 11–15. [Google Scholar] [CrossRef]
  24. Chen, X.; Zheng, J.; Jiang, J.; Peng, H.; Luo, Y.; Zhang, L. Numerical Simulation and Experimental Study of a Multistage Multiphase Separation System. Separations 2022, 9, 405. [Google Scholar] [CrossRef]
  25. Rushd, S.; Gazder, U.; Qureshi, H.J.; Arifuzzaman, M. Advanced Machine Learning Applications to Viscous Oil-Water Multi-Phase Flow. Appl. Sci. 2022, 12, 4871. [Google Scholar] [CrossRef]
  26. Chala, G.T.; Negash, B.M. Artificial Neural Network and Regression Models for Predicting Intrusion of Non-Reacting Gases into Production Pipelines. Energies 2022, 15, 1725. [Google Scholar] [CrossRef]
  27. Ssebadduka, R.; Le, N.N.H.; Nguele, R.; Alade, O.; Sugai, Y. Artificial Neural Network Model Prediction of Bitumen/Light Oil Mixture Viscosity under Reservoir Temperature and Pressure Conditions as a Superior Alternative to Empirical Models. Energies 2021, 14, 8520. [Google Scholar] [CrossRef]
  28. Picha, T.; Papezova, S.; Picha, S. Evaluation of Relative Permittivity and Loss Factor of 3D Printing Materials for Use in RF Electronic Applications. Processes 2022, 10, 1881. [Google Scholar] [CrossRef]
  29. Kumbharkhane, A.; Puranik, S.; Mehrotra, S. Temperature dependent dielectric relaxation study of ethylene glycol-water mixtures. J. Solut. Chem. 1992, 21, 201–212. [Google Scholar] [CrossRef]
  30. Mukhlisin, M.; Saputra, A. Performance evaluation of volumetric water content and relative permittivity models. Sci. World J. 2013, 2013, 421762. [Google Scholar] [CrossRef] [Green Version]
  31. Roshani, G.; Feghhi, S.; Mahmoudi-Aznaveh, A.; Nazemi, E.; Adineh-Vand, A. Precise volume fraction prediction in oil–water–gas multiphase flows by means of gamma-ray attenuation and artificial neural networks using one detector. Measurement 2014, 51, 34–41. [Google Scholar] [CrossRef]
  32. Gallant, A.R.; White, H. On learning the derivatives of an unknown mapping with multilayer feedforward networks. Neural Netw. 1992, 5, 129–138. [Google Scholar] [CrossRef]
  33. Salgado, C.M.; Brandão, L.E.; Schirru, R.; Pereira, C.M.; da Silva, A.X.; Ramos, R. Prediction of volume fractions in three-phase flows using nuclear technique and artificial neural network. Appl. Radiat. Isot. 2009, 67, 1812–1818. [Google Scholar] [CrossRef]
  34. Roshani, G.H.; Roshani, S.; Nazemi, E.; Roshani, S. Online Measuring Density of Oil Products in Annular Regime of Gas-Liquid Two Phase Flows. Meas. J. Int. Meas. Confed. 2018, 129, 296–301. [Google Scholar] [CrossRef]
  35. Levenberg, K. A method for the solution of certain non-linear problems in least squares. Q. Appl. Math. 1944, 2, 164–168. [Google Scholar] [CrossRef] [Green Version]
  36. Marquardt, D.W. An algorithm for least-squares estimation of nonlinear parameters. J. Soc. Ind. Appl. Math. 1963, 11, 431–441. [Google Scholar] [CrossRef]
  37. Balubaid, M.; Sattari, M.A.; Taylan, O.; Bakhsh, A.A.; Nazemi, E. Applications of discrete wavelet transform for feature extraction to increase the accuracy of monitoring systems of liquid petroleum products. Mathematics 2021, 9, 3215. [Google Scholar] [CrossRef]
  38. Hosseini, S.; Taylan, O.; Abusurrah, M.; Akilan, T.; Nazemi, E.; Eftekhari-Zadeh, E.; Bano, F.; Roshani, G.H. Application of Wavelet Feature Extraction and Artificial Neural Networks for Improving the Performance of Gas–Liquid Two-Phase Flow Meters Used in Oil and Petrochemical Industries. Polymers 2021, 13, 3647. [Google Scholar] [CrossRef]
  39. Alamoudi, M.; Sattari, M.A.; Balubaid, M.; Eftekhari-Zadeh, E.; Nazemi, E.; Taylan, O.; Kalmoun, E.M. Application of Gamma Attenuation Technique and Artificial Intelligence to Detect Scale Thickness in Pipelines in Which Two-Phase Flows with Different Flow Regimes and Void Fractions Exist. Symmetry 2021, 13, 1198. [Google Scholar] [CrossRef]
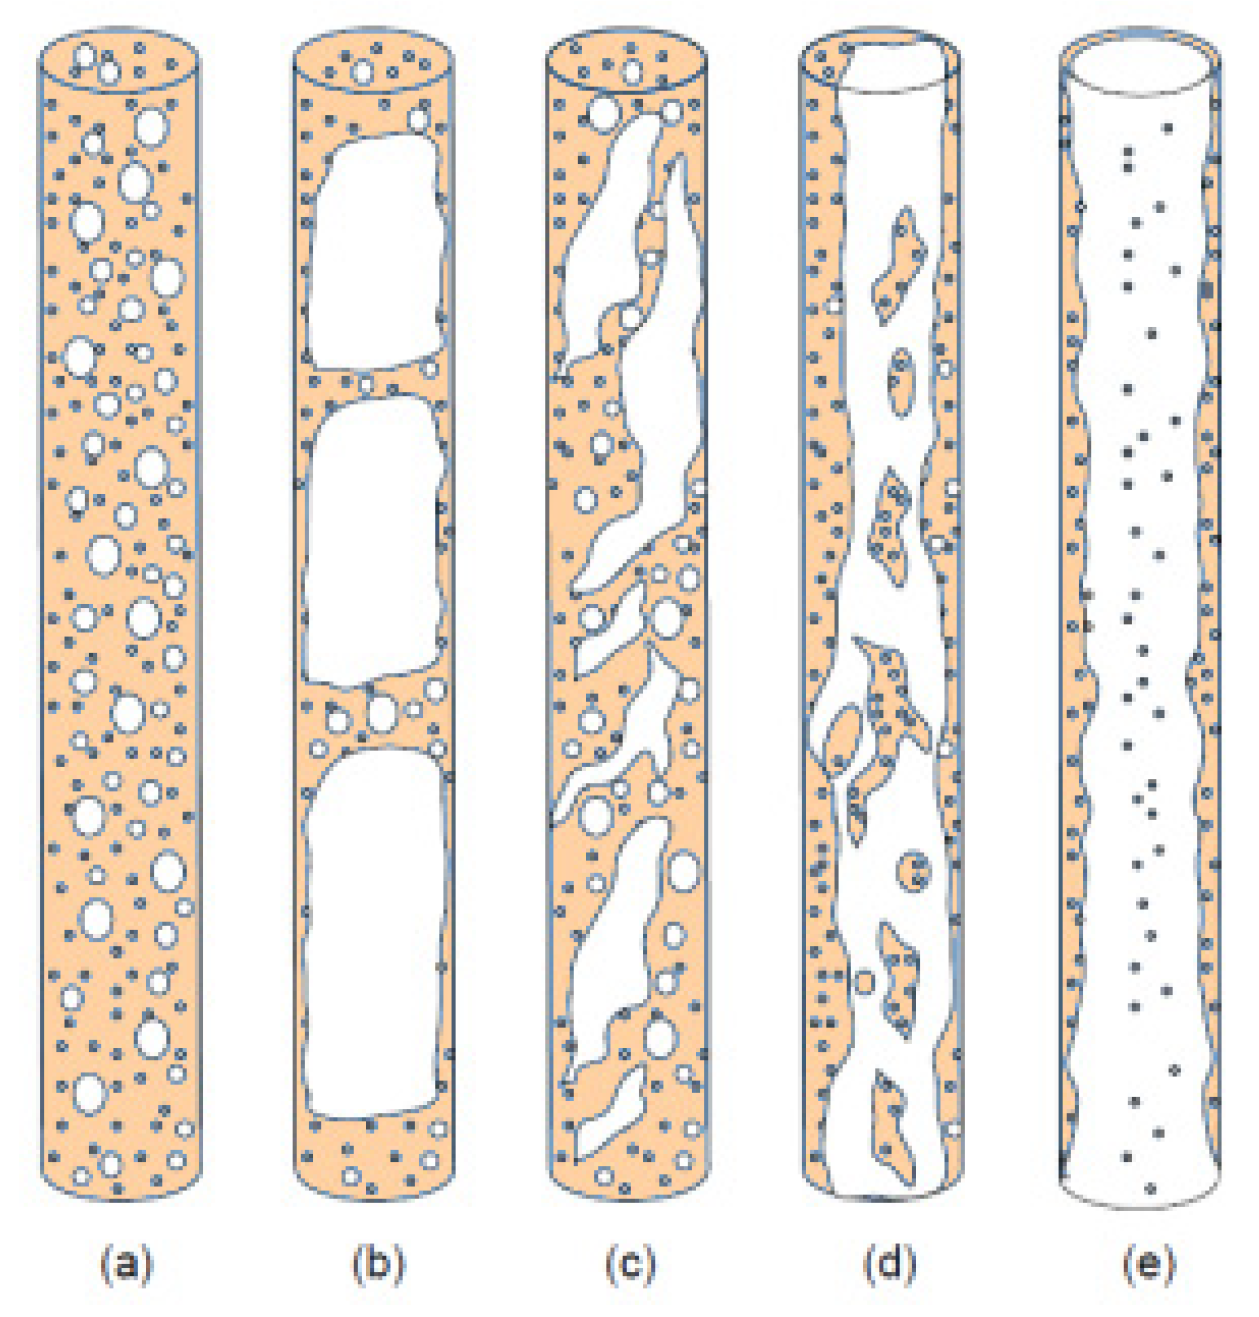
Figure 1. (a) Bubble flow, (b) Plug slug flow, (c) Foam flow, (d) Annular streak flow, (e) Annular flow.
Axioms 12 00066 g001
Figure 2. Schematic view of the modelled annular regime in two-phase flow.
Axioms 12 00066 g002
Figure 3. Constructed phantoms used for designing various void fractions.
Axioms 12 00066 g003
Figure 4. 3D printing of a pipe with a transparent PLA filament.
Axioms 12 00066 g004
Figure 5. Fabricated capacitance-based concave sensor.
Axioms 12 00066 g005
Figure 6. (a) Different void fractions generated by the phantoms. (b) Experimental setup.
Axioms 12 00066 g006aAxioms 12 00066 g006b
Figure 7. Cross-section diagram of the simulated capacitance-based sensor in the middle of the electrode.
Axioms 12 00066 g007
Figure 8. (a) 3-Dimensional view of the electrodes pattern. (b) Volumetric view the simulated setup. (c) Meshed model of the simulated structure.
Axioms 12 00066 g008
Figure 9. Void fractions from 0 to 100% simulated by COMSOL Multiphysics software.
Axioms 12 00066 g009
Figure 10. (a) Cross-section diagram of the voltage dispersion in the middle of the electrode. (b) Cross-section diagram of the electric field dispersion in the middle of the electrode. (c) Sketch of the electric field direction. (d) 3D view of the electric field.
Axioms 12 00066 g010
Figure 11. Comparison of the experimental data and the simulated data in a two-phase annular flow.
Axioms 12 00066 g011
Figure 12. Architecture of the proposed network in order to determine the void fractions.
Axioms 12 00066 g012
Figure 13. Regression diagrams of the predicted and simulated results for the void fractions: (a) training set and (b) testing set.
Axioms 12 00066 g013
Table 1. Measured results by the experimental setup for the concave sensor in the annular water–air regime.
Void Fraction (%)Measured Capacitance (pF)
10027.21
9044.73
8053.19
7057.65
6060.83
5061.80
4063.22
3064.38
2065.23
1066.65
068.11
Table 2. Simulation results calculated by COMSOL Multiphysics for the concave sensor in the annular water–air regime.
Void Fraction (%)Simulated Capacitance (pF)
10010.067
9015.317
8018.957
7021.178
6022.967
5024.391
4025.481
3026.389
2027.113
1027.749
028.341
Disclaimer/Publisher’s Note: The statements, opinions and data contained in all publications are solely those of the individual author(s) and contributor(s) and not of MDPI and/or the editor(s). MDPI and/or the editor(s) disclaim responsibility for any injury to people or property resulting from any ideas, methods, instructions or products referred to in the content.