Article

Preliminary Study of Geochemical, Mineralogical and Magnetic Susceptibility Properties of Flotation Tailings from the Pb-Zn-Cu-Ag Rudnik Mine, Serbia

1
University of Belgrade, Faculty of Mining and Geology, Đušina 7, 11000 Belgrade, Serbia
2
University of Belgrade, Institute for Multidisciplinary Research, Kneza Višeslava 1, 11030 Belgrade, Serbia
3
Institute for Technology of Nuclear and Other Mineral Raw Materials, Bulevar Franš d’Eperea 86, 11000 Belgrade, Serbia
4
Rudnik and Flotation Rudnik doo, Miše Mihajlovića 2, 32313 Rudnik, Serbia
*
Authors to whom correspondence should be addressed.
Minerals 2025, 15(12), 1287; https://doi.org/10.3390/min15121287
Submission received: 13 October 2025 / Revised: 2 December 2025 / Accepted: 5 December 2025 / Published: 7 December 2025

Abstract

Samples of flotation tailings generated during the exploitation and processing of Zn–Pb–Cu–Ag ore from the Rudnik mine (Serbia) were investigated for their mineralogical, geochemical, and magnetic susceptibility properties. The flotation tailings consist of a complex mineral assemblage, including silicates, carbonates, sulfides, phosphates, sulfates, oxides, hydroxides, and native elements. Quartz, calcite, and orthoclase dominate the coarse fraction (>400 µm), accompanied by epidote, Ca-garnet, and Ca-clinopyroxene. Sulfide minerals are concentrated in finer fractions (<400 µm), with pyrite and arsenopyrite being the most abundant, followed by pyrrhotite, sphalerite, galena, and chalcopyrite. These sulfides occur as dispersed grains within a silicate–carbonate matrix. Post-depositional oxidative alteration is moderately developed, with pyrite replaced by hematite, galena by cerussite, and chalcopyrite by malachite. Geochemical analyses reveal that SiO2 (avg. 38.98 wt%), Fe2O3 (avg. 23.68 wt%), Al2O3 (avg. 8.95 wt%), CaO (avg. 9.03 wt%) and MgO (avg. 1.50 wt%) dominate the composition. Economically significant metals include Zn (avg. 0.47 wt%), Pb (avg. 0.20 wt%), Cu (avg. 0.11 wt%), Ag (max. 19 µg/g), and Bi (max. 130 µg/g). Mass magnetic susceptibility shows a strong correlation with S (r = 0.92), Co (r = 0.90), and Bi (r = 0.87); moderate correlation with Fe2O3, Al2O3, and As; and negative correlation with Mn, TiO2, Zn, and Pb. The ferromagnetic phase most likely originates from pyrrhotite, as well as hematite formed during pyrite alteration and goethite.

Graphical Abstract

1. Introduction

Mine tailings are increasingly recognized as a potential source of mineral raw materials in response to increasing metal demand and the need for sustainable resource management. Their characterization and the recovery of valuable components have become an important aspect of contemporary resource and environmental policies [1]. Mine tailings often contain significant amounts of metals that could not be recovered with the technologies available at the time of mining, were not economically viable, or were not analyzed—or could not be analyzed—at that time. In Serbia, tailings generated from polymetallic Pb–Zn mines are the second largest source of waste in the metal mining sector, due to an annual ore production of approximately 500 thousand tonnes [2]. Despite their potential as secondary sources of metals, tailings from polymetallic deposits in Serbia have received limited scientific attention [3,4]. Until recently, only flotation tailings from the Grot mine had been the subject of preliminary investigation [5]. More recent studies have examined flotation tailings from the Rudnik mine, including mineralogical and environmental assessments [6] and the flotation behavior of minerals [7,8,9].
The Rudnik mine, situated in central Serbia, is one of the most prominent and long-standing polymetallic mining sites. It hosts economically significant concentrations of Pb, Zn, Cu, and Ag, and has been continuously exploited since 1953, with a total of more than 14 million tonnes of ore extracted to date [10]. The mine exploits a distal skarn deposit formed during Oligocene to Early Miocene magmatic-hydrothermal activity, consistent with other deposits associated with volcano-intrusive complexes in the Balkan Peninsula [11,12,13]. Sulfide ore is predominantly hosted within epidote-bearing skarn and occurs as massive bodies, stockwork veinlets, and disseminated mineralization. The main sulfide minerals include sphalerite, galena, and chalcopyrite, with pyrrhotite, arsenopyrite, and pyrite as common gangue phases. Metal concentrations in ore vary considerably, ranging from 0.94 to 5.66 wt% Pb, 0.49 to 4.49 wt% Zn, 0.08 to 2.18 wt% Cu, and 50 to 297 µg/g Ag [14].
Decades of mining and flotation processing of polymetallic ore have resulted in a tailings storage facility covering ~30 ha, with over 11 million tonnes (7 million m3) of material deposited to date (Figure 1a,b). These flotation tailings, representing the residual fraction after the beneficiation of PbS, ZnS, and CuFeS2 concentrates, has evolved from initially supporting only Pb and Zn recovery to including Cu concentrates since 1988. Their mineralogical composition and heterogeneity position them simultaneously as a potential secondary resource and as a factor influencing long-term environmental impact. Consequently, the tailings storage facility represents both a challenge and an opportunity—requiring proper management to mitigate ecological risks while offering scope for revalorization through modern processing technologies. In this context, characterization becomes essential for advancing sustainable resource management and circular economy strategies.
The present study provides the first comprehensive dataset on the mineralogical, geochemical, and magnetic susceptibility properties of flotation tailings samples from the Rudnik mine, thereby strengthening the knowledge base required for sustainable management and the potential valorization of tailings as secondary raw material sources in the future.

2. Materials and Methods

2.1. Sampling

Samples were obtained from three vertical trenches excavated within the tailings body, which occupies the bed of a former dry creek (Figure 1a). In total, 16 samples were collected (Table 1). Trench T1 was sampled at 0.5 m intervals, whereas trenches T2 and T3 were sampled at 1 m intervals to evaluate vertical heterogeneity within the flotation tailings. Mineralogical and geochemical analyses, as well as magnetic susceptibility, were carried out for each depth interval. This approach enables the assessment of vertical variations in composition.

2.2. Granulometrical Analysis

Granulometric analysis was performed on two composite samples. The first composite (TC1) was prepared from 50 g of individual samples consisting of brown material and mixture of grey and brown material (samples T1.5, T1.6, T1.7, T7.8, T2.11, T3.15), while the second composite (TC2) was prepared from the same weight of grey material (samples T1.1, T1.2, T1.3, T1.4, T2.9, T2.10, T2.12, T3.13, T3.14, T3.16). Both composite samples were homogenized and analyzed.
The grain-size distribution of the two composite samples was determined by dry sieving in the laboratory. The homogenized material was separated into nine fractions: F1 = 0–0.045 mm, F2 = 0.045–0.063 mm, F3 = 0.063–0.09 mm, F4 = 0.09–0.125 mm, F5 = 0.125–0.25 mm, F6 = 0.25–0.5 mm, F7 = 0.5–0.71 mm, F8 = 0.71–1 mm, and F9 = 1–2 mm.

2.3. X-Ray Diffraction (XRD)

X-ray diffraction analyses were performed on a “PHILIPS” X-ray diffractometer, model PW-1710 (Malvern Panalytical, Malvern, UK), with a curved graphite monochromator and a scintillation counter. The intensities of diffracted CuKα X-rays (λ = 1.54178 Å) were measured at room temperature in intervals of 0.02°2θ and a time of 1 s in the range from 4 to 65°2θ. The X-ray tube was operated at a voltage of 40 kV and a current of 30 mA, while the slits for directing the primary and diffracted beams were set to 1 mm and 0.1 mm, respectively.

2.4. Optical and Scanning Electron Microscopy with Energy Dispersive Spectroscopy (SEM-EDS)

Optical analyses were performed at the University of Belgrade, Faculty of Mining and Geology, using a Zeiss Axio Imager 2 reflected light microscope, and at the Institute for Technology of Nuclear and Other Mineral Raw Materials (ITNMS), using a Carl Zeiss-Jena JENAPOL-U polarizing microscope for both reflected and transmitted light. Samples were subsequently examined with a scanning electron microscope (SEM, JSM-6610LV, JEOL Inc., Tokyo, Japan) operated at 20 kV. Mineral identification was supported by energy-dispersive X-ray spectrometry (EDS, Xplore 30, Oxford Instruments, Abingdon, UK), with a detection limit of approximately 0.1 wt% based on internal standards. Backscattered electron (BSE) micrographs were used to evaluate mineral homogeneity and identify potential zoning features.

2.5. X-Ray Fluorescence (XRF)

The chemical composition analyses of the selected samples were performed using the SPECTRO Xepos C energy dispersive X-ray fluorescence (ED-XRF) spectrometer, with an air-cooled X-ray tube with a thick Pd/Co binary alloy anode operating at 50 kV voltage and at tube power of 50 W. The analyses were conducted on 5 grams of unfused, fine-grained powder samples.

2.6. Fourier-Transform Infrared Spectroscopy (FTIR)

The FTIR spectra of the fine-grained powder materials were recorded using a Perkin Elmer Spectrum Two equipped with the Universal ATR accessory. The spectrum of each powder sample was recorded in the mid-infrared range 1600–400 cm−1 with 20 scans and a spectral resolution of 4 cm−1.

2.7. Inductively Coupled Plasma Optical Emission Spectrometry (ICP-OES)

Selected elements (Ca, Mg, Cu, Pb, Zn, Co, Ni, Mn, Cr, Ba, As, Bi, and Ag) were analyzed with a PERKIN-ELMER AVIO 200 ICP-OES, which uses a vertical plasma engineered to handle even the most difficult, high-matrix samples without dilution. A full-wavelength field detector simultaneously measured spectral ranges around the lines of interest. Sample digestion and preparation were carried out using an acid mixture (HNO3:HCl = 3:1). The detection limit of the AVIO 200 ICP-OES is in the µg/L (ppb) range, typically 0.1–100 µg/L depending on the element. The procedure for preparation of a calibration curve included 5 values depending on the range of concentration that is expected. Standard reference material OREAS 135 [16] was used for quality control.

2.8. Laboratory Measurement of Magnetic Susceptibility (MS)

Magnetic susceptibility was measured at room temperature (~20 °C) under a low magnetic field of 400 A/m using an MFK-1A Kappabridge (AGICO Instruments, Brno, Czech Republic) with a sensitivity of 2 × 10⁻⁸ SI. Volume magnetic susceptibility was determined on dry samples of fixed volume (20 cm3). Sample mass was measured with a Radwag AS 220 R2 Plus analytical balance, accurate to four decimal places, to calculate mass magnetic susceptibility. Each sample was measured five times, and the mean value was used for further analysis. Before measurements, the magnetic susceptibility of the plastic bag and instrument holder was determined and used to correct the final values.

3. Results

3.1. Grain Size Distribution

Grain size analysis of composite samples TC1 and TC2 revealed that both samples have a similar distribution, with slightly over 90% of the material being finer than 0.5 mm (Table 2 and Figure 2). The main difference is that the brownish colored material contains approximately twice the amount of the <0.063 mm fraction.

3.2. Mineralogy

3.2.1. X-Ray Diffraction (XRD)

X-ray diffraction (XRD) analysis of flotation tailings samples reveals a consistent and complex mineral assemblage predominantly composed of silicate, carbonate, sulfate, and sulfide minerals (Figure 3, Table 3). Quartz and calcite are the most abundant phases across all samples. Sulfide minerals, including pyrite, sphalerite, chalcopyrite, galena, pyrrhotite, and arsenopyrite, are also present. Accessory minerals such as chlorite, dolomite, and gypsum were also identified, and minor diffraction peaks indicate the presence of additional gangue minerals, including kaolinite or related clays, plagioclase, orthoclase, muscovite, anatase, and goethite.

3.2.2. FTIR Analysis

The Fourier transform infrared spectroscopy (FTIR) was used for profiling the mine tailings samples’ components. The component identification based on characteristic band vibrations in the fingerprint region of 1600–400 cm−1 is shown in Figure 4. In the fingerprint region, the most intensive broad complex band in the 1100–950 cm−1 range is assigned to the in-plane Si–O–Si stretching vibration in silicates. The bands at ca 1163, 1086 (shoulder), doublet 799 and 778, are assigned to stretching and banding vibrations in quartz. The strong and wide band at 1440–1420 cm−1 is assigned to carbonates. Specifically, bands 876 and 712 cm−1 are assigned to calcite. The intensities of quartz and carbonate bands suggest that those minerals are the most abundant, which is consistent with optical and XRD investigations. In addition, the bands belonging to feldspar and sulfates are also observed, the latter consistent with the gypsum identified by XRD.

3.2.3. Optical and Scanning Electron Microscopy with Energy Dispersive Spectroscopy (SEM-EDS)

Optical and SEM-EDS analyses support the XRD results and provide additional insight into the textural and spatial relationships among the identified minerals (Table S1 in Supplementary Materials). The tailings comprise a heterogeneous mixture of sulfides, native elements, and secondary oxidation products, embedded within a matrix dominated by silicates and carbonates (Figure 5a). According to optical examination, most grains range in size from 100 to 300 µm. Sulfides and their alteration products often appear as finer particles (<100 µm), with occasional larger grains, whereas silicates and carbonates typically form coarser particles (>400 µm).
Quartz is the most abundant, occurring as large, homogeneous and euhedral grains. It is commonly associated with sulfide minerals, particularly pyrite and sphalerite, where it occurs in interstitial spaces relative to the sulfides (Figure 5a,b).
Calcite, epidote, garnet, and orthoclase are also common, most frequently occurring as dispersed grains of various sizes (Figure 5a,b). Ca-pyroxenes, represented by diopside-hedenbergite, occur as subhedral to euhedral grains, although they are present only in minor quantities. Apatite and zircon appear as small, very rare, and dispersed grains.
Pyrite and arsenopyrite represent the most abundant sulfide minerals within the tailings, predominantly occurring as isolated grains and, to a lesser extent, as intergrowths with silicate phases (Figure 5c). Pyrite grains display considerable size variability, commonly reaching coarse dimensions of up to 400 µm. These grains are homogeneous, with rare inclusions of chalcopyrite and galena, which appear as droplet-shaped inclusions up to 40 µm in length. Partial to complete oxidation of pyrite is frequent, with hematite frequently present as a secondary alteration mineral (Figure 5a,b). Arsenopyrite occurs as isolated, homogeneous, and unaltered grains of sizes comparable to pyrite (Figure 5c).
Pyrrhotite is less abundant relative to pyrite and arsenopyrite and often associated with galena, sphalerite, and chalcopyrite (Figure 5d). It occasionally contains flame- or vein-like pentlandite exsolutions less than 5 µm in length.
Among economically significant sulfides, sphalerite is the most prevalent. It occurs as individual grains that host chalcopyrite inclusions ranging from 10 to 40 µm and, less frequently, as co-occurrence with other minerals, especially sulfides such as galena and chalcopyrite (Figure 5e). Sphalerite grains range from below 50 µm to 500 µm in size.
Galena is commonly observed in complex intergrowths with sphalerite, chalcopyrite, and various silicate, oxide, and carbonate minerals, while isolated grains are subordinate. Its grain size ranges from 50 to 250 µm. Sometimes, galena is associated with native bismuth, native silver, and bismite (Figure 5f,g). Secondary alteration along some grain boundaries is evidenced by the occurrence of cerussite (Figure 5h).
Chalcopyrite forms fine impregnations within sphalerite or as small inclusions and co-occurrence with pyrrhotite and sphalerite (Figure 5d,e). Grain sizes range from submicron to 100 µm. The chalcopyrite is rarely altered, although minor malachite coatings have been present on some grain surfaces.

3.3. Geochemistry

The most abundant oxide in all samples is SiO2 (33.81–44.30 wt%; Table 4; Figure 6), followed by Fe2O3 (19.02–28.74 wt%), Al2O3 (7.69–10.57 wt%), CaO (4.49–12.88 wt%) and MgO (1.24–1.91 wt%). Sulfur (S) contents vary widely (2.20–12.30 wt%). Among the metals, Zn shows the highest enrichment (0.21–0.79 wt%), followed by Pb (0.14–0.32 wt%) and Cu (0.05–0.17 wt%). Manganese (Mn) is present in moderate amounts (0.104–0.189 wt%), whereas Cr is consistently low (≤0.036 wt%). Arsenic (As) displays a broad range (0.012–0.732 wt%). Nickel (Ni) (0.011–0.023 wt%) and Co (0.003–0.007 wt%) contents remain consistently low. Bismuth (Bi) is present in trace but potentially significant amounts (0.002–0.013 wt%), while Ag content is lower (6 to 19 µg/g).
Pearson correlation analysis is performed to assess the relationships among oxides, elements, and magnetic susceptibility (MS) (Figure 7).
Strong positive correlations (r ≥ 0.7) are between SiO2 and Al2O3 (r = 0.87). Al2O3 is also positively correlated with Ni (r = 0.71), while Fe2O3 shows strong positive correlations with Cu (r = 0.82), Bi (r = 0.87), and Co (r = 0.79). Sulfur (S) is strongly correlated with Co (r = 0.97) and Bi (r = 0.91), while with Cu and Ag (r = 0.81), as well as Zn and Mn (r = 0.79), also show strong positive correlations. Ni is strongly correlated with As (r = 0.89), and Bi with Co (r = 0.97). Ag is positively correlated with Cr (r = 0.77) and Zn (r = 0.71).
Moderate positive correlations (0.4 ≤ r < 0.7) are between SiO2 and Ni (r = 0.61) and As (r = 0.55), Al2O3 and S (r = 0.50) and As (r = 0.63), Fe2O3 and S (r = 0.71) and Cr (r = 0.55), S and Cu (r = 0.53) and Cr (r = 0.45), Cu and Pb (r = 0.61) and Co (r = 0.62), Ni and SiO2 (r = 0.61) and Al2O3 (r = 0.71), Co and Cr (r = 0.49), Cr and Cu (r = 0.64) and Fe2O3 (r = 0.55), Ag and Pb (r = 0.54) and Mn (r = 0.43).
Strong negative correlations (r ≤ −0.7) are between SiO2 and Zn (r = −0.86) and Pb (r = −0.76), Al2O3 and Zn (r = −0.88), Mn and Al2O3 (r = −0.82) and Ni (r = −0.76), and Zn and Ni (r = −0.69).
Moderate negative correlations (−0.7 < r ≤ −0.4) are between TiO2 and Fe2O3 (r = −0.55), S (r = −0.63), Co (r = −0.61), and Cu (r = −0.46), S and Mn (r = −0.64), Cu and Al2O3 (r = −0.33), as well as Ag and SiO2 (r = −0.51), TiO2 (r = −0.50), and Al2O3 (r = −0.530).

3.4. Magnetic Susceptibility

Mass magnetic susceptibility (MS) values of the flotation tailings show considerable variability, ranging from 0.687 × 10⁻⁶ m3·kg−1 to 4.724 × 10⁻⁶ m3·kg−1, with an average of 2.201 × 10⁻⁶ m3·kg−1 (Table 4). The highest MS values were recorded in samples T3.13 and T3.14, whereas the lowest were observed in T2.10 and T2.11. This variability reflects differences in geochemical and mineralogical composition, particularly the abundance of iron-rich ferromagnetic minerals (in general), which show an affinity toward specific metals (Figure 6).
Correlation analysis was performed using MS and bulk geochemical data for all analyzed tailings samples (Figure 7). Strong positive correlations were identified between MS and S (r = 0.92), Co (r = 0.90), Bi (r = 0.87), and Ag (r = 0.87). Moderate positive correlations with MS were observed for Fe2O3 (r = 0.62), As (r = 0.57), Cr (r = 0.48), Al2O3 (r = 0.50), Cu (r = 0.45), and Ni (r = 0.45). Moderate negative correlations were recorded for Mn (r = −0.60) and TiO2 (r = −0.58), while Zn exhibited only a weak negative correlation with MS (r = −0.31). These trends are consistent with sample-level observations; for instance, T3.13 and T3.14, which show the highest MS values, also display elevated concentrations of S and Co, reflecting the strong positive correlations identified. No elements show strong negative correlations with MS (r ≤ −0.7).

4. Discussion

The polymetallic ore from the Rudnik mine is characterized by complex co-occurrence of gangue and ore minerals, which can adversely influence ore processing efficiency [18,19]. In the analyzed flotation tailings samples, no significant variations in the distribution of mineral phases were observed. The major minerals—calcite, quartz, and K-feldspar—were consistently present, accompanied by epidote, Ca-garnet, and Ca-pyroxene, which reflects the skarn-type mineralogy of the primary ore [13,20]. These minerals were commonly associated with sulfides, which were either embedded within or dispersed throughout a predominantly silicate–carbonate matrix. Among the sulfides, pyrite, arsenopyrite, and pyrrhotite are dominant, followed by sphalerite, galena, and chalcopyrite.
Post-depositional oxidative alteration is most pronounced near the surface, where atmospheric exposure promotes the oxidation of sulfides. Similar alteration features are also observed at several depths within the tailings, mainly in material that was previously exposed at the surface and later buried by younger tailing material. Pyrite is particularly susceptible, frequently replaced by hematite along grain boundaries or via pseudomorphosis, illustrating natural weathering processes [21]. Galena and chalcopyrite are likewise transformed, forming cerussite and malachite, respectively, whereas other sulfides remain relatively unaltered, resulting in heterogeneous oxidation patterns throughout the tailings. Compared with nearby sites, oxidation in the Rudnik flotation tailings appears relatively limited [22].
The geochemical data corroborate these mineralogical and petrographic observations. Elevated SiO2 and Al2O3 contents confirm the prevalence of silicate and aluminosilicate minerals (Table 2), while increased Fe2O3 and S concentrations in the upper part of T3 indicate a significant abundance of iron sulfides such as pyrite and pyrrhotite. Sulfur concentrations vary considerably (2.20–12.30 wt%), reflecting vertical heterogeneity in sulfide distribution (Table 4; Figure 6). Base metal contents—Zn (up to 0.79 wt%), Pb (up to 0.32 wt%), and Cu (up to 0.17 wt%)—provide further evidence of inefficiencies in historical ore processing. Although present at low concentrations, trace elements such as Ag and Bi may still hold economic significance for potential future recovery.
The sulfur content along the vertical profile of the trenches T2 and T3 indicates a decrease with depth, reflecting the progressive decomposition of sulfide minerals over time (i.e., with depth) and the migration of liberated sulfur as sulfate via pore waters within the tailings body.
Correlation analysis provides further insights into the geochemical controls of the tailings. The strong positive correlation between SiO2 and Al2O3 (r = 0.87) is typical of aluminosilicate minerals (feldspars), which, together with quartz, dominate the gangue matrix. Conversely, strong positive correlations between Fe2O3 and Cu, Bi, and Co, as well as between S and Co and Bi, highlight the controlling role of sulfide phases—chiefly pyrite, pyrrhotite, and arsenopyrite—in the geochemical behavior of these elements [23]. Correlations such as Cu–Ag, Zn–Mn, and Ni–As further reflect well-documented mineralogical linkages, including chalcopyrite with Ag, sphalerite with Mn, and arsenopyrite with Ni and As [24,25]. The very strong correlation between Bi and Co (r = 0.97) suggests a close association within Fe-sulfide phases, with possible implications for the recovery of critical metals [26]. Negative correlations between SiO2/Al2O3 and Zn/Pb highlight the contrast between the silicate–carbonate matrix, which is poor in metals, and the sulfide phases, which serve as the primary hosts of base metals. Similarly, negative correlations between Mn and Al2O3/Ni indicate that Mn is linked to carbonate and oxide minerals, whereas Ni is predominantly controlled by the presence of sulfides.
Magnetic susceptibility (MS) data further support the observed geochemical and mineralogical patterns in the analyzed samples. Pyrrhotite is strongly ferromagnetic, in contrast to pyrite and arsenopyrite, which are diamagnetic to weakly paramagnetic; this explains why pyrrhotite is the only mineral capable of generating high MS values in the flotation tailings material. Accordingly, Fe-sulfide–rich samples (e.g., T3.13 and T3.14) display the highest recorded MS values, consistent with their elevated sulfur contents (12.3% and 10.90%, respectively), confirming that the abundance of pyrrhotite exerts primary control over the magnetic response. Pyrrhotite is the main carrier of the magnetic signal, while its alteration products—hematite and goethite—may provide a secondary but measurable contribution [27]. In contrast, samples dominated by the silicate–carbonate matrix show markedly lower MS values, as minerals such as quartz, calcite, and K-feldspar have negligible or zero susceptibility and therefore diminish the overall magnetic signal. Overall, MS patterns are consistent with the mineralogical assemblage and demonstrate that variations in mineral distribution—particularly the proportion of pyrrhotite relative to non-magnetic gangue minerals—govern the magnetic properties of the flotation tailings.
The relatively low metal concentrations and the complex intergranular associations of the sulfide minerals indicate that economically viable metallurgical processing of the tailings is limited. In contrast, the high abundance of other minerals (quartz, calcite and orthoclase) and their fine grain size (~90% smaller than 0.5 mm) suggests the potential use of the tailings as low-value aggregates in the construction industry. This approach enables material valorization despite the low metal content and provides a sustainable solution for tailings management.

5. Conclusions

The flotation tailings of the Rudnik mine exhibit mineralogical and geochemical characteristics that reflect the complexity of the processed primary ore, the efficiency of mineral liberation and phase selectivity during flotation, as well as post-depositional alterations, including sulfide oxidation and the formation of secondary minerals. Key findings include the following:
  • Complex mineral associations and microtextural intergrowths of rock-forming minerals with sulfides hinder efficient flotation of the primary ore.
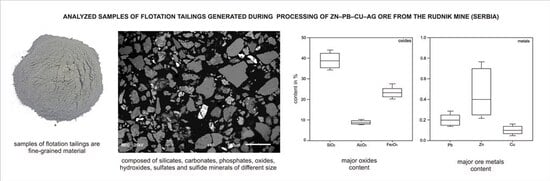
  • Flotation tailings are dominated by quartz, calcite, orthoclase and accompanied by Ca-garnets, Ca-pyroxenes and epidote. Economically valuable sulfides—sphalerite, galena, and chalcopyrite—are mostly present in fractions finer than 400 µm (mostly below 100 µm) and occur as dispersed grains within a silicate–carbonate matrix. Post-depositional oxidation is moderately developed; pyrite is often replaced by hematite, galena by cerussite, and chalcopyrite by malachite, while other sulfides remain relatively unaltered.
  • High SiO2 and Al2O3 contents confirm the dominance of silicate and aluminosilicate minerals, whereas elevated Fe2O3 and S reflect the presence of iron sulfides. Zn, Pb, and Cu concentrations are below 1%, while minor elements such as Ag and Bi, although present at low levels, may hold future economic potential.
  • Mass magnetic susceptibility data support the mineralogical observations: samples with higher Fe2O3 and S show elevated susceptibility, whereas samples with lower Fe2O3 exhibit reduced susceptibility, consistent with XRD and SEM-EDS analyses.
  • Given the relatively low metal concentrations and the complex intergranular associations of the minerals, the most realistic immediate valorization pathway is the use of the tailings as low-value construction aggregates. Future research will include various mineral processing techniques for further characterization and evaluation of the tailings. Selective pre-treatment for trace-metal recovery could also be investigated as a secondary option following detailed characterization and a technical–economic assessment.

Supplementary Materials

The following supporting information can be downloaded at: https://www.mdpi.com/article/10.3390/min15121287/s1, Representative SEM-EDS spectra of the minerals; Table S1: Chemical composition of mineral phases measured with SEM-EDS method and presented in oxides wt% normalized; Table S2: Chemical composition of mineral phases measured with SEM-EDS method in wt% normalized.

Author Contributions

Conceptualization, S.P., V.S. and D.Ž.; methodology, N.N., J.S., V.C., J.M. and Lj.O.; validation, V.S. and D.Ž.; formal analysis, N.N., J.S., V.C. and Lj.O.; writing—original draft preparation, S.P. and V.S.; writing—review and editing, V.C., D.Ž. and N.N.; project administration, V.S. All authors have read and agreed to the published version of the manuscript.

Funding

This research was funded by the Science Fund of the Republic of Serbia, GRANT 7522—REASONING and the Ministry of Science, Technological Development and Innovation of the Republic of Serbia (Grant numbers: 451-03-136/2025-03/200126; 451-03-136/2025-03/200053; 451-03-136/2025-03/200023).

Data Availability Statement

All data generated or analyzed during this study are included in this published article and are available upon request from the corresponding author.

Acknowledgments

The permission to take samples and the determination of selected trace elements by the “Rudnik i flotacija Rudnik” Company is gratefully acknowledged.

Conflicts of Interest

Author Ljiljana Obrenović was employed by the company Rudnik and flotation Rudnik doo. The remaining authors declare that the research was conducted in the absence of any commercial or financial relationships that could be construed as a potential conflict of interest.

References

  1. European Commission. Mining Waste; European Commission—Environment. Available online: https://environment.ec.europa.eu/topics/waste-and-recycling/mining-waste_en#law (accessed on 20 September 2025).
  2. Gavrilovic, D. Statistical Yearbook of the Republic of Serbia; Statistical Office of the Republic of Serbia: Belgrade, Serbia, 2024; 446p. [Google Scholar]
  3. Steiner, T.M.C.; Bertrandsson Erlandsson, V.; Šajn, R.; Melcher, F. Preliminary chemical and mineralogical characterization of tailings from base metal sulfide deposits in Serbia and North Macedonia. Geol. Croat. 2022, 75, 291–302. [Google Scholar] [CrossRef]
  4. Šajn, R.; Ristović, I.; Čeplak, B. Mining and metallurgical waste as potential secondary sources of metals—A case study for the West Balkan region. Minerals 2022, 12, 547. [Google Scholar] [CrossRef]
  5. Djokić, B.V.; Jović, V.; Jovanović, M.; Ćirić, A.; Jovanović, D. Geochemical behaviour of some heavy metals of the Grot flotation tailing, Southeast Serbia. Environ. Earth Sci. 2012, 66, 933–939. [Google Scholar] [CrossRef]
  6. Abramović, F.; Cvetkov, V.; Ilić, A.; Životić, D. Korelacija magnetnog susceptibiliteta i sadržaja metala u flotacijskom jalovištu. In Proceedings of the 18. Kongres Geologa Srbije “Geologija Rešava Probleme”, Divčibare, Serbia, 1–4 June 2022; pp. 23–24. [Google Scholar]
  7. Lazić, P.; Nikšić, Đ.; Miković, B.; Tomanec, R. Copper minerals flotation in flotation plant of the “Rudnik” mine. Podzemni Rad. 2019, 35, 23–35. [Google Scholar] [CrossRef]
  8. Lazić, P.; Nikšić, D.; Tomanec, R.; Vučinić, D.; Cvetičanin, L. Chalcopyrite floatability in flotation plant of the Rudnik mine. J. Min. Sci. 2020, 56, 119–125. [Google Scholar] [CrossRef]
  9. Nikšić, D.; Lazić, P.; Kostović, M. Flotability of chalcopyrite from the Rudnik deposit. J. Min. Sci. 2021, 57, 523–530. [Google Scholar] [CrossRef]
  10. Popović, R.; Umeljić, G. Metallogeny of the Rudnik Mountain, Position in Time and Space; Rudnik doo: Belgrade, Serbia, 2015; p. 224. [Google Scholar]
  11. Cvetković, V.; Šarić, K.; Pécskay, Z.; Gerdes, A. The Rudnik Mts. volcano-intrusive complex (central Serbia): An example of how magmatism controls metallogeny. Geol. Croat. 2016, 69, 89–99. [Google Scholar] [CrossRef]
  12. Hoerler, J.; Von Quadt, A.; Burkhard, R.; Peytcheva, I.; Cvetković, V.; Baker, T. The Karavansalija mineralized center at the Rogozna Mountains in SW Serbia: Magma evolution and time relationship of intrusive events and skarn Au±Cu–Pb–Zn mineralization. Front. Earth Sci. 2022, 9, 798701. [Google Scholar] [CrossRef]
  13. Petrović, S.; Bakker, R.J.; Cvetković, V.; Jelenković, R. Multiphase evolution of fluids in the Rudnik hydrothermal-skarn deposit (Serbia): New constraints from study of quartz-hosted fluid inclusions. Mineral. Petrol. 2024, 118, 461–482. [Google Scholar] [CrossRef]
  14. Stojanović, J.; Radosavljević-Mihajlović, A.; Radosavljević, S.; Vuković, N.; Pačevski, A. Mineralogy and genetic characteristics of the Rudnik Pb-Zn/Cu, Ag, Bi, W polymetallic deposit (Central Serbia)—New occurrence of Pb (Ag) Bi sulfosalts. Period. Mineral. 2016, 85, 121–135. [Google Scholar]
  15. Google. Google Maps. Available online: https://www.google.com/maps (accessed on 29 September 2025).
  16. OREAS 135. Available online: https://www.oreas.com/crm/oreas-135/ (accessed on 18 November 2025).
  17. Whitney, D.L.; Evans, B.W. Abbreviations for names of rock-forming minerals. Am. Mineral. 2010, 95, 185–187. [Google Scholar] [CrossRef]
  18. Fuerstenau, D.W.; Phatak, P.B.; Kapur, P.C.; Abouzeid, A.Z. Simulation of the grinding of coarse/fine (heterogeneous) systems in a ball mill. Int. J. Miner. Process. 2011, 99, 32–38. [Google Scholar] [CrossRef]
  19. Little, L.; Mainza, A.N.; Becker, M.; Wiese, J.G. Using mineralogical and particle shape analysis to investigate enhanced mineral liberation through phase boundary fracture. Powder Technol. 2016, 301, 794–804. [Google Scholar] [CrossRef]
  20. Stojanović, J.N.; Radosavljević, S.A.; Tošović, R.D.; Pačevski, A.M.; Radosavljević-Mihajlović, A.S.; Kašić, V.D.; Vuković, N.S. A review of the Pb-Zn-Cu-Ag-Bi-W polymetallic ore from the Rudnik orefield, Central Serbia. Geol. Anal. Balk. Poluostrva 2018, 79, 47–69. [Google Scholar] [CrossRef]
  21. Garcia, C.; Ballester, A.; Gonzalez, F.; Blázquez, M.L. Pyrite behaviour in a tailings pond. Hydrometallurgy 2005, 76, 25–36. [Google Scholar] [CrossRef]
  22. Zdravković, A.; Cvetković, V.; Pačevski, A.; Rosić, A.; Šarić, K.; Matović, V.; Erić, S. Products of oxidative dissolution on waste rock dumps at the Pb-Zn Rudnik mine in Serbia and their possible effects on the environment. J. Geochem. Explor. 2017, 181, 160–171. [Google Scholar] [CrossRef]
  23. Vaughan, D.J.; Corkhill, C.L. Mineralogy of sulfides. Elements 2017, 13, 81–87. [Google Scholar] [CrossRef]
  24. George, L.L.; Cook, N.J.; Ciobanu, C.L. Partitioning of trace elements in co-crystallized sphalerite–galena–chalcopyrite hydrothermal ores. Ore Geol. Rev. 2016, 77, 97–116. [Google Scholar] [CrossRef]
  25. George, L.L.; Cook, N.J.; Crowe, B.B.; Ciobanu, C.L. Trace elements in hydrothermal chalcopyrite. Mineral. Mag. 2018, 82, 59–88. [Google Scholar] [CrossRef]
  26. Godirilwe, L.L.; Gayratov, B.; Jeon, S.; Shibayama, A. Utilization of pyrite-rich tailings in sulfation roasting for efficient recovery of copper, nickel, and cobalt from smelter slag. In Proceedings of the 11th World Congress on Mechanical, Chemical, and Material Engineering (MCM 2025), Paris, France, 19–21 August 2025. [Google Scholar]
  27. Dunlop, D.J.; Özdemir, Ö. Rock Magnetism: Fundamentals and Frontiers; Cambridge University Press: Cambridge, UK, 1997. [Google Scholar]
Figure 1. (a) Satellite image of the Rudnik mine flotation tailings showing the positions of sampled trenches (T1, T2, T3), source: Google Maps [15]. (b) Location of the Rudnik flotation tailings in the Republic of Serbia, SE Europe. (c) Field photograph of the mine flotation tailings site. (d) Sample brown-colored flotation tailings. (e) Sample grey-colored flotation tailings.
Minerals 15 01287 g001
Figure 2. Diagram of grain size distribution of composite flotation tailings samples TC1 (a) and TC2 (b) from the Rudnik mine.
Minerals 15 01287 g002
Figure 3. Representative XRD diffractograms of flotation tailings samples from the Rudnik mine: (a) sample T1.5, (b) sample T2.10. Abbreviations [17]: Apy—arsenopyrite, Ccp—chalcopyrite, Gn—galena, Py—pyrite, Qz—quartz, Sp—sphalerite, Kfs—K-feldspar, Ant—anatase, Gp—gypsum, Chl—chlorite, Kln—kaolinite, Pl—plagioclase, Cal—calcite, CM—clay mineral, Px—pyroxene. ?—possible presence, but not confirmed.
Minerals 15 01287 g003
Figure 4. FTIR spectra in the fingerprint region (1600–400 cm−1) of flotation tailing from the Rudnik mine. Abbreviations [17]: Cal—calcite, Kfs—K-feldspar, Qz—quartz, Sulf—sulfates.
Minerals 15 01287 g004
Figure 5. Photomicrographs ((ad): reflected light; (eh): backscattered electron images) of tailings from the Rudnik mine. (a) Quartz and calcite grains associated with sulfides in the flotation tailings; (b) quartz grain associated with garnet, pyrite, epidote, and hematite; (c) pyrite and arsenopyrite grains; (d) Co-occurrence of pyrrhotite, chalcopyrite, and galena; (e) sphalerite grain with chalcopyrite inclusions; (f) pyrrhotite with galena hosting inclusions of native silver and native bismuth; (g) galena grain associated with native bismuth and bismite; (h) galena grain partly altered to cerussite along the rim. Abbreviations [17]: Ag—native silver; Apy—arsenopyrite; Bi—native bismuth; Bsm—bismite; Ccp—chalcopyrite; Crz—cerussite; Ep—epidote; Gn—galena; Grt—garnet; Hem—hematite; Or—orthoclase; Po—pyrrhotite; Py—pyrite; Qz—quartz; Sp—sphalerite.
Minerals 15 01287 g005
Figure 6. Distribution of major oxides, selected elements, and magnetic susceptibility (MS) in flotation tailings samples from the Rudnik mine.
Minerals 15 01287 g006
Figure 7. Correlation matrix of oxides, elements and magnetic susceptibility (MS) of flotation tailings samples from the Rudnik mine. The color bar on the right represents the values of the correlation coefficient (r) between pairs of variables (in this case, chemical elements, oxides and magnetic susceptibility).
Minerals 15 01287 g007
Table 1. Details of flotation tailings samples, including trench, sample designation, depth, and material description.
TrenchSamples IDDepth (m)Material Description
T1T1.10.0–0.5Grey material
T1.20.5–1.0
T1.31.0–1.5
T1.41.5–2.0
T1.52.0–2.5Brown material
T1.62.5–3.0
T1.73.0–3.5Grey material, interbedded with Brown
T1.83.5–4.0
T2T2.90.0–1.0Grey material
T2.101.0–2.0
T2.112.0–3.0Brown material
T2.123.0–4.0Grey material
T3T3.130.0–1.0Grey material
T3.141.0–2.0
T3.152.0–3.0Brown material
T3.163.0–4.0Grey material
Table 2. Grain size distribution of composite flotation tailings samples.
Sieve, mmTC1, %TC2, %
F9: 1.0–2.0100.0100.0
F8: 0.710–1.097.696.2
F7: 0.500–0.71097.094.5
F6: 0.250–0.50092.791.1
F5: 0.125–0.25076.476.3
F4: 0.090–0.12553.854.3
F3: 0.063–0.09032.031.6
F2: 0.045–0.06317.38.1
F1: <0.04510.65.1
Table 3. Mineral identification based on optical microscopy, SEM-EDS, and XRD analyses. Abundance categories are defined as follows: Major—minerals present as dominant phases in the samples (>25%); Moderate—minerals regularly observed in moderate quantities (5%–25%); Minor—minerals present in low quantities (1%–5%); Trace—minerals observed only sporadically or in specific samples (<1%).
GroupMineralConfirmation MethodRelative Abundance in the Samples
T1.1T1.2T1.3T1.4T1.5T1.6T1.7 T1.8T2.9T2.10T2.11T2.12T3.13T3.14T3.15T3.16
Silicates, phosphates,
carbonates, sulfates
Quartz XRD, Optical, SEM-EDS, FTIR
Calcite XRD, Optical, SEM-EDS, FTIR
Epidote SEM-EDS
Ca-garnet SEM-EDS
Orthoclase (K-feldspar)XRD, SEM-EDS, FTIR
Ca-clinopyroxeneSEM-EDS
ApatiteSEM-EDS
Zircon SEM-EDS
Gypsum XRD
ChloriteXRD
PlagioclaseXRD
Sulfides and native
elements
Pyrite XRD, Optical, SEM-EDS
Arsenopyrite XRD, Optical, SEM-EDS
Pyrrhotite XRD, Optical, SEM-EDS
Sphalerite XRD, Optical, SEM-EDS
Chalcopyrite XRD, Optical, SEM-EDS
GalenaXRD, Optical, SEM-EDS
Native bismuth Optical, SEM-EDS
Native silver Optical, SEM-EDS
Native copper Optical, SEM-EDS
Pentlandite Optical, SEM-EDS
Oxides and
hydroxides
(weathering
minerals)
Hematite Optical, SEM-EDS
Bismite Optical, SEM-EDS
Cerussite SEM-EDS
Malachite SEM-EDS
AnataseXRD
Goethite XRD, SEM-EDS
major moderate minor trace
Table 4. Major oxide, sulfur, and metal contents, and mass magnetic susceptibility (MS) in flotation tailings samples from the Rudnik mine (oxides and sulfur contents determined by XRF; metals contents by ICP-OES).
T1.1 T1.2T1.3T1.4T1.5T1.6T1.7T1.8 T2.9 T2.10T2.11T2.12T3.13 T3.14T3.15T3.16AVSD
SiO2 (%)44.3035.7435.1035.1034.4540.2343.0137.2443.8738.3133.8137.6641.7341.3043.2338.7338.993.60
TiO2 (%)0.550.500.450.480.520.530.480.520.470.520.530.470.370.450.630.520.500.06
Al2O3 (%)9.988.307.697.967.828.719.058.139.438.667.848.2210.1710.2410.579.268.880.96
Fe2O3 (%)21.3123.0222.5925.1725.8821.3123.3123.3119.0222.8825.4523.4528.7427.3121.0220.5923.402.58
CaO (%)9.4910.3012.549.6310.719.309.489.537.919.278.6512.884.495.117.567.629.032.23
MgO (%)1.681.461.361.341.461.431.431.411.691.831.331.331.241.461.911.711.500.20
S (%)2.202.243.285.054.542.943.994.254.223.112.662.9312.3010.904.163.494.522.90
Cu (%)0.0590.1000.1530.1370.1610.0850.0700.1440.0470.0690.1270.1030.1710.1390.0750.0490.1060.042
Pb (%)0.150.210.230.260.250.140.150.280.140.160.320.250.200.150.210.170.200.06
Zn (%)0.240.700.790.760.720.400.320.680.250.270.700.700.270.220.240.210.470.24
Co (%)0.0030.0030.0030.0040.0040.0030.0030.0040.0030.0030.0030.0030.0070.0070.0030.0030.0040.001
Ni (%)0.0160.0110.0130.0140.0140.0120.0120.0130.0230.0150.0120.0110.0180.0190.0180.0170.0150.003
Mn (%)0.1640.1610.1890.1800.1770.1500.1640.1640.1230.1450.1560.1880.1050.1040.1190.1320.1510.028
Cr (%)0.0180.0160.0210.0360.0360.0210.0220.0250.0190.0170.0150.0160.0270.0250.0170.0160.0220.007
Ba (%)0.0030.0020.0020.0010.0020.0010.0010.0010.0010.0010.0010.0010.0020.0020.0010.0010.0010.001
As (%)0.1320.0340.0390.0400.0350.0120.0140.0160.7320.2660.0650.0320.5410.5500.1950.1630.1790.228
Bi (%)0.0040.0040.0040.0060.0070.0030.0040.0050.0020.0030.0030.0040.0130.0120.0020.0020.0050.003
Ag (µg/g)8111619161112151181213141386123
MS [10−6 m3kg−1]1.4651.9971.5282.2302.7662.0342.4281.6732.3630.6871.2171.5024.6434.7241.9651.9912.2011.093
Disclaimer/Publisher’s Note: The statements, opinions and data contained in all publications are solely those of the individual author(s) and contributor(s) and not of MDPI and/or the editor(s). MDPI and/or the editor(s) disclaim responsibility for any injury to people or property resulting from any ideas, methods, instructions or products referred to in the content.

