Figure 1.
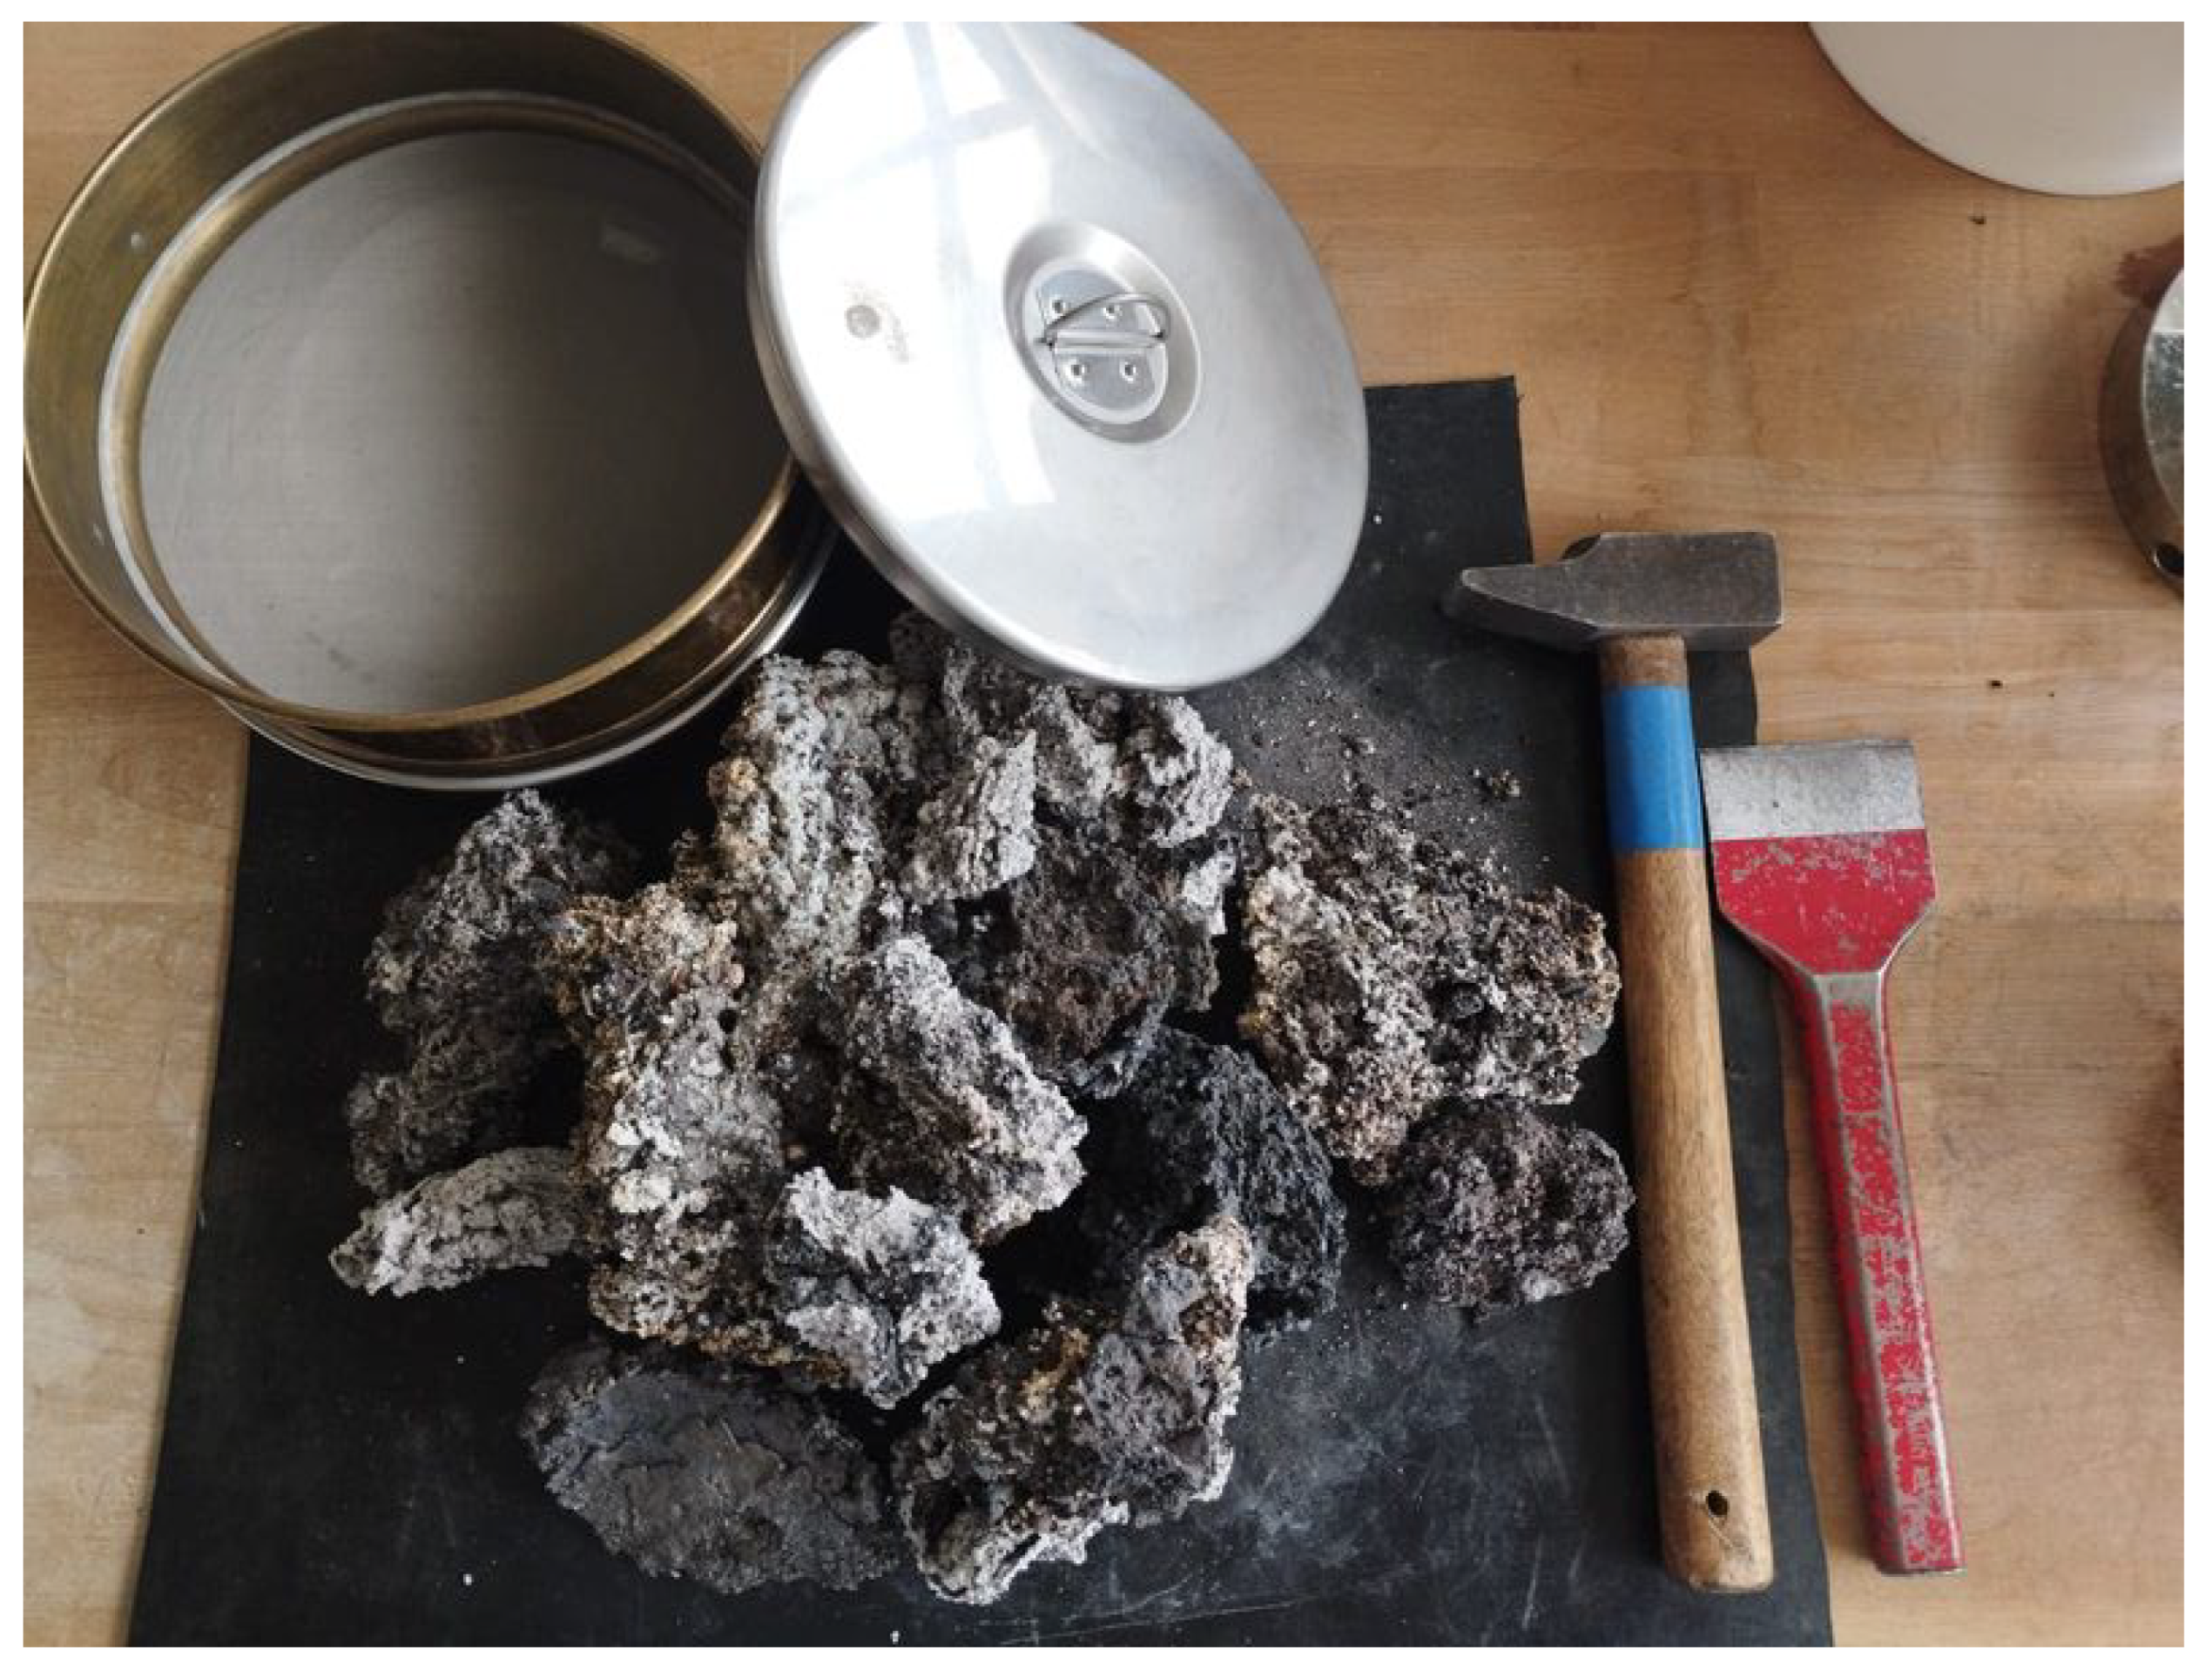
Coarse iron-rich slag feedstock prior to milling and sieving. The photograph shows irregularly shaped slag fragments exhibiting heterogeneous texture and color.
Figure 1.
Coarse iron-rich slag feedstock prior to milling and sieving. The photograph shows irregularly shaped slag fragments exhibiting heterogeneous texture and color.
Figure 2.
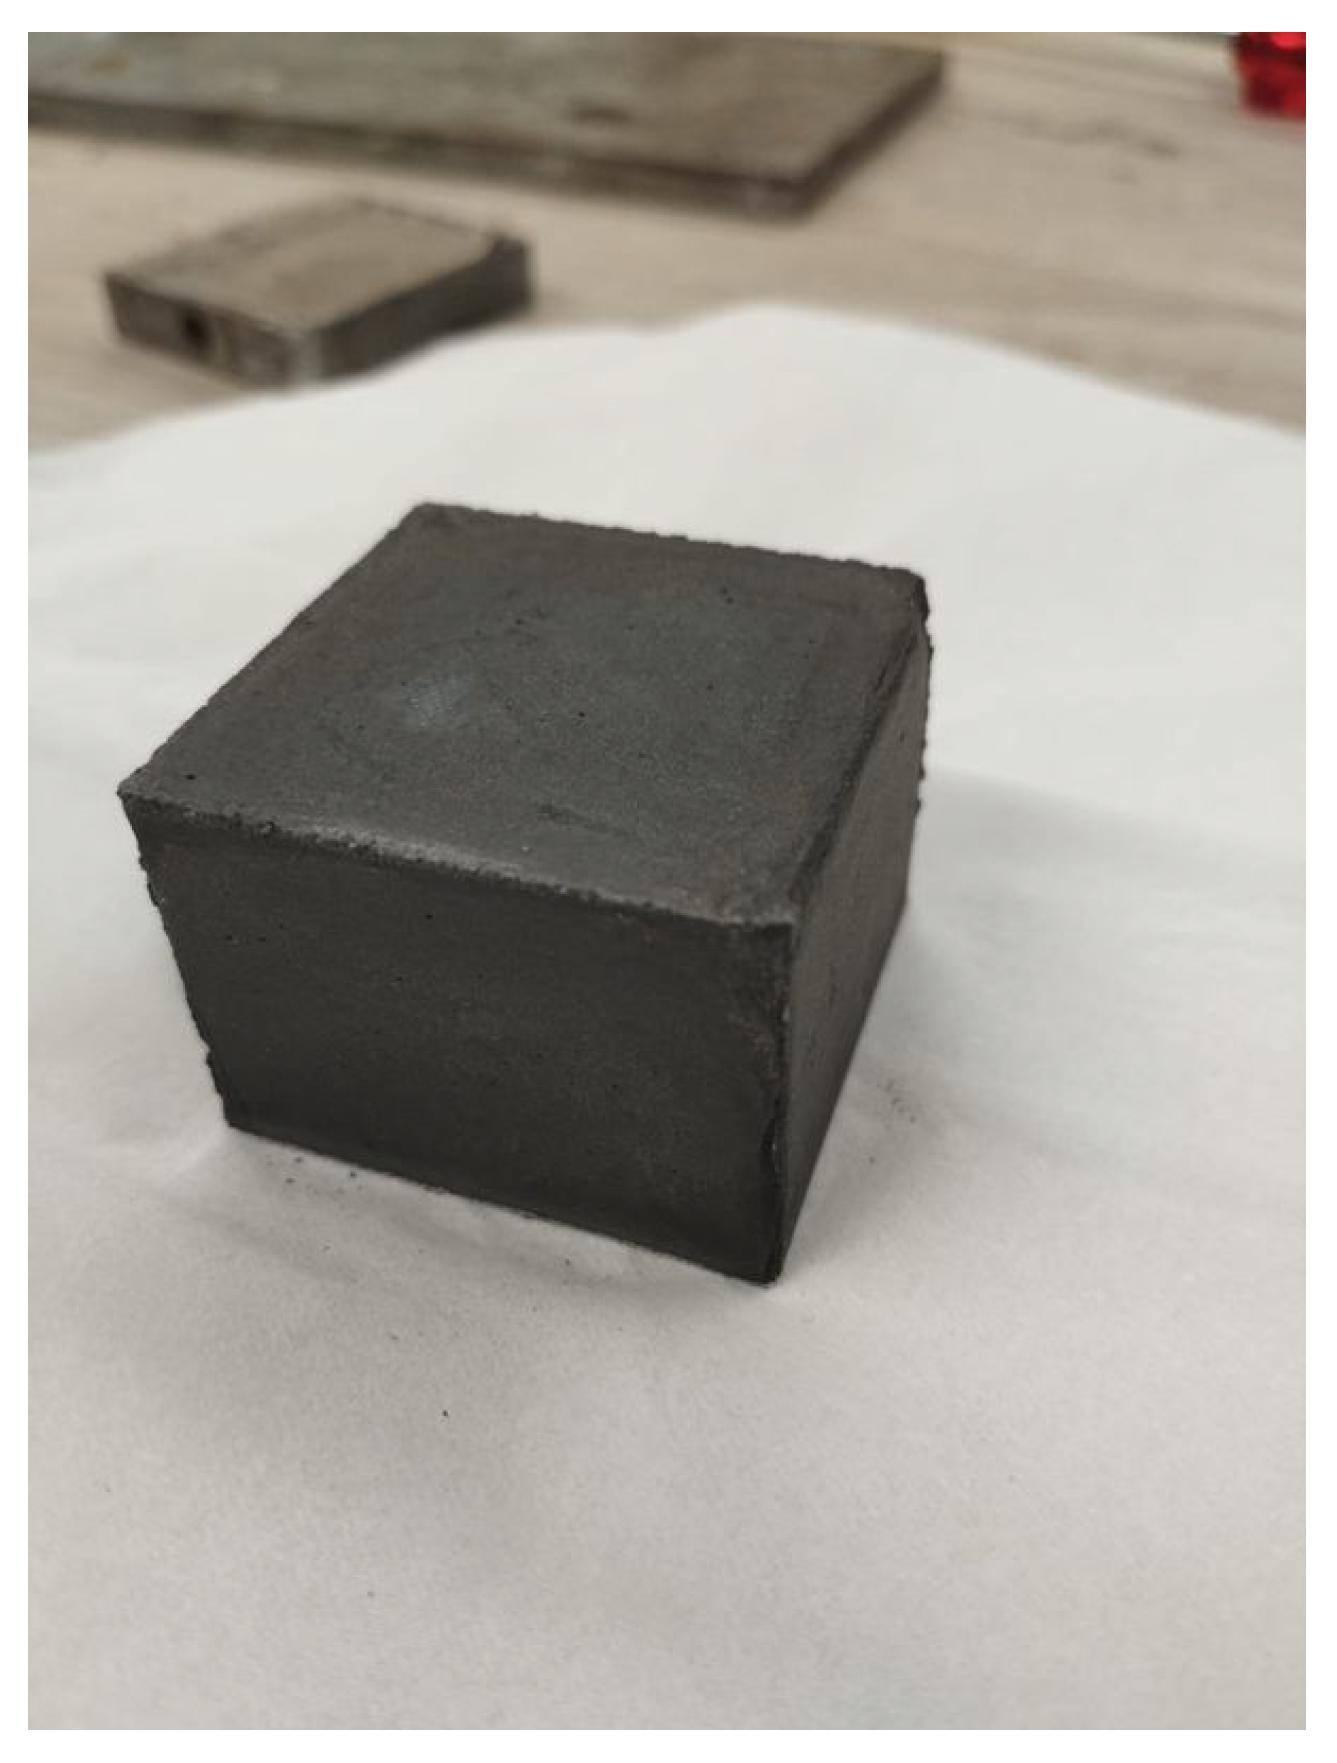
Demolded Aachen GP cubic specimen (40 × 40 × 40 mm) prior to curing used for compressive strength testing and other analysis.
Figure 2.
Demolded Aachen GP cubic specimen (40 × 40 × 40 mm) prior to curing used for compressive strength testing and other analysis.
Figure 3.
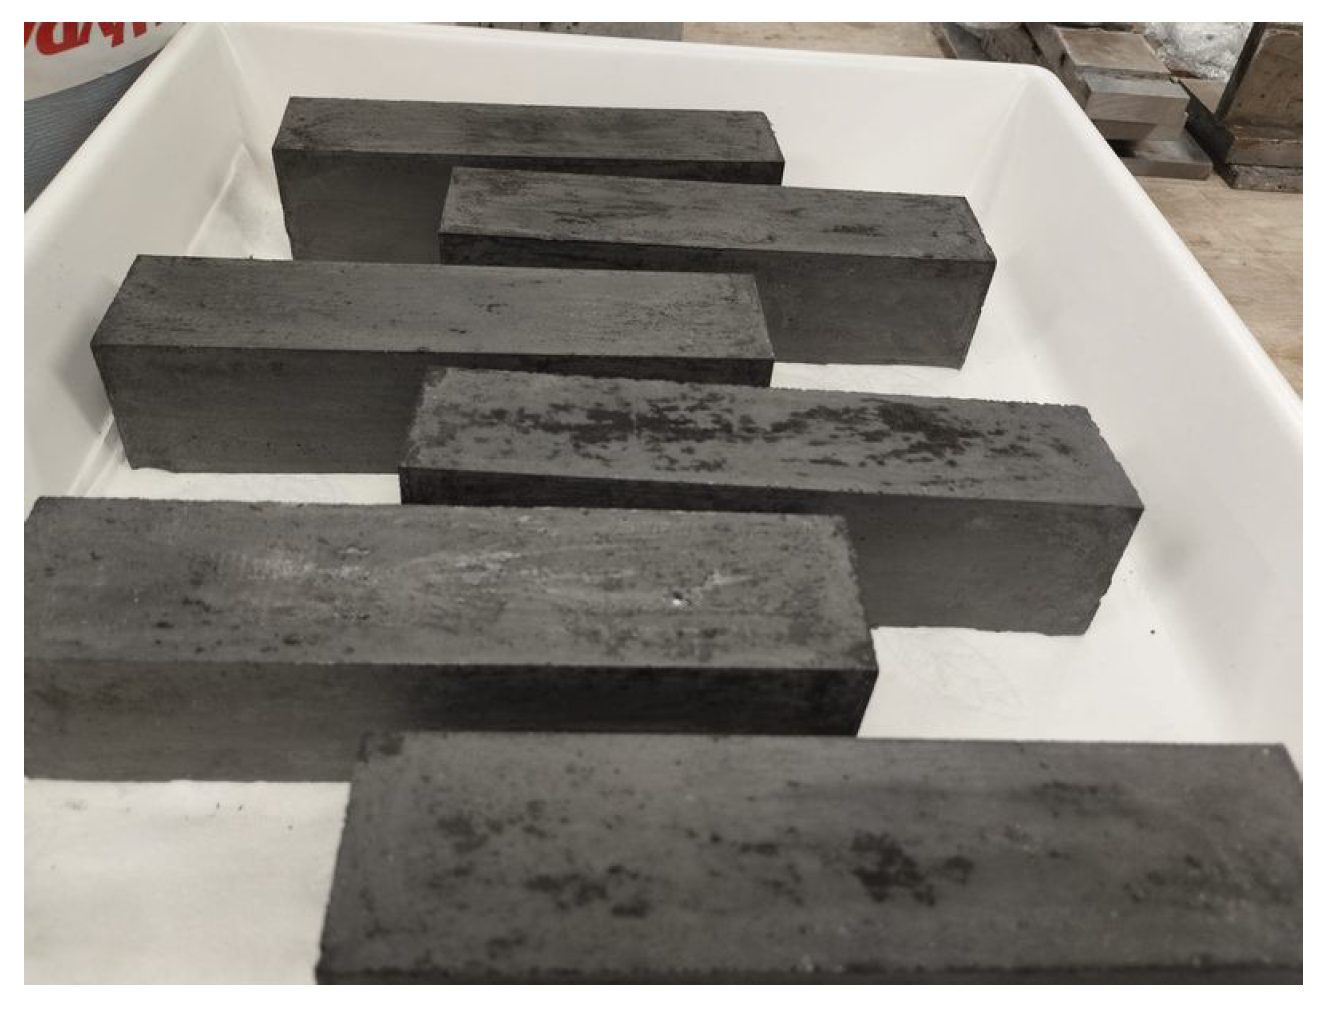
Demolded Aachen GP prismatic specimens (40 × 40 × 160 mm) prior to curing used for flexural strength testing.
Figure 3.
Demolded Aachen GP prismatic specimens (40 × 40 × 160 mm) prior to curing used for flexural strength testing.
Figure 4.
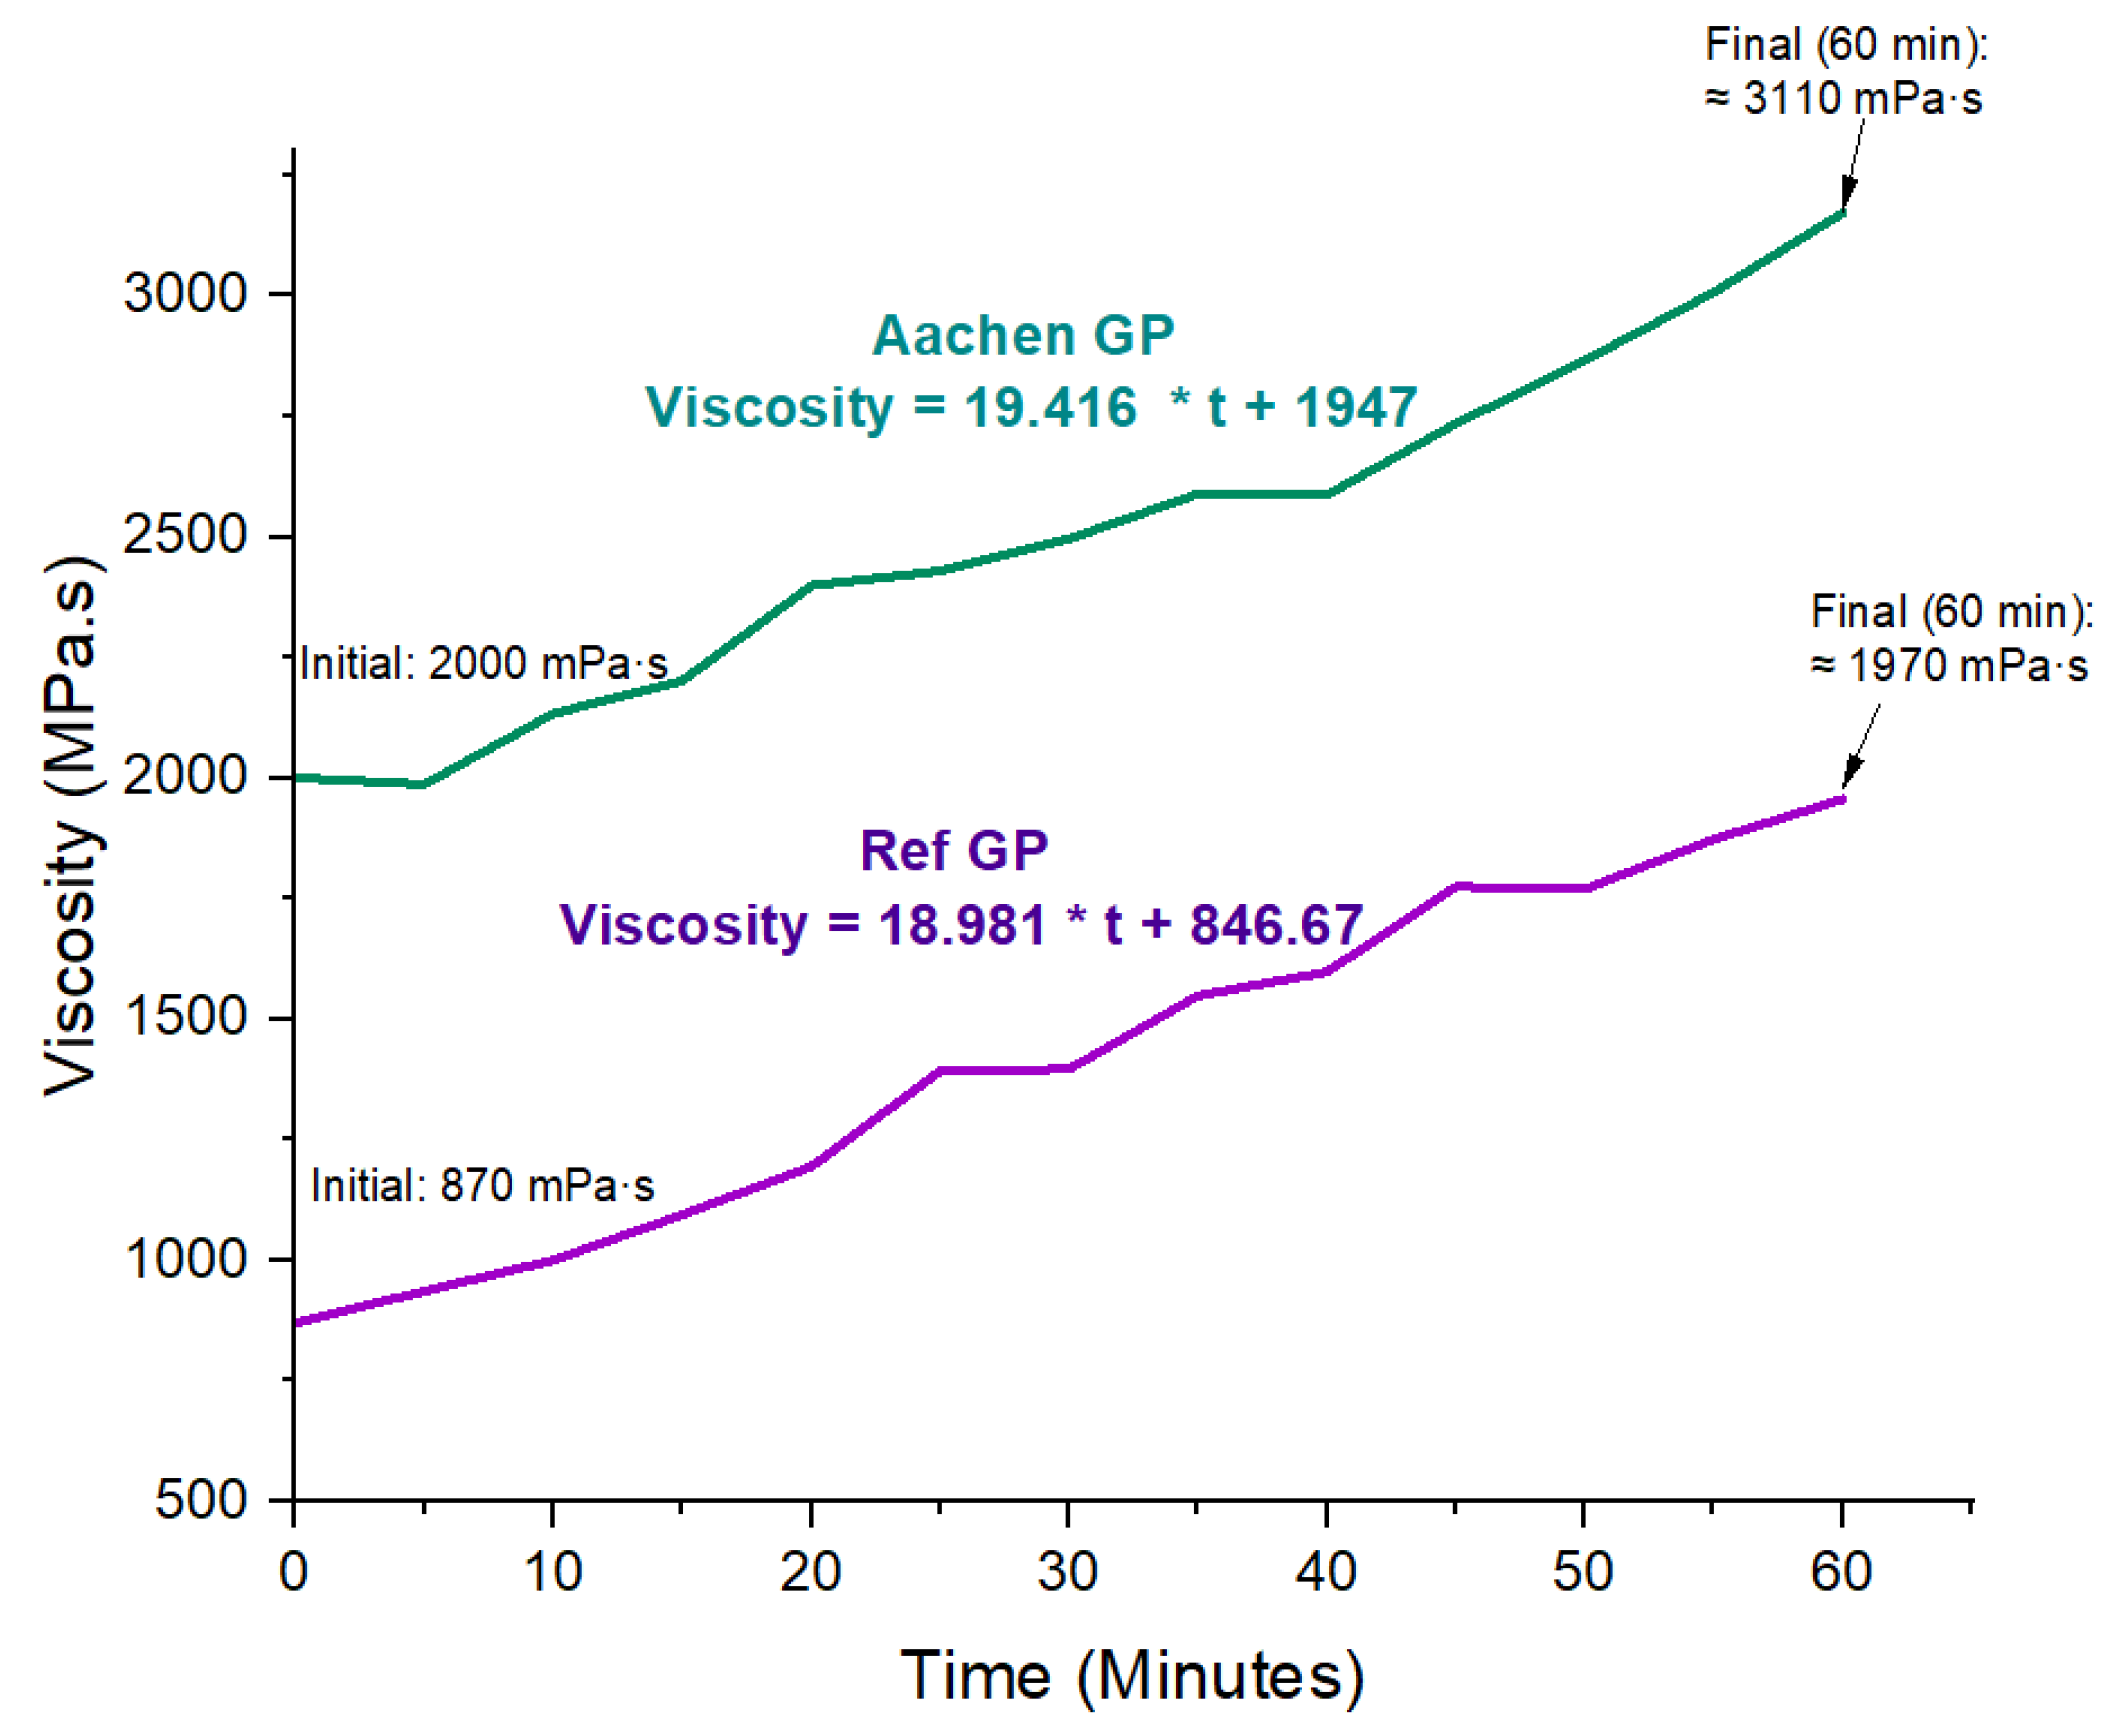
Viscosity development of Ref GP and Aachen GP over 60 min. Linear trendlines are fitted to the experimental data. Key viscosity values are annotated on the curves: Aachen GP (initial 2000 mPa·s, final ≈ 3110 mPa·s) and Ref GP (initial 870 mPa·s, final ≈ 1970 mPa·s), highlighting the higher viscosity and faster thickening of the iron-rich AAM.
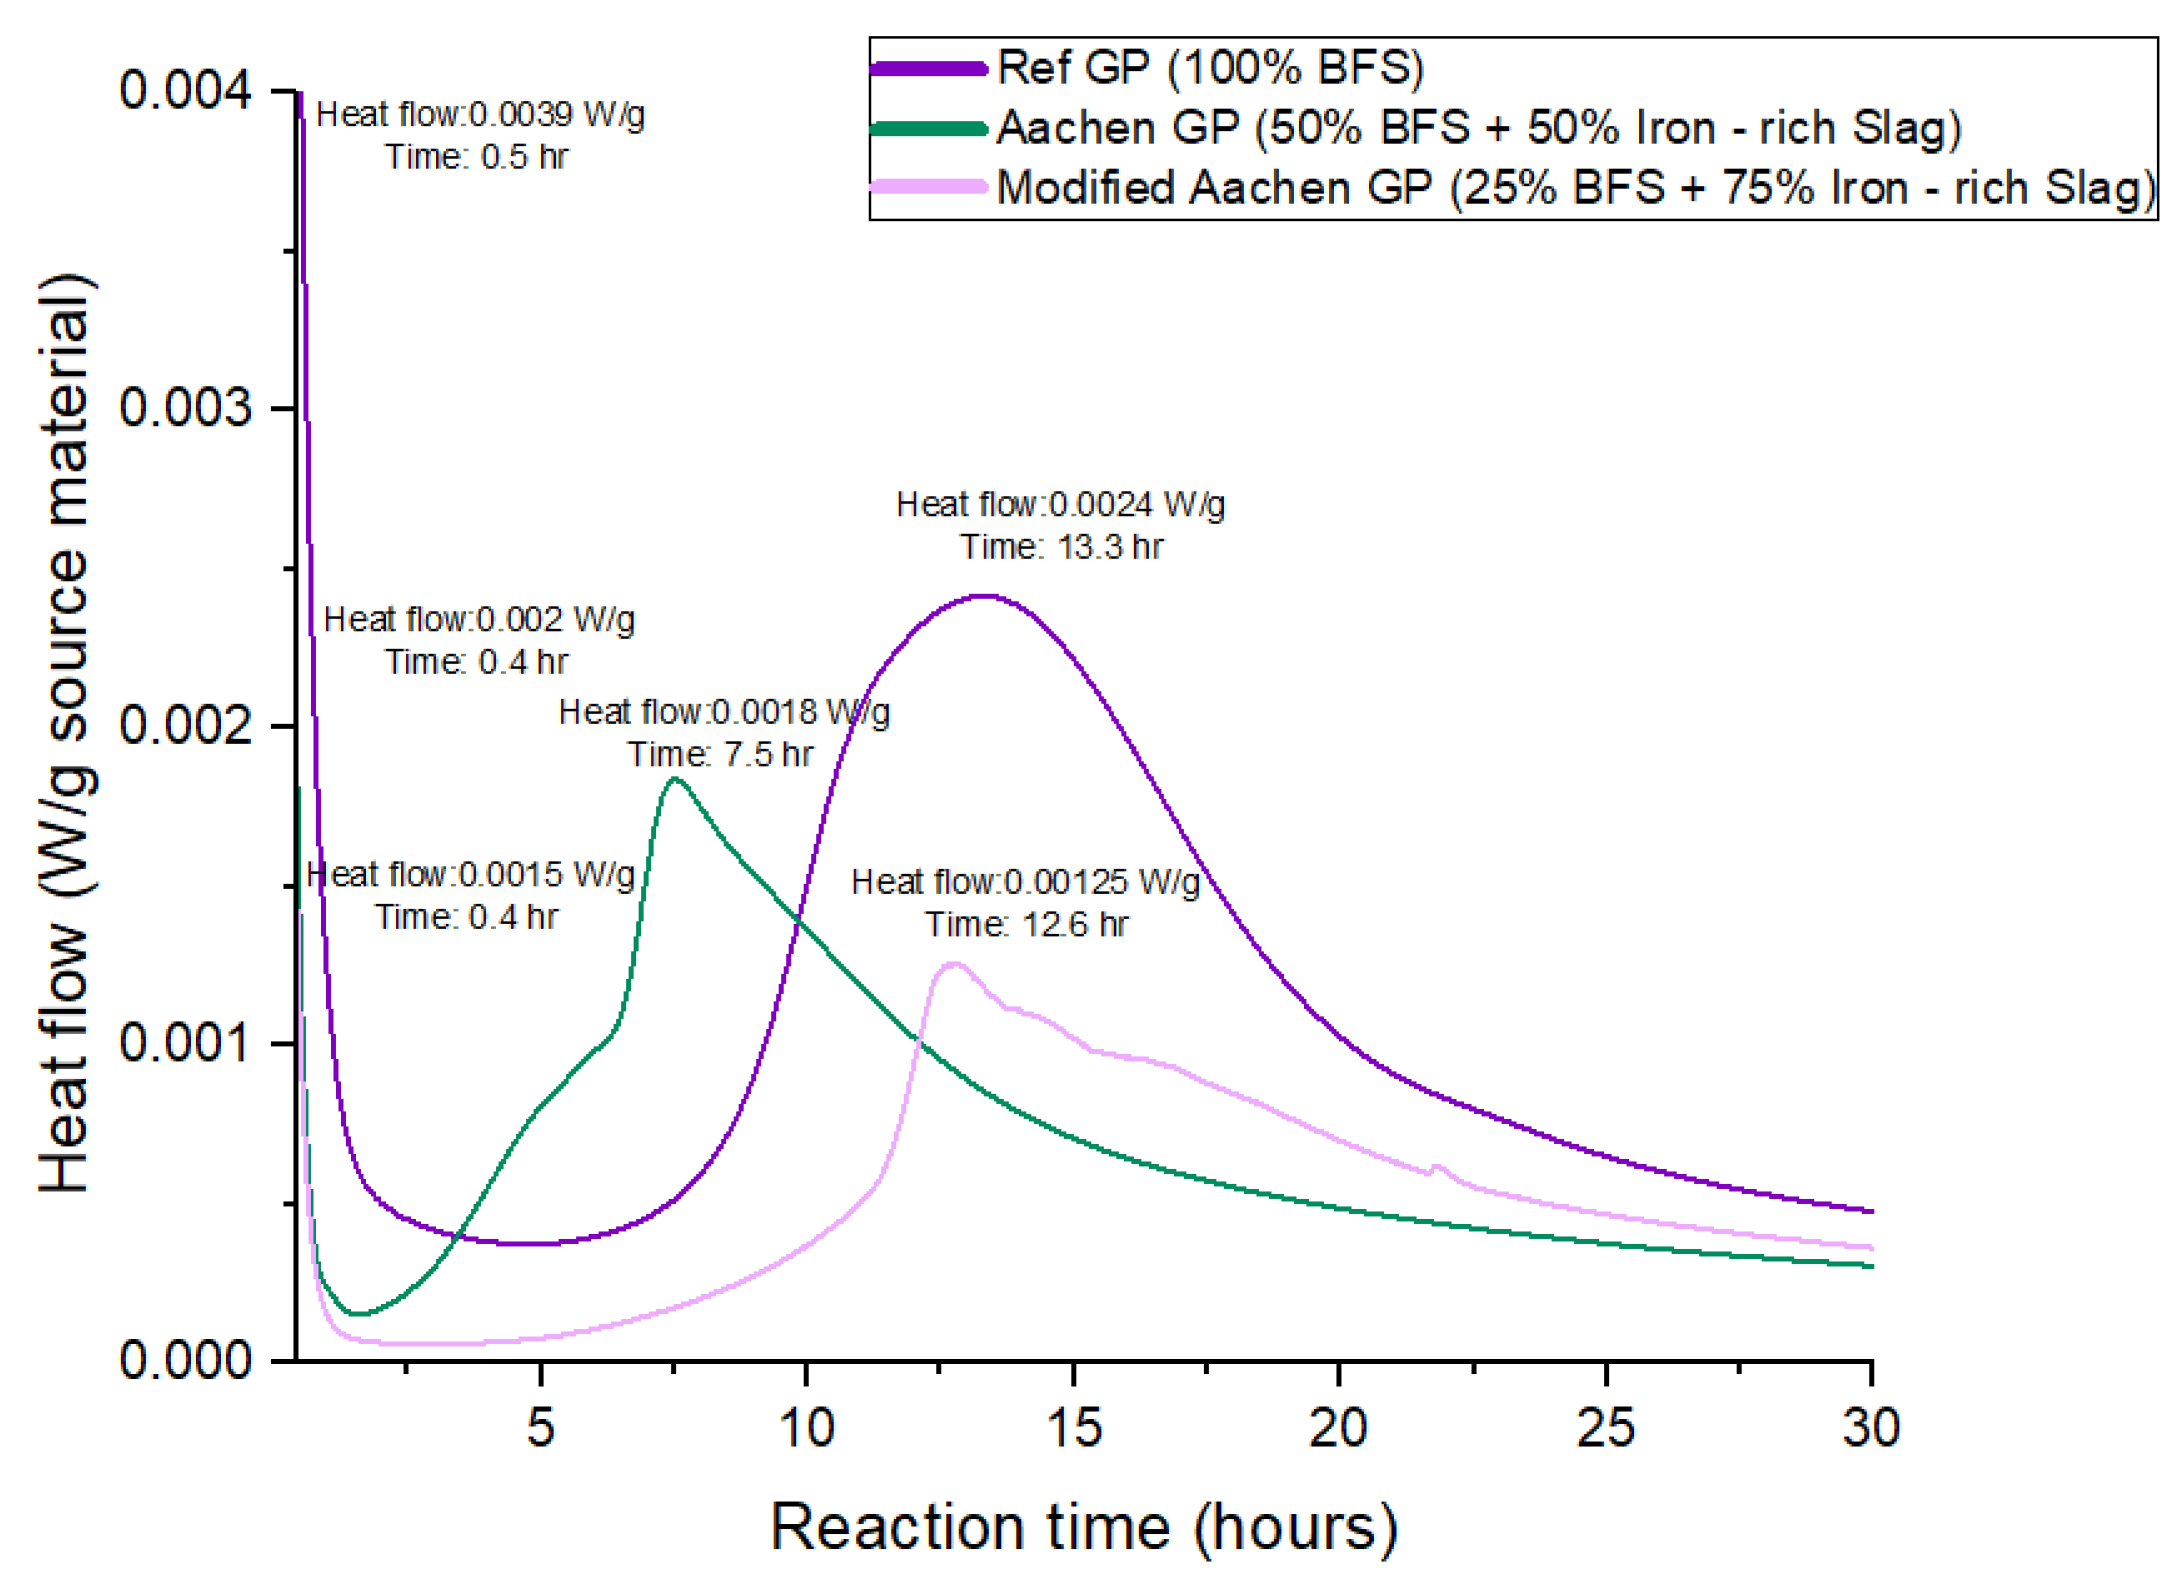
Figure 5.
Heat flow curves of alkali-activated materials (AAMs) during isothermal activation, showing full heat evolution over 15 days, the first exothermic peak, and the second acceleration peak for Ref GP, Aachen GP, and Modified Aachen GP. The purple line represents Ref GP (100% BFS), the green line represents Aachen GP (50% BFS + 50% iron-rich slag), and the pink line represents Modified Aachen GP (25% BFS + 75% iron-rich slag).
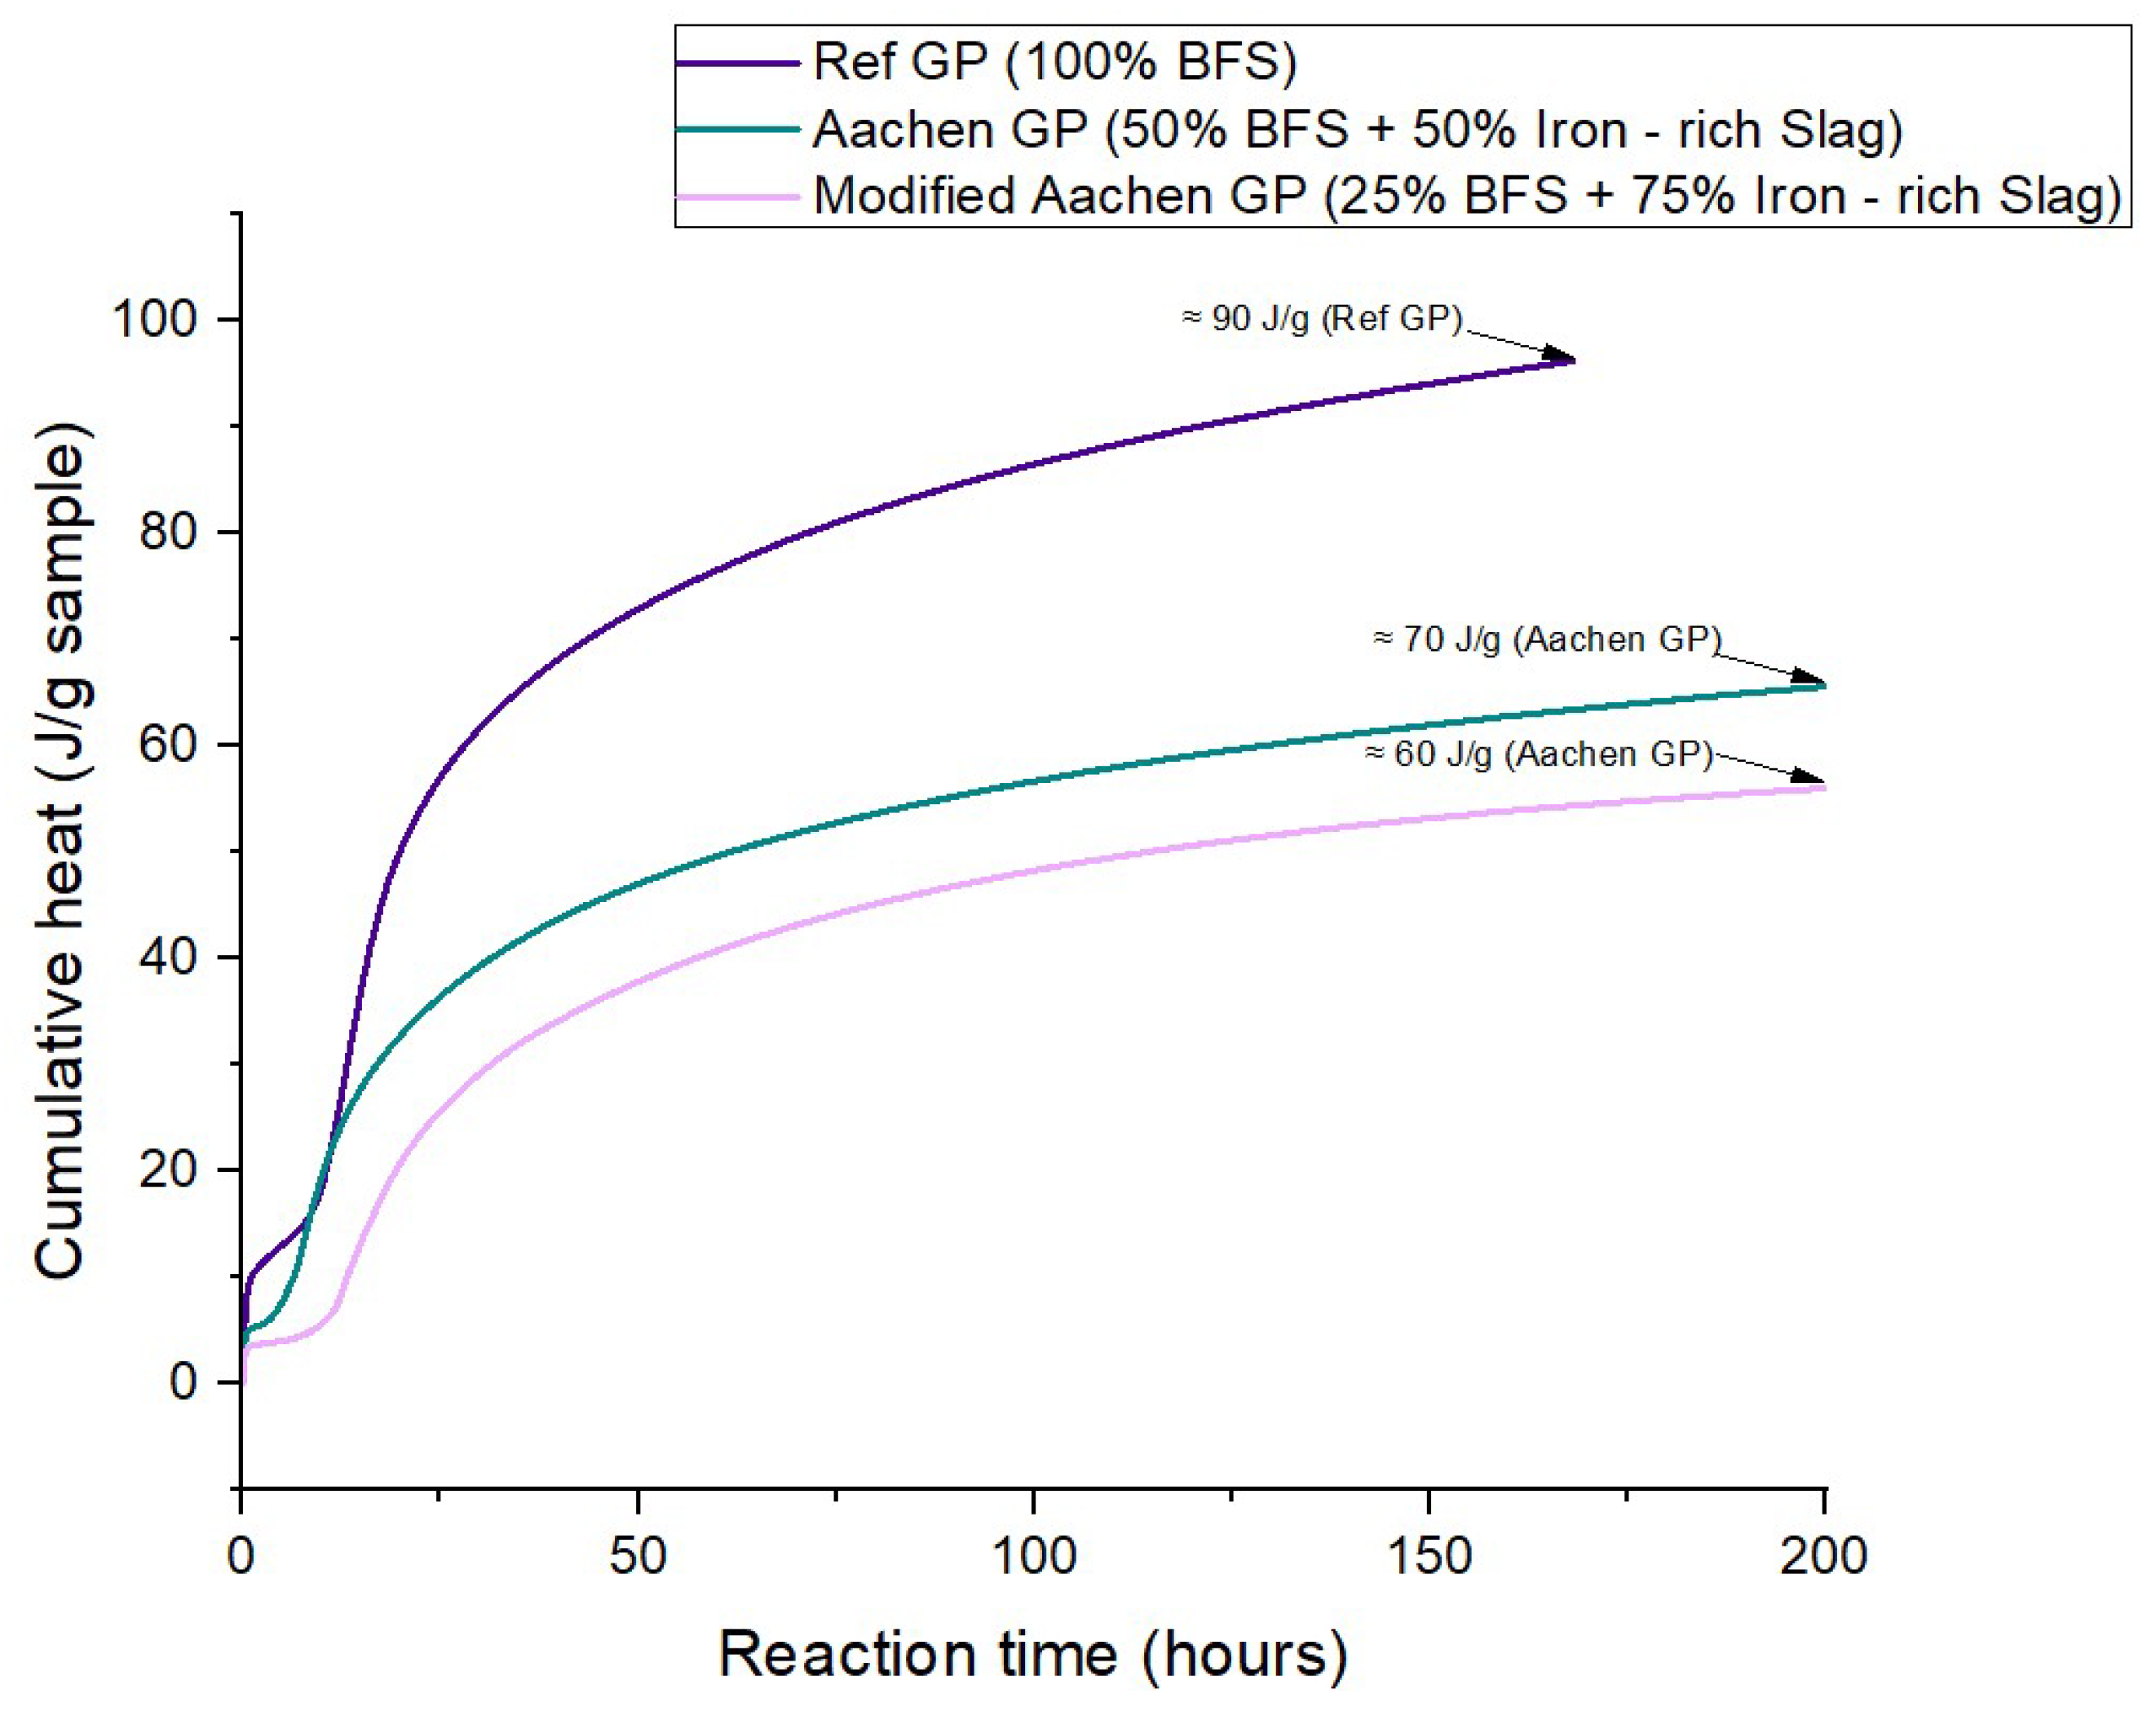
Figure 6.
Cumulative heat release of alkali-activated materials (AAMs) during isothermal activation over 15 days. The purple line represents Ref GP (100% BFS), the green line Aachen GP (50% BFS + 50% iron-rich slag), and the pink line Modified Aachen GP (25% BFS + 75% iron-rich slag). Labeled values indicate the final cumulative heat (J g−1) for each formulation, showing a progressive reduction in reaction extent with increasing iron-slag content.
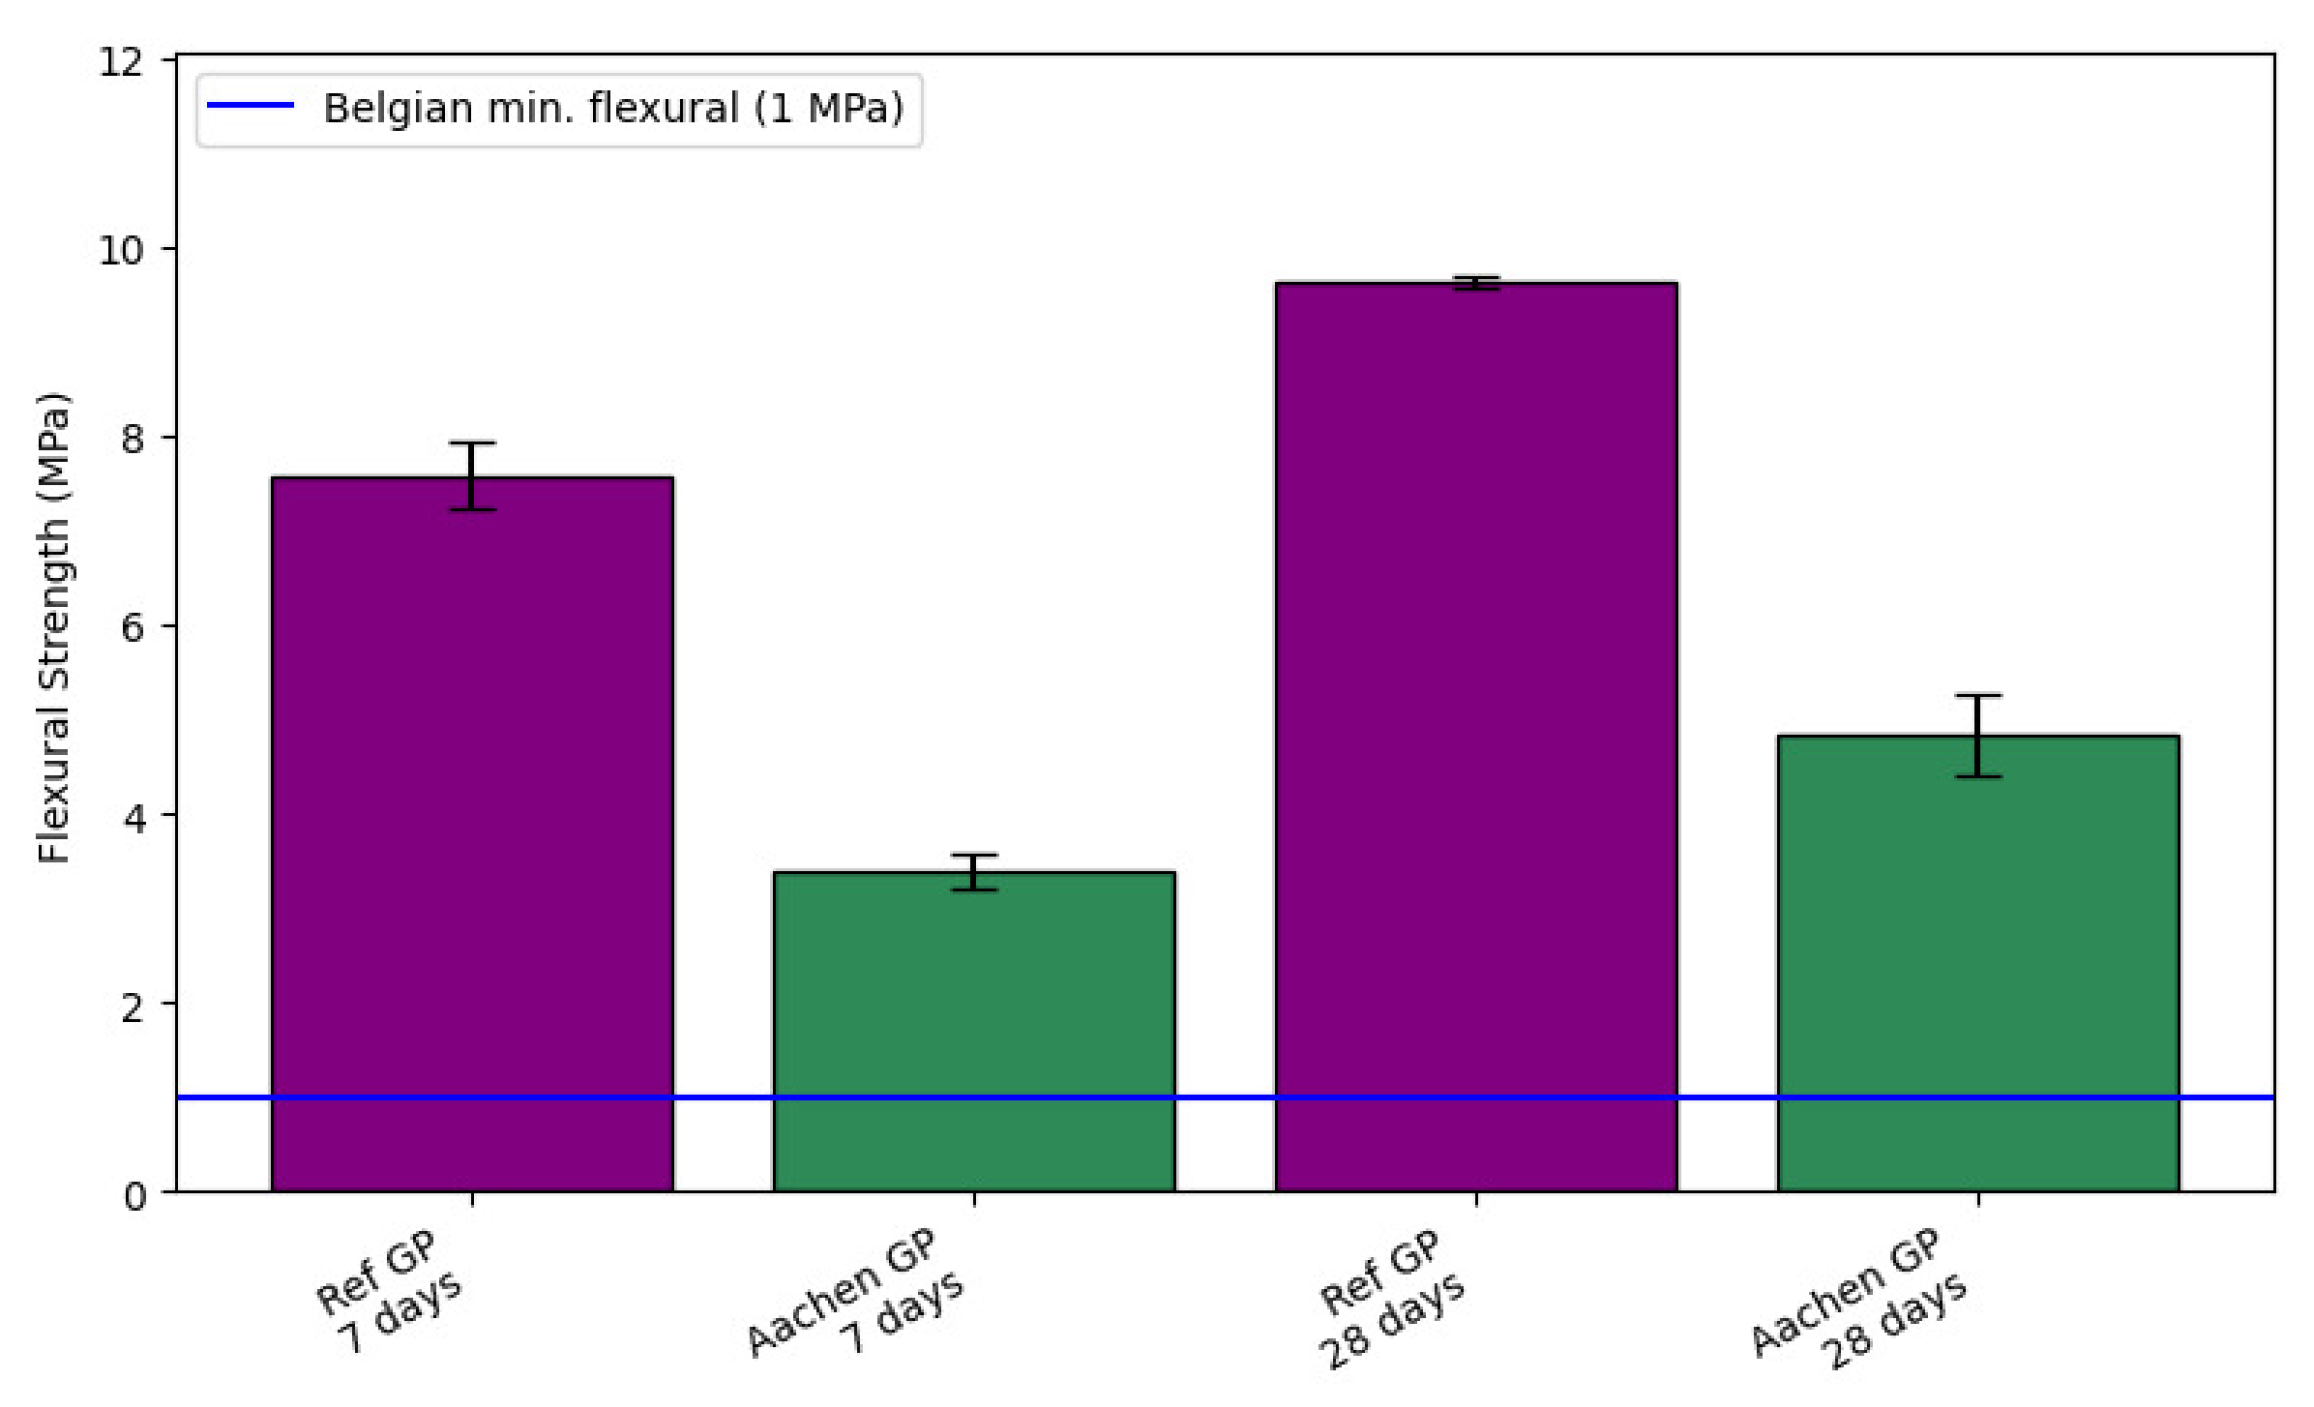
Figure 7.
Flexural strength development of AAMs at 7 and 28 days. The blue line indicates the minimum flexural strength requirement (1MPa) specified by the Belgian nuclear waste acceptance criteria (ONDRAF/NIRAS, 2011) [
48]. Error bars represent one standard deviation (±1 SD) from the mean of three independent specimens (
). At 28 days, Ref GP reached 9.62 ± 0.07 MPa, whereas Aachen GP achieved 4.84 ± 0.40 MPa.
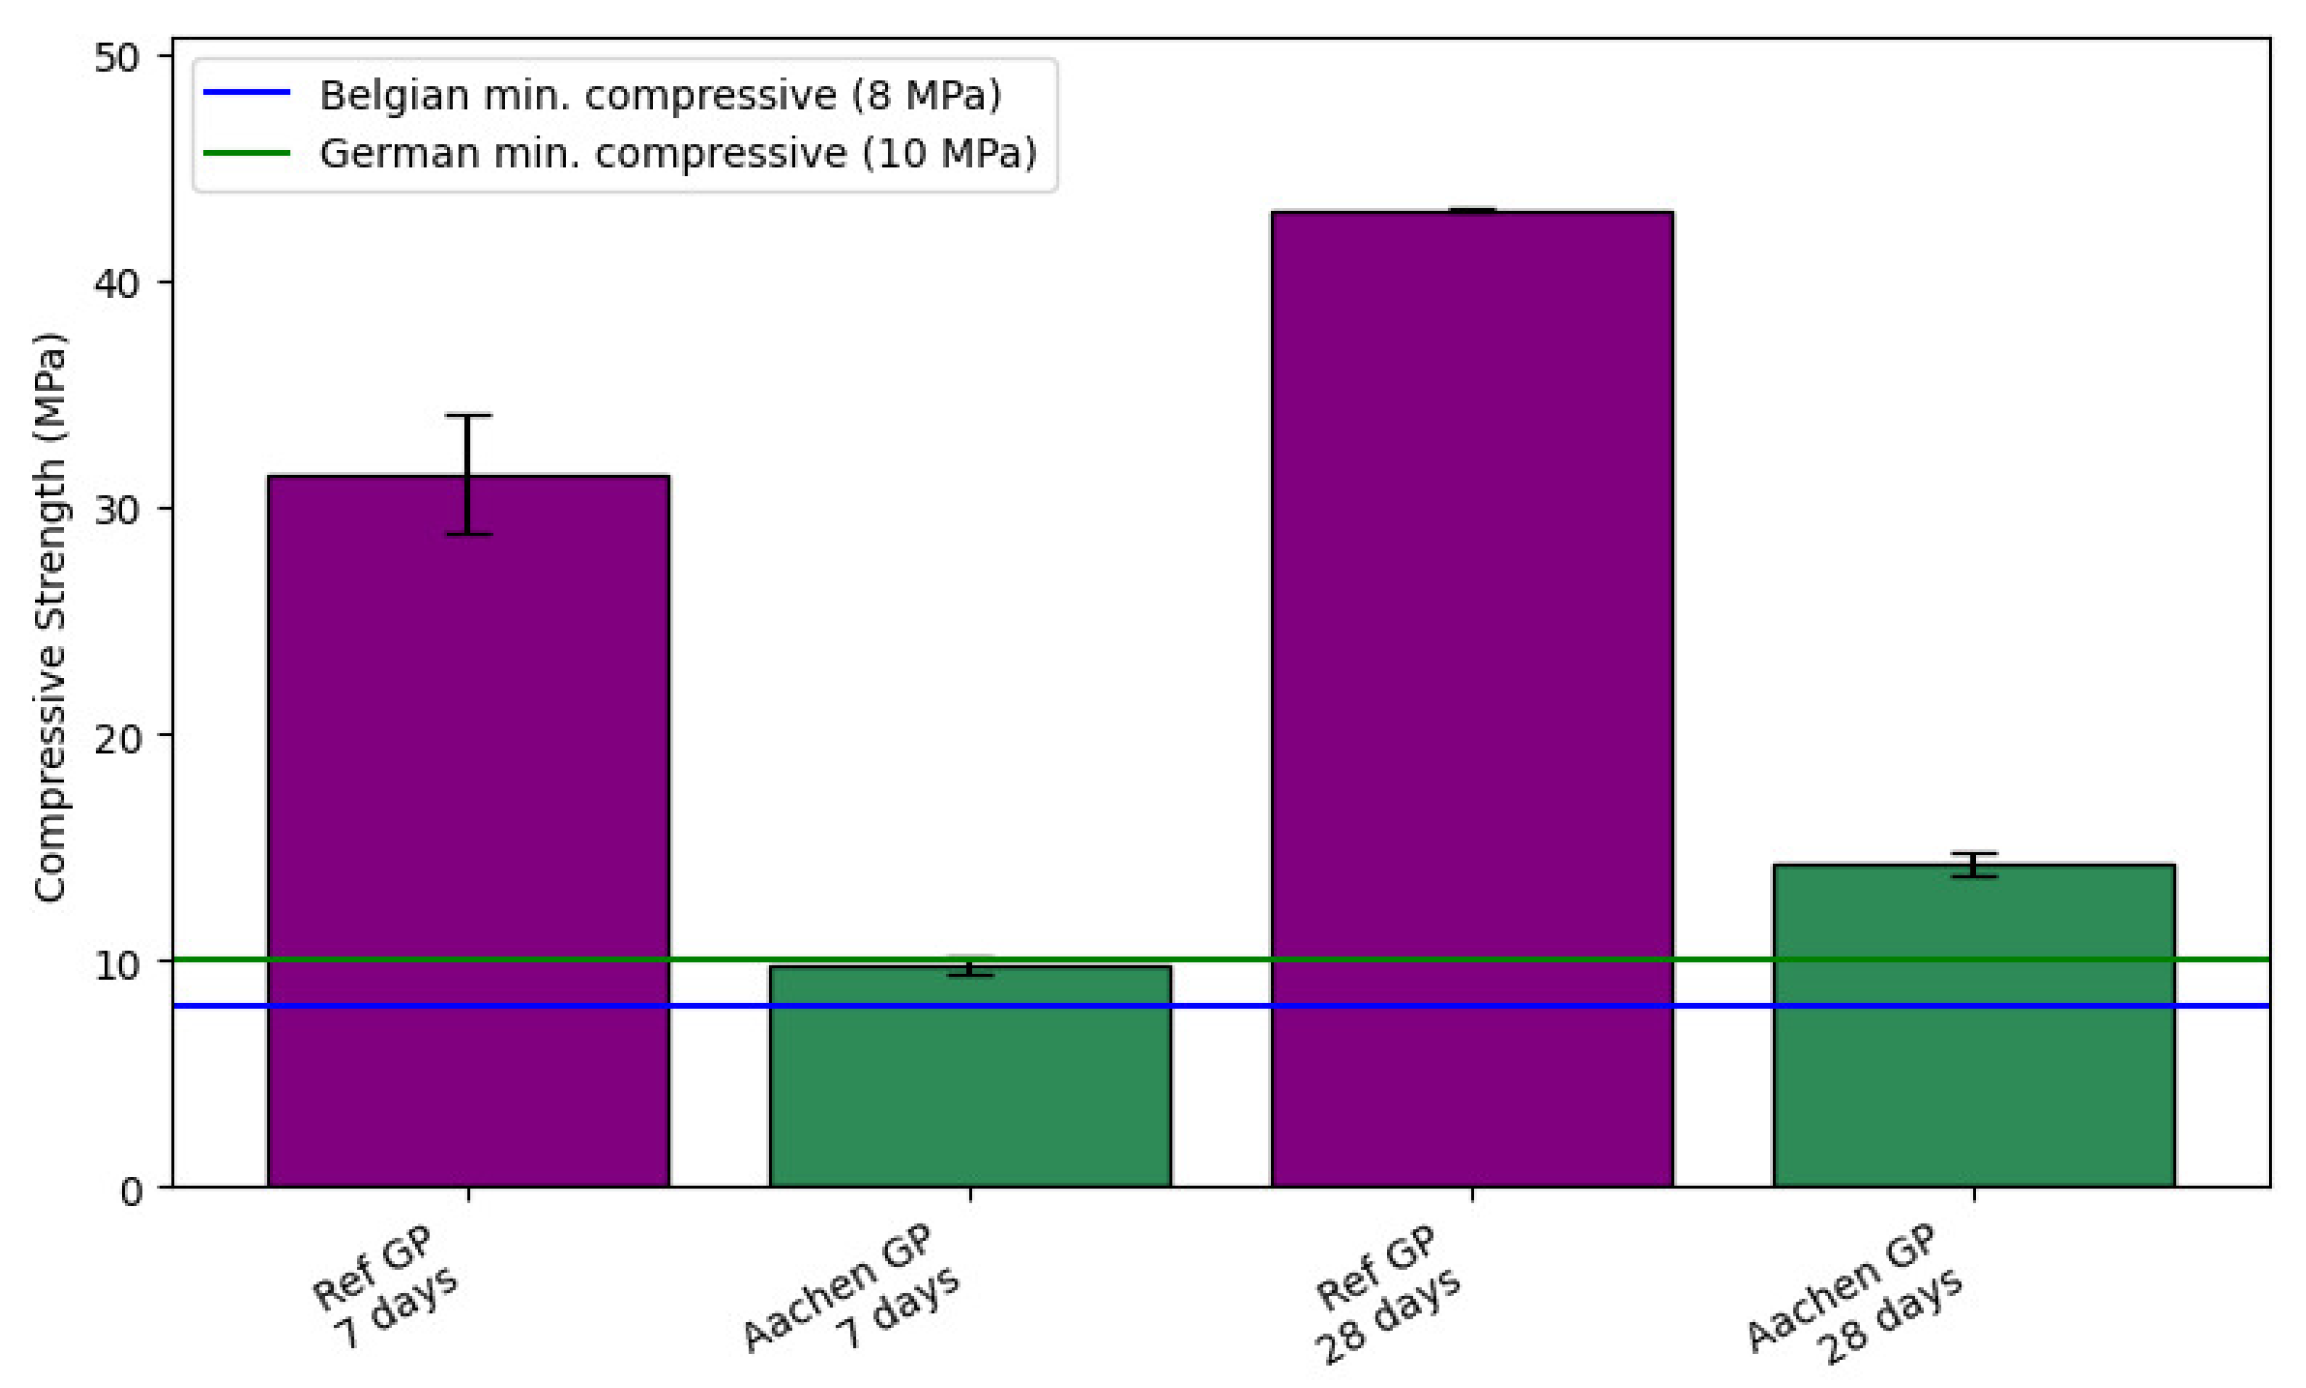
Figure 8.
Compressive strength development of AAMs at 7 and 28 days. The purple bars represent Ref GP (100% BFS), and the green bars represent Aachen GP (50% BFS + 50% iron-rich slag). Blue and turquoise horizontal lines indicate the minimum compressive strength requirements for the Belgian (8 MPa) and German (10 MPa) nuclear waste acceptance criteria, respectively [
48,
49]. Error bars represent one standard deviation (±1 SD) from the mean of three independent specimens (
). At 28 days, Ref GP reached 43.09 ± 0.10 MPa, whereas Aachen GP achieved 14.24 ± 0.46 MPa.
Figure 9.
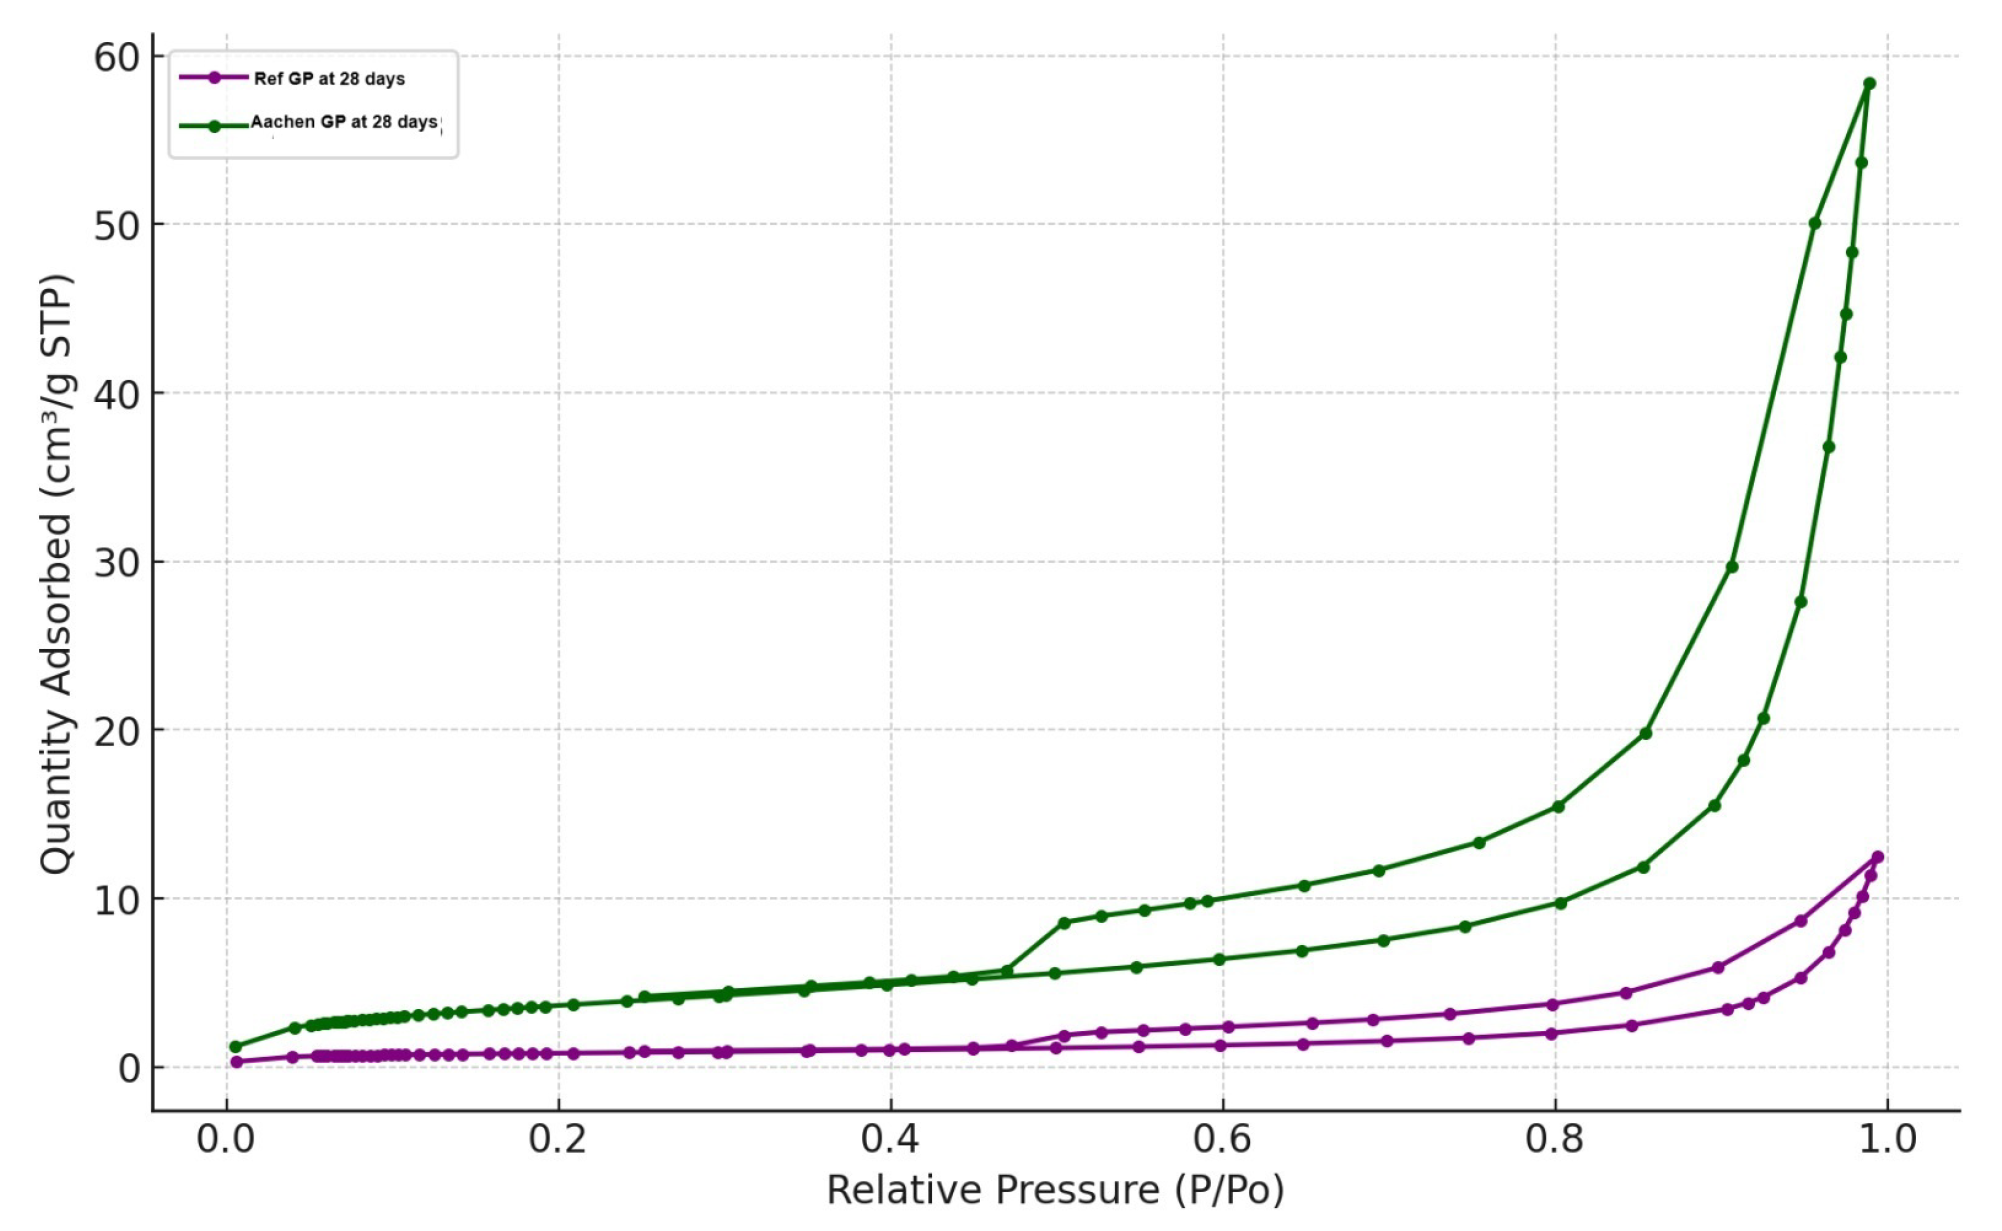
Nitrogen adsorption-desorption isotherms of Ref GP (100% BFS) at 28 days and Aachen GP (50% BFS + 50% iron-rich slag) at 28 days showing Type IV behavior with H3 hysteresis loops.
Figure 9.
Nitrogen adsorption-desorption isotherms of Ref GP (100% BFS) at 28 days and Aachen GP (50% BFS + 50% iron-rich slag) at 28 days showing Type IV behavior with H3 hysteresis loops.
Figure 10.
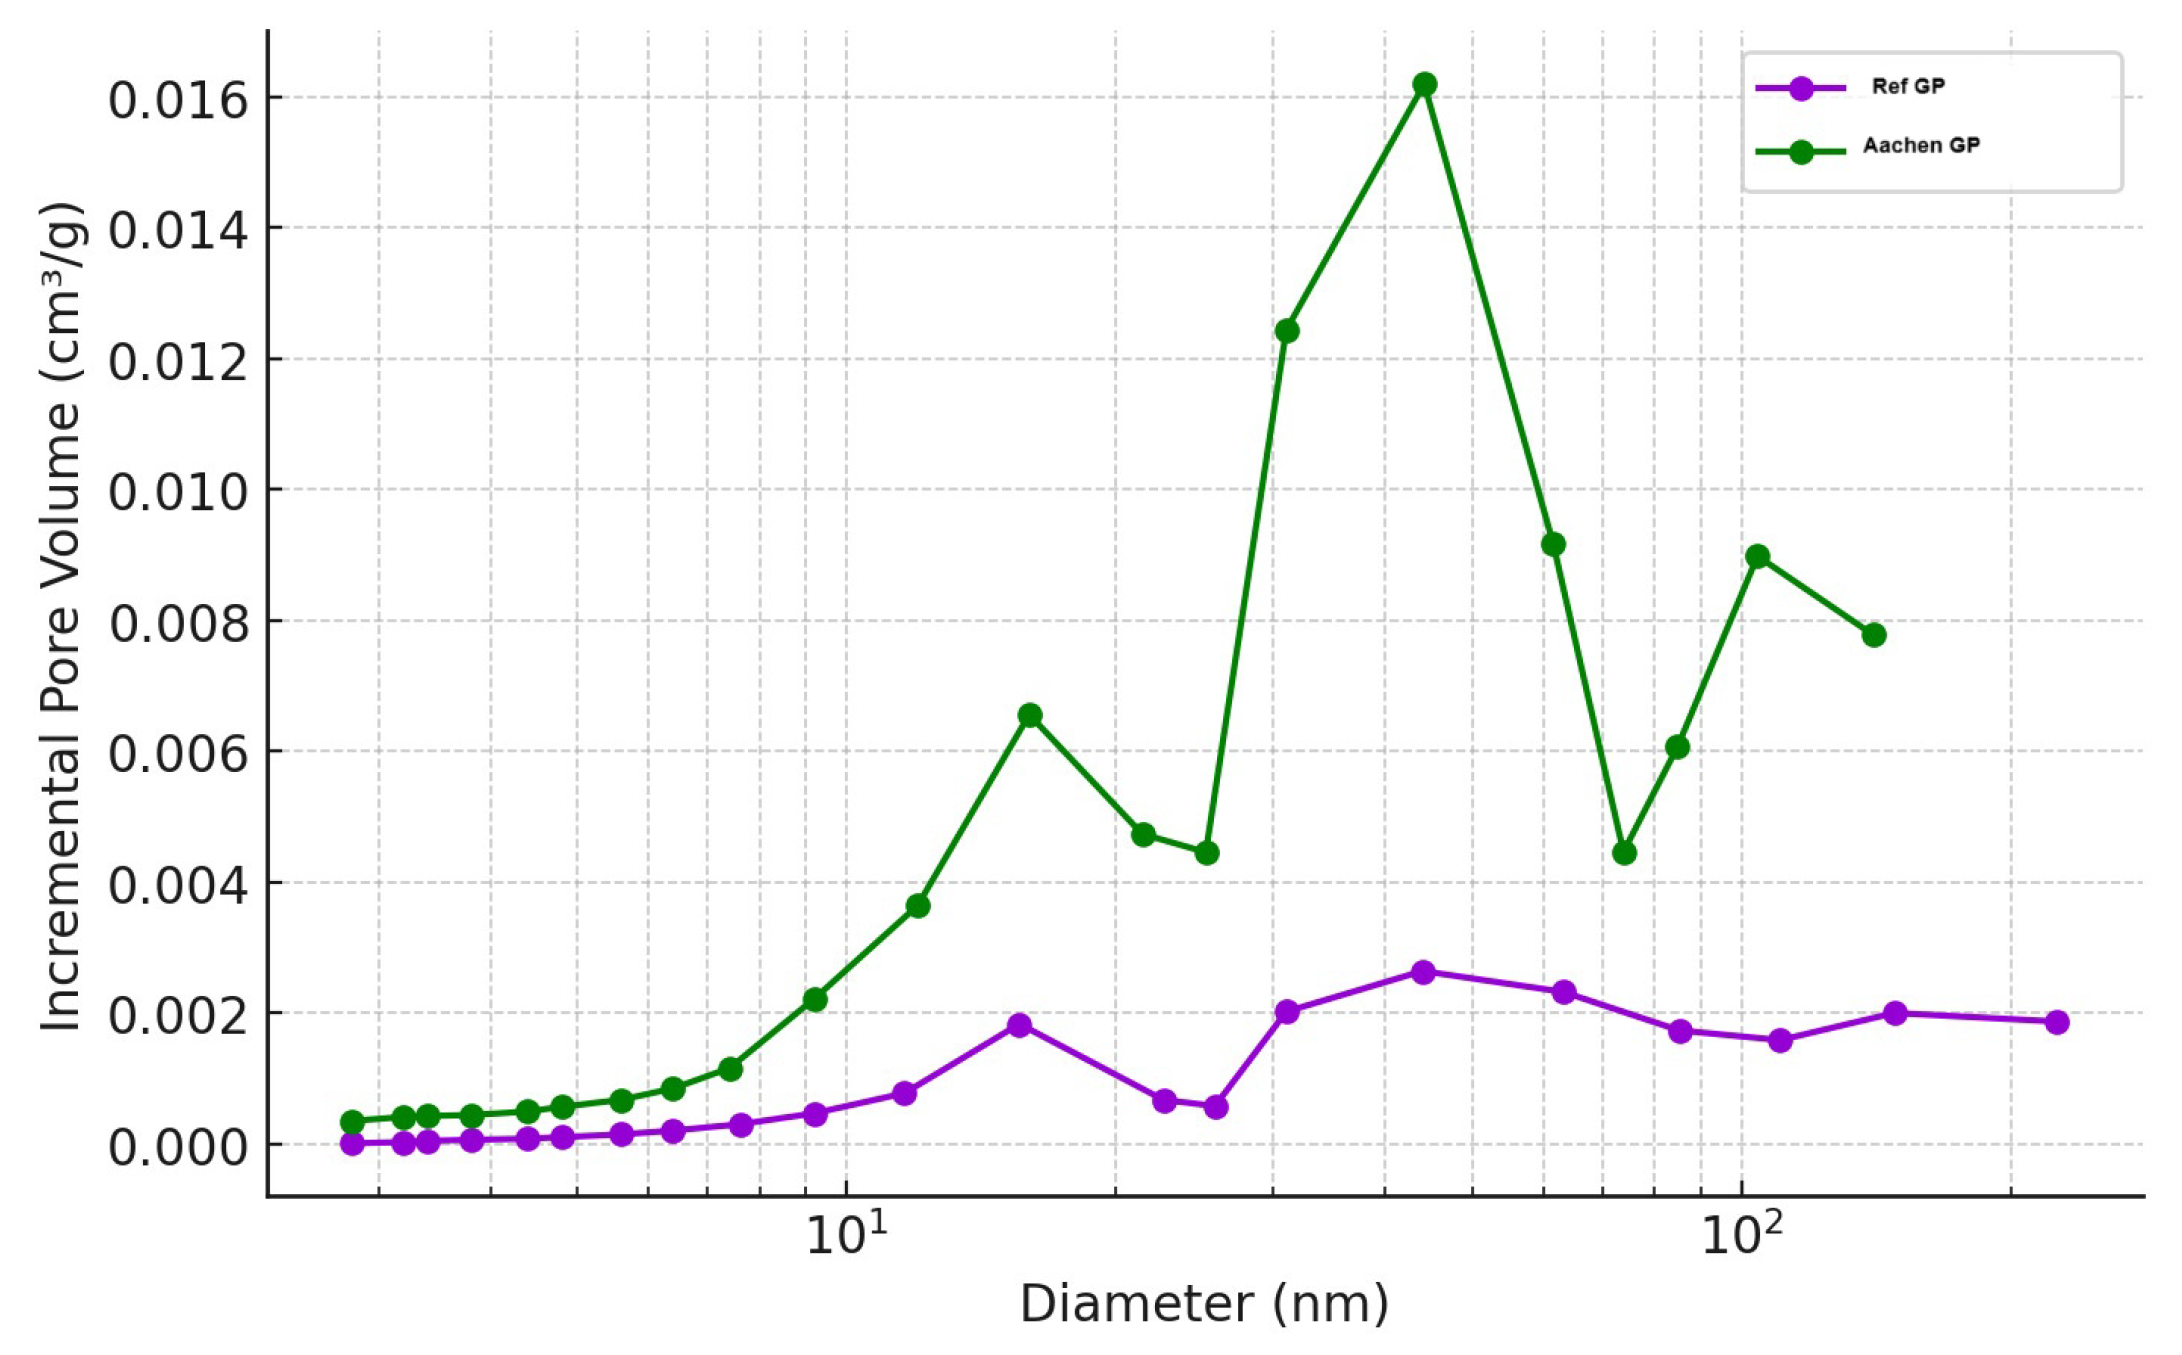
Pore size distribution curves of Ref GP (100% BFS) at 28 days and Aachen GP (50% BFS + 50% iron-rich slag) at 28 days derived from BJH analysis.
Figure 10.
Pore size distribution curves of Ref GP (100% BFS) at 28 days and Aachen GP (50% BFS + 50% iron-rich slag) at 28 days derived from BJH analysis.
Figure 11.
Cumulative pore volume versus pore diameter for Ref GP (100% BFS) at 28 days and Aachen GP (50% BFS + 50% iron-rich slag) at 28 days showing total accessible pore volume distribution.
Figure 11.
Cumulative pore volume versus pore diameter for Ref GP (100% BFS) at 28 days and Aachen GP (50% BFS + 50% iron-rich slag) at 28 days showing total accessible pore volume distribution.
Figure 12.
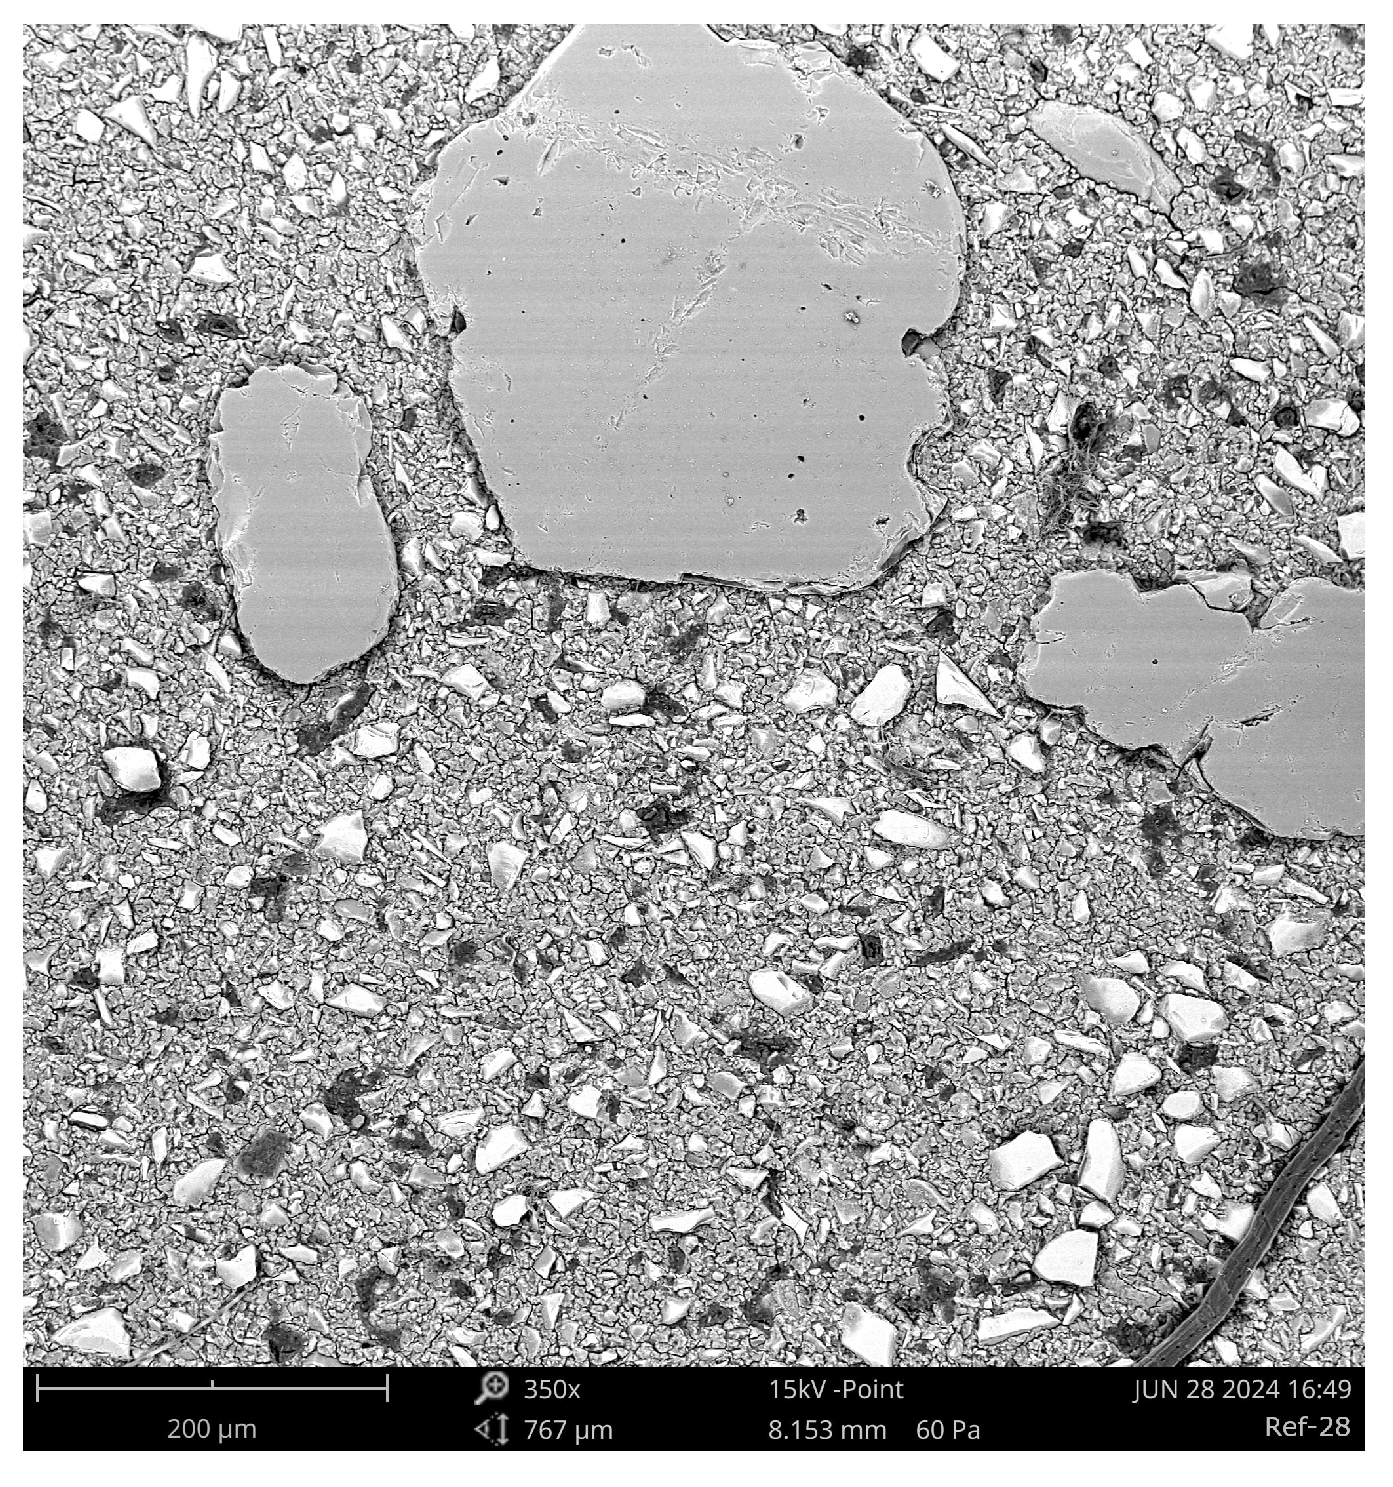
SEM micrograph of Aachen GP at 7 days (350×) showing a heterogeneous and incompletely reacted microstructure. Bright angular regions labeled U correspond to unreacted slag particles, while the darker continuous areas labeled G represent the early-stage alkali-activated gel matrix. Isolated dark zones labeled P denote pores and incomplete densification. A small bright inclusion labeled F indicates a possible Fe-rich nodule. The observed heterogeneity and porosity suggest a delayed geopolymerization process influenced by the high Fe content of the precursor. Legend: U = Unreacted slag particle; G = Gel matrix; P = Pore or void; F = Fe-rich nodule.
Figure 13.
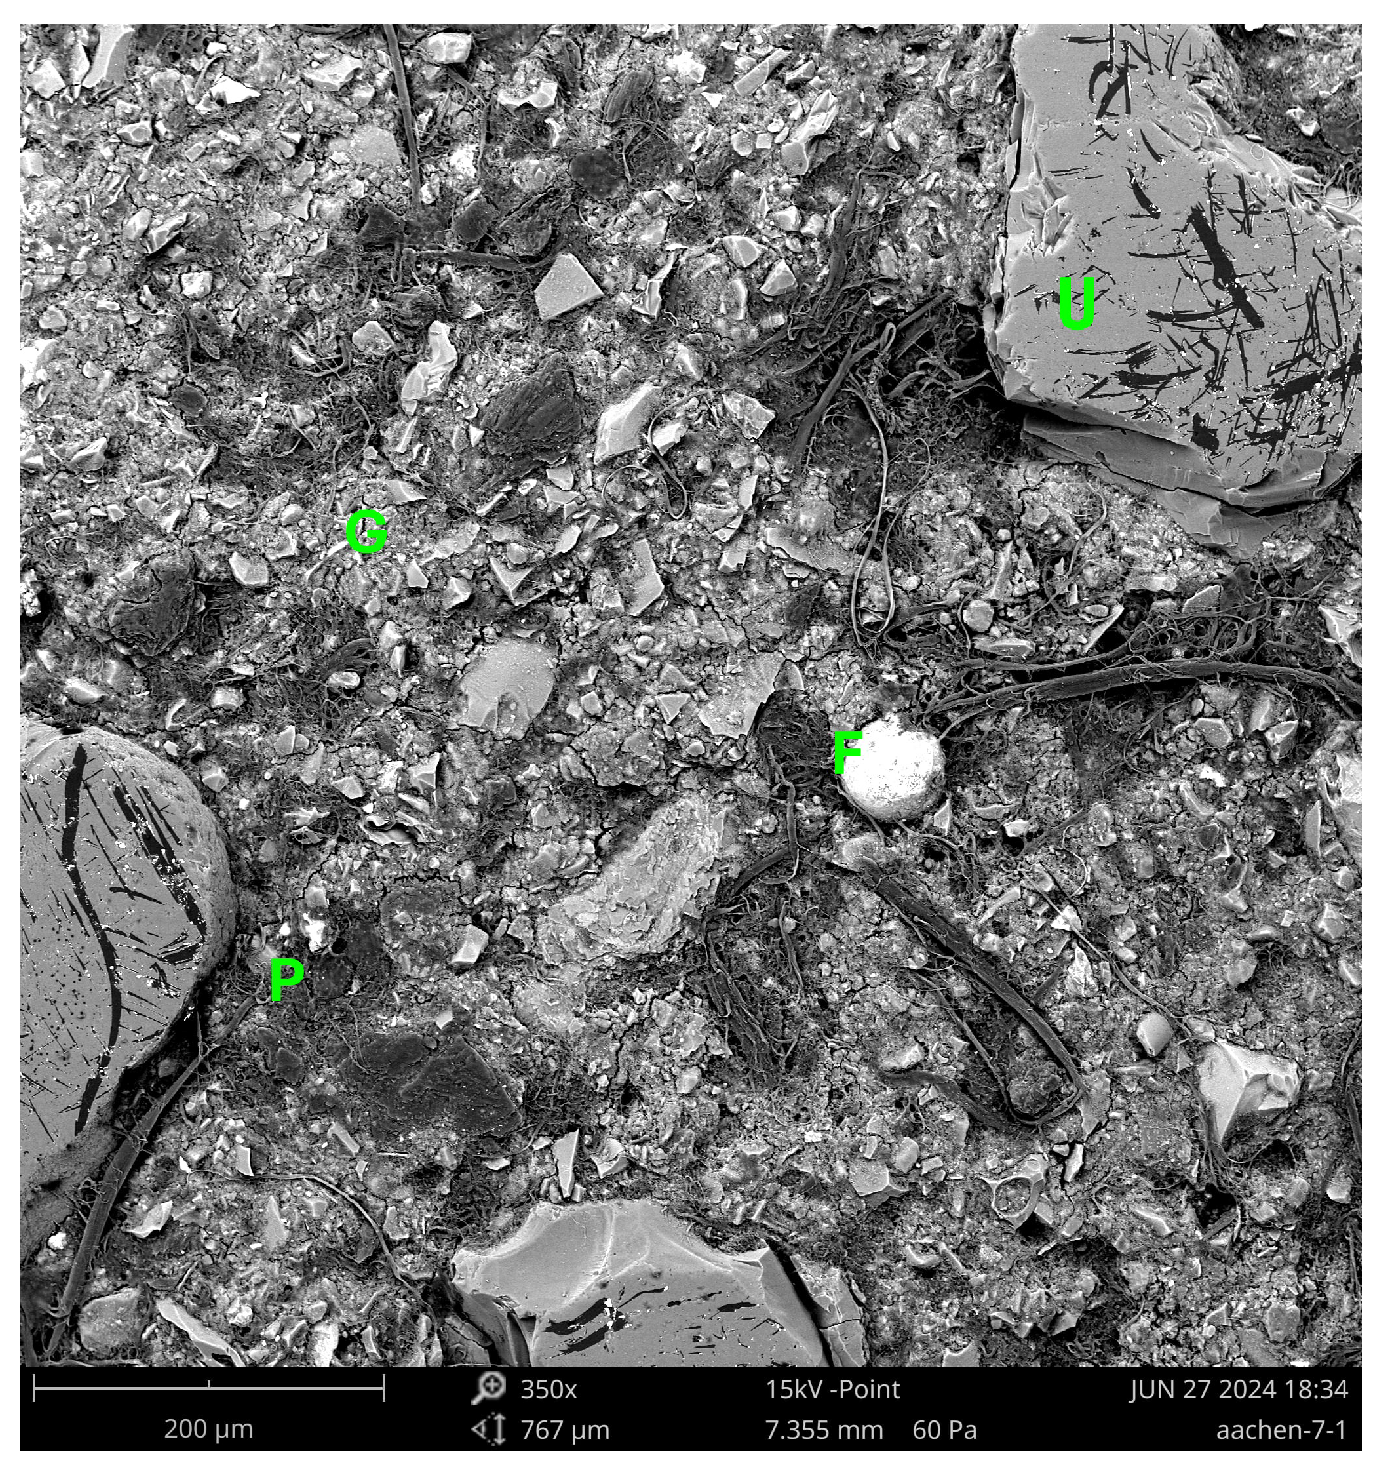
SEM micrograph of Aachen GP at 28 days (350×) showing partial densification and remaining unreacted slag grains (U) embedded within the developing alkali-activated gel (G), and residual pores (P) are visible, consistent with incomplete reaction and hindered gel formation due to the high Fe content of the precursor. Legend: U = Unreacted slag particle; G = Gel matrix; P = Pore.
Figure 14.
SEM micrograph of Ref GP at 7 days (350×), showing a dense and homogeneous alkali-activated matrix. The continuous gel phase (G) dominates the microstructure, with only isolated unreacted slag particles (U) and few visible pores (P). This morphology reflects high precursor reactivity and efficient polymerization of the BFS-based system. Legend: G = Gel matrix; U = Remnant slag particle; P = Pore or void.
Figure 15.
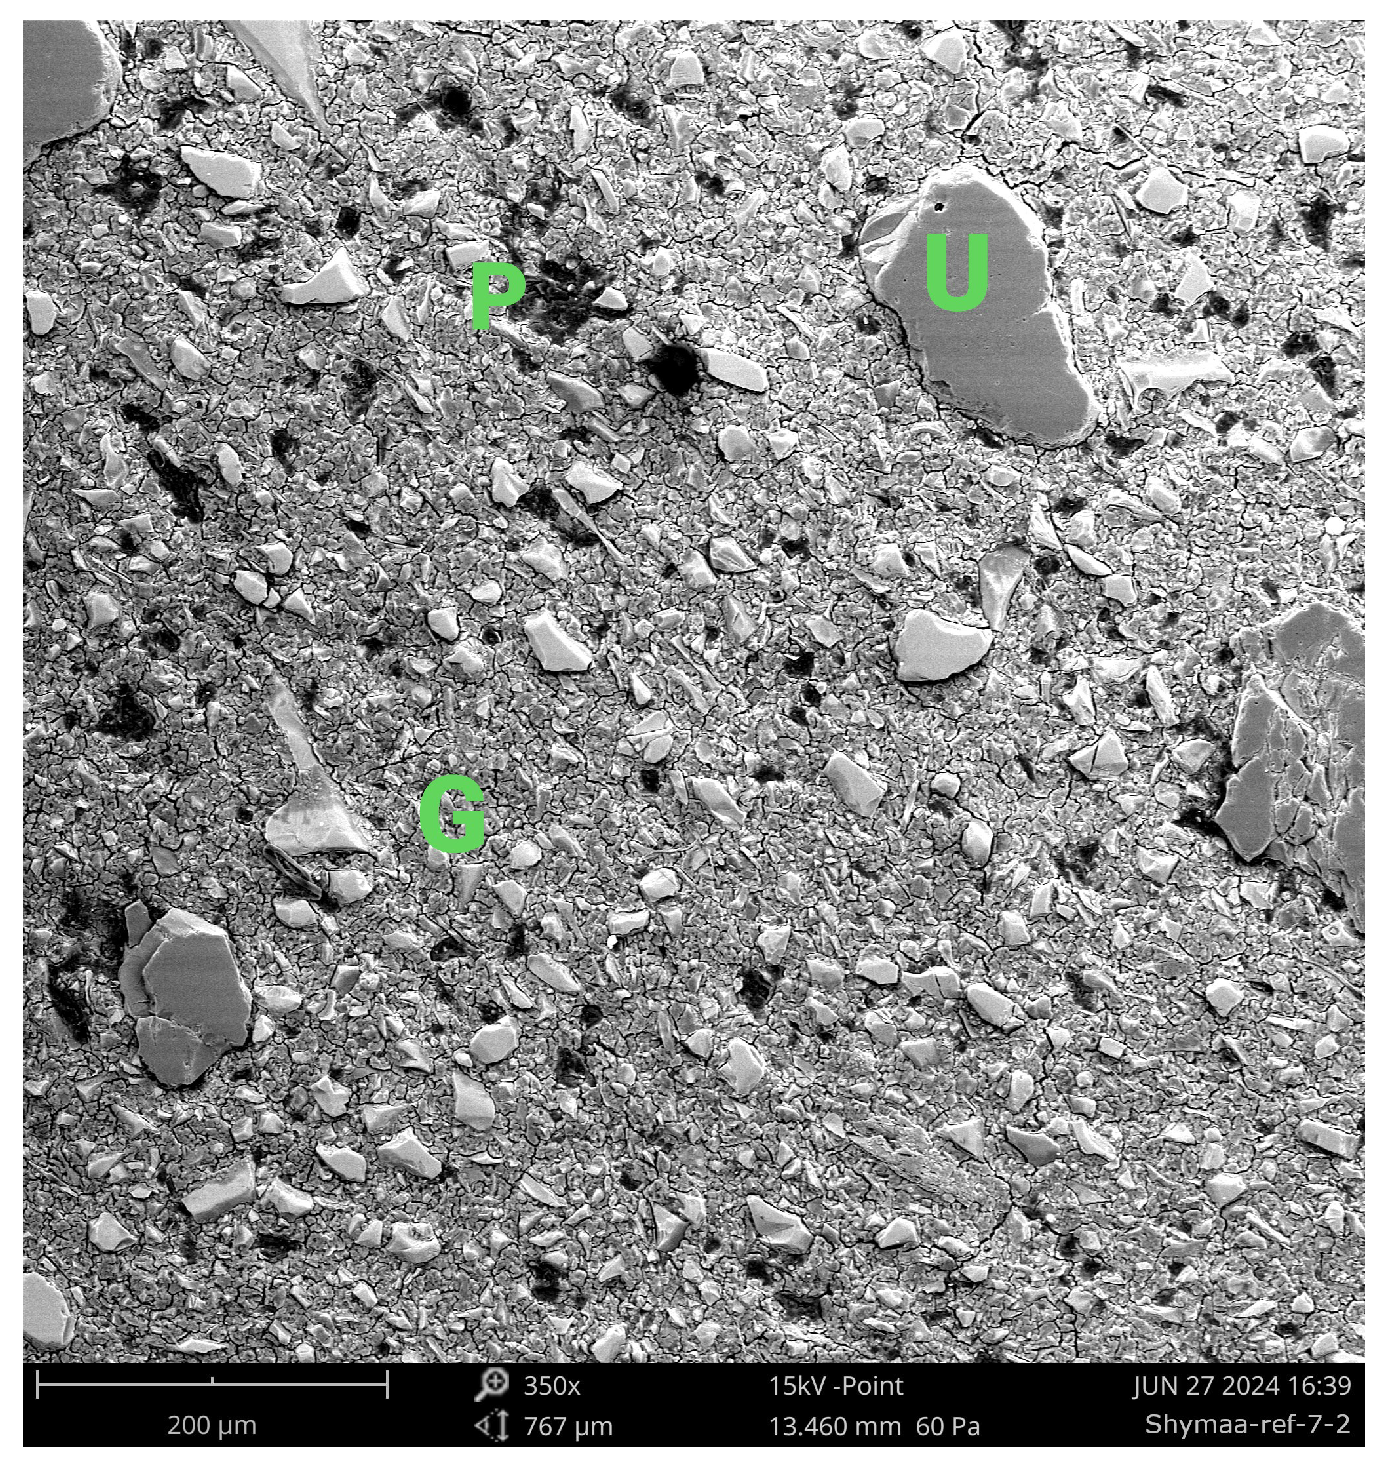
SEM micrograph of Ref GP at 28 days (350×) showing a refined, consolidated gel matrix. Minimal porosity and few unreacted particles remain, indicating advanced alkali-activation and strong matrix densification compared to the Fe-rich system.
Figure 15.
SEM micrograph of Ref GP at 28 days (350×) showing a refined, consolidated gel matrix. Minimal porosity and few unreacted particles remain, indicating advanced alkali-activation and strong matrix densification compared to the Fe-rich system.
Figure 16.
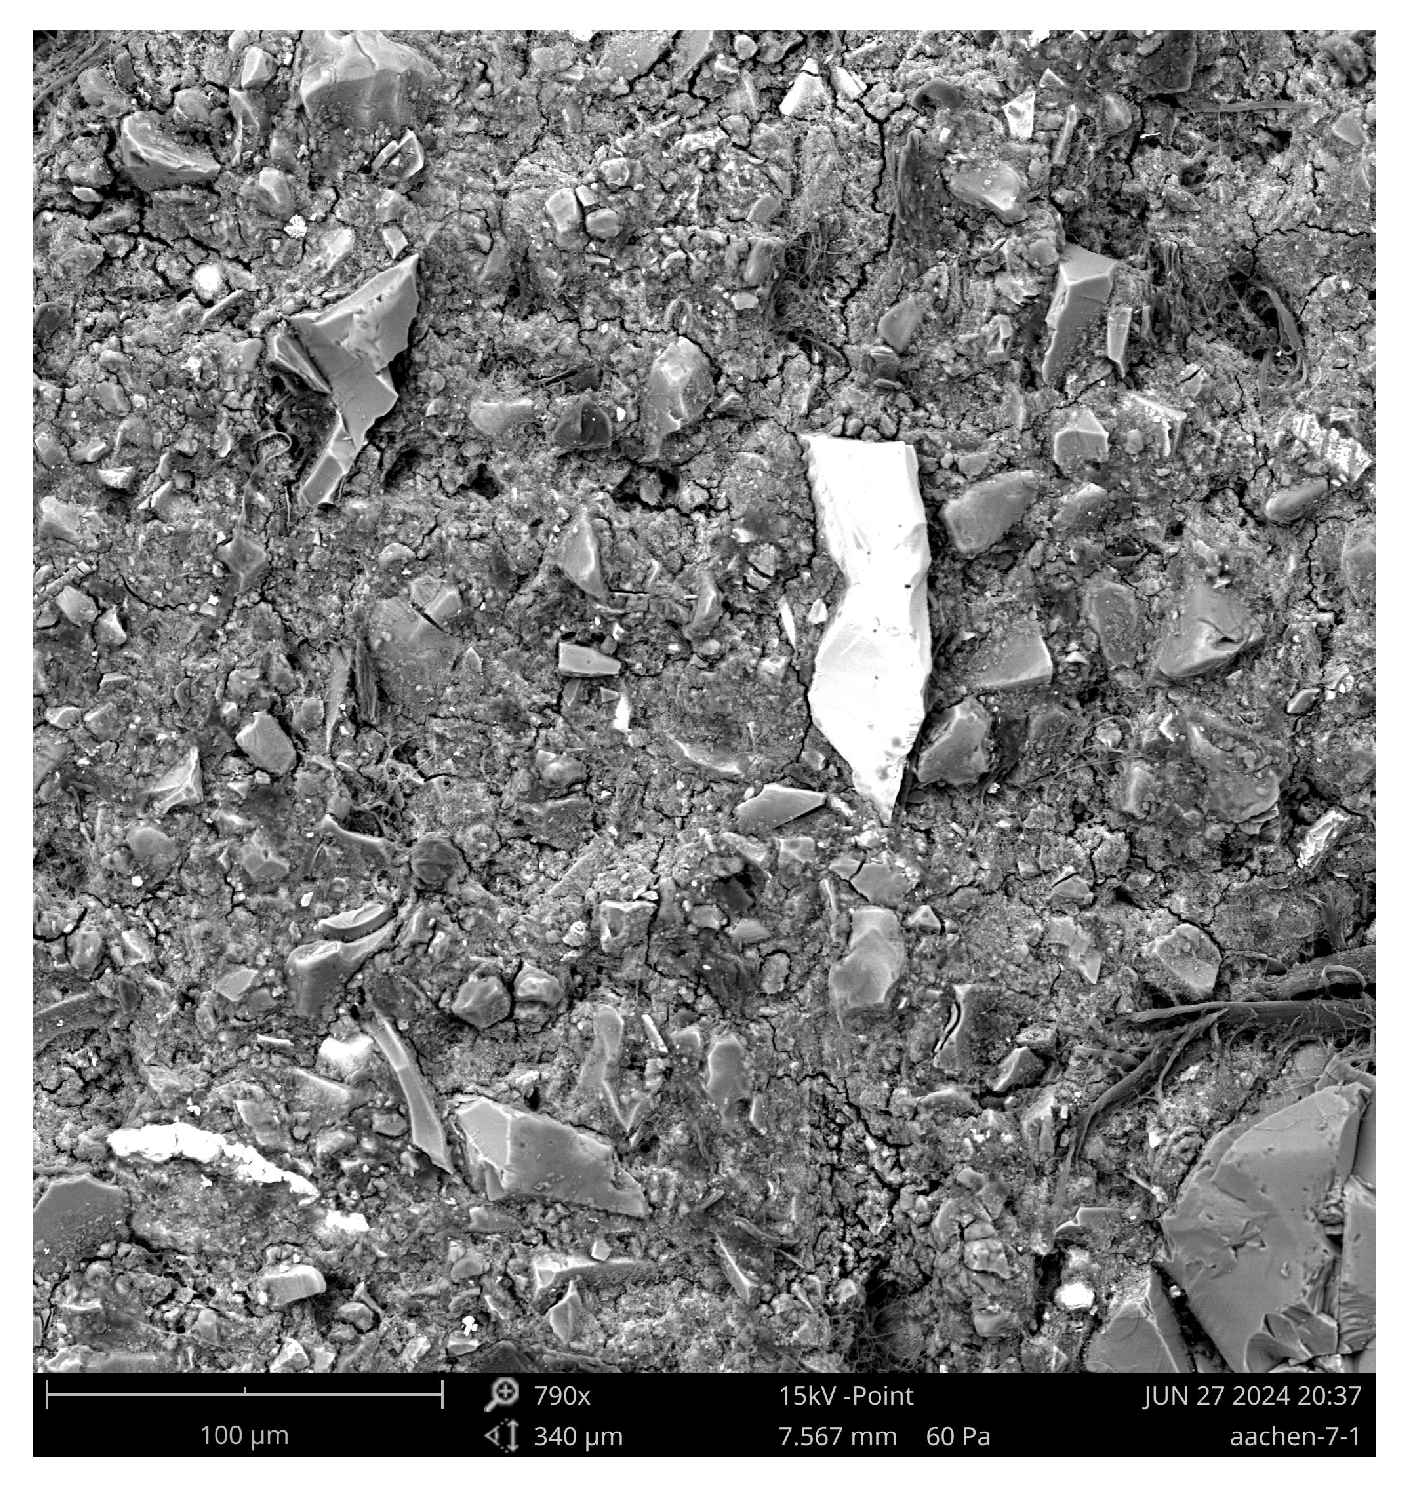
SEM micrograph of Aachen GP at 28 days (790×) showing large, irregular, and interconnected pores with residual slag inclusions. The open pore structure indicates incomplete encapsulation by the alkali-activated gel, consistent with the higher measured porosity and slower reaction kinetics.
Figure 17.
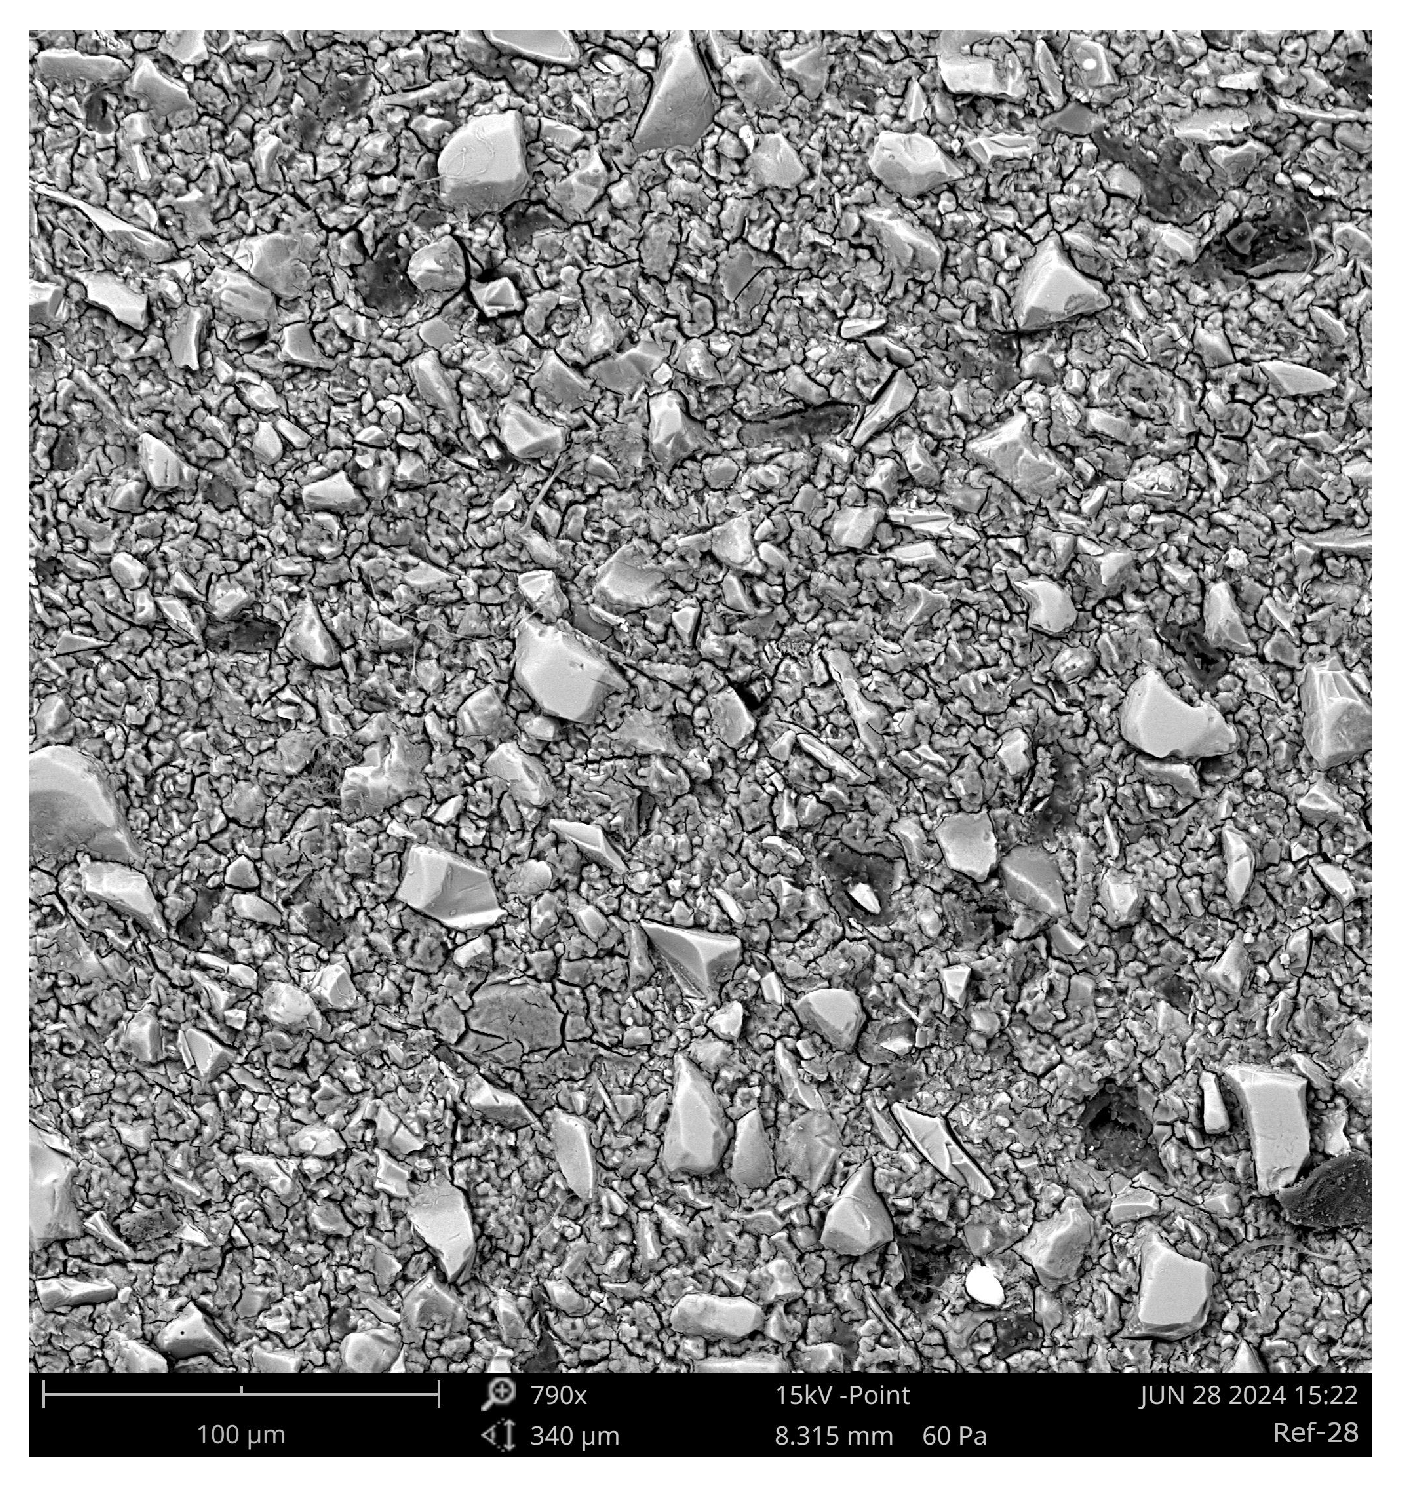
SEM micrograph of Ref GP at 28 days (790×) showing a denser gel network with a finer, tortuous pore structure and lower overall porosity compared to Aachen GP. This morphology reflects advanced alkali-activation and higher reactivity of the BFS precursor.
Figure 17.
SEM micrograph of Ref GP at 28 days (790×) showing a denser gel network with a finer, tortuous pore structure and lower overall porosity compared to Aachen GP. This morphology reflects advanced alkali-activation and higher reactivity of the BFS precursor.
Figure 18.
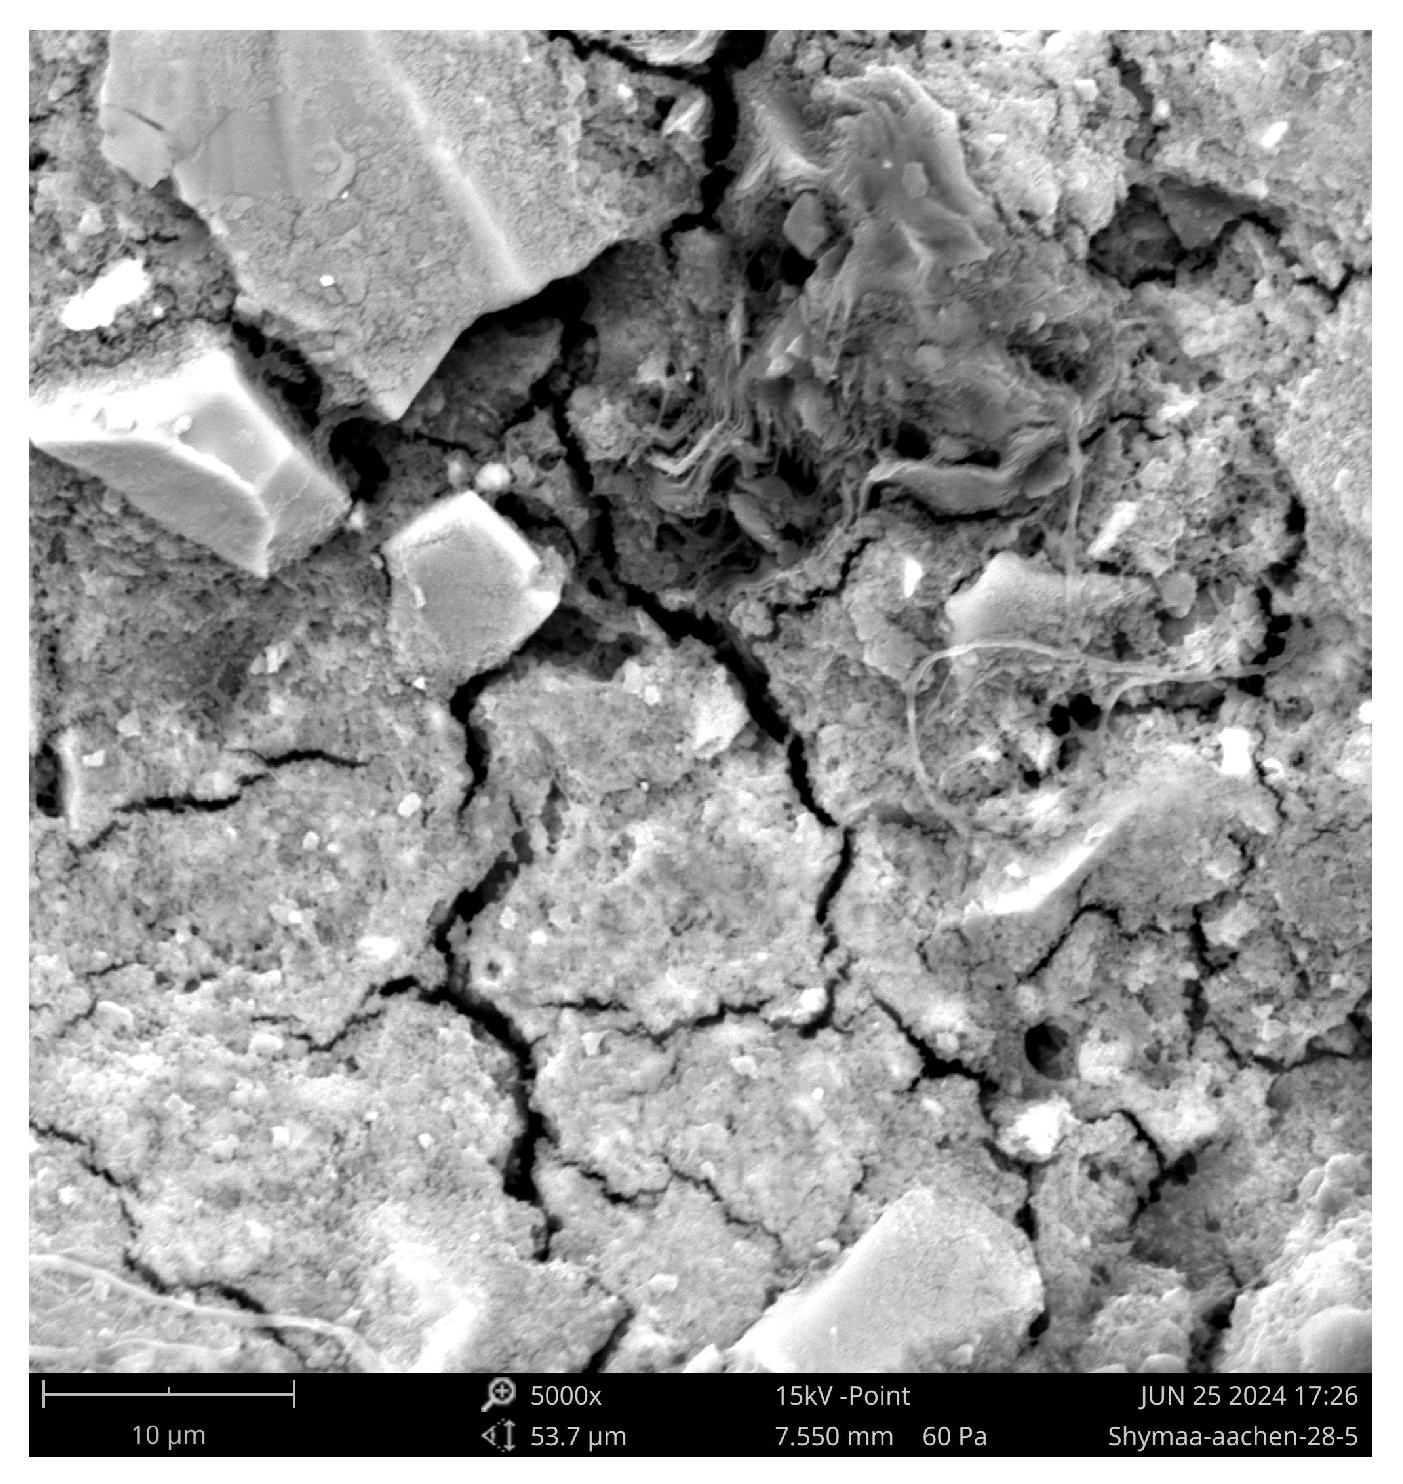
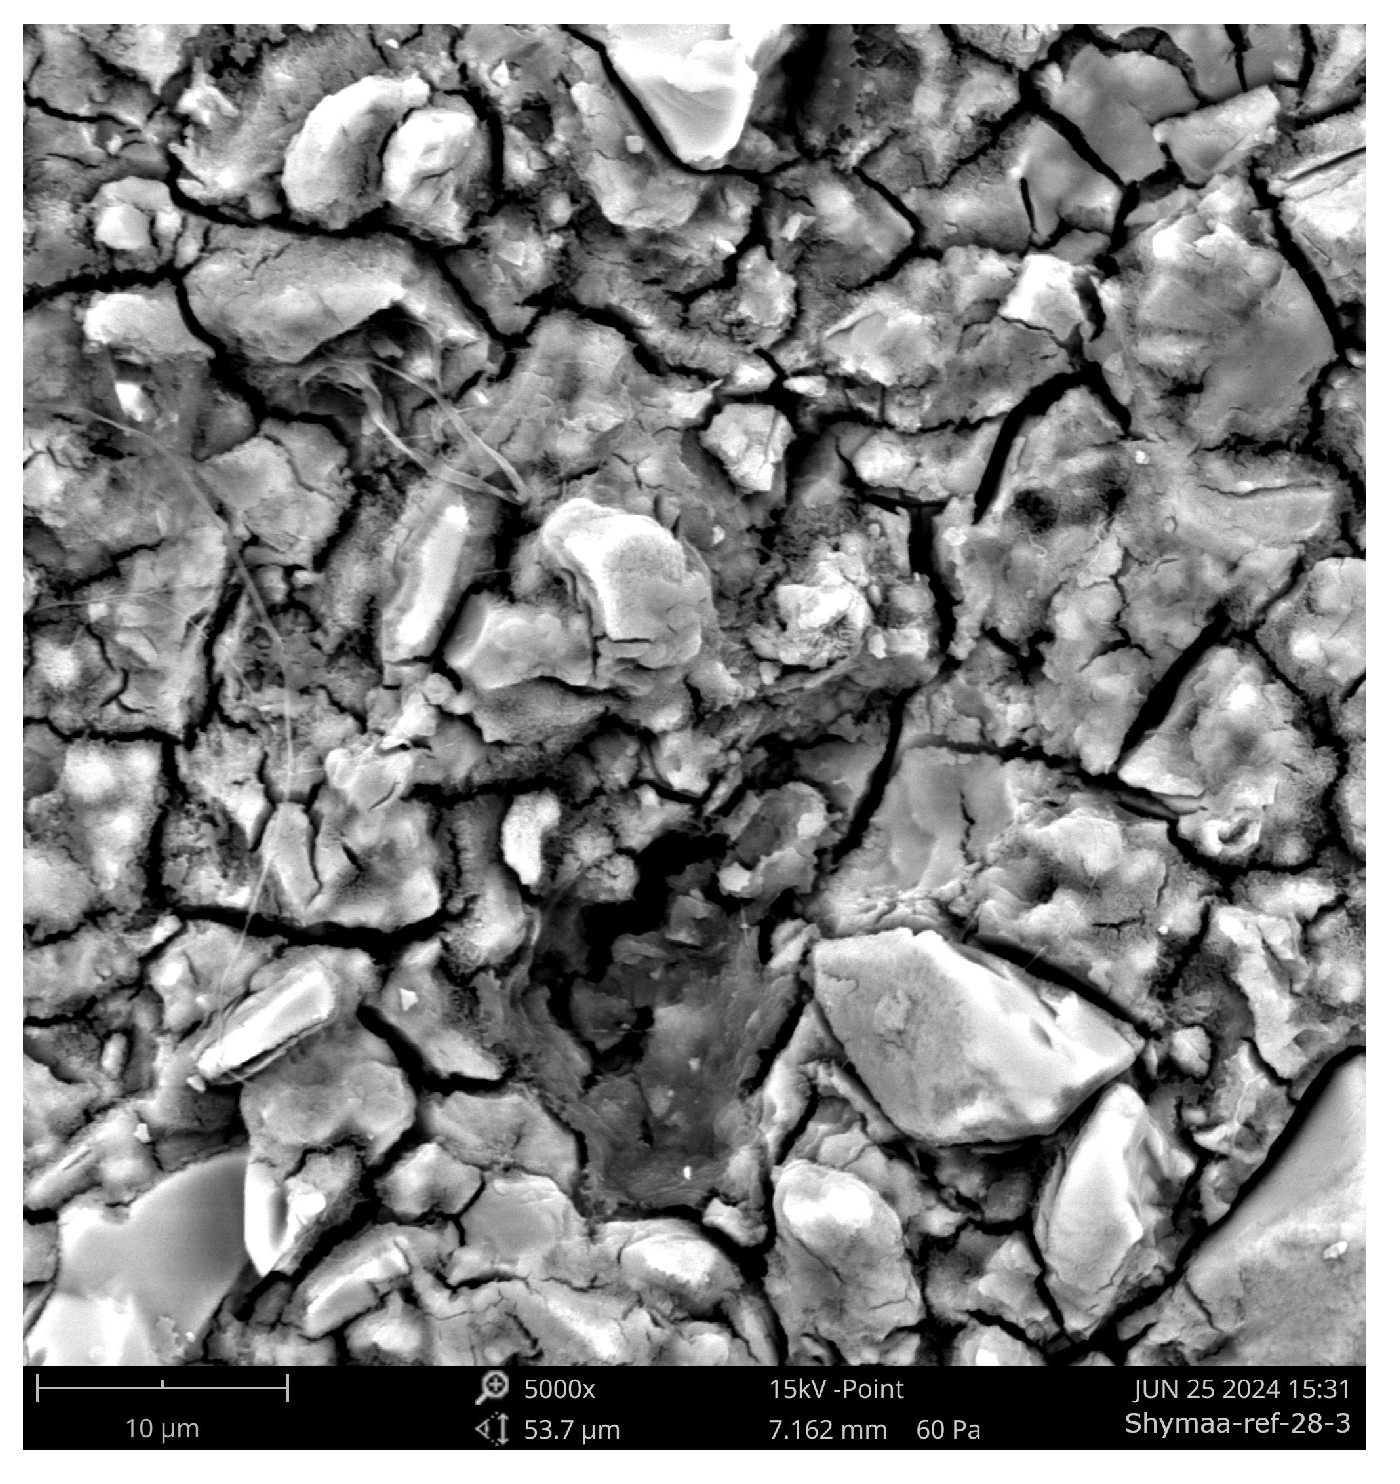
SEM micrograph of Aachen GP at 28 days (5000×) showing a rough, discontinuous gel structure with Fe-rich inclusions and irregular micropores. This morphology reflects limited densification and disruption of the gel network by iron-bearing phases.
Figure 18.
SEM micrograph of Aachen GP at 28 days (5000×) showing a rough, discontinuous gel structure with Fe-rich inclusions and irregular micropores. This morphology reflects limited densification and disruption of the gel network by iron-bearing phases.
Figure 19.
SEM micrograph of Ref GP at 28 days (5000×) showing a compact, smooth gel matrix with homogeneously distributed microporosity. Residual particles are rare, and the continuous matrix indicates advanced alkali-activation and high structural integrity.
Figure 19.
SEM micrograph of Ref GP at 28 days (5000×) showing a compact, smooth gel matrix with homogeneously distributed microporosity. Residual particles are rare, and the continuous matrix indicates advanced alkali-activation and high structural integrity.
Figure 20.
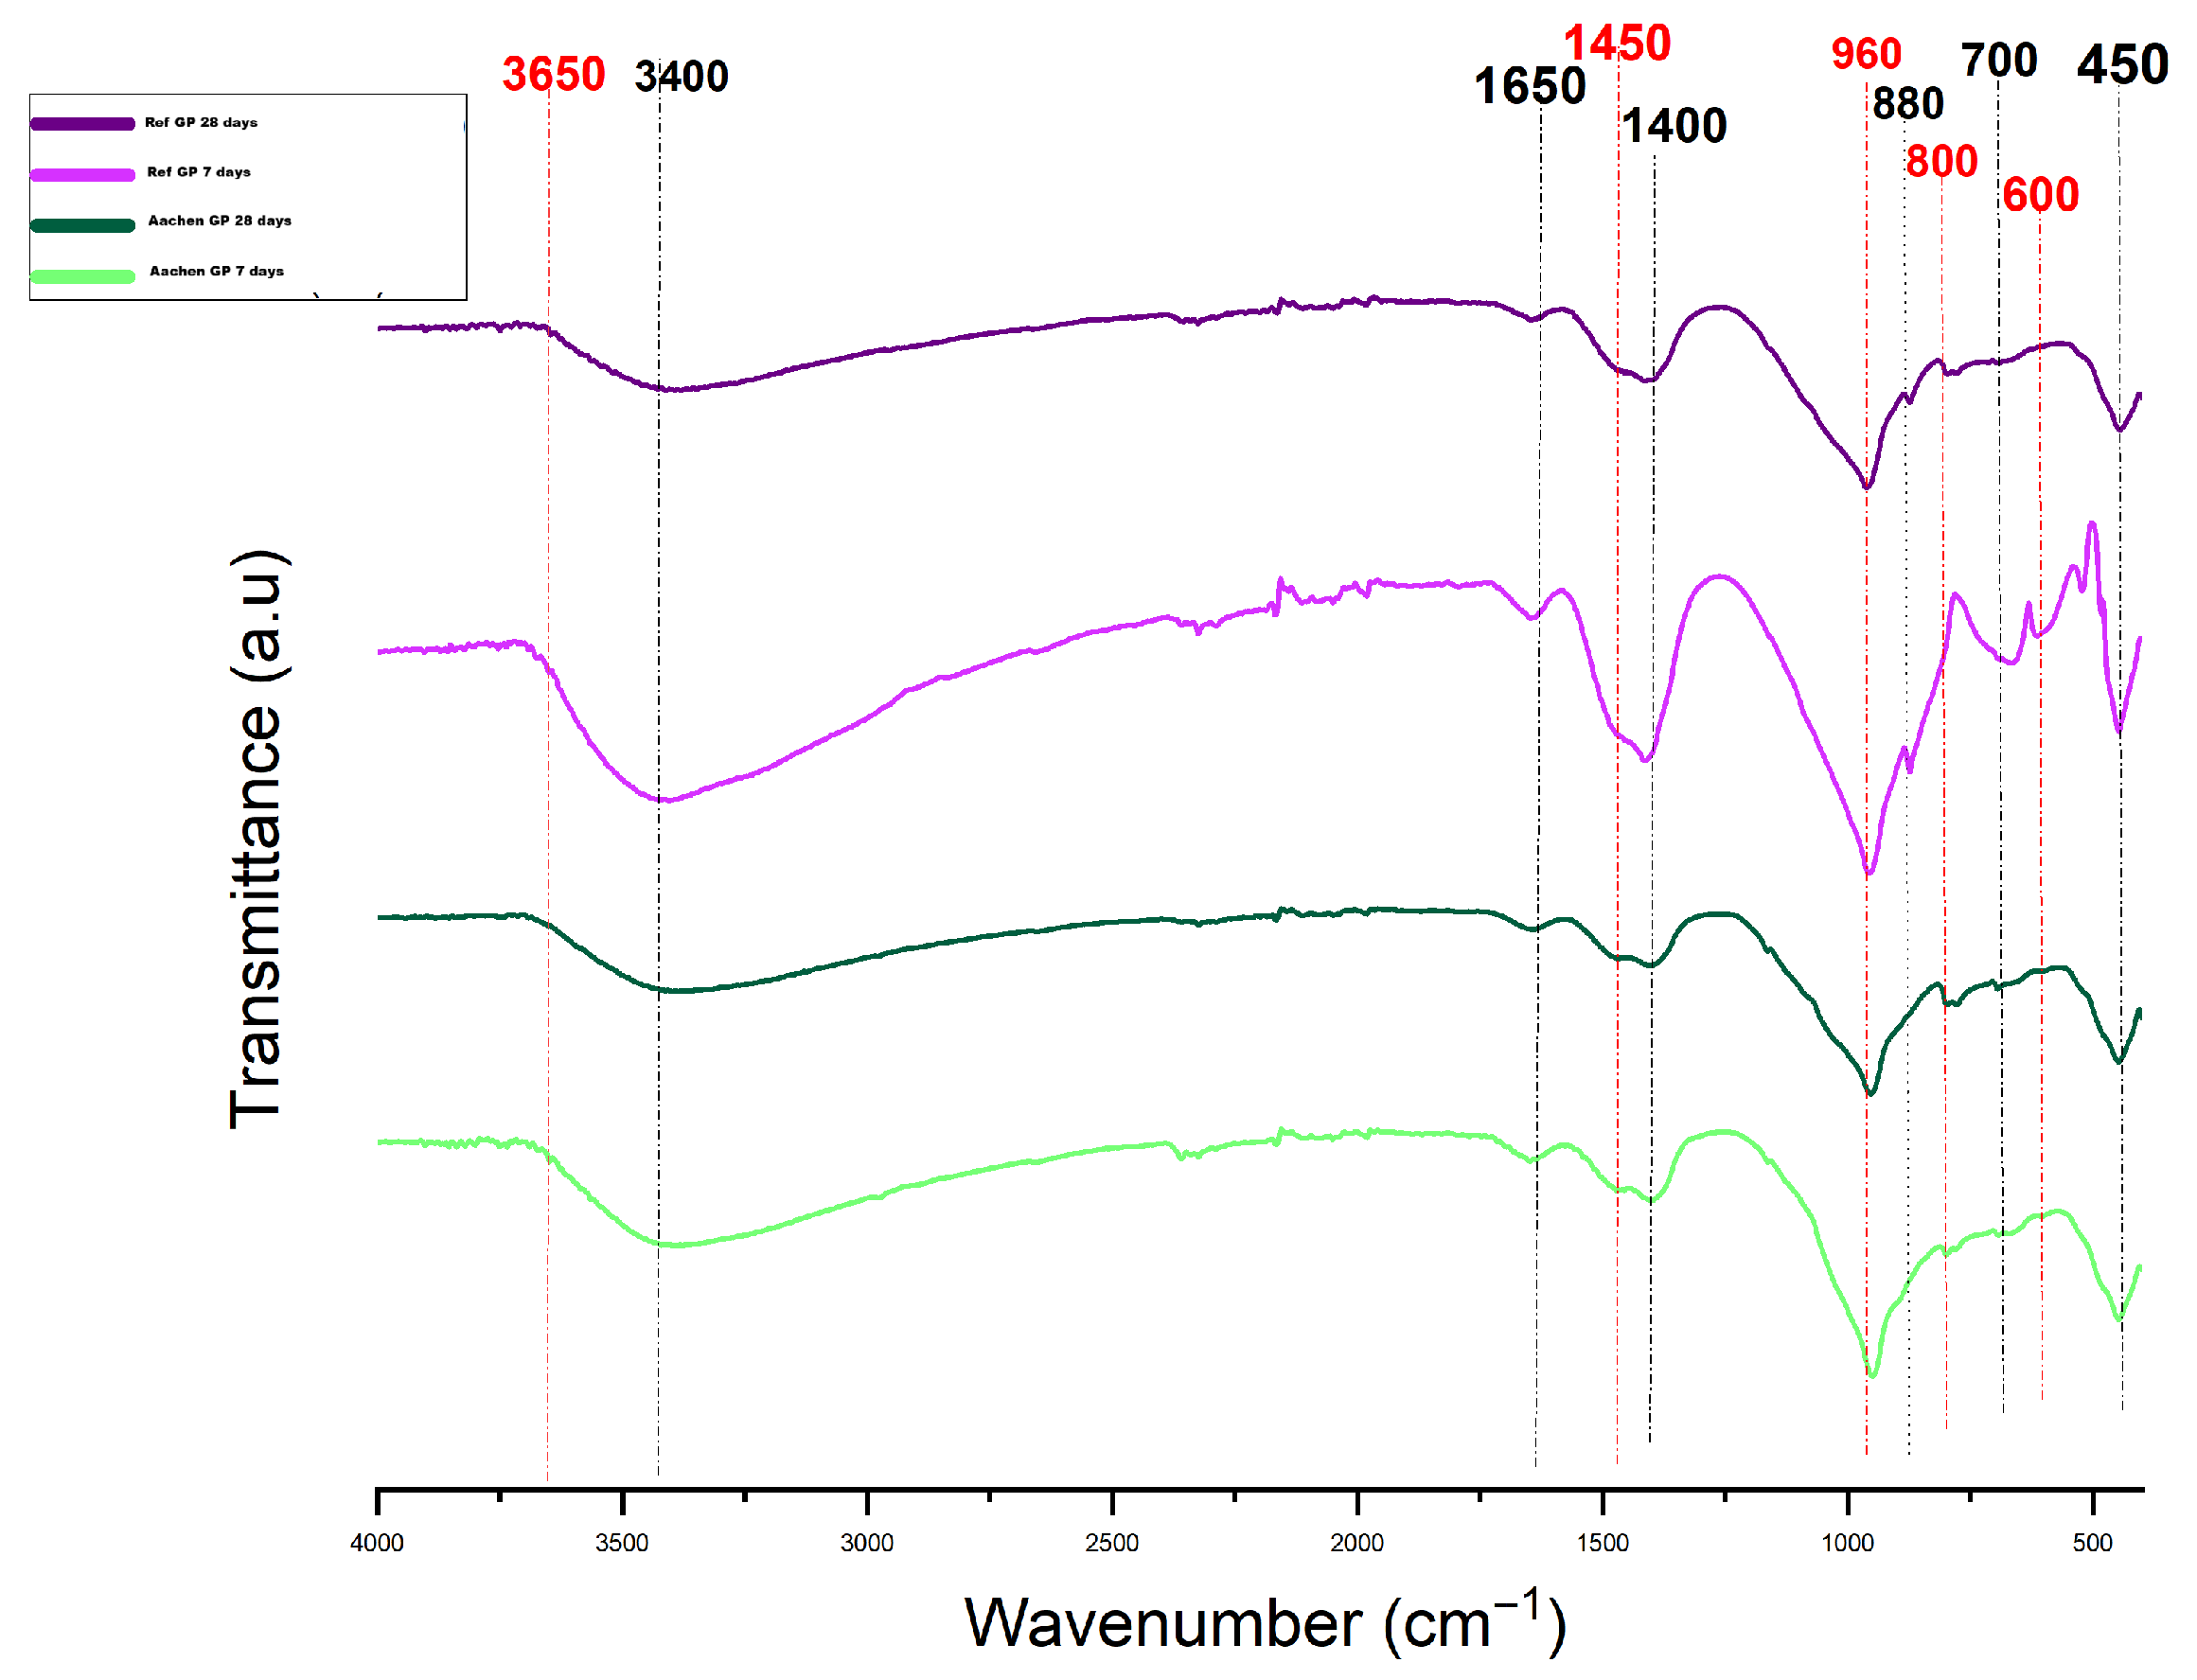
ATR-FTIR spectra of Ref GP and Aachen GP at 7 and 28 days, vertically shifted to aid visualization. The image shows the evolution of Si–O–T, Fe–O, and carbonate vibrations during alkali-activation.
Figure 20.
ATR-FTIR spectra of Ref GP and Aachen GP at 7 and 28 days, vertically shifted to aid visualization. The image shows the evolution of Si–O–T, Fe–O, and carbonate vibrations during alkali-activation.
Figure 21.
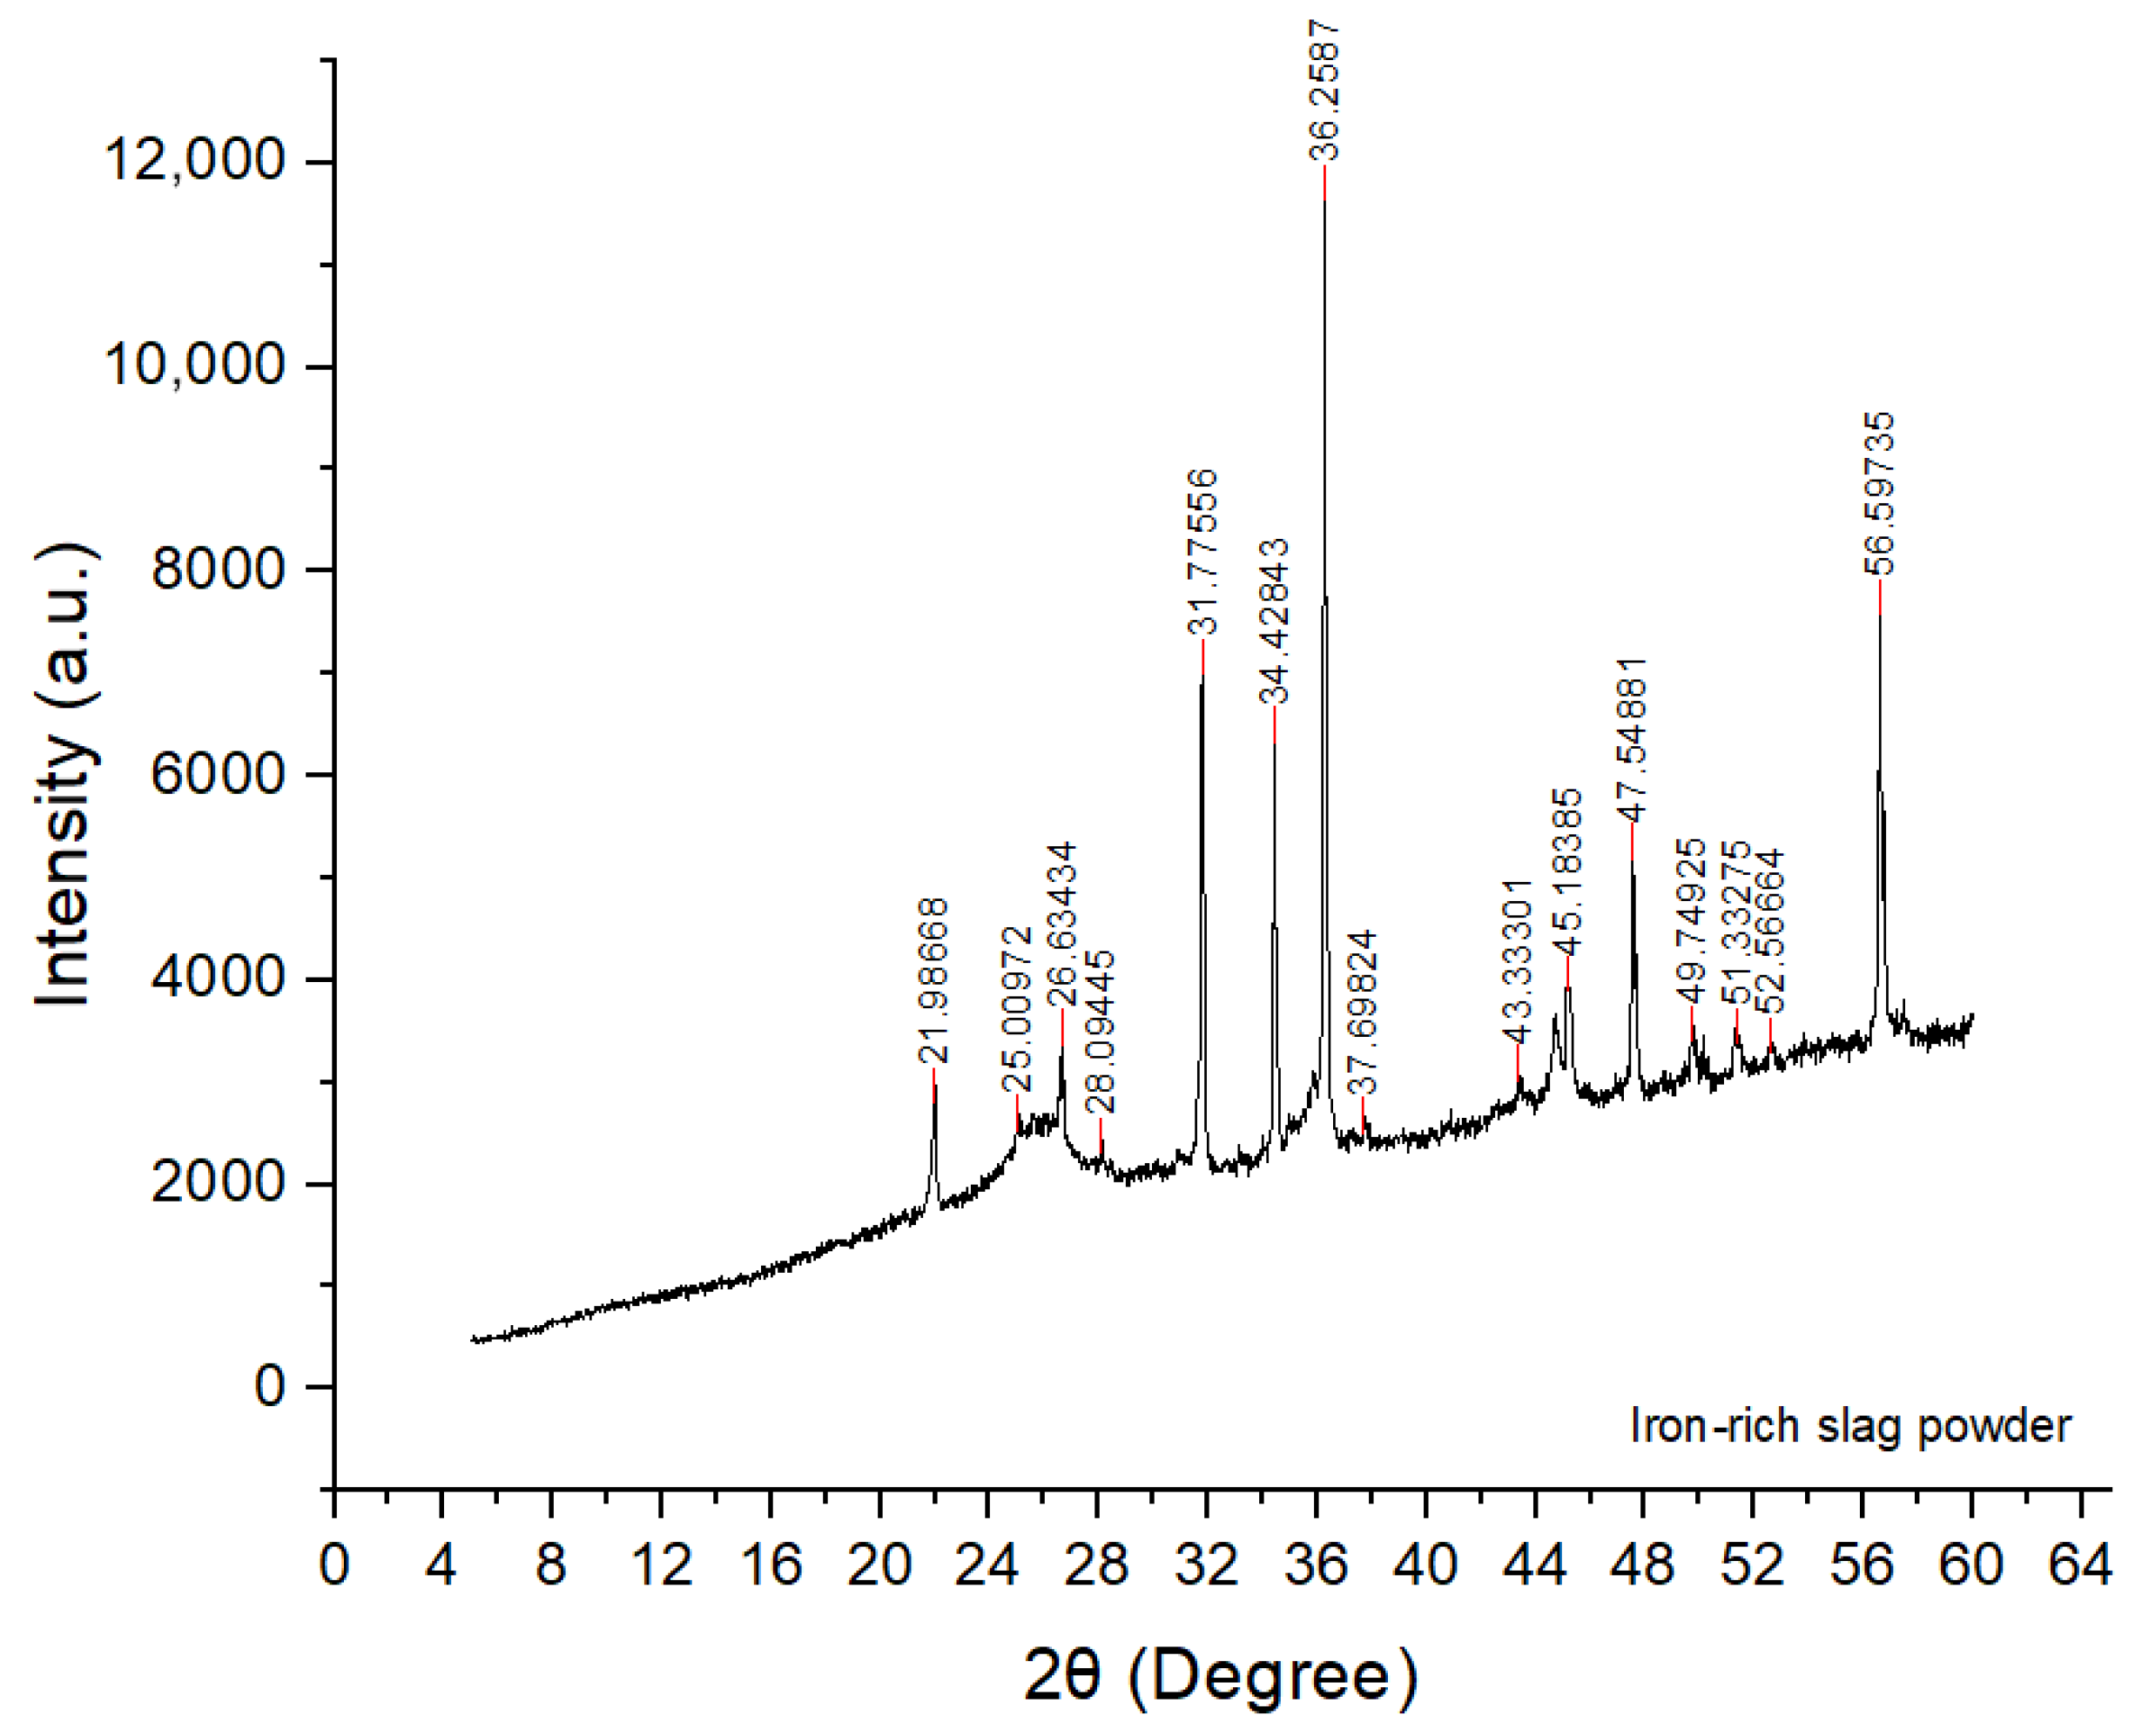
XRD pattern of the raw iron-rich slag, showing a broad amorphous hump (15°–35° 2) superimposed with crystalline reflections. Major crystalline phases and diagnostic reflections are: fayalite (Fe2SiO4; 25.0°, 31.7°, 34.4°, 51.3°, 52.5°), hematite (Fe2O3; 24.2°, 37.7°, 49.8°; 33–36° 2 peaks coincide with ZnO reflections), magnetite (Fe3O4; 43.3°), quartz (26.6°), cristobalite (21.9°), feldspar/melilite-type (28.1°), and minor Fe–silicide (FeSi; 26.6°, tentative). High-intensity lines at 31.8°, 34.4°, 36.3°, 47.5°, and 56.6° correspond to the ZnO internal standard.
Figure 22.
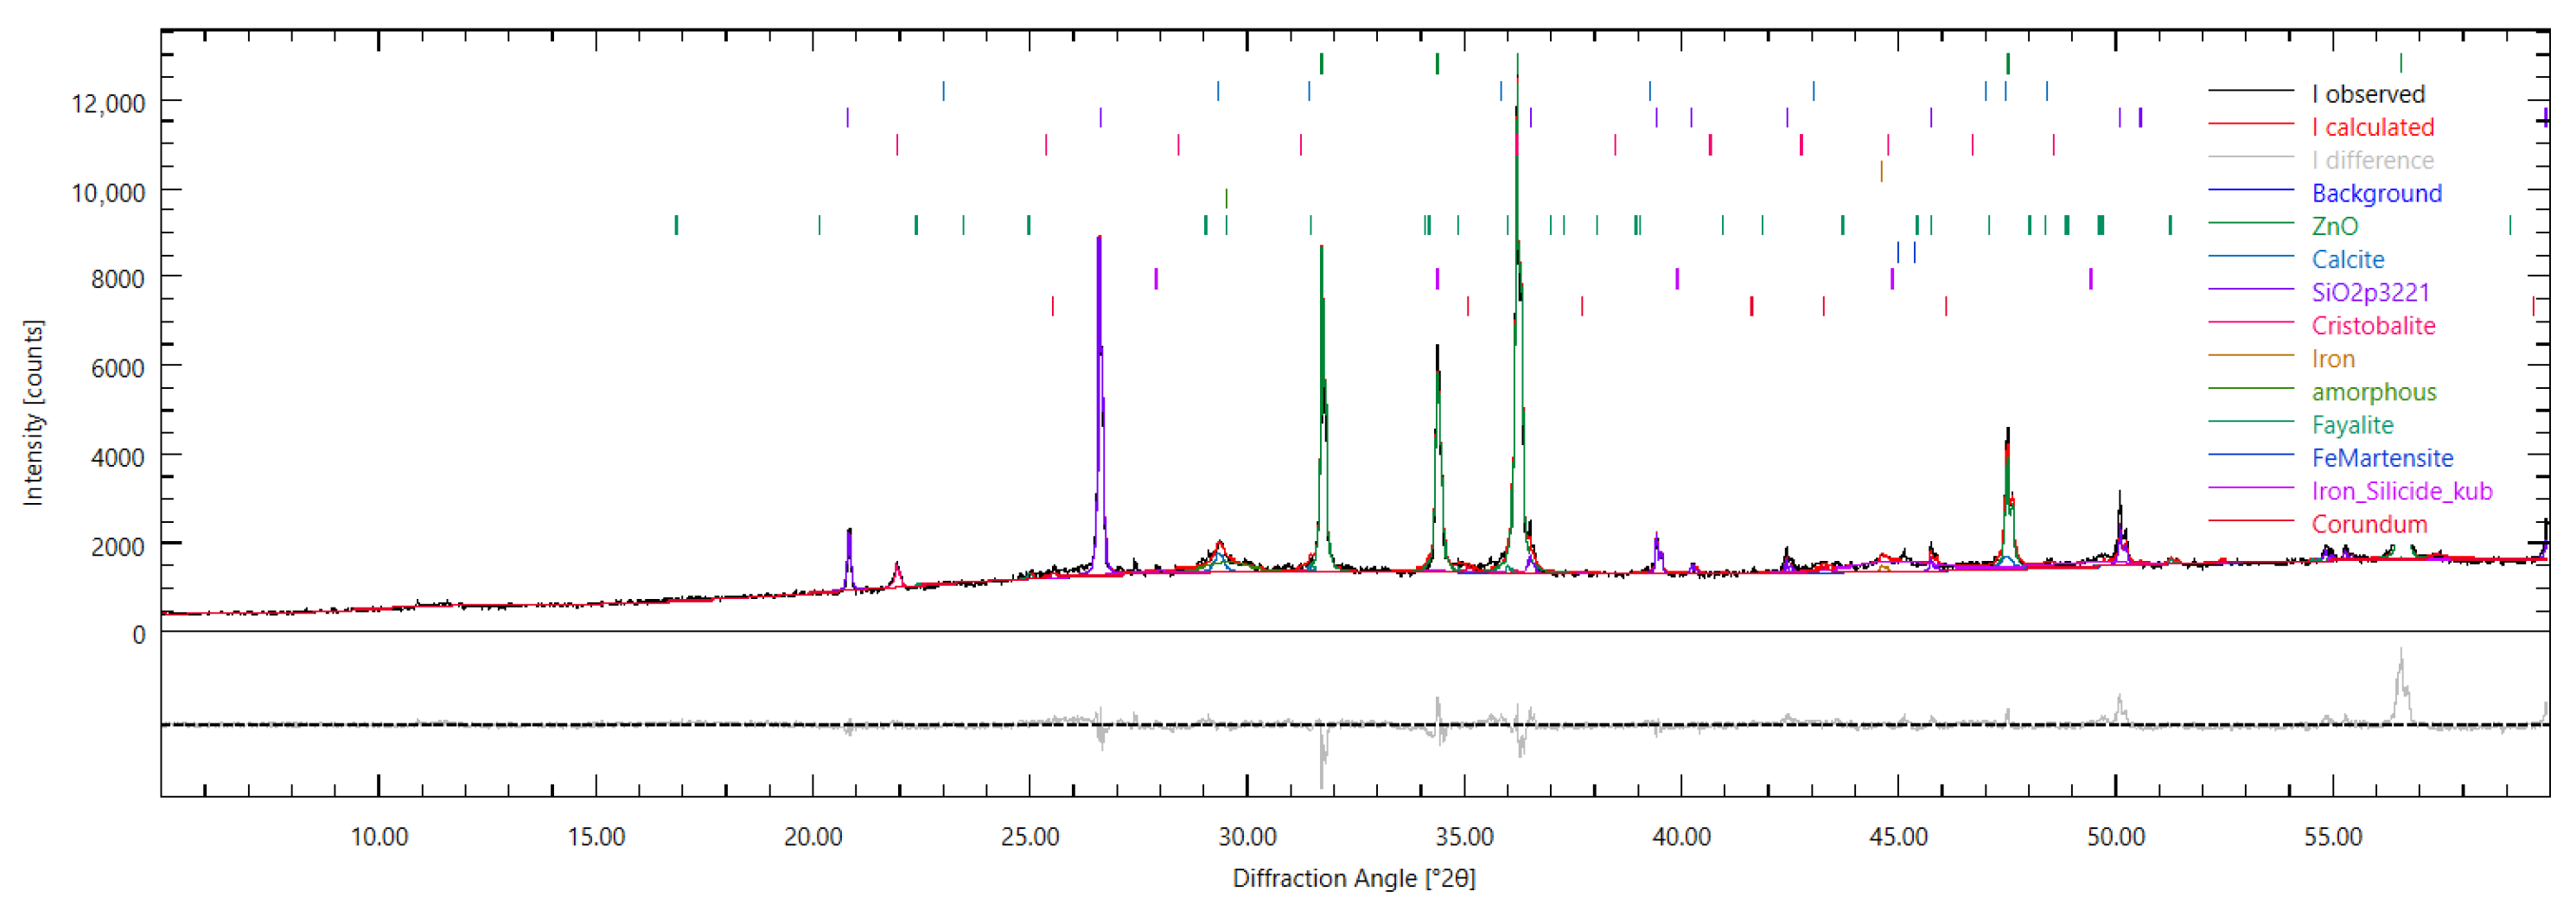
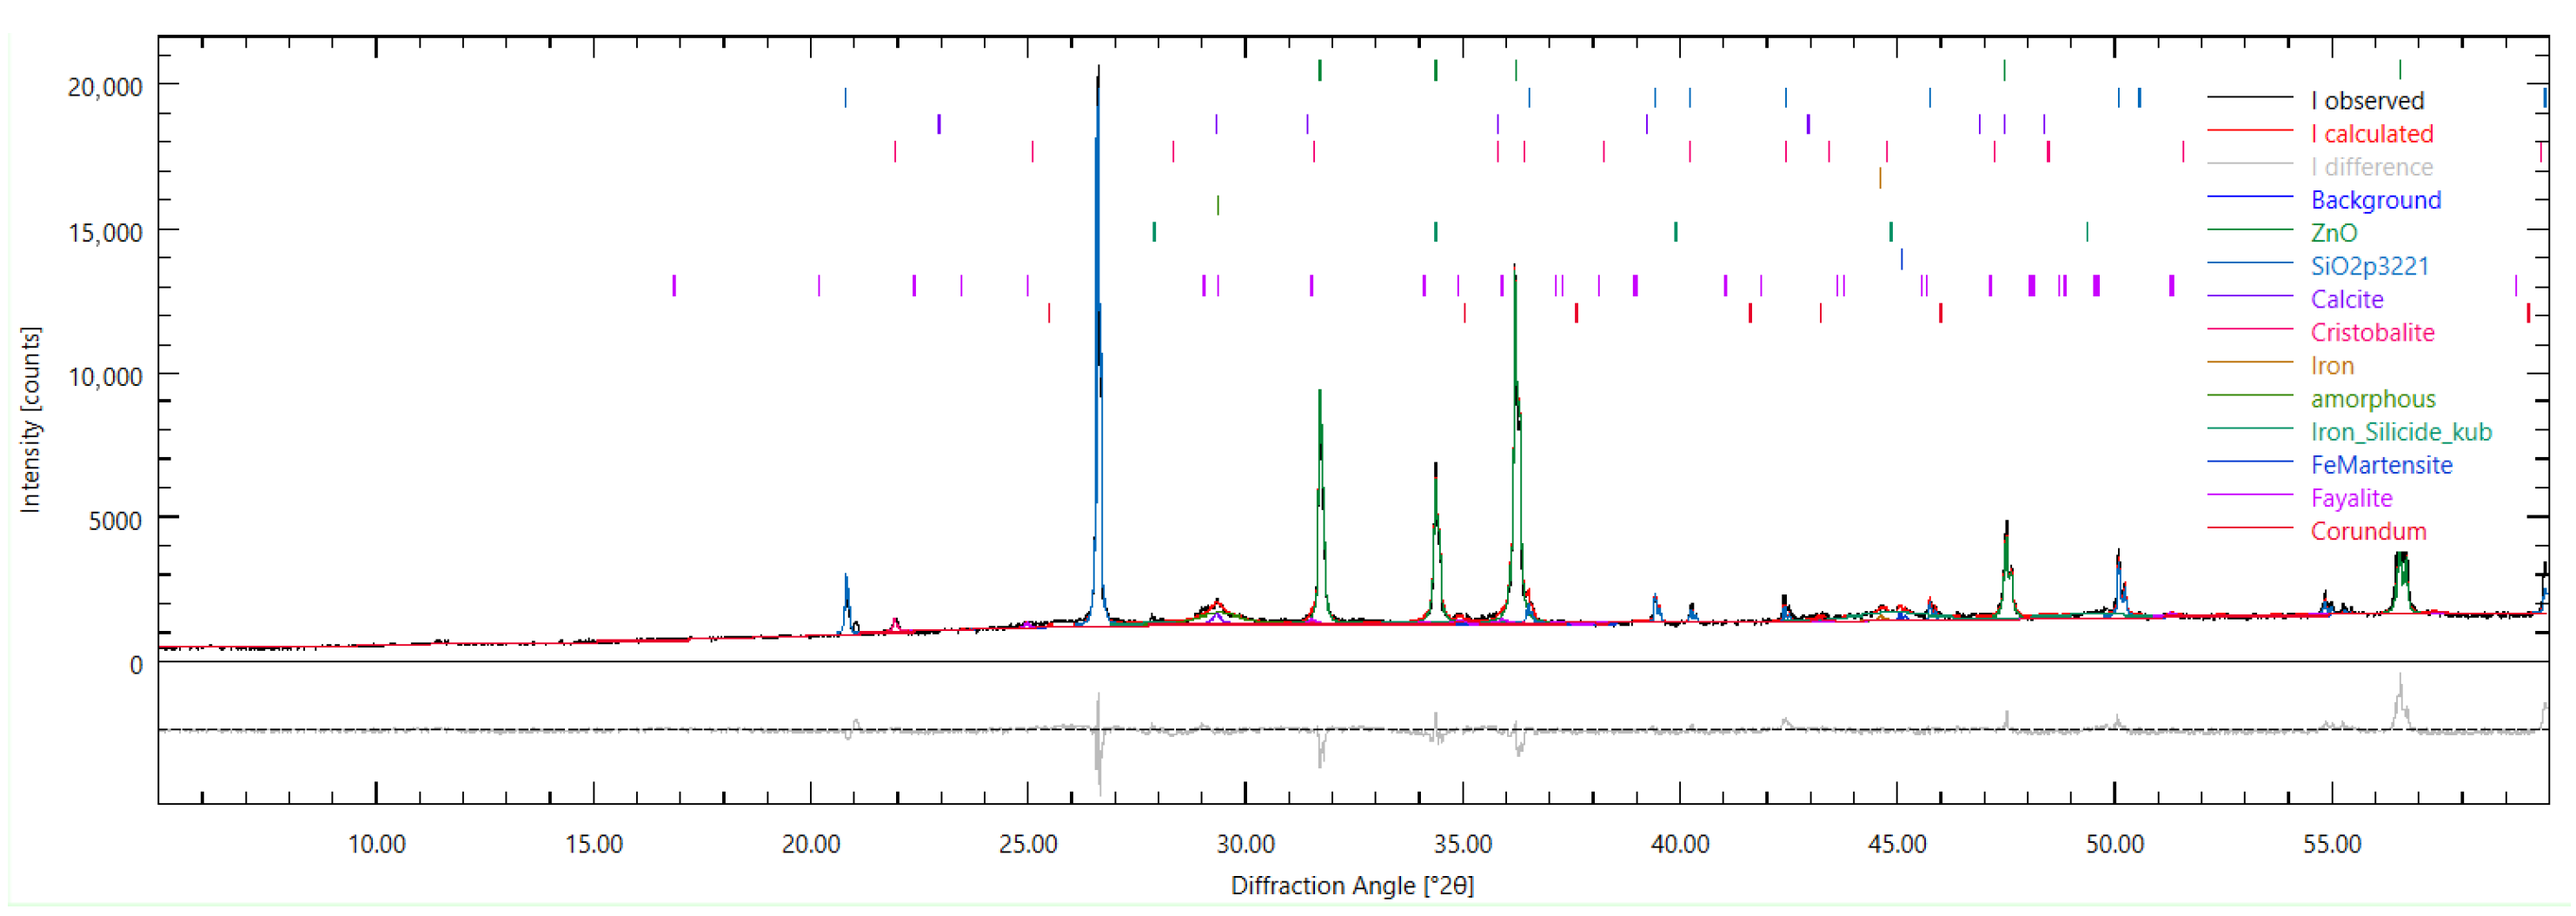
Powder XRD pattern of Aachen GP at 7 days (Bragg–Brentano, –, Cu K, Å; 5–60° ). Black = measured intensity; red = calculated pattern after Rietveld refinement (Profex/BGMN); fitted background is shown; the lower trace is the difference (observed−calculated); colored ticks mark Bragg positions of the refined phases. A broad hump between ∼20–36° indicates the amorphous alkali-activated gel. Low-intensity reflections assigned by the refinement include calcite (∼29.4°), cristobalite (∼21.9°), quartz (∼26.6°), and fayalite (e.g., ∼25.0° with supporting peaks at 51–53°). Corundum (-Al2O3) is present at low intensity (e.g., ∼25.6°, 52.6°). ZnO internal-standard peaks are visible at ∼31.8°, 34.4°, 36.3°, 47.5°, and 56.6°.
Figure 23.
Powder XRD pattern of Aachen GP at 28 days (Bragg–Brentano, –, Cu K, λ = 1.5456 Å; 5–60° ). Black = measured intensity; red = calculated pattern after Rietveld refinement (Profex/BGMN); grey = fitted background; lower trace = difference (observed–calculated); colored ticks mark Bragg positions of the refined phases. A broad hump between ∼20–36° indicates a dominant amorphous gel fraction. Reflections assigned by the refinement include SiO2 polymorphs (quartz at ∼26.6°; cristobalite at ∼21.9°), calcite (e.g., ∼29.4° and higher-angle companions), and an Fe-bearing silicate (fayalite; e.g., ∼25.0° with supporting peaks at ∼51–53°). Additional minor reflections between ∼44–48° are observed but remain inconclusive without further confirmation. ZnO internal-standard peaks (∼31.8°, 34.4°, 36.3°, 47.5°, 56.6°) are also visible.
Figure 24.
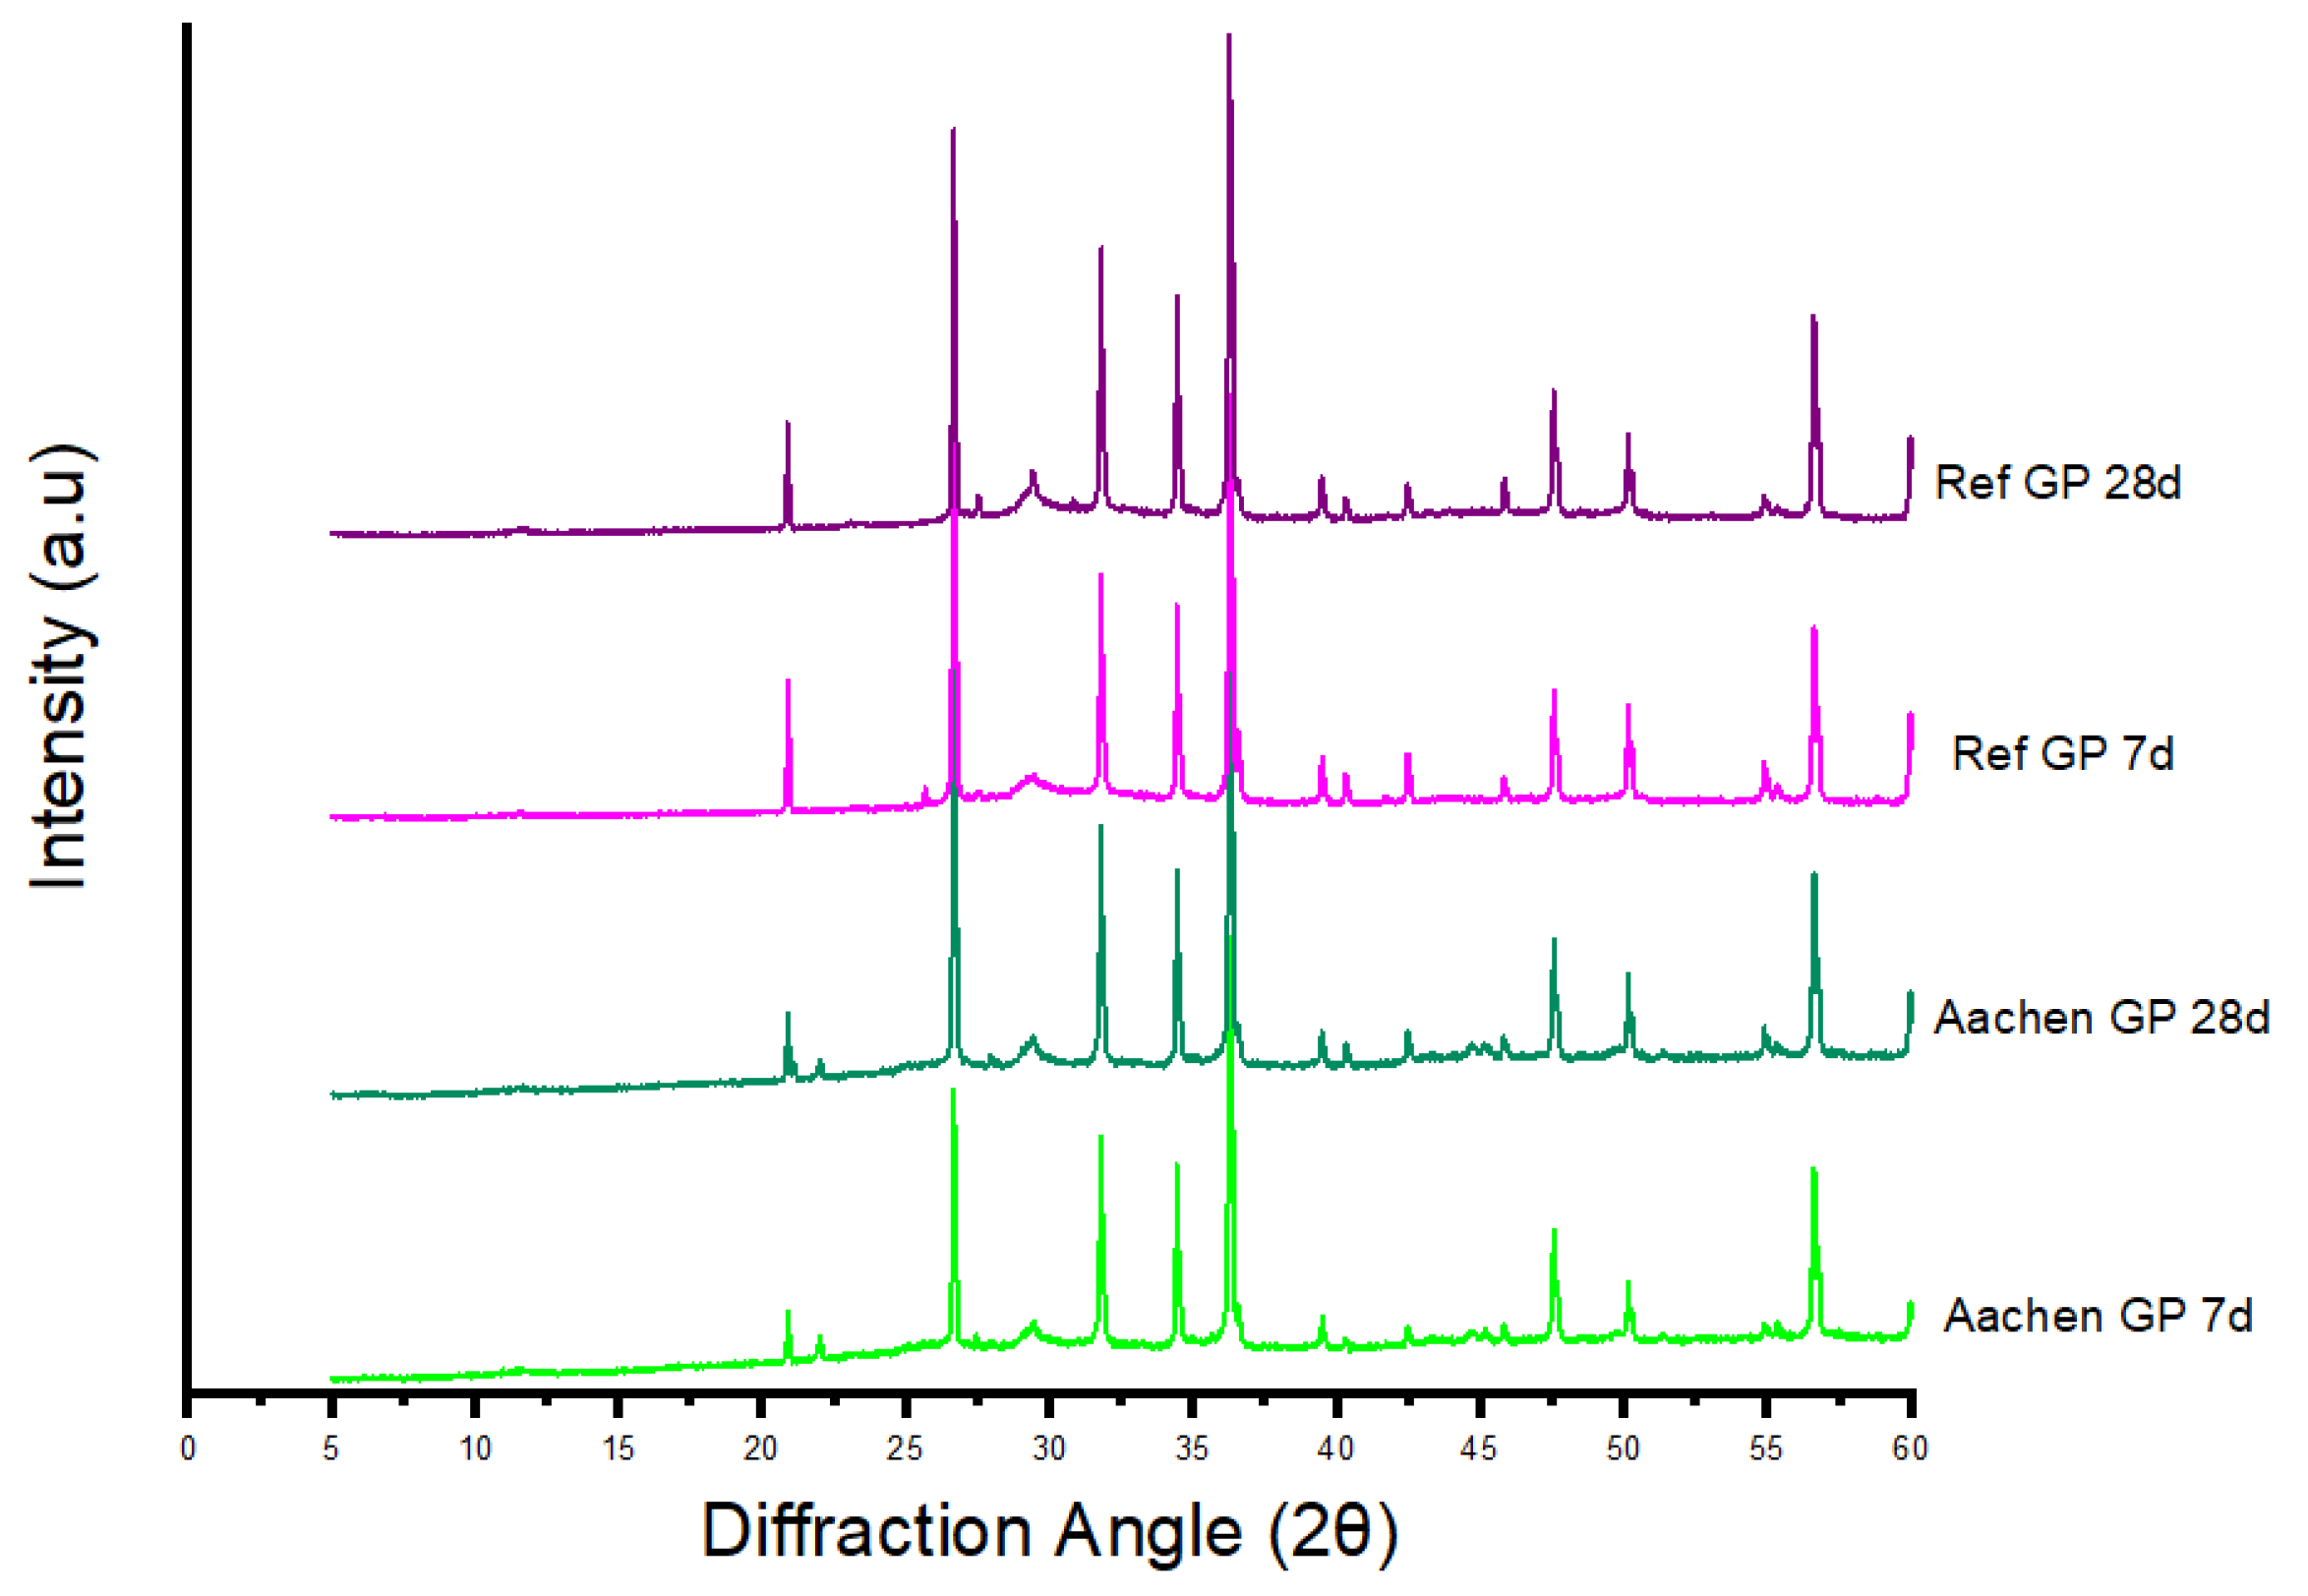
Stacked XRD patterns for Aachen GP, and Ref GP. Attenuation of fayalite-related reflections (∼25.0°) from the raw slag to the activated binders highlights partial dissolution of Fe-silicates, while the broad amorphous hump (20–36°) becomes prominent after activation. Residual quartz (26.6°) remains visible in both systems. Possible Fe-oxide lines in the 33–36° region coincide with ZnO and are not resolved.
Figure 25.
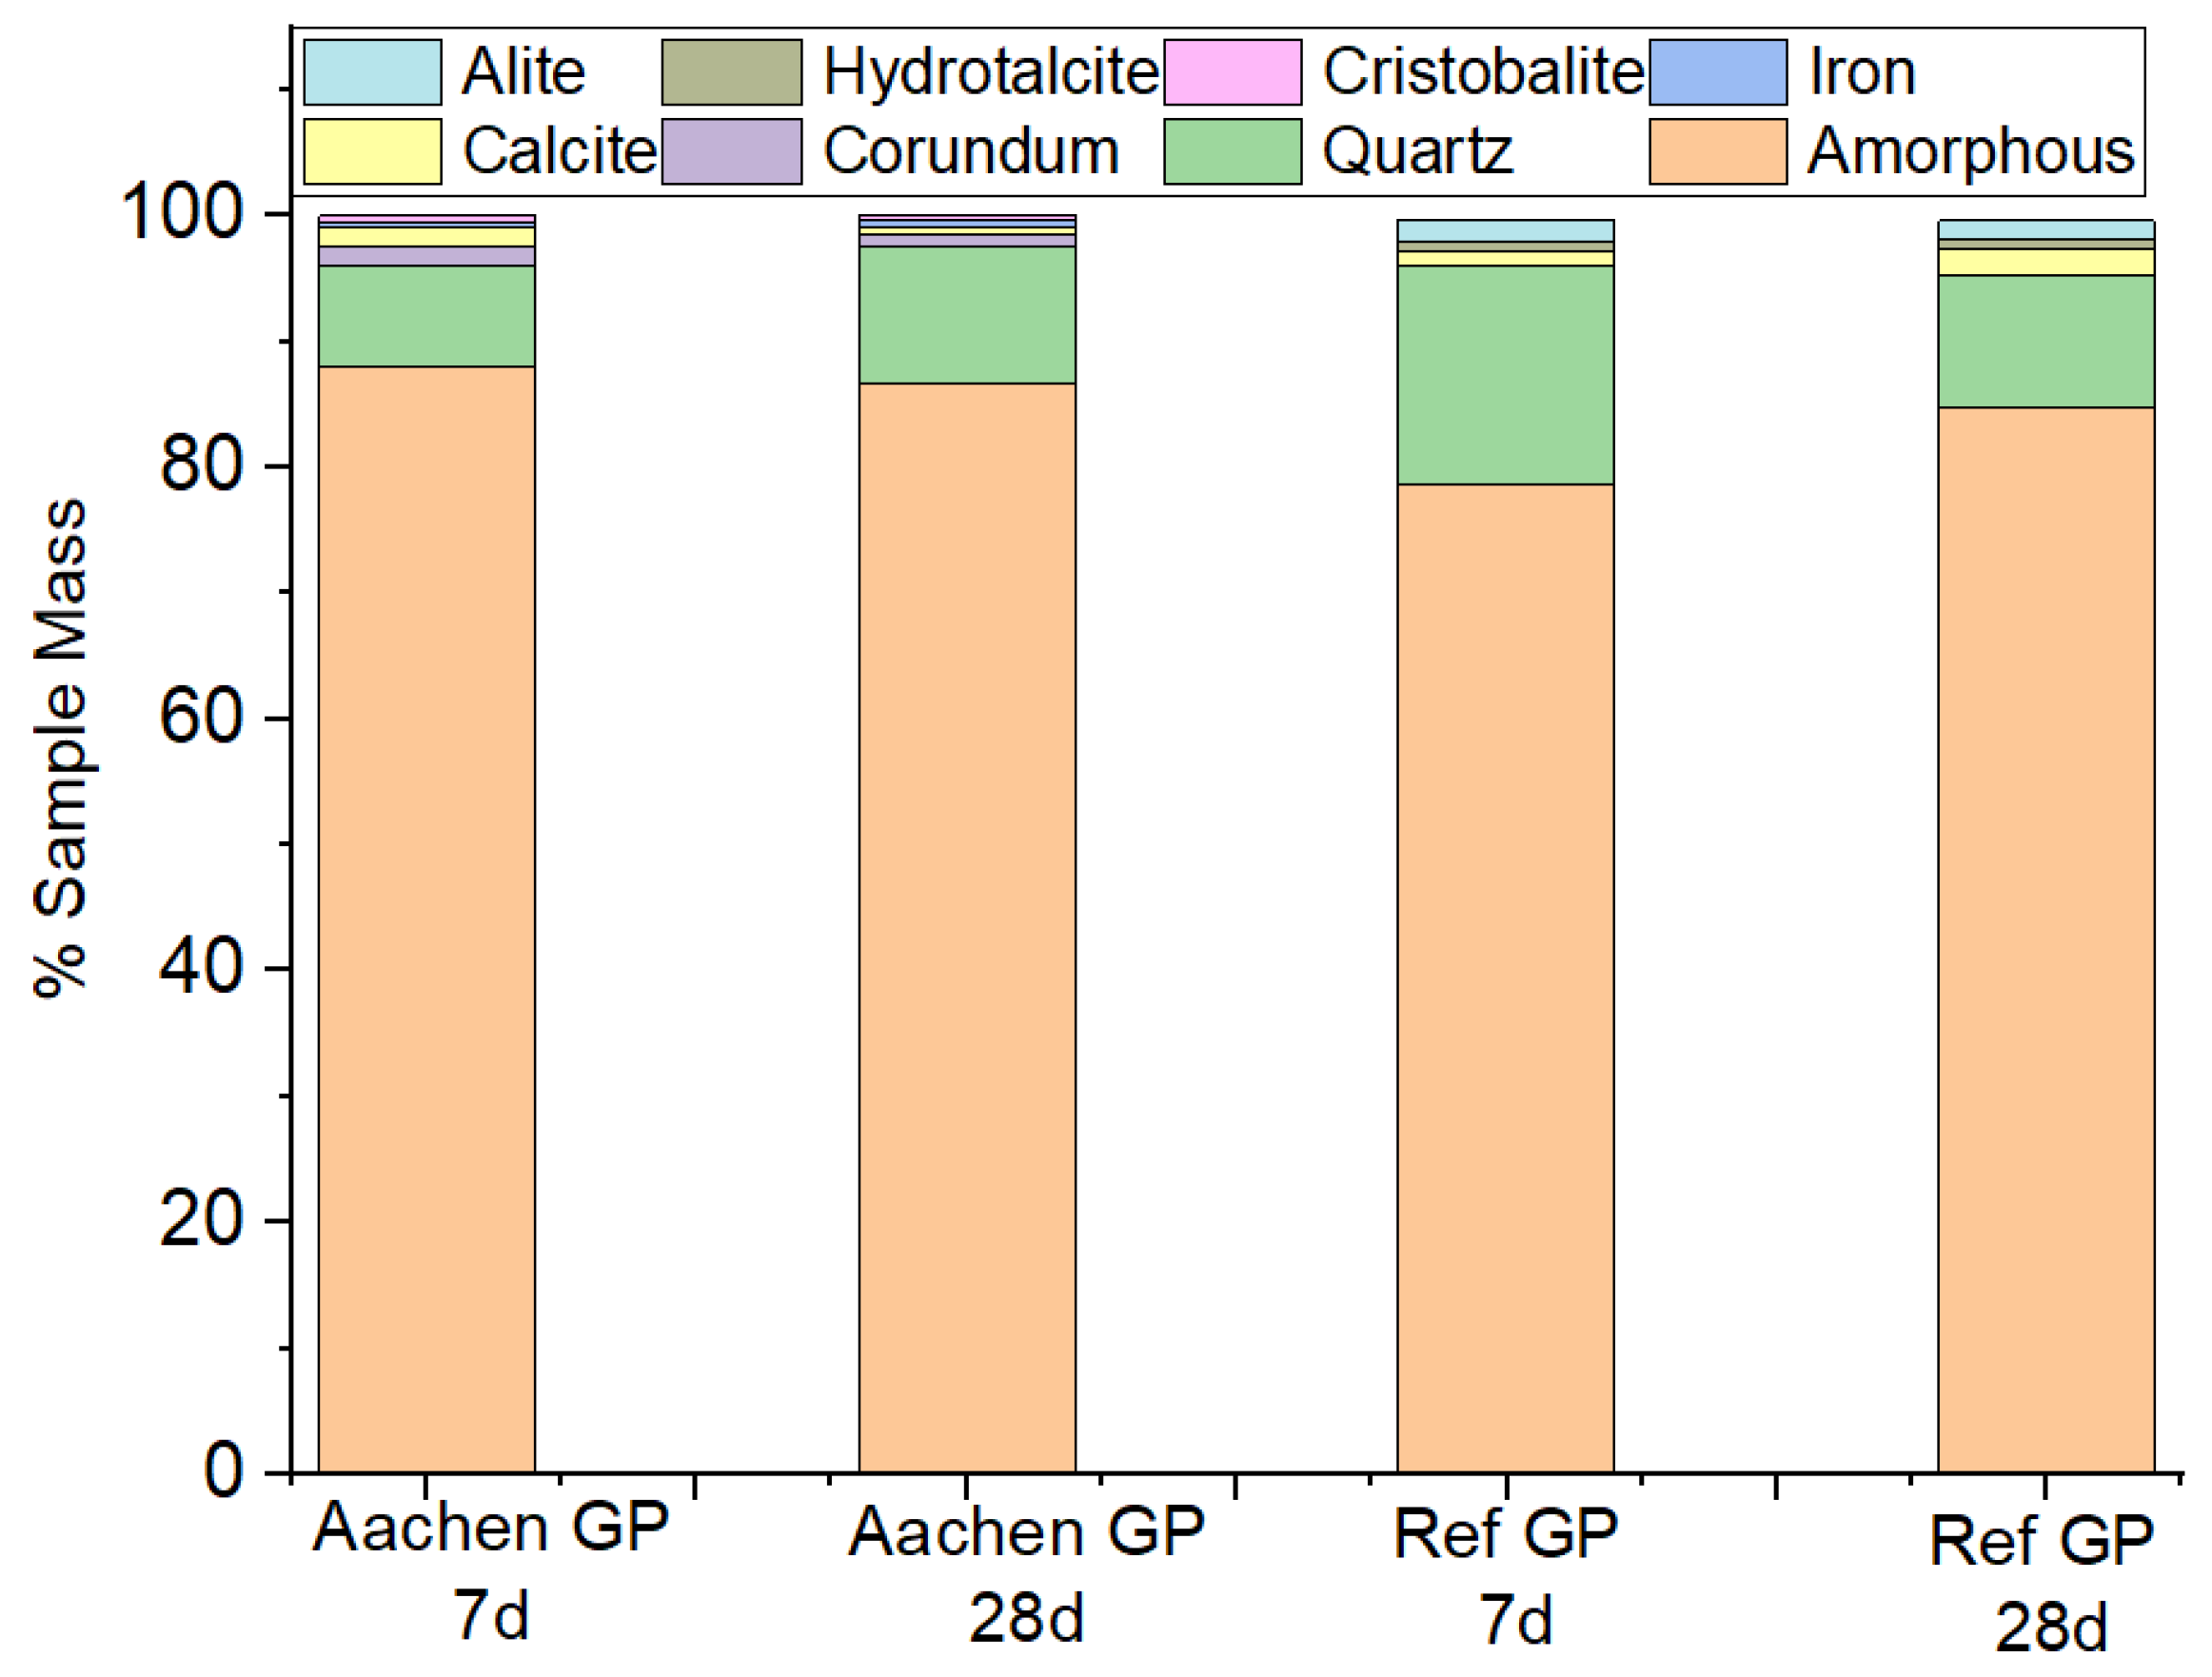
Quantitative phase composition of Ref GP and Aachen GP at 7 and 28 days derived from Rietveld refinement. The amorphous fraction dominates in all samples (>75%), while crystalline phases such as quartz, calcite, cristobalite, and minor corundum persist as residual components. Aachen GP exhibits a slightly higher amorphous fraction but comparable crystalline residues across curing ages, confirming limited phase transformation in the Fe-rich system.
Figure 26.
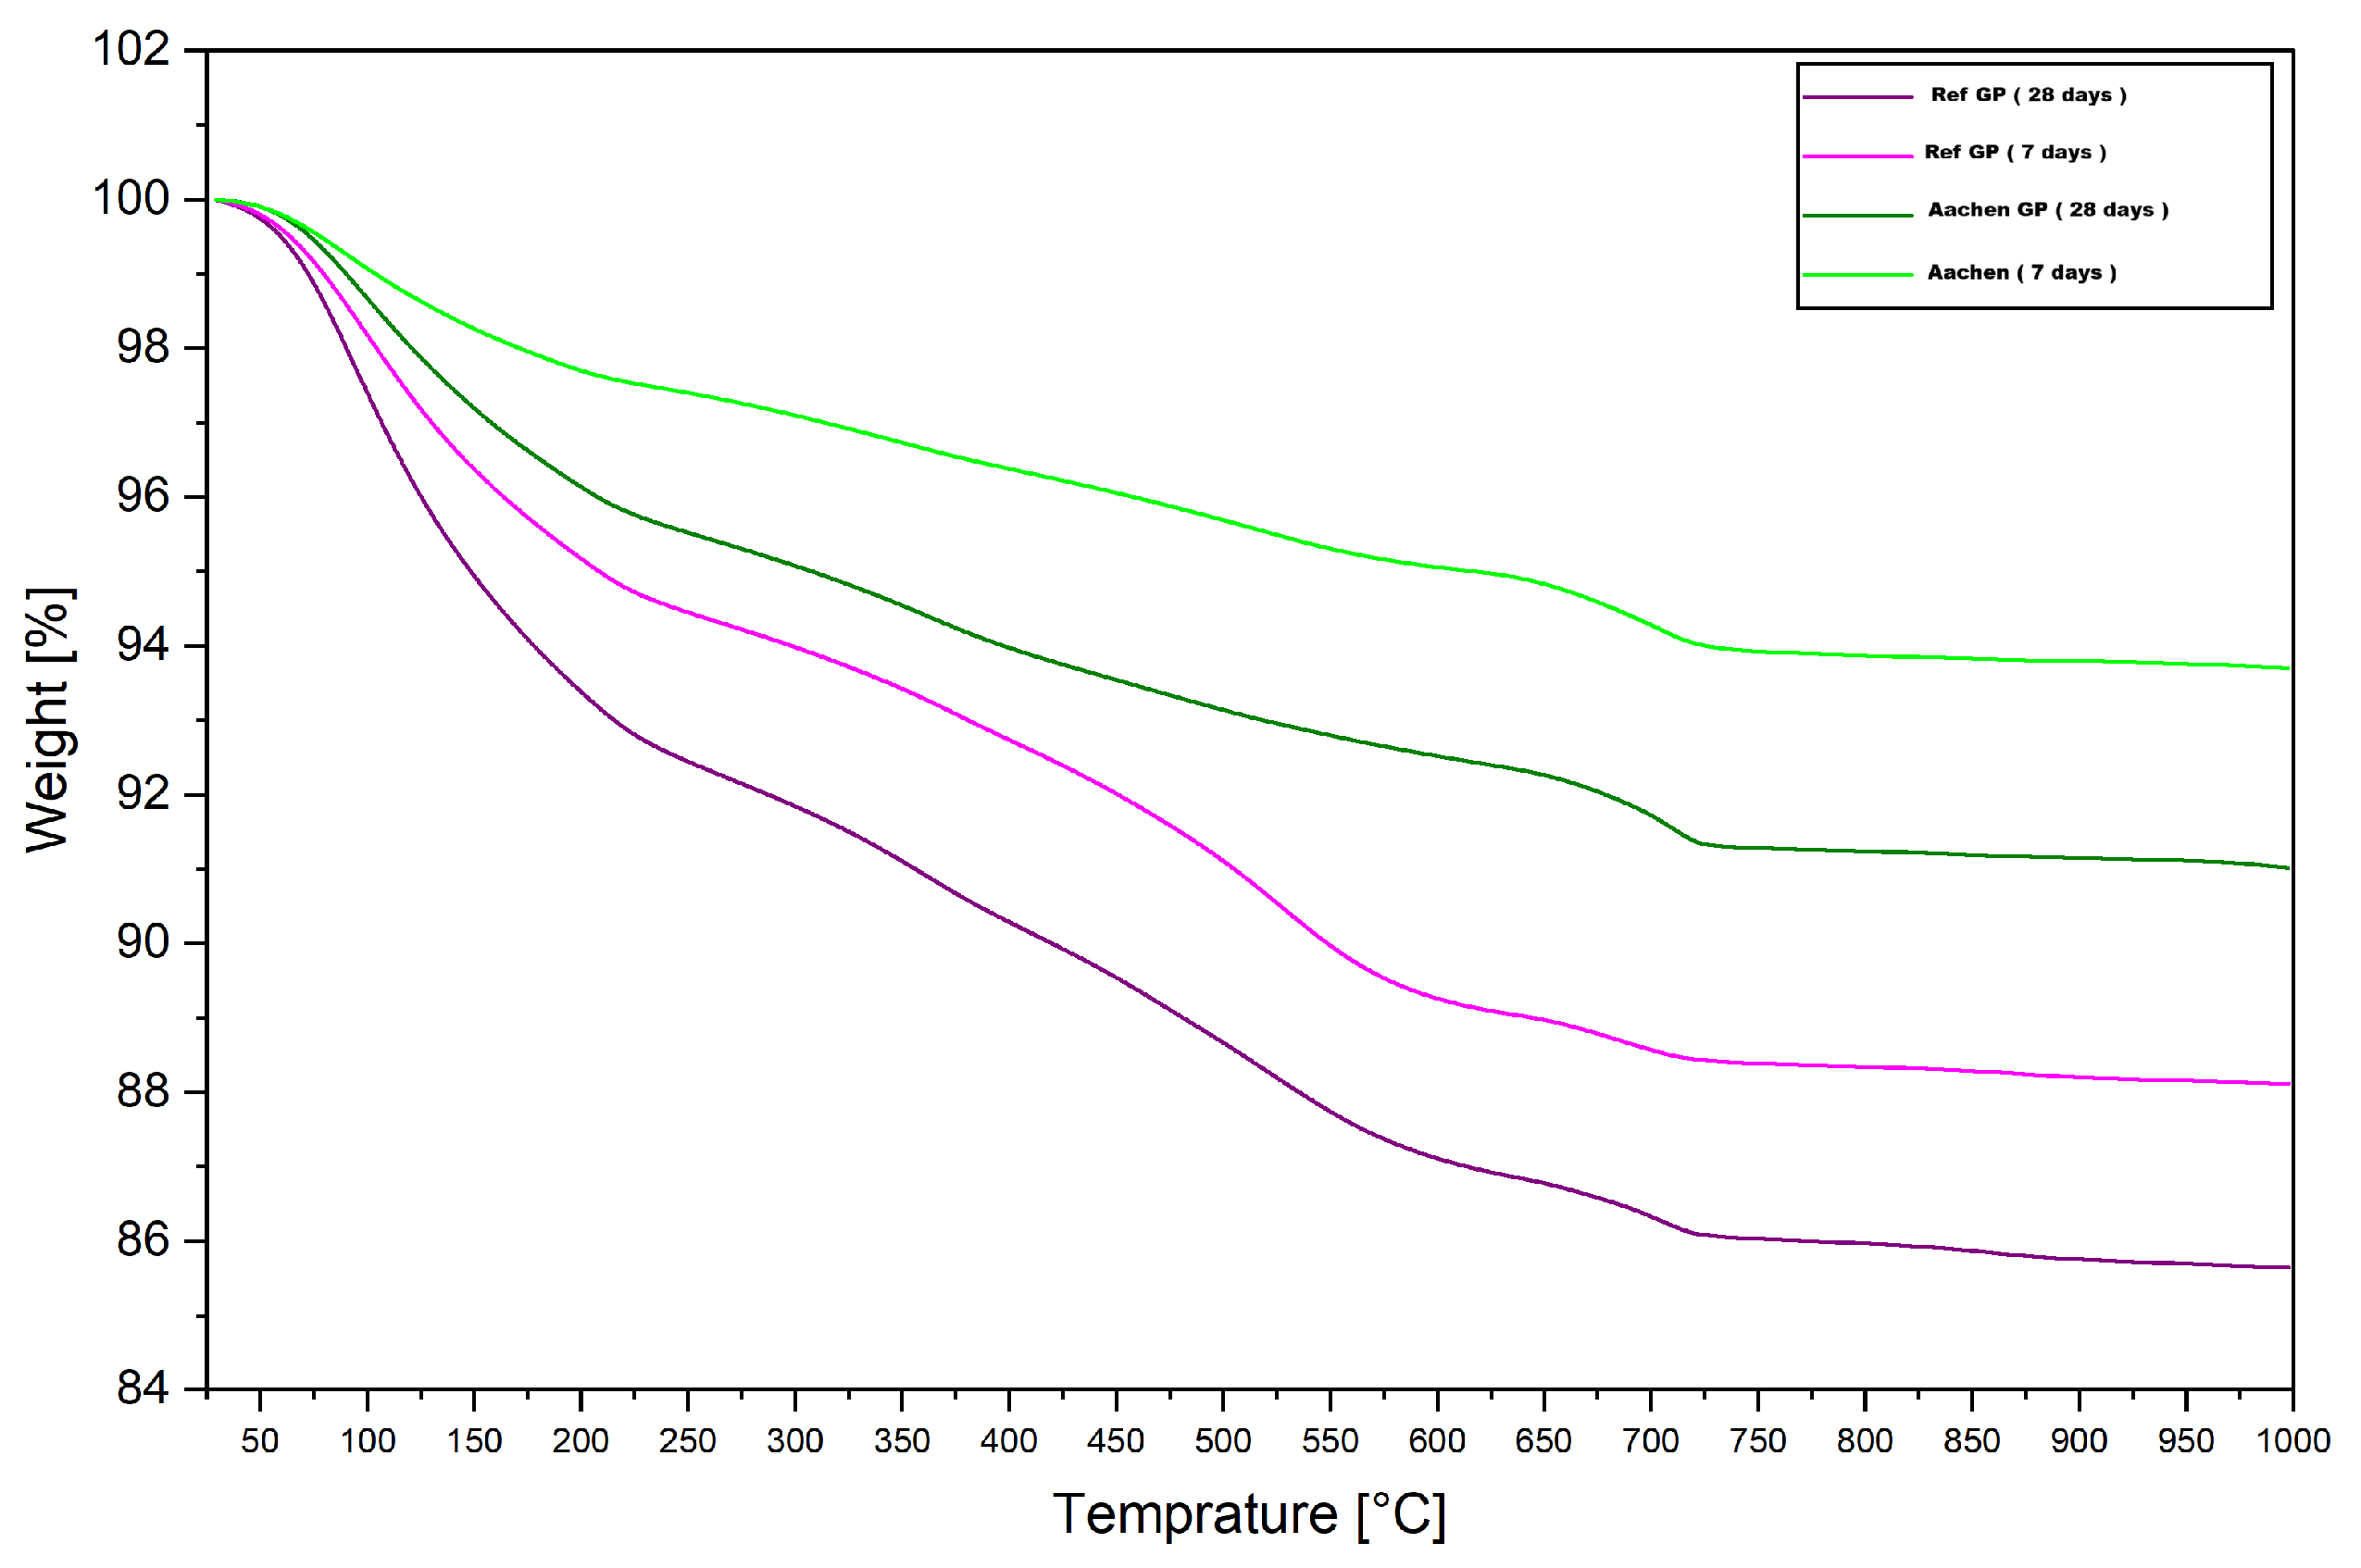
TGA curves of Ref GP and Aachen GP at 7 and 28 days. The TGA curves illustrate the total weight loss as a function of temperature, corresponding to the release of physically adsorbed water, bound water from gel phases, and decomposition of minor crystalline phases.
Figure 26.
TGA curves of Ref GP and Aachen GP at 7 and 28 days. The TGA curves illustrate the total weight loss as a function of temperature, corresponding to the release of physically adsorbed water, bound water from gel phases, and decomposition of minor crystalline phases.
Figure 27.
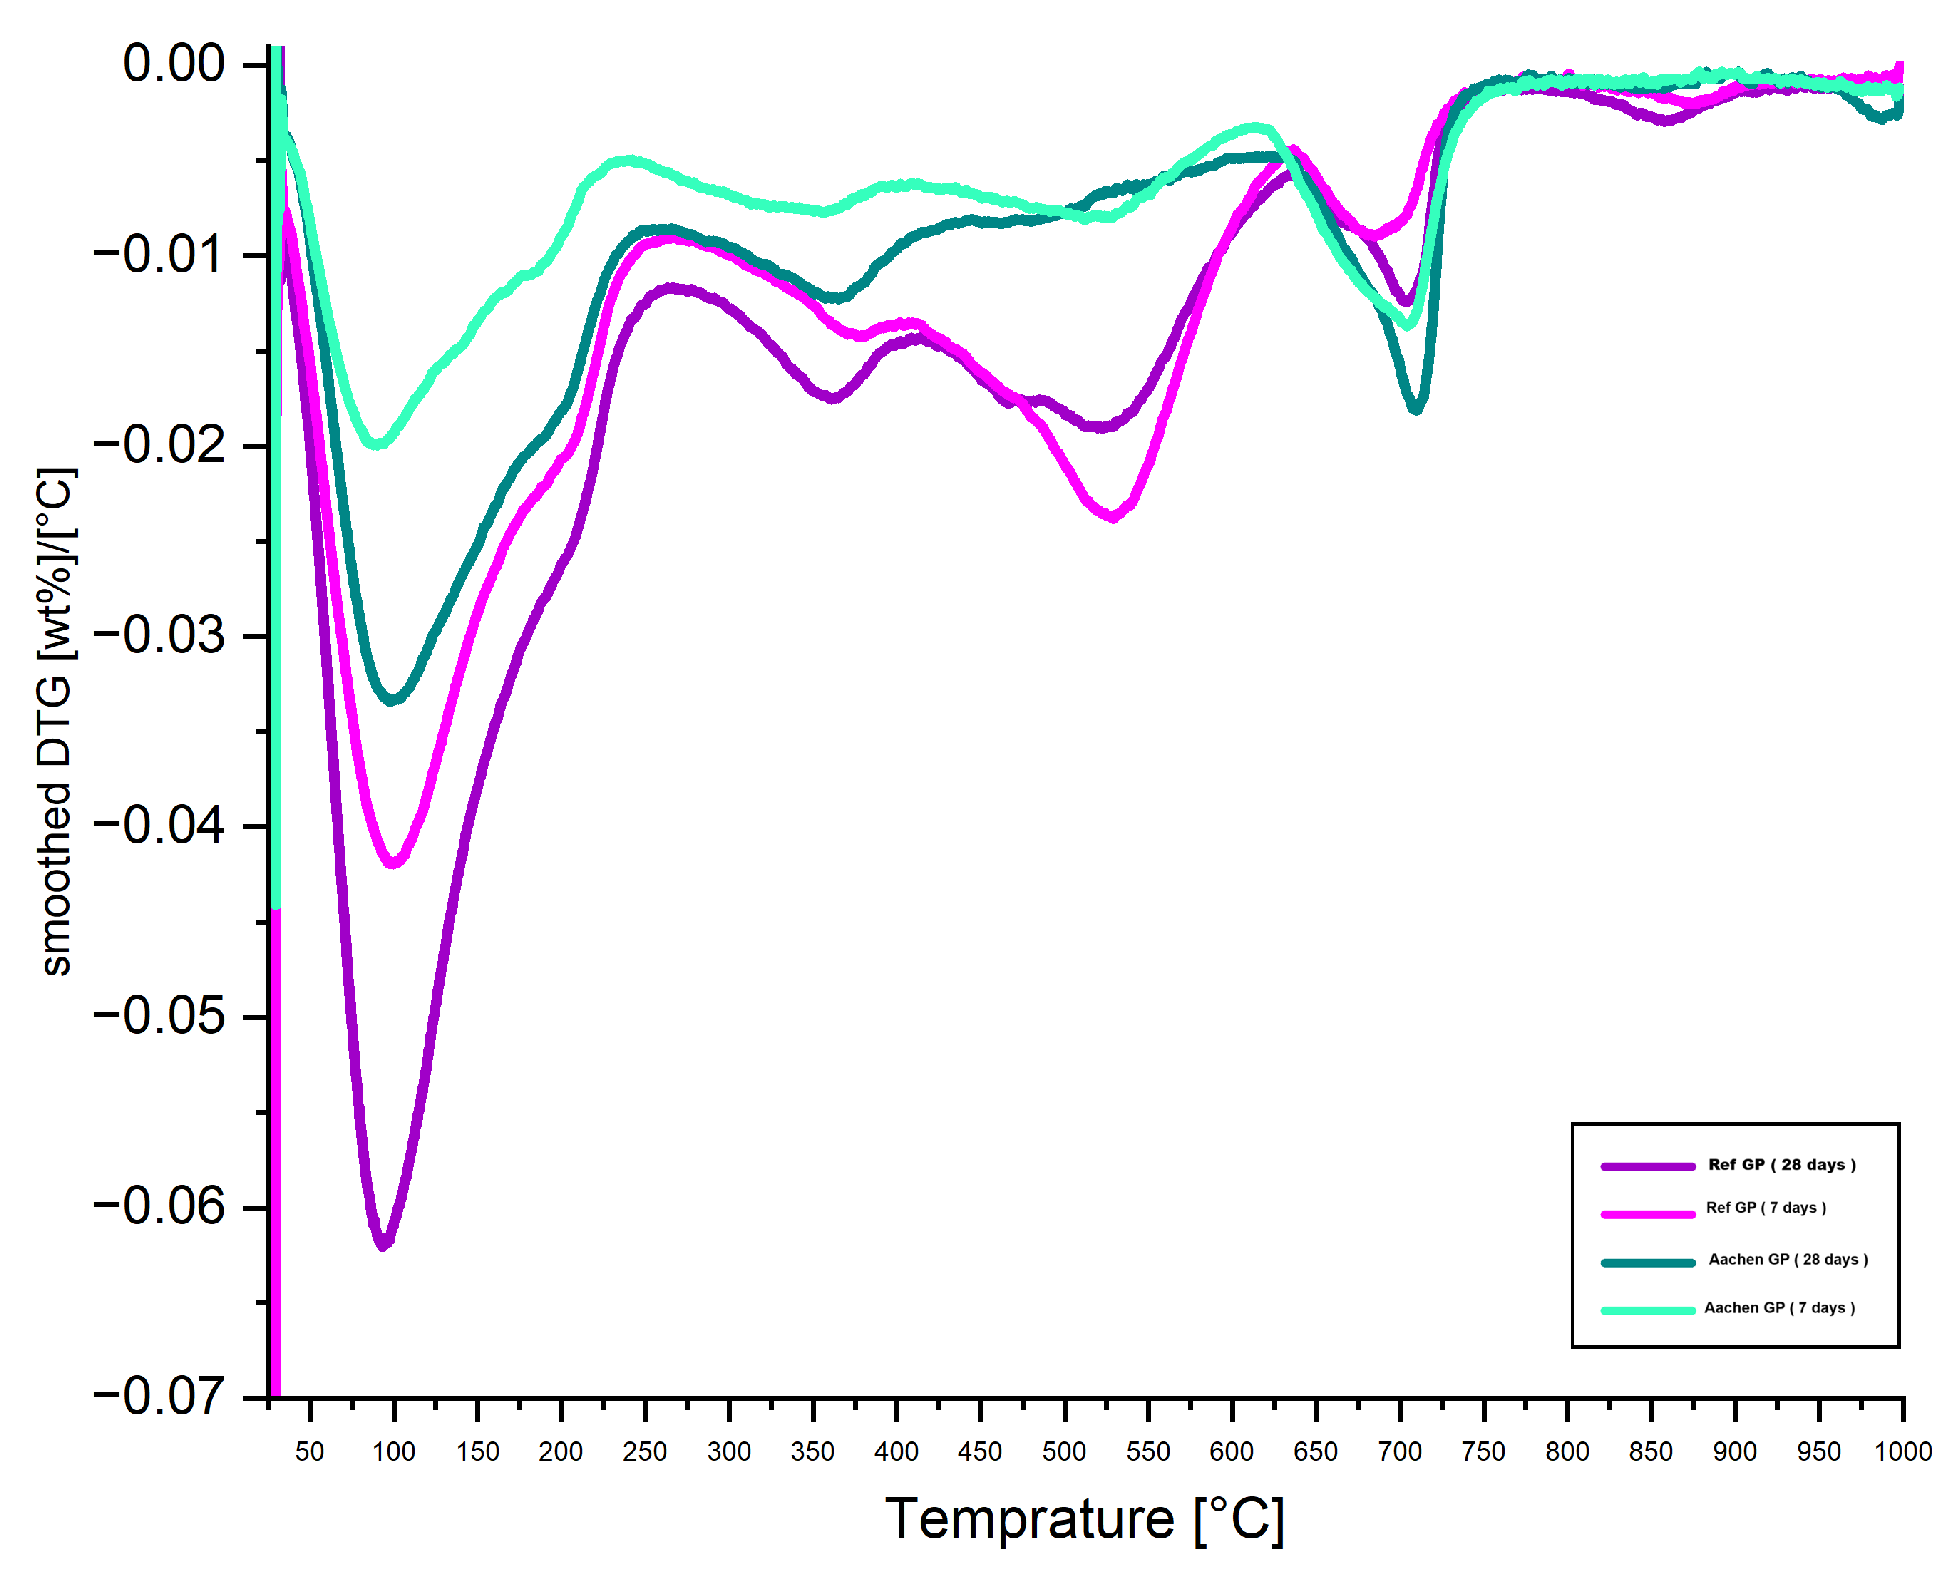
DTG curves (first derivative of weight loss) of Ref GP and Aachen GP at 7 and 28 days. The DTG curves highlight the temperature ranges of maximum mass loss rates, reflecting phase transformations and dehydration behavior linked to gel structure and curing progression.
Figure 27.
DTG curves (first derivative of weight loss) of Ref GP and Aachen GP at 7 and 28 days. The DTG curves highlight the temperature ranges of maximum mass loss rates, reflecting phase transformations and dehydration behavior linked to gel structure and curing progression.
Figure 28.
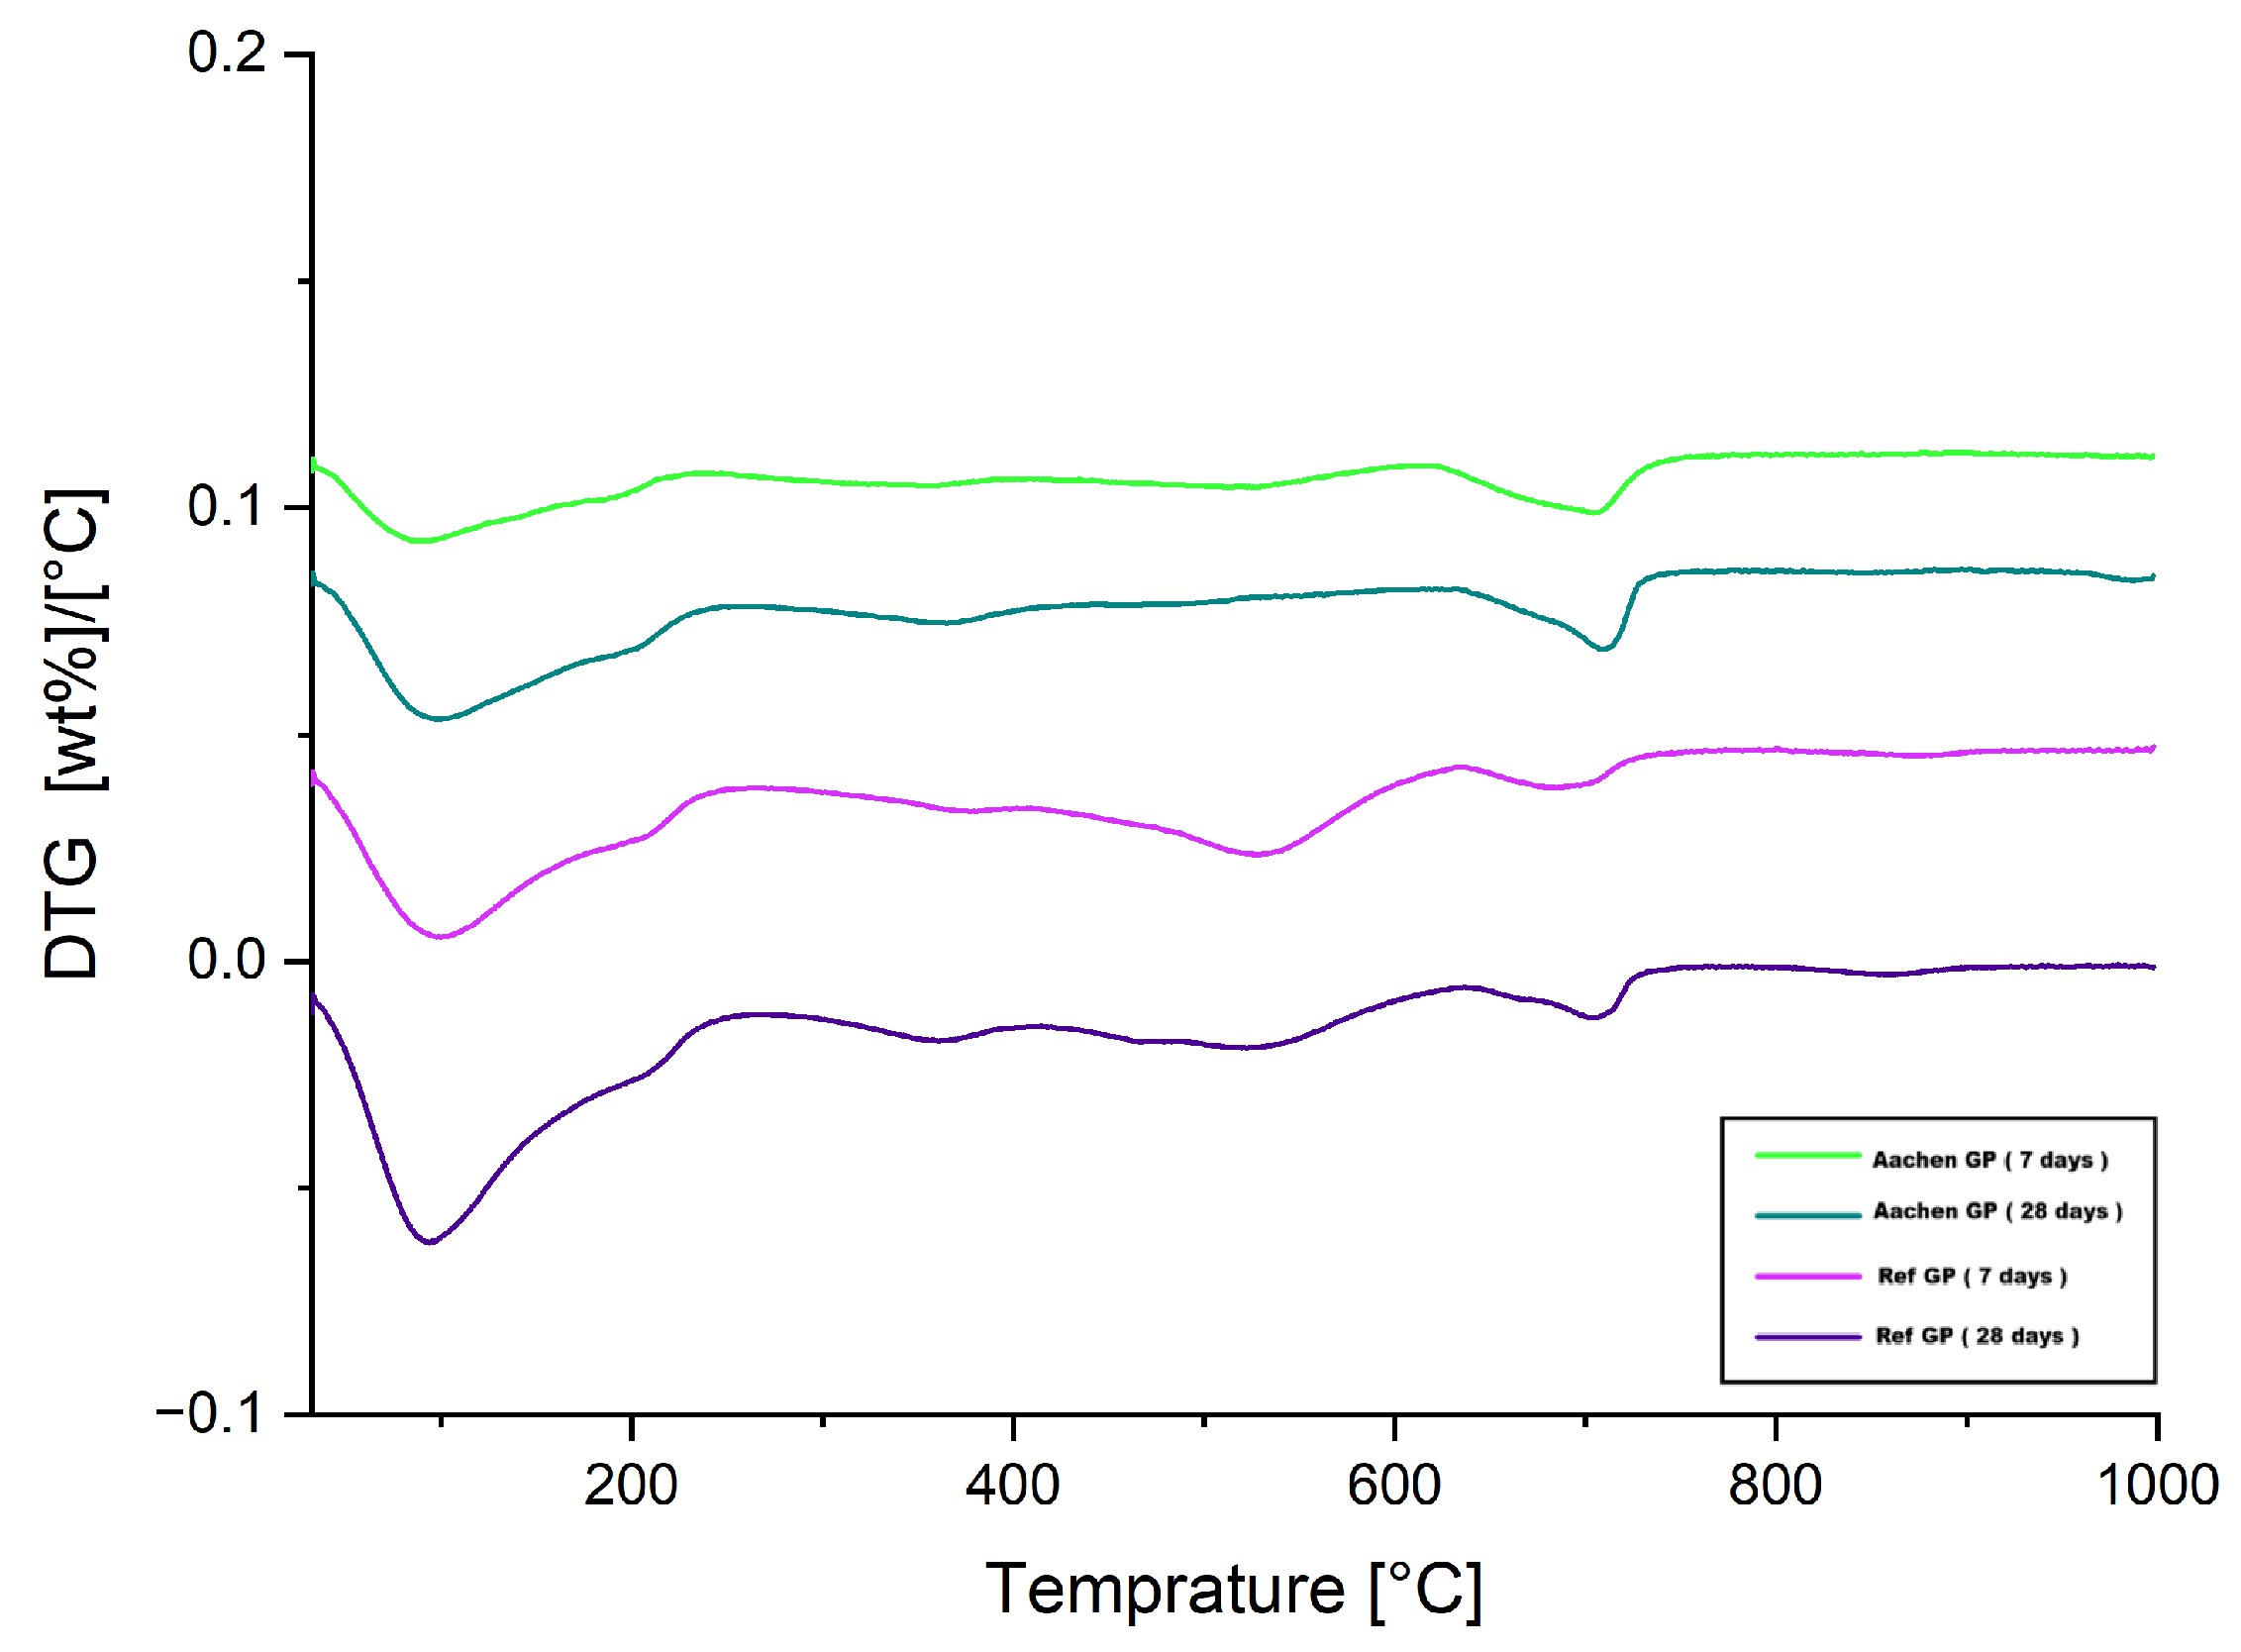
DTG curves of Ref GP and Aachen GP at 7 and 28 days, vertically shifted to aid visualization.
Figure 28.
DTG curves of Ref GP and Aachen GP at 7 and 28 days, vertically shifted to aid visualization.
Table 1.
Comparison of the chemical composition of the blast furnace slag (BFS) and the iron-rich slag used in the Aachen GP formulation. Values are reported as oxide weight percentages (wt.%). Legend: “–” = not detected/not reported; “n.m.” = not measurable by portable XRF; “n.a.” = not applicable (cement-specific index).
| Chemical Component | BFS (wt.%) | Iron-Rich Slag (wt.%) |
|---|
| CaO | 39.58 | 0.90 |
| SiO2 | 35.37 | 59.40 |
| MgO | 8.66 | 0.70 |
| Al2O3 | 12.29 | 7.60 |
| Fe2O3 | 0.37 | 24.60 |
| MnO/Mn2O3 | 0.54 | 1.80 |
| K2O | 0.59 | 2.50 |
| TiO2 | – | 0.30 |
| SO3 | 0.09 | 0.90 |
| Na2O | 0.27 | – |
| Na2O equivalent | 0.66 | n.a. |
| Cr | 0.02 | – |
| Cl− | – | n.m. |
| Glass content | 100 | – |
| (CaO + MgO + SiO2) | 83.60 | – |
| (CaO + MgO)/SiO2 | 1.36 | – |
Table 2.
Summary of mix proportions for the reference AAM (Ref GP) [
39] and the developed iron-rich slag-based formulation (Aachen GP) used in this study, normalized to a total of 1000 g per mix. A dash (–) denotes that the quantity was not added.
Table 2.
Summary of mix proportions for the reference AAM (Ref GP) [
39] and the developed iron-rich slag-based formulation (Aachen GP) used in this study, normalized to a total of 1000 g per mix. A dash (–) denotes that the quantity was not added.
| Component | Ref GP (g) | Aachen GP (g) |
|---|
| Blast furnace slag | 465.5 | 236.0 |
| Iron-rich slag | – | 236.0 |
| NaOH solution | 55.6 | 60.0 |
| Sodium disilicate | 15.2 | – |
| Additional water | 183.8 | 188.0 |
| Fine sand (≤2 mm) | 280.0 | 280.0 |
| Water-to-binder ratio | 0.45 | 0.475 |
Table 3.
Theoretical oxide molar ratios for Ref GP and Aachen GP (sand excluded). NaOH solution taken as 10 mol/L with 30.1, wt.% NaOH (balance water).
Table 3.
Theoretical oxide molar ratios for Ref GP and Aachen GP (sand excluded). NaOH solution taken as 10 mol/L with 30.1, wt.% NaOH (balance water).
| Mix | SiO2/Al2O3 | Na2O/SiO2 | Na2O/Al2O3 | CaO/SiO2 | H2O/Na2O |
|---|
| Ref GP | 5.13 | 0.096 | 0.493 | 1.14 | 45.23 |
| Aachen GP | 8.09 | 0.0607 | 0.490 | 0.458 | 56.54 |
Table 4.
Reference entries used for Rietveld refinement (Profex/BGMN). Database abbreviations: ICDD = PDF; BGMN = in-house structure model (no external card).
Table 4.
Reference entries used for Rietveld refinement (Profex/BGMN). Database abbreviations: ICDD = PDF; BGMN = in-house structure model (no external card).
| Phase (Formula) | Database | Reference ID |
|---|
| Zincite (ZnO) * | ICDD PDF | 04-003-2106 |
| Quartz (SiO2, ) | ICDD PDF | 04-012-0490 |
| Cristobalite (SiO2) | ICDD PDF | 04-007-2134 |
| Calcite (CaCO3) | ICDD PDF | 04-008-0788 |
| Corundum (-Al2O3) | ICDD PDF | 04-004-2852 |
| Iron (-Fe, Imm) | ICDD PDF | 04-007-9753 |
| Fe-martensite (Fe–C, tetragonal) | ICDD PDF | 04-014-0361 |
| Iron silicide (FeSi, ) | BGMN | not specified |
| Fayalite (Fe2SiO4, SG No. 62) † | BGMN | not specified |
| Amorphous hump (gel) | BGMN | n/a |
Table 5.
Water-accessible porosity (WAP) and water permeability (WP) at 7 and 28 days. Reported values represent the mean ± standard deviation (SD). Where only one measurement was available, SD is not applicable.
Table 5.
Water-accessible porosity (WAP) and water permeability (WP) at 7 and 28 days. Reported values represent the mean ± standard deviation (SD). Where only one measurement was available, SD is not applicable.
| Sample | WAP 7 d (%) | WAP 28 d (%) | WP (m/s) |
|---|
| Aachen GP | | | |
| Ref GP | | | |
Table 6.
BET analysis results for Aachen GP and Ref GP at different curing ages. Reported values are single measurements; standard deviations are therefore not applicable.
Table 6.
BET analysis results for Aachen GP and Ref GP at different curing ages. Reported values are single measurements; standard deviations are therefore not applicable.
| Sample | Surface Area (m2/g) | Pore Volume (cm3/g) | Pore Width (nm) |
|---|
| Aachen GP 7 d | 8.2 | 0.06 | 35 |
| Aachen GP 28 d | 12.4 | 0.09 | 32 |
| Ref GP 7 d | 4.1 | 0.02 | 33 |
| Ref GP 28 d | 6.8 | 0.02 | 31 |
Table 7.
FTIR peaks observed in Aachen GP at 28 days, arranged in descending order of wavenumber, with corresponding vibrational assignments.
Table 7.
FTIR peaks observed in Aachen GP at 28 days, arranged in descending order of wavenumber, with corresponding vibrational assignments.
| Wavenumber (cm−1) | Assignment |
|---|
| ∼3400 | O–H stretching (physically bound water and hydroxyl groups) |
| 1650 | H–O–H bending (molecular water) |
| 1475 | C–O stretching (carbonate group; shifted from 1410 cm−1 at 7 days) |
| 960 | Si–O–T asymmetric stretching (aluminosilicate gel network) |
| 900–1000 | Broad Si–O–T envelope (incomplete or evolving network) |
| 880 | Si–O–T shoulder (delayed network polymerization; possible Fe substitution) |
| 790–650 | Si–O–Si and O–Si–O bending vibrations |
| 700 | Si–O–Si symmetric bending (framework deformation) |
| 670, 514 | Tentative Si–O–Fe linkages (Fe incorporation; overlapping with Al/Si modes in NaOH-activated systems) |
| 625–830 | Overlapping Si–O, Fe–O, and fayalite-type lattice vibrations |
| 560 | Fe–O stretching (possibly shifted from 550 cm−1; weak in NaOH-activated matrices) |
| 400–800 | Complex Fe- and Si-related overlapping bands (low polymerization, spectral broadening) |
Table 8.
Quantitative phase analysis (Rietveld refinement) of Ref GP and Aachen GP at 7 and 28 days.
Table 8.
Quantitative phase analysis (Rietveld refinement) of Ref GP and Aachen GP at 7 and 28 days.
| Sample | Age | Amorphous (%) | Crystalline (%) | Dominant Crystalline Phases |
|---|
| Ref GP | 7 d | 78 | 22 | Quartz, Calcite, Cristobalite |
| Ref GP | 28 d | 85 | 15 | Residual Quartz, Calcite, Cristobalite |
| Aachen GP | 7 d | 85 | 15 | Calcite, Cristobalite, Fayalite, Corundum (α-Al2O3) |
| Aachen GP | 28 d | 85 | 15 | Cristobalite, Fayalite, SiO2, Fe-bearing metallic phase (α-Fe/Fe-martensite/Fe–silicide, minor) |
Table 9.
Summary of bound water content (105–600 °C) and total mass loss (25–950 °C).
Table 9.
Summary of bound water content (105–600 °C) and total mass loss (25–950 °C).
| Sample | Curing Age | Bound Water (%) | Total Mass Loss (%) |
|---|
| Ref GP | 7 days | 7.9 | 11.2 |
| Ref GP | 28 days | 9.1 | 13.4 |
| Aachen GP | 7 days | 3.04 | 5.9 |
| Aachen GP | 28 days | 4.6 | 8.3 |
