Article

Automated SEM Mineral Liberation Analysis (MLA) with Generically Labelled EDX Spectra in the Mineral Processing of Rare Earth Element Ores

1
Institut für Mineralogie, Lagerstättenlehre und Petrologie, TU Bergakademie Freiberg, Brennhausgasse 14, D-09596 Freiberg/Sachsen, Germany
2
Merker Mineral Processing, Oertenroeder Str. 21, D-35329 Gemuenden, Germany
3
Helmholtz-Zentrum Dresden-Rossendorf, Helmholtz-Institut Freiberg für Ressourcentechnologie, Chemnitzer Str. 40, D-09599 Freiberg/Sachsen, Germany
*
Author to whom correspondence should be addressed.
Minerals 2019, 9(9), 527; https://doi.org/10.3390/min9090527
Submission received: 9 August 2019 / Revised: 28 August 2019 / Accepted: 29 August 2019 / Published: 30 August 2019

Abstract

:
Many rare earth element (REE) deposits have experienced multistage geological enrichment processes resulting in REE bearing mineral assemblages of considerable complexity and variability. Automated scanning electron microscopy (SEM) mineral liberation analysis of such REE ores is confronted by the difficult assignment of energy-dispersive X-ray (EDX) spectra to REE mineral names. To overcome and bypass this problem, a generic and reliable labelling of EDX reference spectra obtained from REE-bearing minerals based on their contents of Si, Ca, F and P in a bulk normalised analysis is proposed. The labelled spectra are then combined into groups of REE-P (~monazite), REE-Ca-Si-P (~britholite), REE-Ca-F (~synchysite) and REE-F (~bastnaesite, parisite, fluocerite). Mixed spectra with low counts for REE from minute REE mineral grains are combined into a separate group. This classification scheme is applied to automated SEM mineral liberation analysis (MLA) data from beneficiation products by comminution and multistage flotation of REE carbonatite ores. Mineral modes, mineral grain size distribution, mineral liberation, mineral locking and mineral grade versus recovery curves based on the analysis of >200,000 particles in a sample can be recognised and interpreted in virtual grain size fractions. The approach as proposed here will allow future process mineralogical studies of REE deposits to be robust and comparable.

Graphical Abstract

1. Introduction

Rare earth element (REE) ore deposits occur in a wide variety of geological contexts and are hosted by a considerable diversity of host rocks [1]. Igneous host rocks appear mainly carbonatites and peralkaline plutonic rocks as nepheline syenites [2,3,4,5]. Although pegmatites may also contain significant amounts of REE-bearing minerals [6], they are usually too small in volume to be of economic significance. REE mineralisation also occurs in hydrothermal veins and stockworks [7,8]. Recent and fossile mineral placers can be sedimentary REE mineral deposits. Significant enrichment of REE is also possible by chemical weathering with recoverable REE concentrations occurring in lateritic clays formed at the expense of magmatic REE deposits. Some of the largest known REE deposits owe their origin to a sequence of natural enrichment processes. Primary igneous occurrences in alkali syenites and carbonatites as well as sedimentary heavy mineral accumulations and weathering crusts underwent metamorphic and hydrothermal overprint in depth, followed by weathering. Due to their possible complex geological evolution, the deportment of the elements in such REE mineral deposits are often ambiguous and the subject of scientific discussions.
REE ores are not only marked by geological complexity, but REE ore mineralogy is also very complex, with different minerals having complex chemical and crystallographic properties. More than 200 REE minerals are known [9]. Actually, in the largest REE mineral deposit of Bayan Obo in Mongolia one can distinguish three ore types with Fe-REE-, dolomite-REE- and silicate-REE-ores. The economic REE minerals are bastnaesite and monazite [10]. Other important REE mineral deposits are associated with carbonatite intrusions, as Mountain Pass (USA) and Mount Weld (Australia). The ore minerals in these deposits are bastnaesite, allanite (part of the epidote mineral group), monazite, apatite and pyrochlor. In lateritic clay deposits, REE released during chemical weathering of igneous host rocks may occur adsorbed in clay minerals [11,12,13,14].
The beneficiation of REE ores poses major technological challenges [15,16,17,18]. These may be understood—and then overcome—by applying modern and quantitative analytical methods that yield not only chemical but also mineralogical and microfabric data. Bulk chemical analysis of ore and processing products by X-ray fluorescence (XRF) and inductively coupled plasma mass spectrometry (ICP-MS) will readily provide elemental concentrations, especially of the REE [19]. X-ray diffraction (XRD) analysis, in turn, allows the identification of minerals, but is afflicted with considerable uncertainty and error when mineral modal abundance is below ~1 wt %. However, both analytical methods require powdered samples at grainsizes <2 µm and provide no tangible information on particle and mineral grain sizes, particle compositions, mineral intergrowths and liberation. However, such particle-related parameters are essential during the beneficiation of REE ores. Therefore, non-destructive, element sensitive methods based on scanning electron microscopy (SEM) with energy dispersive spectroscopy (EDS) and involving automated backscattered electron (BSE) image analysis, referred to as automated mineralogy, are widely applied [20,21,22,23]. Automated mineralogical studies of REE ores are confronted with the following mineralogical challenges:
  • REE-bearing minerals occur in many mineral classes, including REE-phosphates, REE-carbonates, REE-halogenides, REE-oxides, REE-silicates, REE-arsenates, as well as combinations of it as REE-fluoro-carbonates [24].
  • Many REE minerals have a complex mineral chemistry with light REE (LREE, elements La to Eu), heavy REE (HREE, elements Gd to Lu), Th, U, Si, Al, Ca, F, CO3, PO4, Nb, Y, As, S and others.
  • Most of the REE minerals are solid solutions with single and coupled substitution involving LREE, HREE, Y, Si, Al, Ca, F, P, Nb, Th, U and others. Compositional variations are widespread.
  • Many REE minerals are hydrated phases. This considerably hinders their identification by chemical analysis.
  • The often complex and multistage geological processes of REE enrichment lead to mineral intergrowths, pseudomorphs, partial and complete replacement, hydration and dehydration. This often results in a complex REE mineral assemblage.
Mineral phases are defined first by the crystallographic parameters (structure) and second by the chemical composition [24]. For the REE-bearing minerals as outlined above, there arises the consequence that even when crystallographic parameters by XRD are available it is often very hard to define a correct mineral name based on energy-dispersive X-ray (EDX) spectra and element compositions. Also, the conventional method of labelling EDX spectra from REE-bearing minerals by mineral names is severely hampered by the fact that the X-ray energy peaks and sub-peaks of LREE and HREE display considerable overlap and interference along the keV scale, which cannot be resolved by an analysis with the EDX, even when interference corrections are applied. This requires dedicated routines during the application of automated SEM methods [25,26]. Our study introduces an approach of applying generic labelling of a list of EDX reference spectra obtained from REE-bearing minerals in nepheline syenites and carbonatites, which is followed by a distinct mineral grouping. This allows robust classification and the extraction of mineralogical data from automated scanning electron microscopy-mineral liberation analysis (SEM-MLA) measurements. Many of the problems of the nomenclature and assignment of the REE-bearing minerals are thus avoided.

2. Approach and Analytical Methods

At the TU Bergakademie Freiberg/Saxony a scanning electron microscope FEI Quanta 600 (FEI, Hillsboro, OR, USA) equipped with a field emission gun (FEG) as electron source, two Bruker energy dispersive X-ray (EDX) SDD detectors (Bruker Quantax 200 with two Dual XFlash 5030 EDX detectors, (Bruker, Berlin, Germany), and backscattered electron (BSE) and SE detectors is applied for Mineral Liberation Analysis [20]. For the measurements presented here, the commercial MLA 2.9 software package (JKTech, Brisbane, Australia) has been used [21].
The analytical routine proposed here commences with the survey of a sample by a BSE image, labelled as a frame, at 25 kV acceleration voltage and 10 nA beam current. The instrument-specific working distance was at 12 mm. REE-bearing mineral grains with high average atomic numbers and molecular masses appear in light grey in the BSE image compared to gangue minerals as quartz and feldspar with darker grey colour (Figure 1a–c). The calibration of the BSE greyscale with contrast and brightness was performed with gold reference. After automated image analysis (Figure 1d–f), the electron beam is directed into the barycentres of contiguous mineral grains characterised by their BSE grey values, and a single EDX spectrum is obtained (XBSE measurement mode, [21]). In the case of thin sections or polished blocks of ore, the image analyser performs only the particle segmentation within a frame, and a grid of single EDX spectra is gained from each contiguous domain with distinct BSE grey values (GXMAP measurement mode). Each EDX spectrum is normalised by the counting rates (cts/s)N of the coupled EDX detectors and plotted against the keV scale (Figure 1g–i). These EDX spectra have characteristic peaks at distinct positions in the keV scale and distinct relative cts/s allowing identification of major elements present, giving a semiquantitative indication of their concentrations. Both measurement routines allow a later examination of both geometrical and mineralogical particle and grain parameters, as various size and shape parameters, mineral locking and mineral liberation [21]. The classification of the measured EDX spectra from the sample is performed by a comparison to a list of labelled reference EDX spectra. The list of reference spectra can incorporate up to 250 different reference EDX spectra which were gained under similar measurement conditions from the analysed samples and/or from related reference samples.

3. Energy-Dispersive X-ray (EDX) Spectra of Rare Earth Element (REE)-Bearing Minerals

As outlined above, REE-bearing minerals have rather complex chemical compositions [24]. This mineralogical and chemical diversity is also evident from the currently most important economic REE bearing minerals (Table 1). The REE phosphate monazite (LREE,Y,Th,Si,Ca)PO4 shows highly variable concentrations of the LREE elements La, Ce, Nd in solid solutions toward cheralite (REE,Ca,Th)(P,Si)O4, huttonite (ThSiO4) and the xenotime group of minerals (Y,HREE)PO4 involving coupled substitution of Y, Ca, Si, Th and P [24]. Hydrated species such as rhabdophane (REE)PO4(H2O) and florencite REE)Al3(PO4)2(OH)6 occur as well. In the britholite group (REE,Ca,Th)5(SiO4,PO4)3(OH,F) variable REE and Y contents occur together with Ca, Si, P and F. The synchysite group Ca,REE(CO3)2F contains Ca, F and C together with REE. Parisite, with more F and C but less Ca can be considered there as a subspecies. Bastnaesite REE(CO3)F is a hydrated halogene-bearing carbonate mineral with variable REE, Y, F, C concentrations. In contrast, fluocerite (REE)F3 is a simple fluor-bearing mineral (Table 1). A systematic search for REE-bearing minerals in available databases, such as MinIdent [27,28] and websites (http://webmineral.com/chem/Chem; http://rruff.info.ima) by using the mineral chemical compositions leads to long and desperately confusing list of mineral names. This complexity of mineral compositions and mineral names renders correct identification of individual REE minerals difficult. This pertains in particular to automated mineralogy studies where mineral identification is based on EDX spectra with minute X-ray counts, as ~10,000 cts exemplified in this study. Even when pertinent expert knowledge upon the corresponding mineral groups is available, an assignment of the EDX spectra to mineral names remains biased. To overcome this particular problem of reference EDX spectra denomination for SEM-based image analysis measurements, the following workflow is proposed. Although the proposed workflow is based here on the MLA 2.9 or MLA 3.1 software versions, it is easily transferable to similar instrumental and software platforms.
  • During a first automated SEM-MLA measurement, all EDX spectra in a given sample are captured (XBSE-STD measurement mode). The discrimination of these spectra is provided by a high reliability value of 1℮−10 which means a high degree of conformance. The spectra that fall within this limit of conformance receive consecutive numbers (Mineral 1, Mineral 2, …). Dependent on the mineralogical diversity of the ore, ca. 100–150 different EDX spectra can be collected from REE-bearing and gangue minerals (e.g., carbonates and silicates). A certain fraction of these spectra will be from grain boundaries or artefacts of preparation effects. These can be ignored during further assessment by a tentative classification of the measurement.
  • The MLA software functions allow driving the SEM stage to the mineral grains (e.g., Mineral 1, Mineral 2, …) where the consecutively numbered spectra were obtained for the first time during the measurement. A quantitative element analysis by EDS is performed from these grains. The EDX spectra from gangue minerals can then be labelled by corresponding mineral names (e.g., calcite, dolomite, fluorite, …). It is recommended labelling several slightly differing spectra from the same gangue minerals (e.g., calcite1, calcite-mix).
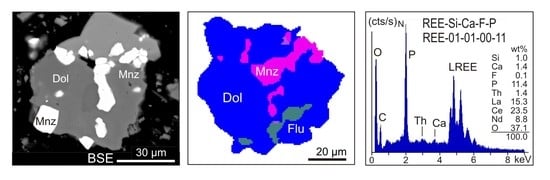
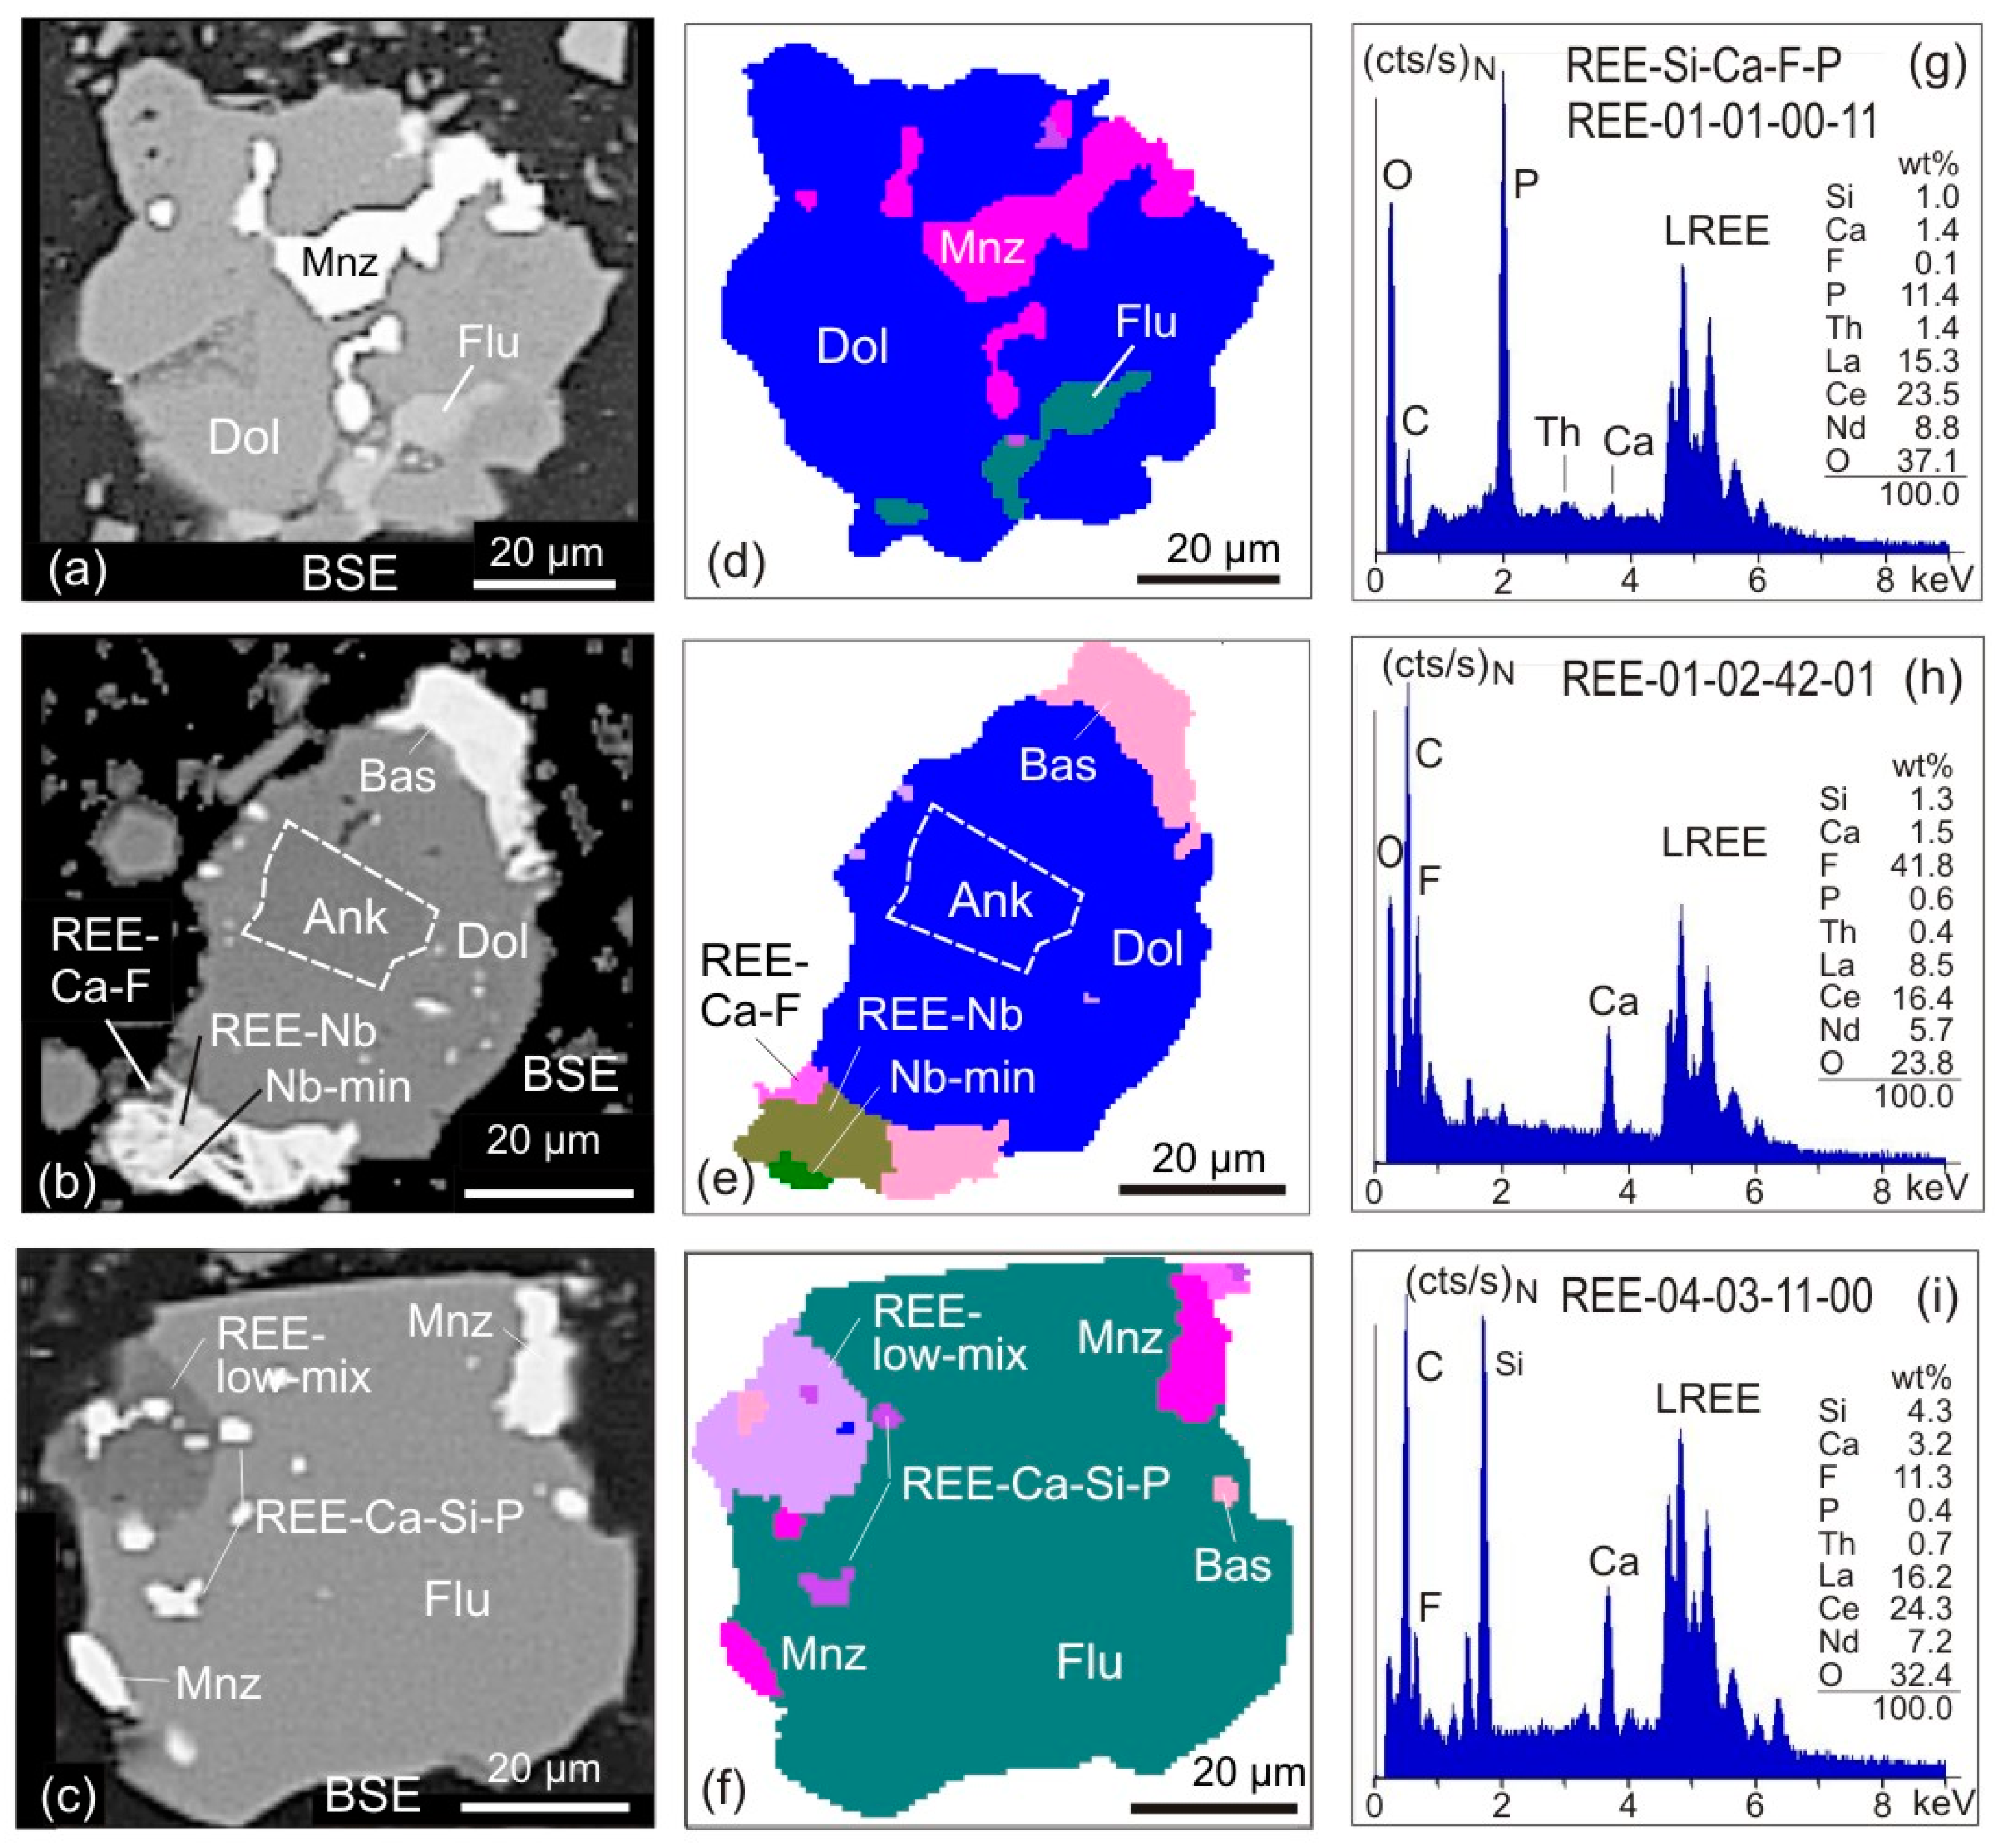
  • The EDX spectra from REE-bearing mineral grains receive a generic label that matches the normalised results of EDS element analysis. An EDX spectrum from an REE-bearing mineral suggesting e.g., 3.9 wt % Si, 4.7 wt % Ca, 14.3 wt % F and 2.4 wt % P (when totals are normalised to 100) will be labelled as REE-04-05-14-02 (Figure 1g–i). The range of the labelled elements should be the same for all REE-bearing minerals in a particular study, e.g., REE-Si-Ca-F-P, to assure consistency and comparability. When P and F are purposefully positioned at the end of the label, this will facilitate the subsequent step of spectra grouping (see below). Due to the carbon coating and the analytical uncertainty related to peak interferences, the elements C and the REE are not used in this generic labelling process. In a similar manner EDX spectra from REE-bearing minerals with Y, Nb or further elements such as As can also be labelled. A similar approach has previously been applied to automated SEM-MLA measurements of sewage sludge ashes [29], soils [30] or to zoned metamorphic garnets [31].
  • A labelling of the EDX spectra based on quantitative EDS analysis of the REE is not reasonable because the relative REE concentrations have only secondary relevance for the distinction of mineral classes. Also, a considerable analytical uncertainty is caused by the REE peak interferences, which could yield erroneous absolute concentrations of REE. Therefore, when the totals are normalised to 100 wt %, the analysis of Si, Ca, F and P will provide at best the relative proportions of these elements in a REE bearing mineral grain.
The SEM-MLA measurements of various REE ores will provide a list of reference EDX spectra. Given a possible maximum of 250 reference EDX spectra for a measurement classification, then ~50 spectra should be sufficient for REE-bearing minerals. The mineral xenotime will be readily distinguished by the abundance of Y and will not require more than ~5 spectra [32]. The reference spectra list further encloses minerals with Nb (~15 spectra) and also minerals with both Y and Nb (~5 spectra). The other spectra in the list concern gangue minerals, i.e. feldspars (~15 spectra for K-feldspar, albite, plagioclase), quartz (5 spectra), carbonate minerals (~20 spectra for calcite, dolomite, ankerite, siderite), fluorite (~5 spectra), as well as accessory minerals such as Ti-bearing minerals (~15 spectra for rutile, ilmenite, titanite), apatite (5 spectra) and zircon (3 spectra).
The classification of an SEM-MLA measurement against the labelled reference EDX spectra list provides the proportion in area% of the grains that are classified by a distinct spectrum. However, the evaluation of area proportions dedicated to up to 250 EDX spectra is at best unmanageable. Therefore, the area proportions of several EDX spectra have to be integrated or summarised into groups. An educated grouping of spectra is usually sufficient to address important issues of the mineral processing [32]. A re-grouping of existing data is possible at any time without performing a new measurement. Depending on the MLA software version, a mineral formula, an exact or approximated element composition, and a specific weight can be assigned to each reference EDX spectrum (MLA 3.1 version) or to a group of spectra (MLA 2.9 version). The REE ores analysed in this study were grouped as follows (Table 1):
  • EDX spectra from REE-bearing minerals with high content of P are summarised under the group REE-P-monazite. A typical mineral of this group would be monazite.
  • EDX spectra from REE-bearing minerals with low content of P but elevated contents of Si and Ca are summarised as the REE-Ca-Si-P group. A typical mineral of this group would be britholite.
  • The EDX spectra from REE-bearing minerals without P but high contents of Ca and F, and intermediate to low contents of Si are summarised as the REE-Ca-F group. A typical mineral of this group would be synchysite.
  • The EDX spectra from REE-bearing minerals with dominant F at low Ca and Si concentrations are combined as the REE-F group. Typical minerals of this group are bastnaesite and parisite. The element carbon cannot be used for labelling due to the carbon-coating of the samples.
  • EDX spectra from grains with detectable but low REE contents are merged to form the REE-Low-Mix group. In contrast to the groups 1–4 with high cts/s on the numerous lines of REE and corresponding elevated element contents, the REE-Low-Mix group integrates spectra with low counts on the REE lines and apparently low REE contents. Minerals containing low REE concentrations (for example allanite) can generate such spectra, but similar may be true for small acicular and fibrous crystals of REE minerals enclosed in gangue minerals. In the latter case, the excitation bulb of the electron beam captures gangue minerals beside and below, which will led to such mixed spectra, with low counts on the REE.
A further group of EDX spectra includes Y-HREE and P-rich xenotime and associated Nb-Ta minerals. Dependent on the mineralogy of the deposit, particular attention during spectra grouping is recommended to minerals that contain Y and Nb, as well as Nb and REE, such as the aeschynite mineral group. For the presented case studies, the REE-Nb group and the Nb-Y groups were established. For the discrimination of spectra from Y and Nb the secondary lines have to be considered. After a tentative grouping of the EDX spectra from REE-bearing minerals from an ore sample, the corresponding area proportions should be examined. In the following, the convenience and suitability of the classification workflow introduced above is presented in some case studies dealing with automated SEM of complex REE ores and process samples from three different deposits.

4. Case Studies

Beneficiation test work requires the investigation of comminution and separation characteristics of a given raw material. The first task should always be a thorough study of the unprocessed feed material, i.e. the ore itself in its pristine state [23]. Characterisation by SEM-based image analysis will provide important clues towards the development of a suitable beneficiation strategy. It will inform to the determination of the optimal grinding conditions and time. This is done to achieve a high degree of mineral liberation, whilst minimising the generation of fines. SEM-based image analysis data will provide important insight to assess the success of comminution. In the case of REE ores, comminution is often followed by a multi-stage flotation process [33]. The success of flotation test work can be monitored by SEM-based image analysis. Our case studies illustrate that the mineralogical properties, intergrowths, locking relationships and grain sizes of the REE minerals, as captured by automated mineralogy, are crucial in the critical assessment of the performance of beneficiation processes of fine grained and complex REE ores.

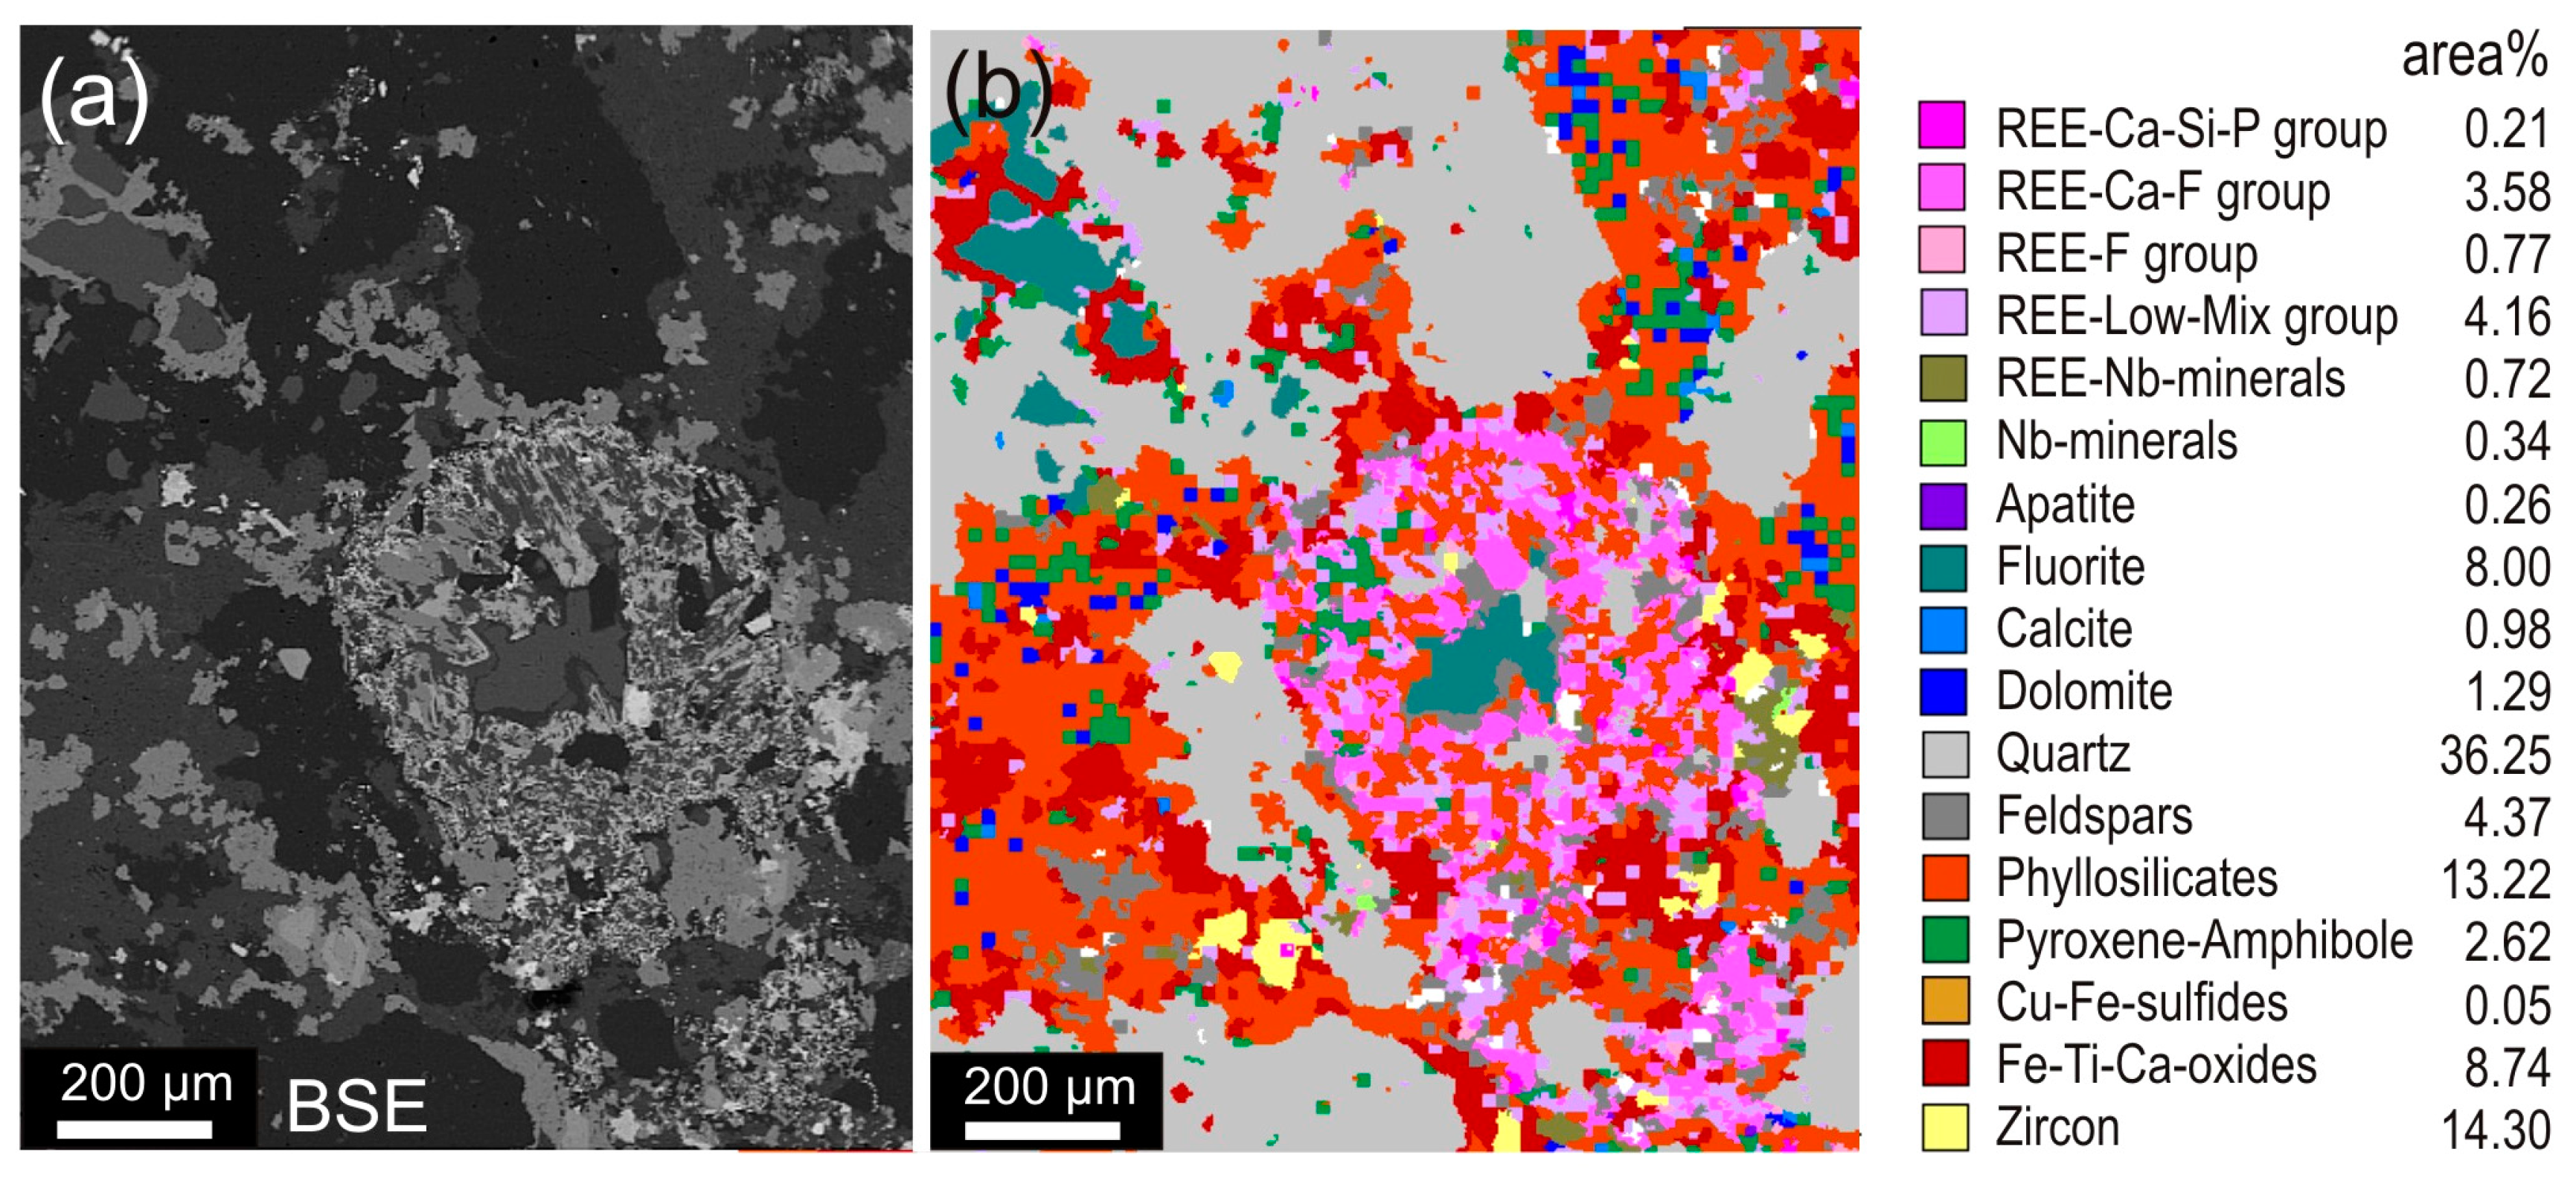
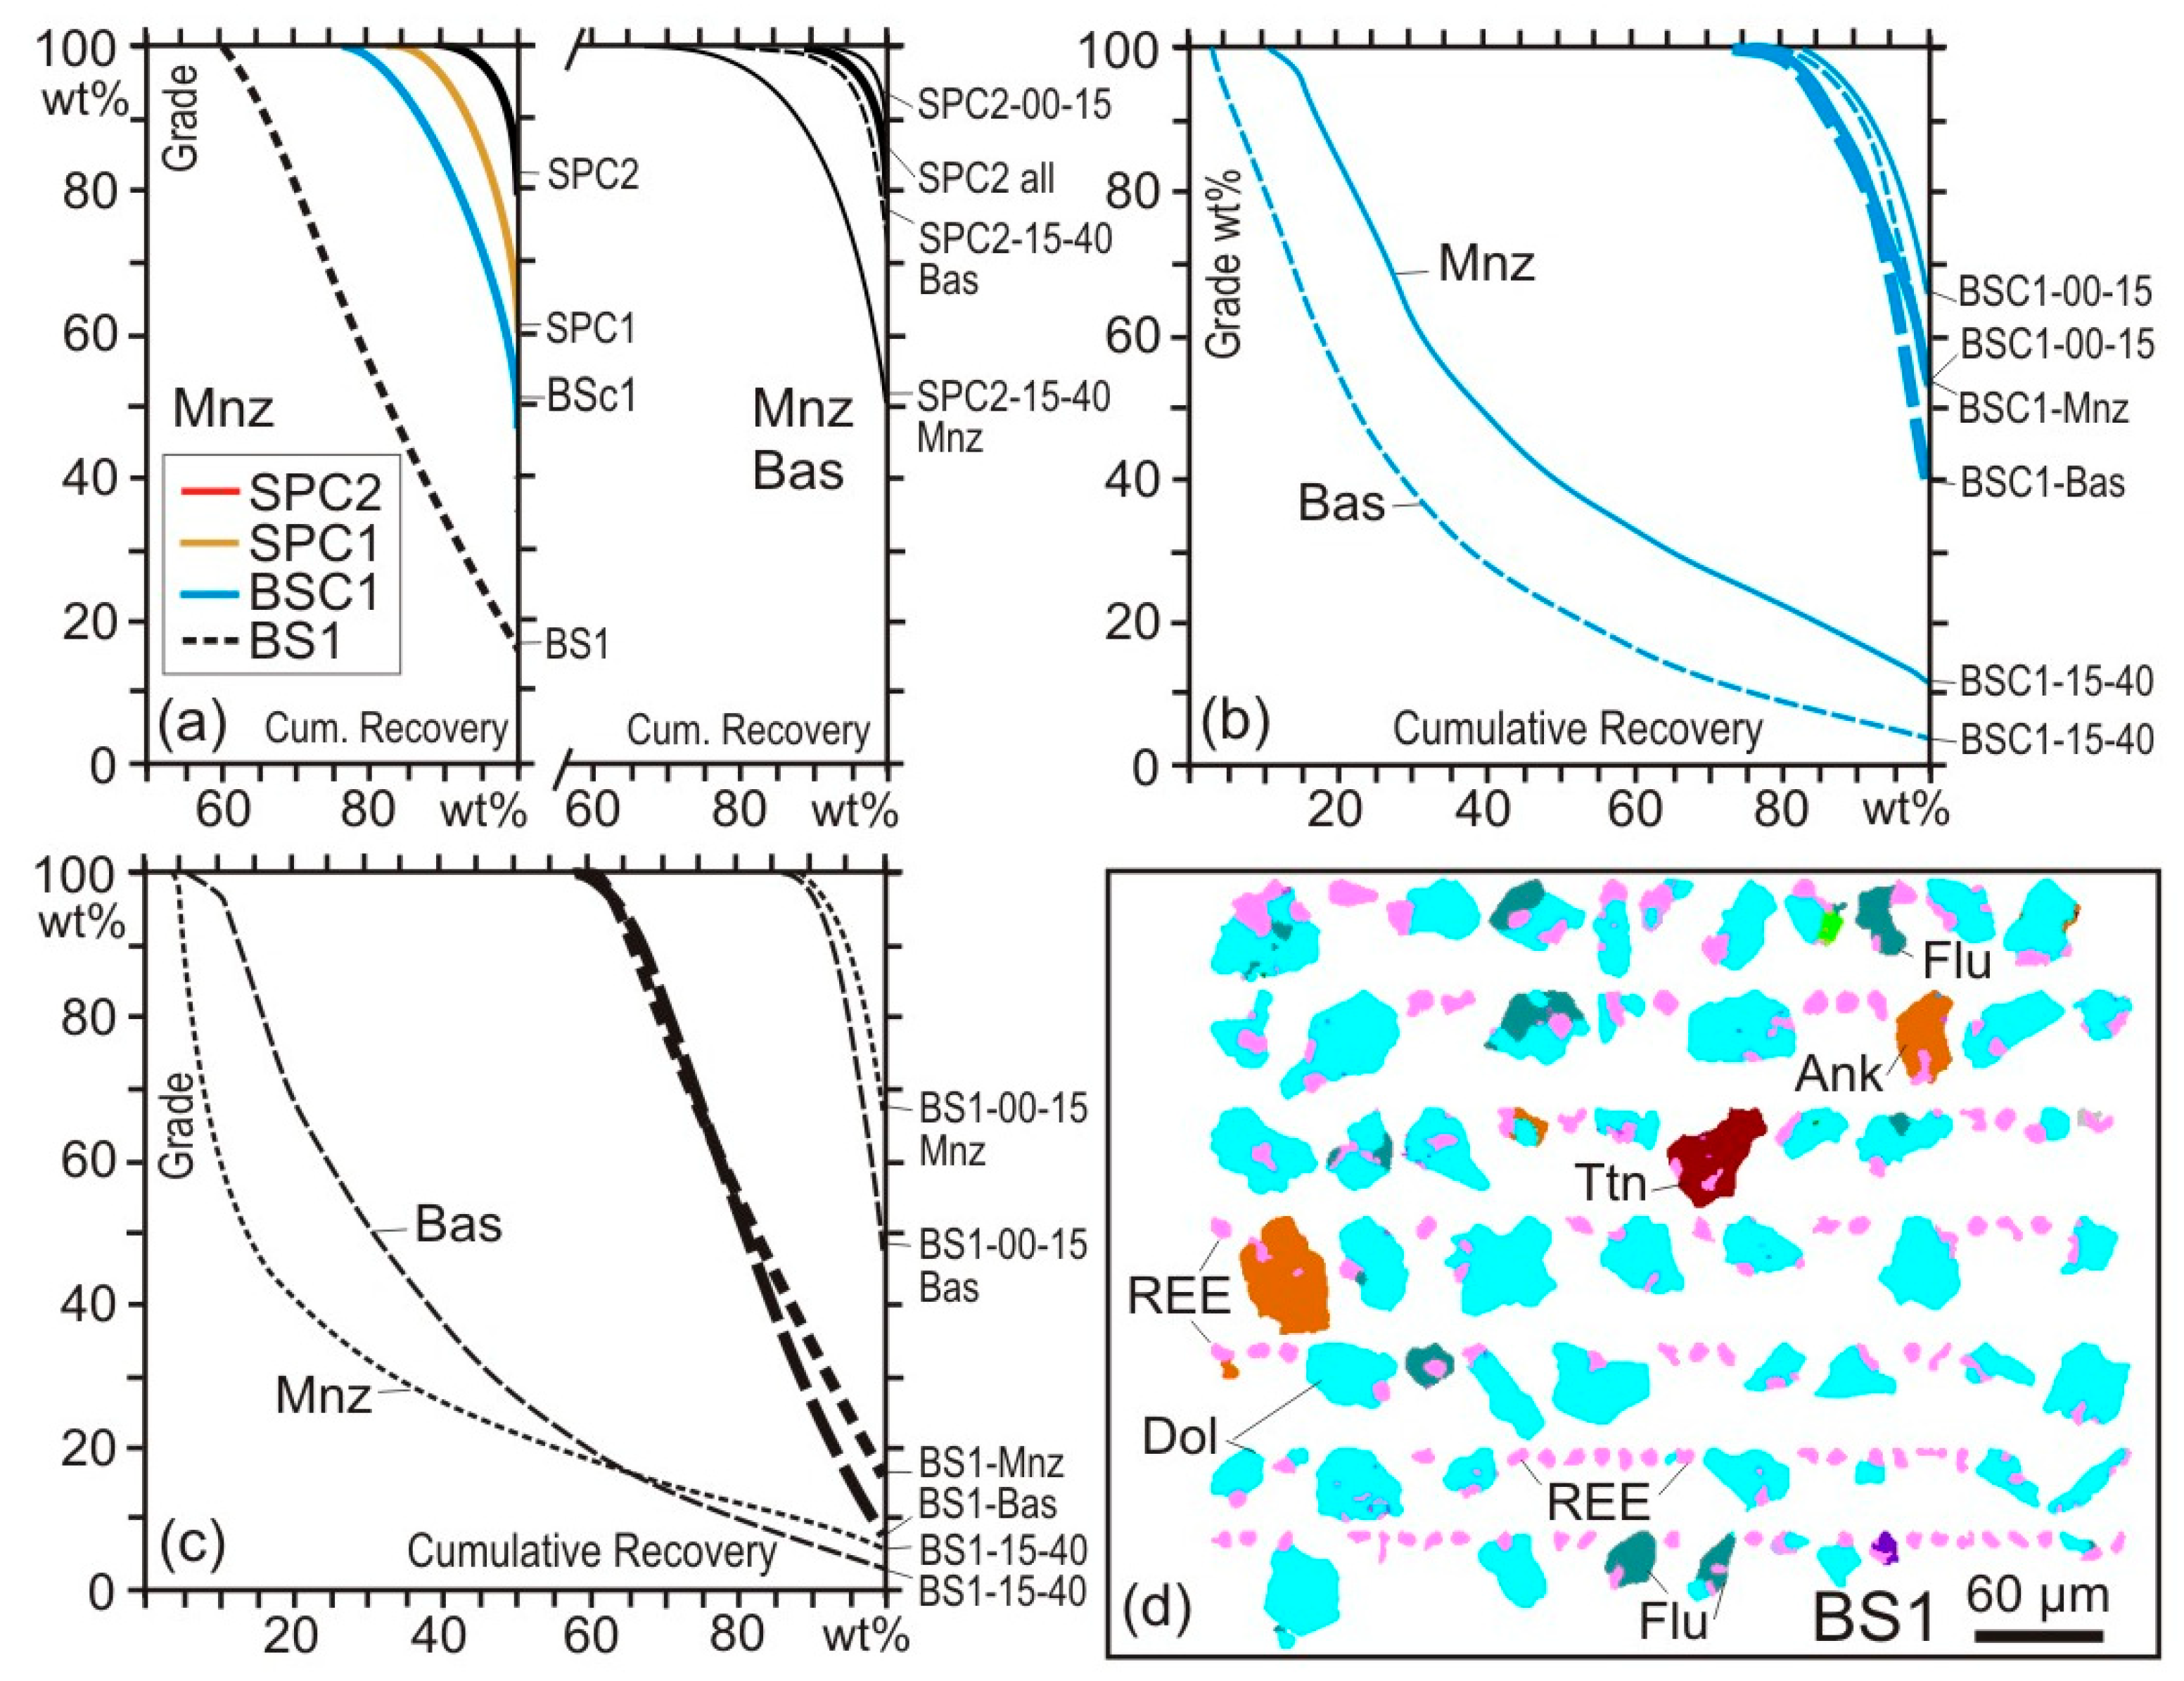
4.1. Case Study 1: Run-of-Mine Ore

The proper identification of the REE-bearing minerals, their mineral grain size and intergrowths is crucial to select suitable technologies and machine parameters for comminution and mineral separation. This is exemplified by the analysis of a polished thin section of a syenite from the Thor Lake Intrusion in Canada, Northwest Territories [34,35]. The sample has been taken from the mineralised T-Zone at the northern margin of the syenite intrusion. The abundance of gangue minerals such as fluorite and quartz in the sample attest to an intense hydrothermal overprint of the pluton. The SEM-MLA analysis (at 25 kV, 10 nA) has been performed in the GXMAP mode at 175 times magnification and with a greyscale trigger (25–255) that includes all minerals but excludes epoxy resin. The analysis took 15 h and is composed of 300 square frames of 1500 µm edge length, covering an area of 2.25 mm2. The analysed area is covered by 2,158,015 single EDX spectra, which means ~7,200 spectra per frame or 3,200 spectra per mm2 with a stepsize of 18 × 18 µm. EDX spectra obtained from the REE-bearing minerals can be subdivided into 3 groups (Figure 2). Most abundant are the minerals of the REE-Ca-F group (resembling synchysite) with 3.58 area% (Figure 2b). REE-P-monazite is present, but of such low abundance that it has been ignored for the purpose of this study. A comparably large area proportion (4.16 area %) of the spectra related to the REE-Low-Mix group is obvious. This can be explained by the intense intergrowths of very fine-grained REE-bearing mineral grains with gangue minerals. Indeed, BSE images and GXMAPs suggest that REE minerals are concentrated in 1 × 1.5 mm large aggregates composed of countless miniscule REE bearing mineral grains (Figure 2b). These minute REE mineral grains (0.2–5 µm) are tightly intergrown with phyllosilicates, feldspar and Fe-Ti-oxides. This leads to the conclusion that physical treatment of the ore for separation of REE mineral grains will require a very fine grind size, and that REE mineral grains—even if they are liberated—are unlikely to be recovered by a conventional flotation process properly.

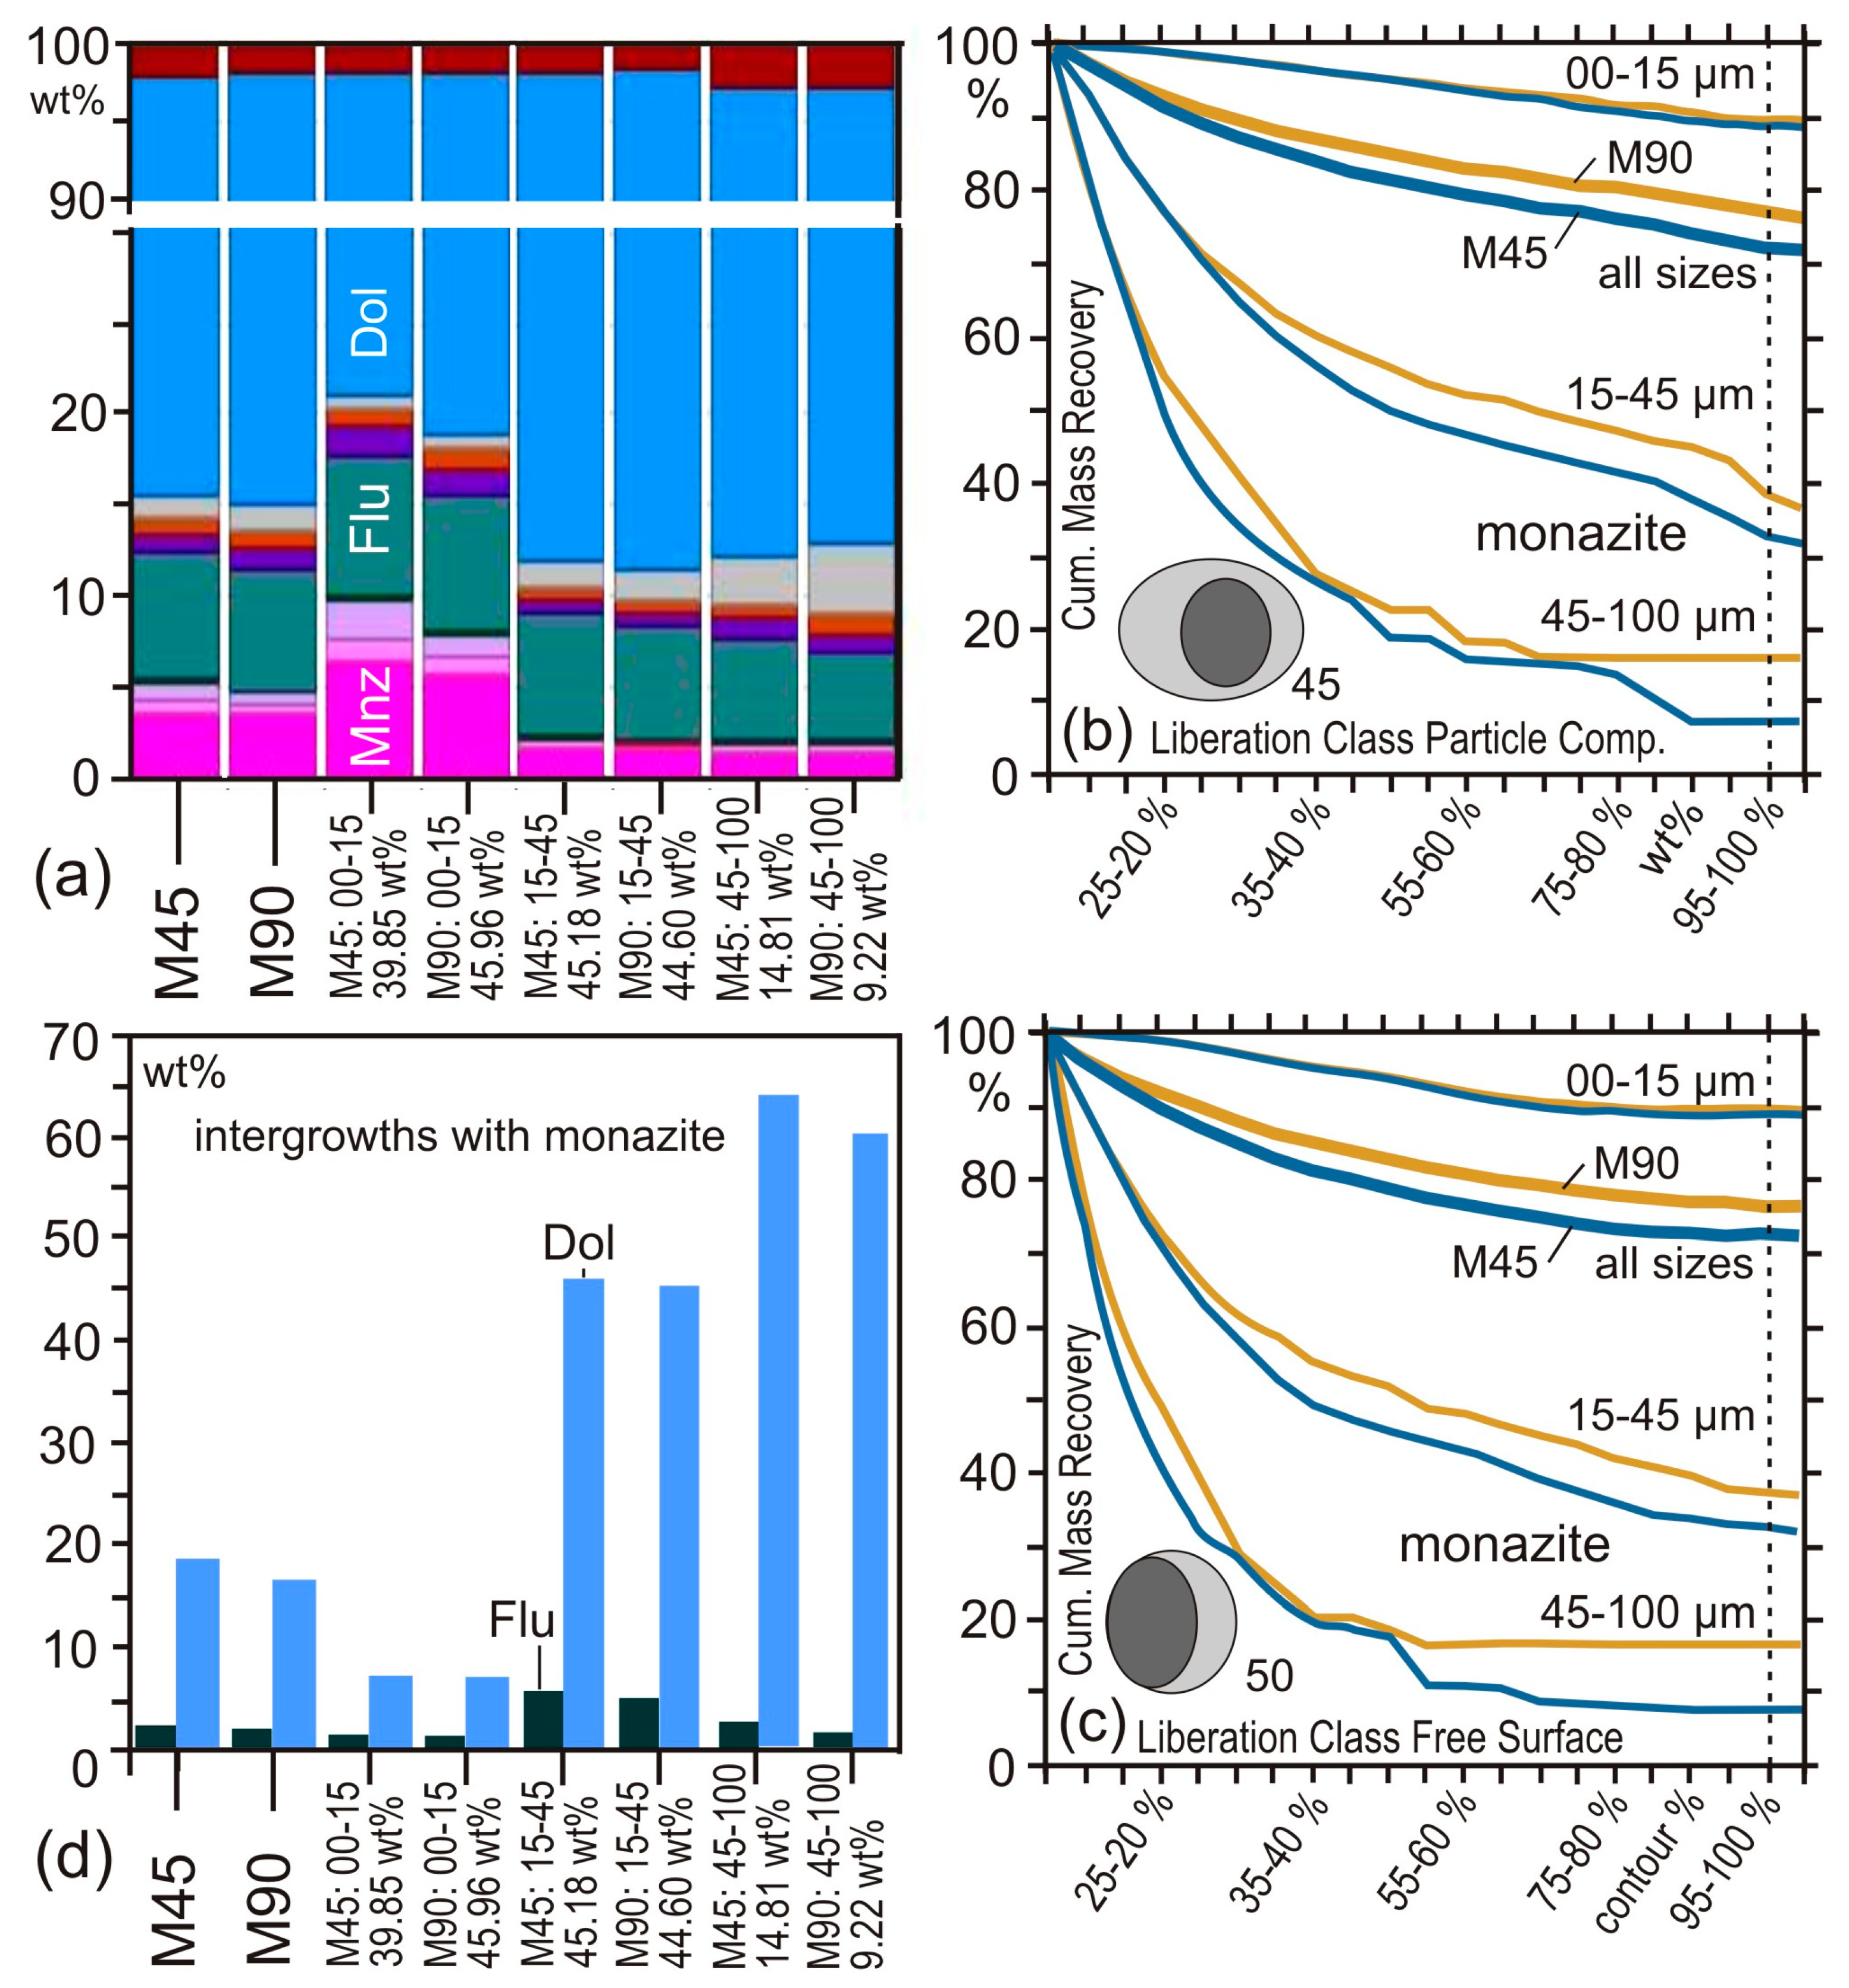
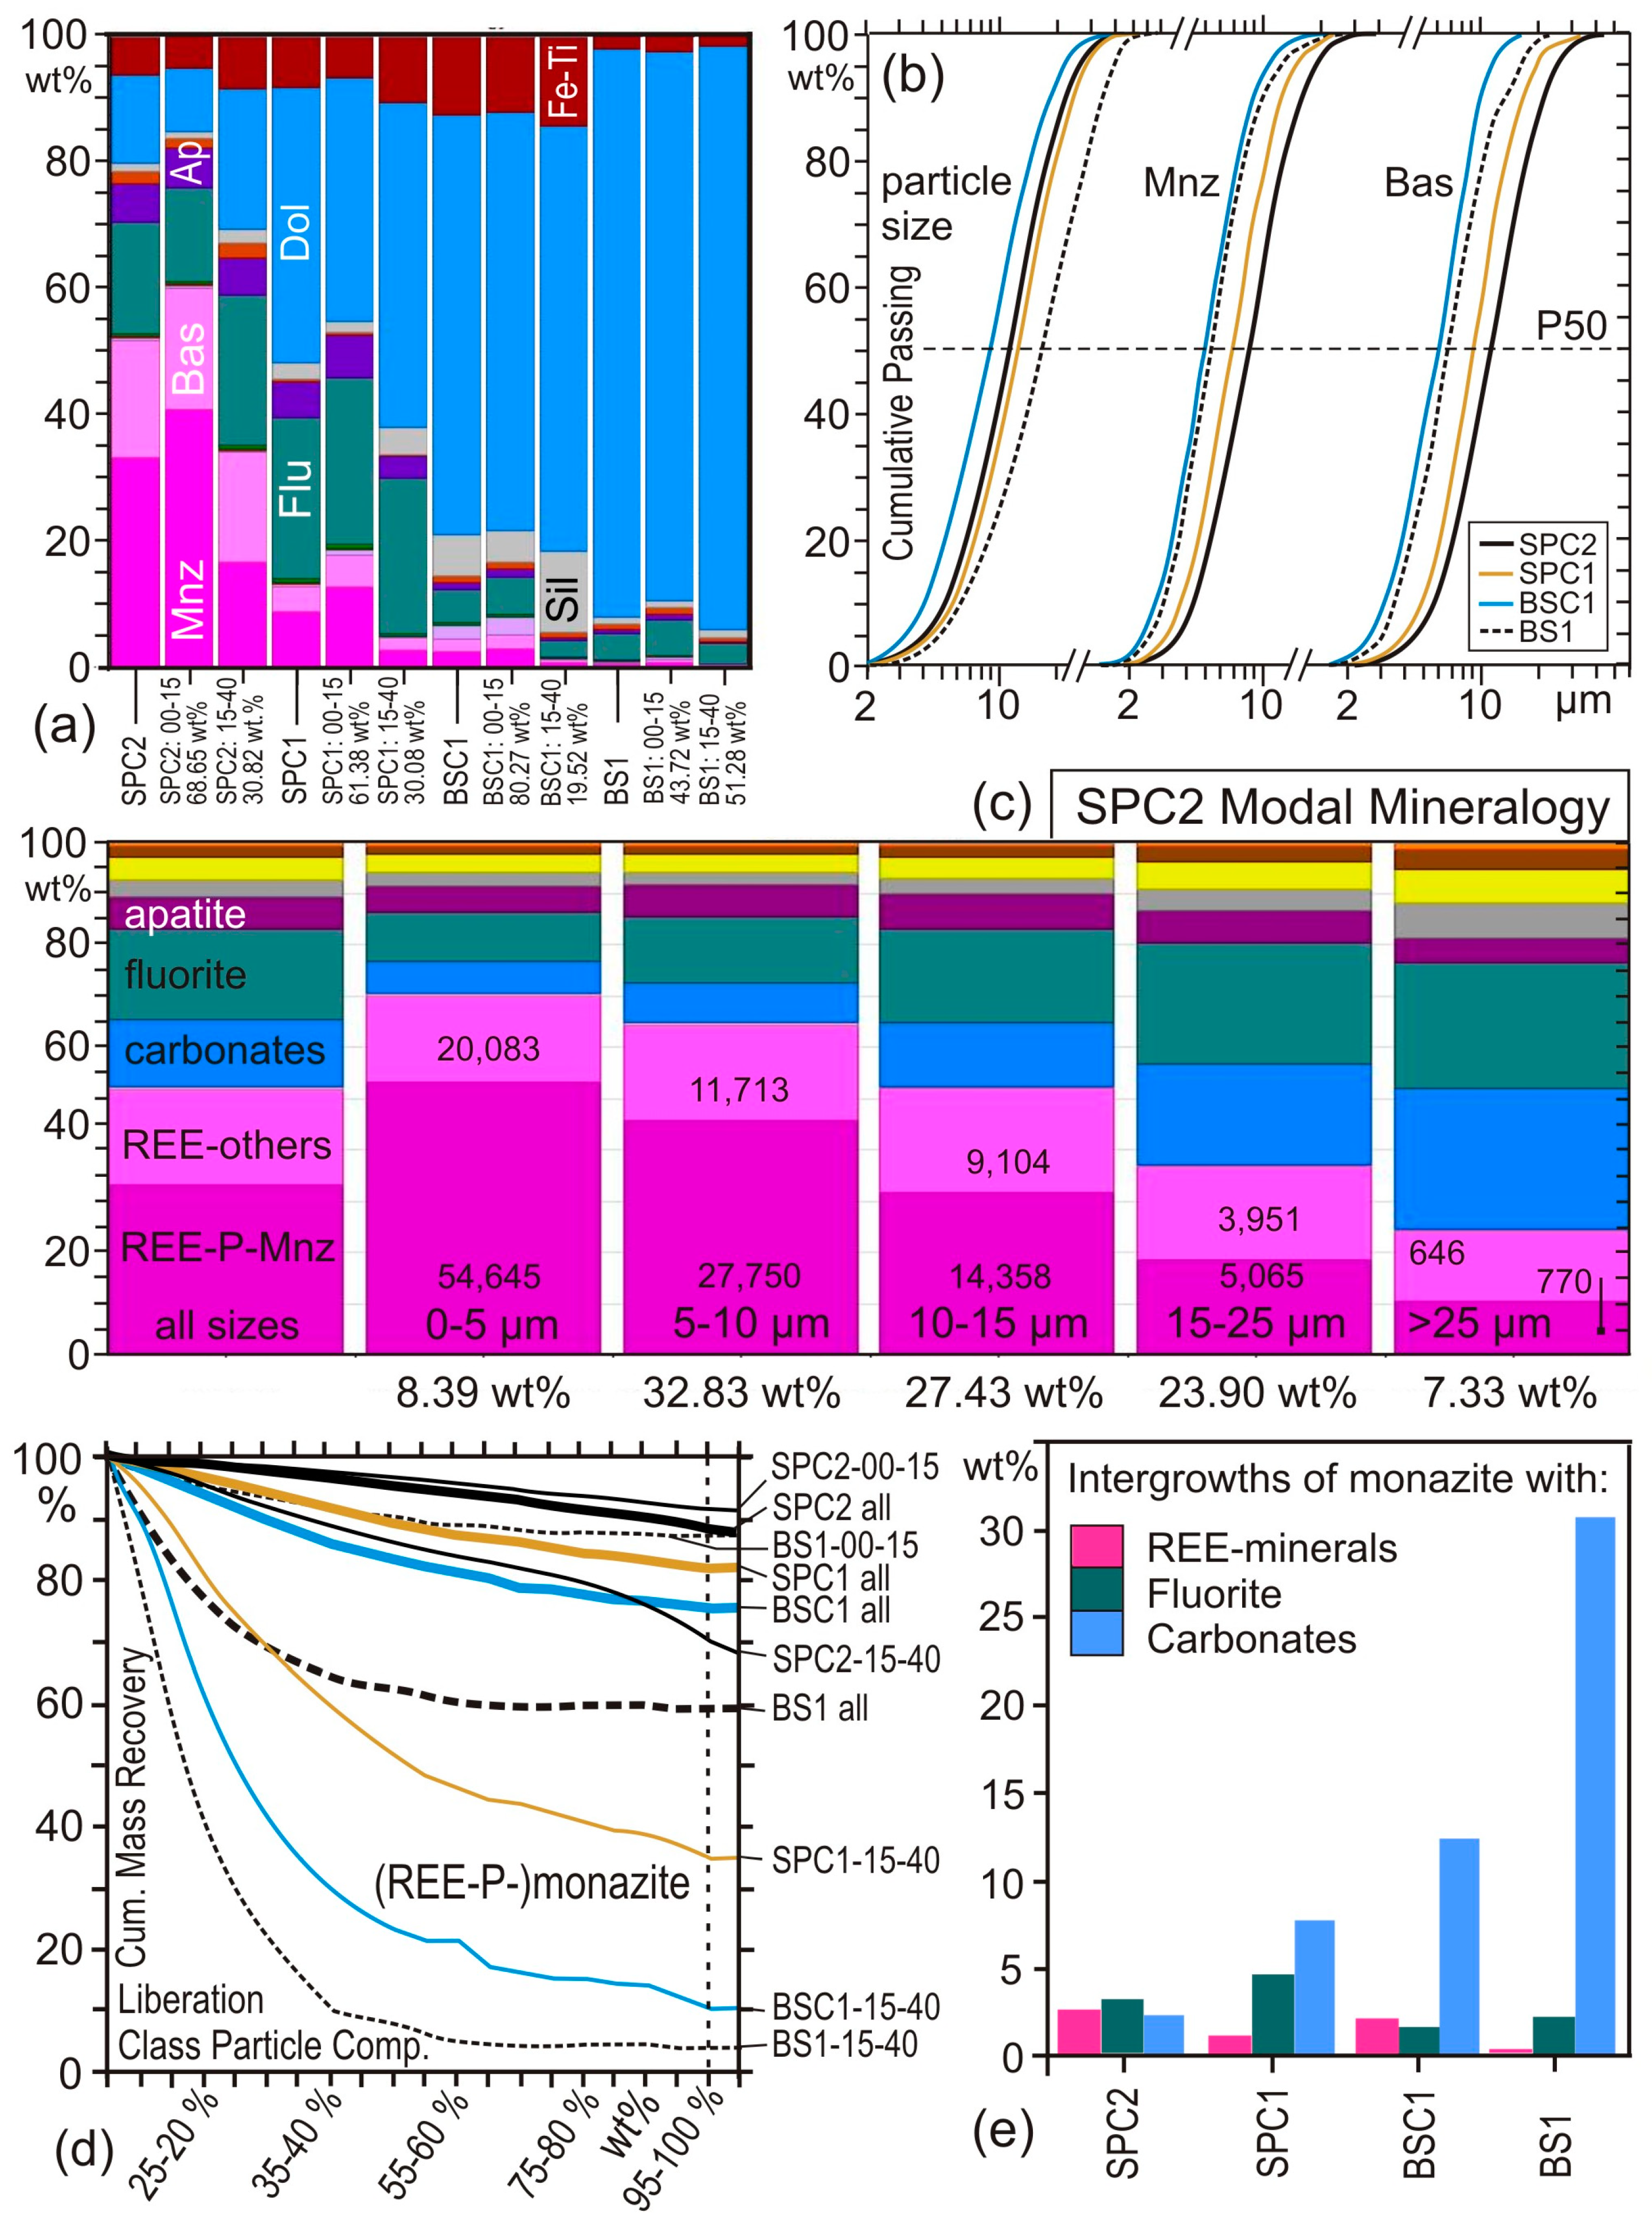
4.2. Case Study 2: Comminution

This case study concerns a carbonatite REE ore, with monazite as the most abundant REE mineral. Monazite is part of the REE-P-monazite group of EDX spectra with 3.5 wt % modal proportion (please note, in this case study we report wt %, different to the previous case study where data was reported as area %). All other groups of REE mineral spectra attain a total of only 0.7 wt % whilst the REE-Low-Mix group accounts for 0.5 wt %. The prevalent gangue minerals are dolomite (~70 wt %) and Fe-Mg carbonates (~13 wt %). Fluorite reaches ~7.0 wt % in abundance, whilst phyllosilicates, other silicates and quartz all together amount to a maximum of 2.5 wt % (Figure 3a).
Dry grinding experiments on the REE carbonatite ore were performed with a laboratory rodmill, starting with crushed (<2 mm particle size) feed material. For the determination of the optimal grinding fineness, two experiments at 45 min (sample M45) and at 90 min (sample M90) grinding time were conducted. The products (~10 g) were thoroughly mixed with an adequate amount (~10 g) of powdered graphite of pure and fine quality as a parting agent, and stirred into ~2 cm3 of fast-hardening epoxy resin for the production of grain mount blocks of 30 mm in diameter [36,37]. The thickness of the epoxy layer containing sample grains is <5 mm to prevent severe gravity segregation effects. The horizontal block surfaces were polished after a thickness reduction of ~1 mm by grinding. MLA measurements in the XBSE analysis routine included 200,000 particles per sample which were examined within 3–4 h. The XBSE analysis routine is based on a single EDX spectrum within the barycentre of each mineral grain as identified by its grey colour in the BSE image. The cumulative bulk particle size distribution curves for both grinding tests display similar shapes. At 45 min grinding time the P50 (corresponds to cumulative 50 wt % of the distribution curve) is at ~19 µm, and at 90 min grinding time at ~16 µm. For the REE mineral monazite, the most important ore mineral in this case study, the corresponding grainsizes at P50 are 7.5 µm (M45) and 7.2 µm (M90), respectively. When compared at P50 the grainsizes of the carbonates are reduced from 20 to 17 µm, and those of the fluorite from 15 to 12 µm at the longer grinding time (not shown). This illustrates significant effects of selective comminution.
With a longer grinding time one expects to achieve better mineral liberation of REE mineral grains. However, the problem of over-grinding of the REE mineral grains also increases with a longer grinding time. Over-grinding leads to a large proportion of very fine grains at <<10 µm that are known to usually float poorly [38], and will thus hamper separation by flotation [39]. Cumulative grain size distribution curves provide a first control of potential over-grinding. A subsequent sieve classification of the ground ore with subsequent study of further parameters (e.g., mode, mineral liberation, mineral locking) in the distinct grain size fractions would be of great interest [40]. At the given particle sizes, a mechanical sieve classification is only reliable at particle sizes >20 µm. An alternative is the virtual sieving by an electronic method. The shape classification parameter of the equal circle (EC) diameter turned out to give reasonable results for the 2-dimensional image, however, dependent on the overall particle shapes (e.g., rounded, cubic, platy, elongated, acicular, fibrous), distinct differences to the results of mechanical sieving are noted [23]. In the studied samples the rounded and cubic particles prevail. Virtual sieving of the XBSE data sets was performed in the particle size fractions 0–15 µm, 15–40 µm und 40–100 µm. As expected, increasing grinding time from 45 to 90 min resulted in a larger proportion of the smallest sieve size fraction from ~40 to 46 wt % (Figure 3a). It is obvious from the modal mineralogy that the REE mineral monazite is prominently enriched in the smallest sieve grain size fractions. In the smallest sieve size fraction 0–15 µm the mode of monazite slightly decreases with the longer grinding time while the mode of carbonates increases (Figure 3a). This is a consequence of the lower mechanical stability of the carbonates due to their cleavage planes, when compared to monazite.
The dataset of the XBSE measurement also allows the extraction of parameters of mineral liberation as (1) mineral liberation by particle composition, and (2) mineral liberation by free surface. For both parameters the particles are examined in liberation classes ranging from 0–100%. The liberation class 95–100% (fully liberated mineral grains) for mineral liberation by particle composition for the mineral group (REE-P-)monazite includes all particles that comprise of 95–100 wt % of (REE-P-)monazite. Correspondingly, the parameter mineral liberation by free surface, includes all particles with monazite where the (2D)-contour of the monazite grain is 95–100% free of inherent other mineral phases. The cumulative proportions of each liberation class in wt % are plotted along the Y axis as mass recovery (Figure 3b,c). For our case study, more than 90 wt % of the monazite of the grain size fraction 0–15 µm appear fully liberated. This is the best liberation among all (virtual) sieve grain size classes, as monazite is often locked by carbonates and fluorite in coarser particle size fractions (Figure 3d). Interestingly, the locking of monazite with fluorite is highest in the (virtual) sieve size fraction of 15–40 µm (Figure 3d). A longer comminution at 90 minutes resulted in no further improvement of monazite liberation in the size fraction 0–15 µm. For the larger sieve size fractions and the complete sample, the longer grinding time results in a moderate increase of the cumulative mass recovery of about 5% for the liberation class 95–100% (Figure 3b,c).
In the complete samples, the REE-P-monazite in the particles are often locked by carbonates (at 15–18 wt %), and with fluorite (at ~2 wt %, Figure 3d). With increasing sieve grain size fraction, the proportion of inherent carbonate minerals also increases, but with slightly lower values for the long comminution test at 90 min. At the locking of REE-P-monazite with fluorite the highest proportions are observed in the (virtual) sieve grain size fraction of 15–40 µm (Figure 3d). As a consequence of the results presented above, a multi-phase grinding process with only short periods of milling and intermittent classification has been established. This prevented the undesirable formation of fines and associated losses of REE-P-monazite. In addition, a sizing step by hydrocyclones was introduced to reject slimes (<5 µm particle size) prior to flotation.

4.3. Case Study 3: Flotation

The presented method for REE mineral classification was deployed in the evaluation of mineral processing tests for a further REE carbonatite ore. The studied samples were taken from multi-stage open cycle flotation tests (Figure 4). Previous to flotation, multi-stage comminution was performed with an interim classification step at 40 µm and recirculation of the >40 µm grain size fraction, followed by de-sliming with removal of the fraction <5 µm using a hydrocyclone. The de-slimed material was the feed to multi-step flotation including rougher flotation, scavenger flotation, two rougher-cleaner steps and one scavenger-cleaner flotation. Wet re-grinding was applied to the rougher concentrate prior to the cleaner stages, and also to the middling concentrate from the scavenger flotation prior to an additional scavenger-cleaner stage (Figure 4). This approach was chosen to accomplish a further improvement of the REE-liberation for boosting REE- and Y-recovery.
Polished epoxy grain mounts with 30 mm in diameter were prepared from four flotation process samples (Figure 4) and analysed by automated MLA in the XBSE mode. Between 317,000 and 340,000 particles were analysed in each block during 4–5 h. Sample SPC2 represents the final concentrate after two cleaner flotation steps. Sample SPC1 is a middling concentrate produced by scavenger-cleaner flotation of a rougher-scavenger concentrate (following re-grinding). The sample BSC1 is a middling from the scavenger-cleaner stage that still contains liberated REE-mineral fines. The sample BS1 is the final tailing (Figure 4).
After EDX spectra classification and grouping, the REE-P-monazite and the REE-F-phases are the dominant groups among the REE-bearing minerals, and are denoted as monazite and bastnaesite for simplification (Figure 5a). The gangue minerals are the carbonate minerals dolomite, siderite and ankerite (regrouped as siderite-ankerite) but also apatite and quartz. The mineral grain sizes for monazite and bastnaesite in the pristine ore do not exceed 30 µm. In the cumulative grain size distribution curves the P50 values are 8 µm for monazite and 11 µm for bastnaesite. In all samples from this ore type, the P50 grain sizes for monazite are lower than those for bastnaesite (Figure 5b).
Virtual sieving based on the parameter equivalent circle (EC) diameter was performed at several sieve grain size classes. Coarse sieve grain size fractions (>40 µm) are not further considered here, as they account only for ~5.2 wt % in the sample BS1 and less than 0.5 wt % in the other three samples. In the final concentrate SPC2 a grade of 33.28 wt % of monazite and of 18.47 wt % of bastnaesite is achieved (Figure 5a). In contrast, only 0.59 wt % monazite and 0.29 wt % of bastnaesite report to the final tailings (sample BS1). The contents of the REE-Low-Mix spectra group in sample BSC1 is at 2.24 wt % fairly elevated when compared to the other samples with modes markedly below 1.0 wt %.
The REE minerals in the flotation tests reach their highest grades in the virtual sieve grain size class of 0–15 µm (Figure 5a,c). As expected, the multi-stage grinding and de-sliming process produced a narrow range of particle sizes in the virtual sieve grain size classes 0–15 µm and 15–40 µm. The cumulative grain size distribution curves display P50 particle sizes between 9 µm in sample BSC1 and 18 µm in sample BS1 (Figure 5b). The concentrates SPC2 and SPC1 display intermediate P50 particle sizes of ~12 µm.
SEM-based image analysis is currently the only available routine analytical method to quantify parameters such grain sizes or liberation of distinct minerals in fine-grained material without a previous mechanical mineral separation. Thus, the effects of selective comminution in mineral processing can be critically assessed [32]. In this case study, the monazite has a P50 value of 8.5 µm, whereas the bastnaesite has a P50 of 12 µm in the concentrate sample SPC2 (Figure 5b). Furthermore, it is noted that the P50 grain sizes of the REE minerals in the concentrate samples are always higher than in the tailings (Figure 5b).
Unsurprisingly, the liberation of monazite in the parameter particle composition is for all samples always best in the (virtual) sieve grain size class 0–15 µm. In this grain size class, the liberation class 95–100% in the final concentrate sample SPC2 has a value of cumulative mass recovery of 93% (Figure 5d). For the complete sample SPC2 the cumulative mass recovery of the monazite and the other REE minerals has a very high value of 88% for monazite and 82% for bastnaesite for the liberation class 95–100% (Figure 5d). For sample BS1 these values are minimal at 60% monazite and 56% bastnaesite for the liberation class 95–100%. This illustrates the need for an efficient comminution and liberation.
Grain size dependent trends are exemplified for three particle size fractions (Figure 5a). At grain size fractions below 15 µm these trends are continued, as exemplified for sample SPC2, so that at grain size fractions below 5 µm, more than 70 wt % mode of REE minerals are observed (Figure 5c). In the grain size fraction <15 µm the 95–100% liberation of monazite is well above 90% cumulative mass recovery (Figure 5d). This emphasises that high modes in distinct grain size fractions in combination with a high degree of liberation are important for a later enrichment of REE minerals. However, this positive effect is partly counteracted by the very fine grain size of the liberated grains.
In the concentrate sample SPC2 the monazite is mostly in contact with fluorite (3.1 wt %) and carbonates (2.4 wt %) but also often intergrown with other REE minerals (2.5 wt %). In sample SPC1 the intergrowth with carbonates has the highest value at 7.7 wt %. In the tailings BS1 the target mineral group monazite is mostly locked by carbonates (31.2 wt %) and rarely locked within fluorite (Figure 5e). Liberation data can be used to determine recovery curves, also known as mineral grade vs. recovery curves [41,42]. These curves allow the comparison of efficiencies in mineral-processing schemes. The values for the curves are defined by the proportions of the given mineral in wt % in the various liberation classes. As can be expected, the final concentrate SPC2 displays the best curve for monazite, whereas the tailings BS1 illustrate the worst case (Figure 6a). This is confirmed by the (virtual) sieve grain size fractions, where curves for the class 0–15 µm are more favourable than those observed for bulk (i.e. unsieved) samples. For monazite, the larger (virtual) sieve size fraction 15–40 µm shows a more advantageous curve for the concentrate SPC2 when compared to SPC1. In the coarse (virtual) sieve grain class in sample SPC2 one can recognise a potential for a partition of more monazite. The curve for bastnaesite displays a more advantageous trend than that for monazite (Figure 6a).
This assessment of potential recoveries is especially interesting for the scavenger and cleaner sample BSC1 and the tailings in sample BS1. For these samples, the (virtual) sieve grain size fraction 0–15 µm displays a quite favourable recovery curve for the REE-bearing minerals (Figure 6b,c). In contrast, the recovery curve for the (virtual) sieve grain size fraction 15–40 µm displays a potential for further recovery of REE minerals by improving their liberation, possibly by re-grinding. This potential can be also evaluated and visualised by a simple line-up of the particles with REE-bearing minerals (Figure 6d).
The line-up function is an important tool within the MLA processing software packages. Even in the tailings sample BS1 numerous well-liberated REE mineral grains remain. Most of these have grain sizes <10 µm, i.e. they can be expected to not float well. The loss of such REE mineral grains is undesirable, but technically induced. The reasons of non-floating fines may be: (1) insufficiently adapted hydrodynamics for fines flotation; (2) a too short flotation time (kinetic problem); (3) insufficiently adapted bubble size distribution; and (4) an insufficiently optimized reagent dosage. Another important observation in the line-up view is the presence of REE mineral grains locked in coarse-grained carbonate particles. In this case the liberation of REE mineral grains may be improved by finer grinding, so that these grains will also float. However, further grinding will inevitably also result in more fines, a typical trade-off when developing a process flow sheet.

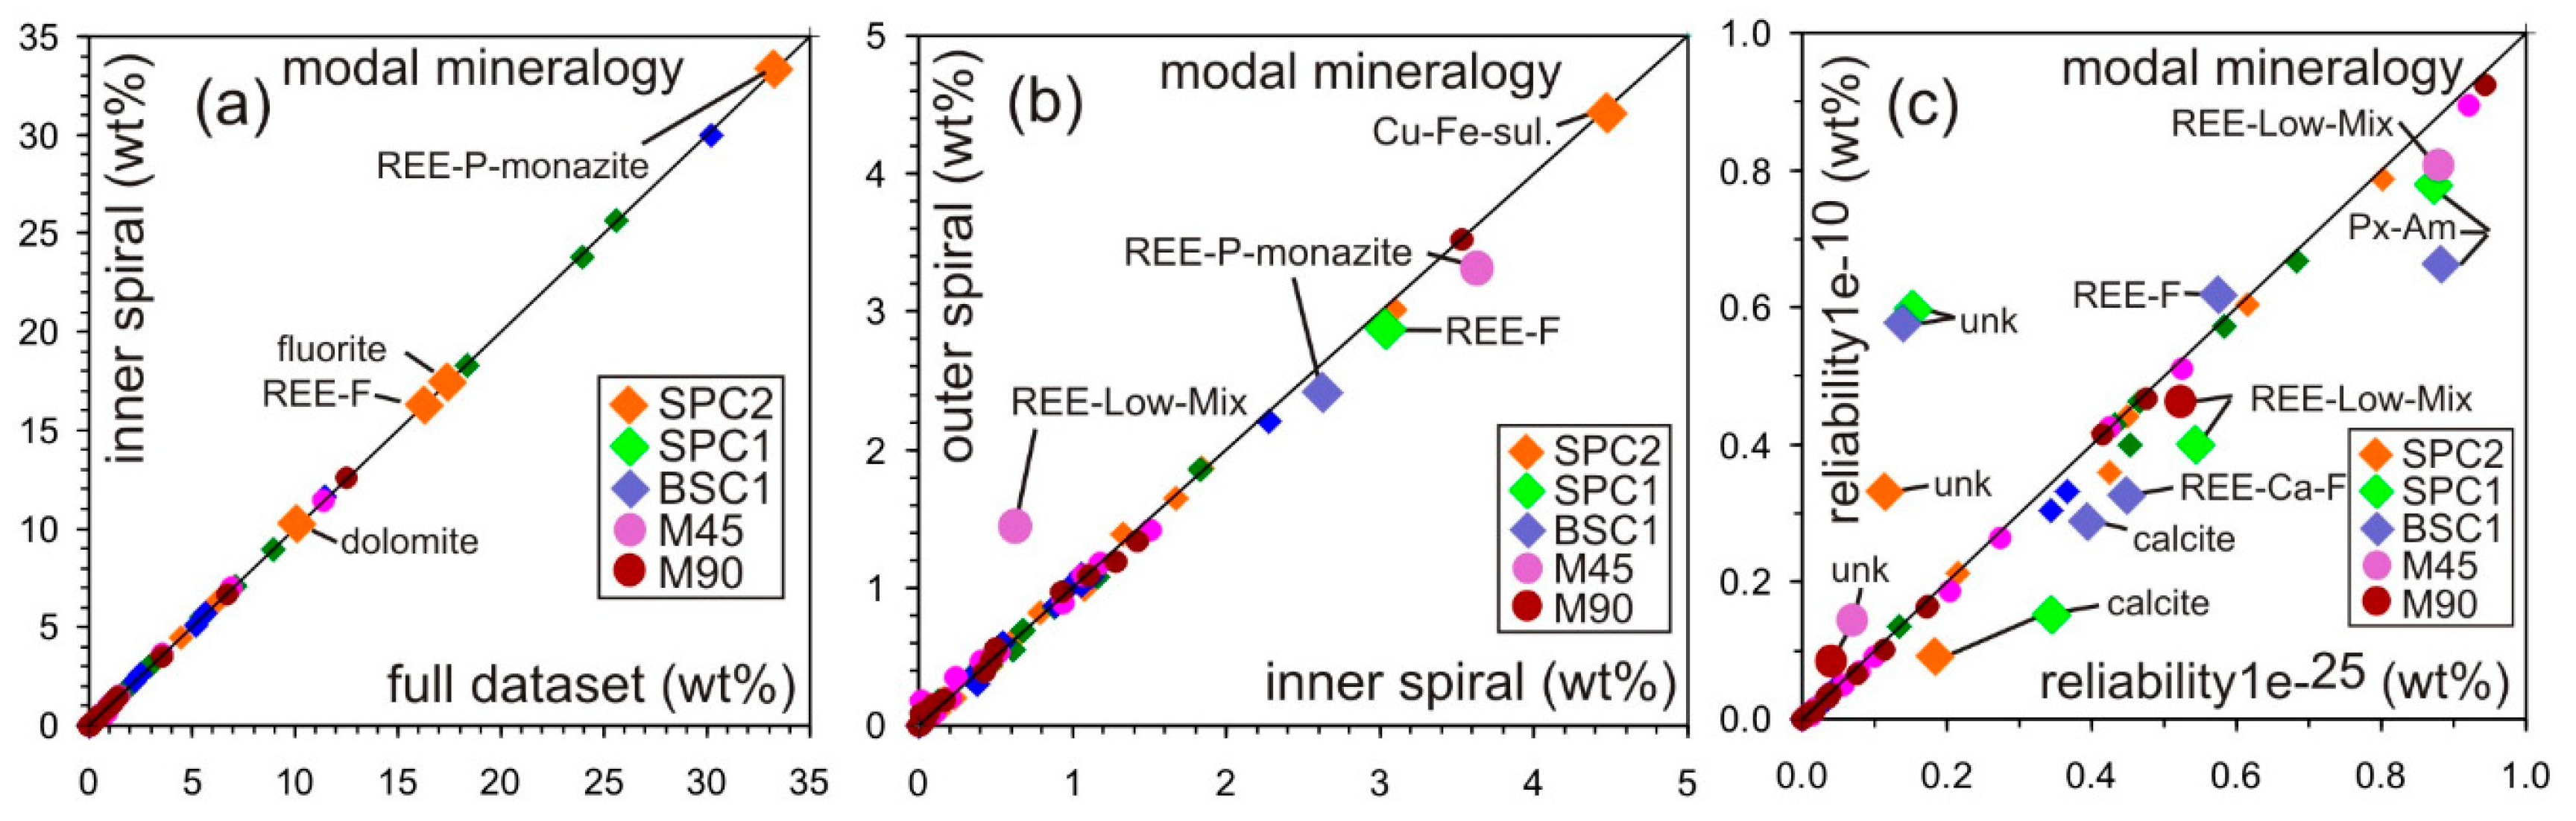
5. Analytical Uncertainties

The presented data from grain mounts of processing products are based on the analysis of 336,000–599,000 individual particles in a single sample. When the analytical uncertainties are evaluated, the mineral mode appears as the most prominent parameter in comparison to the particle and grain sizes and their shape geometries. An MLA measurement starts with the acquisition of the first frame in the centre of a round epoxy grain mount block. The subsequent frames are then arranged in a single spiral toward the margin of the block [16]. During the preparation of the grain mount block, particle separation may be induced by the stirring of the particles into the liquid epoxy and subsequent gravitational subsidence of high-density particles during epoxy hardening. These effects can lead to heterogeneous particle distributions in the surface of a polished block [42,43], an effect that is particularly prominent for sample materials (mineral mixtures) with large differences in particle sizes and/or densities. For evaluating this potential uncertainty induced by heterogeneous particle distribution in the polished block surface, the full datasets with >300.000 particles were compared to the datasets from the inner part of the spiral. At a scale of 0–35 wt % the data align almost perfectly (Figure 7a). As a consequence the measurement of the inner spiral appears representative of the complete sample. However, when the inner spirals and the outer spirals are compared at the scale 0–5 wt % of mode, it is obvious that minerals with a mode below 1 wt % may be heterogeneously distributed within a sample, as is the case for the REE-Low-Mix group in sample M45 (Figure 7b). This apparent heterogeneity is attributed to a nugget effect for minor and trace minerals induced during sample preparation. Yet, it is encouraging that the modes of the other mineral groups match very well between the different data sets.
There are also uncertainties related to the spectra classification. The EDX spectra classification algorithm for the MLA software packages follows the principle of best match along a scale of reliability between 1−10 (absolute conformance) to 1−100 (no conformance), as outlined by [16]. REE-bearing minerals display a comparably complex pattern of X-ray emission lines, with many peaks and sub-peaks that are marked by considerable interference (Figure 1g–i). Due to the complex X-ray spectra characteristic for REE-bearing there is considerable risk that EDX spectra are not at all classified, if classification is carried out at a high reliability value. The classification algorithm allows no alternative assignment to another EDX reference spectrum or to another mineral in the list. Due to this principle, the spectra which cannot be classified by the higher reliability scale value will remain as unknown and increase the mode of unknown grains. For the study presented here the sample EDX spectra were thus classified by the reliability values of 1−10 (high degree of conformance) and 1−25 (fair degree of conformance). The latter reliability value is applied to process samples, in an effort to reduce the amount of unknowns below 0.1 wt % mode (by assigning the specific weight of carbon to the unknown spectra).
Applying a reliability value of 1−25 to the samples of the third case study, the modes of unknowns remained low, ranging between 0.04 and 0.15 wt %. These values increase to 0.21–0.59 wt % when a reliability value of 1e−10 is applied to the same data sets. For the modes above 1 wt %, the differences between the two classification schemes are negligible and far below 1 wt %, except for dolomite (−1.2 wt %) in sample BSC1. The largest differences are observed for minor and trace minerals (modal abundance <1.0 wt %; Figure 7c). It is obvious that the increase of the unknowns leads to a reduction of the modes of REE mineral groups. This is the case for the REE-Low-Mix and the REE-Ca-F groups in the samples M90, SPC1 and BSC1 (Figure 7c). For the modes above 1 wt % (not shown), the differences are marginal. The samples of the grinding tests display similar trends. Here, one also observes a reduction of the REE-Low-Mix group, presumably induced by the low intensities along the LREE spectra.

6. Conclusions

Many REE mineral deposits are marked by a diverse set of REE bearing minerals. These REE-bearing minerals are distributed across several mineral classes, representing complex solid solutions with diverse substitutions, and crystallise in numerous hydrous species. All of these factors result in considerable problems in labelling the energy-dispersive X-ray spectra and quantitative element data from REE bearing minerals with the corresponding mineral names.
For the efficient examination of automated SEM mineral liberation analysis data of REE ores, a generic system of labelling the reference EDX spectra from REE-bearing minerals is proposed. This generic labelling is based on quantitative elemental EDS analyses of the REE-bearing minerals, placing particular emphasis on the elements Si, Ca, F and P. EDS spectra are assigned to the following groups (1) REE-P-monazite; (2) REE-Ca-Si-P (represented by britholithe); (3) REE-Ca-F (represented by synchysite); (4) REE-F (represented by bastnaesite and parisite), and a further group (5) REE-Low-Mix. The latter comprises of spectra with low counts in the energy range of the LREE. In case studies, this classification approach has been applied to classify automated SEM-MLA measurements on REE syenite and REE carbonatite ores.
In a REE syenite ore the fine-grained REE minerals in aggregates up to 1 mm in size are closely intergrown with Fe-Ti phases and phyllosilicates. This causes a hard mineability of the REE ores, although the bulk rock REE concentrations are convenient. In comminution tests of a REE carbonatite ore, a longer grinding time of 90 min, compared to 45 min, leads to no significant improvement of the liberation of the dominant REE mineral monazite. A successful concentration of monazite and bastnaesite to >50 wt % in a REE carbonatite ore requires a multi-stage flotation process with regrinding and de-sliming. A considerable proportion of well liberated yet fine REE mineral particles did not float and were lost in the tailings caused by insufficiently optimized flotation conditions and generally known problems with flotation slimes.
The datasets were classified with the spectra list involving generically labelled REE spectra with high (1−10) and fair (1−25) reliability of match. When classified at a reliability value of 1−10, one can state an increase of the unknowns by a factor 2, however, the mode proportions of unknowns still remains below 1.0 wt %. A high reliability of match (1−10) induces a reduction of the mode proportions of the REE-Low-Mix group and other REE spectra groups in favour of the unknowns. At mode proportions of >5 wt% the effects of the reliability values are marginal and almost negligible.
The case studies illustrate the generic characters of the classification approach, as it is found to be highly applicable to different types of REE ores and mineral-processing products.

Author Contributions

Conceptualization, B.S., G.M., J.G.; methodology, B.S.; investigation, G.M., B.S.; resources, J.G.; data curation, B.S., G.M.; Writing—Original Draft preparation, B.S.; Writing—Review and Editing, B.S., G.M., J.G.; visualization, B.S. and G.M.; project administration, G.M.; funding acquisition, G.M. and J.G.

Funding

This research was supported by TU Bergakademie Freiberg and the Helmholtz Institute Freiberg for Resource Technology.

Acknowledgments

The authors acknowledge the great expertise of A. Bartzsch, R. Wuerkert and M. Stoll at the difficult preparation of numerous epoxy grain mount blocks from REE carbonite ores at Helmholtz Institute Freiberg for Resource Technology. S. Gilbricht is thanked for her untiring support during the automated SEM-MLA measurements at the instruments of the Geometallurgy Laboratory at the TU Bergakademie Freiberg. The authors acknowledge also the constructive comments of three reviewers to the manuscript.

Conflicts of Interest

The authors declare no conflict of interest.

References

  1. Chakhmouradian, A.R.; Wall, F. Rare earth elements: Minerals, mines, magnets (and more). Elements 2012, 8, 333–340. [Google Scholar] [CrossRef]
  2. Guarino, V.; de’ Gennaro, R.; Melluso, L.; Ruberti, E.; Azzone, R.G. The transition from miaskitic to agpaitic rocks as marked by the accessory mineral assemblages, in the Passa Quatro alkaline complex (southeastern Brazil). Can. Mineral. 2019, 57, 1–23. [Google Scholar] [CrossRef]
  3. Guarino, V.; Wu, F.Y.; Melluso, L.; Gomes, C.B.; Tassinari, C.C.G.; Ruberti, E.; Brilli, M. U-Pb ages, geochemistry, C-O-Nd-Sr-Hf isotopes and petrogenesis of the Catalão II carbonatitic complex (Alto Paranaíba Igneous Province, Brazil): Implications for regional-scale heterogeneities in the Brazilian carbonatite associations. Int. J. Earth Sci. 2017, 106, 1963–1989. [Google Scholar] [CrossRef]
  4. Melluso, L.; Guarino, V.; Lustrino, M.; Morra, V.; de’ Gennaro, R. The REE- and HFSE-bearing phases in the Itatiaia alkaline complex (Brazil), and geochemical evolution of feldspar-rich felsic melts. Mineral. Mag. 2017, 81, 217–250. [Google Scholar] [CrossRef]
  5. Marks, M.A.W.; Markl, G. A global review of agpaitic rocks. Earth-Sci. Rev. 2017, 173, 229–258. [Google Scholar] [CrossRef]
  6. Chakhmouradian, A.R.; Zaitsev, A.N. Rare earth mineralization in igneous rocks: Sources and processes. Elements 2012, 8, 347–353. [Google Scholar] [CrossRef]
  7. Williams-Jones, A.E.; Migdisov, A.A.; Samson, I.M. Hydrothermal mobilisation of the rare earth elements—a tale of “Ceria” and “Yttria”. Elements 2012, 8, 355–360. [Google Scholar] [CrossRef]
  8. Richter, L.; Diamond, L.W.; Atanasova, P.; Banks, D.A.; Gutzmer, J. Hydrothermal formation of heavy rare earth element (HREE)–xenotime deposits at 100 °C in a sedimentary basin. Geology 2018, 46, 263–266. [Google Scholar] [CrossRef]
  9. Jones, A.P.; Wall, F.; Williams, C.T. Rare Earth Minerals: Chemistry, Origin and Ore Deposits; The Mineralogical Society Series 7; Chapmann & Hall: London, UK, 1996; p. 372. [Google Scholar]
  10. Yang, K.F.; Fan, H.R.; Santosh, M.; Hu, F.F.; Wang, K.Y. Mesoproterozoic carbonatitic magmatism in the Bayan Obo deposit, Inner Mongolia, North China: Constraints for the mechanism of super accumulation of rare earth elements. Ore Geol. Rev. 2011, 40, 122–131. [Google Scholar] [CrossRef]
  11. Long, K.R.; Van Gosen, B.R.; Foley, N.K.; Cordier, D. The Principal Rare Earth Elements Deposits of The UNITED STATES—A Summary of Domestic Deposits and a Global Perspective; USGS Scientific Investigation Report 2010–5220; USGS: Reston, VA, USA, 2010; p. 96. Available online: https://pubs.usgs.gov/sir/2010/5220/ (accessed on 30 August 2019).
  12. Hatch, G.P. Rare Earth Elements: Dynamics in the Global Market for Rare Earths. Elements 2012, 8, 341–346. [Google Scholar] [CrossRef]
  13. Mariano, A.N.; Mariano, A., Jr. Rare earth elements: Rare earth mining and exploration in North America. Elements 2012, 8, 369–376. [Google Scholar] [CrossRef]
  14. Kynicky, J.; Smith, M.P.; Xu, C. Rare earth elements: Diversity of rare earth deposits: The key example of China. Elements 2012, 8, 361–367. [Google Scholar] [CrossRef]
  15. Reisman, D.; Weber, R.; McKernan, J.; Northeim, C. Rare Earth Elements: A Review of Production, Processing, Recycling, and Associated Environmental Issues; EPA Report; EPA/600/R-12/572; U.S. Environmental Protection Agency (EPA): Washington, DC, USA, 2013. Available online: https://nepis.epa.gov/Adobe/PDF/P100EUBC.pdf (accessed on 30 August 2019).
  16. Weng, Z.H.; Jowitt, S.M.; Mudd, G.M.; Haque, N. Assessing rare earth element mineral deposit types and links to environmental impacts. Appl. Earth Sci. 2013, 122, 83–96. [Google Scholar] [CrossRef]
  17. Dutta, T.; Kim, K.-H.; Uchimiya, M.; Kwonc, E.E.; Jeon, B.-H.; Deep, A.; Yun, S.-T. Global demand for rare earth resources and strategies for green mining. Environ. Res. 2016, 150, 182–190. [Google Scholar] [CrossRef] [PubMed]
  18. Wall, F.; Rollat, A.; Pell, R.S. Responsible sourcing of critical metals. Elements 2017, 13, 313–318. [Google Scholar] [CrossRef]
  19. Rollinson, H. Using Geochemical Data: Evaluation, Presentation Interpretation; Longman Group: Harlow, UK, 1993; p. 354. [Google Scholar]
  20. Gu, Y. Automated scanning electron microscope based mineral liberation analysis. An introduction to JKMRC/FEI Mineral Liberation Analyser. J. Miner. Mater. Character. Eng. 2003, 2, 33–41. [Google Scholar] [CrossRef]
  21. Fandrich, R.; Gu, Y.; Burrows, D.; Moeller, K. Modern SEM-based mineral liberation analysis. Int. J. Miner. Process. 2007, 84, 310–320. [Google Scholar] [CrossRef]
  22. Lastra, R. Seven practical application cases of liberation analysis. Int. J. Miner. Process. 2007, 84, 337–347. [Google Scholar] [CrossRef]
  23. Petruk, W. Applied Mineralogy in the Mining Industry, 1st ed.; Elsevier Science: Amsterdam, The Netherlands, 2000; p. 288. [Google Scholar]
  24. Chang, L.L.A.; Howie, R.A.; Zussman, J. Rock-Forming Minerals, 2nd ed.; Non-silicates: Sulphates, carbonates, phosphates, halides; Geological Society London: London, UK, 1998; Volume 5B, p. 383. [Google Scholar]
  25. Thompson, W.; Lombard, A.; Santiago, E.; Singh, A. Mineralogical studies in assisting benefication of rare earth element minerals from carbonatite deposits. In Proceedings of the 10th International Congress for Applied Mineralogy (ICAM), Trondheim, Norway, 1–5 August 2011; Springer: Berlin/Heidelberg, Germany, 2012; pp. 665–672, ISBN 9788273851390. [Google Scholar]
  26. Smythe, D.M.; Lombard, A.; Coetzee, L.L. Rare earth element deportment studies utilising QEMSCAN technology. Miner. Eng. 2013, 52, 52–61. [Google Scholar] [CrossRef]
  27. Smith, D.G.W. Identification of rare earth and yttrium minerals using the minident database. In Russel, P.E. Microbeam Analysis. In Proceedings of the 24th Annual Conference of the Microbeam Analysis Society, Asheville, NC, USA, 16–21 July 1989; pp. 559–562. [Google Scholar]
  28. Smith, D.G.W.; de St. Jorre, L. The MinIdent Data Base-examples of applications to the Thor Lake rare metal deposits. In Proceedings of the 14th General meeting of International Mineralogical Association, Stanford, CA, USA, 13–18 July 1986; p. 234. [Google Scholar]
  29. Greb, V.G.; Guhl, A.; Weigand, H.; Schulz, B.; Bertau, M. Understanding phosphorous phases in sewage sludge ashes: A wet-process investigation coupled with automated mineralogy analysis. Miner. Eng. 2016, 99, 30–39. [Google Scholar] [CrossRef]
  30. Pietranik, A.; Kierczak, J.; Tyszka, R.; Schulz, B. Understanding heterogeneity of a slag derived technosol: The role of automated SEM-EDS analyses. Minerals 2018, 8, 513. [Google Scholar] [CrossRef]
  31. Schulz, B. Polymetamorphism in garnet micaschists of the Saualpe Eclogite Unit (Eastern Alps, Austria), resolved by automated SEM methods and EMP-Th-U-Pb monazite dating. J. Metamorph. Geol. 2017, 35, 141–163. [Google Scholar] [CrossRef]
  32. Merker, R.G.; Leissner, T.; Schulz, B. Use of virtual fractions for MLA of Y-bearing REE ores. In Proceedings of the 28th International Mineral Processing Congress 2016, Québec, QC, Canada, 11–15 September 2016. Conference Proceedings Paper ID 894. [Google Scholar]
  33. Merker, R.G.; Smith, D.L. Rare earths—espects of market and beneficiation. World Metall.-Erzmetall. 2018, 71, 189–197. [Google Scholar]
  34. Pinckston, D.R.; Smith, D.G.W. Mineralogy of the Lake zone, Thor Lake rare-metals deposit, N.W.T., Canada. Can. J. Earth Sci. 1995, 32, 516–532. [Google Scholar] [CrossRef]
  35. Sheard, E.R.; Williams-Jones, A.E.; Heiligmann, M.; Pederson, C.; Trueman, D.L. Controls on the concentration of zirconium, niobium, and the rare earth elements in the Thor Lake rare metal deposit, Northwest Territories, Canada. Econ. Geol. 2012, 107, 81–104. [Google Scholar] [CrossRef]
  36. Jackson, B.R.; Reid, A.F.; Wittemberg, J.C. Rapid production of high quality polished sections for automated image analysis of minerals. Proc. Australas. Inst. Miner. Metall. 1984, 289, 93–97. [Google Scholar]
  37. Echlin, P. Handbook of Sample Preparation for Scanning Electron Microscopy and X-ray Microanalysis, 1st ed.; Springer Science: Berlin/Heidelberg, Germany, 2009; p. 326. [Google Scholar] [CrossRef]
  38. Finch, J.A.; Gomez, C.O. Separability curves from image analysis data (Technical Note). Miner. Eng. 1989, 2, 565–568. [Google Scholar] [CrossRef]
  39. Leistner, T.; Peuker, U.A.; Rudolph, M. How gangue particle size can affect the recovery of ultrafine particles during froth flotation. Miner. Eng. 2017, 9, 1–9. [Google Scholar] [CrossRef]
  40. Lastra, R.; Petruk, W. Mineralogical characterization of sieved and un-sieved samples. J. Miner. Mater. Charact. Eng. 2014, 2, 40–48. [Google Scholar] [CrossRef]
  41. Neethling, S.J.; Cilliers, J.J. Grade-recovery curves: A new approach for analysis of and predicting from plant data. Miner. Eng. 2012, 36, 105–110. [Google Scholar] [CrossRef]
  42. Sandmann, D.; Schulz, B.; Gutzmer, J.; Eickhoff, A. Controls on the Industrial Regrind Milling Process of Coarse-Grained Ores by SEM-Based Image Analysis; Abstracts 89. In Proceedings of the DGK, DMG & +MG, Salzburg, Austria, 20–24 September 2011; p. 131. [Google Scholar]
  43. Leigh, G.M.; Sutherland, D.N.; Gottlieb, P. Confidence limits for liberation measurements. Miner. Eng. 1993, 2, 155–161. [Google Scholar] [CrossRef]
Figure 1. (ac) Particles of grinded rare earth element (REE) carbonatite ore in backscattered electron images (BSE). The REE minerals monazite (Mnz), bastnaesite (Bas), and the REE-Ca-F minerals (synchysite) are in light grey to white; the REE-Nb- and Nb-bearing minerals (Nb-min) are also in light grey; the gangue minerals as ankerite (Ank), dolomite (Dol) and fluorite (Flu) are dark grey. (df) REE carbonatite ore particles after classification of automated scanning electron microscopy (SEM) measurement in the mineral liberation analysis (MLA)-XBSE routine. Classification with list of generically labelled energy-dispersive X-ray (EDX) spectra and corresponding grouping of the spectra (see text). REE minerals in the particles display only poor and partial liberation. (gi) EDX spectra of some REE minerals in keV versus normalised counting rate (cts/s)N. Positions of maxima in the spectra are labelled by the corresponding elements. The generic labelling of the spectra in REE-Si-Ca-F-P is according to a quantitative EDX element analysis of the corresponding REE mineral grain, shown on the right side.
Minerals 09 00527 g001
Figure 2. (a) Backscattered electron image (BSE) of one frame (magnification 175 times) of an automated scanning electron microscopy-mineral liberation analysis (SEM-MLA) measurement of a polished thin section from a hydrothermally overprinted alkali plutonite. A complete measurement of the 25 × 40 mm sized thin section is composed of ~300 frames. The BSE image displays only a comparably low resolution due to technical reason. (b) Classified, grouped and color-coded presentation of the frame in (a) in an automated SEM-MLA measurement in the GXMAP routine; the modes in the mineral legend are in area percent and are related to the whole sample area. Stepsize is 18 µm. The images in (a) and (b) display fine-grained and heterogeneously composed parts and REE mineral grains in intimate intergrowth with phyllosilicates and Fe-oxides.
Minerals 09 00527 g002
Figure 3. Results of comminution tests of REE carbonatite ore with 45 and 90 min length of time. (a) Modal mineralogy (in wt %, y-axis) of complete samples and of particle size classes by virtual sieving with the filter routine of equivalent circle (EC) diameter (see text). Proportion of the corresponding particle size class in wt % (x-axis). Dolomite (Dol); fluorite (Flu) and REE-P-monazite (Mnz) are labelled. (b) Mineral liberation of REE-P-monazite in terms of proportion in wt % of particle composition. Inset sketch displays the liberation class particle composition of 45 wt % REE-P-monazite in a schematic view. (c) Mineral liberation of REE-P-monazite in terms of proportion in contour% of free surface. Inset sketch displays the liberation class free surface of 50% REE-P-monazite in a schematic view. (d) Presentation of the intergrowths of non-liberated REE-P-monazite with fluorite (Flu) and dolomite (Dol). Proportions of fluorite and dolomite in wt % in the complete samples and in particle size fractions by virtual sieving with the filter routine EC diameter (see text).
Minerals 09 00527 g003
Figure 4. Flow scheme of multi-stage open cycle flotation tests with REE carbonatite ore, containing monazite and bastnaesite as principal REE minerals. Positions of analysed samples along the flow scheme are marked in yellow, flotation products which are not analysed are marked in grey.
Minerals 09 00527 g004
Figure 5. Results of mineral processing tests with the steps SPC2-SPC1-BSC1-BS1 during multistage flotation of REE carbonatite ore (see Figure 4 for positions of samples in the flow scheme. (a) Modal mineralogy (in wt %) of complete samples and selected particle size fractions after virtual sieving with the filter mode equivalent circle diameter. Ap—apatite; Bas—bastnaesite; Dol—dolomite; Fe-Ti—Fe-Ti-minerals; Flu—fluorite; Mnz—REE-P-monazite; Sil—silicate minerals. SPC2—second cleaner concentrate; SPC1—scavenger cleaner concentrate; BSC1—scavenger cleaner middlings; BS1—tailings. (b) Cumulative particle size distributions (cumulative passing) of the step samples of the mineral processing tests in (a), for all particles, for (REE-P)-monazite (Mnz) and bastnaesite (Bas). (c) Modal mineralogy of virtual sieve fractions of concentrate SPC2. Proportions of fractions are listed below the columns. Maximum modes of REE minerals are found in the fraction 0–5 µm. Numbers are grain counts. (d) Mineral liberation of (REE-P)-monazite in terms of proportion in wt % of particle composition. Data for complete samples (labelled as all) in thick lines; data for selected particle size classes in microns after virtual sieving in thin lines. Same legend as in (b). (e) Intergrowth relationships of non-liberated (REE-P)-monazite with other REE-minerals, fluorite and carbonates.
Minerals 09 00527 g005
Figure 6. (ac) Mineral grade vs recovery curves of REE carbonatite ore samples in mineral processing tests involving multistage flotation. Data of 100 wt % cumulative recovery is given by the mode of bastnaesite (Bas—broken lines) and REE-P-monazite (Mnz). Data of 100 wt % mineral grade is given by the proportion in wt% of fully liberated grains, extracted from the mineral liberation data in Figure 5d. SPC2—second cleaner concentrate; SPC1—scavenger cleaner concentrate; BSC1—scavenger cleaner middlings; BS1—scavenger tailings. Data for the complete samples in thick lines; data for particle size classes (in microns, virtual sieving) in thin lines. (d) Particle line-up of monazite and bastnaesite (REE) in the BS1 scavenger tailings sample. Note that many REE mineral particles are fully liberated but did not float. REE mineral grains of same size are mostly enclosed in carbonate (ankerite Ank, dolomite Dol), fluorite (Flu) and titanite (Ttn) particles.
Minerals 09 00527 g006
Figure 7. Influence of various parameters on the modal mineralogy of processed REE carbonatite ores. Datasets from single samples are based on the analysis of 300,000–600,000 particles in epoxy grain mount blocks of 30 mm in diameter. Samples are: SPC2—second cleaner concentrate; SPC1—scavenger cleaner concentrate; BSC1—scavenger cleaner middlings; BS1—scavenger tailings; M45, M90 are samples of comminution test with 45 and 90 min of milling. See legend insets. (a) Comparison of full dataset composed by inner and outer spiral of measurement frames vs. inner spiral, in the scale 0–35 wt %. At this scale a measurement of the inner spiral appears as sufficient. (b) Comparison of the inner spiral vs. the outer spiral of measurement frames, in the scale 0–5 wt %. Although some outliers with low modes exist, the epoxy block displays homogeneous distribution of particles. (c) Influence of the parameter reliability of conformity of EDX spectra during measurement classification against reference spectra set. The values of reliability of conformity are intermediate (1−25) and high (1−10) and refer to grouped spectra. A high reliability of conformity leads to a significant increase of “unknown” (unk) which is only relevant for modes between 0 and 1 wt %.
Minerals 09 00527 g007
Table 1. List of REE-bearing minerals and their assignment to mineral groups as applied in the presented MLA studies of REE ores. The given mineral compositions (in wt %; density Dens.) are not representative and refer to the analysed REE ores and/or are partly taken from databases (e.g., www.webmineral.com).
MLA-GroupMineralGeneral FormulaDens.∑REEPCaSi C FO
REE-P-monazitemonazite(LREE,Y,Th,Si,Ca)PO45.1059.4913.210.000.000.000.0027.29
REE-Al-P-phasesflorencite(LREE)Al3(PO4)2(OH)63.5827.3112.070.000.000.000.0043.66
REE-Ca-Si-P-phasesbritholite(LREE,Ca)5(SiO4,PO4)3(OH,F)4.4546.442.0014.709.400.000.5026.85
REE-Ca-F-phasessynchysite(LREE,Ca)(CO3)2F4.0243.890.0012.560.007.535.9530.07
REE-F-phasesbastnaesite(LREE)(CO3)F4.9763.940.000.000.005.488.6721.90
REE-F-phasesfluocerite(LREE)F36.1371.070.000.000.000.0028.930.00

