Article

Modeling of REE and Fe Extraction from a Concentrate from Araxá (Brazil)

1
Centro de Tecnologia Mineral—CETEM/MCTIC, Rio de Janeiro 21941-908, Brazil
2
Companhia Brasileira de Metalurgia e Mineração—CBMM, Araxá 38183-903, Brazil
*
Author to whom correspondence should be addressed.
Minerals 2019, 9(7), 451; https://doi.org/10.3390/min9070451
Submission received: 7 June 2019 / Revised: 2 July 2019 / Accepted: 11 July 2019 / Published: 21 July 2019
(This article belongs to the Section Mineral Processing and Extractive Metallurgy)

Abstract

:
The study aimed to employ a comprehensive methodology for the acid processing of a rare earth element (REE) concentrate obtained from the ore from Araxá (MG-Brazil). The most important process variables have been identified and their levels determined to maximize REE extraction (%RE) and minimize Fe extraction (%Fe). The thermodynamic analysis showed that the roasting temperature (TF) is crucial for the control of Fe solubilization in the aqueous leaching step of the acid processing. A statistic design of laboratory experiments and a process optimization method were applied to address the interaction among the process variables. Experimental results showed that a TF of about 700 °C can significantly reduce the Fe concentration in the aqueous leaching liquor. Mathematical models were proposed to predict the effect of process variable on REE and Fe extraction of the concentrate. A multi-objective technique was employed for optimization of chemical processing and the best conditions were reached for roasting temperature (TF) = 700 °C, acid to sample mass ratio (ACs) = 0.8 and leaching time (tL) = 20 min, which led to %RE = 96.91% and %Fe = 21.69%.

1. Introduction

Each deposit of rare earth elements (REE) presents a distinct mineralogy that requires a specific approach in the development of an efficient hydrometallurgical route.
Brazil has the second largest reserve of rare earths in the world, with 22 million tons [1], and the Araxá-MG deposit is one of REE’s main assets worldwide, mostly related to weathered carbonatites. The carbonatite deposit of Araxá is located near the city of Araxá, Minas Gerais State in south-eastern Brazil. The total REE oxide content of the ore is 3.0% [2] with a high Fe content (>30%) [3].
Fe is a common impurity in REE ores and concentrates and must be removed as early as possible in the mineral processing route, either in the mineral beneficiation or in the hydrometallurgy, preferably before the REE separation step.
In the beneficiation step, depending on the characteristics of the ore, Fe minerals can be partially removed by physical or physicochemical methods. Wet high intensity magnetic separation can be used for the removal of Fe minerals from REE ores [4]. Other researchers reported Fe separation and REE recovery using magnetizing roasting [5]. Alternatively, REE minerals can be separated by flotation [6], and the Fe free concentrate and sent to the hydrometallurgical plant.
The hydrometallurgy of REE phosphate minerals, as those of the Araxá carbonatite, requires extreme chemical processing conditions [7]. Alkaline and acid methods are usually proposed as hydrometallurgical alternatives for such ores [8].
In the alkaline decomposition method, the REE phosphates are converted to hydroxides by reaction with NaOH and subsequently dissolved in the acid solution. The rare earths are then purified by solvent extraction. The trisodium phosphate formed can be used to the manufacture other products [9,10,11].
The acid digestion method is based on the roasting of the ore with concentrated H2SO4 (96–98%) at low (<300 °C) or high temperature (>300 °C). The REE present in the mineral phases are converted to sulfates which are submitted to an aqueous leaching [10]. The Fe minerals in the ore may contribute to increase the acid consumption in the process. Additionally, the subsequent Fe removal from solution requires large amounts of reagents such as oxides, carbonates or hydroxides. A similar method was used for REE recovery from bottom ashes. The heat treatment of the ashes was carried out with H2SO4 and the recovery of REE with control of Fe in the final liquor was achieved. [12].
The REE in the acid leaching liquor can be precipitated as sodium double sulfates or as oxalates. The reaction products are treated with sodium hydroxide and subsequently leached with HCl. The REE chlorides in solution are then submitted to solvent extraction for separation of the individual elements [13]. Fe in solution may poison the extractant in this step and also be a determining factor of crud formation [14]. Furthermore, the disposal of Fe tailings leads to an increase in processing costs that may affect the project feasibility.
Classical processes are reported to remove Fe+3 from a sulfate leaching liquor by percolating it through a column of iron scrap followed by treatment with sodium dithionite [15]. More recently an alternative method was tested to remove Fe from sulfate leaching liquors as phosphate compounds. According to the authors, the process is particularly applicable to liquors with high Fe and low REE concentration [16].
The preliminary thermodynamic analysis allows the evaluation of the possible processing routes [17,18]. Additionally, a lab test program must be designed to estimate the effect of the experimental variables on the performance of the process. These programs can be designed so that the effect of the interaction of experimental variables is taken into account and a mathematical modeling can be performed. The modeling process can be performed using, for instance, experimental design theory, multiple linear regression, stepwise regression and/or artificial neural network [19,20]. Then, a comprehensive approach, using different methodologies, allows for the successful forecast of the behavior of complex hydrometallurgical systems.
A novel comprehensive optimization methodology was used in this work, based on thermodynamic analysis, statistic design of experiments and multi objective optimization. The purpose was to identify the process variables and the levels of these variables that are adequate to improve the extraction of REE and to reduce the extraction of Fe in the acid processing of a mineral concentrate from Araxá (MG Brazil).

2. Materials and Methods

2.1. Sample Preparation and Characterization

A mineralogical and technological characterization of the ore from Araxá was previously performed in order to subsidize the development of a processing route to extract REE [21]. In the study, the authors identified goethite (38.9%), hematite (8.6%) and magnetite (2.5%) as the main Fe bearing minerals that account for practically all the Fe content in the ore (Fe = 31.2%). Monazite (4.0%) is the major REE carrier. La, Ce, Nd, and Pr correspond to 95% of the REE in the ore. Besides ilmenite, quartz, pyrochlore, rutile, apatite, barite, calzirtite, hollandite, k-feldspar, kaolinite, zircon, cerianite and gorceixite were also reported. The authors also reported that monazite crystals are intergrown with other minerals of the paragenesis and identified a complex mineralogy, dominated by fine crystals and a strong Fe oxide overprint that lead to poor rare earth separability from gangue. Other research reports that mineralogy and texture of the ore from Araxá impose serious technological constraints to the concentration of the rare earths bearing minerals of the ore [22].
A reverse flotation of this ore was performed in order to obtain monazite in the flotation tailings [23] that were then used for the experiments of roasting and aqueous leaching.
The concentrate was characterized by X-Ray diffraction (spectrometer Bruker-AXS D4, Co Kα 40 KV, 40 mA) (Bruker, Karlsruhe, Germany) and X-Ray fluorescence (spectrometer AXIOS WDS, PANalytical, Almero, The Netherlands).

2.2. Thermodynamic Analysis

The thermodynamic data used in this work is provided in Table 1. The ΔG values (Gibbs free energy) of selected reactions were calculated with HSC® Chemistry software (Version 7.15, Outotec, Espoo, Finland) [24]. The charts were generated in the range of 100 °C to 1000 °C in order to study the thermodynamics of the acid roasting.

2.3. Statistical Design, Mathematical Modeling and Experiments

Experiments were planned in two sets: screening experiments and mathematical modeling.

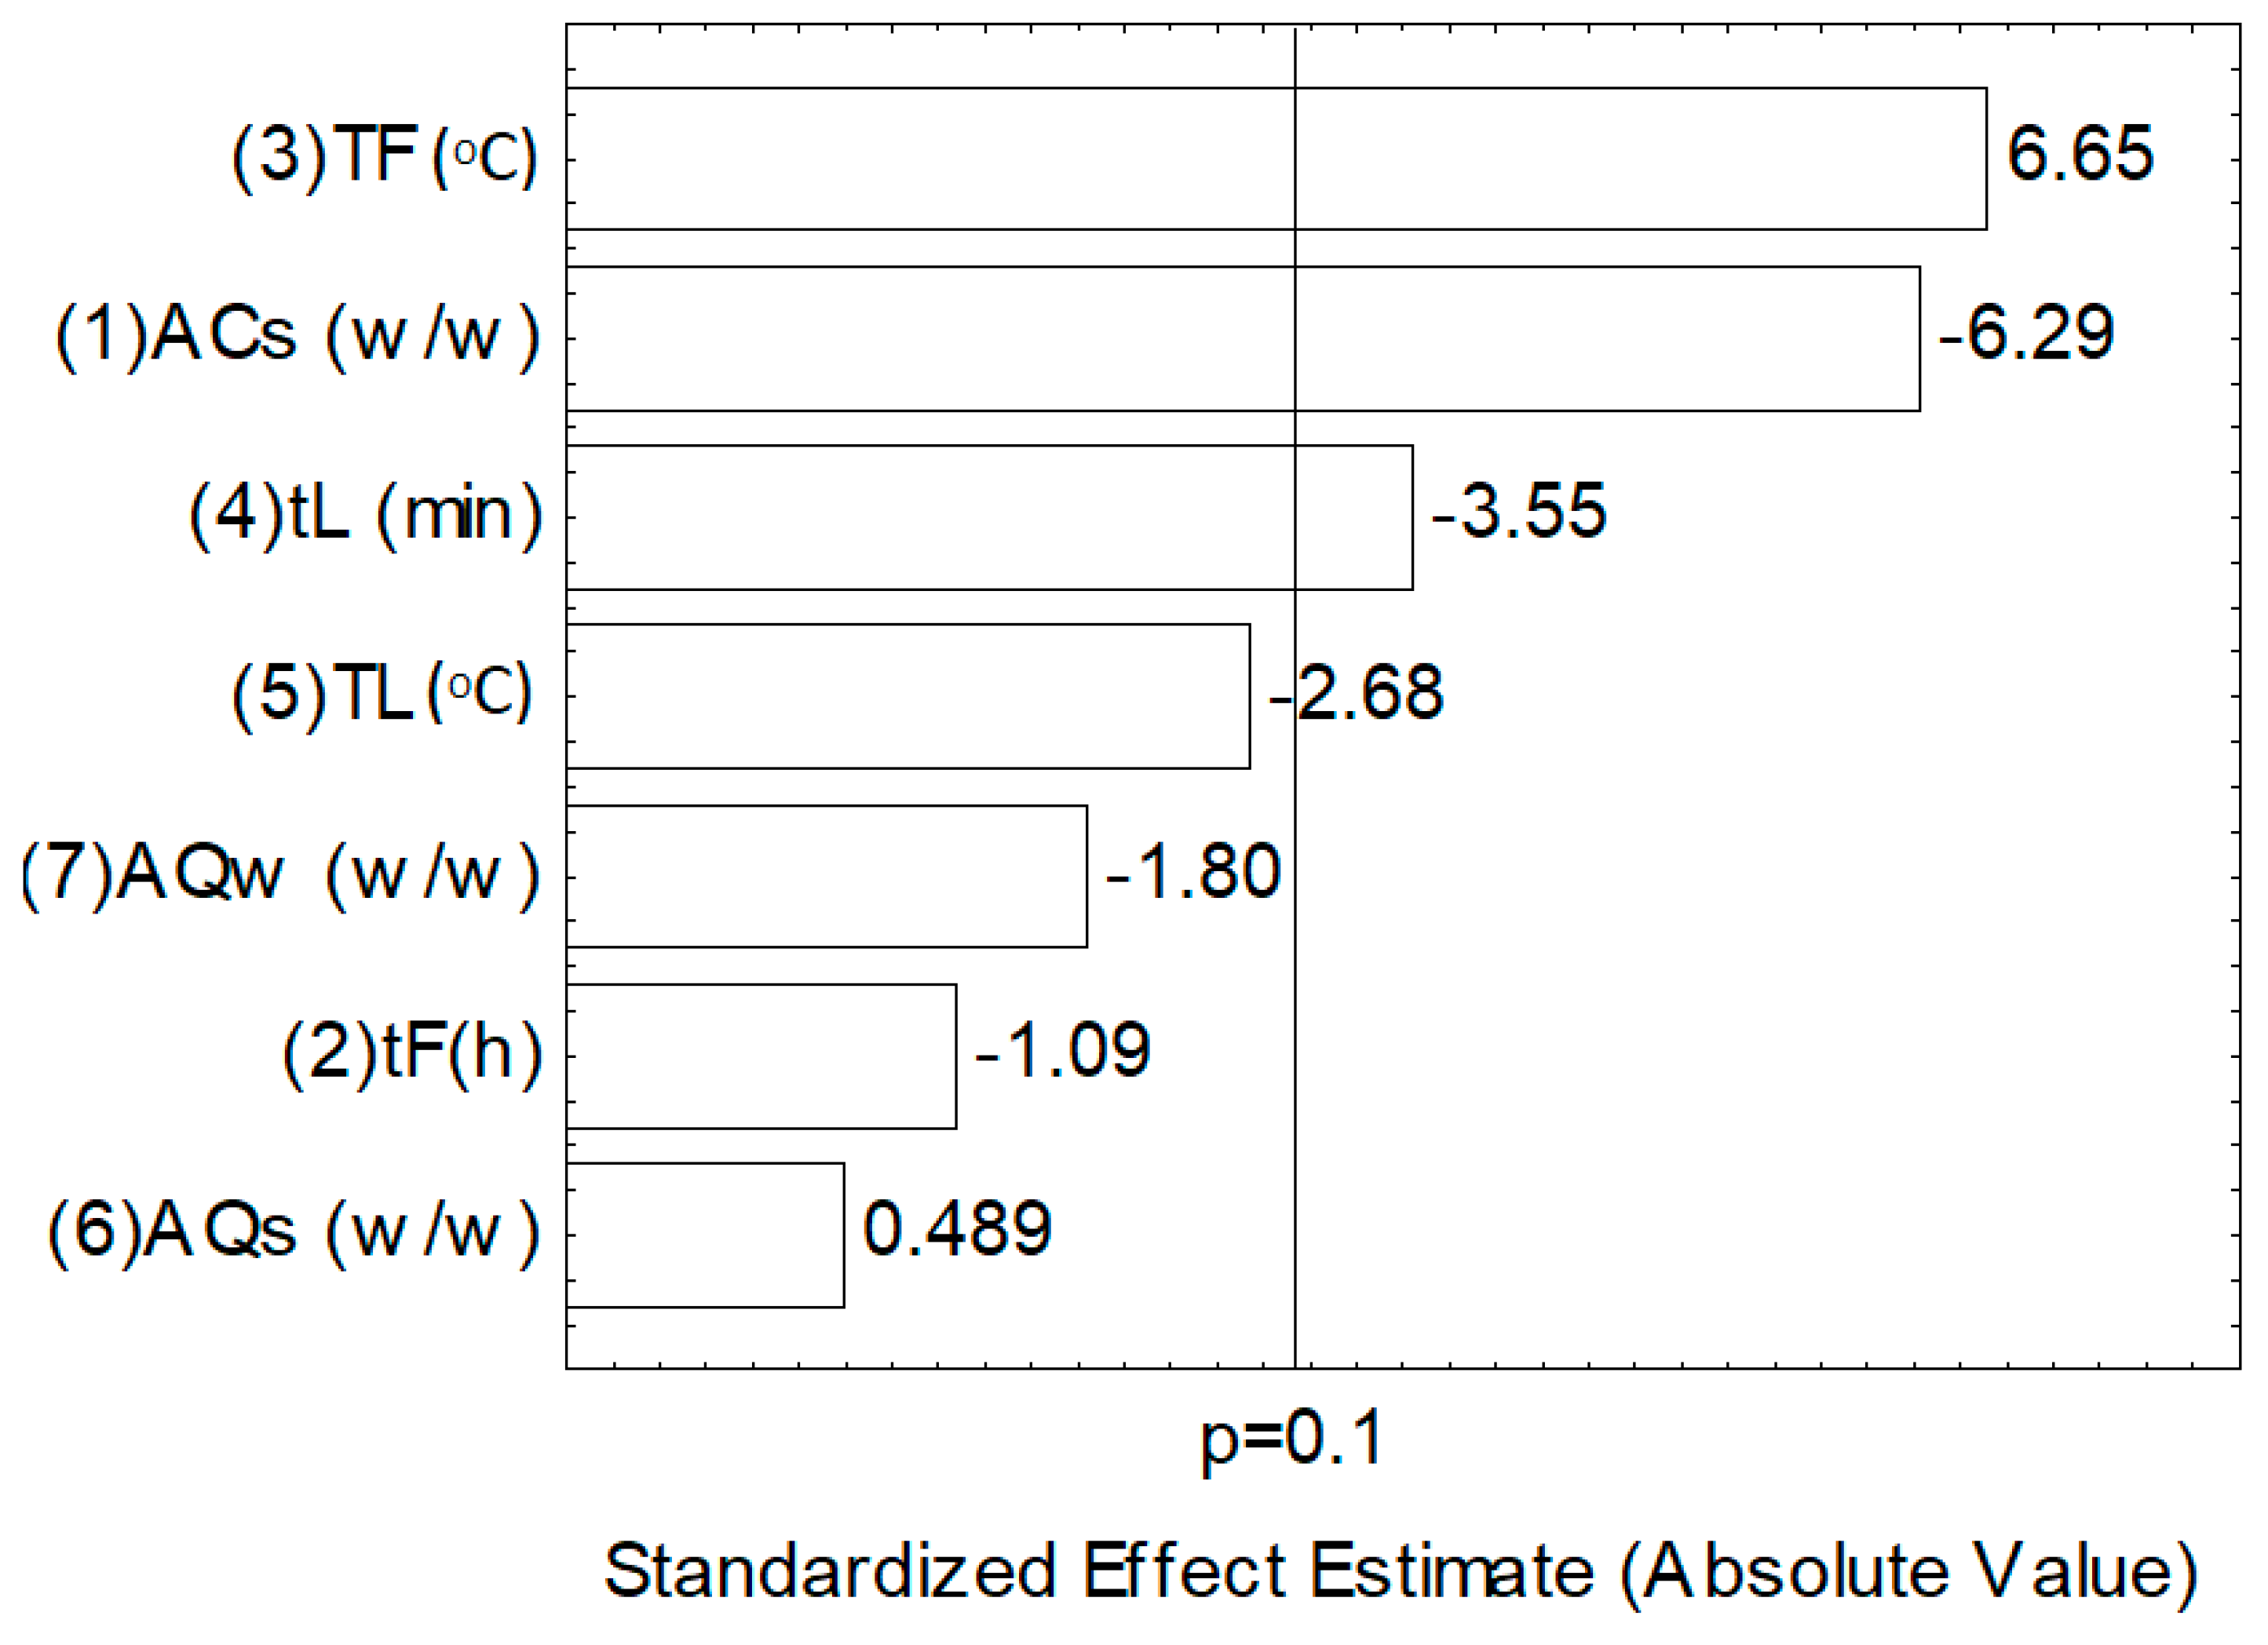
2.3.1. Screening Experiments

The purpose of the screening experiments was to identify which process variables are statistically significant in the acid processing of the concentrate. Acid/sample mass ratio (w/w)—ACs, roasting time (h)—tF, roasting temperature (°C)—TF, leaching time (min)—tL, leaching temperature (°C)—TL, water/sample mass ratio in aqueous leaching (w/w)—AQs and water/sample mass ratio (w/w) in washing—AQw were the process variables selected.
The experiments were statistically planned according to a Plackett–Burman design of eight tests and replicas [25]. The levels of variables shown in Table 2 were set according to the results of preliminary tests and a literature survey.
The statistical analysis of the results was carried out by calculating the effect of each process variable on the response variables: REE extraction (%RE), Fe extraction (%Fe) and the ratio between REE extraction and Fe extraction (%RE/%Fe). The minimum effect statistically significant for a 90% of significance level (p = 0.1) was also calculated, which was represented by a vertical line in the Effects Diagram (Pareto Chart) [25,26]. All statistical analysis was performed with the software Statistica® (Version 12, Statsoft, Tulsa, OK, USA).

2.3.2. Mathematical Modeling

The second set of experiments was statistically designed for the mathematical modeling of the process using different levels of the variables. The modeling was aimed at predicting the behavior of the extraction of REE and Fe in the roasting and the aqueous leaching. The effects of the process variables were directly related to the constants of the mathematical model. Linear, quadratic and second order effects were taken into consideration as in the generic mathematical model of Equation (1), where β0, β1, …, βn are coefficients; x0, x1, …, xn, are process variables, Ɛ is the experimental error and Y is the response variable.
Y = β 0 + β 1 × x 1 + β 2 × x 2 +   β 12 × x 1 × x 2 + β 11 × x 1 × x 2 + β 22 × x 1 2 + ε
Table 3 shows the sixteen experiments planned as a central composite design [25] that were carried out with replicas. Some process variables were kept constant as they were not identified as significant in the statistical analysis of Section 3.3.1. These variables were as follows: tF = 2 h, TL = 25 °C, AQs = 2 and AQw = 2.
Mathematical models were represented by response surface plots that show the processing conditions to achieve the best results for the value ranges of the variables considered [26,27].
As part of the mathematical modeling, a multi objective optimization technique was employed to obtain the levels of the variables based on a desirability function that leads to a maximum REE extraction and a minimum Fe extraction. This method is usually applied when an optimal compromise among multiple responses has to be identified.
The desirability function is an important technique for the optimization of processes with multiple response variables [28]. This methodology requires the calculation of the individual desirability function d by converting the values of responses y on a non-dimensional scale ranging from 0 to 1. The conversion scheme can be written as in Equation (2):
d = { 0 i f   y y m i n ( ( y y m i n ) ( y m a x y m i n ) ) w i f   y m i n y y m a x 1 i f   y y m a x
where y is the value of response, ymin and ymax are the lower-bound and the upper-bound respectively and w is the weight coefficient.
The global desirability D can be determined by Equation (3), where m is the number of responses.
D = ( h = 1 m d h ) 1 / m

2.4. Experimental

The screening and mathematical modeling experiments were performed according to the experimental conditions of Table 2 and Table 3. Aliquots of 100 g of the concentrate, obtained as described in Section 2.1, were previously homogenized and sampled for the tests. The samples were rigorously mixed with concentrated sulfuric acid (96–98%) in porcelain crucibles and heated in a laboratory muffle furnace with controlled temperature.
After the roasting treatment and subsequent cooling to room temperature, the reaction product was removed from the crucibles, ground in a hand mortar and leached with water in a glass reactor mechanically agitated at 300 rpm. The pulp was then filtered in a Büchner filter using quantitative paper. The solids were washed with deionized water, oven dried at 60 °C for 24 h and analyzed by X-Ray fluorescence (spectrometer AXIOS Max, Panalytical) and by X-Ray diffraction (spectrometer Bruker-AXS D4, Co Kα 40 KV, 40 mA). The leaching liquor was analyzed through inductively coupled plasma spectroscopy—ICP (ICP-OES Horiba, Ultima 2) to evaluate the Fe and REE extractions. The REE extraction was calculated by the total of La, Ce, Pr, Nd, and Gd extractions. All the chemicals used in the experiments were analytical grade.

3. Results

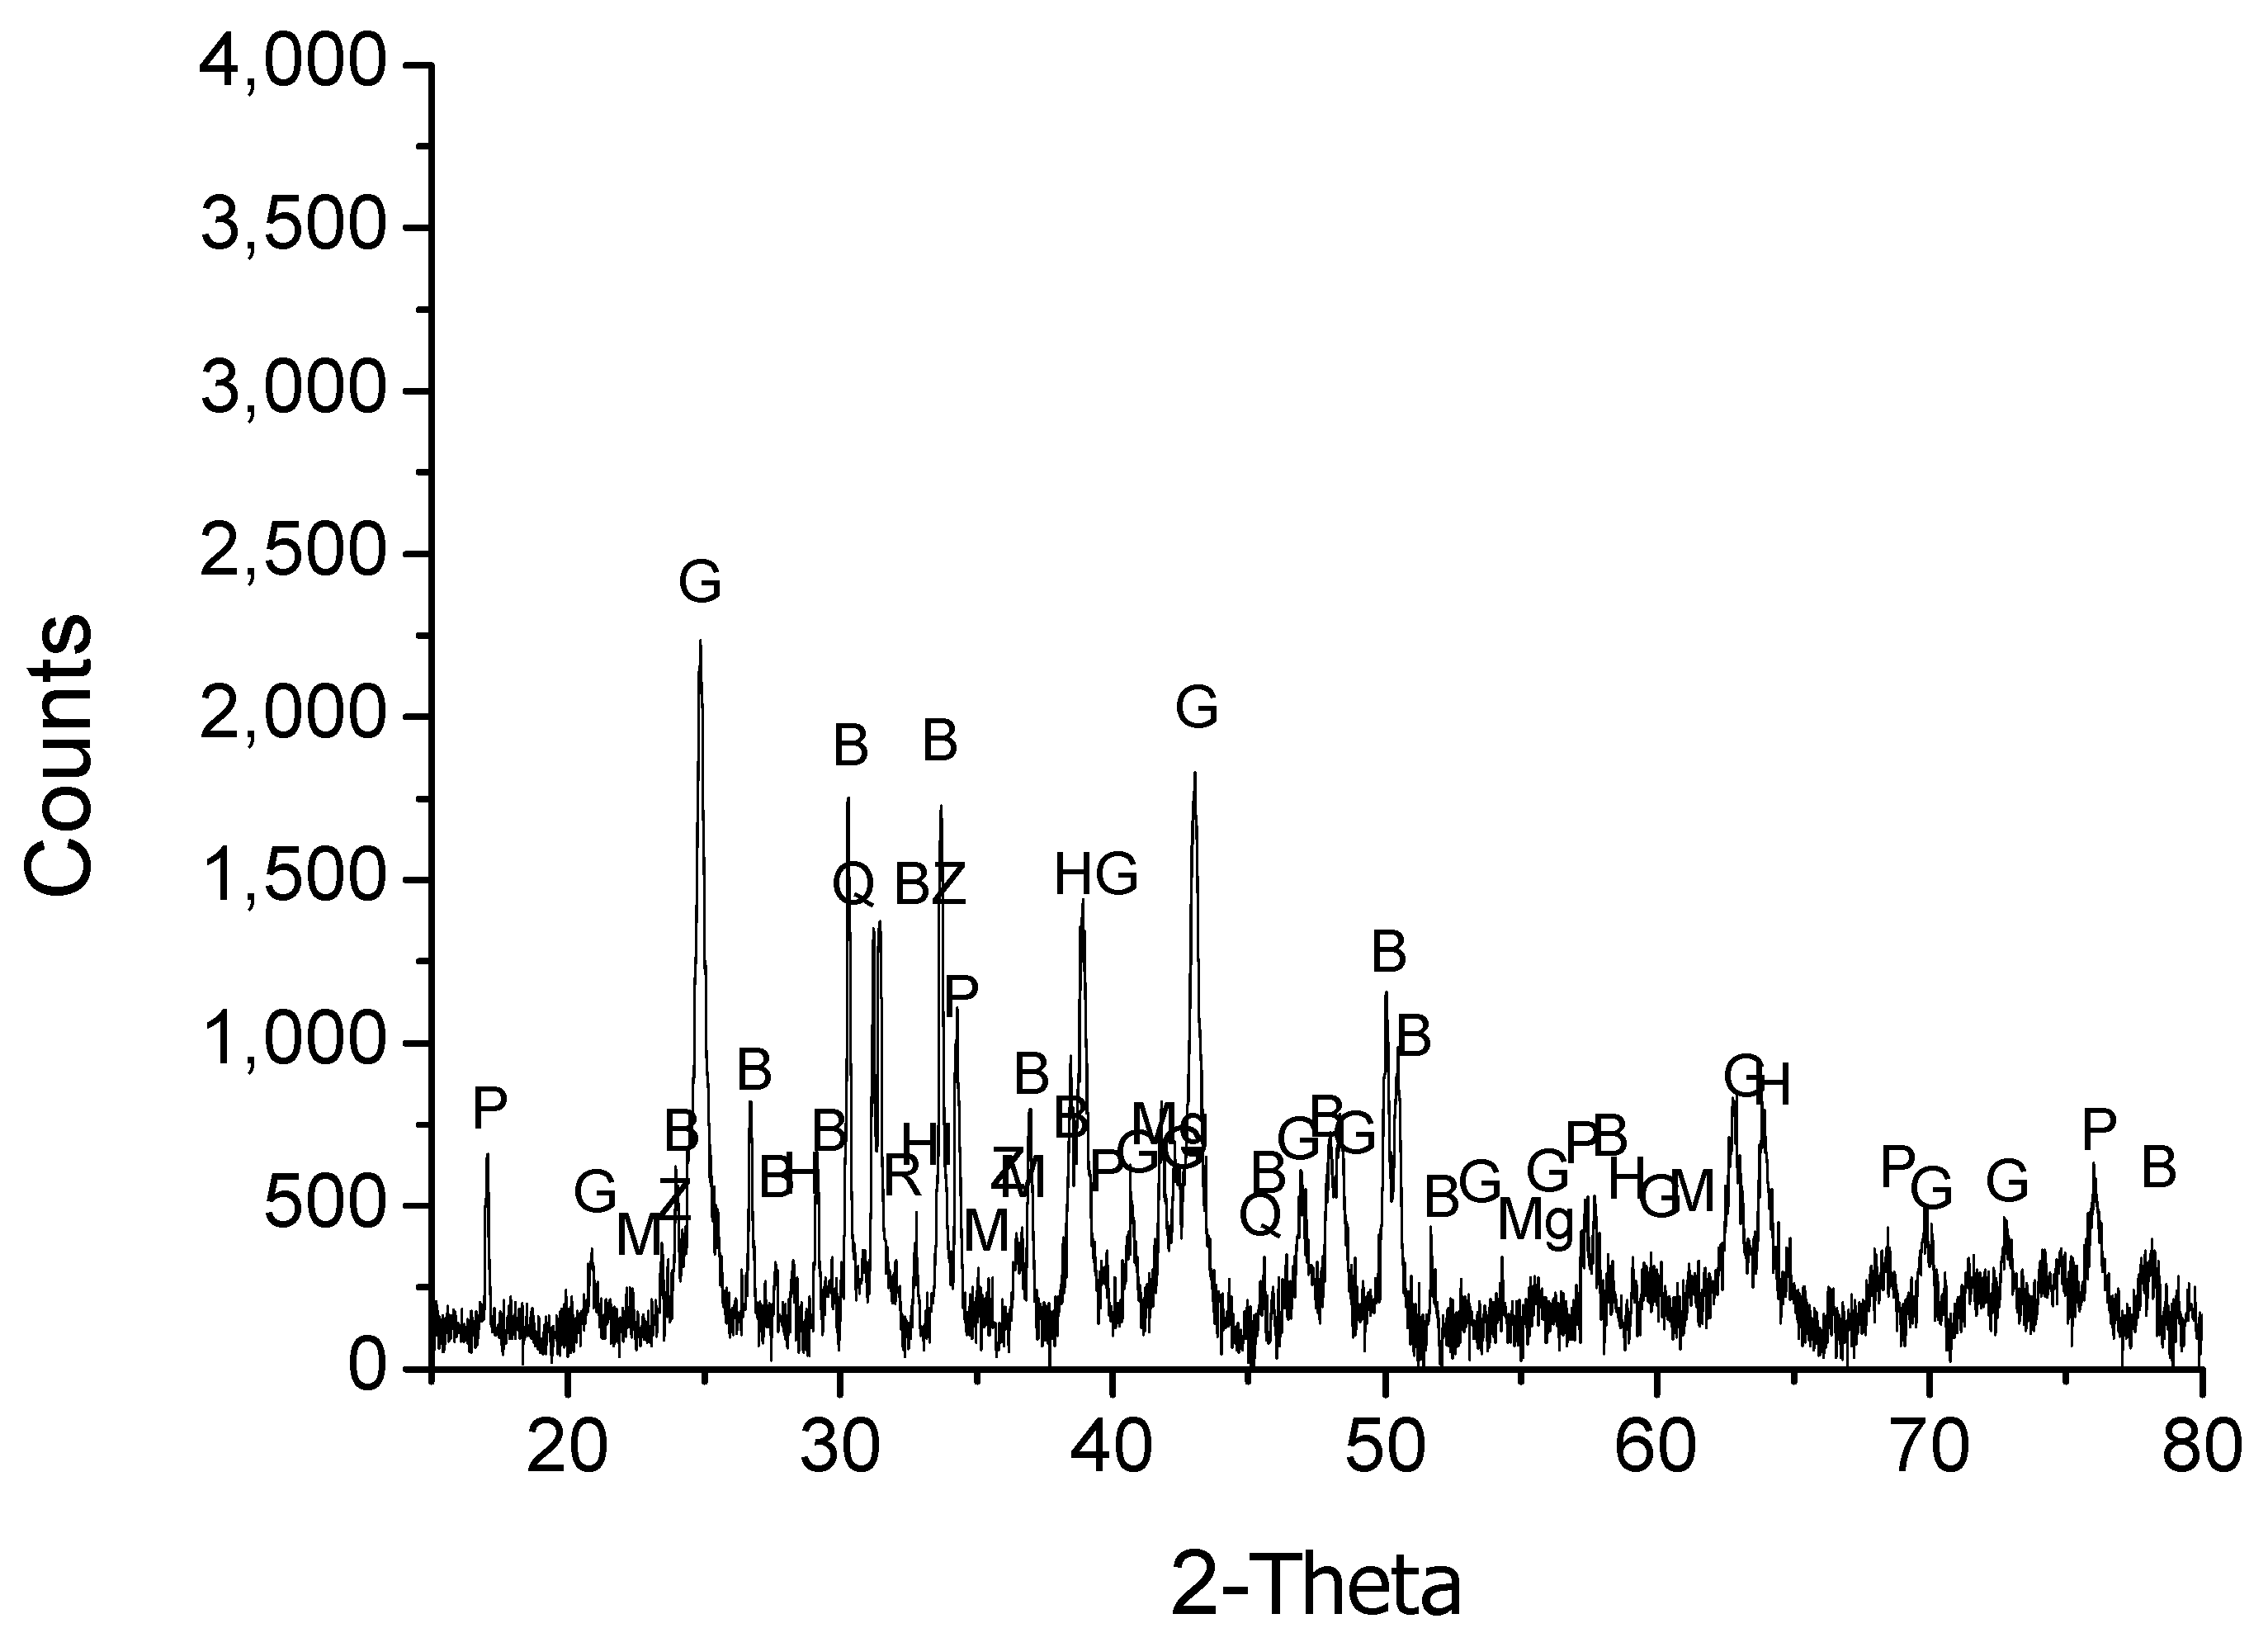
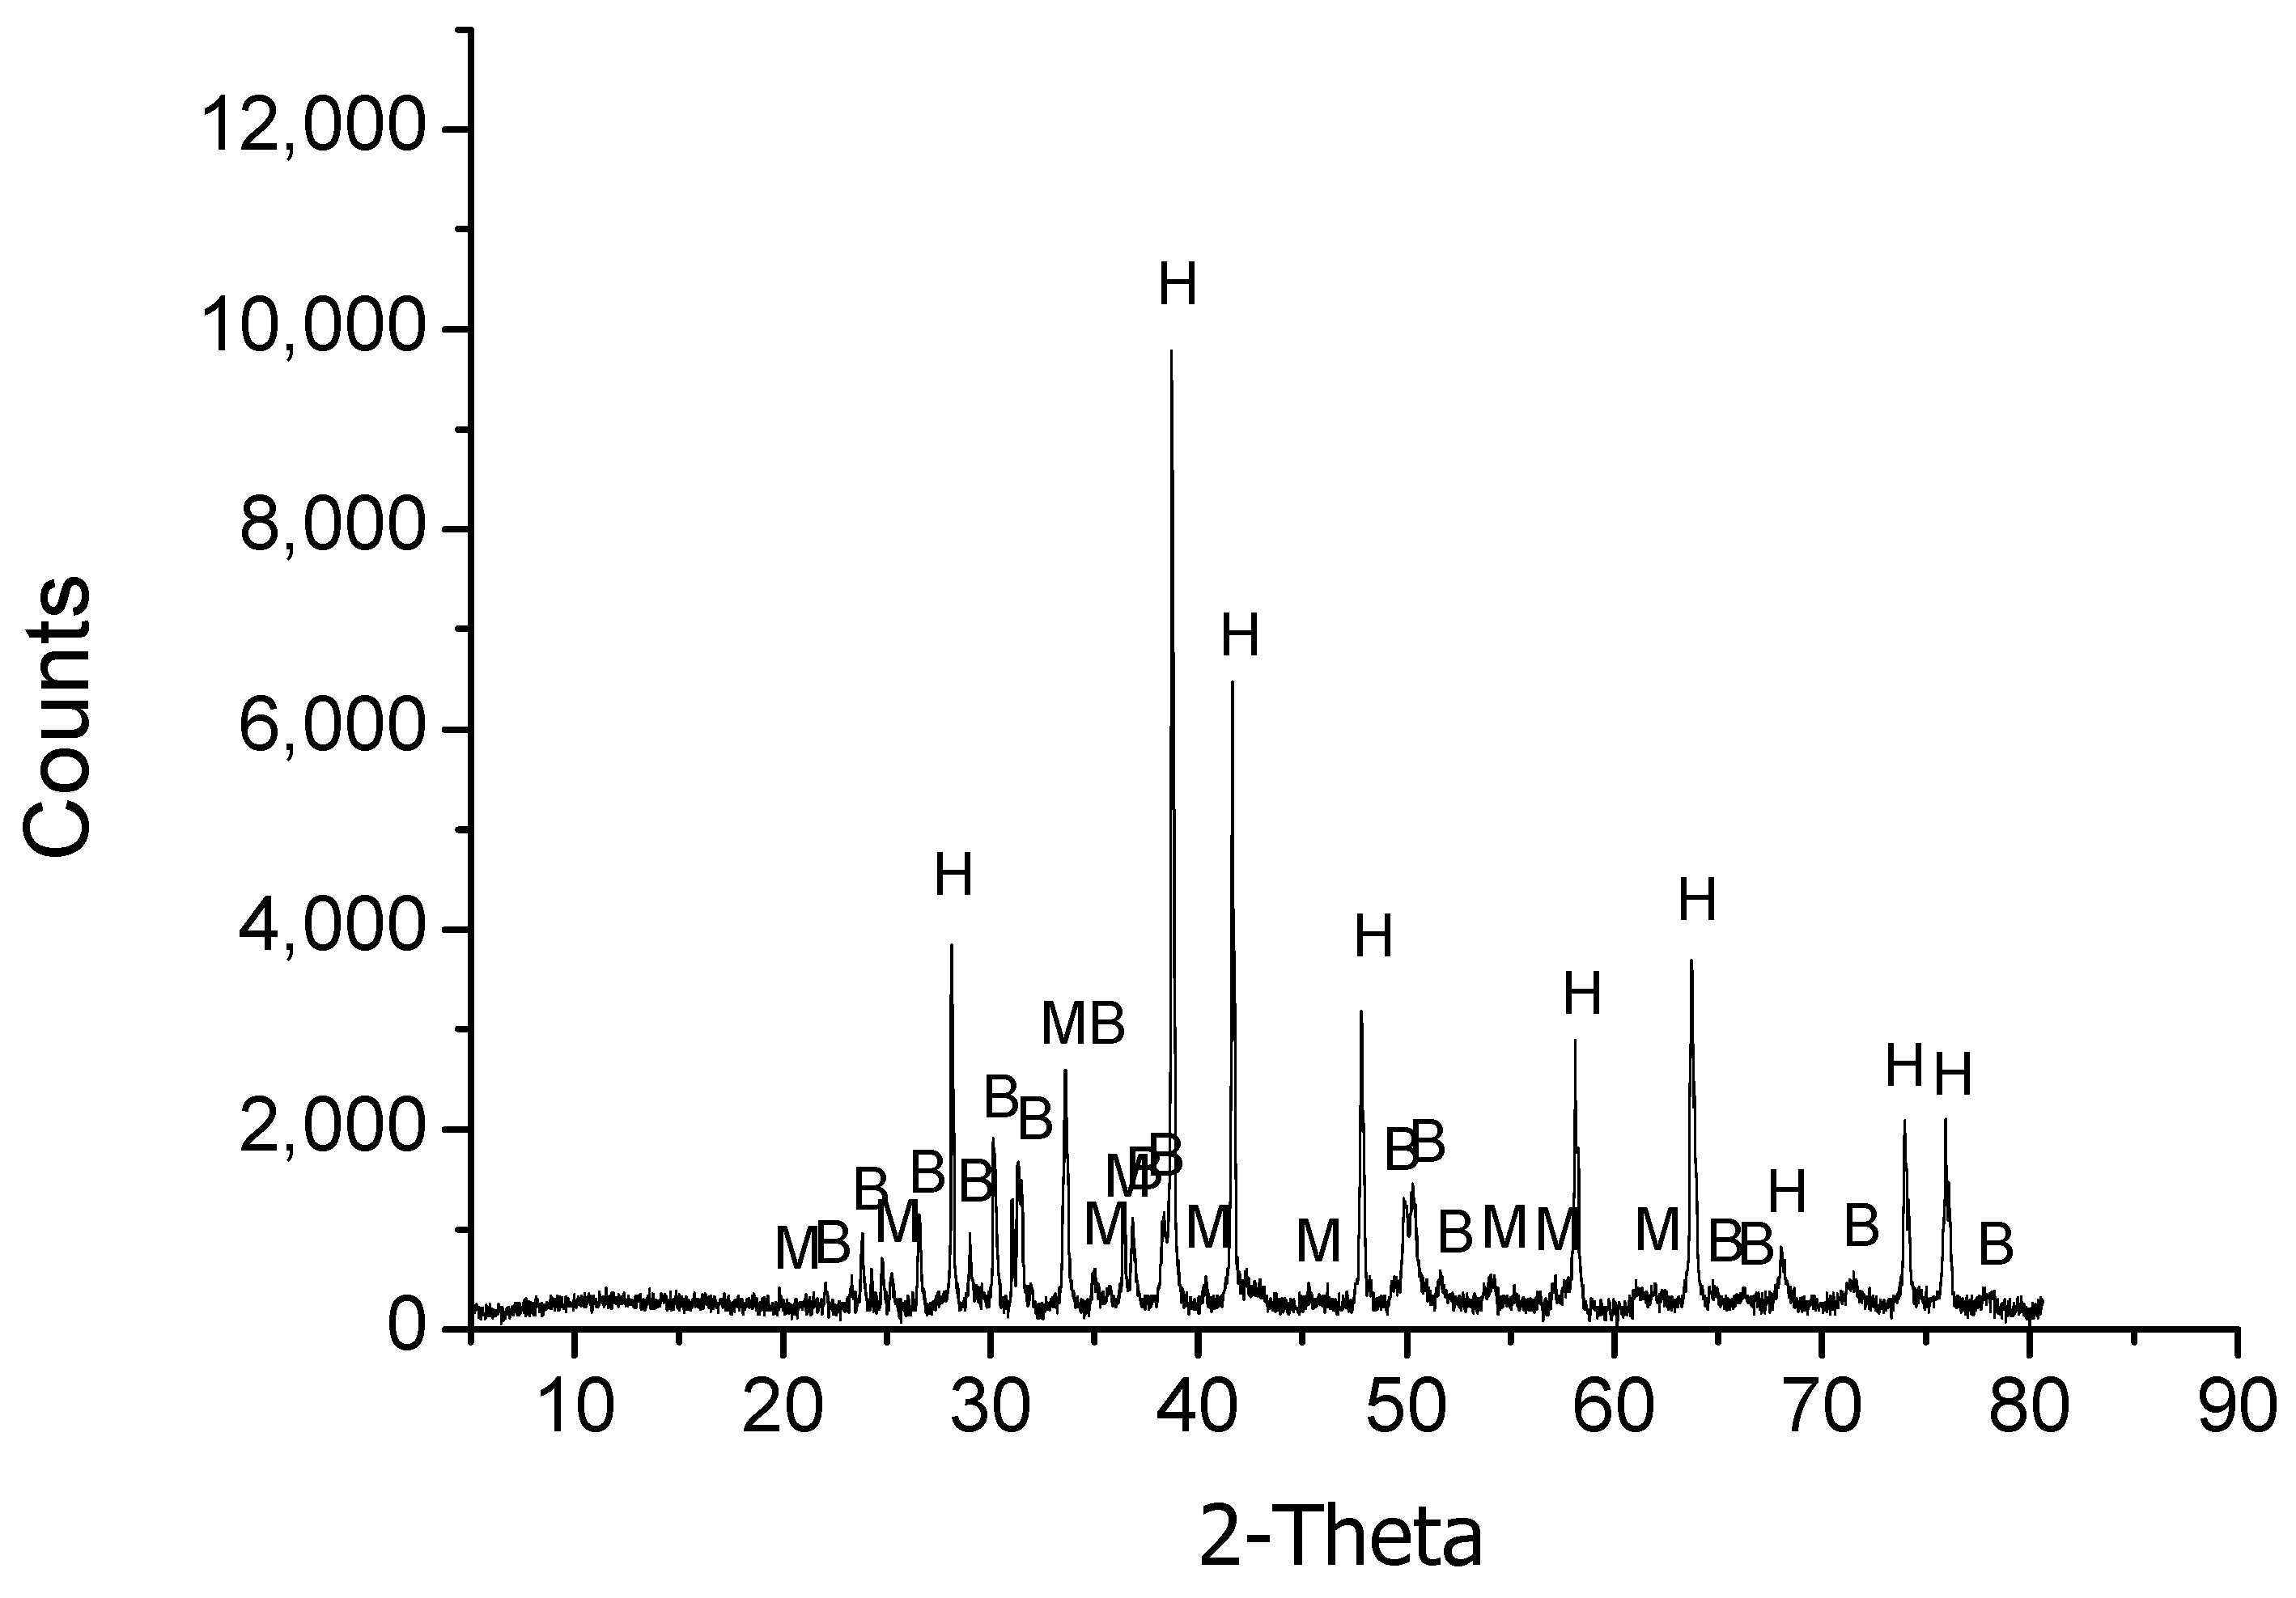
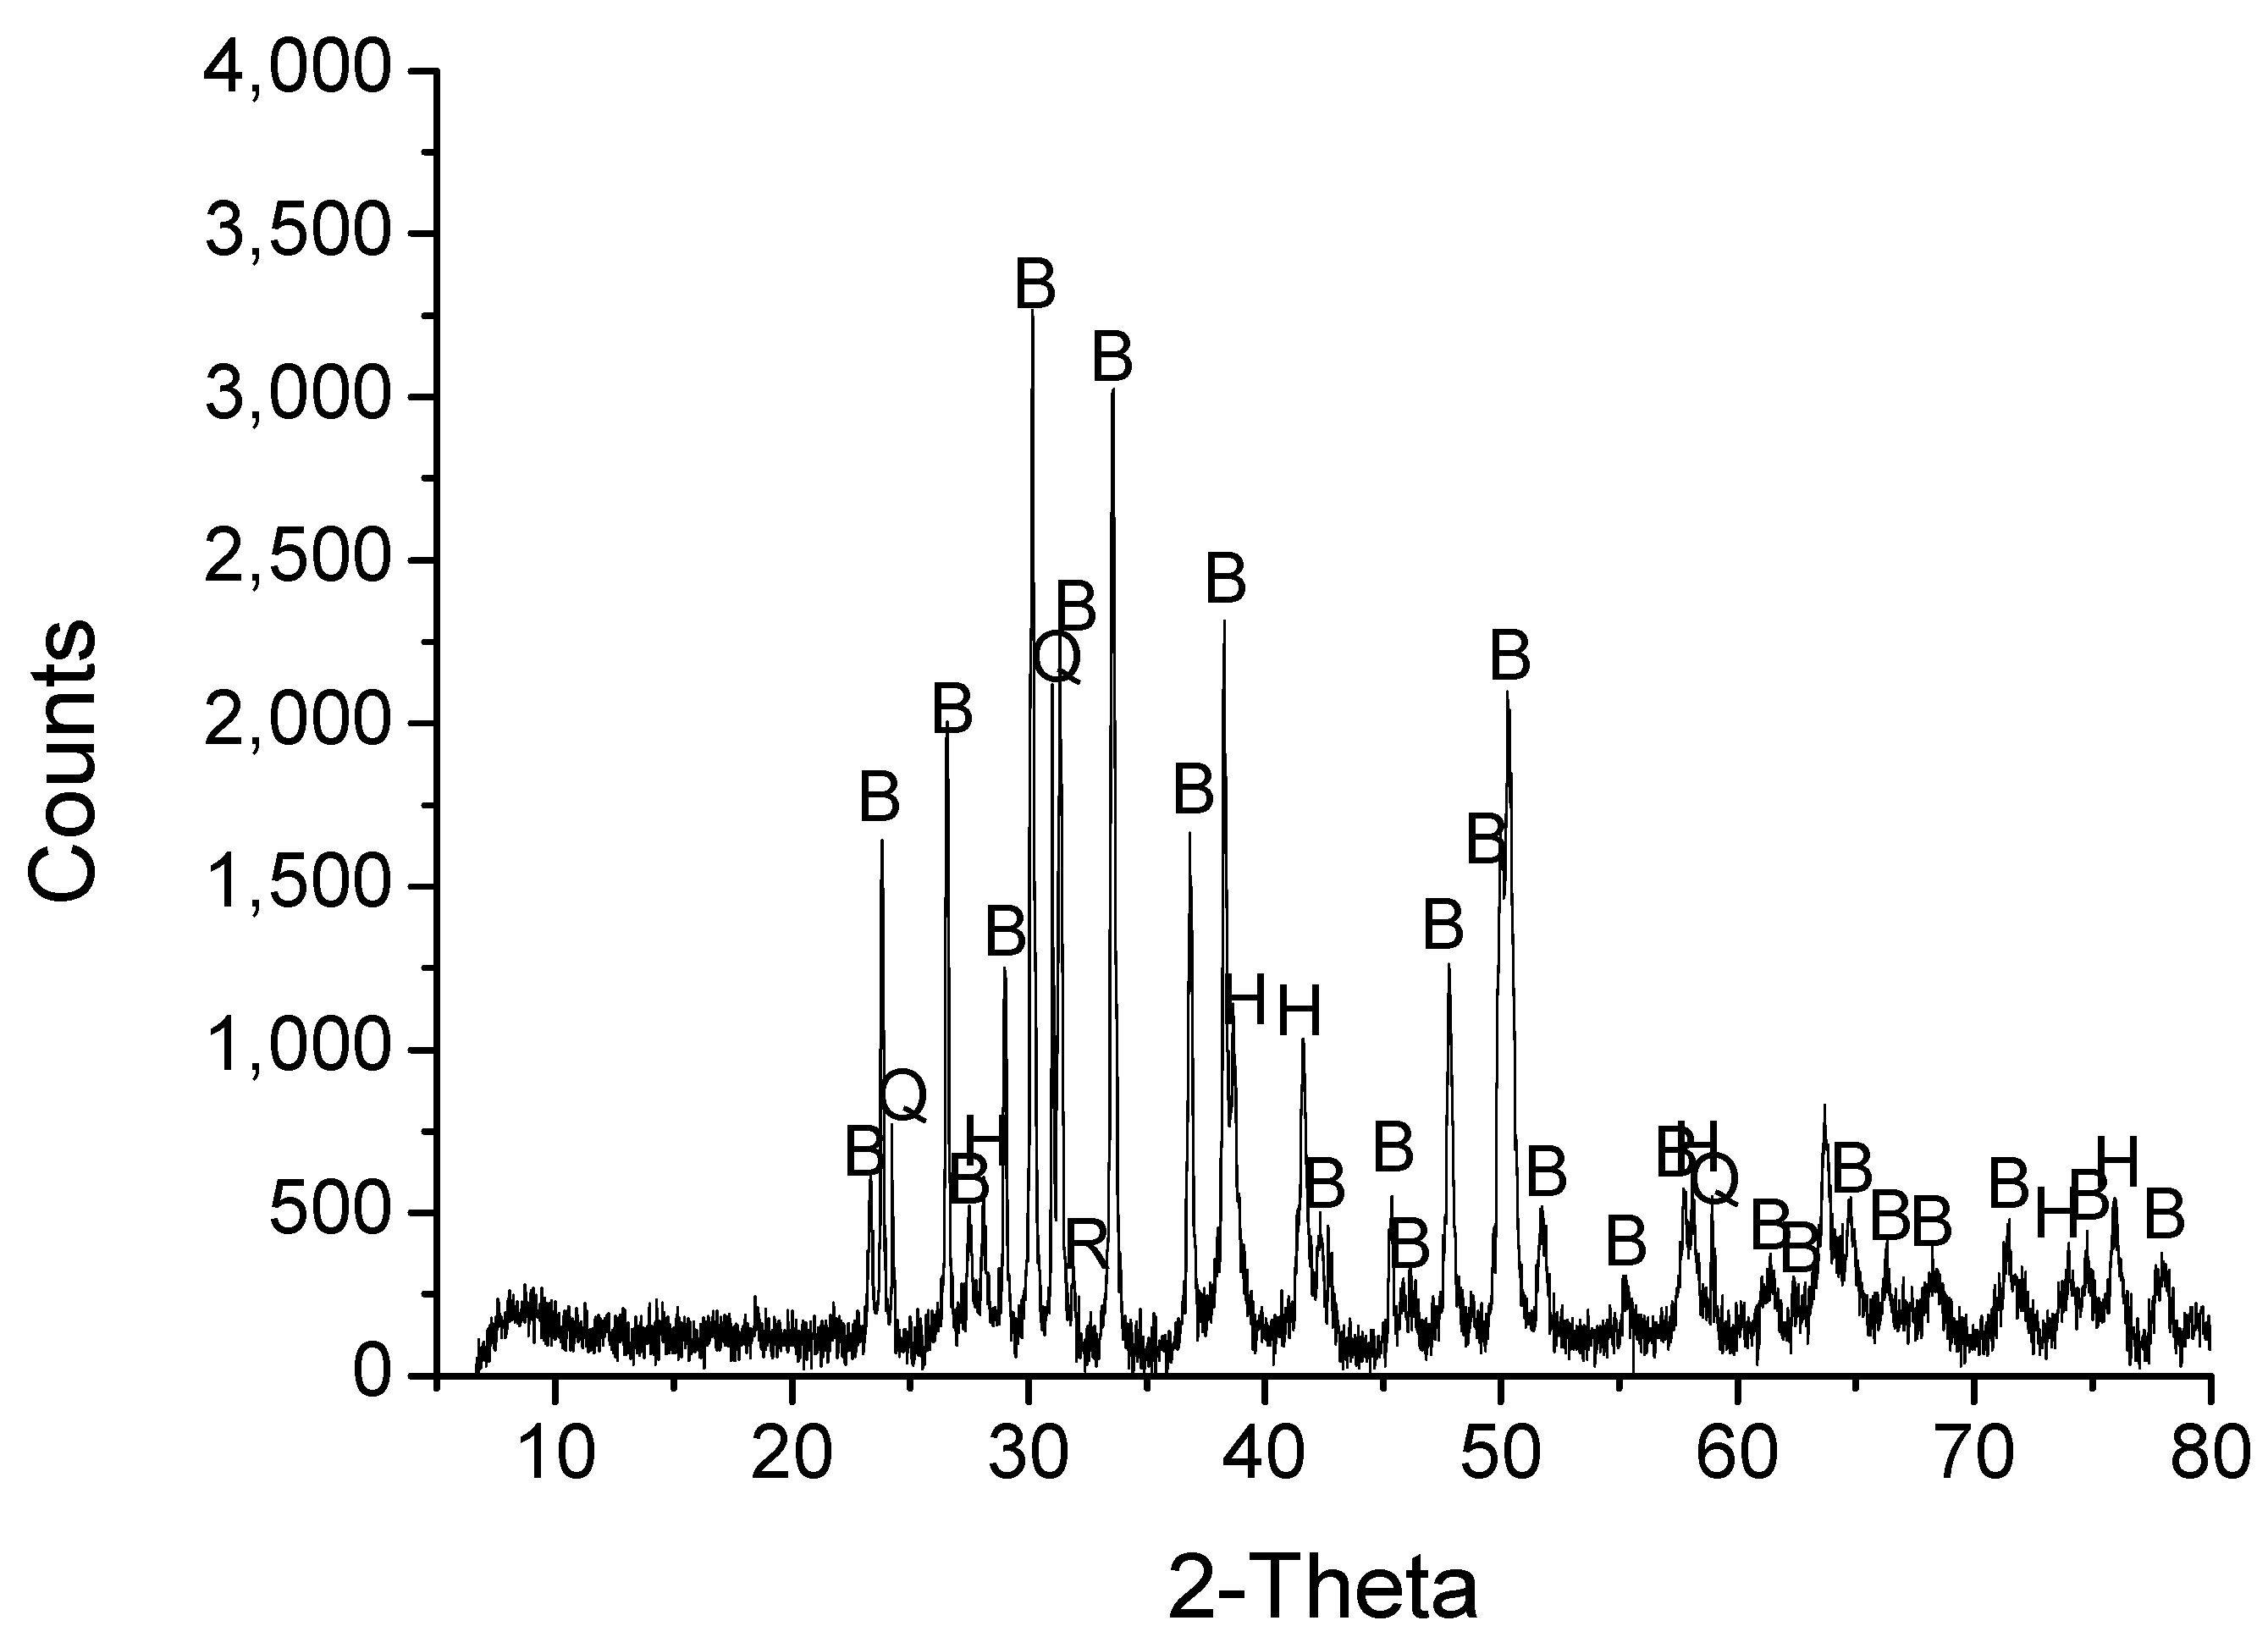
3.1. Sample Preparation and Characterization

The concentrate containing monazite was 80% below 75 μm and its mineral characterization identified goethite (FeOOH), hematite (Fe2O3) and magnetite (Fe3O4) as the Fe bearing minerals. The X-Ray diffraction result is shown in Figure 1. Monazite was identified as the main REE carrier. Barite, bariopyrochlore, quartz, rutile, hollandite and zircon were also detected. The X-Ray fluorescence analysis of the concentrate is shown in Table 4. Fe (57%) is the major constituent of the sample and 2.73% is the REE content.

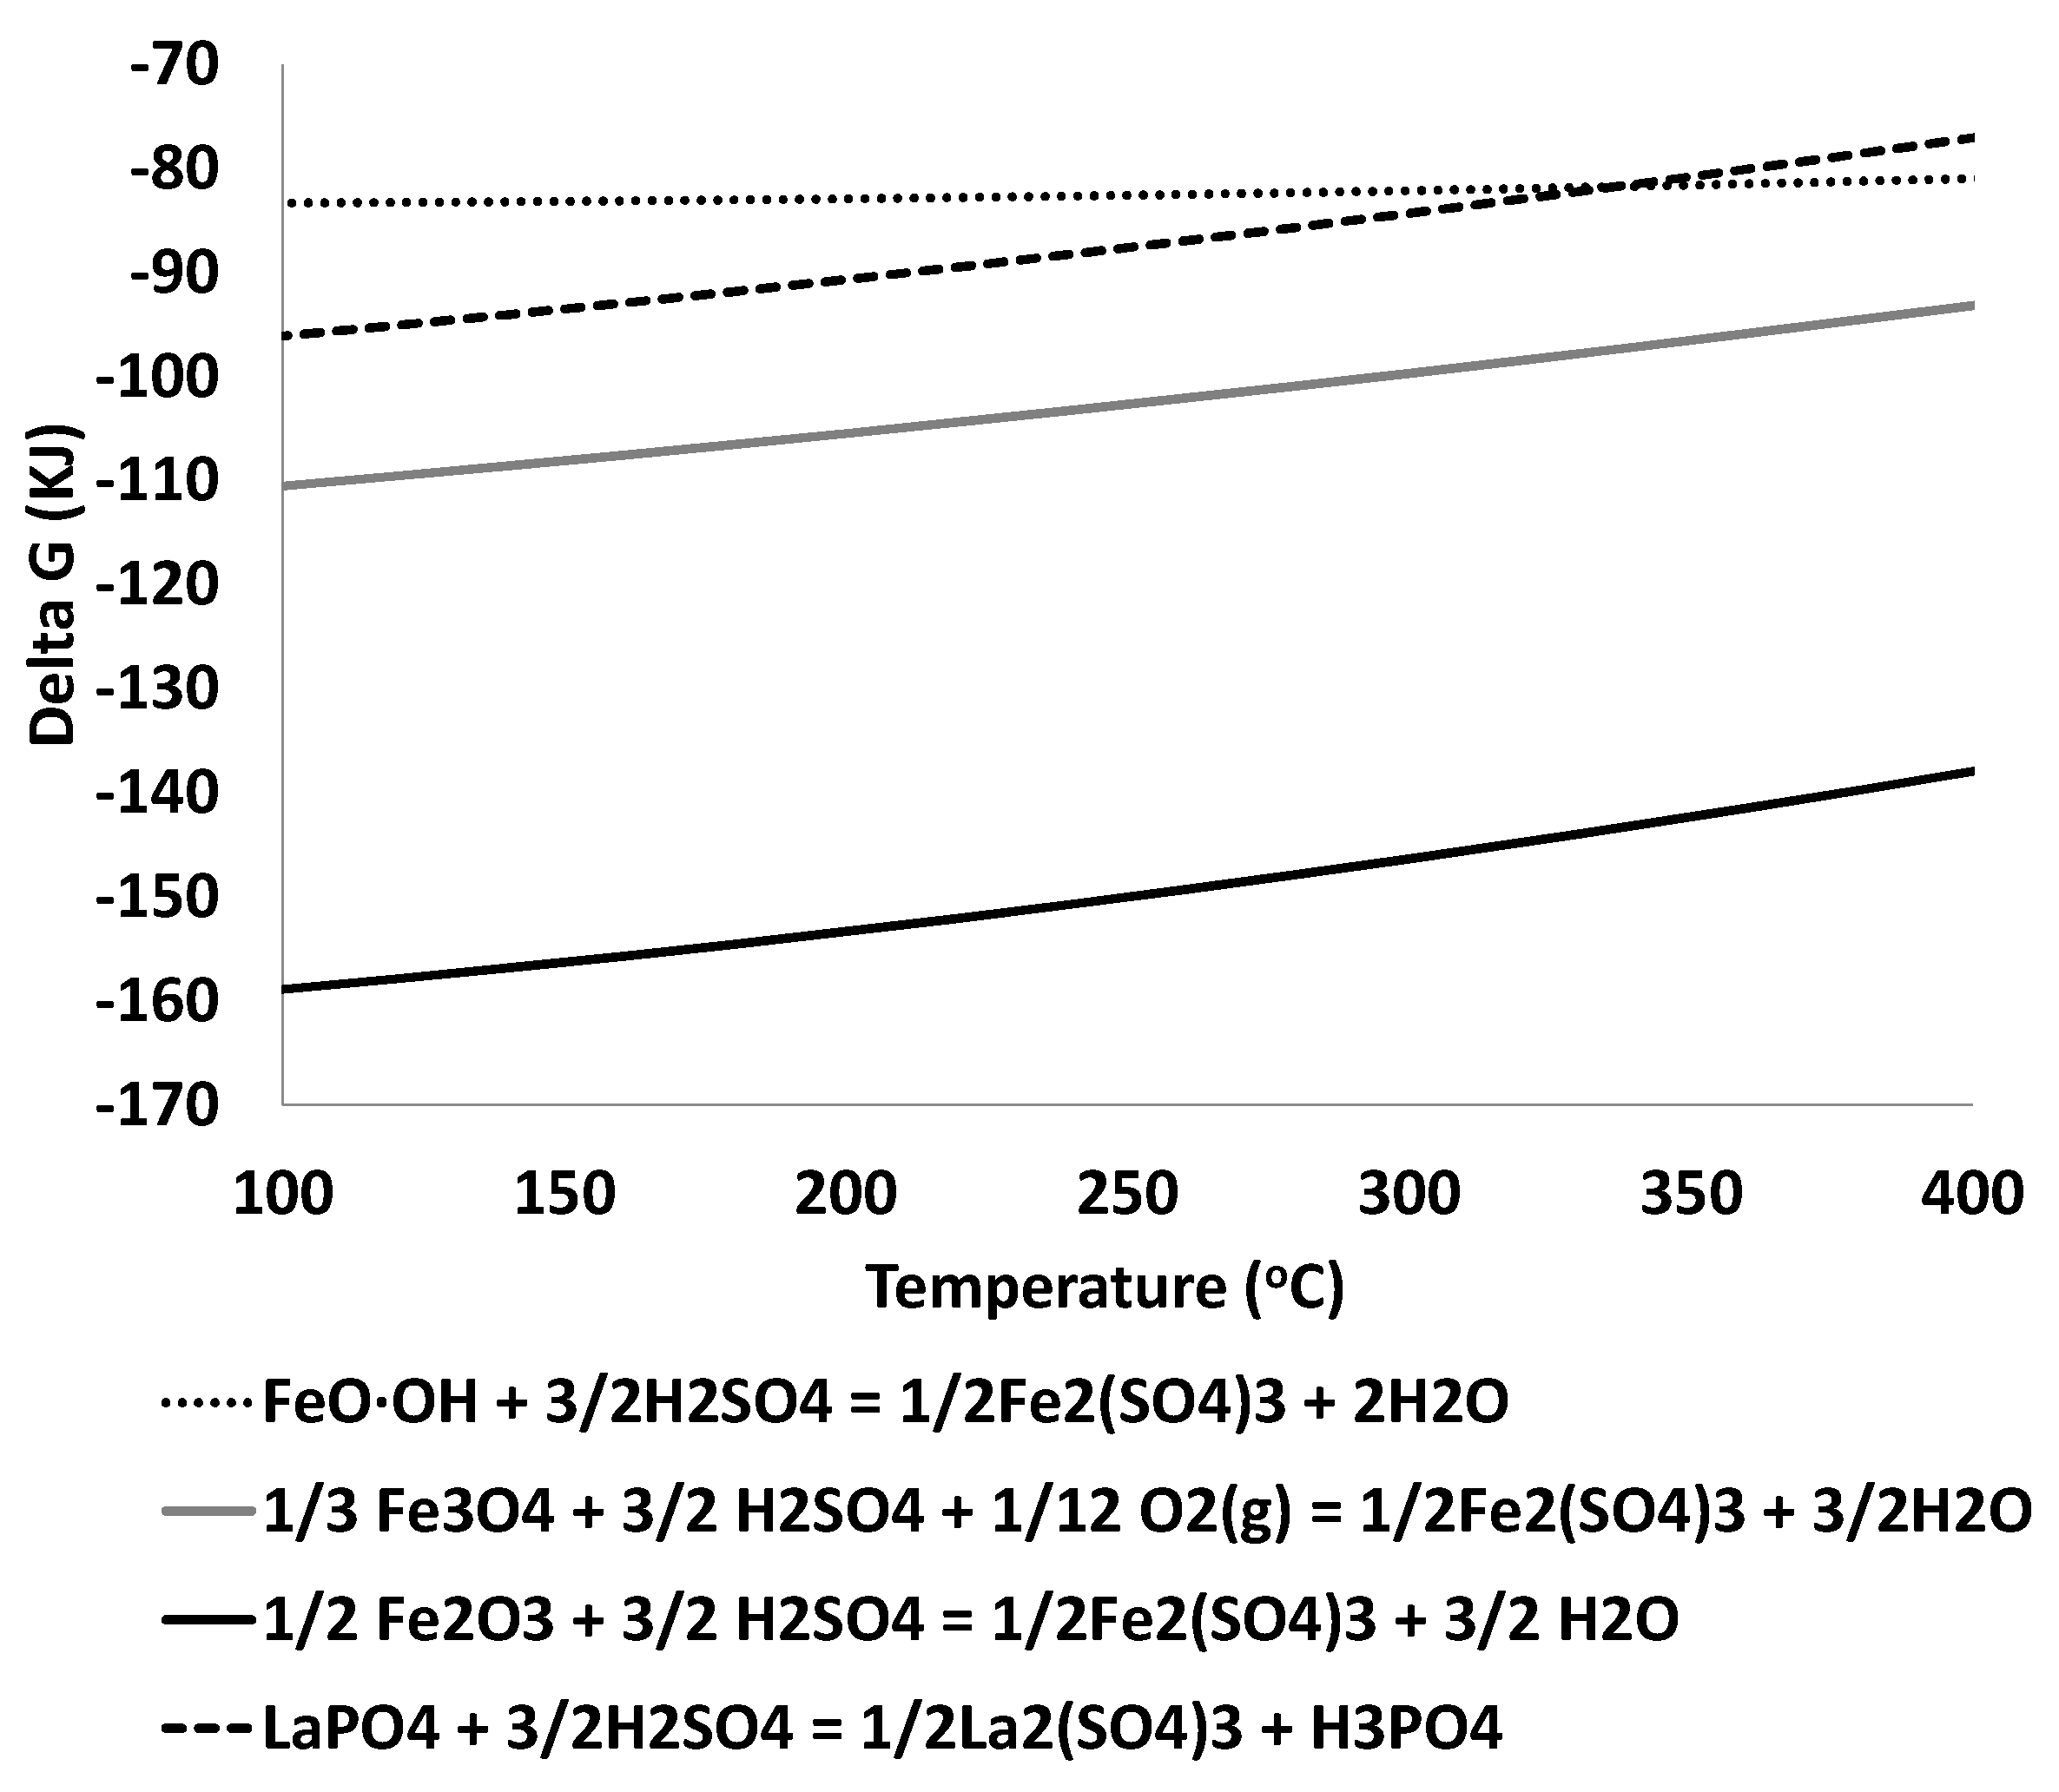
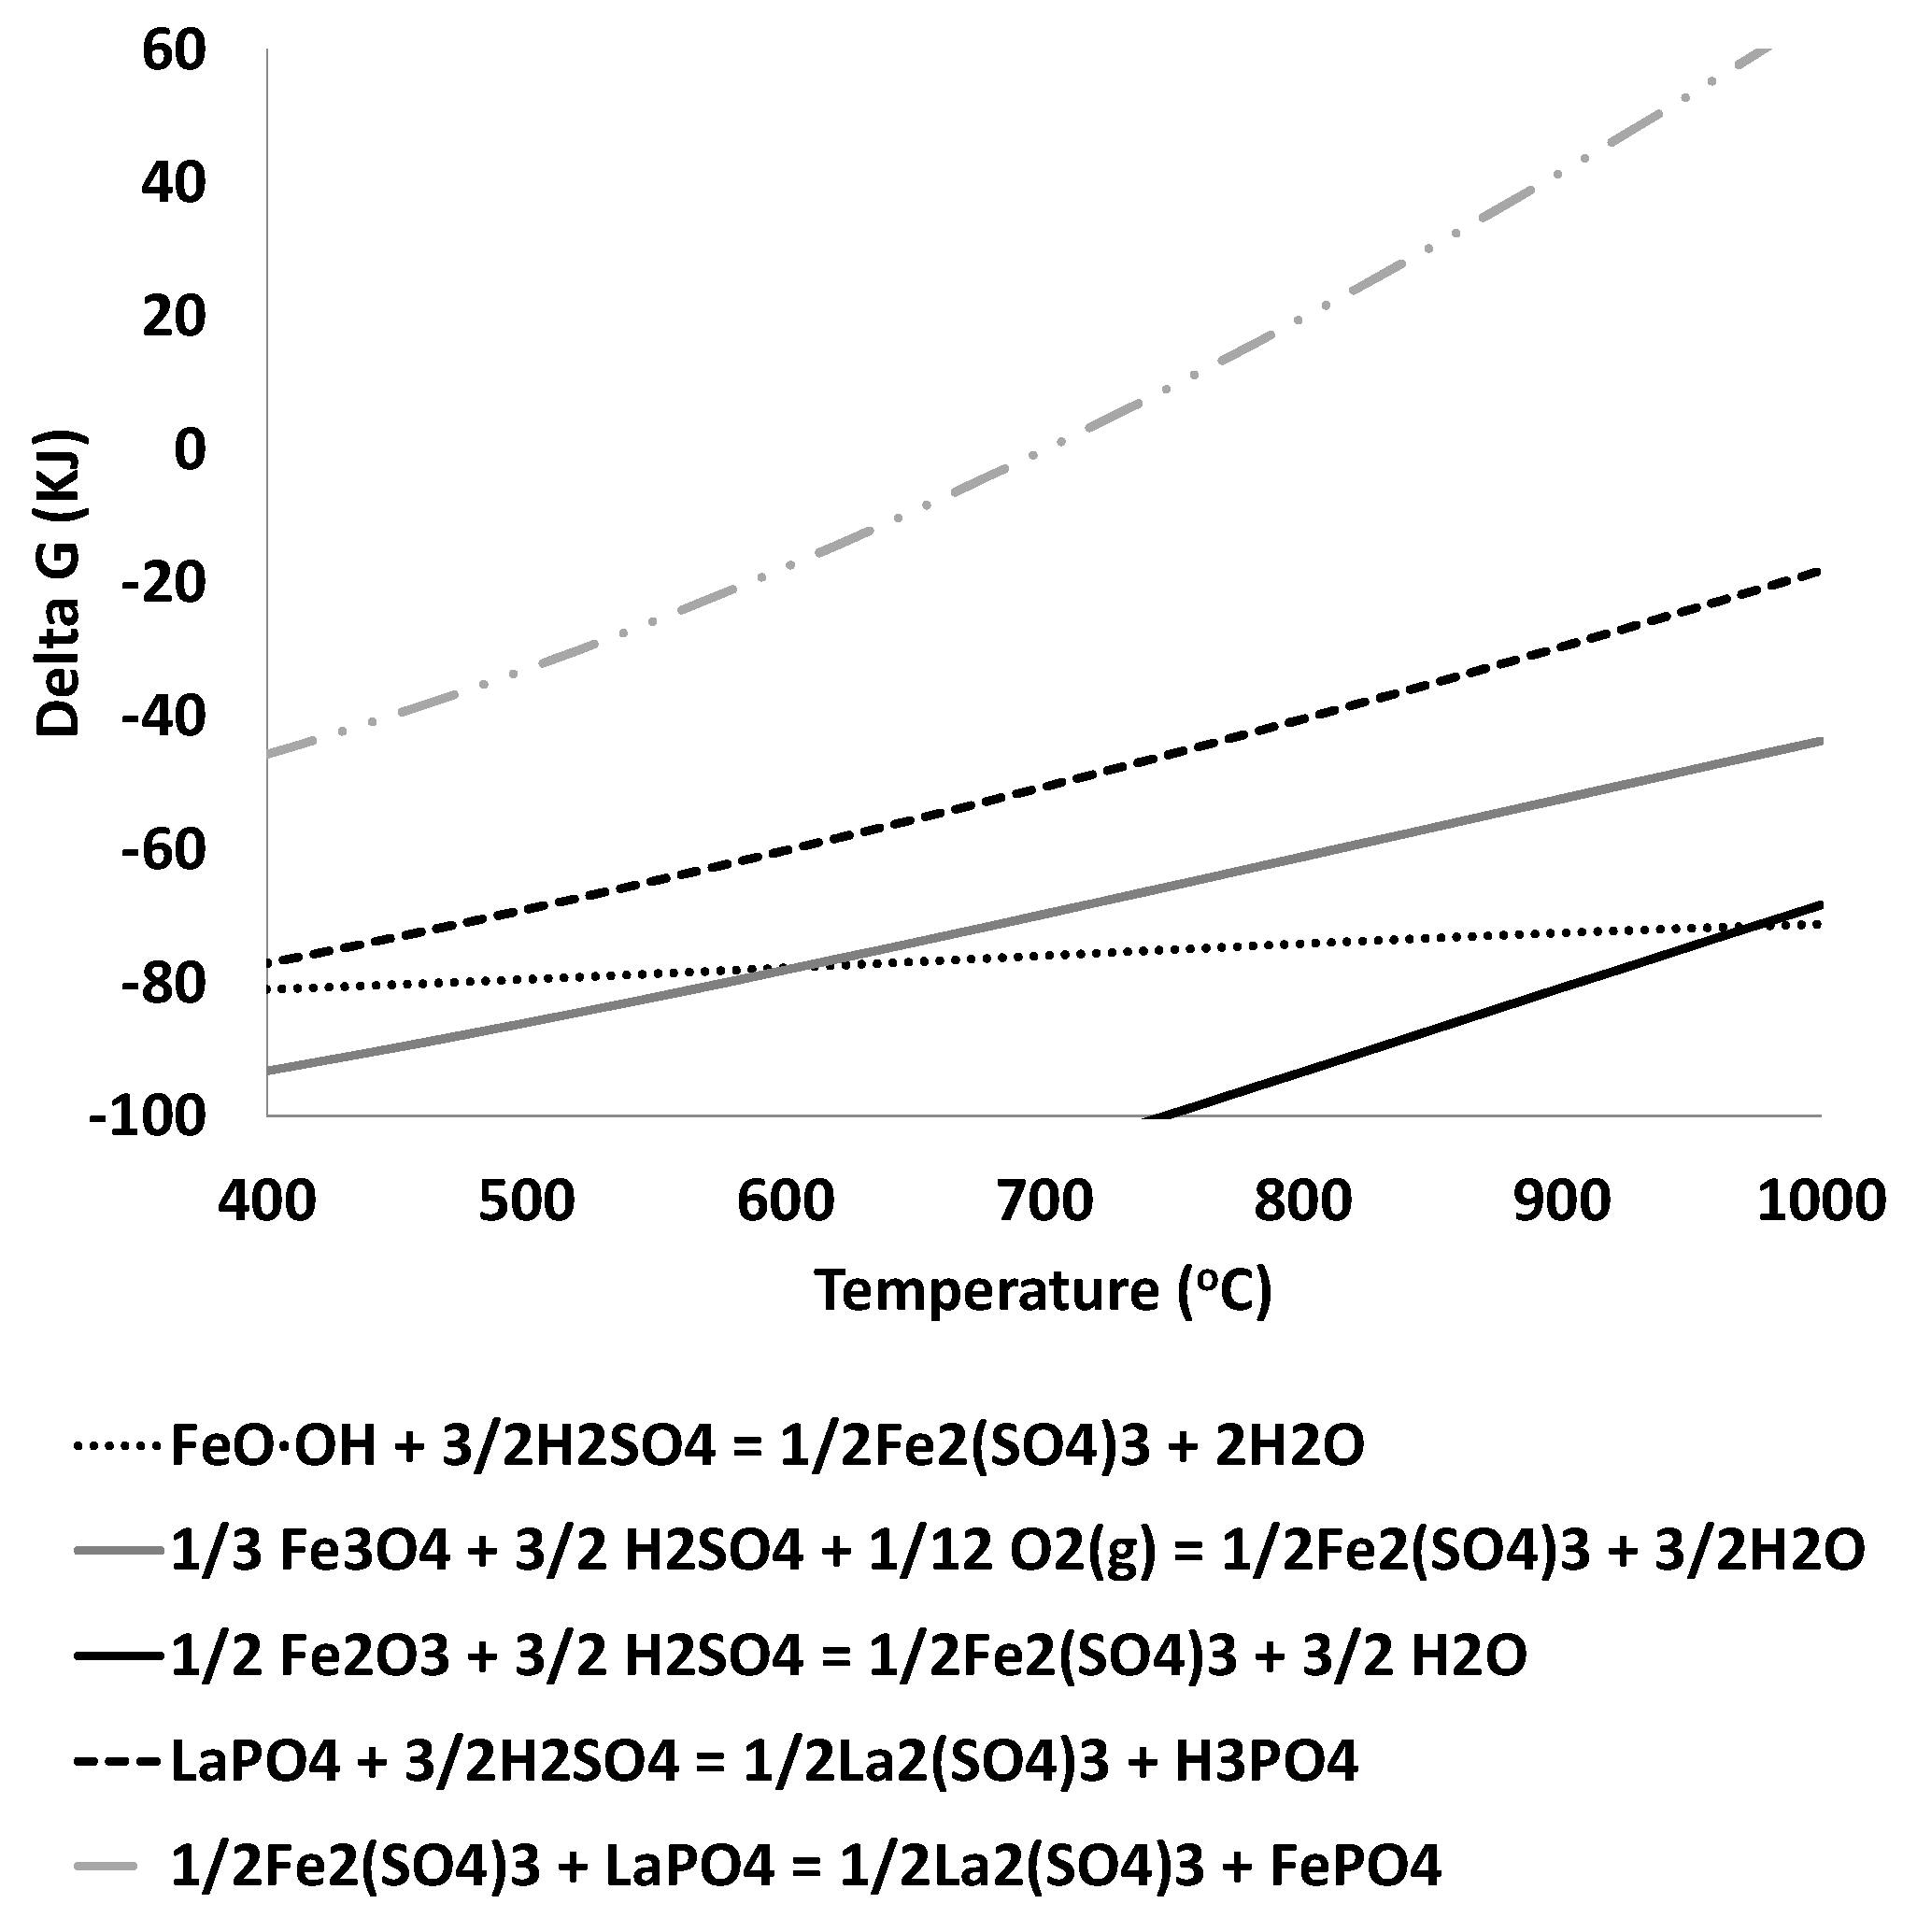
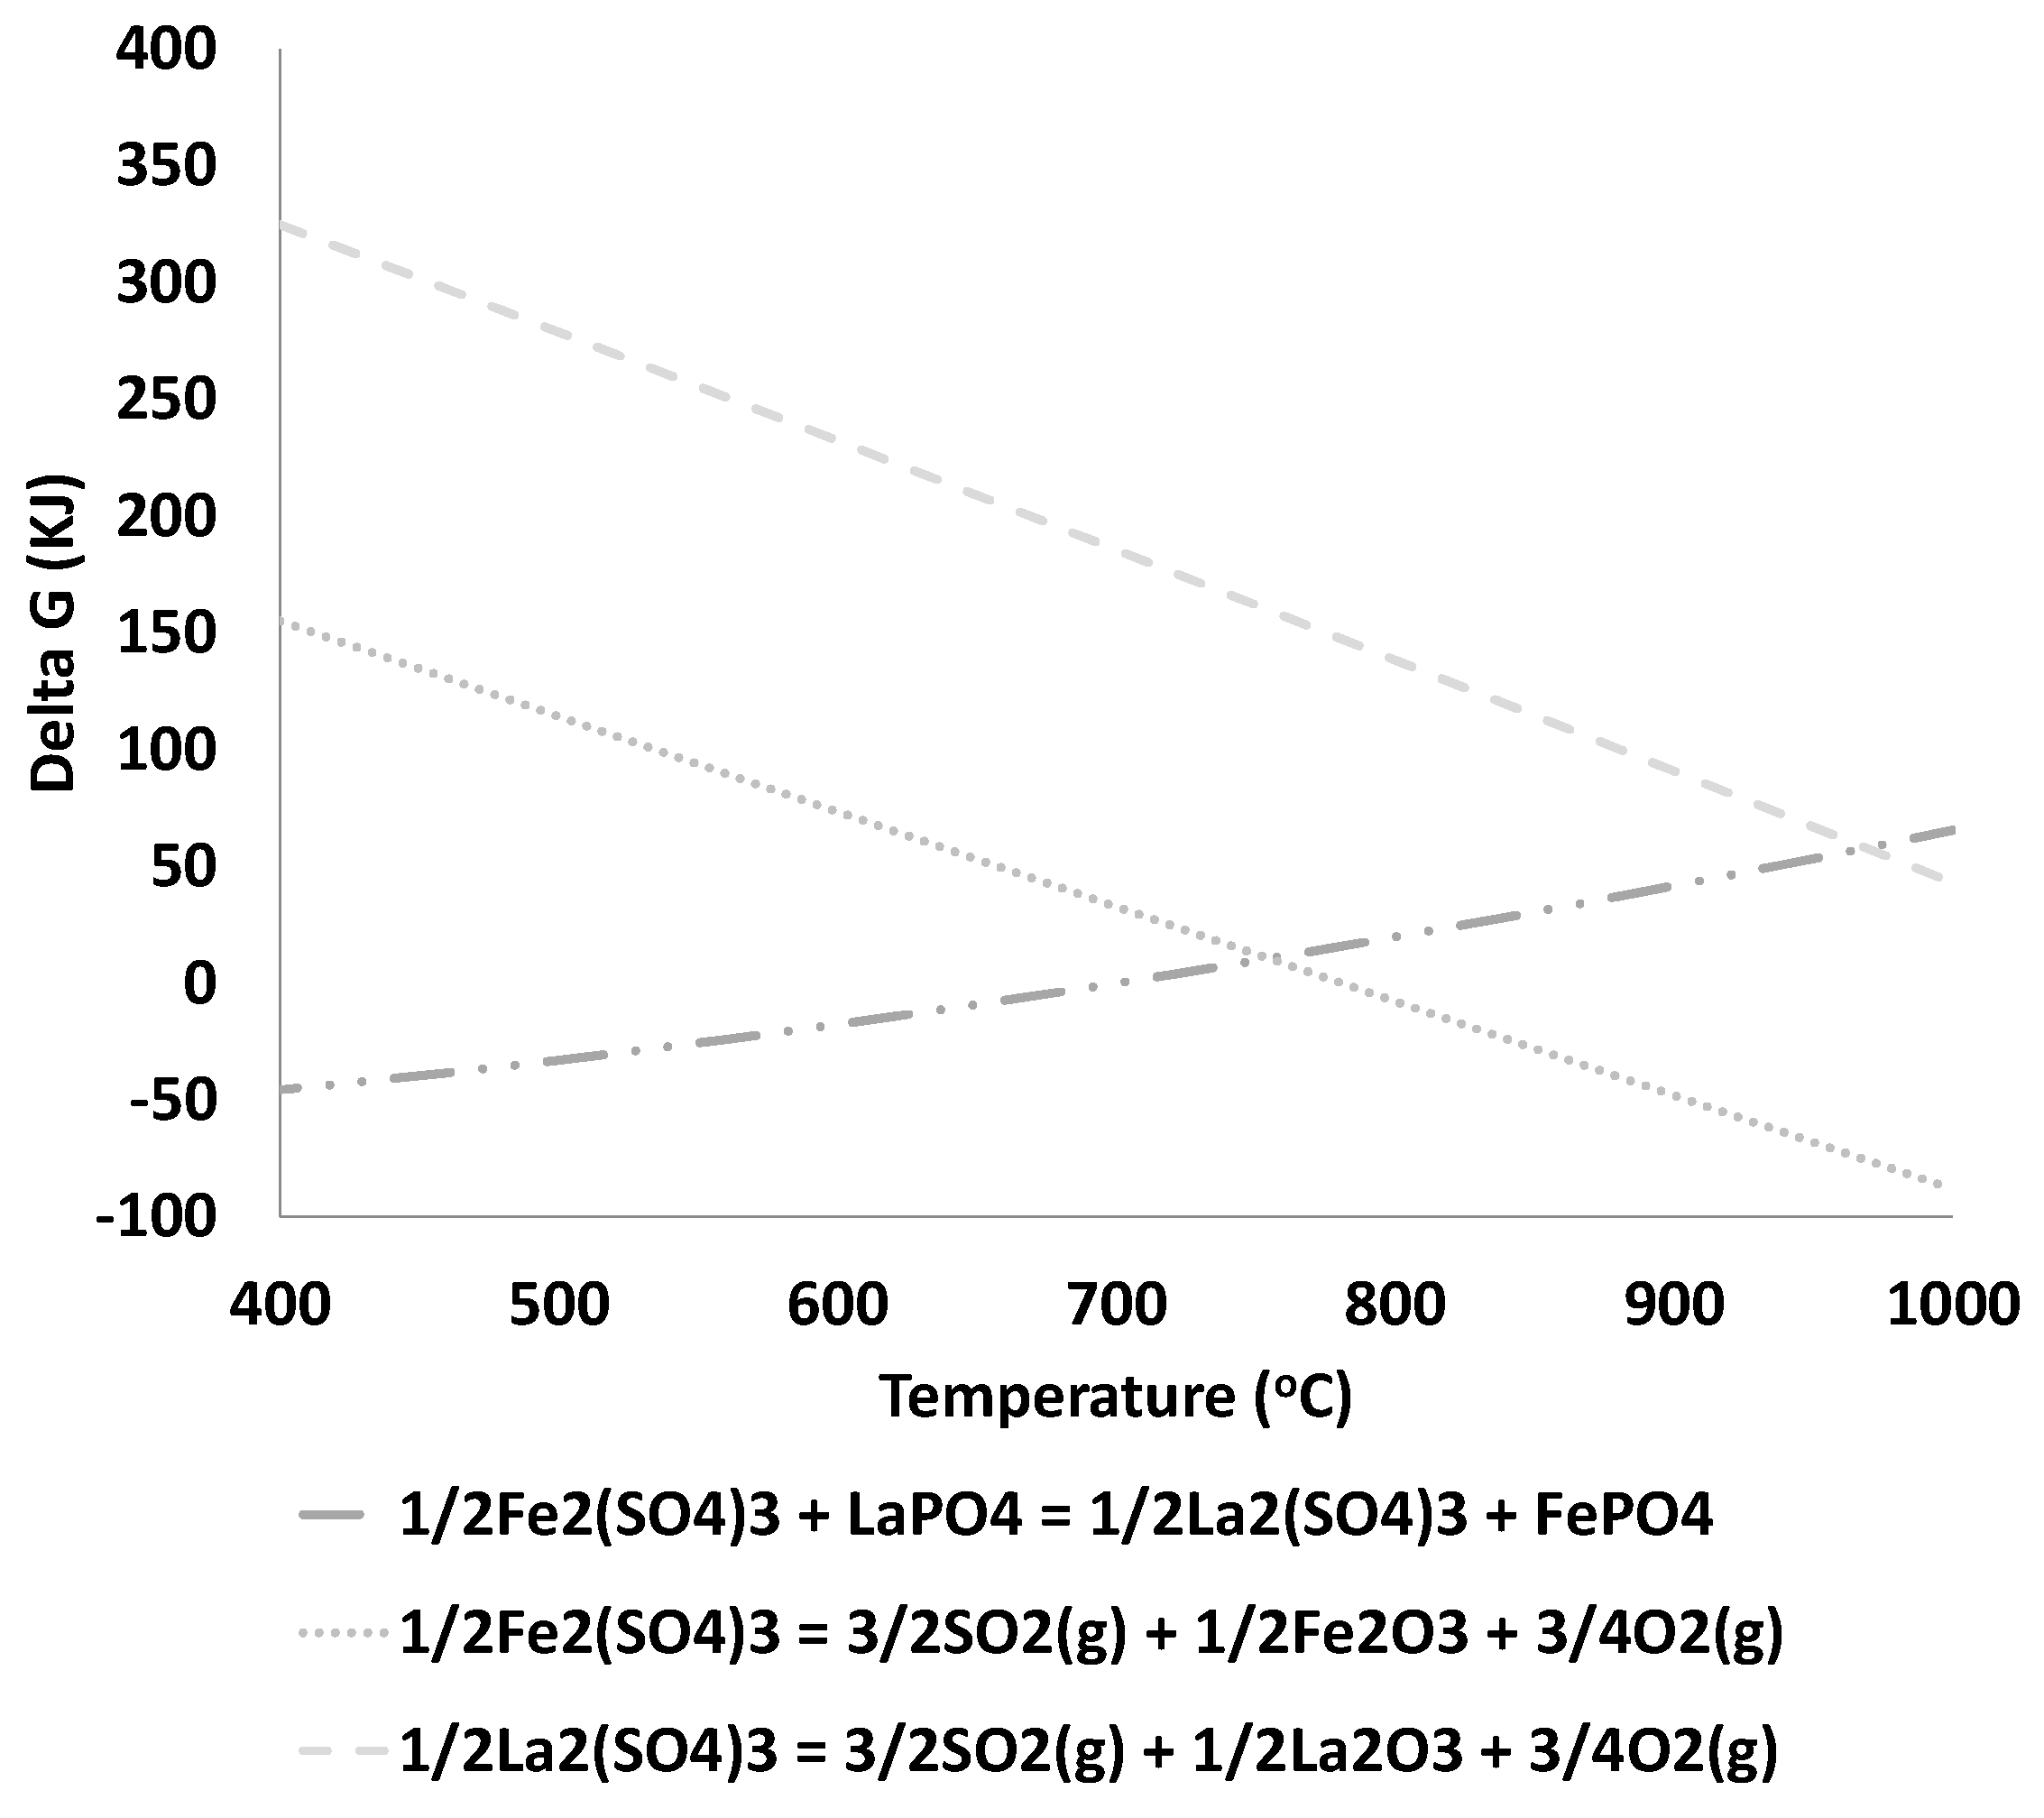
3.2. Thermodynamic Analysis

The reactions selected for the thermodynamic model were sulfatization of Fe and REE bearing phases. Goethite, hematite and magnetite were considered in this case as they are the Fe bearing mineral phases in the characterization (Equations (4)–(6)). Monazite, is the REE carrier and its reaction with sulfuric acid was represented in the model by the sulfatization of LaPO4 (lanthanum phosphate) as La is the most abundant REE in the concentrate (Equation (7)).
The values of free energy (ΔG) of the selected reactions were initially calculated in the temperature range from 0 °C to 400 °C and then, separately, from 400 °C to 1000 °C.
FeO∙OH + 3/2H2SO4 = 1/2Fe2(SO4)3 + 2H2O
1/2Fe2O3 + 3/2H2SO4 = 1/2Fe2(SO4)3 + 3/2H2O
1/3Fe3O4 + 3/2H2SO4 + 1/12O2(g) = 1/2Fe2(SO4)3 + 3/2H2O
LaPO4 + 3/2H2SO4 = 1/2La2(SO4)3 + H3PO4
Figure 2 shows the free energy (ΔG) of the reactions of Equations (4)–(7), from 100 °C to 400 °C.
All reactions in Figure 2 are spontaneous in the temperature range analyzed. The digestion of hematite (Fe2O3) by sulfuric acid (Equation (5)) is the most spontaneous and as the temperature increases, the spontaneities of all reactions decrease.
The stoichiometry of the reactions represented by Equations (4)–(7) show that the amount of acid required to react with 1 mol of Fe (Equations (4)–(6)) is the same as that which is necessary to react with 1 mol of lanthanum (Equation (7)). The reactions of acid with hematite (Fe2O3) and magnetite (Fe3O4) (Equations (5) and (6)) are more favorable than with LaPO4 (Equation (7)) for the temperature range studied. Conversely, the reaction of goethite (FeOOH) (Equation (4)) is less favorable than the reaction of LaPO4 up to 350 °C. The reaction of the sulfuric acid with LaPO4 rather than with goethite can be expected above this temperature. Therefore, one can preliminarily predict that the reaction of goethite with sulfuric acid, may be minimized by keeping the temperature below 350 °C and by controlling the acid content in the roasting process. Regardless the processing temperature in the range studied, sulfuric acid will react preferentially with hematite and magnetite rather than with lanthanum phosphate and Fe will end up in the solution in the aqueous leaching that follows the roasting.
Interesting results of Fe control in the acid roasting can also be obtained at high temperature (nearly 700 °C) in the hydrometallurgical processing of rare earth phosphates [29]. The authors report that the amount of acid and the temperature of the roasting can be adjusted carefully so that Fe minerals present in the ore are converted to sulfate. The reaction products composed of Fe sulfates and unreacted monazite (LaPO4) react according to the reaction represented by Equation (8).
1/2Fe2(SO4)3 + LaPO4 = 1/2La2(SO4)3 + FePO4
The reaction of Equation (8) was then added to the set of reactions of the thermodynamic model proposed in this work and plotted in Figure 3, which shows the temperature versus ΔG values for the reactions of Equations (4)–(8) in the temperature range of 400 °C to 1000 °C.
Figure 3 indicates that the use of a controlled amount of sulfuric acid would initially favor the sulfatization of Fe minerals according to the reactions of Equations (4)–(6) which are thermodynamically more favorable than the sulfatization of the LaPO4 (Equation (7)). The Fe2(SO4)3 formed would then react with the LaPO4 according to the reaction of Equation (8) and it will be converted to Fe phosphate and will remain in the solid residue of the aqueous leaching that follows the acid roasting.
Other possible reactions involving LaPO4 and Fe compounds in the acid roasting are the decomposition of sulfates that were previously formed, as represented by the reactions of Equations (9) and (10).
1/2Fe2(SO4)3 = 3/2SO2(g) + 1/2Fe2O3+3/4O2(g)
1/2La2(SO4)3 = 3/2SO2(g) + 1/2La2O3+3/4O2(g)
Figure 4 shows the plot of ΔG versus temperature for the reactions of Equations (8)–(10) in the range of 400 °C to 1000 °C. The figure shows that the Fe sulfate decomposition according to Equation (9) is only favorable at temperatures above 780 °C and that the decomposition of the lanthanum sulfate (Equation (10)) is not favorable in the temperature range considered.
The laboratory experiments with the ore of Araxá were then designed taking into account the conclusions from the analysis of Figure 2, Figure 3 and Figure 4 as follows:
  • Iron sulfate formation is expected for roasting temperature below 700 °C.
  • Iron sulfate decomposition is expected for a temperature above 780 °C.
  • The amount of acid used in the roasting should be just the necessary to obtain the iron sulfate to react with the monazite of the concentrate.
  • The use of an excess of acid in the roasting step leads to iron solubilization in the aqueous leaching.
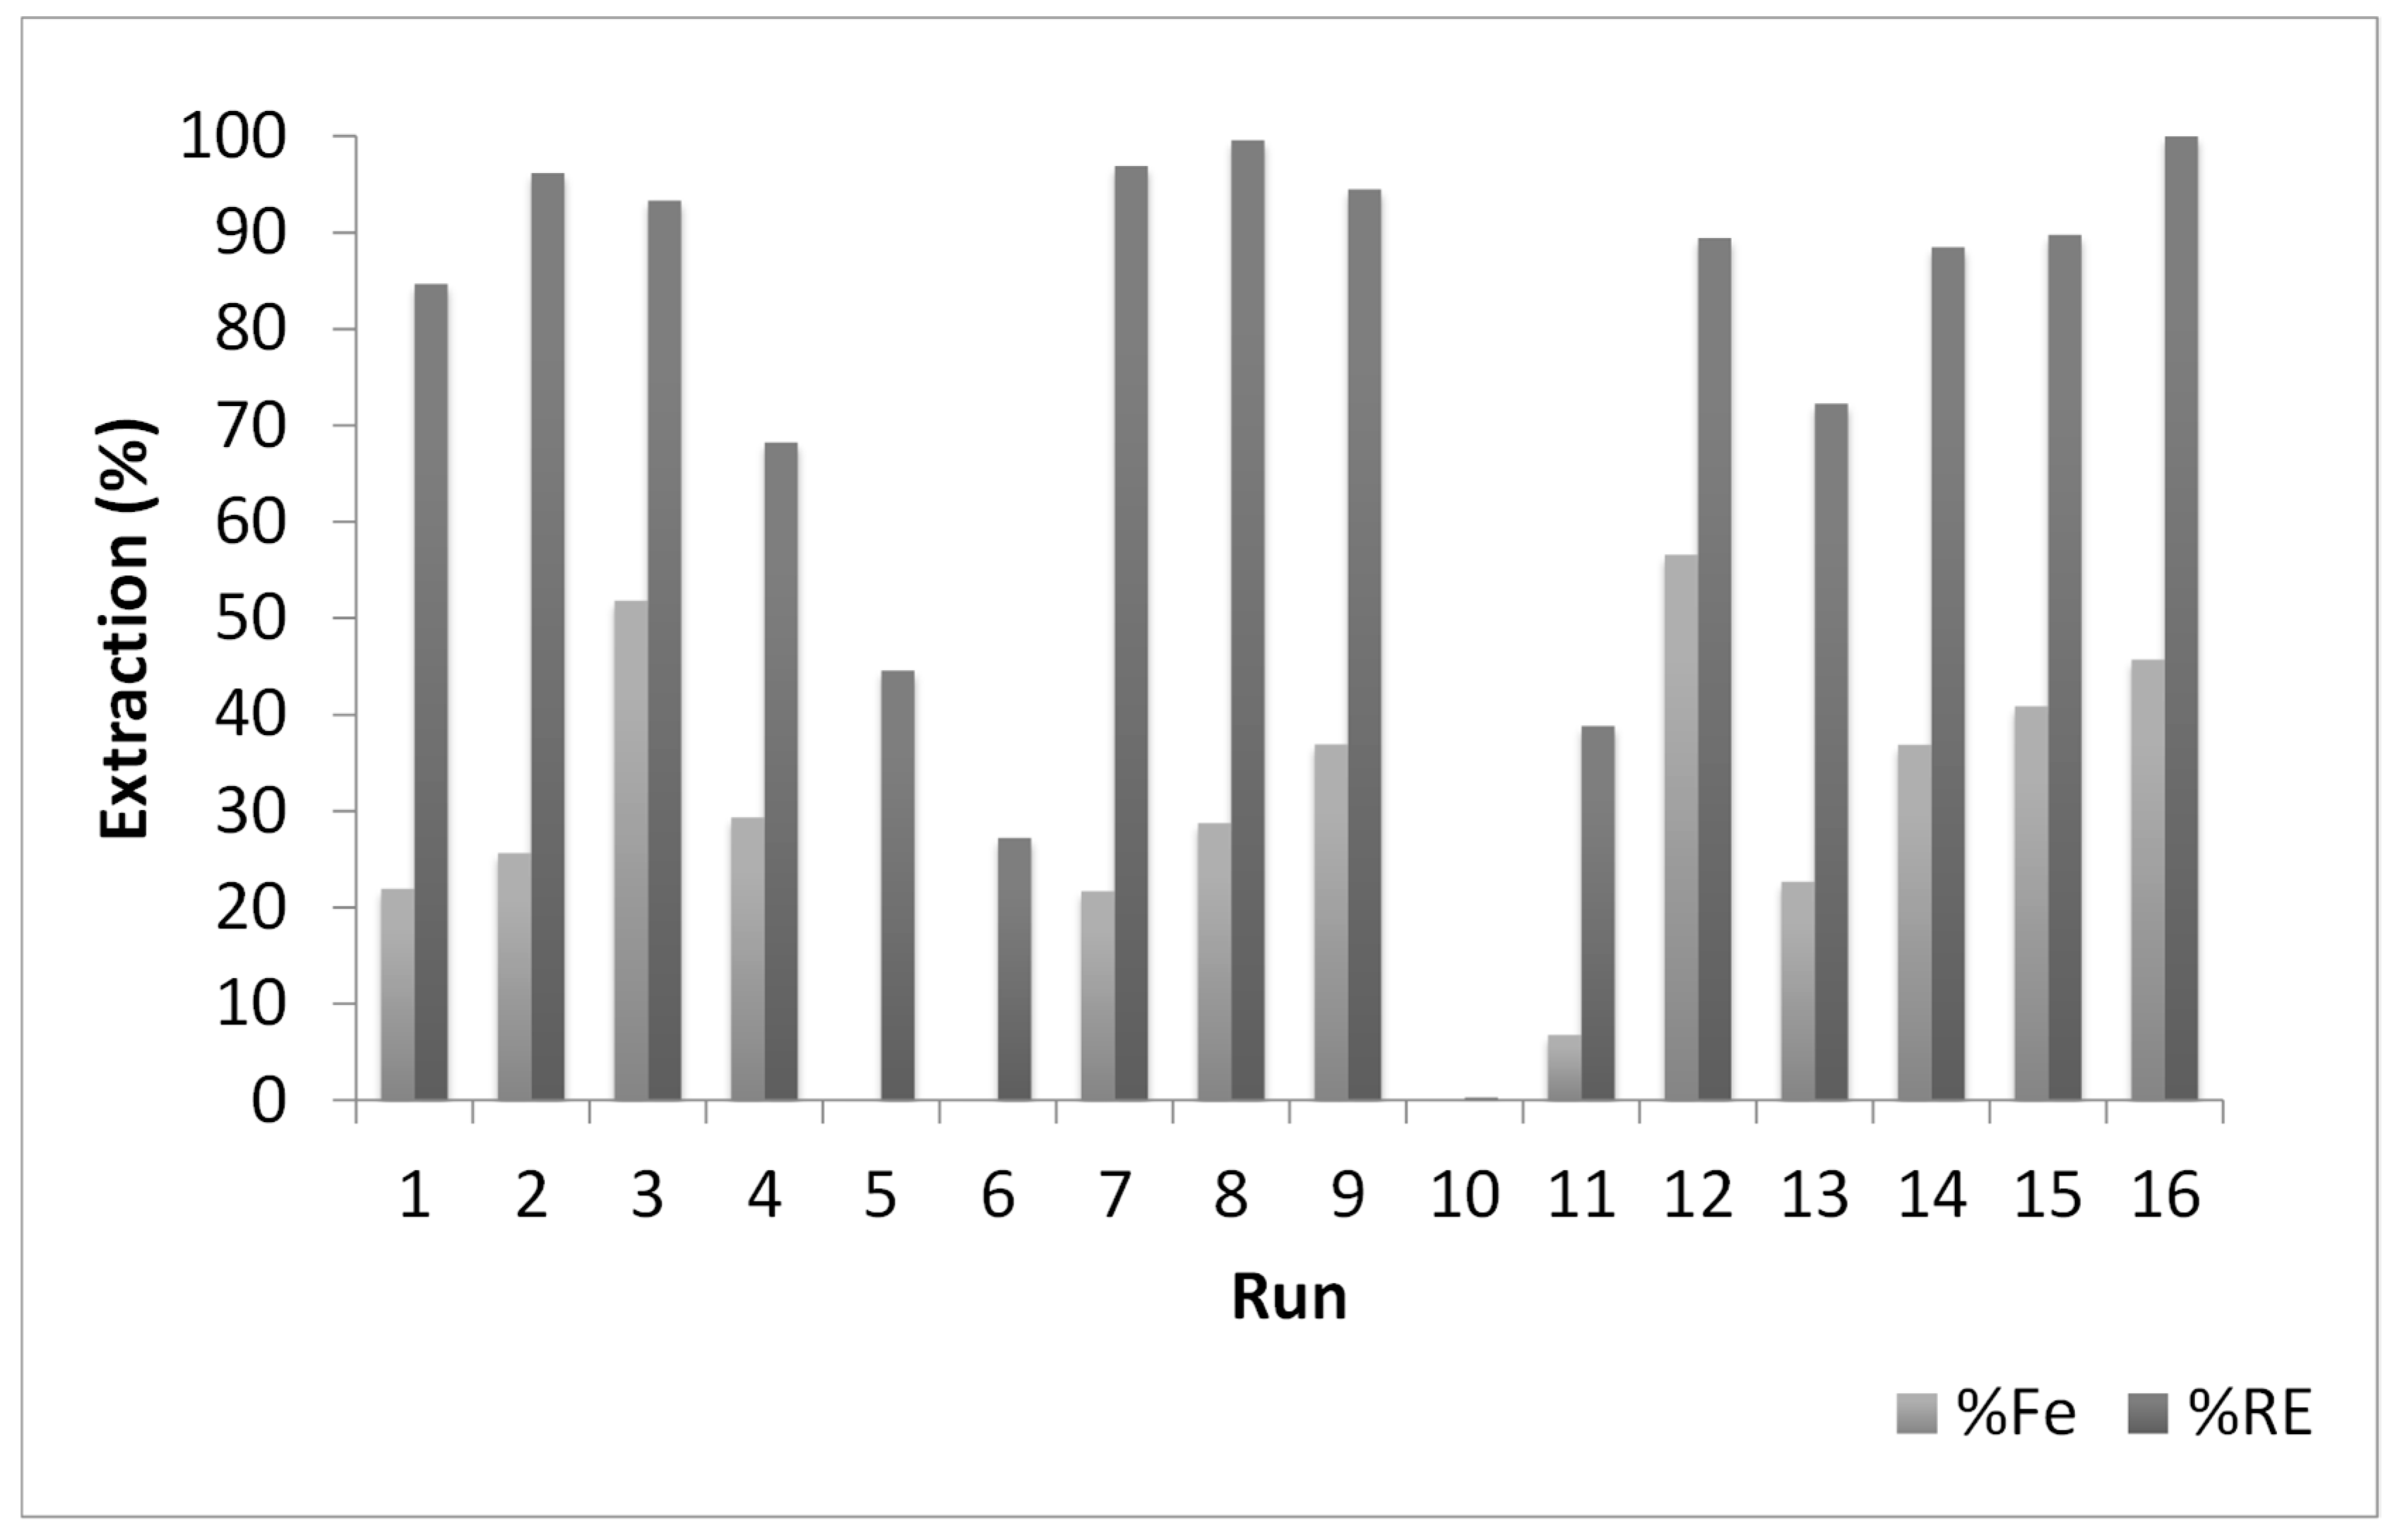
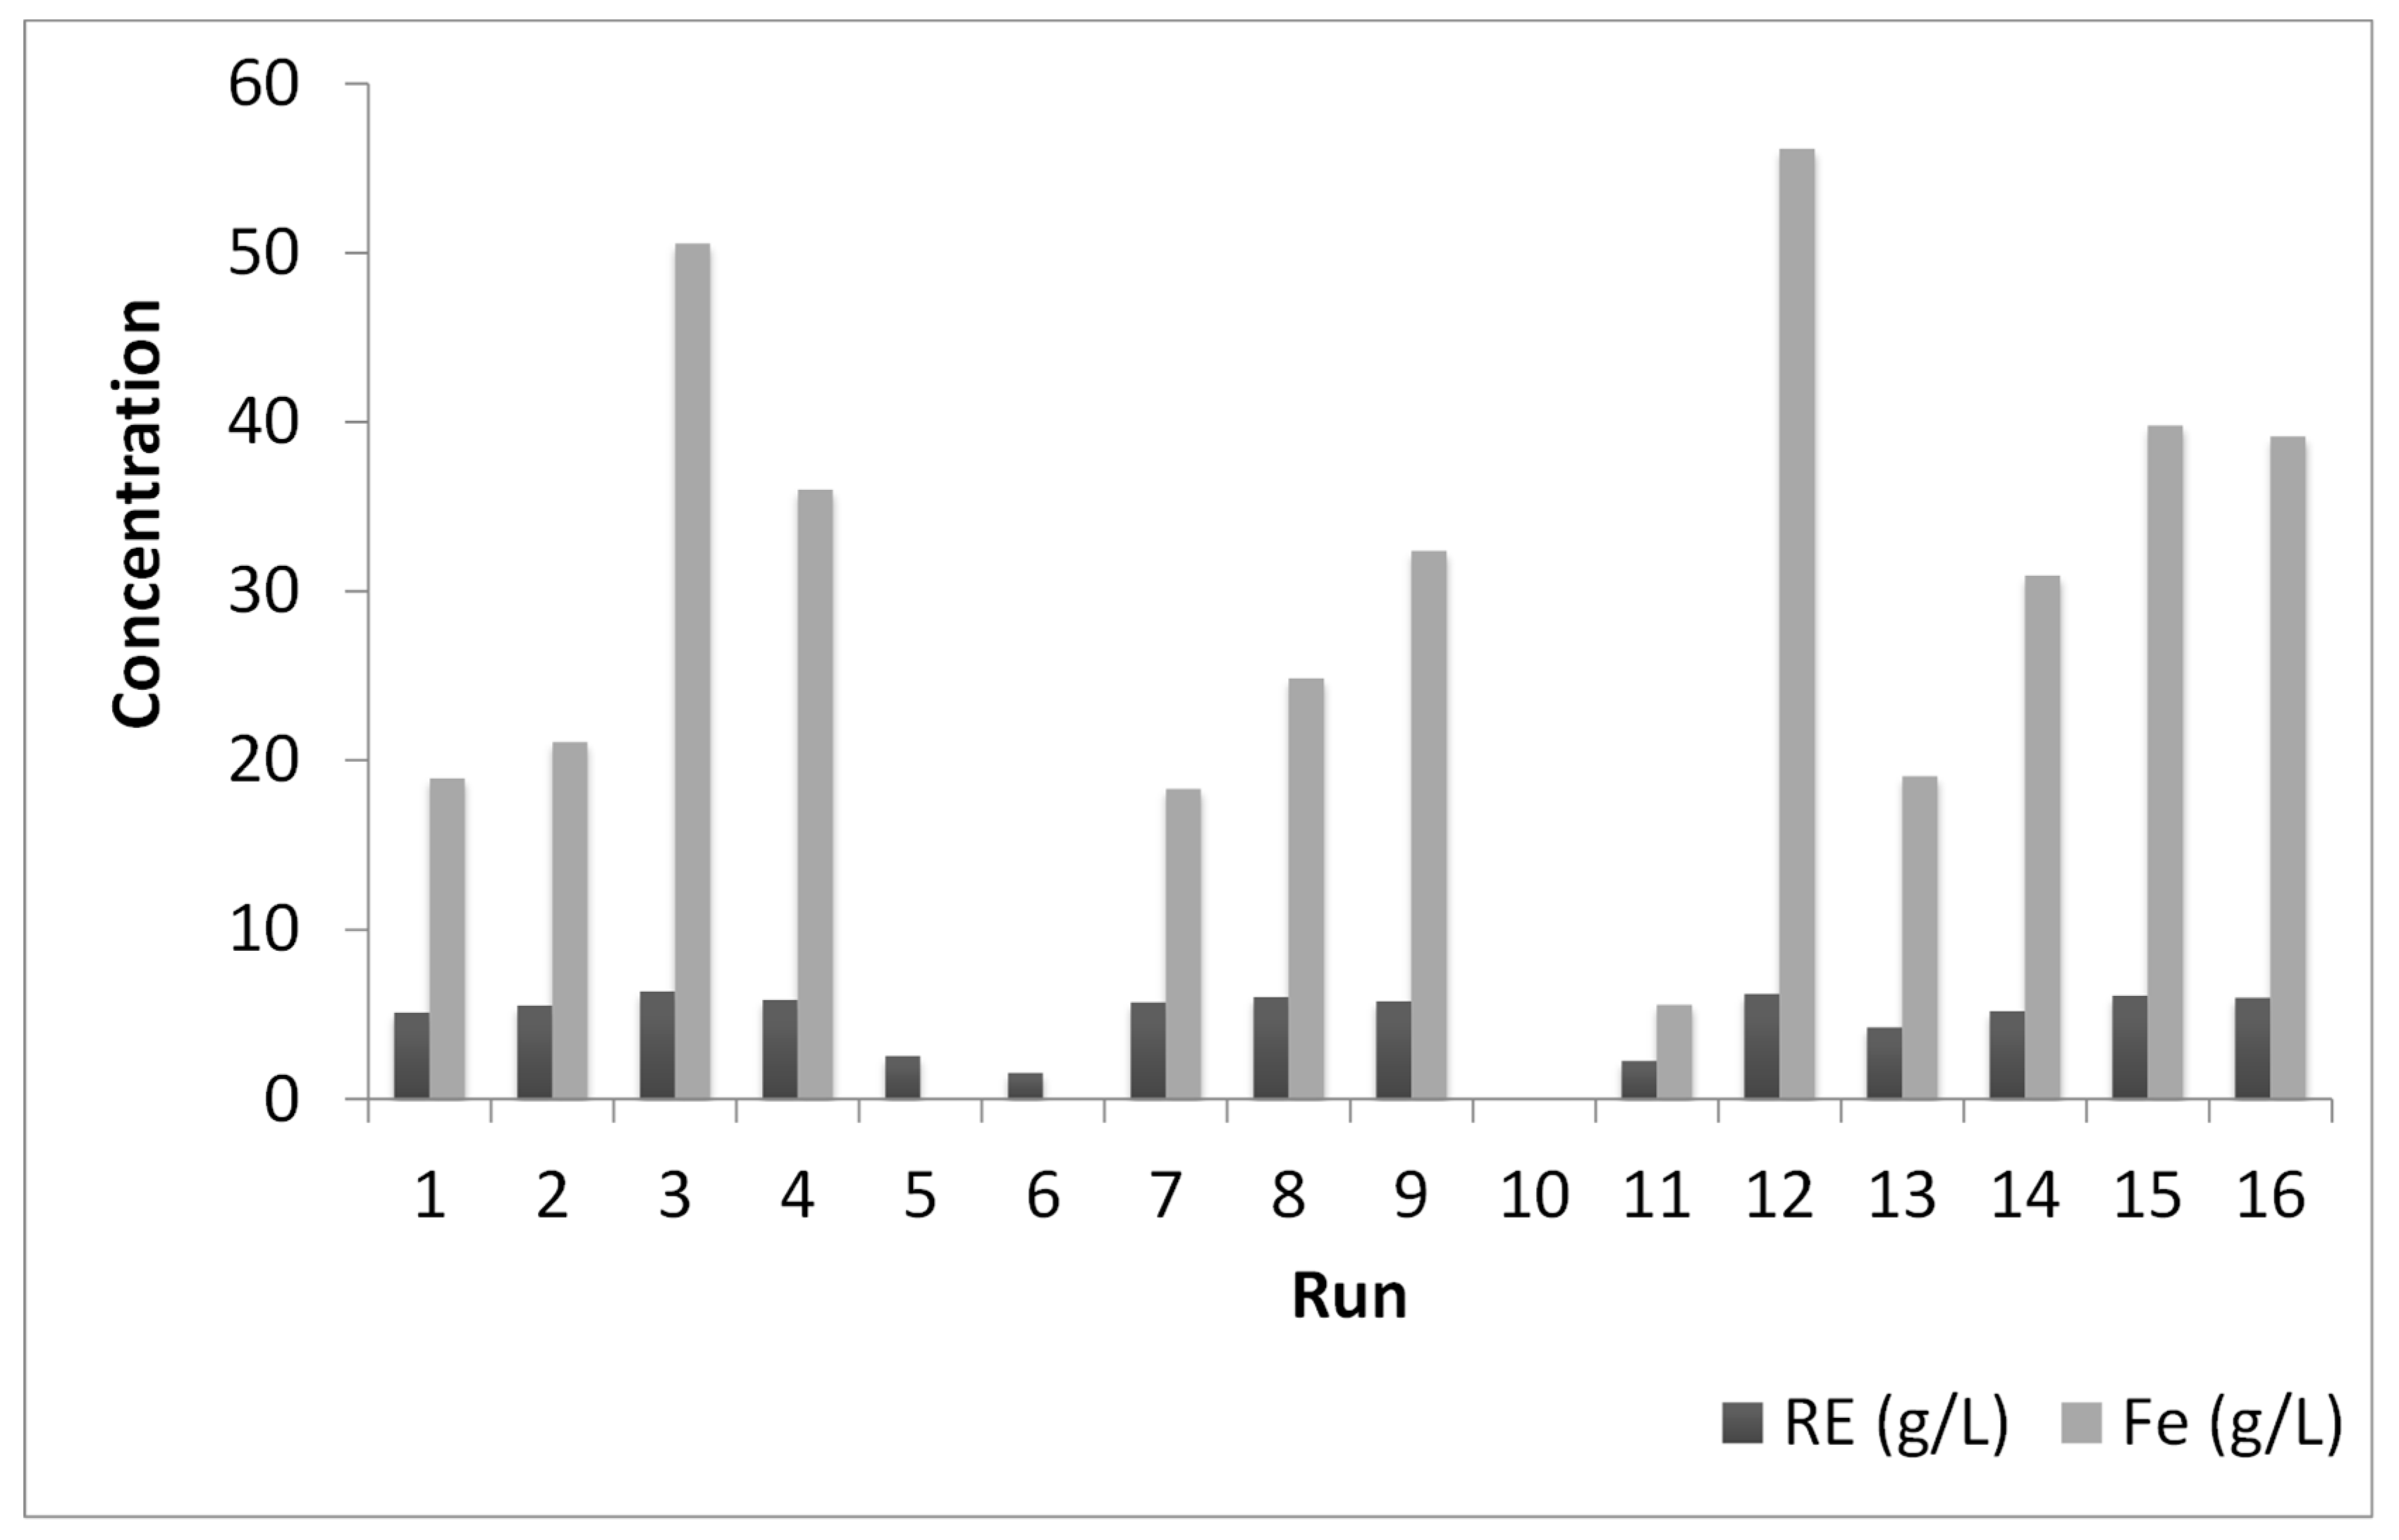
3.3. Experimental

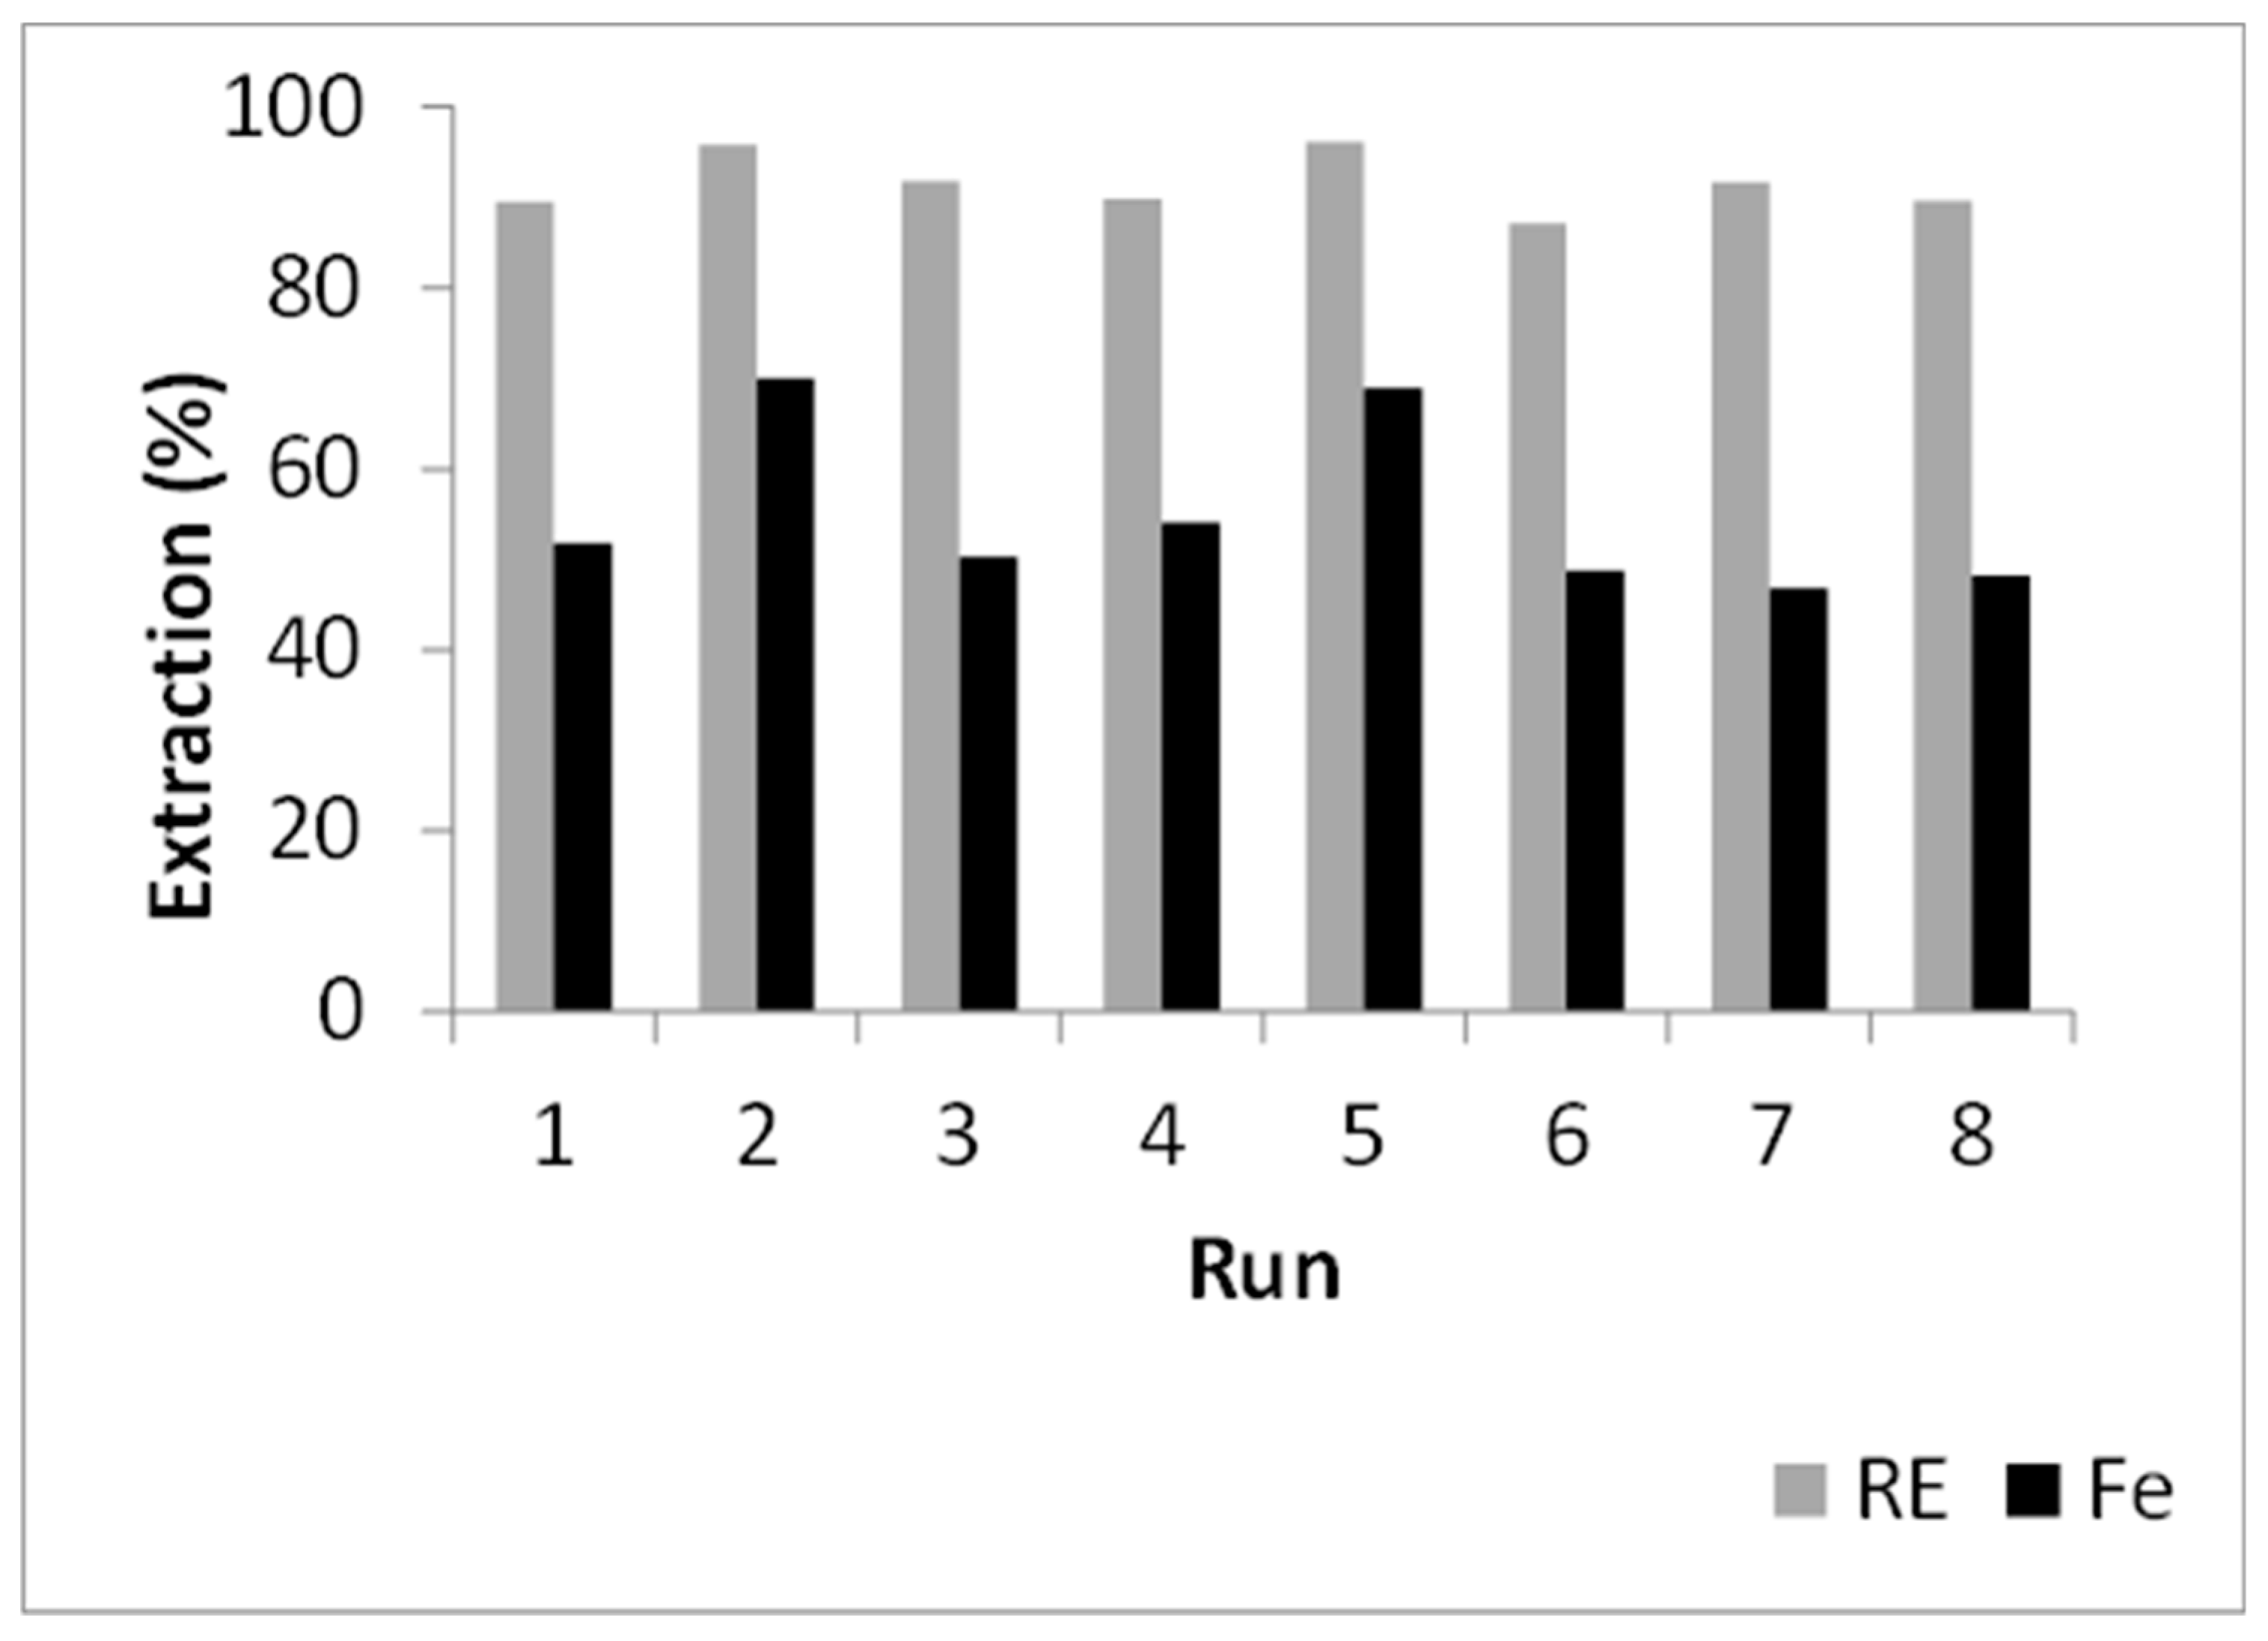
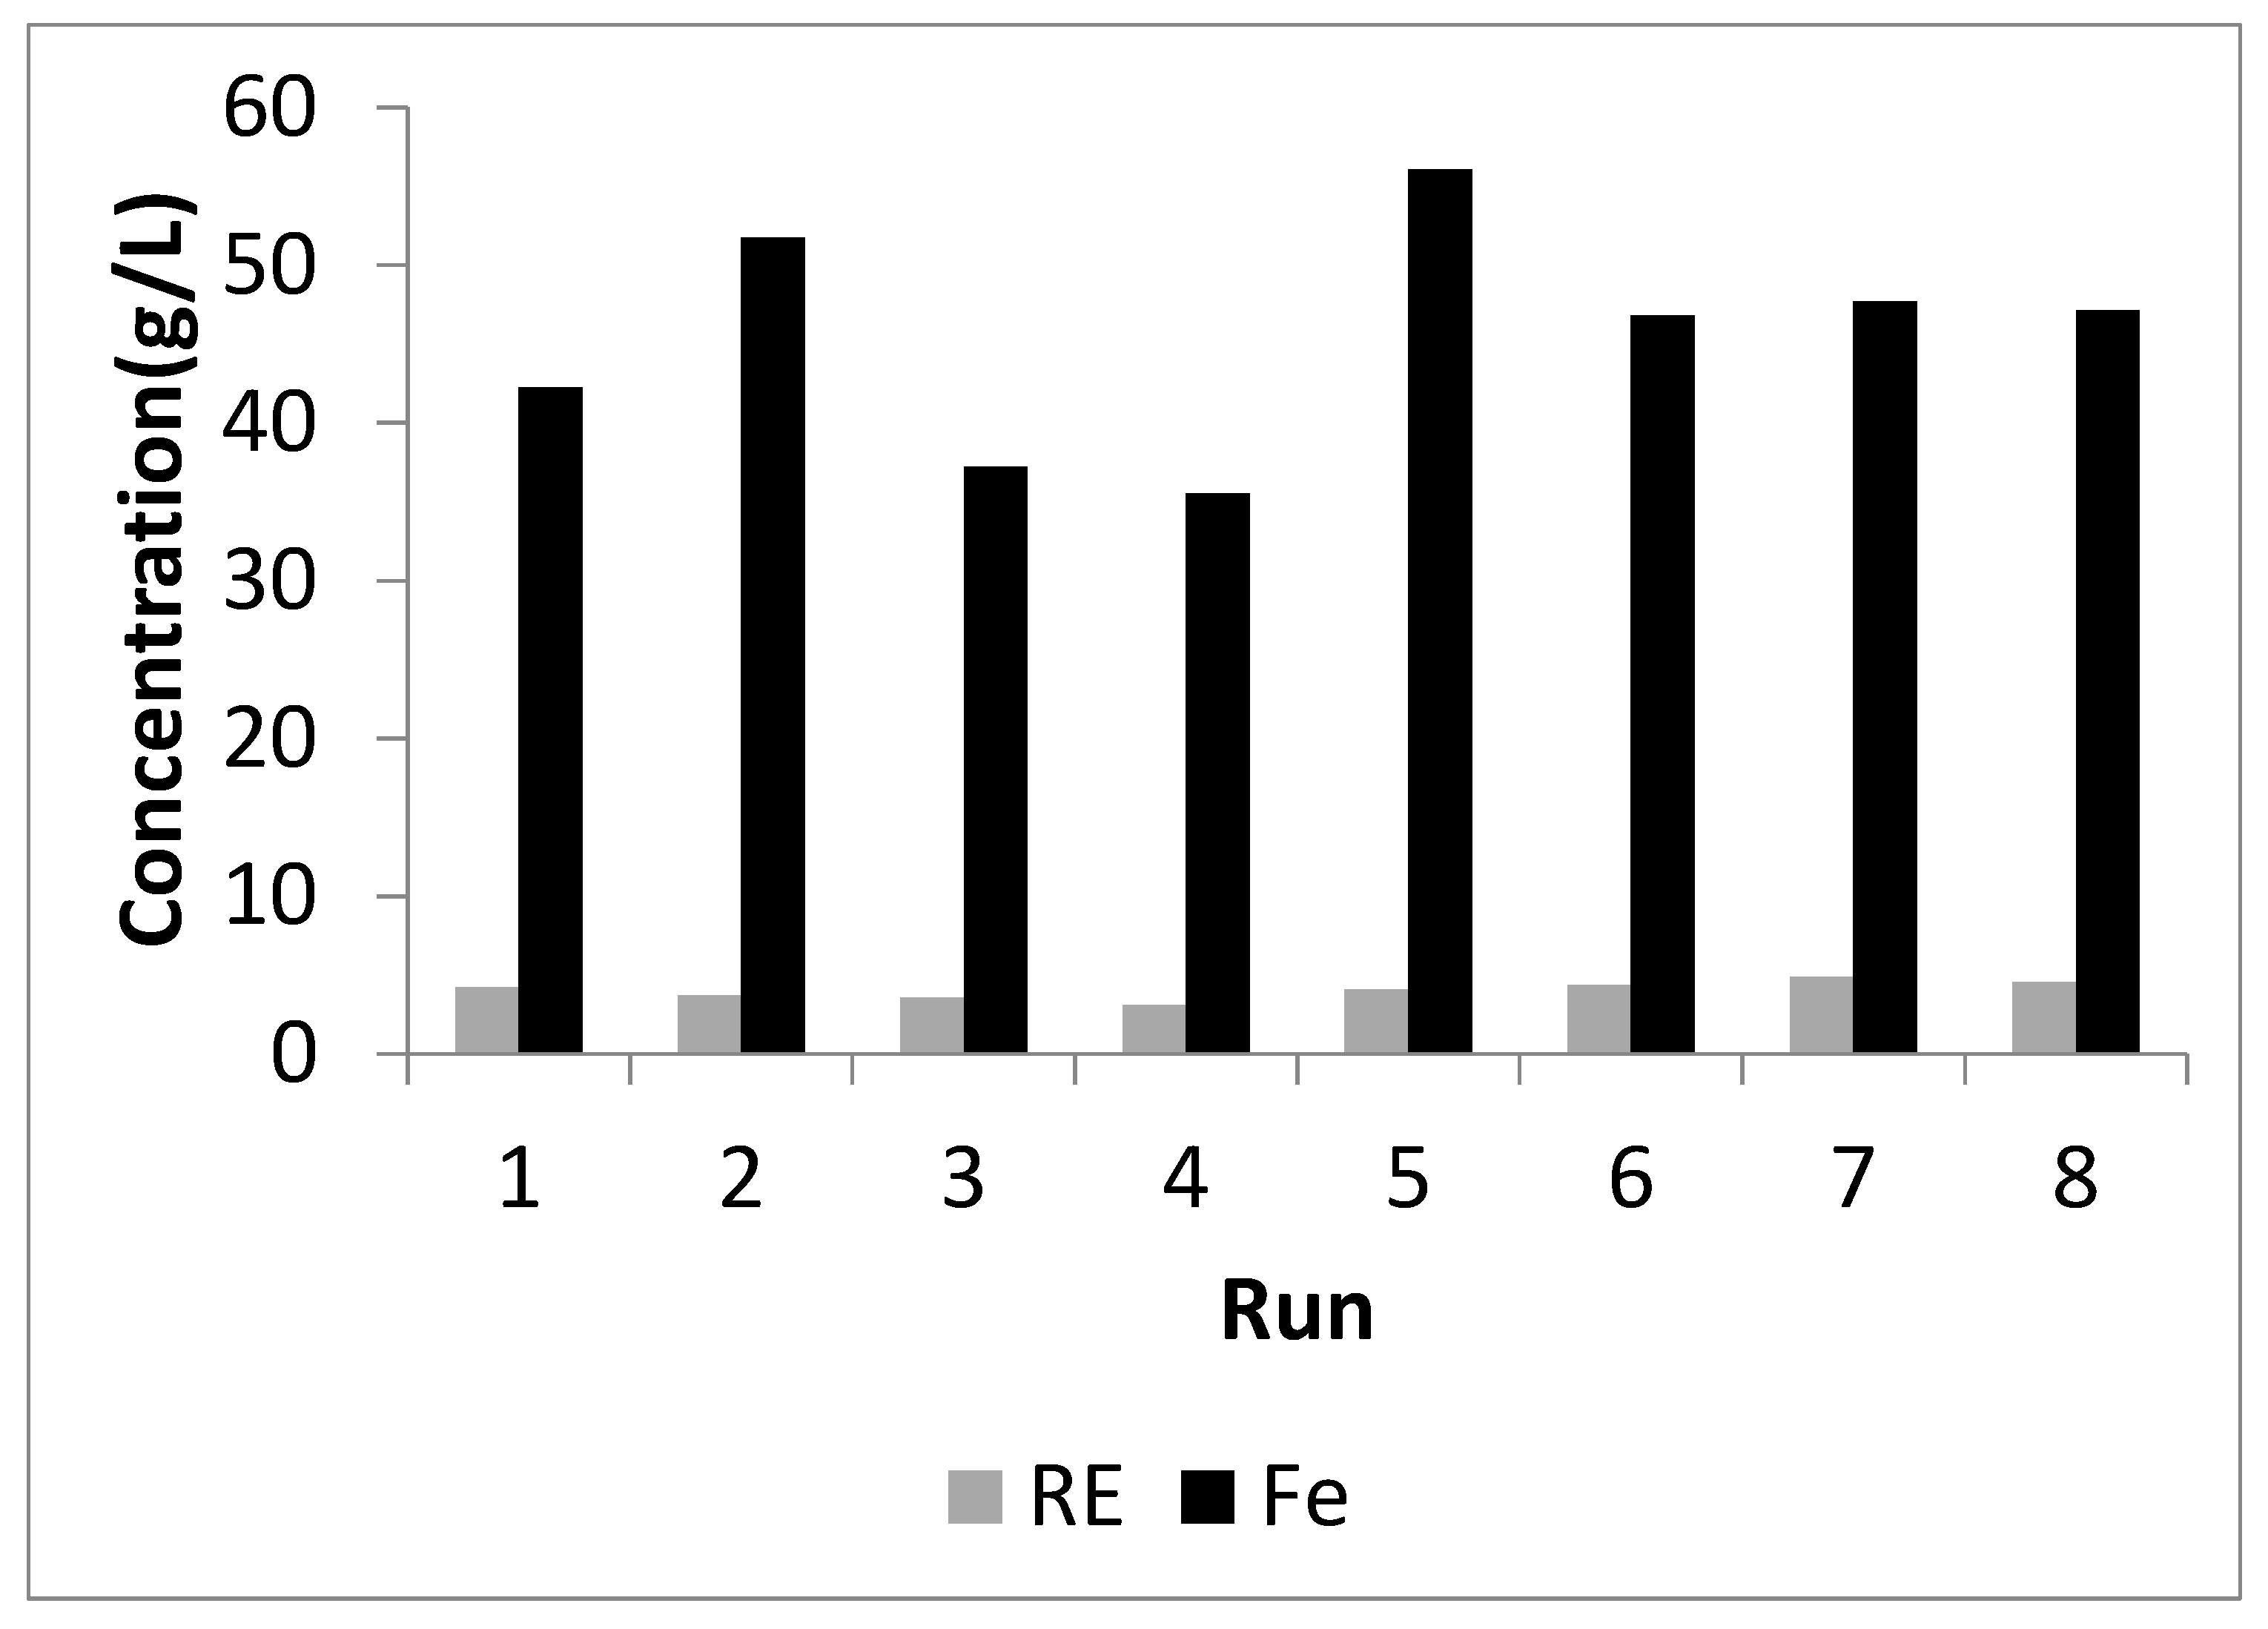
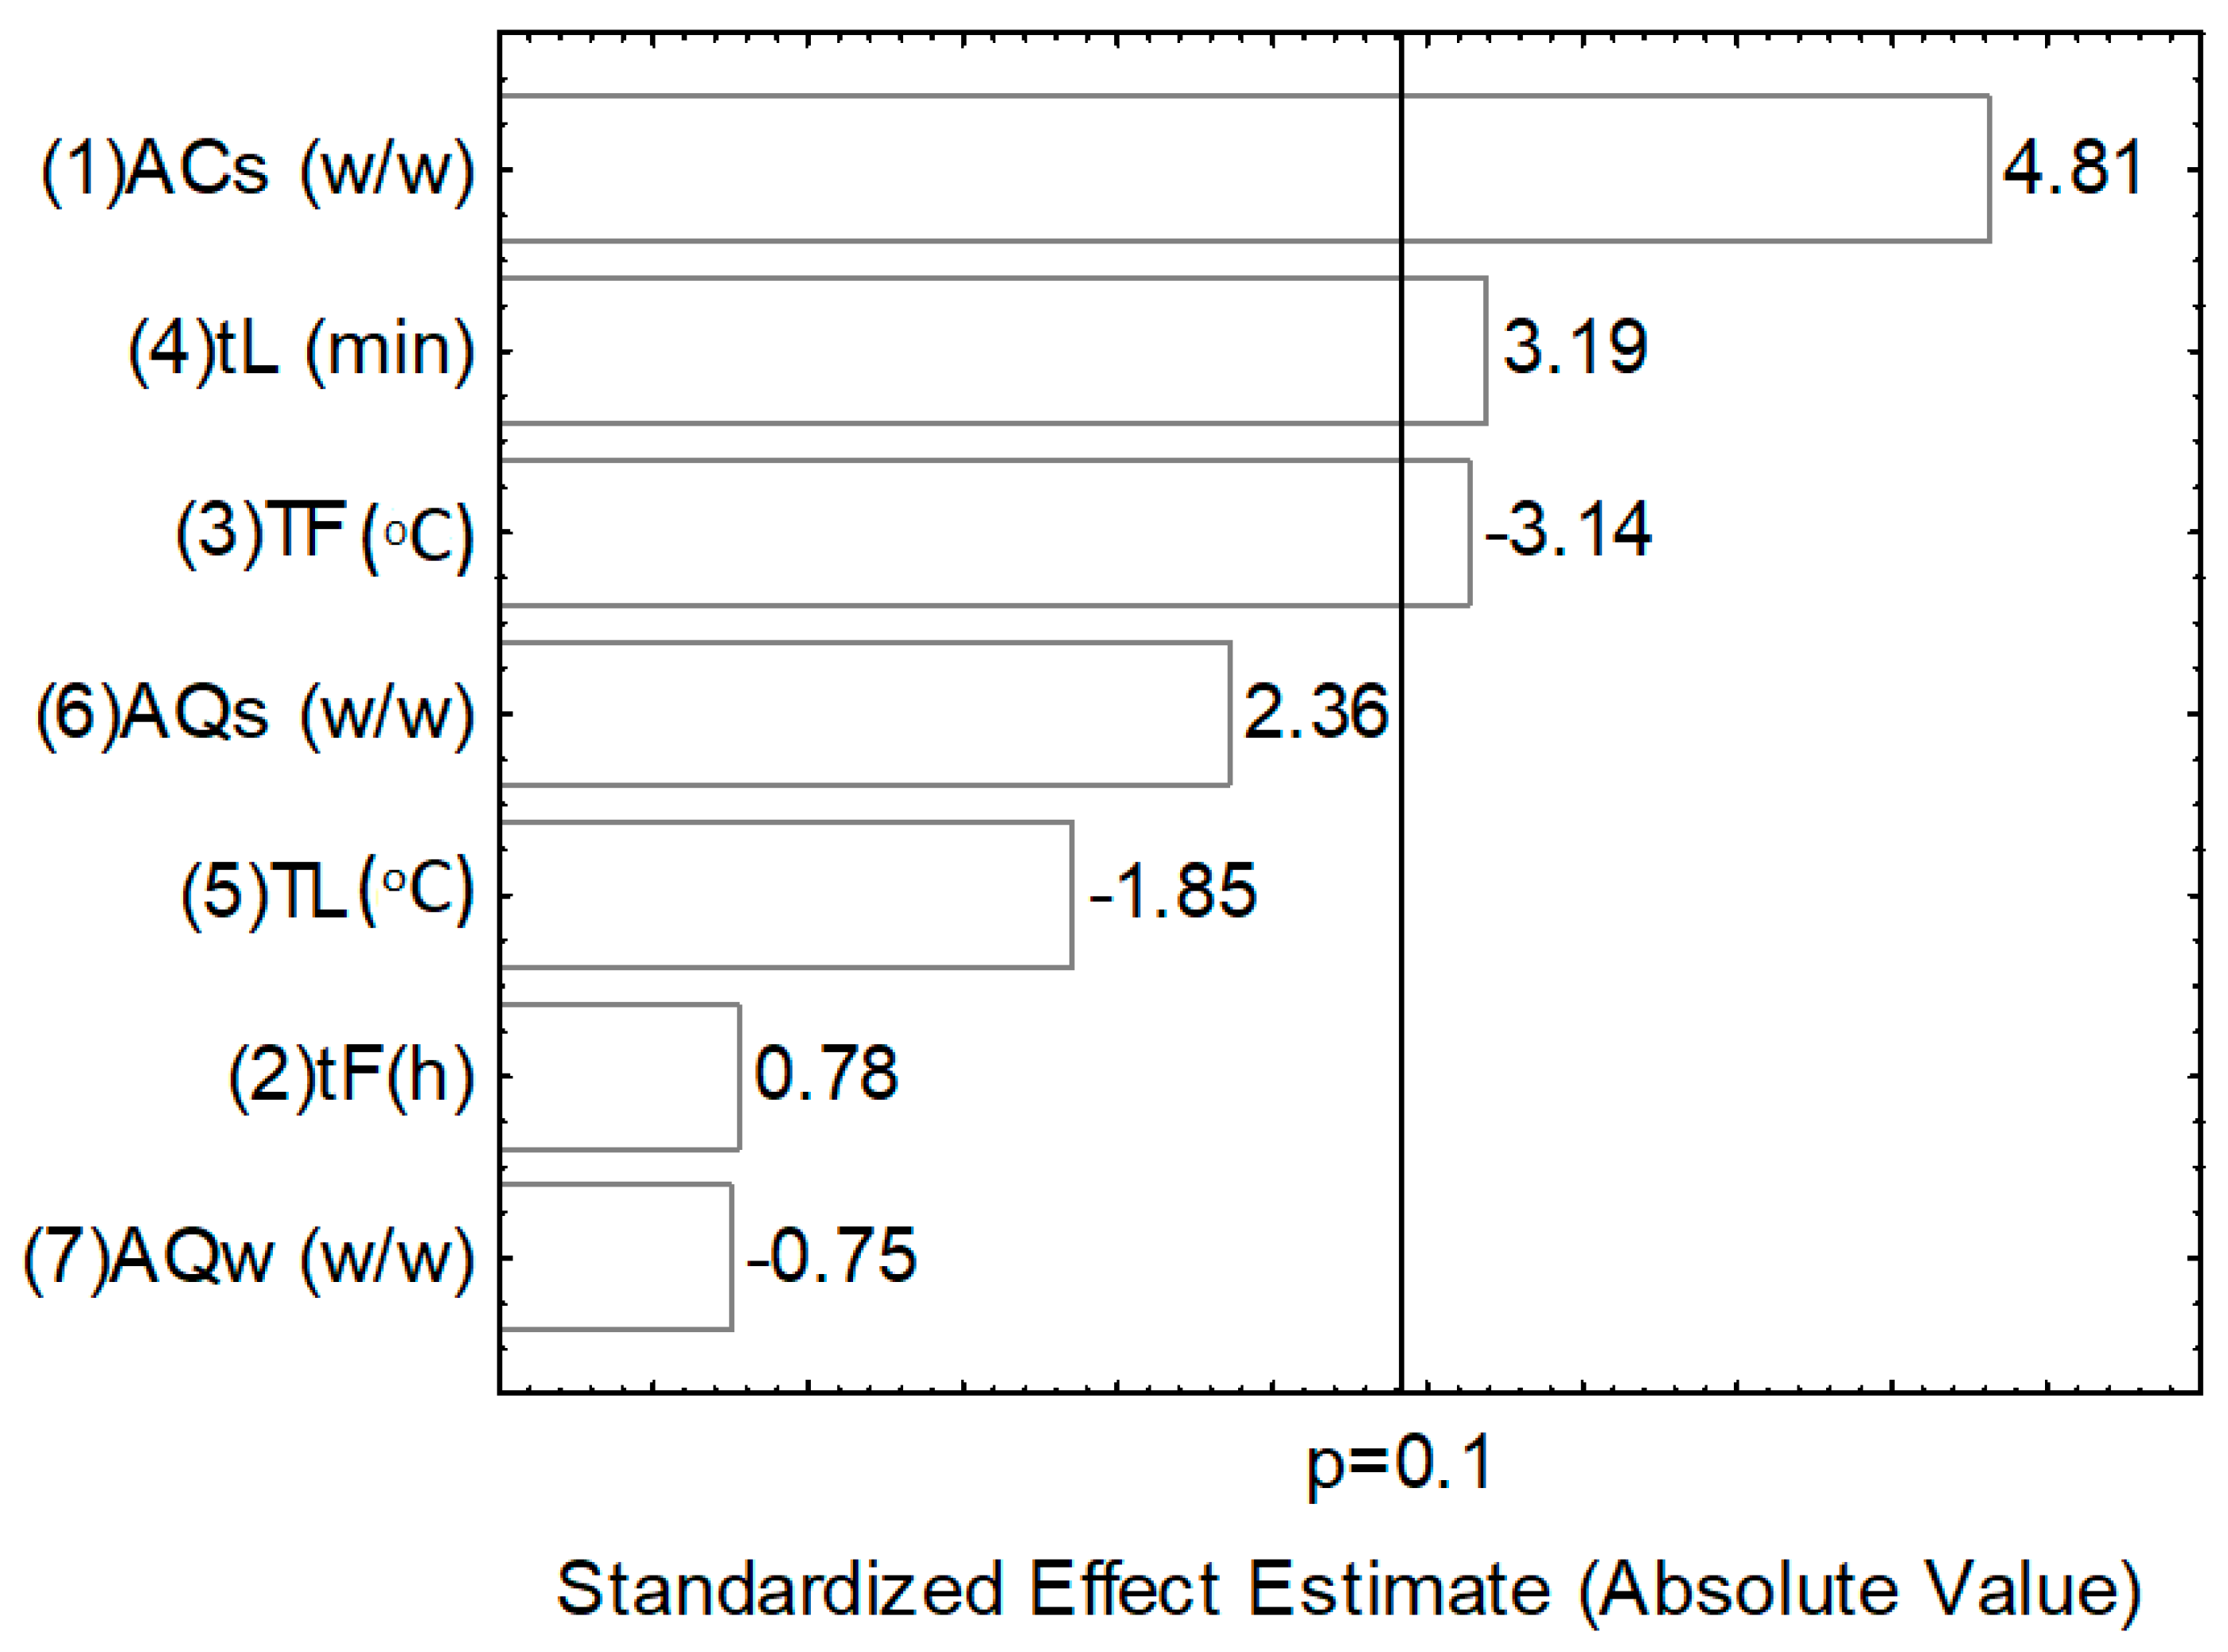
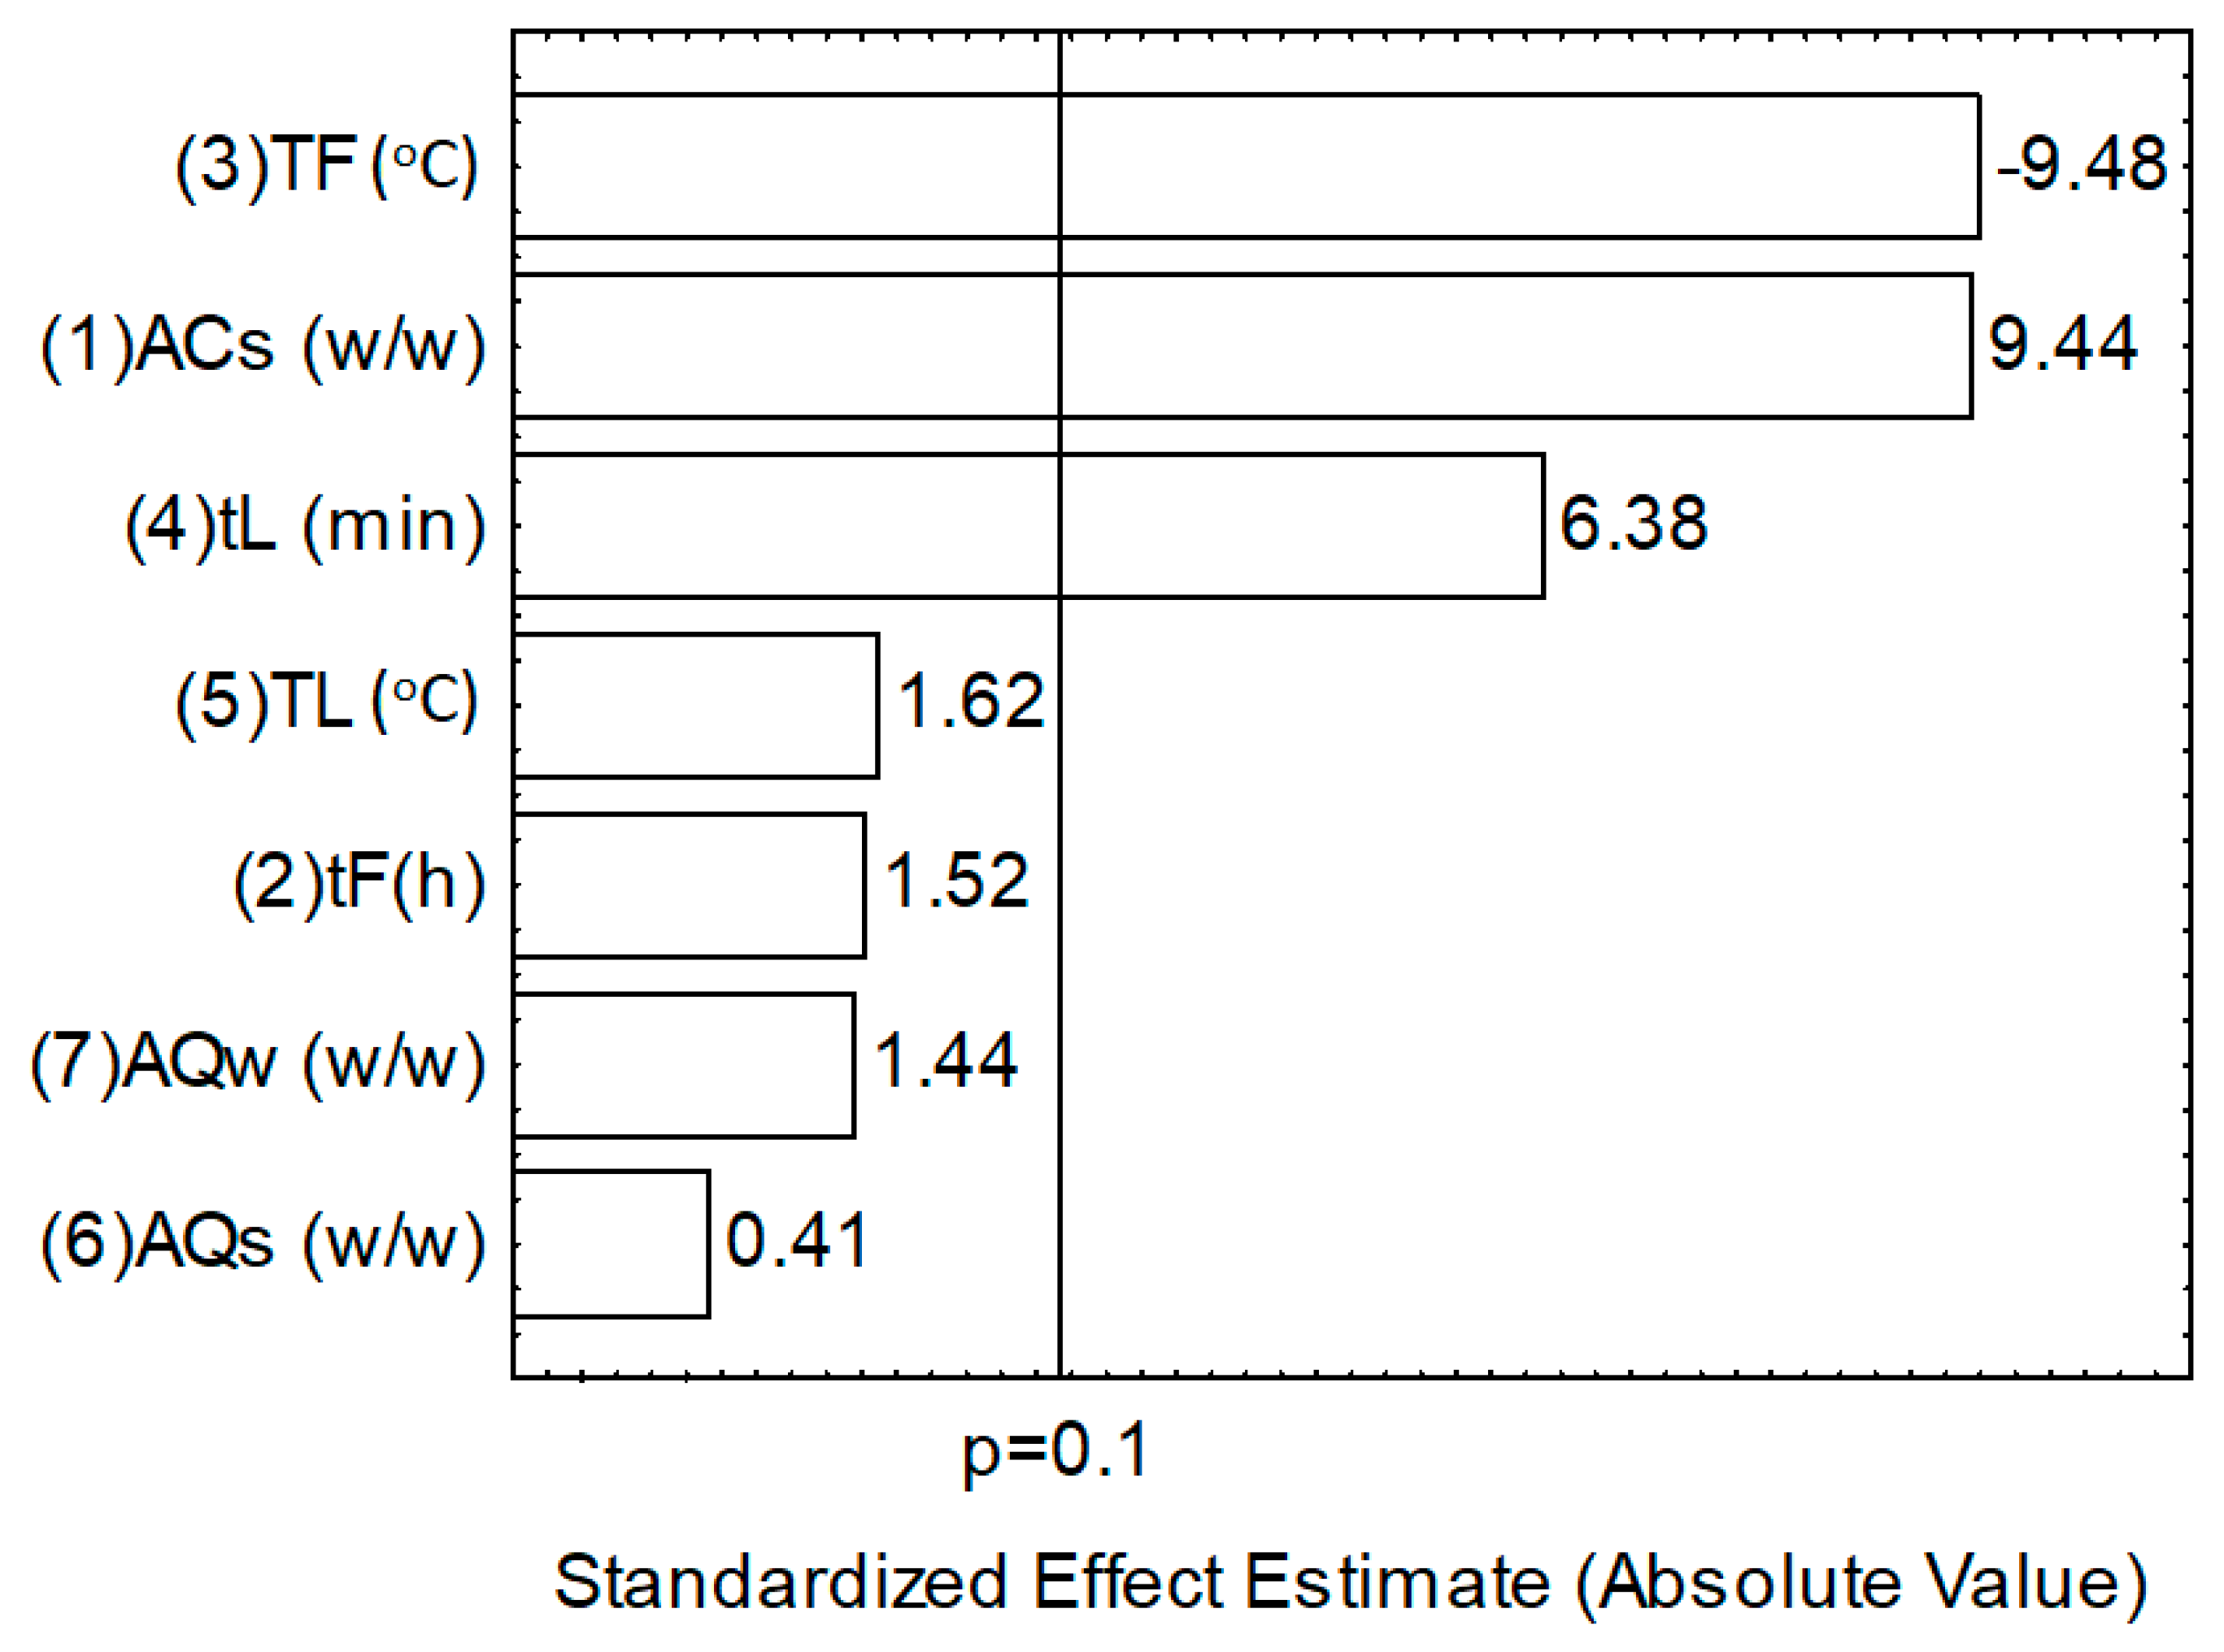
3.3.1. Screening Experiments

The results for extraction of REE and Fe as well as the concentration of these elements in the solution after the aqueous leaching step are shown in Figure 5 and Figure 6 respectively as the arithmetic mean of the experimental results. Figure 5 shows REE extraction from 87% to 96% and Fe extraction from 46% to 70%. These extractions led to leaching liquors from 3 to 5 g/L of REE and from 35 to 53 g/L of Fe (Figure 6).
Figure 7 and Figure 8 show Pareto charts for REE extraction (%RE) and Fe extraction (%Fe).
The figures show the same three variables as statistically significant (90% confidence level—p = 0.1) for the extraction of REE and Fe. This can be credited to the morphology of the mineral phases of Fe and REE which are finely intermixed in the ore.
Figure 7 shows that the acid/sample mass ratio—ACs of the roasting is statistically the most significant variable and the leaching time—tL is the second most significant variable for the REE extraction (p = 0.1). The roasting temperature—TF shows a negative effect on the extraction of REE meaning that an increase of the temperature in the roasting step reduces the REE content of the leaching liquor.
Figure 8 shows that the roasting temperature—TF is statistically the most significant variable for the extraction of Fe and that it has a negative effect on Fe. In other words, an increase in the roasting temperature reduces the soluble Fe in the leaching step. Conversely, an increase in the acid to sample mass ratio—ACs and/or in leaching time—tL leads to an increase in Fe extraction.
Figure 7 and Figure 8 show that the roasting temperature—TF is statistically less significant for REE extraction than for Fe extraction, so one can expect that the proper choice of the roasting temperature could lead to a difference in the leaching of REE and Fe, meaning some selectivity in the leaching of these two species (% RE/% Fe). This agrees with the thermodynamic analysis presented in Section 3.2.
Figure 9 shows the Pareto Chart for the response variable %RE/%Fe. The results confirm that an increase in the roasting temperature—TF can contribute to an increase in the selectivity between REE and Fe.
The reduction of both the acid/sample mass ratio—ACs and the leaching time—tL is also identified as statistically significant to the improvement of the selectivity between REE and Fe in the process.
Based on the thermodynamic analysis presented in Section 3.2 and on the experimental results presented in Section 3.3.1, the roasting temperature (TF), acid/sample mass ratio (ACs) and aqueous leaching time (tL) were identified as the most important process variables to be considered.

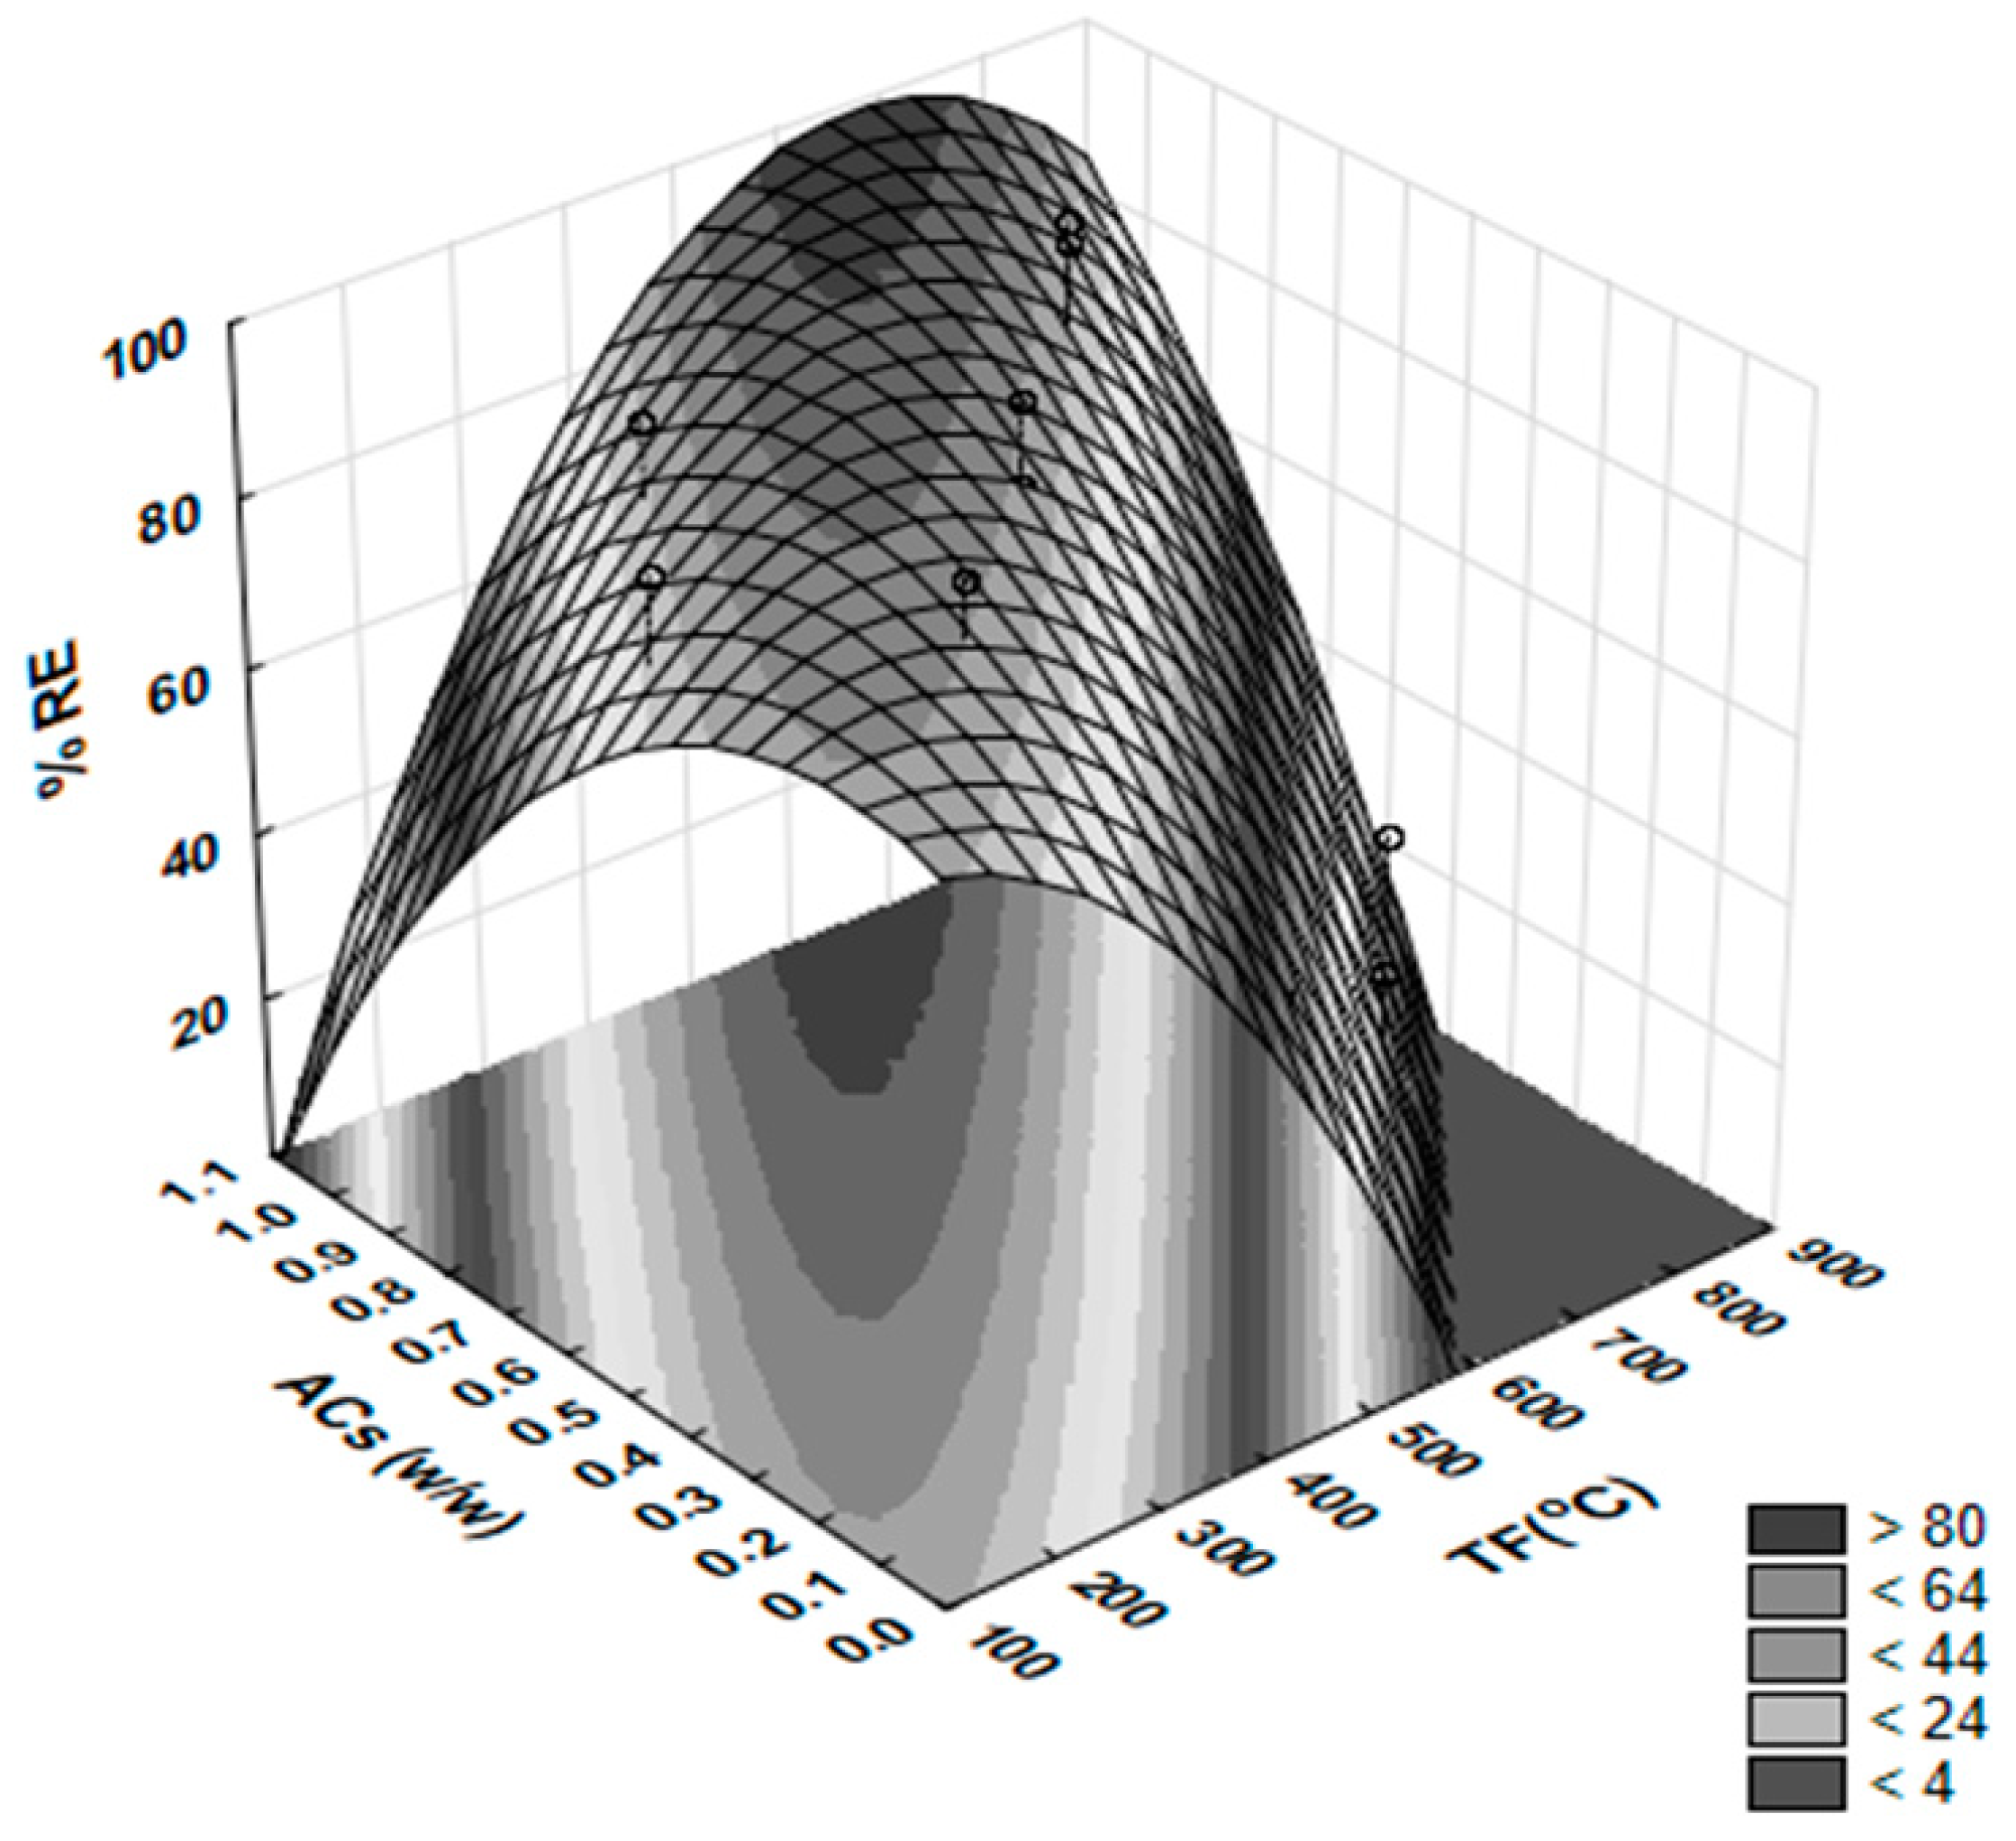
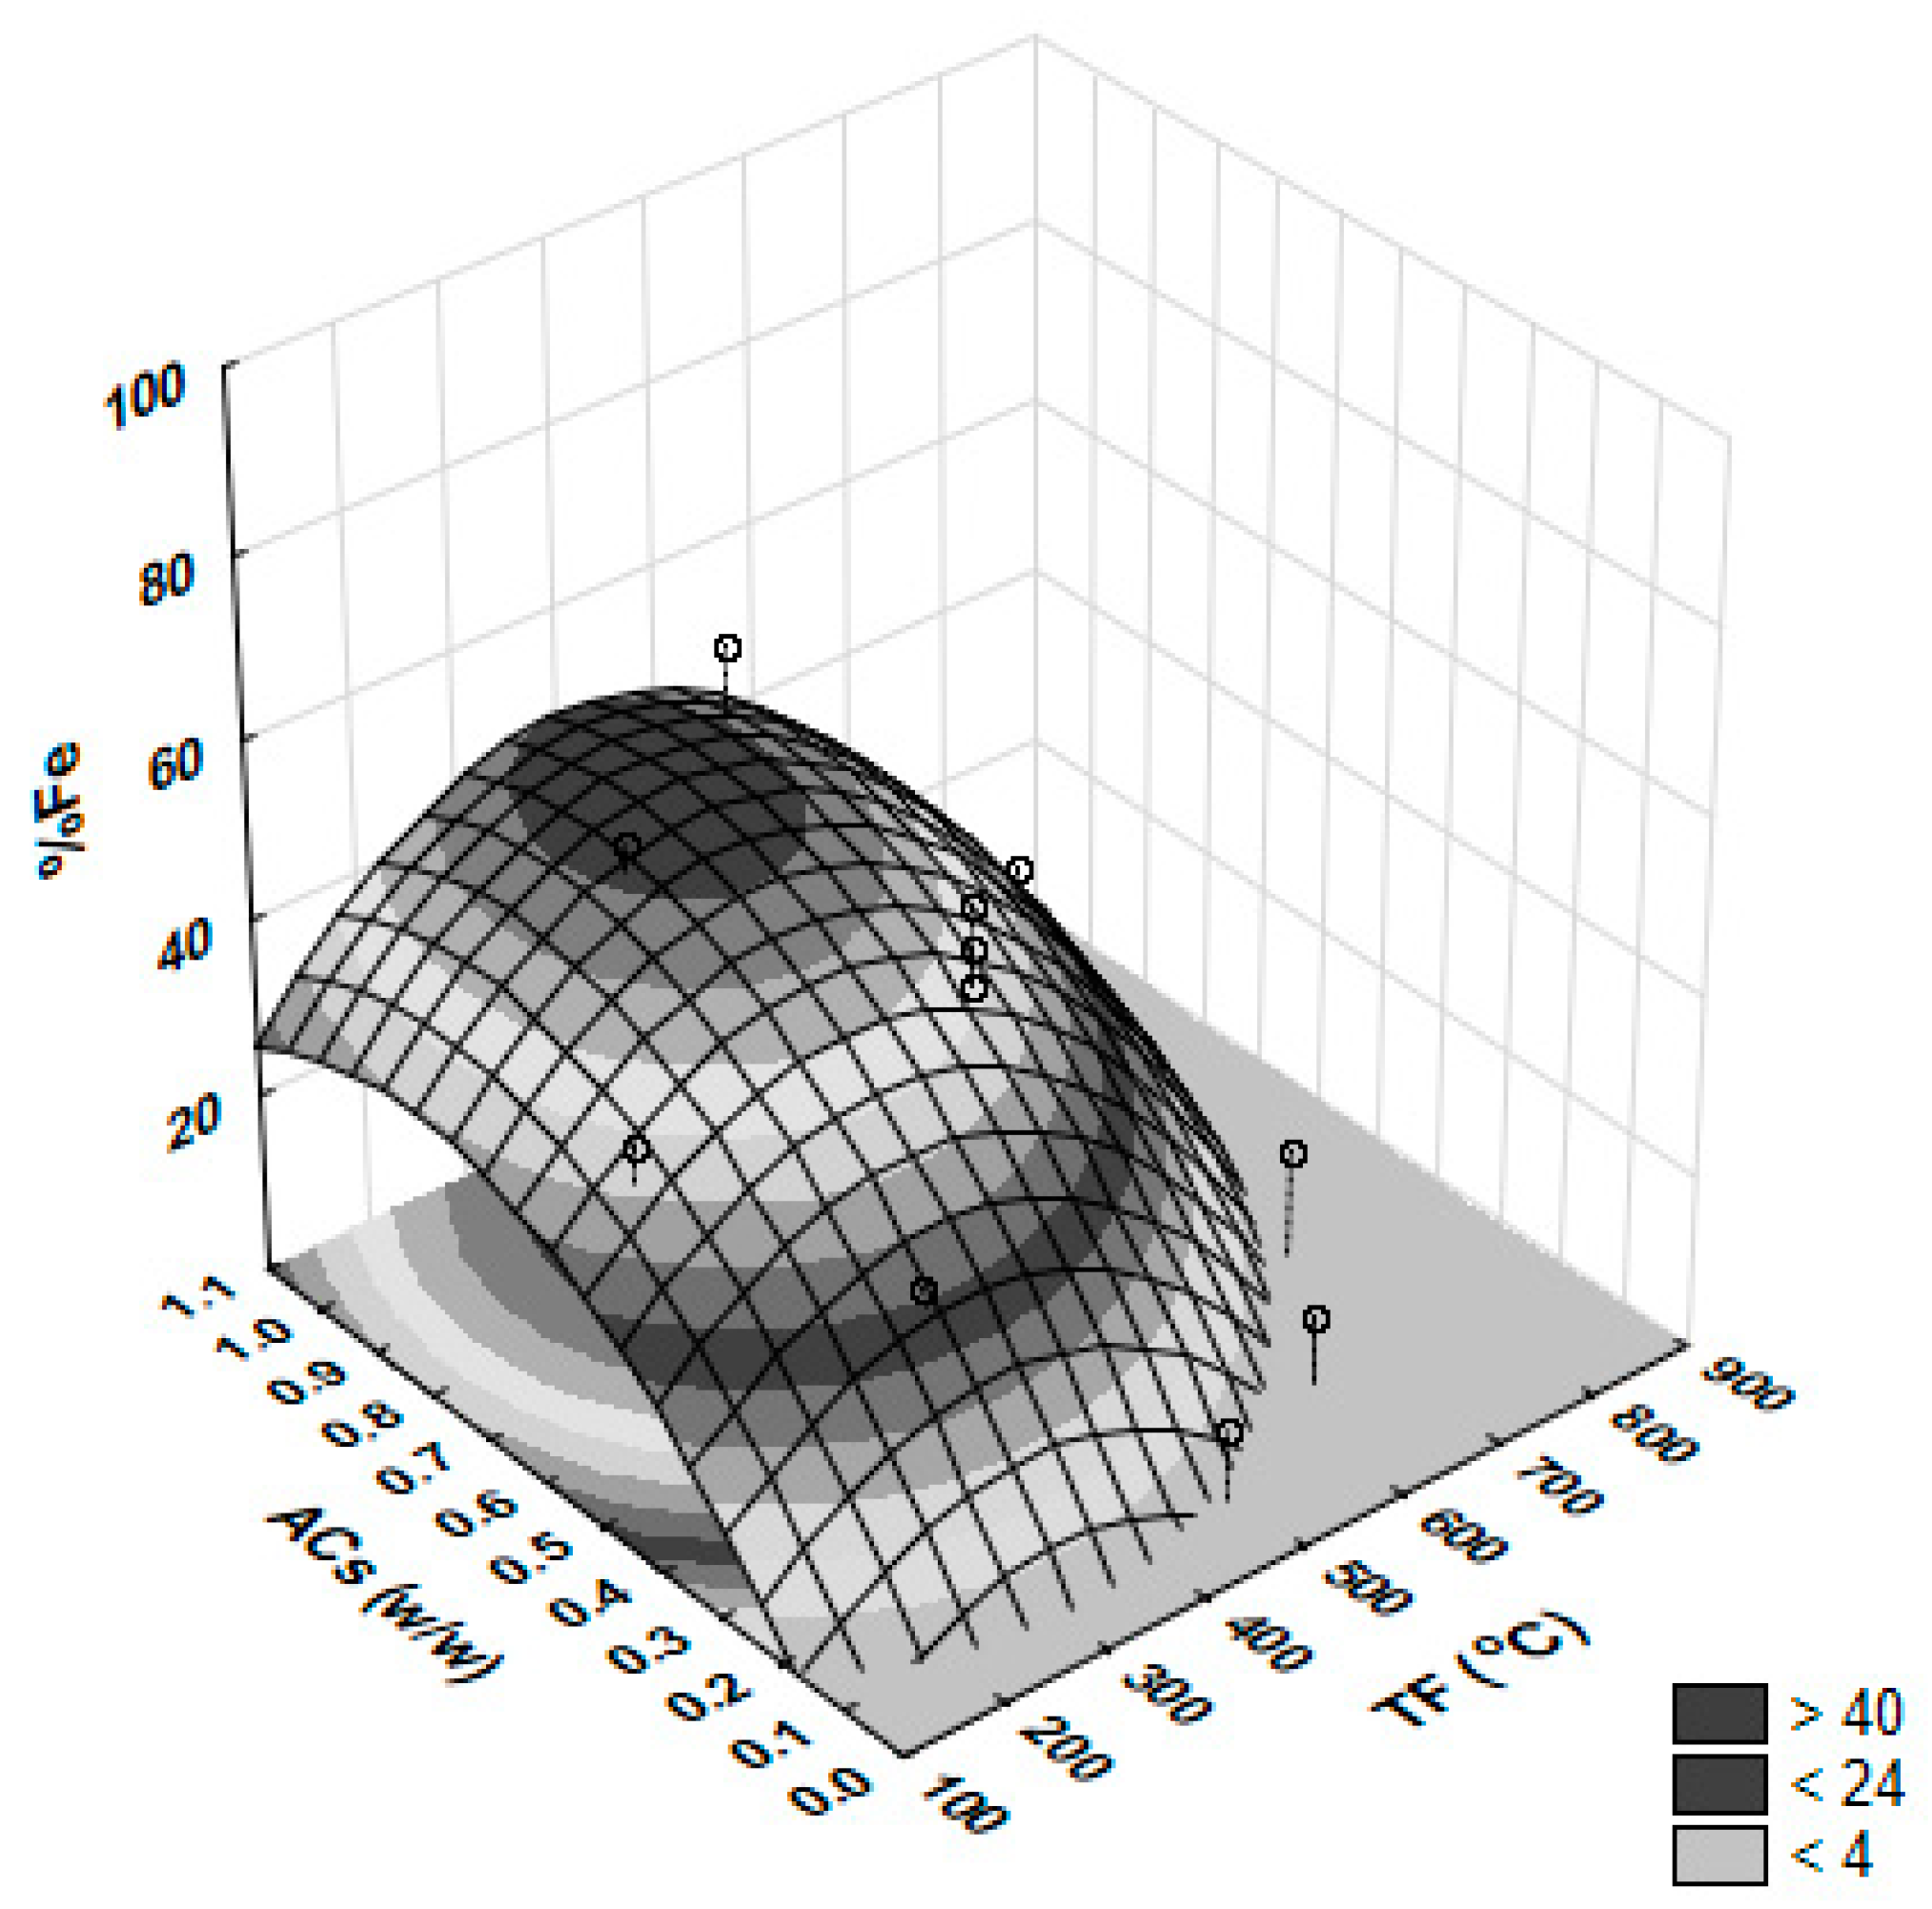
3.3.2. Mathematical Modeling

Figure 10 shows the results of extraction for REE and Fe in the mathematical modeling experiments as the arithmetic mean of the experimental results. More than 80% of REE extraction was obtained in 10 experiments (runs 1, 2, 3, 7, 8, 9, 12, 14, 15 and 16) and the Fe extraction ranged from 0% (run 10) to 56% (run 12).
Figure 11 shows the arithmetic mean of the concentrations of REE that range from 0.01 to 6.65 g/L and of Fe from 0.00 to 56.17 g/L.
Figure 12 and Figure 13 show the X-Ray diffraction of the solid residues of the aqueous leaching step of runs 10 and 12, respectively.
The X-Ray diffraction of Figure 12 (run 10) shows only hematite as the Fe bearing phase. Monazite is also present and barite and quartz are identified in the residue of this run as well as in all other residues of the experiments. The monazite that remains in the residue can be credited to the high temperature of the run (836 °C) that leads to the decomposition of the iron sulfate (Equation (9)) so that it will not be available to react with REE phosphates (Equation (8)).
This proposed decomposition of iron sulfate (Equation (9)) agrees with the enlargement of the hematite peak observed in Figure 12 as compared to the original sample (Figure 1).
Run 12 was carried out at 500 °C with the highest ACs in the experimental planning and led to %Fe = 56.55%. Figure 12 shows hematite as the Fe remaining phase. The extraction of REE reached 89.4% and the monazite phase was not detected in the residue.
Equations (11) and (12) are mathematical models statistically developed for the response variables %RE and %Fe for the range of the process variables shown in the experimental design of Section 2.3.2. The models, based on linear, quadratic and secondary effects of the process variables, showed acceptable adjustment (R2 = 0.82 for %RE and R2 = 0.93 for %Fe). The coefficients indicated in bold in Equations (11) and (12) were statistically significant for a significance level of 90% (p = 0.1).
%RE = 93.49 − 17.03(TF) − 13.47(TF)2 + 13.95(ACs) − 7.55(ACs)2 − 0.08(tL) − 1.81(tL)2 + 18.00(TF)(ACs) − 0.14(TF) (tL) − 2.07(ACs)(tL)
%Fe = 43.58 − 10.27(TF) − 9.52(TF)2 + 12.28(ACs) − 4.86(ACs)2 + 0.88(tL) − 5.53(tL)2 + 2.10(TF)(ACs) + 3.23(TF) (tL) − 2.39(ACs)(tL)
Surface plots of the mathematical models of Equations (11) and (12) are shown in Figure 14 and Figure 15. Figure 14 shows %RE as a function of TF and ACs. The plot was done for tL = 20 min (Table 3). High values for %RE are observed for almost all runs (TF = 400 °C to 700 °C and ACs = 0.8 to 1).
Figure 15 shows %Fe as a function of TF and ACs. The leaching time (tL) was also taken as constant and equal to 20 min. In this case, one looks for the smallest Fe extraction. The figure shows that a reduced Fe extraction can be achieved with low TF and high ACs as predicted in the thermodynamic analysis of Section 2. However, the smallest Fe extraction is obtained at high TF, around 700 °C, and low ACs.
It is, therefore, a matter of optimizing the acid digestion process by setting the level of the process variables to meet two objectives for the response variables: REE extraction (%RE) —maximum and Fe extraction (%Fe)—minimum.

3.3.3. Multi-Objective Optimization

The objective of the process studied was to maximize REE extraction. A minimum of 80% of REE recovery was considered satisfactory and it was imposed in the model as a boundary condition. So, according to Equation (11), ymin = 80% for %RE and ymin = 0% for %Fe. The ymax was set to 100% for %Fe and %RE. The weight coefficient, w, was set to 1. The process of the present study deals with two responses (i.e., %RE and %Fe) so that m = 2 and the global desirability as defined by Equation (12) can be written as the geometric mean of individual desirabilities as follows:
D = d % R E     × ( 1 d % F E   ) 2
In Equation (13) the individual desirability function of %Fe was written as 1-d%Fe, since the objective is to achieve the smallest Fe solubilization.
The individual desirability d and global desirability D were calculated for each %RE and %Fe for all experimental runs. The values are reported in Table 5.
The global desirability D for runs 4, 5, 6, 10, 11 and 13 was equal to 0.00 since d%RE = 0. Similarly, the global desirability D for run 12 was 0.00 since d%Fe = 1. The second lower value of the global desirability was D = 0.24 for run 3 that led to %RE = 93.31% and %Fe = 51.80%. In contrast, the highest global desirability value was D = 0.72 for run 7 that led to %RE = 96.91% and %Fe = 21.69%.

4. Conclusions

The study presents a modeling methodology of the acid processing of a REE mineral concentrate from Araxá (MG Brazil), based on thermodynamic analysis, statistic design of experiments and multi-objective optimization. The objective was to achieve an aqueous solution with high REE concentration and low Fe concentration to feed the subsequent separation and purification operations.
The characterization of the sample showed monazite as the main REE carrier phase and goethite, hematite and magnetite as the main Fe-bearing phases.
The thermodynamic analysis performed showed firstly that the iron sulfate formation is expected for a roasting temperature below 700 °C and that the iron sulfate decomposition is expected for a temperature above 780 °C. Second, it showed that the amount of acid used in the roasting should be just the necessary to obtain the iron sulfate to react with the monazite of the concentrate and that an excess of acid in the roasting step would lead to iron solubilization in the aqueous leaching.
In the experimental planning, initially a set of eight screening experiments was carried out using a Plackett–Burman design to identify the most important process variables. The statistical analysis of the results led to the conclusion that the acid to sample mass ratio (ACs), leaching time (tL) and roasting temperature (TF) are the variables statistically more significant for both REE (%RE) and Fe (%Fe) extraction and for REE/Fe selectivity (%RE/%Fe). This can be credited to the mineralogy of the ore that presents intergrown monazite and Fe phases. The analysis also led to the conclusion that the ACs is statistically the most important variable for %RE followed by tL and TF. The process variable statistically more important for %Fe is TF followed by ACs and tL. The TF increasing, and ACs and tL decreasing, led to an increasing of the selective solubilization between REE and Fe (%RE/%Fe). The results showed that the REE extraction ranging from 87% to 96% and the Fe extraction from 46% to 70%.
A set of sixteen experiments was conceived of as a central composite design to develop a mathematical model to determine the extraction of REE (%RE) and Fe (%Fe) as a function of the roasting temperature (TF), acid to sample mass ratio (ACs) and leaching time (tL). Experimental results reached 99% for REE and 56% for Fe. The mathematical models were obtained with acceptable correlation coefficients: R2 = 0.82 for %RE and R2 = 0.93 for %Fe.
The methodology of the desirability function was efficient as a tool for optimization of the results (response variables). The highest value for the global desirability function was attained with roasting temperature (TF) = 700°C, acid to sample mass ration (ACs) = 0.8 and leaching time (tL) = 20 minutes which led to a %RE = 96.91% and %Fe = 21.69%.

Author Contributions

M.N. conceived and designed the experiments and wrote the paper, P.S. and M.N. analyzed and interpreted the data and wrote the paper, F.L. performed the experiments and helped to analyze the data, R.G. and C.S. contributed with discussion and review.

Funding

This research was funded by Conselho Nacional de Desenvolvimento Científico e Tecnológico—CNPq (INCT PATRIA 465719-2014-7).

Acknowledgments

The authors are thankful to the Companhia Brasileira de Metalurgia e Mineração—CBMM for the sample donation.

Conflicts of Interest

The authors declare no conflict of interest.

References

  1. U.S. Geological Survey, Mineral Commodity Summaries, Rare Earths. February 2014. Available online: https://minerals.usgs.gov/minerals/pubs/commodity/rare_earths/mcs-2014-raree.pdf (accessed on 10 May 2018).
  2. Sumário Mineral. 2016. Available online: http://www.anm.gov.br/dnpm/publicacoes/ serie-estatisticas-e-economia-mineral/sumario-mineral/sumario-mineral-brasileiro-2016 (accessed on 8 August 2018).
  3. Neumann, R.; Medeiros, E.B. Comprehensive mineralogical and technological characterization of the Araxá (SE Brazil) complex REE (Nb-P) ore, and the fate of its processing. Int. J. Min. Proc. 2015, 144, 1–10. [Google Scholar] [CrossRef]
  4. Kim, R.; Cho, H.; Han, K.N.; Kim, K.; Min, M. Optimization of acid leaching of rare-earth elements from Mongolian apatite-based ore. Minerals 2016, 6, 63. [Google Scholar] [CrossRef]
  5. Zhou, Y.; Yang, H.; Xue, X.; Yuan, S. Separation and Recovery of Iron and Rare Earth from Bayan Obo Tailings by Magnetizing Roasting and (NH4)2SO4 Activation Roasting. Metals 2017, 7, 195. [Google Scholar] [CrossRef]
  6. Li, L.Z.; Yang, X. China’s rare earth ore deposits and beneficiation techniques. In Proceedings of the 1st European Rare Earth Resources Conference, Milos Island, Greece, 4–7 September 2014; pp. 26–36. [Google Scholar]
  7. Lapidus, G.T.; Doyle, F.M. Selective thorium and uranium extraction from monazite: I. Single-stage oxalate leaching. Hydrometallurgy 2015, 154, 102–110. [Google Scholar] [CrossRef]
  8. Sadri, F.; Nazari, A.M.; Ghahreman, A. A review on the cracking, baking and leaching process of rare earth element concentrates. J. Rare Earths 2017, 35, 739–752. [Google Scholar] [CrossRef]
  9. Gupta, C.K.; Krishnamurthy, N. Extractive Metallurgy of Rare Earths; CRC Press: New York, NY, USA, 2005. [Google Scholar]
  10. Habashi, F. Handbook of Extractive Metallurgy; Wiley-VCH: Weinheim, Germany, 1997. [Google Scholar]
  11. Habashi, F. Extractive metallurgy of rare earths. Can. Met. Q. 2013, 52, 224–233. [Google Scholar] [CrossRef]
  12. Ponou, J.; Garrouste, M.; Dodbiba, G.; Fujita, T.; Ahn, J. Sulfation–Roasting–Leaching–Precipitation Processes for Selective Recovery of Erbium from Bottom Ash. Sustainability 2019, 11, 3461. [Google Scholar] [CrossRef]
  13. Zhang, J.; Zhao, B. Separation Hydrometallurgy of Rare Earth Elements; Springer International Publishing: Berlin, Germany, 2017. [Google Scholar]
  14. Ritcey, G.M.; Ashbrook, A.W. Solvent Extraction–Principles and Applications to Process Metallurgy; Elsevier Science Publishing Company Inc.: Amsterdam, The Netherlands, 1984. [Google Scholar]
  15. Ritcey, G.M. Solvent Extraction-Principles and Applications to Process Metallurgy; Ritcey, G.M., Ed.; Associates Inc.: Ottawa, ON, Canada, 2006. [Google Scholar]
  16. Beltrami, D.; Deblonde, G.J.P.; Bélair, S.; Weigel, V. Recovery of yttrium and lanthanides from sulfate solutions with high concentration of iron and low rare earth content. Hydrometallurgy 2015, 157, 356–362. [Google Scholar] [CrossRef] [Green Version]
  17. Karshigina, Z.; Abisheva, Z.; Bochevskaya, Y.; Akcil, A.; Salgelova, E.; Sukorov, B.; Silachyov, I. Recovery of rare earth metals (REMs) from primary raw material: Sulphatization-leaching-precipitation-extraction. Min. Proc. Ext. Met. Rev. 2018, 39, 319–338. [Google Scholar] [CrossRef]
  18. Kim, E.; Osseo-Asare, K. Aqueous stability of thorium and rare earth metals in monazite hydrometallurgy: Eh–pH diagrams for the systems Th–, Ce–, La–, Nd– (PO4)–(SO4)–H2O at 25 °C. Hydrometallurgy 2012, 113–114, 67–78. [Google Scholar] [CrossRef]
  19. Ma, Y.; Stopic, S.; Gronen, L.; Milivojevic, M.; Obradovic, S.; Friedrich, B. Neural network modeling for the extraction of rare earth elements from eudialyte concentrate by dry digestion and leaching. Metals 2018, 8, 267. [Google Scholar] [CrossRef]
  20. Georgiou, T.; Tsakanika, P.; Hatzilyberis, L.; Ochsenkuehn-Petropoulou, K.M. Optimizing conditions for scandium extraction from bauxite residue using taguchi methodology. Minerals 2019, 9, 236. [Google Scholar]
  21. Neumann, R.; Rio de Janeiro, RJ, Brazil. Centro de Tecnologia Mineral–CETEM/MCTIC. Personal communication, 2018. [Google Scholar]
  22. Lapido-Loureiro, F.E.D.V. Terras-Raras no Brasil: Depósitos Recursos Identificados Reservas; Centro de Tecnologia Mineral–CETEM: Rio de Janeiro, Brazil, 1994.
  23. Silva, M.C.; Matiolo, E. Estudo da concentração de monazita em uma amostra de carbonatito friável brasileiro. In Proceedings of the Anais da XXXIV Jornada de Iniciação Científica CETEM, CETEM/MCTIC, Rio de Janeiro, Brazil, 29 July 2016; pp. 76–80. [Google Scholar]
  24. Outotec. Outotec HSC 7.15 Chemistry Software. Available online: https://www.outotec.com/products/digitalsolutions/hsc-chemistry/ (accessed on 15 May 2018).
  25. Montgomery, D.C.; Peck, E.A.; Vining, G.G. Design and Analysis of Experiments; John Wiley & Sons, Inc.: Hoboken, NJ, USA, 1997. [Google Scholar]
  26. Calado, V.; Montgomery, D.C. Planejamento de Experimentos Usando o Statistica; e-Papers: Rio de Janeiro, Brasil, 2003. (In Portuguese) [Google Scholar]
  27. Montgomery, D.C.; Runger, G.C.; Hubele, N.F. Design and Analysis of Experiments; John Wiley & Sons, Inc.: Hoboken, NJ, USA, 2011. [Google Scholar]
  28. Costa, N.R.; Lourenço, J.; Pereira, Z.L. Desirability function approach: a review and performance evaluation in adverse conditions, Chemom. Int. Lab. Syst. 2011, 107, 234–244. [Google Scholar] [CrossRef]
  29. Berni, T.V.; Pereira, A.C.; Mendes, F.D.; Tude, J.A.L. System and Method for Rare Earths Extraction. U.S. Patent US2013/0336856 A1, 19 December 2013. [Google Scholar]
Figure 1. X-Ray diffraction of the concentrate (H—hematite, M—monazite, B—barite, P—pirochlore, G—goethite, Z—zircon, Mg—magnetite, Q—quartz, R—rutile).
Minerals 09 00451 g001
Figure 2. Free energy (Delta G—ΔG) of reactions 1 to 5 (kJ) from 100 °C to 400 °C.
Minerals 09 00451 g002
Figure 3. Free energy (Delta G—ΔG) of reactions 5, 6 and 7 (kJ) from 400 °C to 1000 °C.
Minerals 09 00451 g003
Figure 4. Free energy (Delta G—ΔG) of Equations (5)–(7) (kJ) from 400 °C to 1000 °C.
Minerals 09 00451 g004
Figure 5. Extraction of rare earth element (REE) (%RE) and Fe (%Fe)—screening experiments.
Minerals 09 00451 g005
Figure 6. REE (RE) and iron (Fe) concentration (g/L)—screening experiments.
Minerals 09 00451 g006
Figure 7. Effect of the process variables on REE extraction (%RE)—screening experiments (p = 0.1–90% confidence level). Acid/sample mass ratio—ACs, roasting time—tF, roasting temperature—TF, leaching time—tL, leaching temperature—TL, water/sample mass ratio in aqueous leaching—AQs and water/sample mass ratio in washing—AQw.
Minerals 09 00451 g007
Figure 8. Effect of the process variables on Fe extraction (%Fe)—screening experiments (p = 0.1–90% confidence level). Acid/sample mass ratio—ACs, roasting time—tF, roasting temperature—TF, leaching time—tL, leaching temperature—TL, water/sample mass ratio in aqueous leaching—AQs and water/sample mass ratio in washing—AQw.
Minerals 09 00451 g008
Figure 9. Effect of the process variables on the ratio of REE extraction to iron extraction (%RE/%Fe) —screening experiments (p = 0.1–90% confidence level). Acid/sample mass ratio—ACs, roasting time—tF, roasting temperature—TF, leaching time—tL, leaching temperature—TL, water/sample mass ratio in aqueous leaching—AQs and water/sample mass ratio in washing—AQw.
Minerals 09 00451 g009
Figure 10. Extraction of REE (%RE) and Fe (%Fe)—mathematical modeling experiments.
Minerals 09 00451 g010
Figure 11. Concentration of REE and Fe (g/L)—mathematical modeling experiments.
Minerals 09 00451 g011
Figure 12. X-Ray diffraction of the solid residue of the aqueous leaching step of run 10 (H—hematite, M—monazite, B—barite).
Minerals 09 00451 g012
Figure 13. X-Ray diffraction of the solid residue of the aqueous leaching step of run 12 (H—hematite, R—rutile, B—barite, Q—quartz).
Minerals 09 00451 g013
Figure 14. Response surface plot and contour lines for %RE (REE extraction) versus TF (roasting temperature) and ACs (Acid/sample mass ratio)—Equation (11) (leaching time—tL = 20 min).
Minerals 09 00451 g014
Figure 15. Response surface plot and contour lines for %Fe (Fe extraction) versus TF (roasting temperature) and ACs (Acid/sample mass ratio)—Equation (12) (leaching time—tL = 20 min).
Minerals 09 00451 g015
Table 1. Thermodynamic data—HSC Chemistry 7.15 database.
SpeciesΔG°f, 298 (kJ/mol)
Fe2O3−744.246
Fe3O4 −1012.34
FeOOH−490.52
Fe2(SO4)3−2264.37
FePO4−1182.22
LaPO4−1781.49
La2O3−1706.49
La2(SO4)3−3597.5
H2SO4−689.916
SO2(g)−285.468
H2O−237.141
ΔG°f —Standard formation Gibbs energy of the species, 25°C,1bar.
Table 2. Plackett–Burman design—screening experiments (w/w: mass/mass).
RunACs (w/w)tF (h)TF (°C)tL (min)TL (°C)AQs (w/w)AQw (w/w)
11.23350308022
21.232501202523
31.21350302533
40.83250308033
51.212501208032
60.813501208023
70.833501202532
80.81250302522
ACs—Acid/sample mass ratio, tF—roasting time, TF—roasting temperature, tL—leaching time, TL—leaching temperature, AQs—water/sample mass ratio, AQw—water/sample mass ratio.
Table 3. Central composite design—mathematical modeling experiments.
RunTF (°C)ACs (w/w)tL (min)
13000.3020
23000.3060
33000.8020
43000.8060
57000.3020
67000.3060
77000.8020
87000.8060
9163.640.5540
10836.360.5540
115000.1340
125000.9740
135000.556.36
145000.5573.63
15 (C)5000.5540
16 (C)5000.5540
ACs—Acid/sample mass ratio, tF—roasting time, TF—roasting temperature, tL—leaching time, TL—leaching temperature, AQs—water/sample mass ratio, AQw—water/sample mass ratio. w/w: mass/mass, (C): central point.
Table 4. X-Ray fluorescence analysis of the concentrate.
Species%(w/w)Species%(w/w)
Na2O0.22MnO3.3
MgO0.67ZnO0.31
Al2O30.56SrO0.3
SiO24.5Nb2O53.9
P2O53.2BaO6.7
CaO0.2La2O30.87
TiO4CeO20.76
Fe2O357Pr6O110.24
ZrO20.14Nd2O30.69
PbO0.34Gd2O30.17
ThO20.34S1.9
Table 5. Global desirability (D) and individual desirability results (d%RE and d%Fe)—mathematical modeling experiments.
Rund%REd%Fe1-d%FeD
10.230.390.610.38
20.810.450.550.66
30.670.920.080.24
40.000.520.480.00
50.000.001.000.00
60.000.001.000.00
70.850.380.620.72
80.980.510.490.69
90.720.650.350.50
100.000.001.000.00
110.000.120.880.00
120.471.000.000.00
130.000.400.600.00
140.420.650.350.38
150.490.720.280.37
161.000.810.190.44

