Article

Application of Falcon Centrifuge as a Cleaner Alternative for Complex Tungsten Ore Processing

by
Yann. Foucaud
1,*,
Quentin Dehaine
1,2,
Lev. O. Filippov
1,3,* and
Inna V. Filippova
1,3
1
GeoRessources Laboratory CNRS, Université de Lorraine, F54000 Nancy, France
2
Camborne School of Mines, University of Exeter, Penryn Campus, Cornwall TR10 9EF, UK
3
National University of Science and Technology MISIS, 119049 Moscow, Russia
*
Authors to whom correspondence should be addressed.
Minerals 2019, 9(7), 448; https://doi.org/10.3390/min9070448
Submission received: 15 June 2019 / Revised: 11 July 2019 / Accepted: 17 July 2019 / Published: 19 July 2019
(This article belongs to the Section Mineral Processing and Extractive Metallurgy)

Abstract

:
Scheelite (CaWO4) is one of the main raw material for the production of tungsten. It is usually encountered in skarn deposits where it is commonly associated with other calcium minerals as fluorite, apatite, and calcium silicates. Worldwide, scheelite is upgraded to the chemical grades by direct flotation, but the separation efficiency remains limited due to similar flotation behaviors of scheelite and gangue minerals with fatty acid. The only solutions used to overcome this issue involve high energy consumption or ecotoxic reagents. In the present study, a novel method based on the use of a centrifugal Falcon concentrator was investigated to perform an efficient elimination of gangue minerals and fine particles as well as an acceptable scheelite recovery enabling a decrease of the flotation reagents consumption. The performances of the two types of laboratory Falcon bowls, Falcon UltraFine (UF) and Falcon Semi-Batch (SB), were modeled using the design of experiments (DoE) methodology, which allowed to determine the best operating parameters for each bowl. The separation performances were mainly affected by the rotary speed and the pulp density for the Falcon UF and by the rotary speed and the fluidization pressure for the Falcon SB. Due to the fluidization pressure, the Falcon SB exhibited higher gangue minerals rejection with slightly lower recoveries than the Falcon UF. Overall, the optimized Falcon SB test allowed to reach 71.6%, 22.6%, 17.2%, and 12.6% for scheelite, calcium salts, dense calcium silicates, and light non-calcic silicates respectively while the desliming efficiency reached 98.8%. For comparison purposes, a classical hydrocyclone allowed to attain 89.1%, 89.3%, 79.5%, and 76.5% for scheelite, calcium salts, dense calcium silicates, and light non-calcic silicates respectively while the desliming efficiency reached 52.0%. Theses results can be used reliably to assess the separation performances of an industrial Falcon C which can be regarded, along with Falcon SB, as a sustainable and efficient gangue rejection method for complex W skarn ore, which allows the use of environmentally friendly reagents during downstream flotation stages.

1. Introduction

1.1. Challenges in Tungsten Ore Processing

In the global economy, tungsten (W) displays a high economic importance combined with a high supply risk [1,2,3], which impelled the European Union to classify it as a critical metal [3]. It has few efficient substitutes and still exhibits poor recycling rates due to difficulties in the W recycling processes [1,2]. Hence, primary tungsten extraction still represents the major source of this strategic metal in manufactured products, including alloys, supra-alloys, and tungsten carbide [2]. Scheelite (CaWO4) and wolframite ((Fe,Mn)WO4) are the two main W-bearing minerals exploited for primary tungsten extraction. On the one hand, wolframite usually forms coarse crystals in quartz-veins deposits, which are processed by classical gravity, magnetic, and occasionally froth flotation methods [4,5]. On the other hand, scheelite is mainly encountered in skarn deposits, which account for more than 40% of the global current estimated tungsten reserves [2]. The classification of tungsten as a critical metal resulted in a global resurgence of interest for these ores [5,6,7]. In such deposits, scheelite is found in fine-grained mineralizations disseminated thorough the orebody and commonly associated with other calcium-bearing minerals such as calcite, dolomite, fluorite, and apatite [5,7,8,9]. A significant contrast of densities usually exists between scheelite (6.1 g∙cm−3) and the gangue minerals (2.6–3.4 g∙cm−3), including the calcium-bearing ones, which is suitable for gravity concentration. However, due to the small liberation size (<150 µm), the classical gravity separation methods are usually inefficient and froth flotation is often preferred to process W skarn ores [7,10,11]. Fatty acids, particularly sodium oleate, are widely used as collectors for scheelite flotation considering their low cost, environmental friendliness, and high efficiency [7,12,13]. However, separation of calcium-bearing minerals by flotation with fatty acids is very difficult due to the tendency of these collectors to chemisorb onto the surface calcium atoms [14,15,16]. The gangue calcium minerals often contain elements such as P, F, C, and Si that are highly penalizing either for the hydrometallurgy process of the scheelite concentrates or for the final W product [2,17]. Therefore, it is crucial to eliminate these minerals during mineral processing. Though new fatty acids formulations allowed to enhance significantly the separation contrast [12], an acceptable flotation selectivity cannot be attained without either a high energy consumption—e.g., using the Petrov’s process that consists in heating the pulp to 80 °C [18]—or using ecotoxic reagents as lead-benzohydroxamic acid (Pb-BHA) complexes [19,20]. Thus, finding efficient, low cost, and environment friendly processes to beneficiate W-skarn ores is a real challenge for the next decades.

1.2. Enhanced Gravity Concentration Using Centrifugal Separators

Gravity concentration techniques are simple, low costs, and environmental friendly mineral processing techniques since no chemical reagents are needed [21]. Over the past few decades, the necessity of processing more complex ores displaying finer liberation meshes resulted in a decrease of the overall efficiency of classical gravity separation methods [5]. Thus, gravity has been progressively replaced by flotation in processing plants, which demonstrates better performances for the processing of fine-grained ores [5,7]. Nevertheless, flotation also has its limitations, in particular when the minerals which must be separated exhibit similar surface properties, as mentioned before in the case of skarn ores.
Enhanced gravity separators such as Falcon concentrators, which use additional centrifugal force, have been specifically developed to process fine to ultrafine particles, down to 3 µm [22,23,24]. Falcon concentrators can be used successfully for recycling processes [25,26] as well as for mine tailings reprocessing [27,28] that are key approaches to improve environmental outcomes [29]. Developed in the 1980s by Steve McAlister [30], such separators consist in a bowl capable of spinning at high “G” force, enabling the density separation of fine particles [22,24]. The bowl can be fluidized to avoid compaction and to remove light particles from the concentration zone (Falcon SB), while the Falcon UltraFine (UF) bowl, specifically designed to recover very fine particles, is not fluidized. Rotary speed, pulp density, feed flowrate, and fluidization pressure (for the Falcon SB only) are the main operating parameters involved in the separation [27,28,31,32,33,34]. Falcon concentrators are operated in semi-batch mode but, at industrial scale, continuous Falcon concentrators (Falcon C) can process continuously up to 100 t/h of ore with high feed pulp density (up to 45 wt %) [24]. Besides, semi-batch-operated Falcon concentrators (UF and SB) can be used reliably to assess the separation performances of Falcon C and, hence, to demonstrate the viability of the process at industrial scale [35]. Moreover, the Falcon UF as well as the industrial Falcon C do not require wash water, reducing further operating cost and increasing the environment friendliness of this processing method.
Recently, authors demonstrated that Falcon concentrators, as other centrifugal separators, allow to eliminate efficiently the fine particles (−10 µm), also called slimes [28]. Desliming, which is recommended for the froth flotation stage since fine particles (−10 µm) are known to disturb the process, is usually performed using hydrocyclones. These apparatus operate a particle-size-based separation and do not usually concentrate the dense minerals, even if a pre-concentration of dense minerals in the underflow is sometimes observed [36]. This work investigates the use of a Falcon concentrator prior to flotation to perform both a pre-concentration and a desliming stage on a W-skarn ore. The main objective of this study is to propose an optimized Falcon separation prior to flotation to reject the penalizing gangue minerals and, as a side objective, to deslime the ore. Such developments would lead to the reduction of the overall environmental impacts of skarn ore processing by allowing the use of cleaner reagents—i.e., fatty acids—and by decreasing the tonnage processed by flotation and, consequently, the reagents consumption.

2. Material and Methods

2.1. Materials

The ore used in this work is a W-skarn from the Tabuaço deposit (Northern Portugal). It is mainly composed of silicates (85 wt %), mostly calcium-bearing dense silicates (vesuvianite, zoisite, and grossular) and, to a lesser extent, non-calcic light silicates such as feldspars and quartz [9]. The remaining fraction (15 wt %) comprises fluorite (11 wt %), apatite (3 wt %), and scheelite (1 wt %) [9]. The global mineralogical assemblage can be divided into four different mineral groups displaying specific density ranges (Table 1). Assuming that all minerals contained in each density range behave similarly during the separation, the separation performances are estimated using one proxy by minerals group.
The light silicates fraction is dominated by K-feldspar [9], which displays a density very similar to those of other light silicates such as quartz and Na-feldspar (Table 1). Therefore, the potassium oxide (K2O) content can be used as a proxy to estimate the separation performances for this group of minerals. The gangue calcium-bearing salts group contains apatite and fluorite (Table 1), the elimination of which is crucial to improve the downstream flotation process. These minerals have very close densities (Table 1) and their elimination can be approximated using the phosphorous oxide (P2O5) content in the sample, apatite being the only P-bearing mineral in the ore [9]. The dense silicates group comprises pyroxenes, garnets, vesuvianite, and zoisite, which all contain iron and calcium [9]. To assess the rejection performances for this mineral group, the iron oxide (Fe2O3) content can be used as these minerals are the only Fe-bearing minerals in the Tabuaço ore [9]. Finally, the W content can be used to quantify scheelite recovery as no other W-bearing mineral was reported in this ore [9]. Although most of the clay minerals reported contain potassium and iron, they can be classified as light silicates since their densities are close to 2.6. Considering the small amounts of phyllosilicates in the ore, their contribution in terms of iron can be neglected [9].
The samples were crushed in three successive jaw crushers and a gyratory crusher to produce a −4 mm fraction. To avoid any over-grinding, the ground material was sieved and only the +150 µm material was then fed to a ball mill to reach the liberation size, estimated between 150 and 200 µm by optical microscopy. As the desliming efficiency of the Falcon has been investigated, the feed, corresponding to the −150 µm product, was not deslimed prior to the tests. The particle size distribution and WO3, P2O5, K2O, and Fe2O3 distributions in the Falcon feed are presented in Figure 1. Scheelite is mostly distributed in the finest fractions (−100 + 44 µm) with an average grade of 1.0% WO3. The studied major oxides display similar size distributions which roughly follow the weight distribution, although the dense silicates are more distributed in the fine fractions while the light silicates are more distributed in the coarse fractions (Figure 1)

2.2. Chemical Analyzes

Representative aliquots were analyzed by energy dispersive X-ray fluorescence spectroscopy (ED-XRF) using a Niton™ XL3t (Thermo Scientific, Waltham, MA, USA) portable analyzer to measure the W, K, Fe, and P contents and calculate the WO3, K2O, Fe2O3, and P2O5 contents and their recoveries used as proxies in this work. Results were calibrated using standards analyzed by ICP-AES/ICP-MS at the Service d’Analyses des Roches et des Minéraux (SARM-CNRS, Nancy, France).

2.3. Falcon Tests

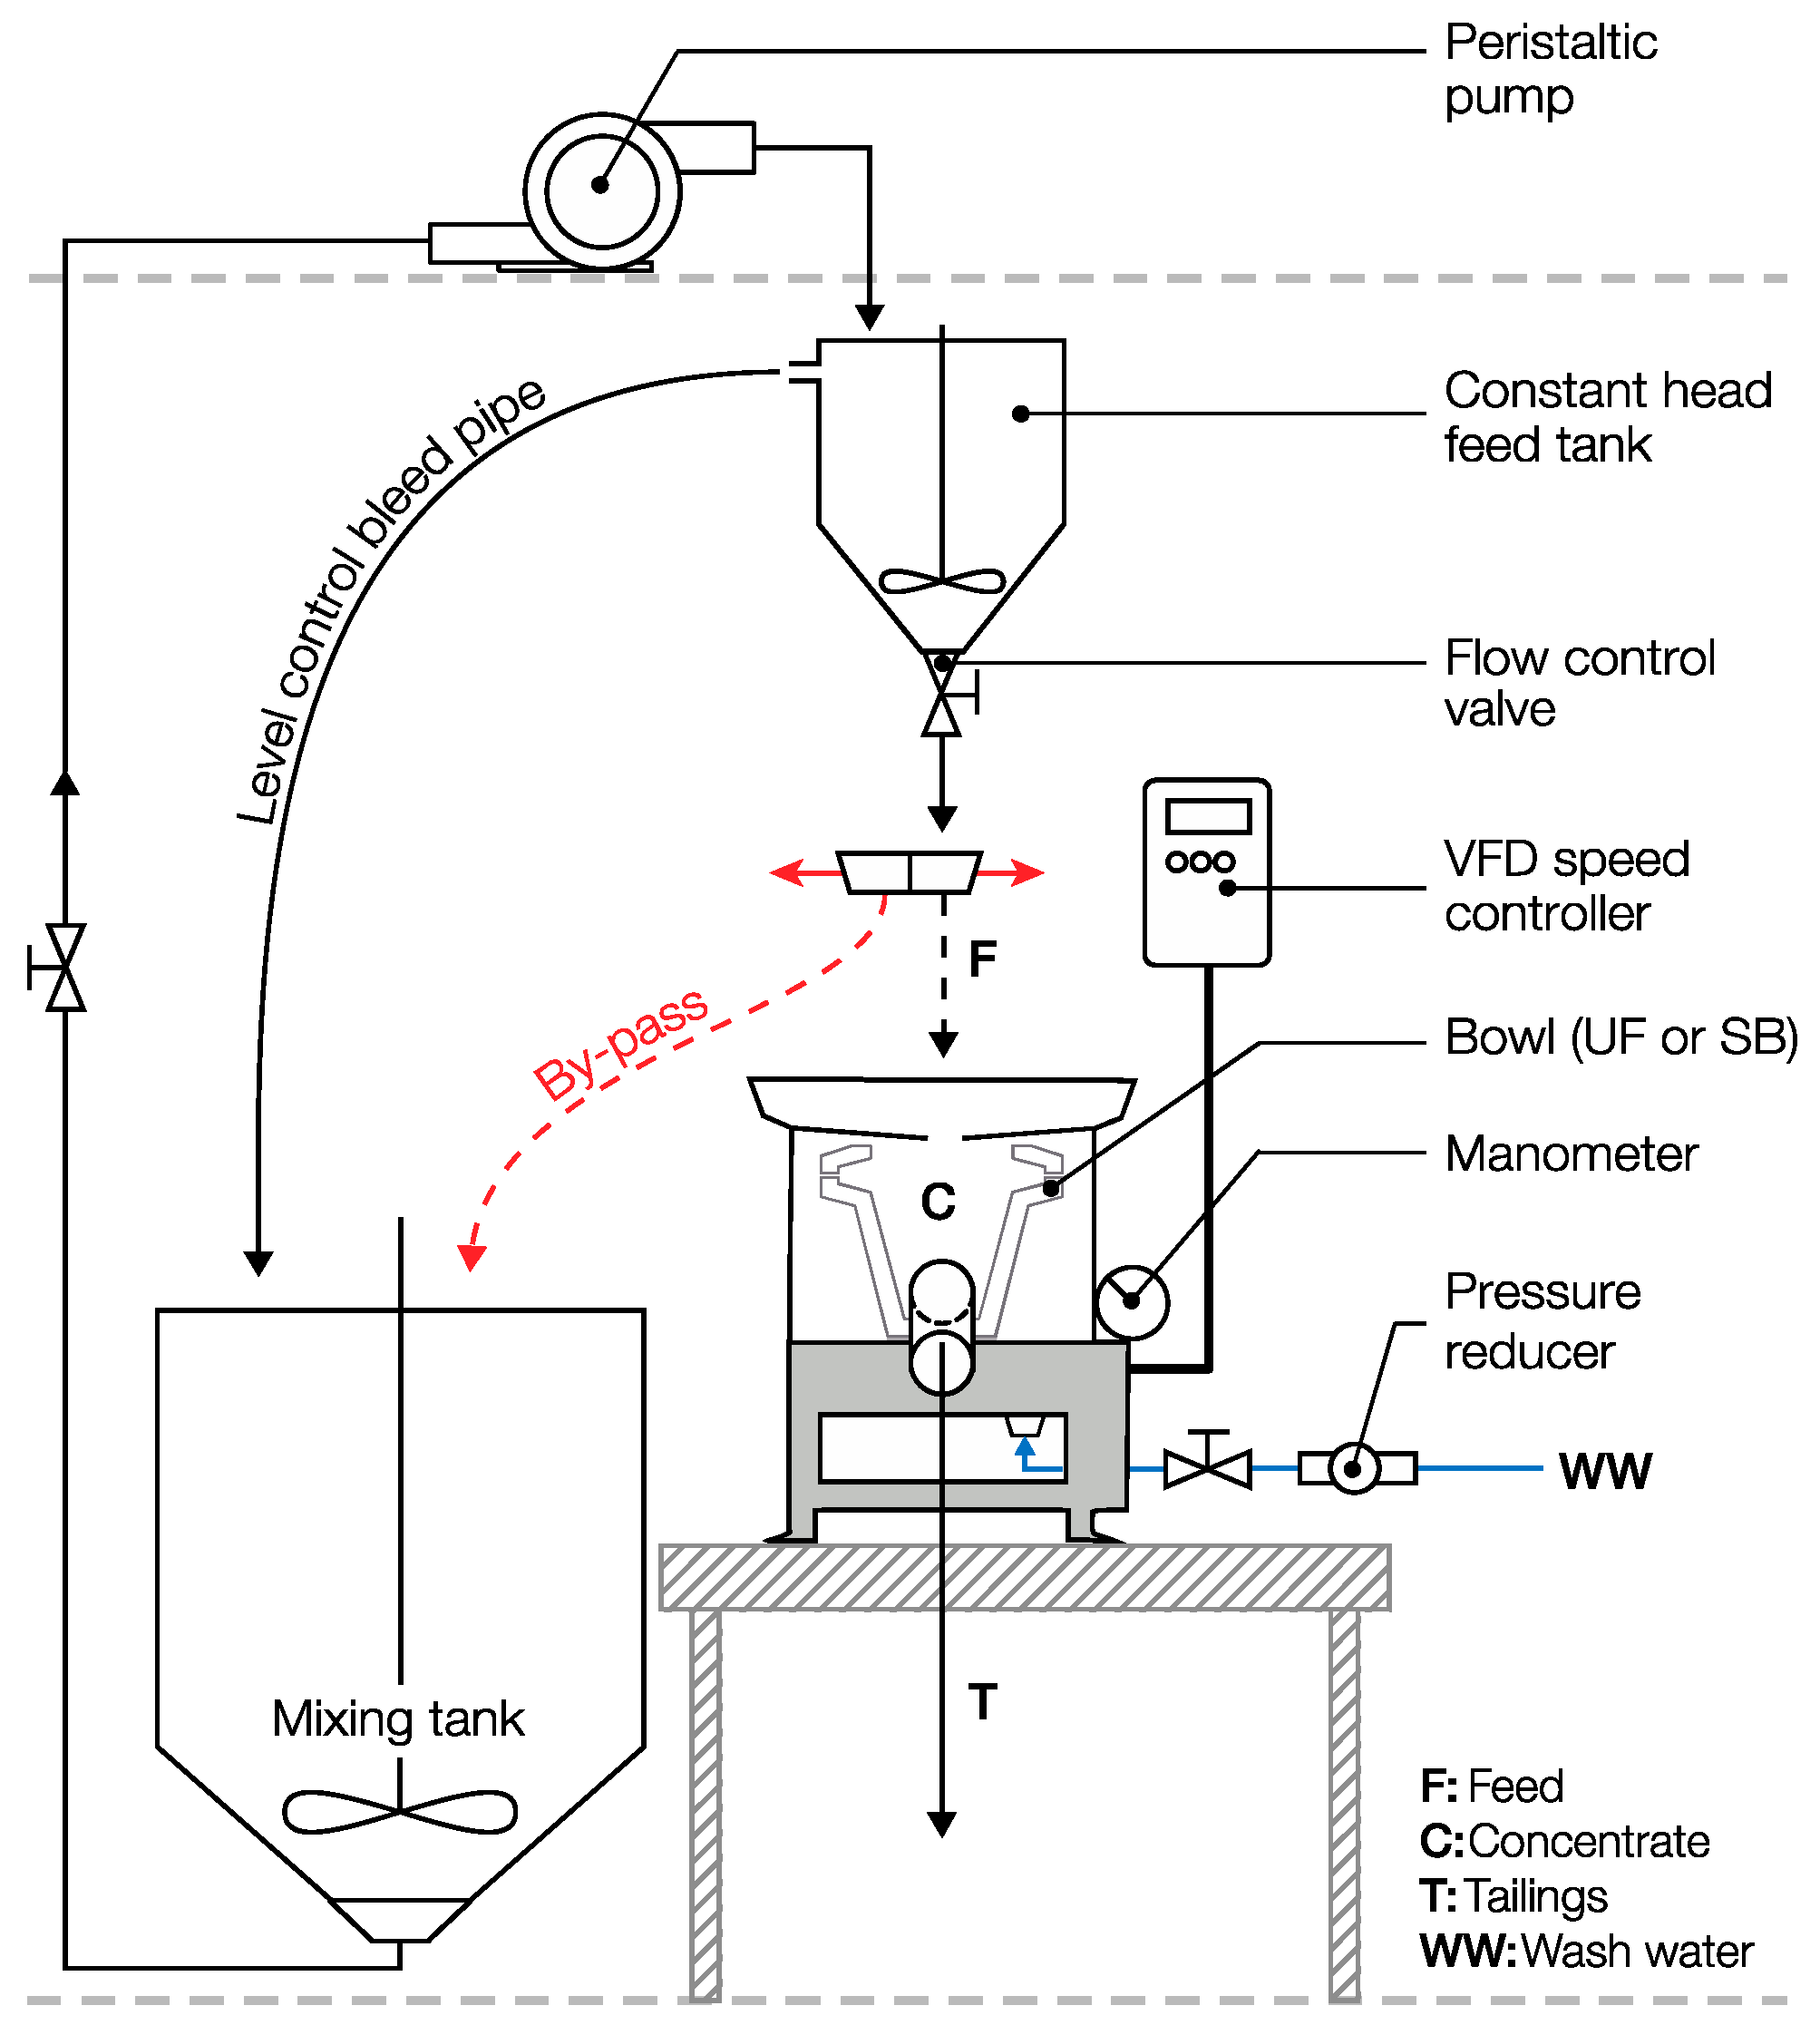
The Falcon concentrator used in this work was a Falcon L40 laboratory model (Sepro Mineral Systems, Vancouver, BC, Canada). Tests were performed with the two bowl types, i.e., the 4” smooth-walled Falcon UF bowl and the Falcon SB bowl, to compare their efficiency. During the tests, the feed slurry was kept homogeneous and the feed flowrate, called pulp flowrate hereafter, maintained constant (Figure 2). In addition, a by-pass was placed at the output of the feed tank to allow operating in closed circuit during feed preparation, for pulp density adjustment and flowrate control. Feed dry weight was set at 500 g for both Falcon UF and Falcon SB, based on preliminary saturation tests which allowed to set the maximum feed weight to work with to avoid saturation of the bowl [28].

2.4. Hydrocyclone Test

To compare the desliming efficiency of Falcon to that of a classical hydrocyclone, a representative sample was selected and was deslimed using a 50-mm hydrocyclone. A vortex finder of 14 mm and an apex aperture of 5 mm was used, with a theoretical cut size of 10 µm. The hydrocyclone was fed at a constant pressure of 2 bar and a constant pulp flowrate of 20 L∙min−1 with a pulp density of 5 wt %. The particle size distributions of the overflow and the underflow were analyzed on representative aliquot sampled on each product.

2.5. Design of Experiments Method

The design of experiments (DOE) methodology allows to study the influence of k parameters at l levels for one or several response(s) [37] and to model these responses from the studied parameters. Some design of experiments such as Box–Behnken and Central Composite Design are suitable for parameter optimization by developing second-order models:
y = a 0 + i = 1 k a i x i + i = 1 k 1 j = i + 1 k a i j x i x j + i = 1 k 2 j = i + 1 k 1 l = j + 1 k a i j l x i x j x l + + a i j l n x i x n + i = 1 k a i i x i 2 + ε
where the xi are the measurable variables (factors); a0, ai, aij.., and aii are the constant, linear, interaction, and quadratic model coefficients, respectively; and ε is a residual. The coefficients and the residual are determined using the least square method on the experimental results [37,38].
In this paper, the DOE methodology has been used to gain understanding on the influence of the operating parameters on the separation efficiency, for the two types of Falcon bowls (UF and SB), and to optimize the separation in terms of gangue minerals rejection. Hence, Central Composite Designs (CCD) with two centered points were generated using the JMP® statistical software (SAS institute) D-optimal design tool, as per the procedures in [38]. Through the design of experiments, the influences of the rotary speed, the pulp flowrate and the solid pulp density, plus the fluidization pressure for the Falcon SB only, were investigated in order to optimize the Falcon separation (Table 2). The levels were defined in accordance with results of preliminary tests and the operating range recommended by the manufacturers. The rotary speed could only vary between 20 and 78 Hz for the Falcon L40, pulp density was chosen as low as possible (2% being the lowest reastically possible pulp density), the feed flowrate levels were chosen as low as possible to avoid settling in the feed and as high as possible to avoid the feed to overflow from the Falcon feeder, and the levels for the fluidization pressure where chosen in accordance with the manufacturer guidance with regard to the sample maximum particle size. Since the chosen levels defined a large experimental domain, the axial value of the CCD was set to 1, which induced that each axial point was located on one boundary of the domain.
The main objective was to use the Falcon concentrator as a pre-concentrating apparatus, to produce a W pre-concentrate from a complex scheelite-containing ore to feed a fatty-acid flotation circuit. An optimized elimination of gangue minerals and fine particles (−10 µm) was required to ensure the selectivity of the subsequent flotation process. Therefore, K2O, Fe2O3, and P2O5 recoveries were used as indicators to estimate the rejection of the corresponding gangue mineral groups. The WO3 recovery characterized the separation performance in terms of target mineral recovery, and was kept as high as possible. Finally, to compare the desliming action of Falcon concentrators to that of a classical hydrocyclone, the ‘desliming efficiency’ (Deff) was defined as the ratio of the amount of −10 µm particles in the tailings over the amount of −10 µm particles in the feed. In total, five performance indexes were considered. Overall, moderate and tight objectives were defined for the Falcon separation indexes—i.e., the five studied responses—that are detailed in Table 3. The tight criterion, if reached, would represent a significant improvement in skarn ore processing since high calcium gangue minerals and fine particles eliminations would increase tremendeously the efficiency of the flotation process while reducing reagents consumption.

3. Results and Discussion

3.1. Falcon UF

3.1.1. Design of Experiments Results

The experimental results, summarized in Table S1 in Supporting Information (SI), were used to determine the second order response models, after the equation (1). These models represent the expression of the studied responses (WO3 recovery, K2O recovery, P2O5 recovery, Fe2O3 recovery, and Deff) as a function of the codded operating variables. The significance of each developed model was estimated through an analysis of variance (ANOVA), see Table S2 in SI. A first F-test was conducted on the models, with all the factors and their interactions. The critical F-value for the 0.05 significance level were calculated using the degrees of freedom (DF) of the models (10) and the residuals (5) for the first run, which is F(10,5) = 4.74. The significance of each factor was assessed by comparing the calculated F-value for each factor to the critical F-value. For each model, the non-significant factors were eliminated from the models one by one, the coefficients were re-calculated, and the ANOVA was performed again after each elimination. Finally, only the significant factors were included in the final models and the ANOVA was conducted again on the final models to assess their significance. The calculated F-values for each final model, given in Table S2 in SI, are significantly higher than the critical F-values, which are, for a 0.05 significance level, F(3,12) = 3.49 for the RW, RK, and RFe models; F(2,13) = 3.81 for the RP model; and F(1,14) = 4.60 for the Deff model, inducing low p-values.
The accuracy of the models was assessed by the relationships between the observed experimental values and the predicted results (Table 4) The correlation coefficient (R2) and the root-mean-square errors (RMSE) were used to illustrate the accuracy and the strength of these relationships (Table 4). The correlation coefficients are quite high for the gangue minerals recoveries (>0.8) but significantly lower for the WO3 recovery and the desliming efficiency for which R2 = 0.5801 and R2 = 0.5435, respectively, indicating that the models accuracy is relatively low.

3.1.2. Interpretation of the Models

For each model, a Student’s t-test was performed on each coefficient to assess the significance of their impact on the results. The coefficients, their standard errors, and their significance (p-value) are summarized in Table 5. All the non-significant factors have been eliminated to obtain the final models, which induces that all the remaining factors have a p-value below 0.05—i.e., the chosen significance level.
The final models can be expressed as a function of the coded variables
R W = 87.52 3.90 x 1 + 3.89 x 2 7.47 x 1 2
R K = 39.21 5.62 x 1 + 10.08 x 2 3.71 x 3
R P = 49.26 8.08 x 1 + 10.81 x 2
R Fe = 45.41 6.58 x 1 + 10.06 x 2 2.89 x 3
D eff = 63.65 6.59 x 2
The WO3 recovery depends significantly on the rotary speed (linear and quadratic terms) and on the pulp density. The rotary speed affects negatively the WO3 recovery for the linear and quadratic terms while the pulp density acts positively on this response. The intercept is high (87.52), which indicates a high WO3 recovery at the center of the experimental domain. As the entrapment of a particle is directly linked to its settling length in the bed [33,34,39,40], scheelite settles probably very fast at the considered operating conditions. The gangue minerals recoveries (proportional to K2O, P2O5, and Fe2O3 recoveries) show similar trends: as the WO3 recovery, they are all affected by a significant negative effect of the rotary speed whereas the pulp density displays a high positive coefficient. The increase of the rotary speed results in the application of a higher G-force and then of a higher cut-off density [33,34], which induces a better rejection of light particles as well as, to a lesser extend, dense particles. The effect of the pulp density can be linked to the differential settling, which is the main separation mechanism occurring in the bowl. When the pulp density is too high, forced settling of light particles may occur, attributed to the superposition of particles with different densities in the flowing film [41,42]. It affects the sedimentation length of both light and dense particles inducing that the light ones are trapped while they should not be. Moreover, the flowrate acts negatively on the K2O and Fe2O3 recoveries. This result can be attributed to the presence of phyllosilicates in light silicates and dense silicates groups, since their characteristic shape can result in stronger entrainment phenomenon [41,42,43]. Moreover, it can also be linked to the erosion mechanisms in the bowl that are undoubtedly stronger for higher pulp flowrates and might affect more significantly the light minerals [28]. Overall, for the gangue mineral recoveries, the pulp density has a higher effect in absolute value than the rotary speed, indicating a strong control of the settling mechanisms on the separation. The coefficients have the same magnitude between the three gangue mineral groups but some differences can be discussed. The constant term, indicating the value of the response at the center of the domain, is the lowest for the light silicates (39.21), the highest for the calcium minerals (49.26), and intermediate for the dense silicates (45.41). However, following Table 1, the dense silicates display higher densities than the calcium minerals and, then, their constant term should be higher. This phenomenon could be attributed to the existence of iron-bearing silicates (biotite, iron-bearing chlorites, iron-bearing clay minerals, etc.) that are lighter than the calcium minerals. Also, the densities considered for the calcium minerals could be inacurate, as they have been measured for ideal minerals, from reference tables. The negative coefficient affecting the rotary speed is the lowest for the light silicates (−5.62), the highest for the calcium minerals (−8.08), and intermediate for the dense silicates (−6.58), in absolute values, which is in accordance with the previous discussion. Additionally, the recovery is low at the center of the domain for the light silicates, which results in a low term affecting the rotary speed for the light silicates. The same trend is followed by the other two responses, as the rotary speed is the main parameter influencing the density cut [34].
The desliming efficiency is significantly affected by a negative effect of pulp density. It means that a high pulp density induces the trapping of fine particles in the concentrate bed, which could be attributed to the forced settling occurring for fine particles as well as for light particles. Moreover, it could also be linked to the second separation mechanism occurring in the bowl, namely the erosion of the concentrate bed. Indeed, with 500 g of feed material, once the concentrate bed is formed, erosion phenomenon are likely to occur as described by Dehaine et al. [28]. The same authors showed that the erosion phenomenon is linked to the shear forces induced by the flow of the pulp at the surface of the concentrate bed [28]. Consistently, the shear forces are higher when the pulp density increases due to the interaction between particles and the concentrate bed surface, that are not taken into account in the current physical separation model of the Falcon yet. Also, the suggested model for the lift forces strongly depends on the particle size which results in a higher erosion rate for coarse particles [28]. This phenomenon could explain the lower desliming efficiency when the pulp density is increased. However, regarding the accuracy of the model, the interpretations are difficult.

3.1.3. Optimization and Validation

Following the models for the different responses, the iso-response graphs presented in Figure 3 display the gangue minerals recoveries as a function of the operating parameters. No iso-response graph and no performance objective were established for Deff as it is affected by only one parameter. Optimum operating conditions were selected based on the models determined previously, through the iso-responses graphs (Figure 3). The areas attaining the moderate performances objectives are indicated in Figure 3a while the tight objectives are attained only for WO3 recovery. None of the studied responses reach an extremum on the domain. The WO3 recovery is maximum at intermediate rotary speed and high pulp density but satisfies the performances objectives in the whole experimental domain. The K2O recovery is minimum at high rotary speed, high pulp flowrate, and low pulp density (Figure 3b–d). The other gangue mineral recoveries (P2O5 and Fe2O3) are minimum at high rotary speed and low pulp density (Figure 3e–h). Since the WO3 recovery attains the performances objectives on the whole experimental domain, the gangue minerals recoveries can be minimized while the WO3 recovery remains higher than 70% (and matches the moderate performances objectives), which however results in WO3 losses: the similar trends followed by the gangue minerals and scheelite induces that a compromise has to be done between the WO3 recovery and the gangue mineral rejection.
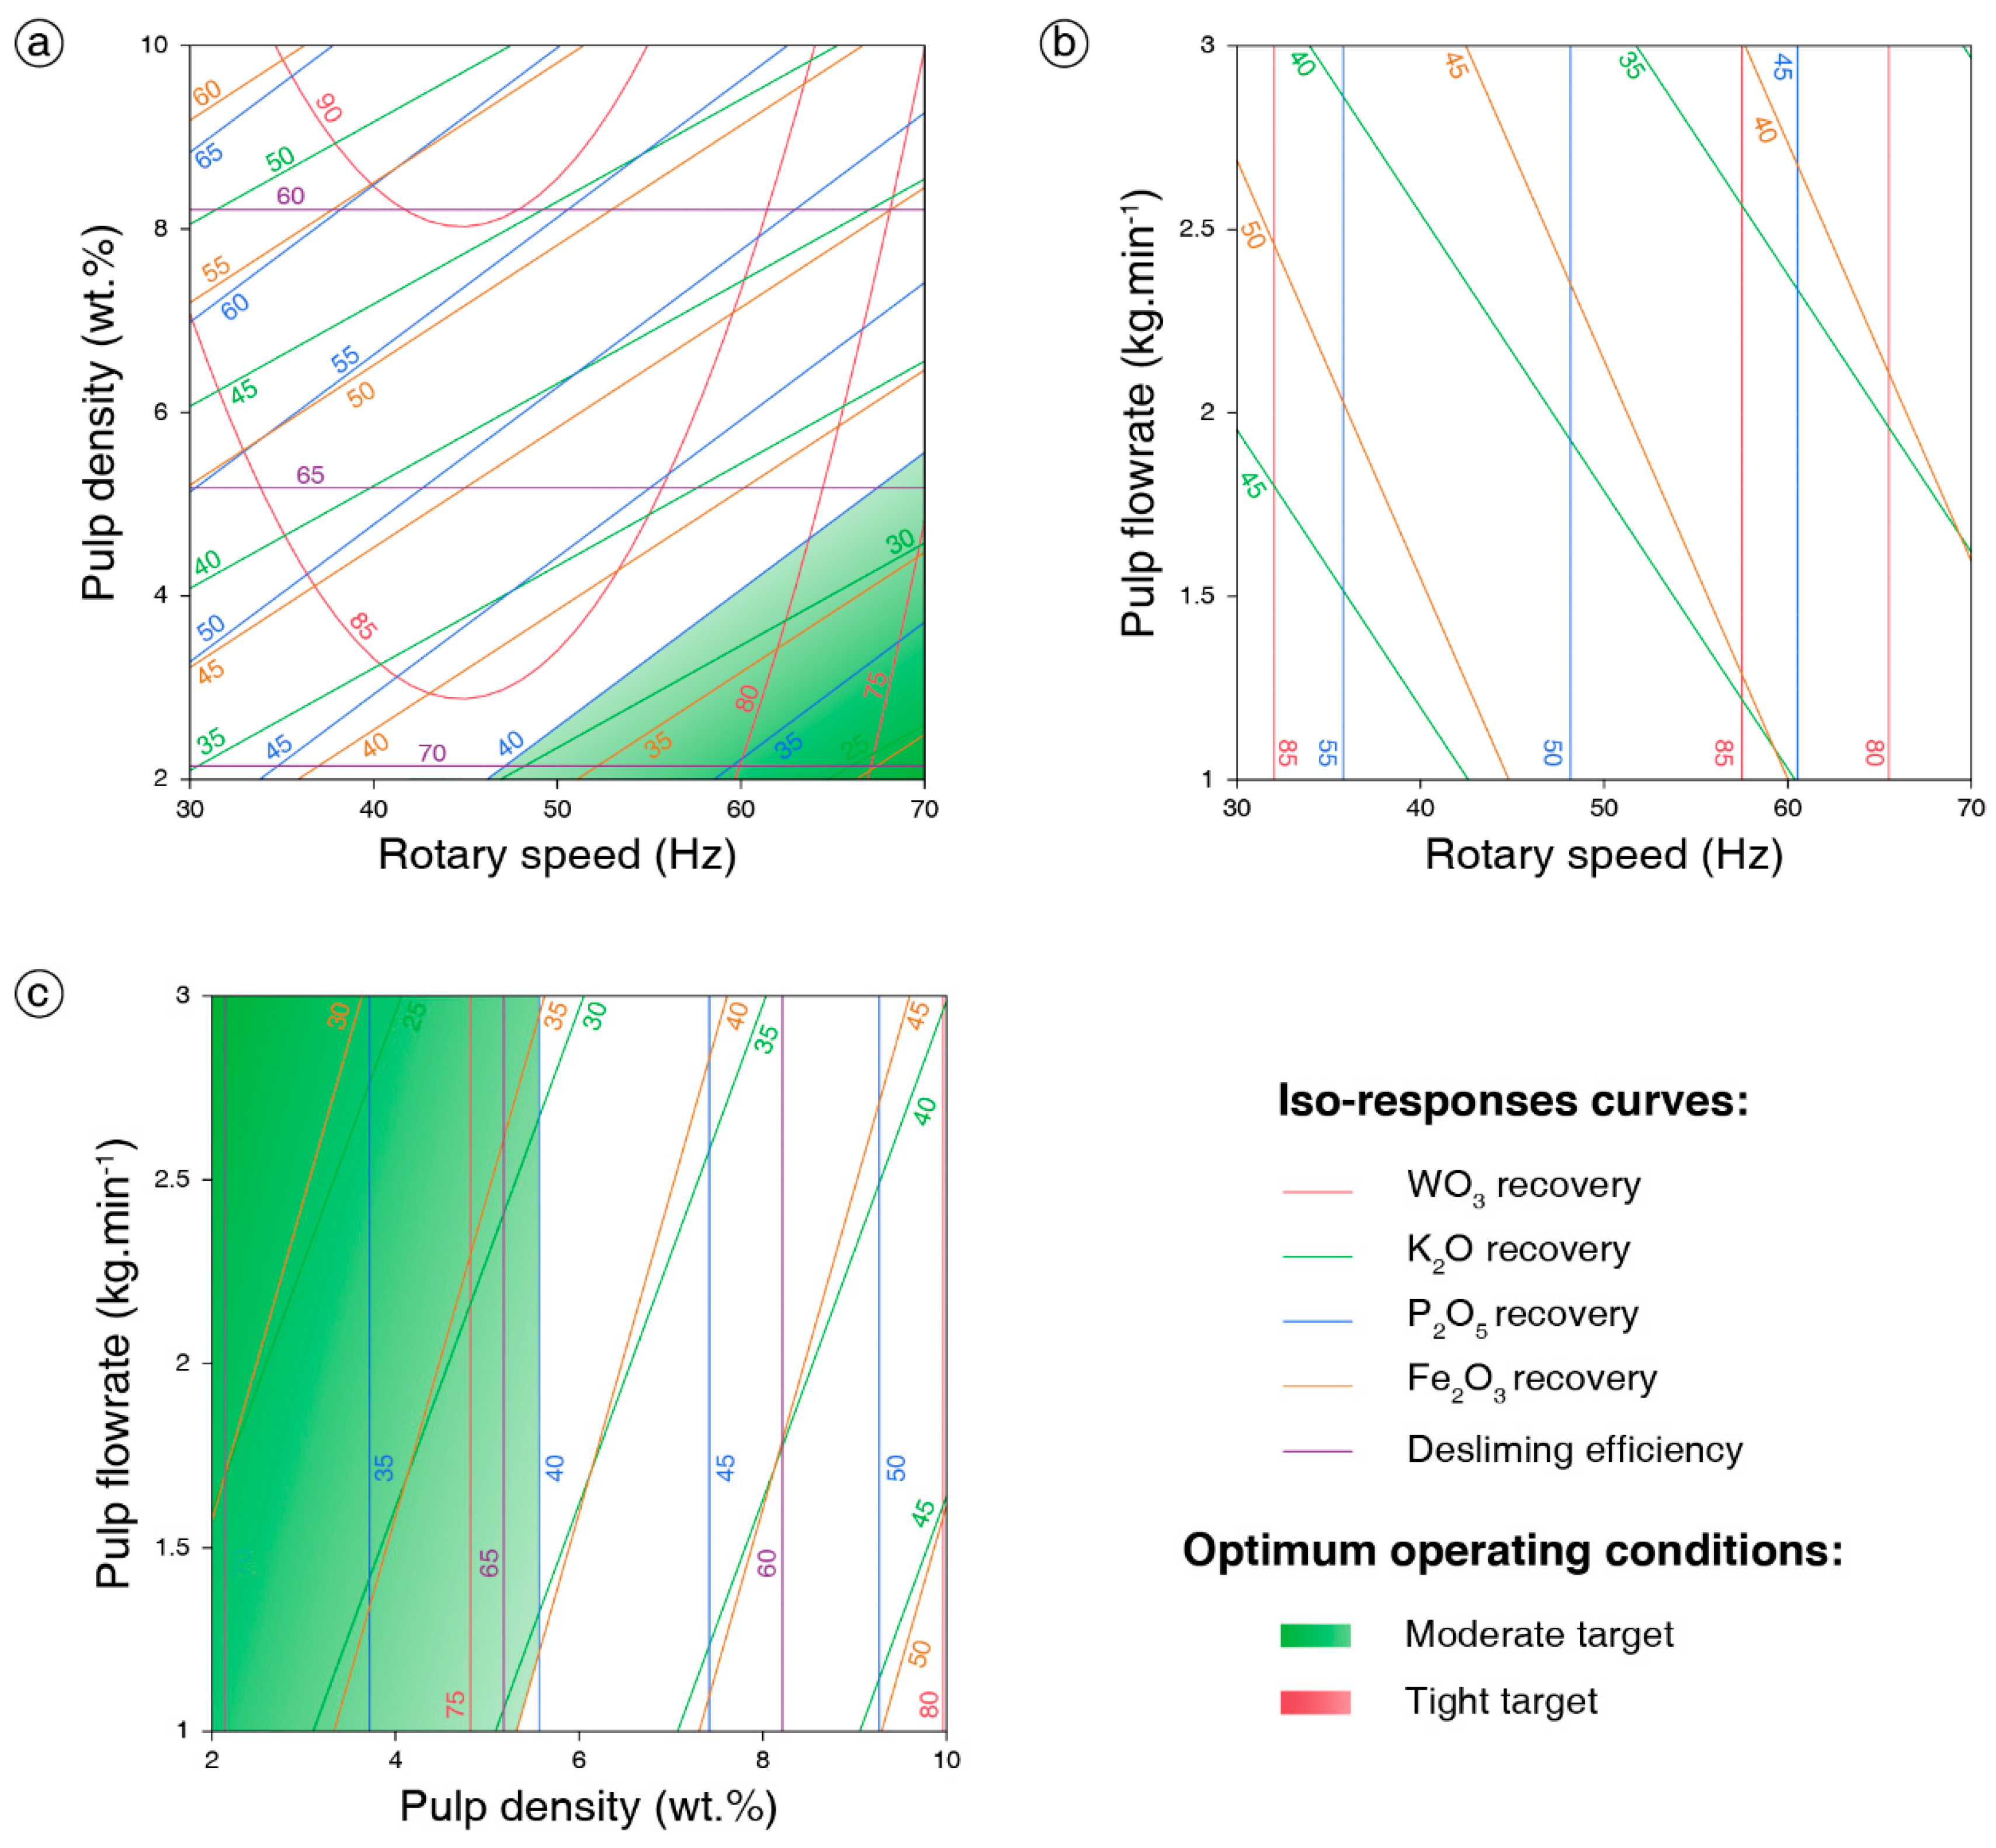
Global iso-responses graphs have been built for the five considered responses as a function of the operating parameters to select the optimum operating conditions taking into account all the responses (Figure 4). Zones corresponding to the operating conditions for which the responses comply with the moderate objective are indicated on the graphs. Thus, the moderate objective can be reached by maximizing the pulp flowrate and the rotary speed (3 kg∙min−1 and 70 Hz, respectively) while minimizing the pulp density (2 wt % solid).
To validate the developed models, a series of tests with the optimized operating conditions was performed. This experience was reproduced 4 times to assess the experimental variability. For each response, the mean and the standard deviation were calculated based on the four reproduced experiences, see Table 6. The experimental standard deviation was also expressed as a percentage of the experimental value. The error between the predicted values and the average obtained values for the studied responses was used to assess the validity of the model. The experimental errors are low, indicating a good reproducibility of the experiments. The errors between the predicted and the observed values are acceptable for most responses (<10%) with the exception of the W recovery.

3.2. Falcon SB

3.2.1. Design of Experiments Results

As for the Falcon UF, the experimental results of the Falcon SB tests (Table S3 in SI) were used to define the second order response functions, after the Equation (1). These functions represent the expression of the responses (WO3 recovery, K2O recovery, P2O5 recovery, Fe2O3 recovery, and Deff) as a function of the operating parameters. The same methodology than for the Falcon UF was applied here. The critical F-value for a 0.05 significance level were calculated using the degrees of freedom (DF) of the models (19) and the residuals (6) for the first run, which is F(19,6) = 3.88. The calculated F-values for each final model, given in Table S4 in SI, are significantly higher than the critical F-values, which are, for a 0.05 significance level, F(5,20) = 2.71 for the RW model and F(2,23) = 3.42 for the RK, RP, and RFe models, and F(3,22) = 3.05, inducing low p-values (Table S4 in SI).
The models accuracies were estimated by the relationships between the observed experimental results and the predicted values. The correlation coefficient (R2) and the root-mean-square errors (RMSE) were used to illustrate the accuracy and the strength of these relationships, see Table 7. The correlation coefficients are very similar for all the minerals recoveries and for the desliming efficiency, around 0.7, which is acceptable.

3.2.2. Interpretation of the Models

A Student’s t-test was performed on each coefficient of each model to assess the significance of their impact on the results. The coefficients, their standard errors, and their significance (t-test) are summarized in Table 8. All the non-significant factors have been eliminated to obtain the final models, which induces that all the presented values have a p-value below 0.05.
The final models are expressed as a function of the coded variables.
R W = 77.33 + 6.57 x 1 3.25 x 2 3.52 x 4 + 4.37 x 1 x 4 7.69 x 4 2
R K = 14.59 + 3.82 x 1 3.61 x 4
R P = 24.58 + 3.87 x 1 4.36 x 4
R Fe = 20.19 + 3.82 x 1 3.52 x 4
D eff = 97.16 2.94 x 1 + 2.02 x 4 4.49 x 1 2
The WO3 recovery depends on the rotary speed, the pulp density, the fluidization pressure (linear and quadratic), and the interaction between the speed and the fluidization pressure. All the coefficients have close absolute values. However, they are negative for the pulp density and for the fluidization pressure (linear and quadratic) but positive for the two other parameters. It induces that the pulp density and the fluidization pressure have a negative effect on the WO3 recovery. In the Falcon SB bowl, the separation depends mainly on two mechanisms: the differential settling in the flowing film [28,33,34,40,44] and the reorganization of the trapped particles in the gutters [45,46]. It can be assumed that, before reaching the gutters, the particles are subject to a differential settling that can be described by the same physical model than for the Falcon UF bowl despite different bowl geometries. Consistently, the rotary speed increases the scheelite recovery as the settling length of scheelite particles is decreased when the G-force is increased. Moreover, a hindered settling phenomenon appears at high pulp density [41,42] resulting in a decrease of the scheelite recovery and then a negative coefficient for the pulp density. The negative coefficient for the fluidization pressure can be attributed to a low selective particles rejection when the fluidization pressure increases, inducing scheelite losses.
The gangue minerals recoveries follow the same trends, due to their similar densities which are also very similar to the scheelite behavior. The rotary speed acts positively while the fluidization pressure acts negatively, roughly with the same absolute values. A high rotary speed induces a non-selective entrapment as it decreases the settling lengths of all the minerals. In the trapping gutters, the fluidization pressure has an opposite direction compared to the gravity force. Hence, the entrapment of a particle in the gutters depends on the force balance between the gravity force, which is a function of the density and the size of the particle, and drag the force induced by the fluidization pressure. This latter, which has been intensively described for Knelson concentrators, is mainly proportional to the particle area [47,48,49,50]. Then, this balance results in a rejection of light particles from the gutters, inducing the negative coefficient for the fluidization pressure on the gangue mineral recoveries. Consistently, the scheelite and the gangue minerals follow very similar trends considering the rotary speed and the fluidization pressure. The absolute values of the coefficients are still different, which can be attributed to their density contrast. It indicates that the scheelite particles are subject to the same force balance and that reaching a better rejection of gangue mineral particles will lead to higher scheelite losses. Overall, the constant terms, as well as the absolute values of the coefficients affecting each operating parameter, can be related with the actual densities of each minerals group.
The desliming efficiency is negatively impacted by the rotary speed (linear and quadratic terms) and positively affected by the fluidization pressure, in the same order of magnitude. The increase of rotary speed leads to the entrapment of fine particles as their settling length is decreased while the fluidization pressure flushes them out from the gutters. The high constant term means that most of the fine particles are rejected with no dependence on the operating parameters in the considered experimental area. The force balance between the gravity force and the fluidization force significantly disfavours the entrapment of fine particles. Indeed, the weight force, responsible for the entrapment of the particle, is correlated to the particle volume and, hence, depends on d3, where d is the particle diameter. The pressure force is mainly related to the particle area that is in contact with the water counter-pressure and should be proportional to the particle surface, whose dependence on the particle size is only at a power of 2 [47,48,49,50].

3.2.3. Optimization and Validation

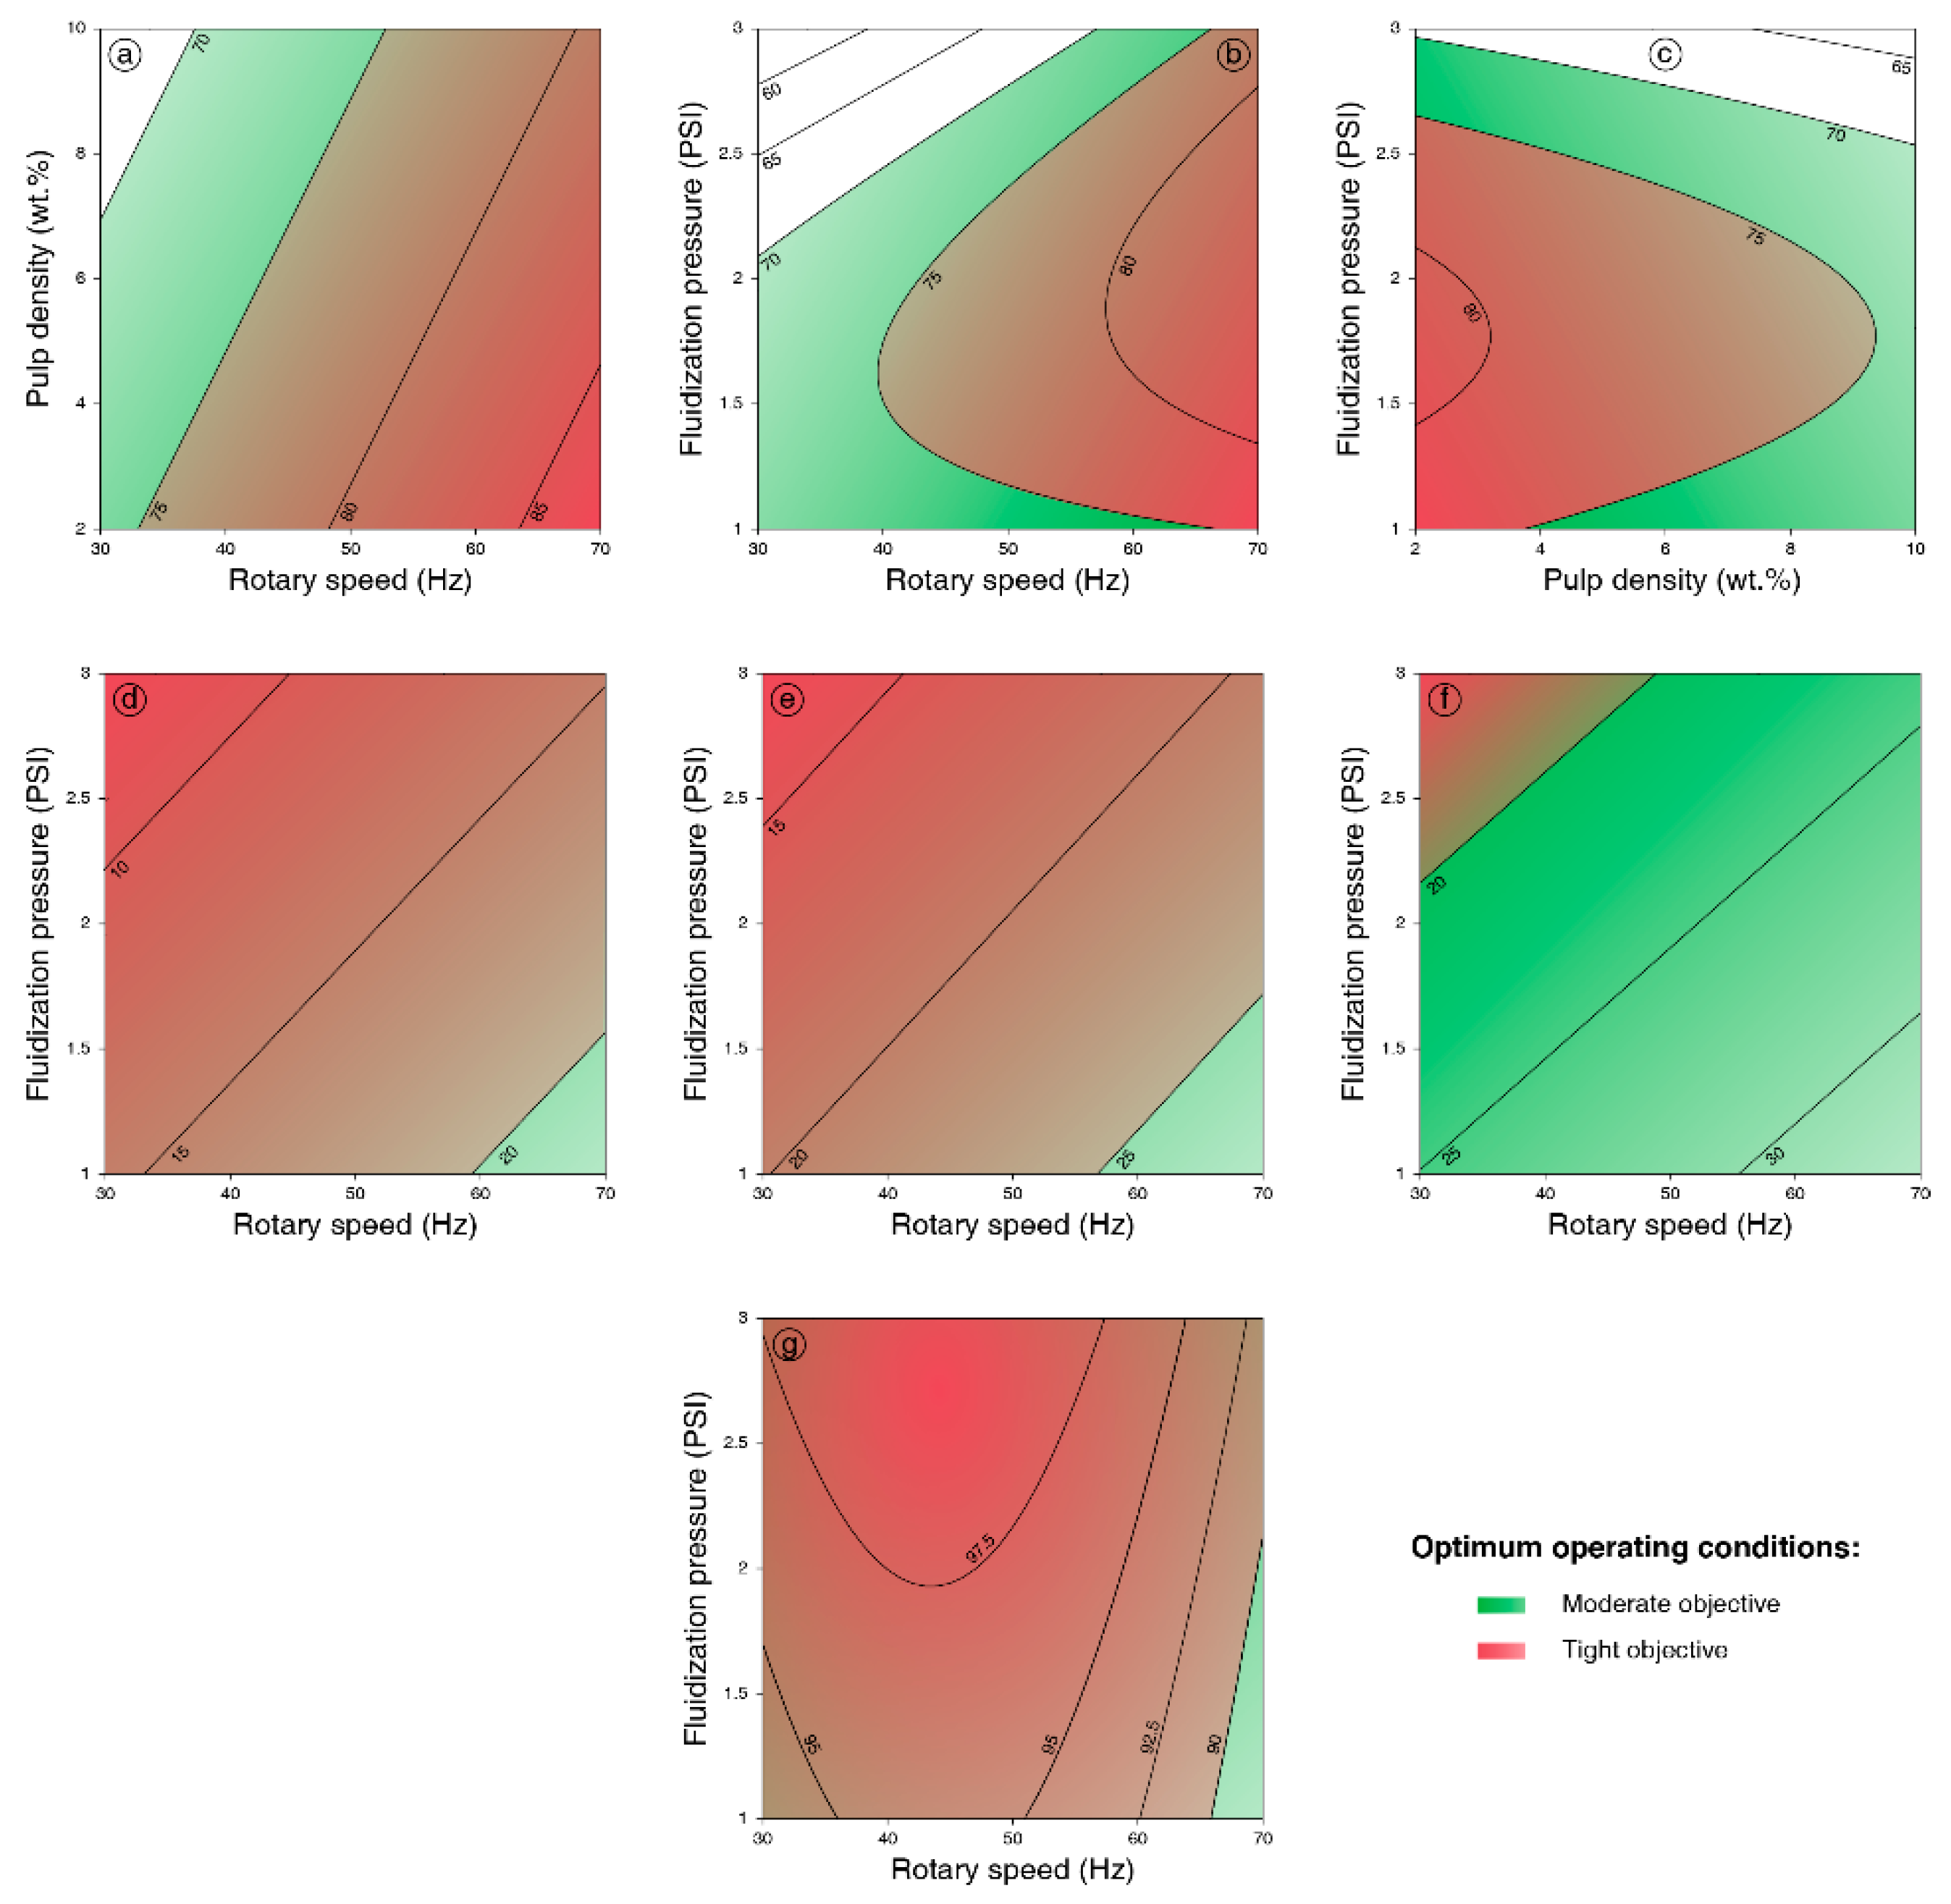
The Falcon SB design yielded more complex models, since, following the equations and the iso-responses graphs (Figure 5), the recoveries of the different minerals, including scheelite, are affected very similarly by the operating parameters. A little loss of recovery is acceptable as the industrial Falcon concentrators are known to be much more efficient than the laboratory-scale Falcon concentrators in terms of recoveries [21,23]. The graphs in Figure 5 present zones corresponding to optimum operating conditions that satisfy the moderate and tight objectives presented in Table 3.
Optimum operating conditions were selected based on the models determined previously and on Figure 6. A compromise had to be made between the WO3 recovery and the WO3 grade. The global objective was to eliminate the gangue minerals that are problematic for flotation, meaning that the gangue minerals recoveries had to be minimized as much as possible. Hence, following the iso-responses graphs (Figure 6), the pulp density should be minimized (2 wt % solid), the fluidization pressure should be maximized (3 PSI) whereas intermediate rotary speed must be defined (58 Hz) to reach a compromise between WO3 recovery, gangue minerals recoveries, and desliming.
As for the Falcon UF, a test with the optimized operating parameters was performed and reproduced seven times to assess the experimental variability (Table 9). The experimental errors are quite low, indicating a good reproducibility of the experiments. The errors between the predicted and the observed values are very low, indicating a good accuracy of the five developed models.

3.3. Discussion on Experimental Results

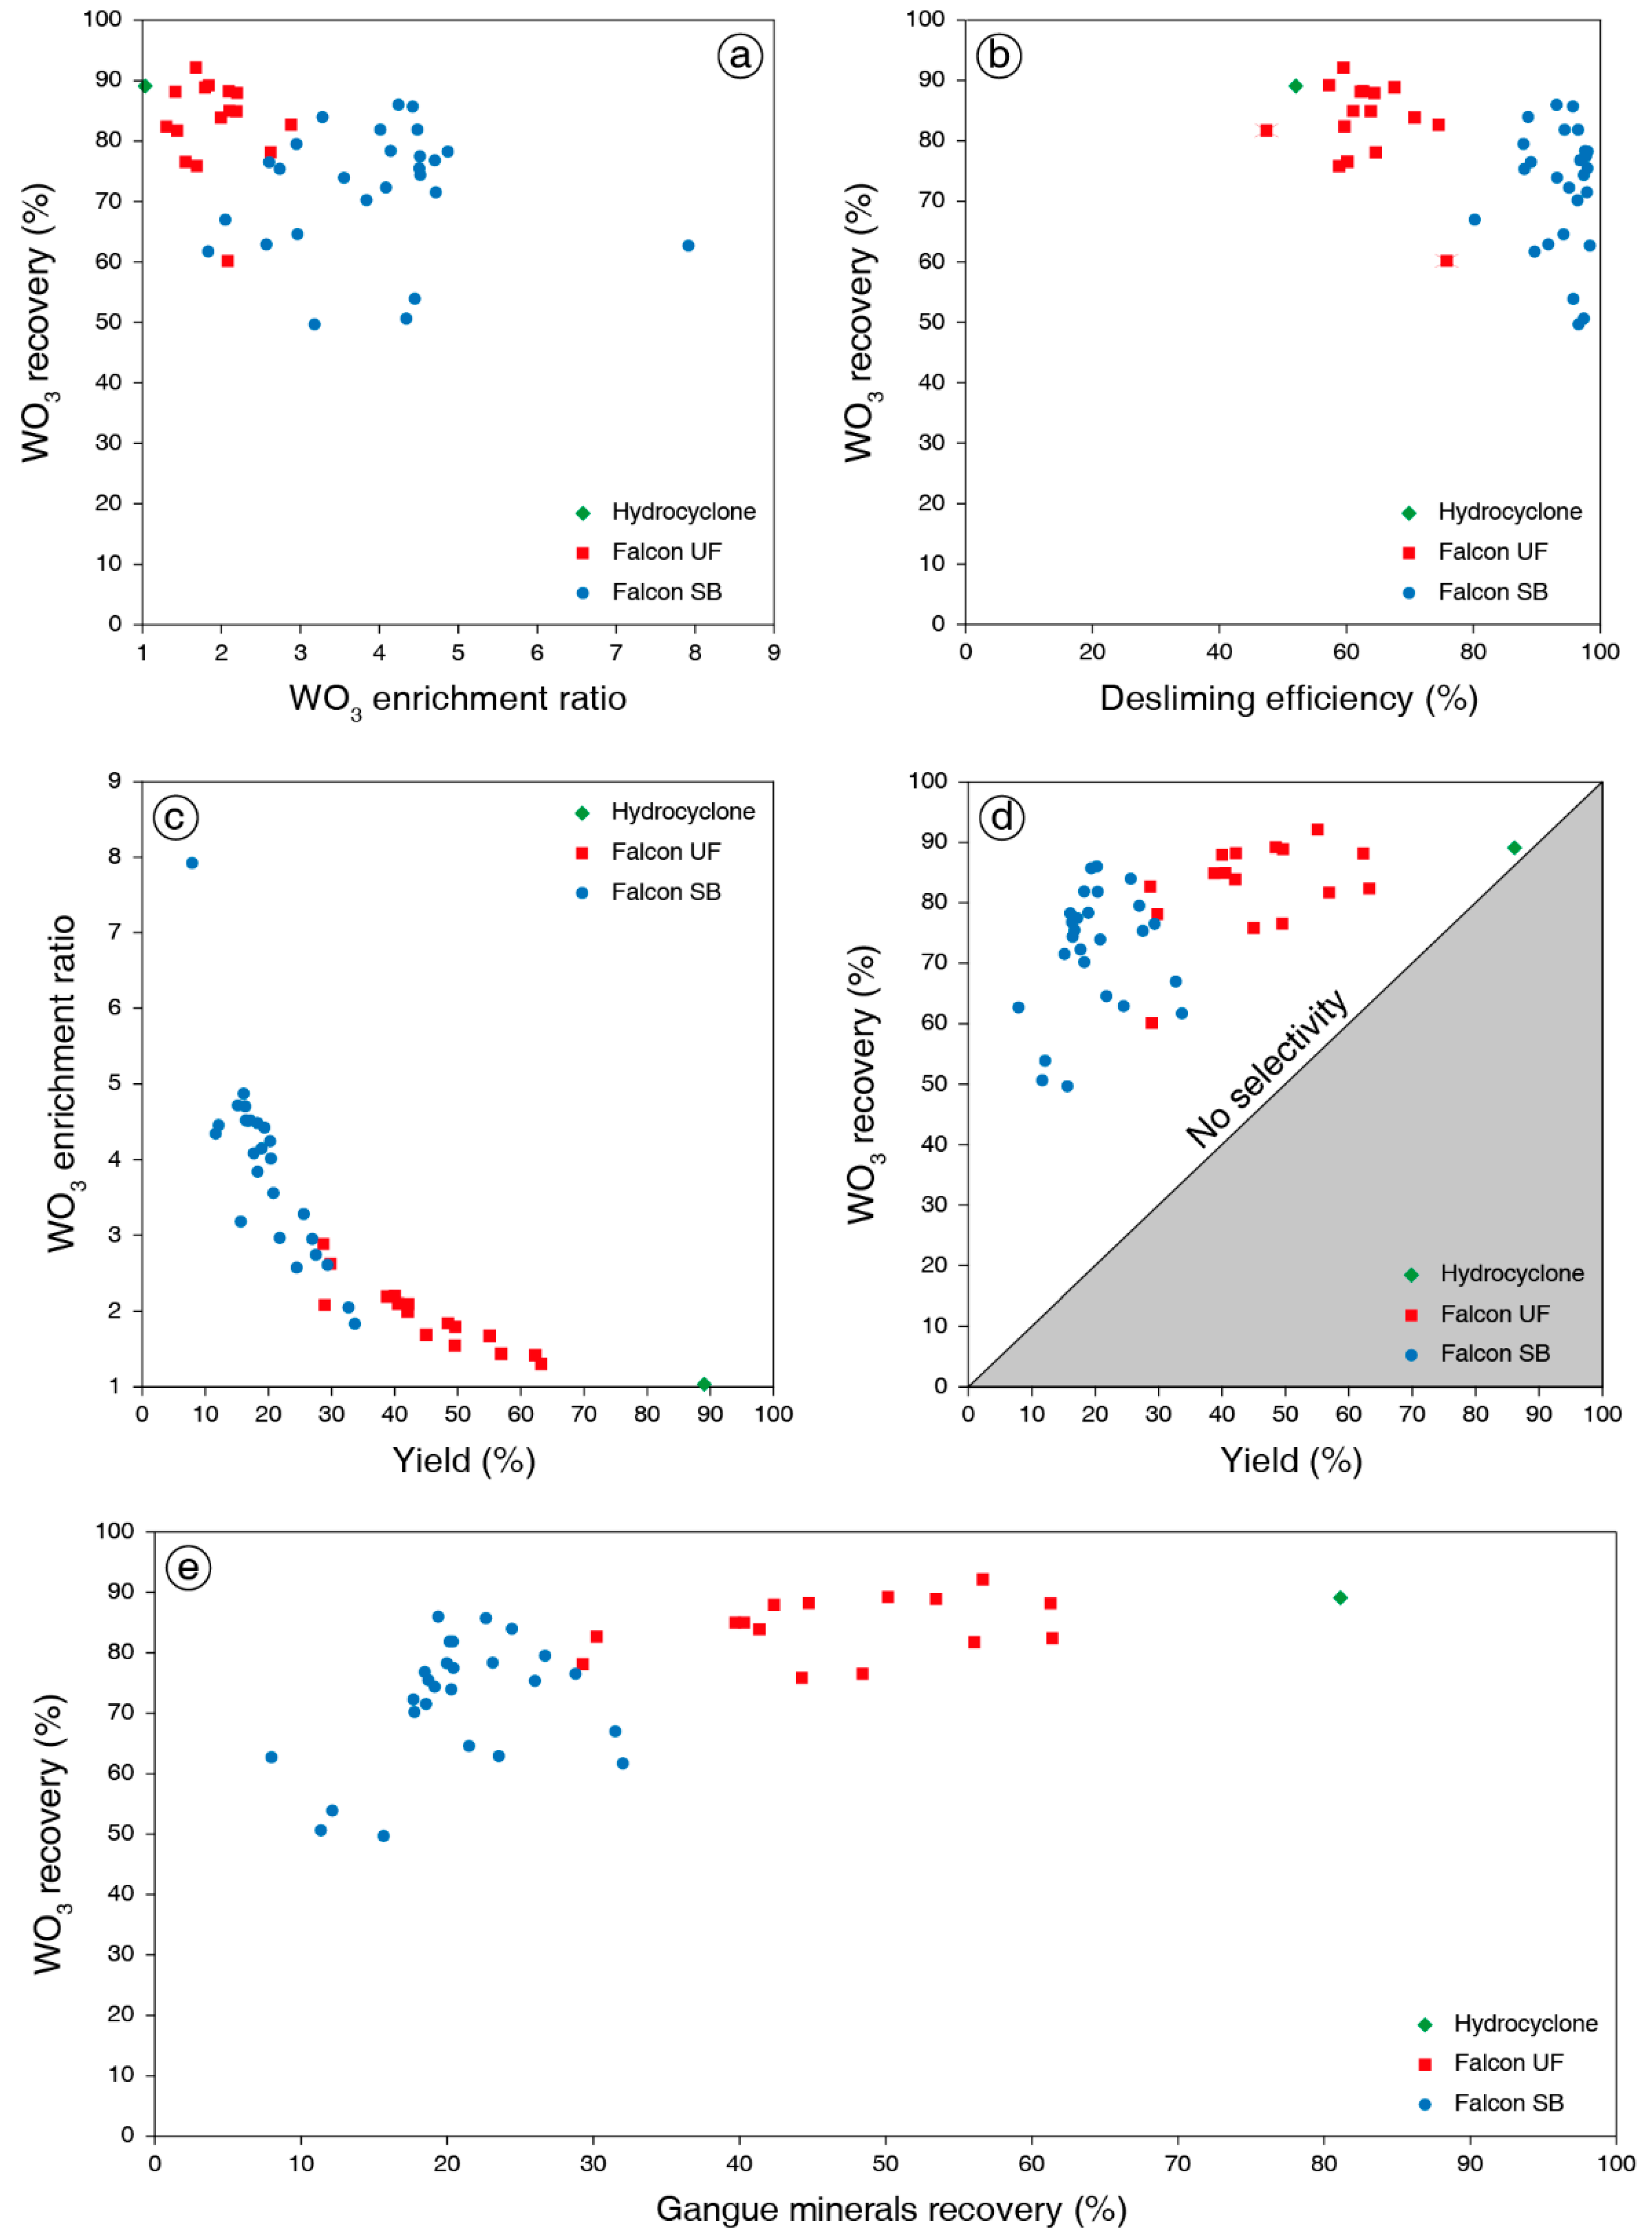
Based on Figure 4, the Falcon UF does not allow to reach the tight objectives defined in Table 3 while the Figure 6 shows that they are reached for very specific operating conidtions with the Falcon SB. It demonstrates a higher ability of Falcon SB for the gangue minerals elimination compared to Falcon UF. Further comparisons of the two bowls in terms of gangue minerals elimination and desliming efficiency are presented in Figure 7, using previous results from the DOE. First, the grade-recovery graph for WO3 (Figure 7a) shows that Falcon SB allows obtaining WO3 recoveries ranging from 50% to 86% with WO3 enrichment ratios ranging from 1.83 to 7.92. Due to its optimized bowl design and the addition of a fluidization pressure, the Falcon SB displays better performances than the Falcon UF despite a slight decrease in WO3 recoveries (Figure 7a). This latter produces concentrates with WO3 recovery ranging from 60% to 92% and WO3 enrichment ratio ranging from 1.30 to 2.88 (Figure 7a). As a comparison, the underflow of a classical hydrocyclone stage with a 10 µm cut-off displays a 1.2 WO3 enrichment ratio for 89% WO3 recovery (Figure 7a). These losses are in accordance with the homogeneous distribution of scheelite in the size fractions.
The desliming efficiency of each apparatus is also presented as a function of the WO3 recovery (Figure 7b). Desliming is very efficient with Falcon SB as the desliming efficiency ranges from 80 to 98%, far better than those obtained with a hydrocyclone (Figure 7b). Indeed, the desliming efficiency with hydrocyclone is 48%, which is around the values obtained with the Falcon UF (Figure 7b). The high desliming performances obtained with both bowls suggest that Falcon concentrators can be used as a pre-concentrating and a desliming apparatus, prior to fatty-acid flotation, therefore substituting to hydrocyclones in flotation feed preparation circuits.
The WO3 enrichment ratio is expressed as a function of the yield in Figure 7c. The yields are comprised between 8% and 33% for the Falcon SB and between 29% and 63% for the Falcon UF. Such values are very well correlated with the WO3 enrichment ratio, as the Figure 7c shows: the highest WO3 enrichment ratios correspond to the lowest yields. Hence, a pre-concentration stage with a Falcon concentrator, in particular the Falcon SB, would lead to a significant decrease of the pulp subjected to the flotation stage, reducing the energy, water, and reagents consumptions. The selectivity curve shown in Figure 7d expresses the WO3 recovery as a function of yield. While the hydrocyclone displays a very poor selectivity, as expected, the Falcon SB is more selective than the Falcon UF, exhibting lower yields for roughly equivalent WO3 recoveries (Figure 7d).
Another selectivity curve, displaying the WO3 recovery as a function of the gangue minerals recoveries is shown in Figure 7e. Overall, for the best tests in terms of gangue minerals elimination, 89% of the apatite, 89% of the fluorite, and 93% of the silicates (light + dense) are rejected from the concentrate. This crucial result indicates that apatite and fluorite, which are highly problematic in fatty-acid flotation [12,16], can be eliminated by a Falcon pre-concentrating stage prior to flotation.
The rotary speed has a negative effect on the gangue mineral recoveries for the Falcon UF but a positive effect for the Falcon SB. Moreover, the pulp density has very little effect on the recoveries for the Falcon SB and a significant positive effect on the gangue mineral recoveries for the Falcon UF. This may indicate a difference in the separation mechanisms between the two bowls. In the Falcon UF, the separation is mostly governed by the differential settling of the particles in the flowing film, before the concentration zone in the upper part of the bowl. It means that the parameters affect the separation performance by influencing the differential settling mechanisms: the rotary speed decreases the settling length of the particles while the pulp density impels either a hindered or a forced settling of particles. In the Falcon SB, the separation seems mostly lead by the forces balance between the centrifugal force, increasing with the rotary speed and the fluidization pressure. The differential settling occurring in the flowing film before the particles reach the gutters seems to have little influence on the separation performance, indicating that the actual separation happens in the gutters.

4. Conclusions

Gravity concentration of a complex W-skarn has been investigated using a Falcon concentrator with the global aim of eliminating the calcium-bearing minerals that are known to be problematic during fatty-acid flotation. Furthermore, the desliming efficiency was also studied to enable the utilization of the Falcon concentrator as a pre-concentrating and desliming apparatus, prior to flotation. Thus, the influence of the operating parameters on the Falcon UF and Falcon SB performances were modeled using the DOE methodology. It allowed to set the best conditions to attain the elimination of 75% and 78% of the total amount of apatite and fluorite with the Falcon UF and Falcon SB, respectively. The Falcon SB exhibited better performances with up to 98% of fine particles rejected from the pre-concentrate, a WO3 recovery higher than 70%, a WO3 enrichment ratio higher than 4.5, and a yield of around 15%. Given the good elimination of calcium-bearing minerals and fine particles, the pre-concentrate could directly undergo a flotation process with fatty acids as the lack of selectivity between the calcium-bearing minerals would not be a problem anymore. Also, it allowed to reject 85% of the global yield by the physical pre-concentration, leading to a 7-fold of the reagents consumed in the flotation stage, as well as reducing the energy consumption. Since the choice was made to maximize the gangue minerals rejection, the Falcon separation induced around 30% of WO3 losses in the tailings compared to around 10% of WO3 losses for a classical hydrocyclone stage. A scavenger Falcon stage could be suggested to reduce these lossess, which would anyhow be significantly decreased by up-scaling the laboratory scale Falcon UF and SB to an industrial Falcon C. Indeed, Falcon UF and SB, used at laboratory scale in this study, are operated in semi-batch and thus are not commonly used at industrial scale in continuous operations since they need to be installed in parallel circuits. For this reason, the Falcon C is more widely used in the industry, operating high pulp flowrates that are, unfortunately, not suitable for laboratory test work. However, according to Sepro Mineral Systems [35], the Falcon C efficiency at industrial scale can be assessed based on laboratory tests performed with semi-batch-operated Falcon SB/UF. Overall, replacing hydrocyclones by Falcon concentrators (SB or C) in flotation feed preparation circuits could lead to higher process performances while reducing the environmental impacts by allowing the replacement of usual ecotoxic reagents by the environmentally friendly fatty acids, reducing the reagent and energy consumptions.

Supplementary Materials

The following are available online at https://www.mdpi.com/2075-163X/9/7/448/s1, Table S1. Three-variable CCD used for the Falcon UF tests and experimental results, i.e., yield, WO3 (RW), K2O (RK), P2O5 (RP), and Fe2O3 (RFe) recoveries, and Deff; Table S2. Analysis of variance (ANOVA) for the WO3, K2O, P2O5, and Fe2O3 recoveries and the desliming efficiency for the Falcon UF presenting the degrees of freedom (DF), sum of squares (SS), F-ratios (F) and p-values (P) for the first and the final runs. Critical F-values for 0.05 significance level are F(10,5) = 4.74, F(3,12) = 3.49 for the RW, RK, RFe models, F(2,13) = 3.81 for the RP model, and F(1,14) = 4.60 for the Deff model; Table S3. Four-variable CCD used for the Falcon SB tests and experimental results, i.e., WO3 (RW), K2O (RK), P2O5 (RP), and Fe2O3 (RFe) recoveries, and Deff; Table S4. Analysis of variance (ANOVA) for the WO3, K2O, P2O5, and Fe2O3 recoveries and the desliming efficiency for the Falcon SB presenting the degrees of freedom (DF), sum of squares (SS), F-ratios (F) and p-values (P). Critical F-values for 0.05 significance level are F(19,6) = 3.88, F(5,20) = 2.71, F(2,23) = 3.42, and F(3,22) = 3.05.

Author Contributions

Conceptualization, Q.D., Y.F., I.V.F., and L.O.F.; methodology, Y.F. and Q.D..; software, Y.F. and Q.D.; validation, Q.D., Y.F., I.V.F., and L.O.F.; formal analysis, Y.F. and Q.D.; investigation, Y.F. and Q.D.; resources, L.O.F. and I.V.F.; data curation, Y.F.; writing—original draft preparation, Y.F., Q.D., and L.O.F.; writing—review and editing, Y.F., Q.D., and L.O.F.; visualization, Y.F., Q.D., and L.O.F.; supervision, L.O.F.; project administration, L.O.F. and I.V.F.; funding acquisition, L.O.F.

Funding

The research leading to these results has received funding from the European Union’s Horizon 2020 research and innovation program for the FAME project (grant no. 641650). We also acknowledge the support of Labex Ressources 21 supported by the French National Research Agency through the national program “Investissements d’Avenir” (reference ANR–10–LABX–21-01).

Acknowledgments

The authors want to acknowledge the technical staff of the experimental station STEVAL, University of Lorraine, Nancy, France, who has been strongly involved in the present work.

Conflicts of Interest

The authors declare no conflict of interest. The funders had no role in the design of the study; in the collection, analyses, or interpretation of data; in the writing of the manuscript, or in the decision to publish the results.

References

  1. Audion, A.S.; Labbé, J.F. Panorama 2011 du Marché du Tungstène; BRGM: Orléans, France, 2012. [Google Scholar]
  2. Pitfield, P.; Brown, T.; Gunn, G.; Rayner, D. British Geological Survey. Tungsten Profile. Available online: https://www.bgs.ac.uk/downloads/start.cfm?id=1981 (accessed on 19 July 2019).
  3. European Commission. Critical Raw Materials for the EU: Report of the Ad-hoc Working Group on Defining Critical Raw Materials; European Commision: Brussels, Belgium, 2010. [Google Scholar]
  4. Lassner, E.; Schubert, W.-D. Tungsten: Properties, Chemistry, Technology of the Element, Alloys, and Chemical Compounds; Springer: Boston, MA, USA, 1999. [Google Scholar]
  5. Yang, X. Beneficiation studies of tungsten ores—A review. Miner. Eng. 2018, 125, 111–119. [Google Scholar] [CrossRef]
  6. Suárez Sánchez, A.; Krzemień, A.; Riesgo Fernández, P.; Iglesias Rodríguez, F.J.; Sánchez Lasheras, F.; de Cos Juez, F.J. Investment in new tungsten mining projects. Resour. Policy 2015, 46, 177–190. [Google Scholar] [CrossRef] [Green Version]
  7. Kupka, N.; Rudolph, M. Froth flotation of scheelite—A review. Int. J. Min. Sci. Technol. 2018, 28, 373–384. [Google Scholar] [CrossRef]
  8. Jébrak, M.; Marcoux, É.; Laithier, M. Geology of Mineral Resources, 2nd ed.; Geological Association of Canada: St. John’s, NL, Canada, 2016. [Google Scholar]
  9. Foucaud, Y.; Lechenard, B.; Marion, P.; Filippova, I.; Filippov, L. Geology, textural study, ore genesis and processing of the tabuaço tungsten deposit (Northern Portugal). In Contributions to Mineralization; Al-Juboury, A.I., Ed.; InTech: London, UK, 2018. [Google Scholar] [CrossRef]
  10. Deng, L.; Zhao, G.; Zhong, H.; Wang, S.; Liu, G. Investigation on the selectivity of N-((hydroxyamino)-alkyl) alkylamide surfactants for scheelite/calcite flotation separation. J. Ind. Eng. Chem. 2016, 33, 131–141. [Google Scholar] [CrossRef]
  11. Liu, C.; Feng, Q.; Zhang, G.; Chen, W.; Chen, Y. Effect of depressants in the selective flotation of scheelite and calcite using oxidized paraffin soap as collector. Int. J. Miner. Process. 2016, 157, 210–215. [Google Scholar] [CrossRef]
  12. Filippov, L.O.; Foucaud, Y.; Filippova, I.V.; Badawi, M. New reagent formulations for selective flotation of scheelite from a skarn ore with complex calcium minerals gangue. Miner. Eng. 2018, 123, 85–94. [Google Scholar] [CrossRef]
  13. Agar, G.E. Scheelite Flotation Process. U.S. Patent 4,488,959, 18 December 1984. [Google Scholar]
  14. Pugh, R.; Stenius, P. Solution chemistry studies and flotation behaviour of apatite, calcite and fluorite minerals with sodium oleate collector. Int. J. Miner. Process. 1985, 15, 193–218. [Google Scholar] [CrossRef]
  15. Marinakis, K.I.; Shergold, H.L. The mechanism of fatty acid adsorption in the presence of fluorite, calcite and barite. Int. J. Miner. Process. 1985, 14, 161–176. [Google Scholar] [CrossRef]
  16. Filippova, I.V.; Filippov, L.O.; Duverger, A.; Severov, V.V. Synergetic effect of a mixture of anionic and nonionic reagents: Ca mineral contrast separation by flotation at neutral pH. Miner. Eng. 2014, 66–68, 135–144. [Google Scholar] [CrossRef]
  17. Yang, Y.; Xie, B.; Wang, R.; Xu, S.; Wang, J.; Xu, Z. Extraction and separation of tungsten from acidic high-phosphorus solution. Hydrometallurgy 2016, 164, 97–102. [Google Scholar] [CrossRef]
  18. Petrov, N.S. A New Method for Flotation of Poor Scheelite Ores; ONTI, Mekhanobr: Sankt-Peterburg, Russia, 1940. [Google Scholar]
  19. Feng, B.; Guo, W.; Xu, H.; Peng, J.; Luo, X.; Zhu, X. The combined effect of lead ion and sodium silicate in the flotation separation of scheelite from calcite. Sep. Sci. Technol. 2017, 52, 567–573. [Google Scholar] [CrossRef]
  20. Zhao, G.; Wang, S.; Zhong, H. Study on the activation of scheelite and wolframite by lead nitrate. Minerals 2015, 5, 247–258. [Google Scholar] [CrossRef]
  21. Burt, R. The role of gravity concentration in modern processing plants. Miner. Eng. 1999, 12, 1291–1300. [Google Scholar] [CrossRef]
  22. Falconer, A. Gravity separation: Old technique/new methods. Phys. Sep. Sci. Eng. 2003, 12, 31–48. [Google Scholar] [CrossRef]
  23. Das, A.; Sarkar, B. Advanced gravity concentration of fine particles: A review. Miner. Process. Extr. Metall. Rev. 2018, 39, 359–394. [Google Scholar] [CrossRef]
  24. Sepro. Falcon UF Gravity Concentrators Brochure. Sepro Miner. Syst. Website. (n.d.) Available online: http://www.seprosystems.com/images/brochures/sepro-falcon-uf-concentrators.pdf (accessed on 19 November 2015).
  25. Zhang, Y.; He, Y.; Zhang, T.; Zhu, X.; Feng, Y.; Zhang, G.; Bai, X. Application of Falcon centrifuge in the recycling of electrode materials from spent lithium ion batteries. J. Clean. Prod. 2018, 202, 736–747. [Google Scholar] [CrossRef]
  26. Duan, C.; Wen, X.; Shi, C.; Zhao, Y.; Wen, B.; He, Y. Recovery of metals from waste printed circuit boards by a mechanical method using a water medium. J. Hazard. Mater. 2009, 166, 478–482. [Google Scholar] [CrossRef]
  27. Filippov, L.O.; Dehaine, Q.; Filippova, I.V. Rare earths (La, Ce, Nd) and rare metals (Sn, Nb, W) as by-products of kaolin production—Part 3: Processing of fines using gravity and flotation. Miner. Eng. 2016, 95, 96–106. [Google Scholar] [CrossRef]
  28. Dehaine, Q.; Foucaud, Y.; Kroll-Rabotin, J.-S.; Filippov, L.O. Experimental investigation into the kinetics of Falcon UF concentration: Implications for fluid dynamic-based modelling. Sep. Purif. Technol. 2019, 215, 590–601. [Google Scholar] [CrossRef] [Green Version]
  29. Edraki, M.; Baumgartl, T.; Manlapig, E.; Bradshaw, D.; Franks, D.M.; Moran, C.J. Designing mine tailings for better environmental, social and economic outcomes: A review of alternative approaches. J. Clean. Prod. 2014, 84, 411–420. [Google Scholar] [CrossRef]
  30. McAlister, S.; Armstrong, K. Development of the Falcon concentrators. In Proceedings of the Society for Mining, Metallurgy & Exploration, Preprint 98-172, Orlando, FL, USA, 9–11 March 1998. [Google Scholar]
  31. Buonvino, M. A Study of the Falcon Concentrator. Ph.D. Thesis, McGill University, Montreal, QC, Canada, 1993. [Google Scholar]
  32. Laplante, A.R.; Buonvino, M.; Veltmeyer, A.; Robitaille, J.; Naud, G. A Study of the Falcon Concentrator. Can. Metall. Q. 1994, 33, 279–288. [Google Scholar] [CrossRef]
  33. Kroll-Rabotin, J.-S.; Bourgeois, F.; Climent, É. Fluid dynamics based modelling of the Falcon concentrator for ultrafine particle beneficiation. Miner. Eng. 2010, 23, 313–320. [Google Scholar] [CrossRef] [Green Version]
  34. Kroll-Rabotin, J.-S.; Bourgeois, F.; Climent, É. Physical analysis and modeling of the Falcon concentrator for beneficiation of ultrafine particles. Int. J. Miner. Process. 2013, 121, 39–50. [Google Scholar] [CrossRef] [Green Version]
  35. Sepro; Falcon Concentrators Inc. FALCON L40 Operations and Maintenance Manual. Available online: https://www.adss.net/documents/manuals/F40_OP_MAN.pdf. (accessed on 19 July 2019).
  36. Dehaine, Q.; Filippov, L.O. Rare earth (La, Ce, Nd) and rare metals (Sn, Nb, W) as by-product of kaolin production, Cornwall: Part1: Selection and characterisation of the valuable stream. Miner. Eng. 2015, 76, 141–153. [Google Scholar] [CrossRef]
  37. Montgomery, D.C. Design and Analysis of Experiments, 8th ed.; John Wiley & Sons, Inc.: Hoboken, NJ, USA, 2013. [Google Scholar]
  38. Goupy, J.; Creighton, W.L. Introduction to Design of Experiments with JMP Examples, 3rd ed.; SAS Institute: Cary, NC, USA, 2007. [Google Scholar]
  39. Kroll-Rabotin, J.-S. Analyse Physique et Modélisation de la Séparation Centrifuge de Particules Ultrafines en Film Fluant: Application au Séparateur Industriel Falcon. Ph.D. Thesis, Université de Toulouse, Toulouse, France, 2010. [Google Scholar]
  40. Kroll-Rabotin, J.-S.; Climent, E.; Bourgeois, F. Beneficiation of concentrated ultrafine suspensions with a Falcon UF concentrator. Can. Inst. Min. J. 2011, 2, 189–198. [Google Scholar]
  41. Burt, R.O.; Mills, C. Gravity Concentration Technology; Elsevier: Amsterdam, The Netherlands, 1984. [Google Scholar]
  42. Burt, R.O. Gravity concentration methods. In Mineral Processing Design; Yarar, B., Dogan, Z.M., Eds.; Springer Netherlands: Dordrecht, The Netherlands, 1987; pp. 106–137. [Google Scholar] [CrossRef]
  43. Kademli, M.; Gulsoy, O. The role of particle size and solid contents of feed on mica-feldspar separation in gravity concentration. Physicochem. Probl. Miner. Process. 2012, 48, 645–654. [Google Scholar] [CrossRef]
  44. Laplante, A.; Nickoletopoulos, N. Validation of a falcon model with a synthetic ore. Can. Metall. Q. 1997, 36, 7–13. [Google Scholar] [CrossRef]
  45. Majumder, A.K.; Barnwal, J.P. Modeling of enhanced gravity concentrators–Present status. Miner. Process. Extr. Metall. Rev. 2006, 27, 61–86. [Google Scholar] [CrossRef]
  46. Ancia, P.; Frenay, J.; Dandois, P. Comparison of Knelson and Falcon centrifugal separators. In Innovation in Physical Separation Technologies; Mozeley, R., Ed.; Richard Mozely Symposium Volume IMM.: Falmouth, UK, 1997; pp. 53–62. [Google Scholar]
  47. Laplante, A.R.; Shu, Y.; Marois, J. Experimental characterization of a laboratory centrifugal separator. Can. Metall. Q. 1996, 35, 23–29. [Google Scholar] [CrossRef]
  48. Coulter, T.; Subasinghe, G.K.N. A mechanistic approach to modelling Knelson concentrators. Miner. Eng. 2005, 18, 9–17. [Google Scholar] [CrossRef]
  49. Ghaffari, A.; Farzanegan, A. An investigation on laboratory Knelson Concentrator separation performance: Part 2: Two-component feed separation modelling. Miner. Eng. 2017, 112, 114–124. [Google Scholar] [CrossRef]
  50. Ghaffari, A.; Farzanegan, A. An investigation on laboratory Knelson Concentrator separation performance: Part 3: Multi-component feed separation modelling. Miner. Eng. 2018, 122, 185–194. [Google Scholar] [CrossRef]
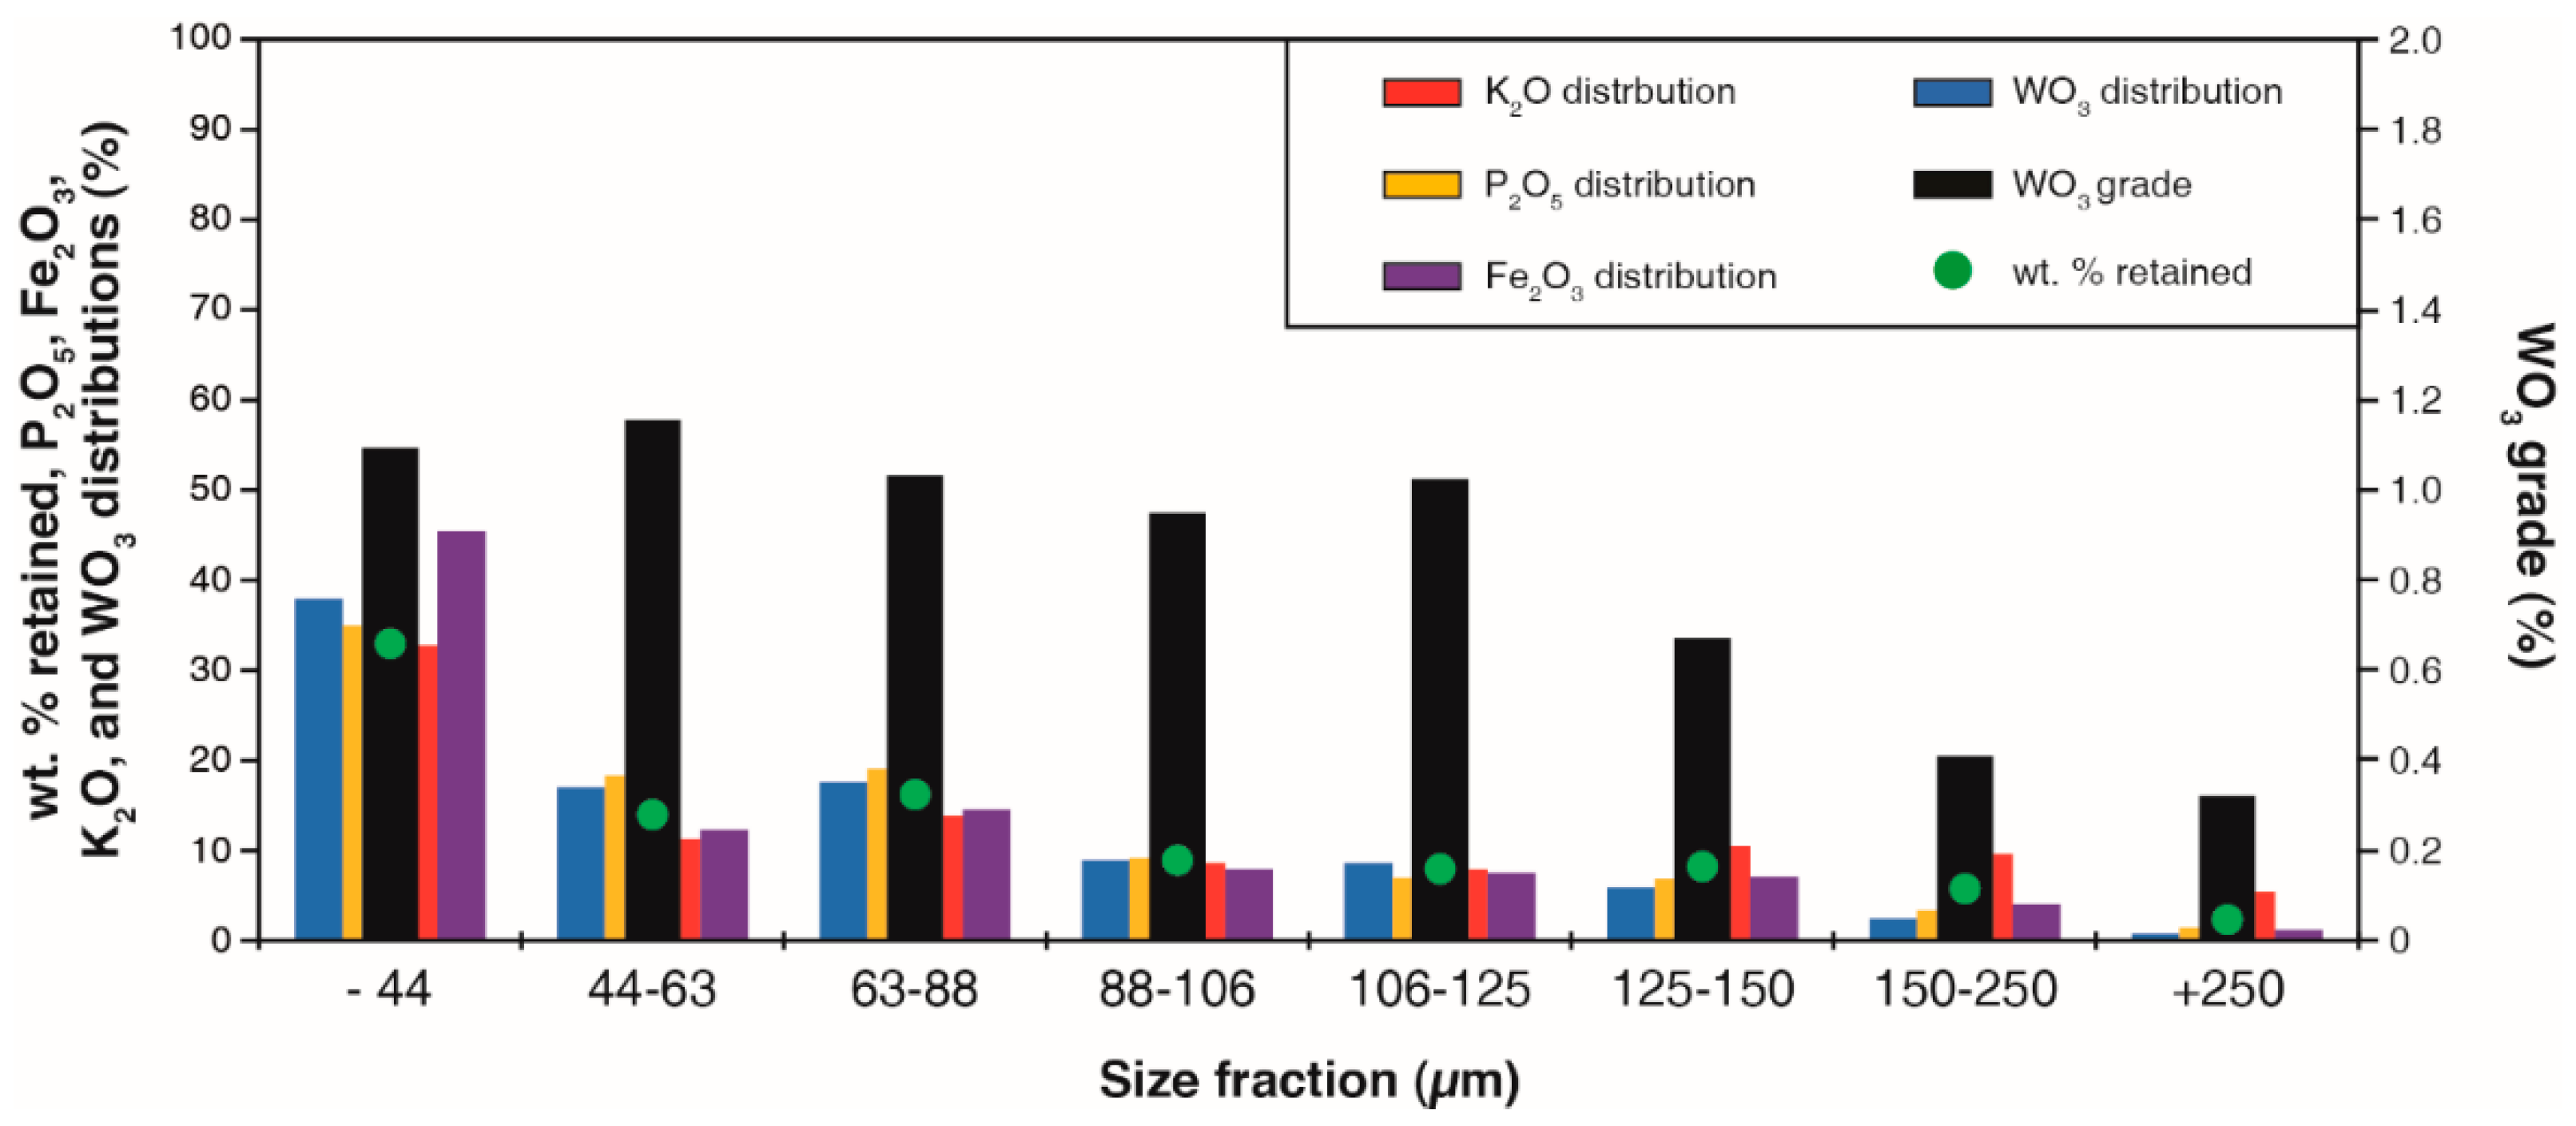
Figure 1. WO3 grade, wt % retained and main oxides size-distributions in feed material used for the Falcon tests.
Minerals 09 00448 g001
Figure 2. Experimental setup for Falcon L40 testing. Note that wash water (WW) is only used for Falcon SB testing.
Minerals 09 00448 g002
Figure 3. 2-D contour plots for WO3 recovery (a), K2O recovery (bd), P2O5 recovery (e), and Fe2O3 recovery (fh) for the Falcon UF models as a function of the operating parameters. The colored zones correspond to values that satisfy the performance objectives defined in Table 3.
Minerals 09 00448 g003
Figure 4. 2-D contour plots for the five studied responses (WO3, K2O, Fe2O3, and P2O5 recoveries and desliming efficiency) for the Falcon UF models as a function of the operating parameters (a): pulp density and rotary speed; (b): pulp flowrate and rotary speed; (c): pulp flowrate and pulp density). Targets represent zones where the objectives set on all the studied responses, defined in Table 3, are reached.
Minerals 09 00448 g004
Figure 5. 2-D contour plots for WO3 recovery (ac), K2O recovery (d), P2O5 recovery (e), Fe2O3 recovery (f), and desliming efficiency (g) for the Falcon SB models as a function of the operating parameters. The green and the red zones correspond to values which satisfy respectively the moderate and the tight performance objectives defined in Table 3.
Minerals 09 00448 g005
Figure 6. 2-D contour plots for the five studied responses (WO3, K2O, Fe2O3, and P2O5 recoveries and desliming efficiency) for the Falcon SB models as a function of the operating parameters (a): pulp density and rotary speed; (b): fluidization pressure and rotary speed; (c): fluidization pressure and pulp density). Targets represent zones where the objectives set on all the studied responses, defined in Table 3, are reached.
Minerals 09 00448 g006
Figure 7. Comparison between a Falcon UF, a Falcon SB, and a classical hydrocyclone in terms of separation performances using DoE results. (a) WO3 recovery versus WO3 enrichment ratio (grade-recovery curve); (b) WO3 recovery versus desliming efficiency; (c) WO3 enrichment ratio versus yield; (d) WO3 recovery versus yield (selectivity curve); (e) WO3 recovery versus gangue minerals recovery.
Minerals 09 00448 g007
Table 1. Mineralogical composition of the Tabuaço W-skarn showing the relative abundances along with the chemical formulas, and the densities of the minerals which are classified into four different groups.
MineralFormulaAbundance (wt %)Density (g∙cm−3)Group
VesuvianiteCa10(Mg,Fe)2Al4(SiO4)5(Si2O7)2(OH)4453.30 Dense silicates
Epidote (zoisite)Ca2(Al,Fe)3(SiO4)3(OH)153.20Dense silicates
FluoriteCaF2103.18Calcium salts
Feldspars(K,Na)AlSi3O8152.65Light silicates
Phyllosilicates-1-52.65Light silicates
Garnet (grossular)Ca3(Al,Fe)2(SiO4)31-53.70Dense silicates
FluorapatiteCa5(PO4)3F33.18Calcium salts
Pyroxene (diopside)Ca(Fe,Mg)Si2O613.20Dense silicates
QuartzSiO212.65Light silicates
ScheeliteCaWO416.10Target mineral
Table 2. Independent factors and corresponding levels for the experimental designs.
FactorsSymbolLevelsCoded Variables
Low (−1)Center (0)High (+1)
Rotary speed (Hz)ω305070x1 = (ω − 50)/20
Pulp density (wt % solid) %s2610x2 = (%s − 6)/4
Pulp flowrate (kg∙min−1)Q123x3 = (Q − 2)/1
Fluidization pressure (PSI) *f123x4 = (f − 2)/1
* Falcon SB only.
Table 3. Moderate and tight objectives based on the five studied responses for the Falcon separation performances.
ResponseCriterion
ModerateTight
WO3 recovery70%75%
P2O5 recovery40%25%
K2O recovery40%20%
Fe2O3 recovery40%20%
Desliming efficiency60%90%
Table 4. Summary of fit (actual vs. predicted) for the five studied responses for the Falcon UF.
Model StatisticsRWRKRPRFeDeff
R20.58020.94200.88100.91210.5492
RMSE5.55922.74704.35033.50205.0488
F5.530064.910048.100041.530017.0600
P0.0128<0.0001<0.0001<0.00010.0010
Table 5. Parameter estimates for the final models for the Falcon UF as a function of the standardized parameters with standard errors (STD), t-ratios (T), and corresponding p-values (P).
TermEstimateSTD ErrorTP
RW
Constant87.522.2738.56<0.0001
x1 (ω)−3.901.76−2.220.0464
x2 (%s)3.891.762.210.0472
x1 (ω × ω)−7.472.87−2.600.0232
RK
Constant39.210.6957.09<0.0001
x1 (ω)−5.620.87−6.47<0.0001
x2 (%s)10.080.8711.60<0.0001
x3 (Q)−3.710.87−4.280.0011
Rp
Constant49.261.0945.29<0.0001
x1 (ω)−8.081.38−5.87<0.0001
x2 (%s)10.811.387.85<0.0001
RFe
Constant45.410.8851.87<0.0001
x1 (ω)−6.581.11−5.94<0.0001
x2 (%s)10.061.119.08<0.0001
x3 (Q)−2.891.11−2.610.0230
Deff
Constant63.651.2650.42<0.0001
x2 (%s)−6.591.60−4.130.0010
Table 6. Validation test for the Falcon UF based on a test with optimized parameters (ω = 70 Hz; %S = 2 wt %; Q = 3 kg∙min−1) repeated four times.
Validation DataRWRKRPRFeDeff
Mean63.7324.1925.4522.6272.51
Absolute experimental standard deviation1.941.301.891.261.46
Predicted by the model72.2619.8030.3725.8970.24
Model absolute error8.53−4.394.923.27−2.27
Table 7. Summary of fit (actual vs. predicted) for the five studied responses for the Falcon SB.
Model StatisticsRWRKRPRFeDeff
R20.69890.65230.69040.71250.6921
RMSE6.26313.39173.45242.91822.6222
F364.150021.580025.650028.500016.4900
P0.0001<0.0001<0.0001<0.0001<0.0001
Table 8. Parameter estimates for the final models for the Falcon SB as a function of the standardized parameters with standard errors (STD), t-ratios (T), and corresponding p-values (P).
TermEstimateSTD errorTP
RW
Constant77.332.2134.92<0.0001
x1 (ω)6.561.484.450.0002
x2 (%s)−3.251.48−2.200.0398
x4 (f)−3.521.48−2.390.0270
x1x4 (ω ∗ f)4.371.572.790.0113
x42 (f ∗ f)−7.692.66−2.890.0091
RK
Constant14.590.6721.94<0.0001
x1 (ω)3.820.804.77<0.0001
x4 (f)−3.610.80−4.510.0002
RP
Constant24.580.6836.30<0.0001
x1 (ω)3.870.814.75<0.0001
x4 (f)−4.360.81−5.36<0.0001
RFe
Constant20.190.5735.28<0.0001
x1 (ω)3.820.695.56<0.0001
x4 (f)−3.520.69−5.11<0.0001
Deff
Constant97.160.93104.81<0.0001
x1 (ω)−2.940.62−4.75<0.0001
x4 (f)2.020.623.260.0036
x12 (ω ∗ ω)−4.491.11−4.030.0006
Table 9. Validation test for the Falcon SB based on a test with optimized parameters (ω = 58 Hz; %S = 2 wt %; Q = 3 kg∙min−1; f = 3 PSI) repeated seven times.
Validation DataRWRKRPRFeDeff
Mean71.6112.6322.6217.1598.78
Absolute experimental standard deviation3.521.293.161.240.06
Predicted by the model73.7412.5121.7718.2097.29
Model absolute error2.07−0.12−0.851.05−1.49