Insights into B-Mg-Metasomatism at the Ranger U Deposit (NT, Australia) and Comparison with Canadian Unconformity-Related U Deposits

 , ,
, ,
Abstract
1. Introduction
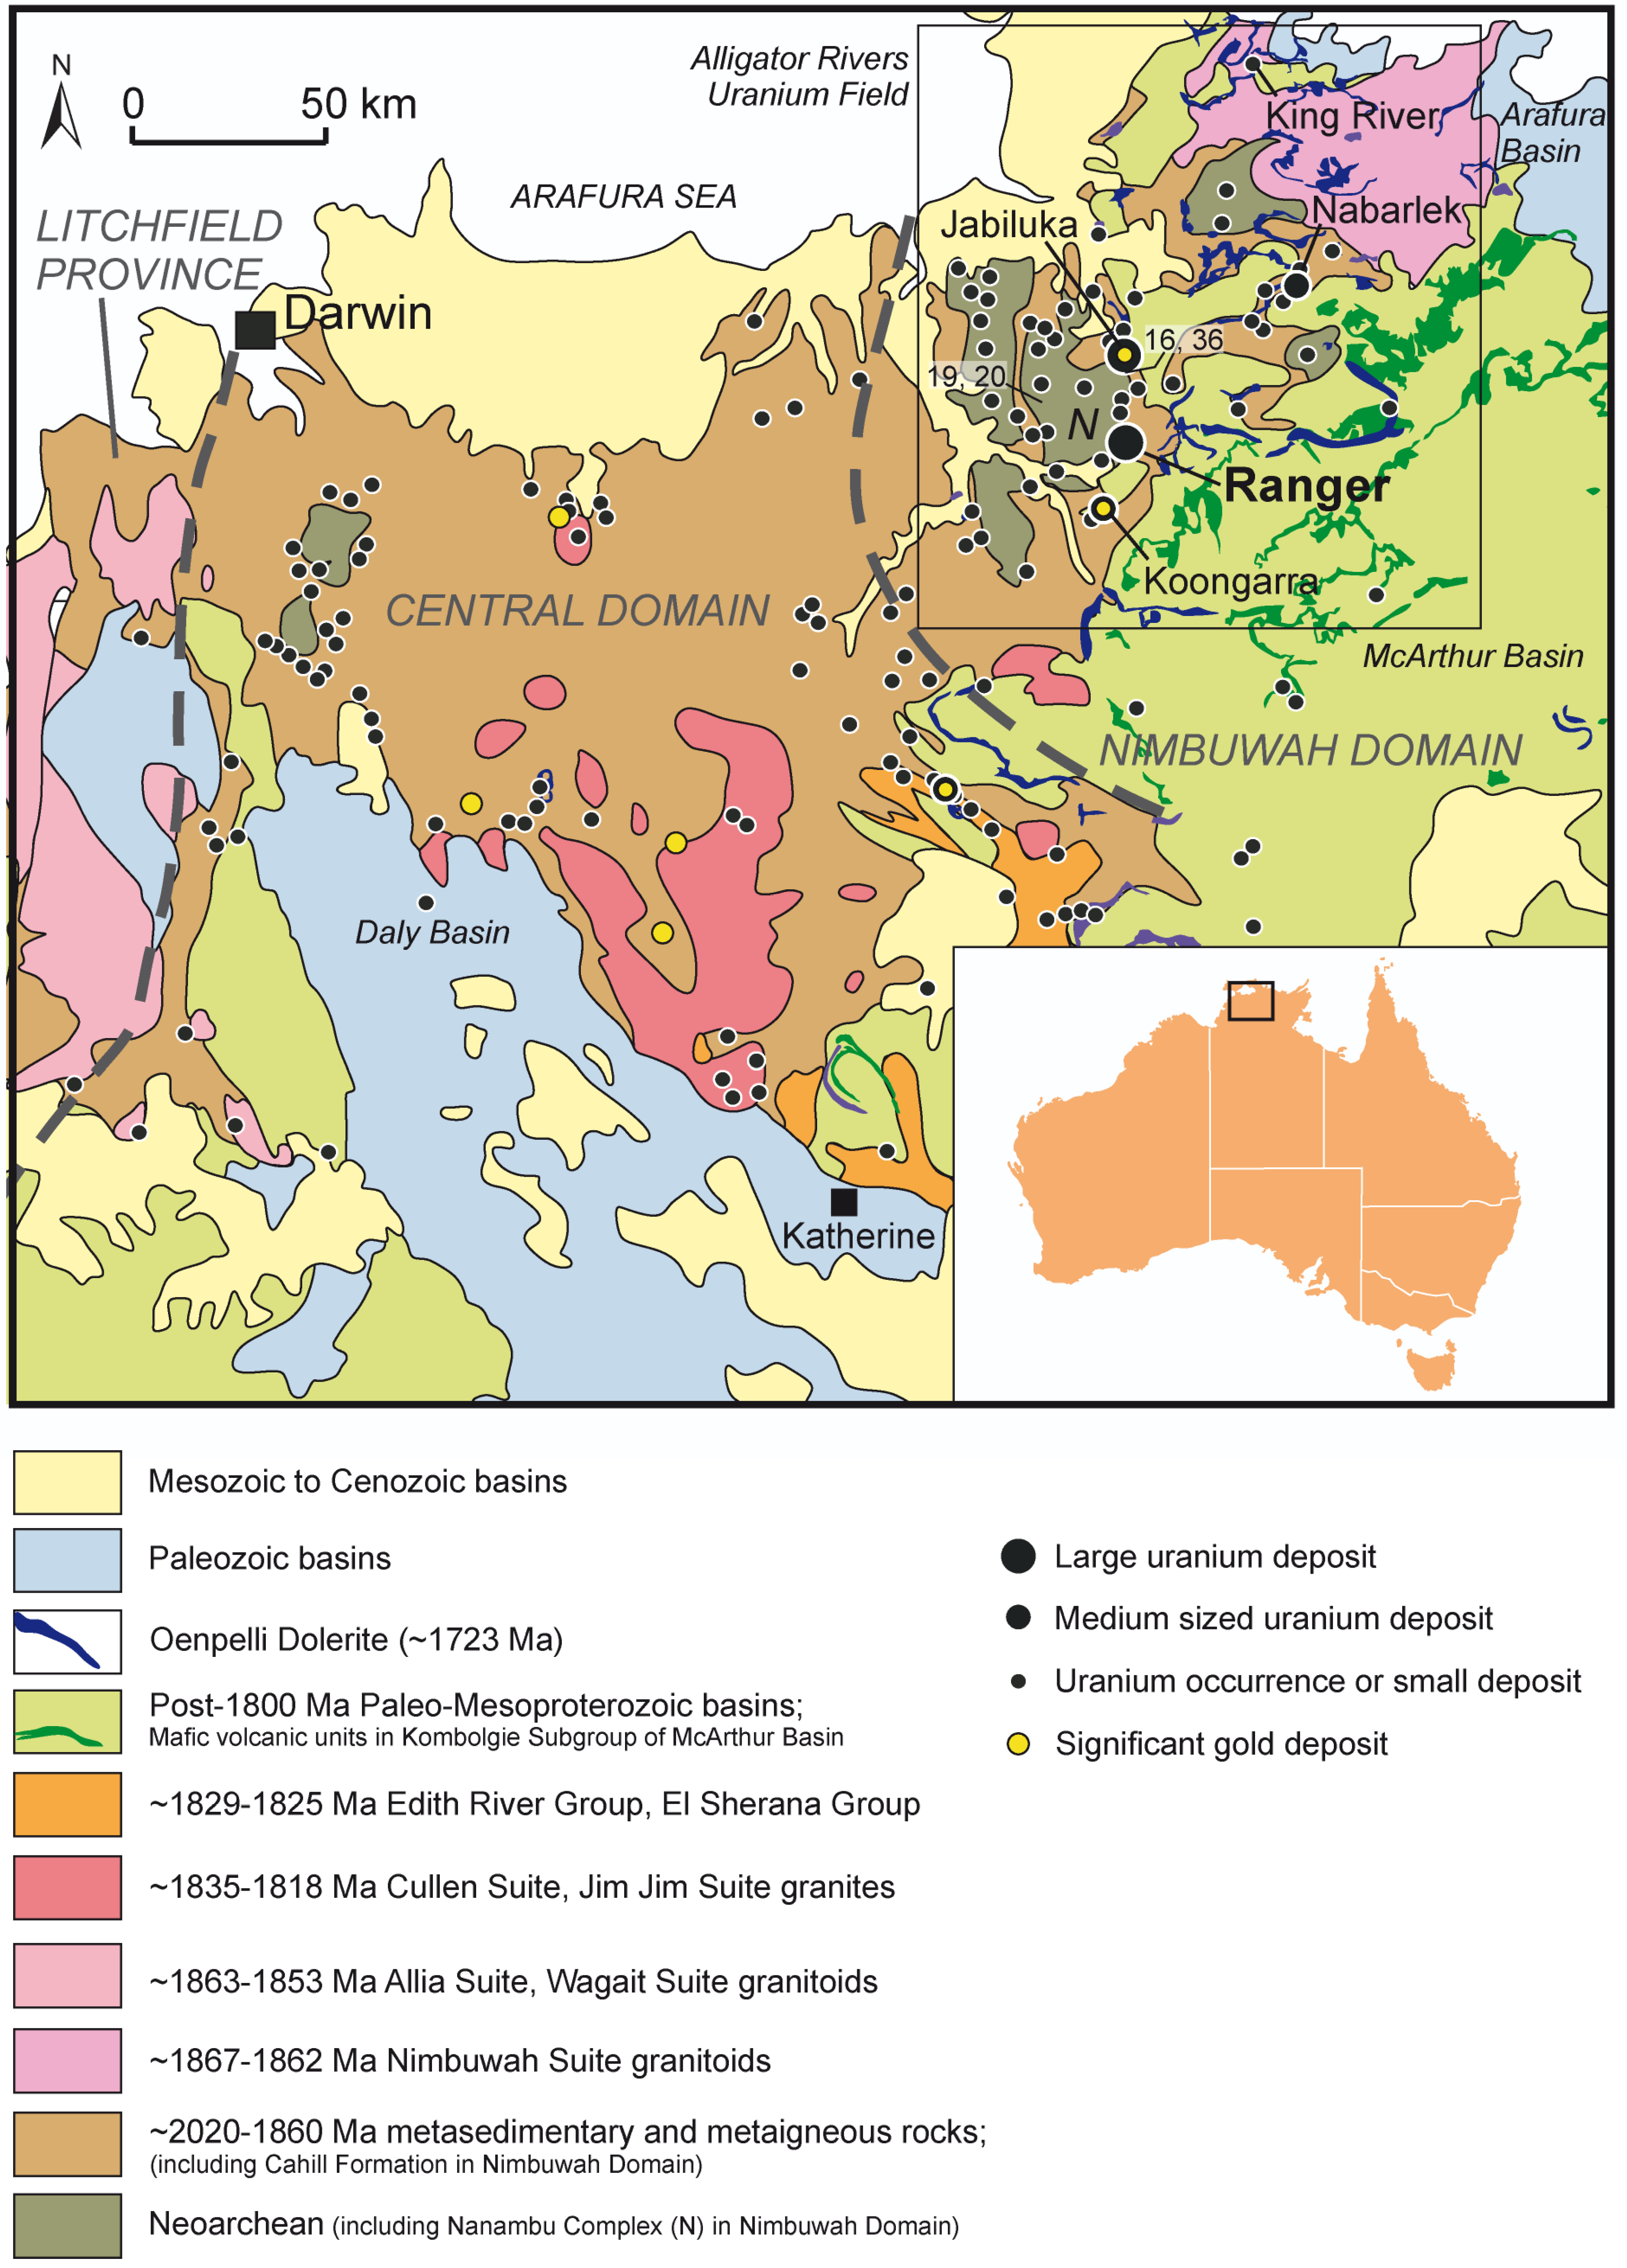
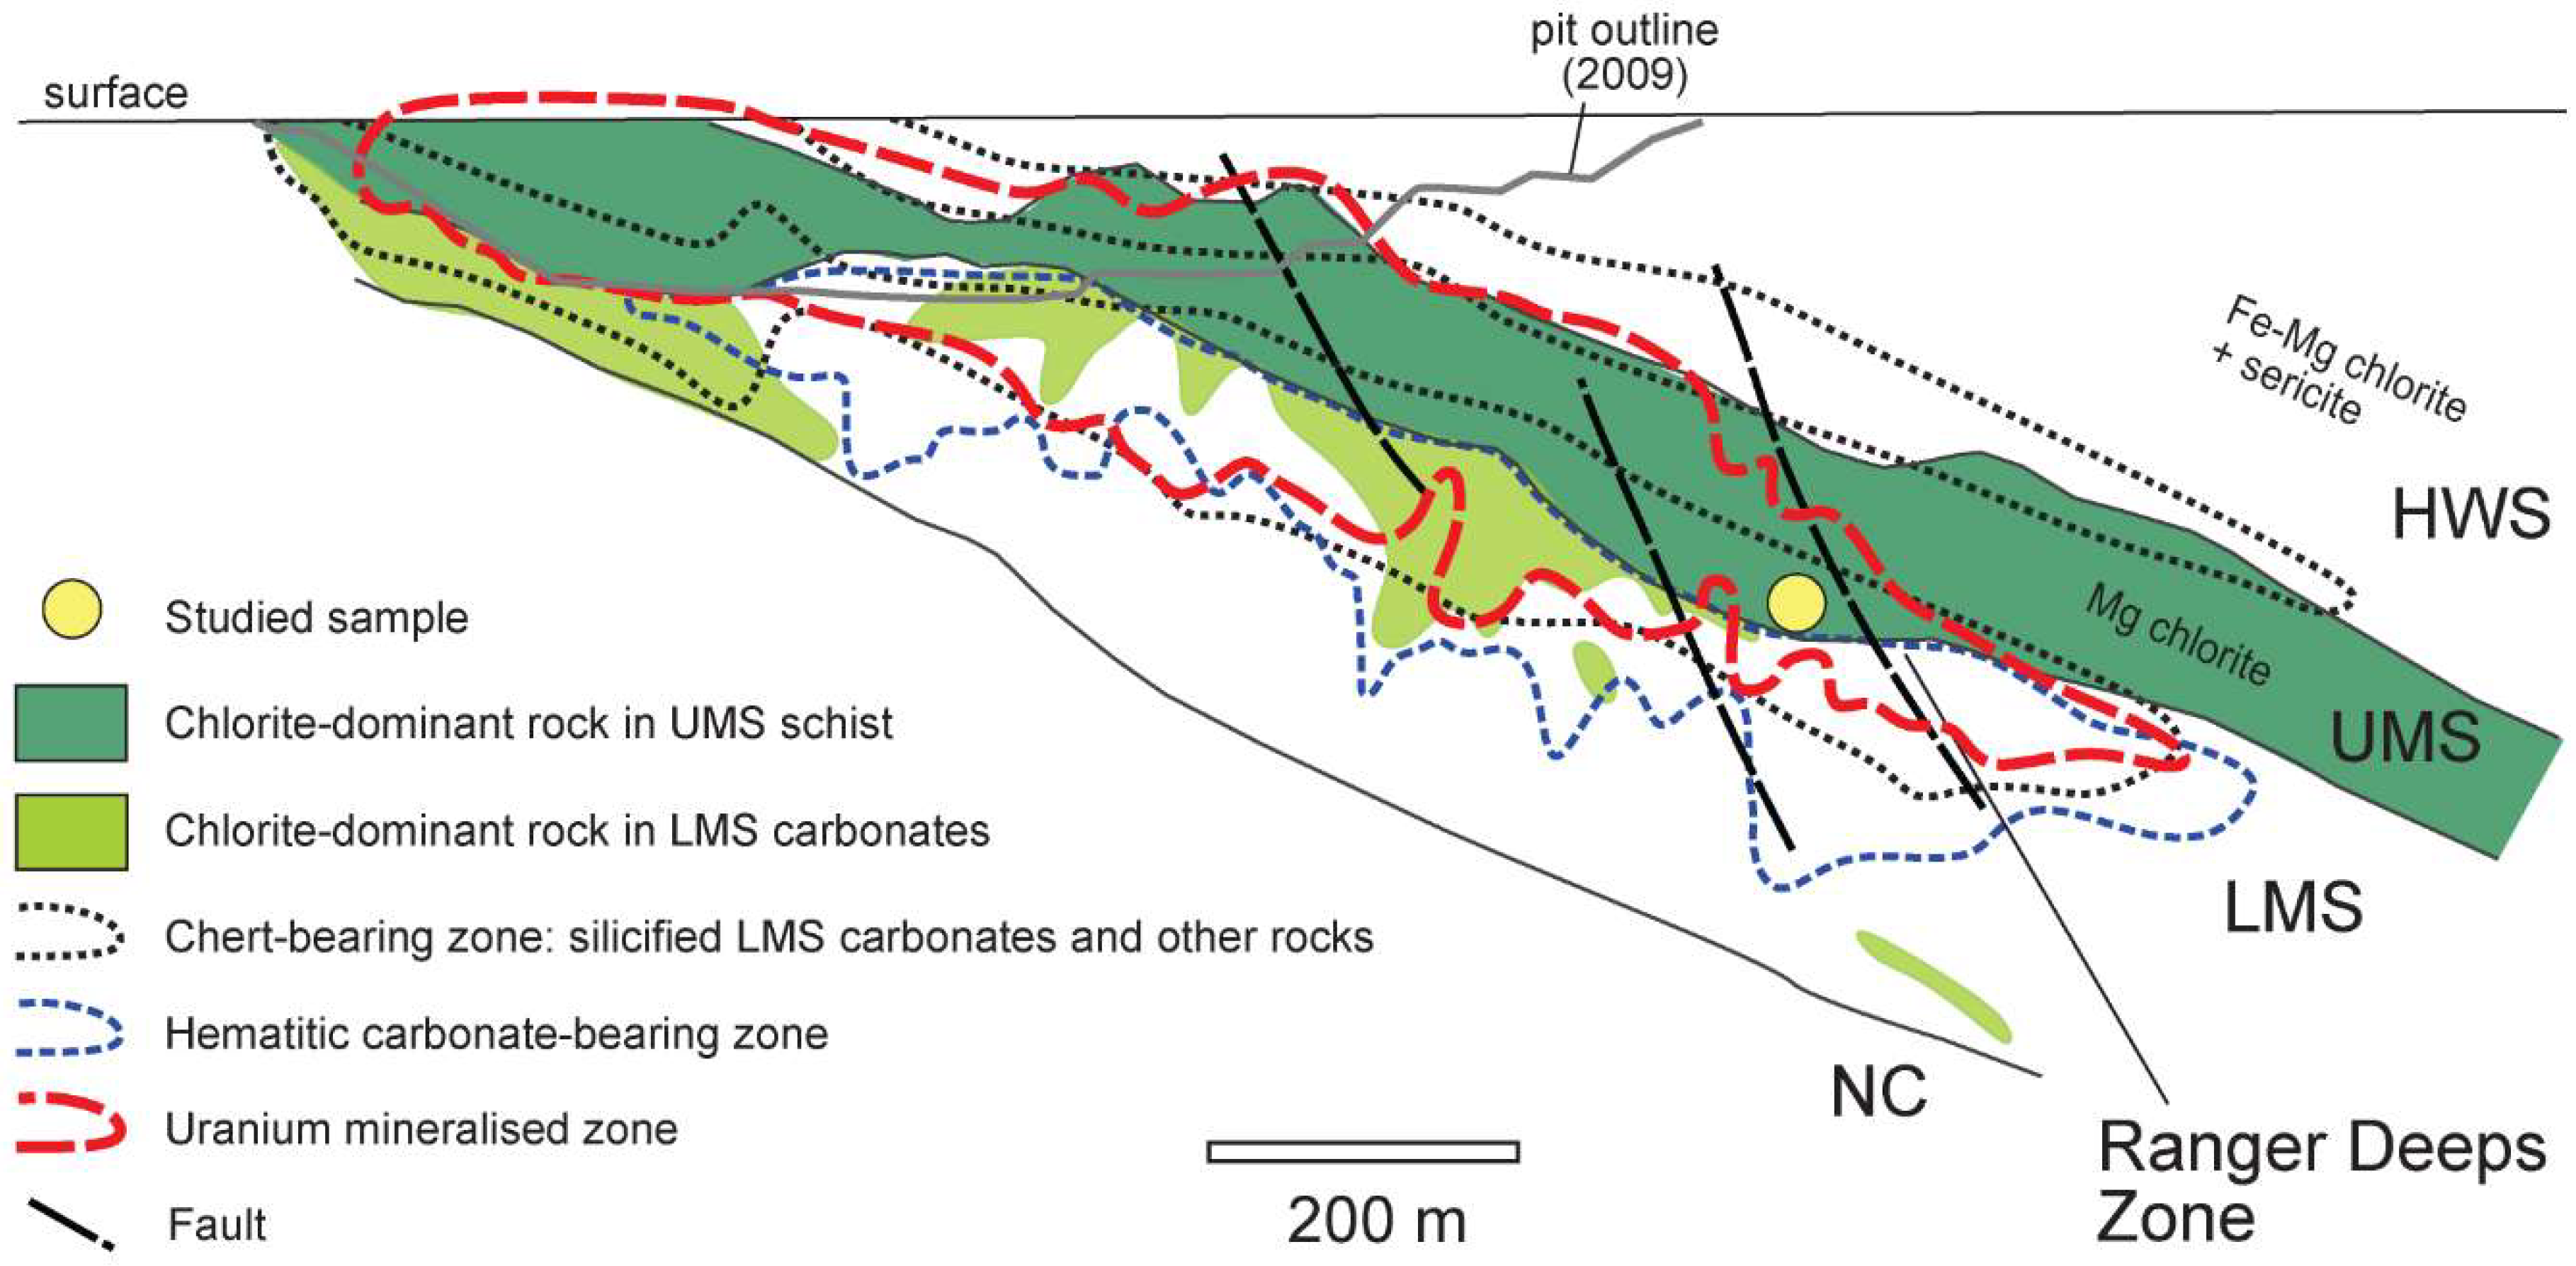
2. Geological Setting of the Ranger Uranium Deposit
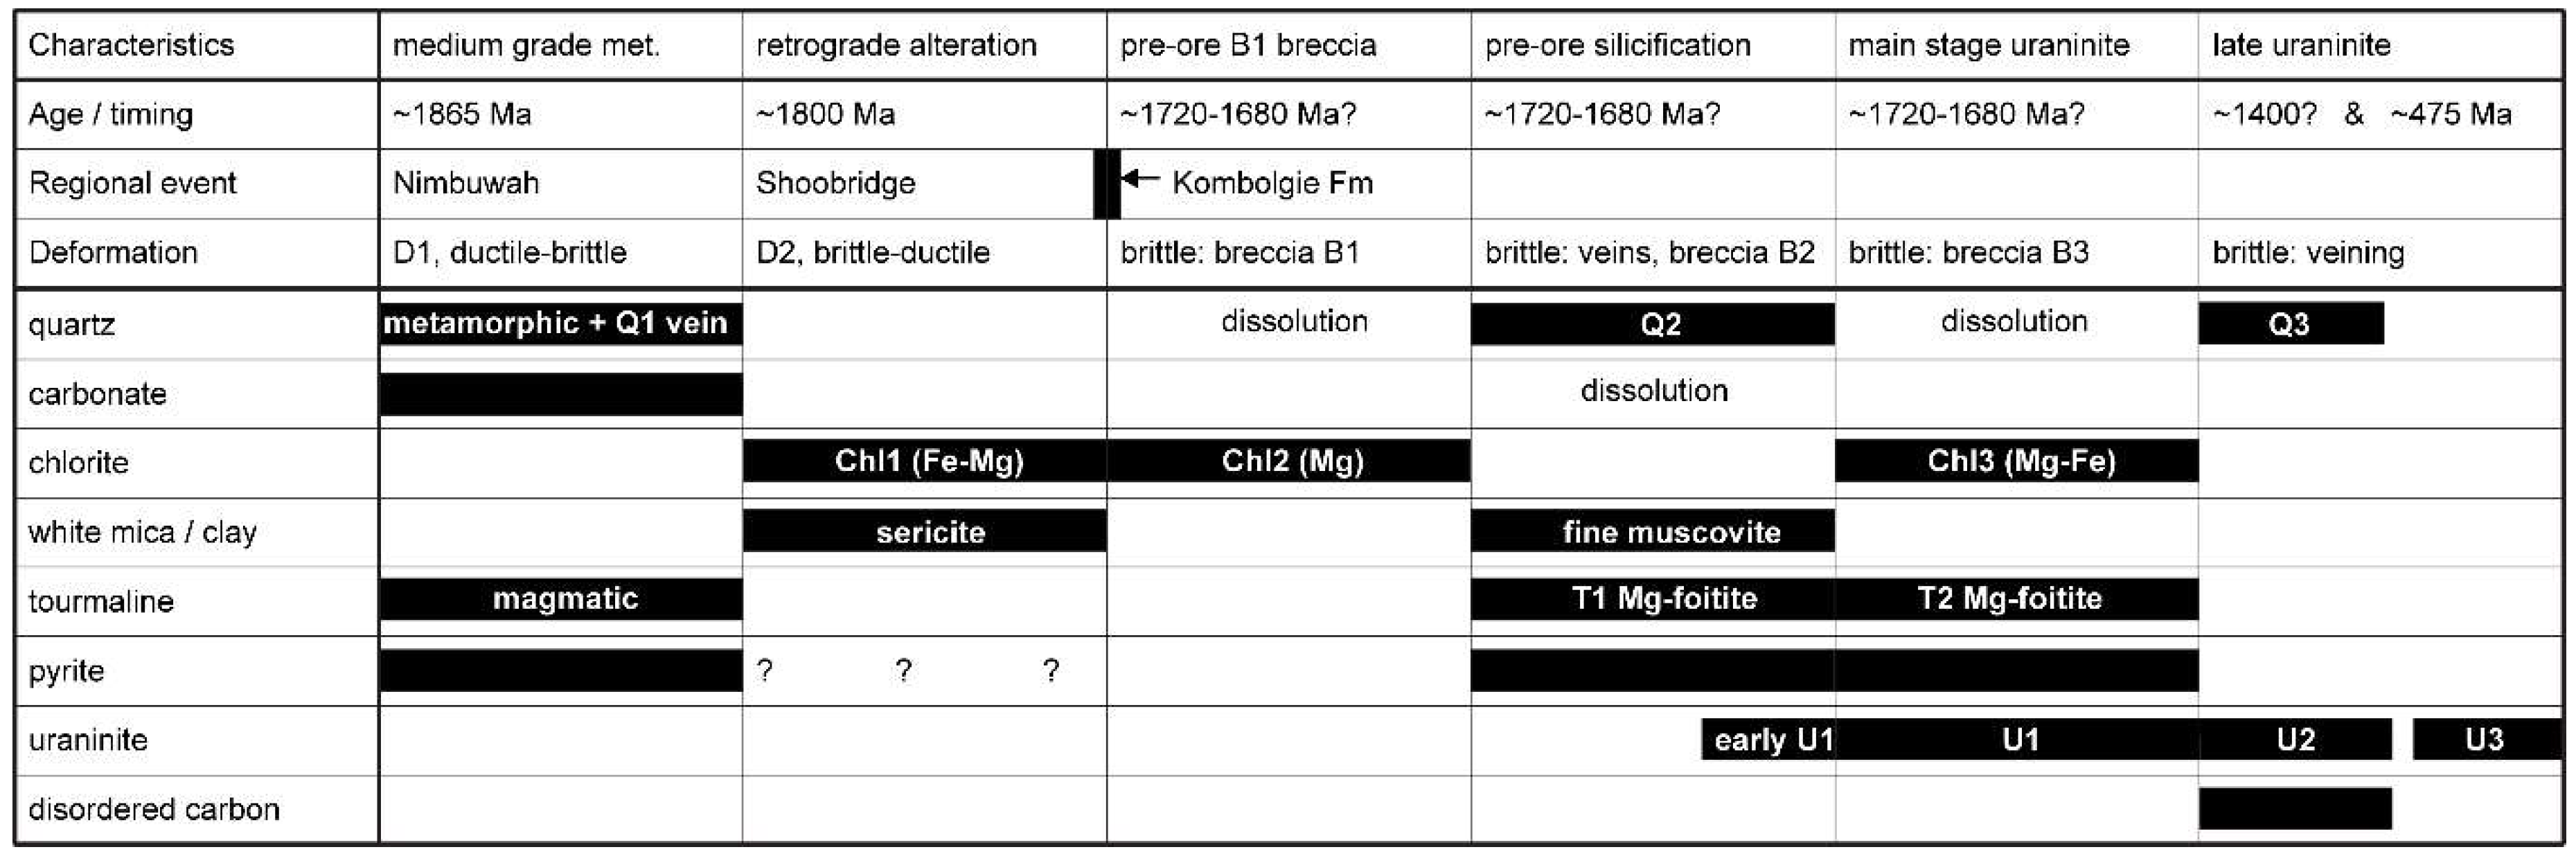
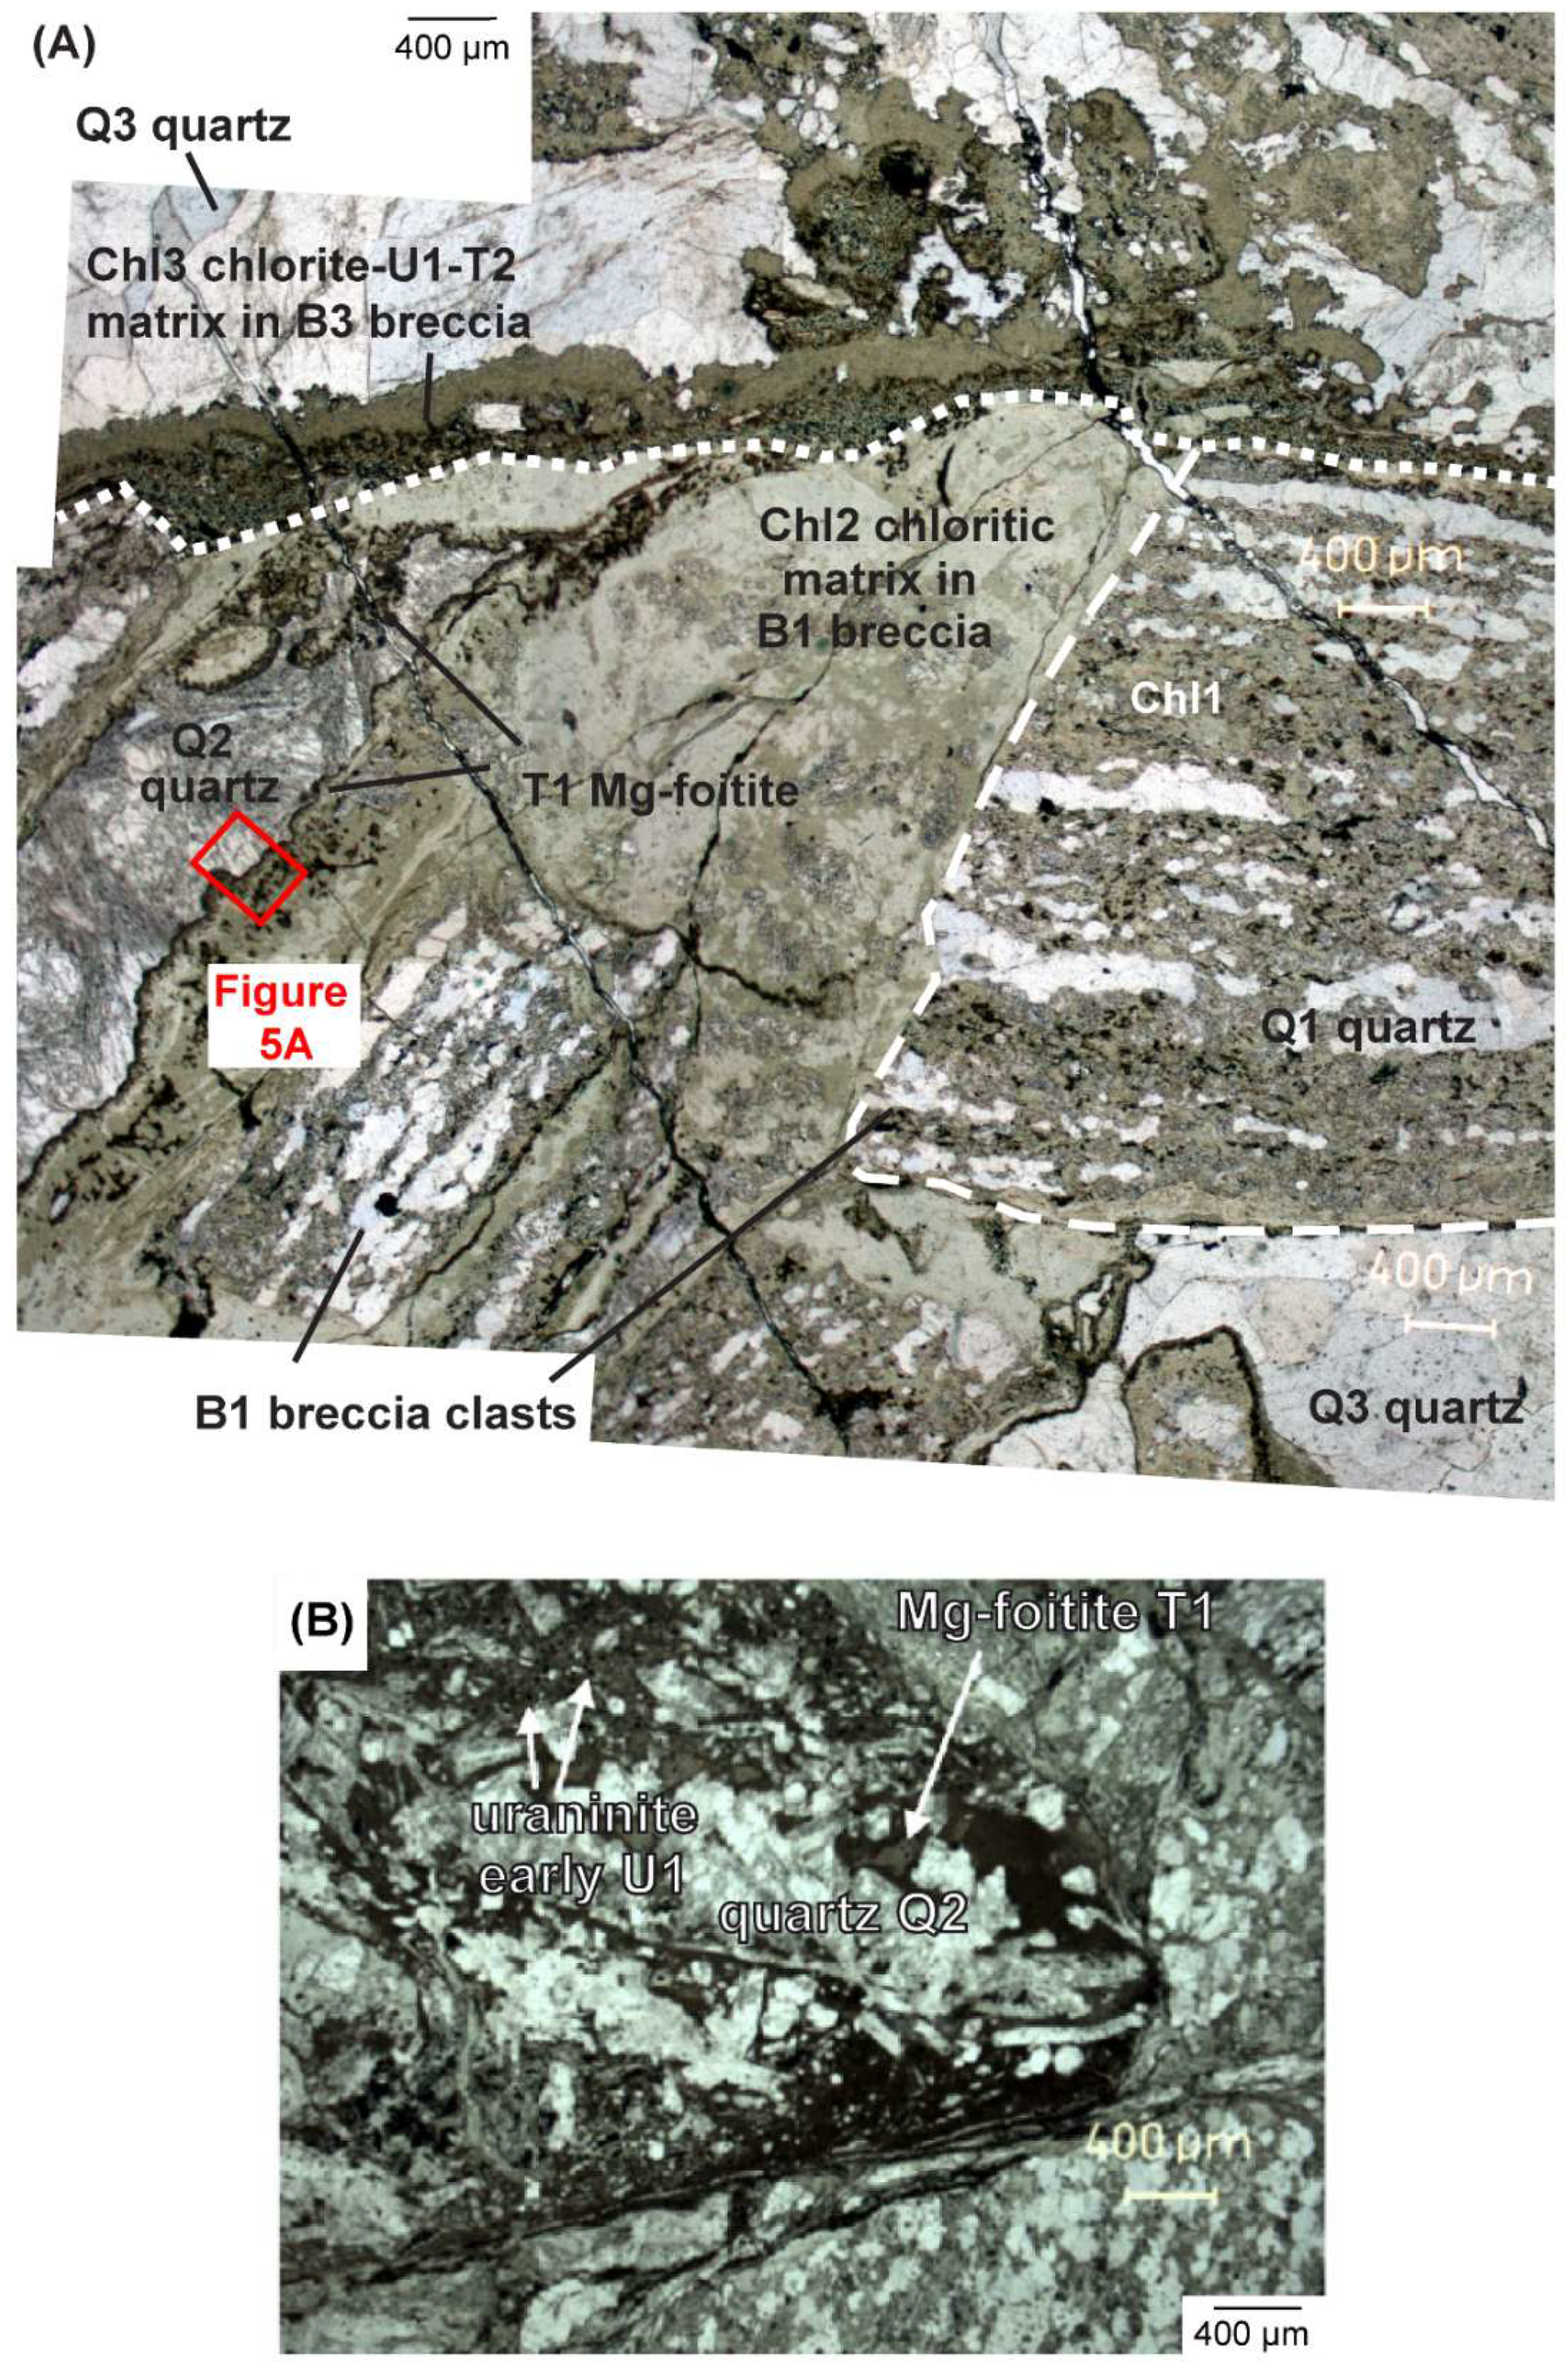
3. Paragenetic Sequence and Tourmaline Occurrence
4. Materials and Methods
4.1. Scanning Electron Microscopy
4.2. Electron Probe Microanalyses
4.3. Secondary Ion Mass Spectrometry
5. Results
5.1. Tourmaline Chemistry
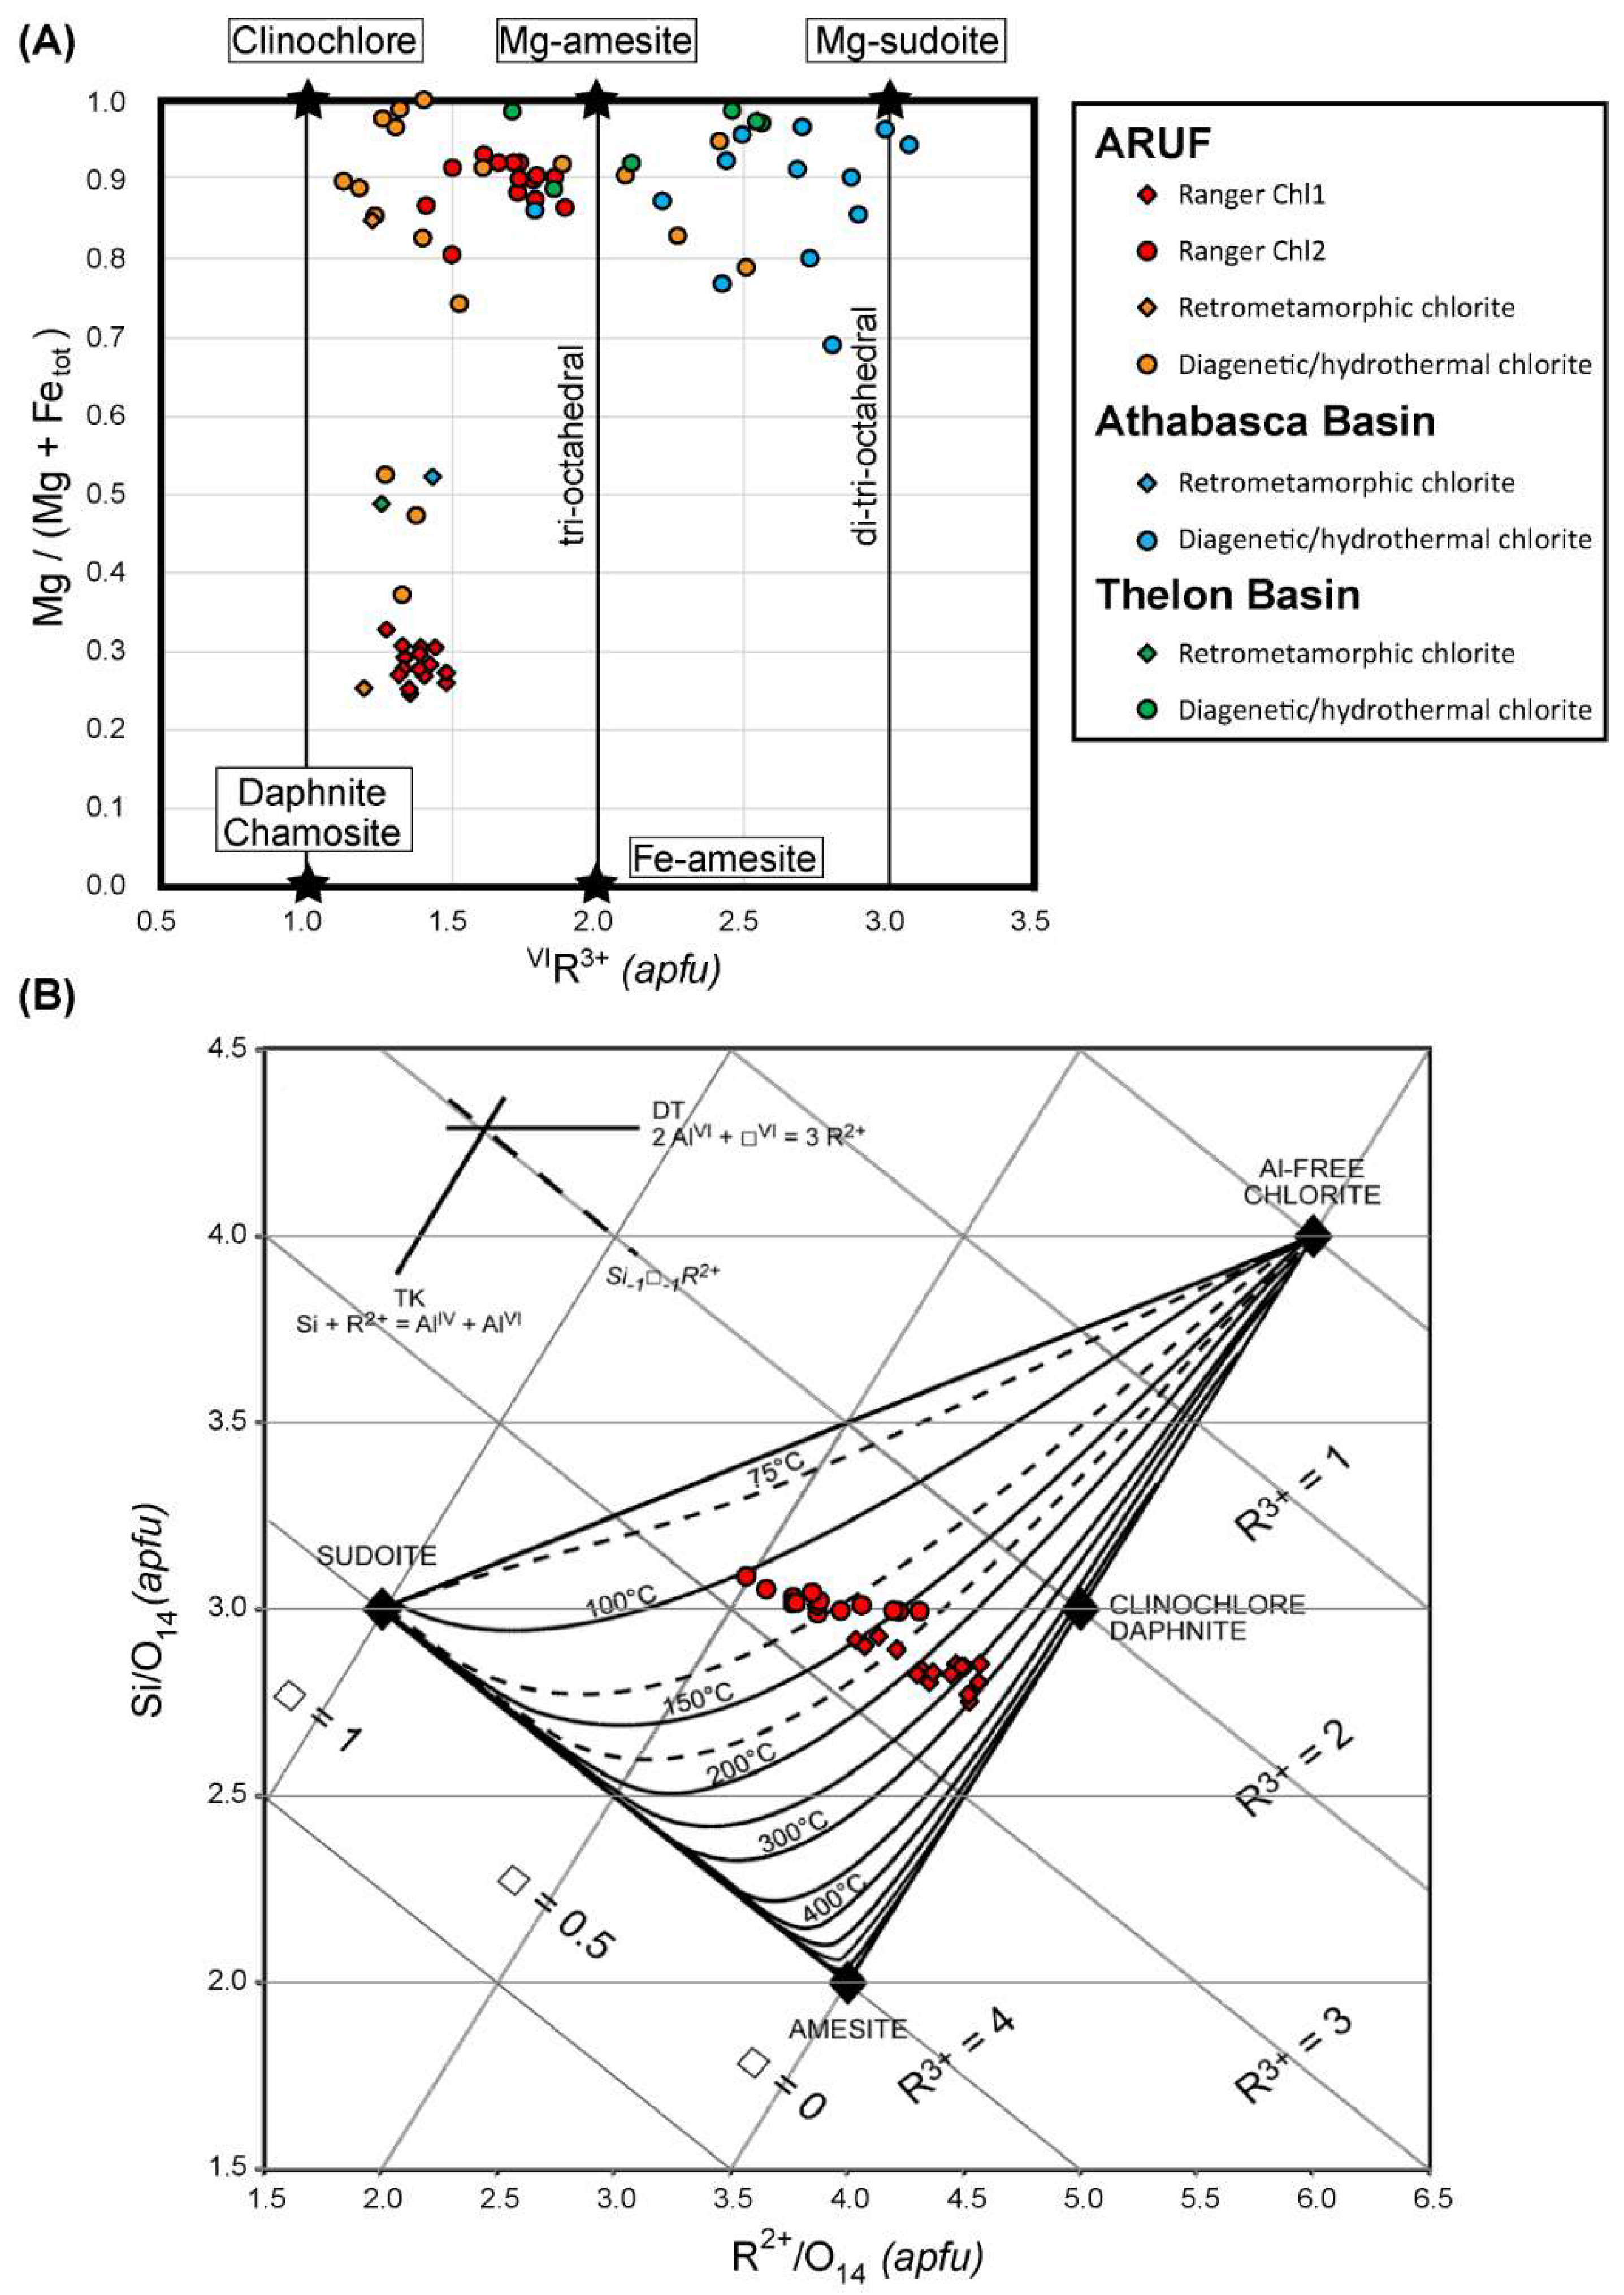
5.2. Chlorite Chemistry and Thermometry
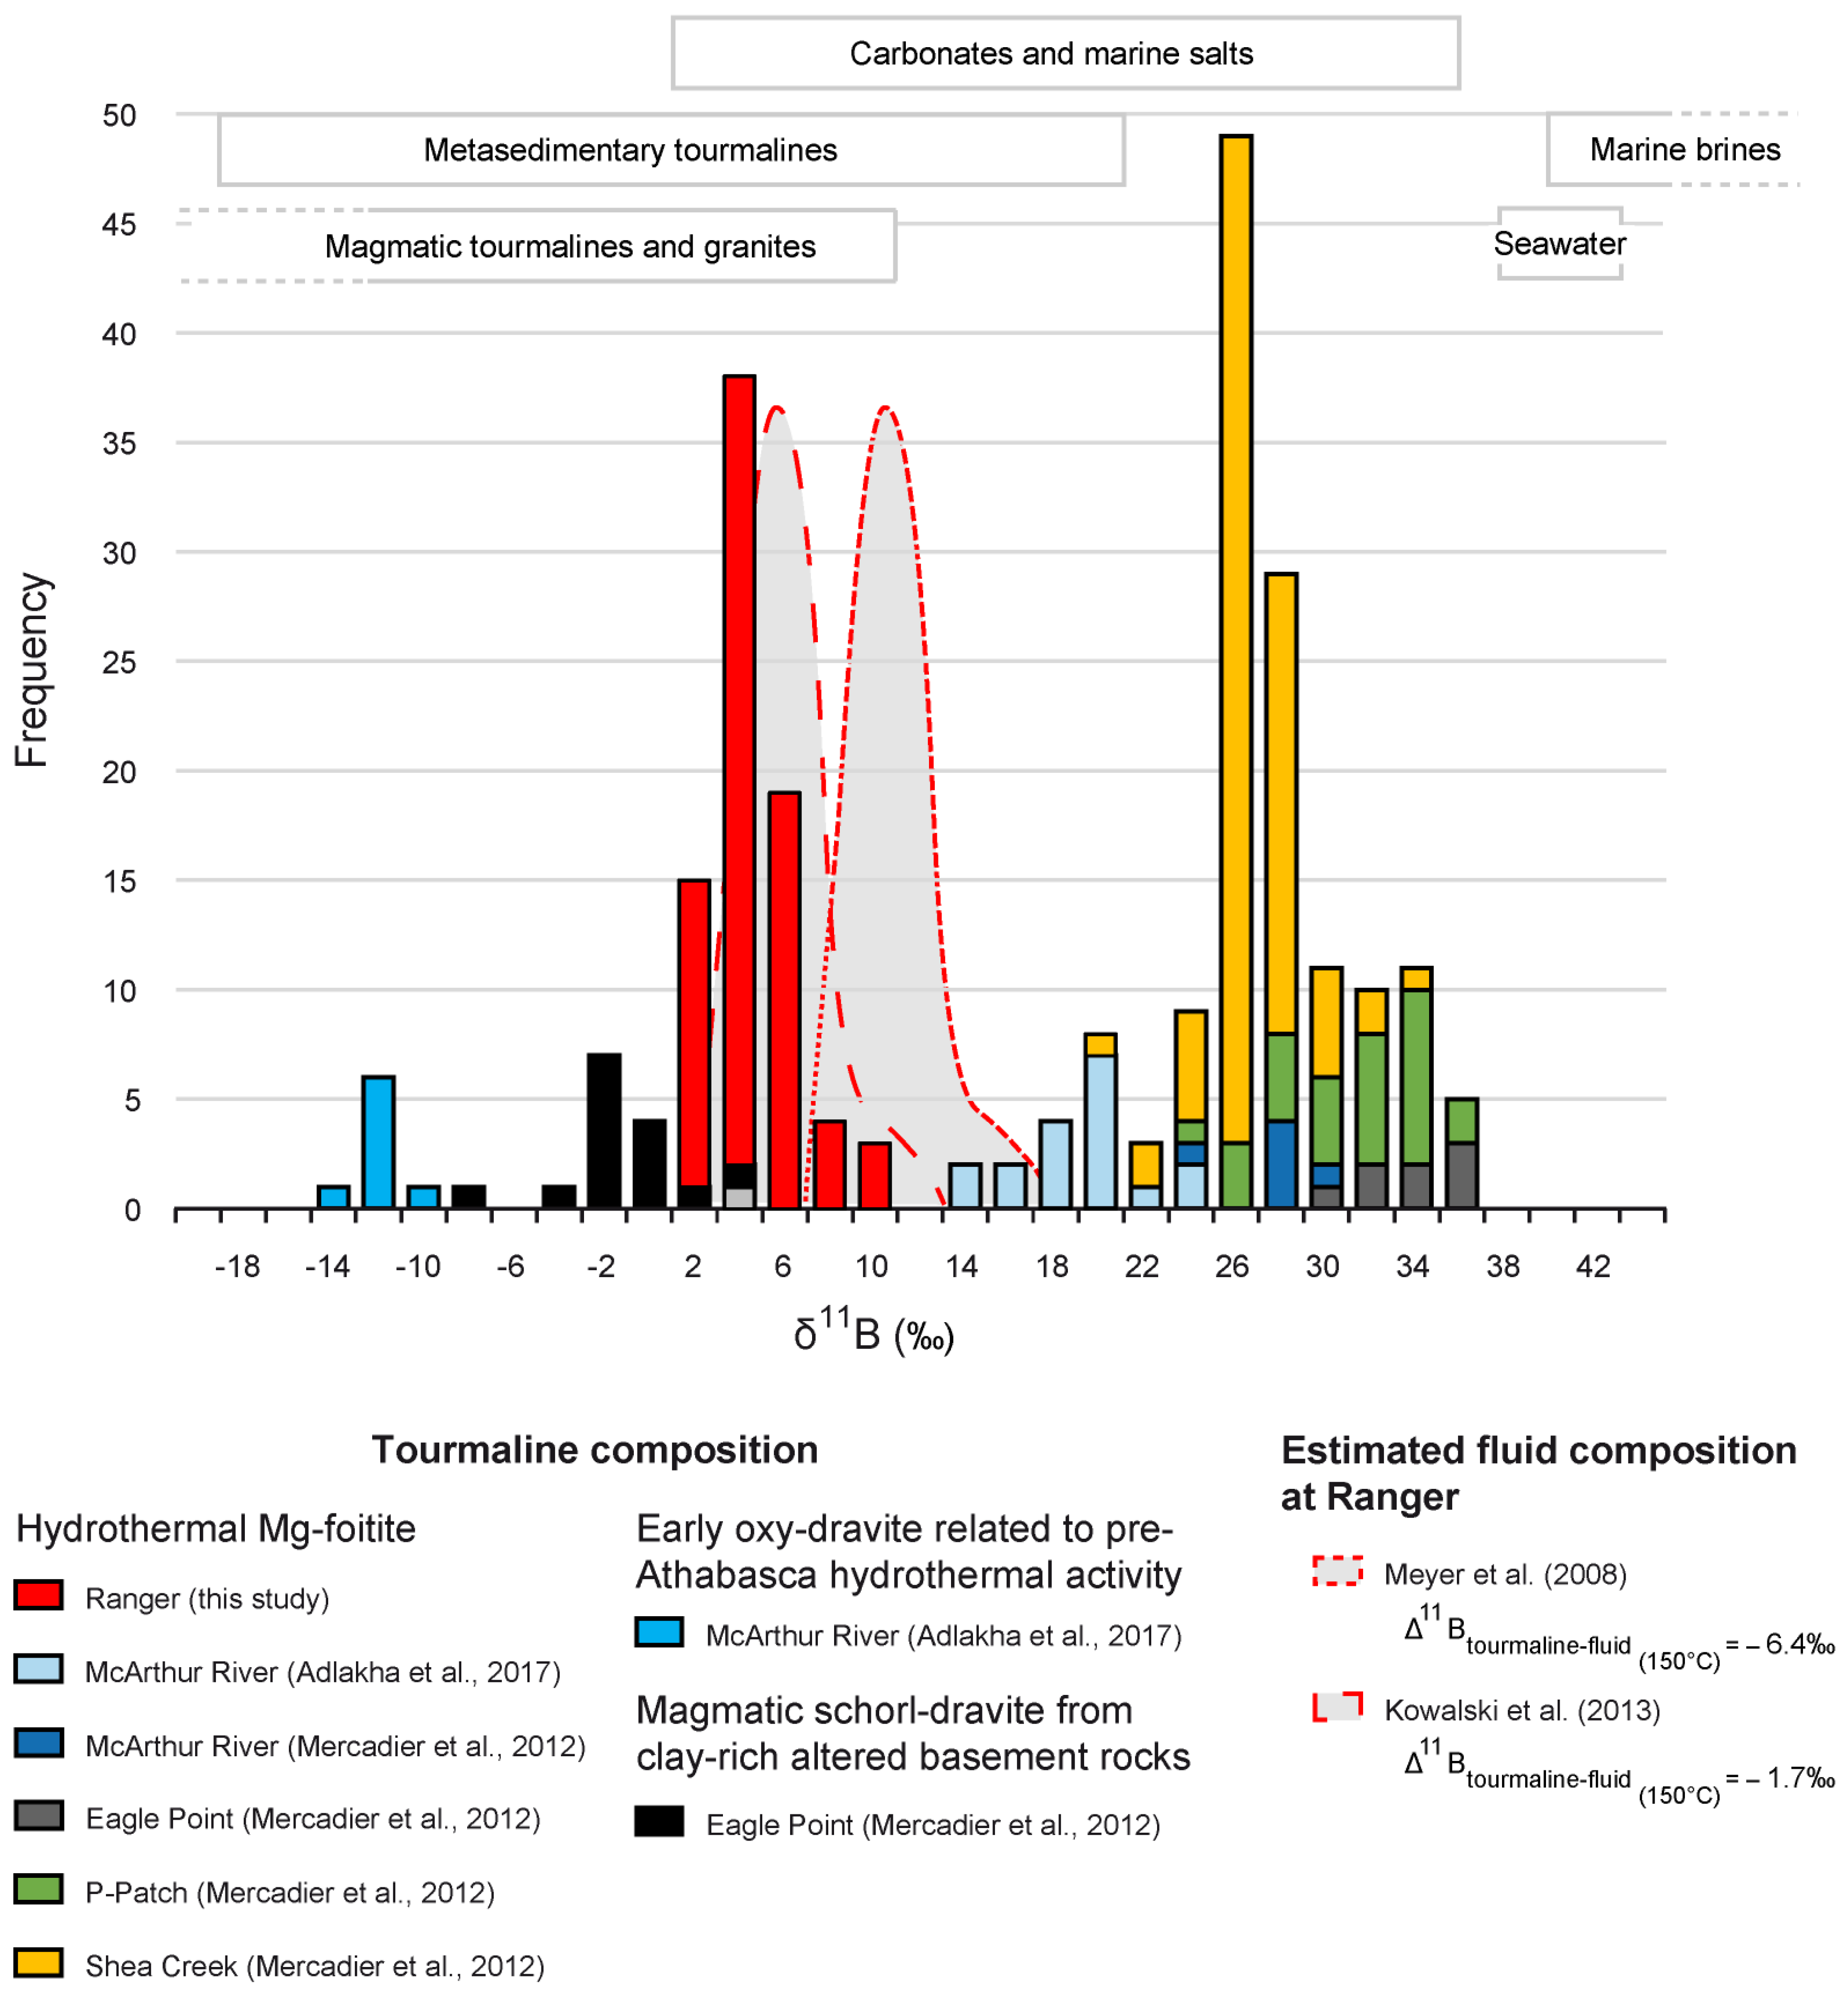
5.3. Boron Isotopes in Tourmaline
6. Discussion and Conclusions
6.1. Comparison between Unconformity-Related Deposits of the Alligator Rivers Uranium Field (Australia) and the Athabasca and Thelon Basins (Canada)
6.2. Insights into Boron and Magnesium Metasomatism
Author Contributions
Funding
Acknowledgments
Conflicts of Interest
References
- Jefferson, C.W.; Thomas, D.J.; Gandhi, S.S.; Ramaekers, P.; Delaney, G.; Brisbin, D.; Cutts, C.; Portella, P.; Olson, R.A. Unconformity-associated uranium deposits of the Athabasca Basin, Saskatchewan and Alberta. Bull. Geol. Surv. Can. 2007, 588, 23. [Google Scholar]
- Cuney, M.; Kyser, K. Geology and Geochemistry of Uranium and Thorium Deposits; Mineralogical Association of Canada: Québec, QC, Canada, 2015; Volume 46, ISBN 0-921294-57-3. [Google Scholar]
- International Atomic Energy Agency. Unconformity-Related Uranium Deposits; International Atomic Energy: Vienna, Austria, 2018; ISBN 978-92-0-108518-4. [Google Scholar]
- Skirrow, R.G.; Mercadier, J.; Armstrong, R.; Kuske, T.; Deloule, E. The Ranger uranium deposit, northern Australia: Timing constraints, regional and ore-related alteration, and genetic implications for unconformity-related mineralisation. Ore Geol. Rev. 2016, 76, 463–503. [Google Scholar] [CrossRef]
- Mercadier, J.; Cuney, M.; Cathelineau, M.; Lacorde, M. U redox fronts and kaolinisation in basement-hosted unconformity-related U ores of the Athabasca Basin (Canada): Late U remobilisation by meteoric fluids. Miner. Depos. 2011, 46, 105–135. [Google Scholar] [CrossRef]
- Boiron, M.-C.; Cathelineau, M.; Richard, A. Fluid flows and metal deposition near basement/cover unconformity: Lessons and analogies from Pb–Zn–F–Ba systems for the understanding of Proterozoic U deposits. Geofluids 2010, 10, 270–292. [Google Scholar]
- Chi, G.; Chu, H.; Petts, D.; Potter, E.; Jackson, S.; Williams-Jones, A. Uranium-rich diagenetic fluids provide the key to unconformity-related uranium mineralization in the Athabasca Basin. Sci. Rep. 2019, 9, 5530. [Google Scholar] [CrossRef]
- Chi, G.; Haid, T.; Quirt, D.; Fayek, M.; Blamey, N.; Chu, H. Petrography, fluid inclusion analysis, and geochronology of the End uranium deposit, Kiggavik, Nunavut, Canada. Miner. Depos. 2017, 52, 211–232. [Google Scholar] [CrossRef]
- Derome, D.; Cathelineau, M.; Fabre, C.; Boiron, M.-C.; Banks, D.; Lhomme, T.; Cuney, M. Paleo-fluid composition determined from individual fluid inclusions by Raman and LIBS: Application to mid-proterozoic evaporitic Na-Ca brines (Alligator Rivers Uranium Field, northern territories Australia). Chem. Geol. 2007, 237, 240–254. [Google Scholar] [CrossRef]
- Derome, D.; Cuney, M.; Cathelineau, M.; Fabre, C.; Dubessy, J.; Bruneton, P.; Hubert, A. A detailed fluid inclusion study in silicified breccias from the Kombolgie sandstones (Northern Territory, Australia): Inferences for the genesis of middle-Proterozoic unconformity-type uranium deposits. J. Geochem. Explor. 2003, 80, 259–275. [Google Scholar] [CrossRef]
- Kotzer, T.G.; Kyser, T.K. Petrogenesis of the Proterozoic Athabasca Basin, northern Saskatchewan, Canada, and its relation to diagenesis, hydrothermal uranium mineralization and paleohydrogeology. Chem. Geol. 1995, 120, 45–89. [Google Scholar] [CrossRef]
- Martz, P.; Mercadier, J.; Cathelineau, M.; Boiron, M.-C.; Quirt, D.; Doney, A.; Gerbeaud, O.; De Wally, E.; Ledru, P. Formation of U-rich mineralizing fluids through basinal brine migration within basement-hosted shear zones: A large-scale study of the fluid chemistry around the unconformity-related Cigar Lake U deposit (Saskatchewan, Canada). Chem. Geol. 2019, 508, 116–143. [Google Scholar] [CrossRef]
- Renac, C.; Kyser, T.K.; Durocher, K.; Dreaver, G.; O’connor, T. Comparison of diagenetic fluids in the Proterozoic Thelon and Athabasca Basins, Canada: Implications for protracted fluid histories in stable intracratonic basins. Can. J. Earth Sci. 2002, 39, 113–132. [Google Scholar] [CrossRef]
- Durak, B.; Pagel, M.; Poty, B. Températures et Salinités des Fluides au Cours des Silicifications Diagénétiques D’une Formation Gréseuse Surmontant un Gisement D’uranium du Socle: L’exemple des Grès Kombolgie (Australie); Comptes rendus de l’Académie des Sciences de Paris: Paris, France, 1983; pp. 571–574. [Google Scholar]
- Richard, A.; Cathelineau, M.; Boiron, M.-C.; Mercadier, J.; Banks, D.A.; Cuney, M. Metal-rich fluid inclusions provide new insights into unconformity-related U deposits (Athabasca Basin and Basement, Canada). Miner. Depos. 2016, 51, 249–270. [Google Scholar] [CrossRef]
- Richard, A.; Rozsypal, C.; Mercadier, J.; Banks, D.A.; Cuney, M.; Boiron, M.-C.; Cathelineau, M. Giant uranium deposits formed from exceptionally uranium-rich acidic brines. Nat. Geosci. 2012, 5, 142–146. [Google Scholar] [CrossRef]
- Mercadier, J.; Richard, A.; Boiron, M.-C.; Cathelineau, M.; Cuney, M. Migration of brines in the basement rocks of the Athabasca Basin through microfracture networks (P-Patch U deposit, Canada). Lithos 2010, 115, 121–136. [Google Scholar] [CrossRef]
- Richard, A.; Pettke, T.; Cathelineau, M.; Boiron, M.-C.; Mercadier, J.; Cuney, M.; Derome, D. Brine-rock interaction in the Athabasca basement (McArthur River U deposit, Canada): Consequences for fluid chemistry and uranium uptake. Terra Nova 2010, 303–308. [Google Scholar] [CrossRef]
- Grare, A.; Benedicto, A.; Mercadier, J.; Lacombe, O.; Travé, A.; Guilcher, M.; Richard, A.; Ledru, P.; Blain, M.; Robbins, J.; et al. Structural controls and metallogenic model of polyphase uranium mineralization in the Kiggavik area (Nunavut, Canada). Miner. Depos. 2019. submitted. [Google Scholar]
- Derome, D.; Cathelineau, M.; Cuney, M.; Fabre, C.; Lhomme, T.; Banks, D.A. Mixing of sodic and calcic brines and uranium deposition at McArthur River, Saskatchewan, Canada: A Raman and laser-induced breakdown spectroscopic study of fluid inclusions. Econ. Geol. 2005, 100, 1529–1545. [Google Scholar] [CrossRef]
- Leisen, M.; Boiron, M.-C.; Richard, A.; Dubessy, J. Determination of Cl and Br concentrations in individual fluid inclusions by combining microthermometry and LA-ICPMS analysis: Implications for the origin of salinity in crustal fluids. Chem. Geol. 2012, 330, 197–206. [Google Scholar] [CrossRef]
- Richard, A.; Kendrick, M.A.; Cathelineau, M. Noble gases (Ar, Kr, Xe) and halogens (Cl, Br, I) in fluid inclusions from the Athabasca Basin (Canada): Implications for unconformity-related U deposits. Precambrian Res. 2014, 247, 110–125. [Google Scholar] [CrossRef]
- Richard, A.; Banks, D.A.; Mercadier, J.; Boiron, M.-C.; Cuney, M.; Cathelineau, M. An evaporated seawater origin for the ore-forming brines in unconformity-related uranium deposits (Athabasca Basin, Canada): Cl/Br and δ37Cl analysis of fluid inclusions. Geochim. Cosmochim. Acta 2011, 75, 2792–2810. [Google Scholar] [CrossRef]
- Richard, A.; Cauzid, J.; Cathelineau, M.; Boiron, M.-C.; Mercadier, J.; Cuney, M. Synchrotron XRF and XANES investigation of uranium speciation and element distribution in fluid inclusions from unconformity-related uranium deposits. Geofluids 2013, 13, 101–111. [Google Scholar] [CrossRef]
- Nutt, C.J. Chloritization and associated alteration at the Jabiluka unconformity-type uranium deposit, Northern Territory, Australia. Can. Mineral. 1989, 27, 41–58. [Google Scholar]
- Fisher, L.A.; Cleverley, J.S.; Pownceby, M.; MacRae, C. 3D representation of geochemical data, the corresponding alteration and associated REE mobility at the Ranger uranium deposit, Northern Territory, Australia. Miner. Depos. 2013, 48, 947–966. [Google Scholar] [CrossRef]
- Earle, S.A.M.; Sopuck, V.J. Regional lithogeochemistry of the eastern part of the Athabasca Basin uranium province, Saskatchewan, Canada. In Uranium Resources and Geology of North America; Muller-Kahle, E., Ed.; International Agency of Nuclear Energy: Vienna, Austria, 1989; Volume TECHDOC-500, pp. 263–269. [Google Scholar]
- Kister, P.; Vieillard, P.; Cuney, M.; Quirt, D.; Laverret, E. Thermodynamic constraints on the mineralogical and fluid composition evolution in a clastic sedimentary basin: The Athabasca Basin (Saskatchewan, Canada). Eur. J. Mineral. 2005, 17, 325–341. [Google Scholar] [CrossRef]
- Kister, P.; Laverret, E.; Quirt, D.; Cuney, M.; Mas, P.P.; Beaufort, D.; Bruneton, P. Mineralogy and geochemistry of the host-rock alterations associated with the Shea Creek unconformity-type uranium deposits (Athabasca Basin, Saskatchewan, Canada). Part 2. Regional-scale spatial distribution of the Athabasca Group sandstone matrix minerals. Clays Clay Miner. 2006, 54, 295–313. [Google Scholar] [CrossRef]
- Polito, P.A.; Kyser, T.K.; Thomas, D.; Marlatt, J.; Drever, G. Re-evaluation of the petrogenesis of the Proterozoic Jabiluka unconformity-related uranium deposit, Northern Territory, Australia. Miner. Depos. 2005, 40, 257–288. [Google Scholar] [CrossRef]
- Adlakha, E.E.; Hattori, K. Paragenesis and composition of tcourmaline types along the P2 Fault and Mcarthur River uranium deposit, Athabasca Basin, Canada. Can. Mineral. 2016, 54, 661–679. [Google Scholar] [CrossRef]
- Adlakha, E.E.; Hattori, K.; Davis, W.J.; Boucher, B. Characterizing fluids associated with the McArthur River U deposit, Canada, based on tourmaline trace element and stable (B, H) isotope compositions. Chem. Geol. 2017, 466, 417–435. [Google Scholar] [CrossRef]
- Mercadier, J.; Richard, A.; Cathelineau, M. Boron-and magnesium-rich marine brines at the origin of giant unconformity-related uranium deposits: δ11B evidence from Mg-tourmalines. Geology 2012, 40, 231–234. [Google Scholar] [CrossRef]
- Marschall, H.R.; Jiang, S.-Y. Tourmaline Isotopes: No Element Left Behind. Elements 2011, 7, 313–319. [Google Scholar] [CrossRef]
- Energy Resources of Australia Ltd. Annual Statement of Reserves and Resources; Energy Resources of Australia Ltd.: Darwin, Australia, 2011. [Google Scholar]
- Lally, J.H.; Bajwah, Z. Uranium Deposits of the Northern Territory; Northern Territory Geological Survey: Darwin, Australia, 2006.
- International Atomic Energy Agency. Geological Classification of Uranium Deposits and Description of Selected Examples; International Atomic Energy Agency: Vienna, Austria, 2018; ISBN 978-92-0-101618-8. [Google Scholar]
- Worden, K.; Carson, C.; Scrimgeour, I.; Lally, J.; Doyle, N. A revised Palaeoproterozoic chronostratigraphy for the Pine Creek Orogen, northern Australia: Evidence from SHRIMP U–Pb zircon geochronology. Precambrian Res. 2008, 166, 122–144. [Google Scholar] [CrossRef]
- Hollis, J.A.; Carson, C.J.; Glass, L.M. SHRIMP U–Pb zircon geochronological evidence for Neoarchean basement in western Arnhem Land, northern Australia. Precambrian Res. 2009, 174, 364–380. [Google Scholar] [CrossRef]
- Hollis, J.A.; Glass, L.M.; Carson, C.J.; Armstrong, R.; Yaxley, G.M.; Kemp, A.I.S.; Phillips, D. The Geological Evolution of the Pine Creek Orogen: New pieces in the Puzzle on Orogen and Craton Scale. In Proceedings of the Annual Geoscience Exploration Seminar (AGES), Alice Springs, Australia, 20–21 March 2011; Volume 18. [Google Scholar]
- Hollis, J.A.; Wygralak, A.S. A review of the geology and uranium, gold and iron ore deposits of the Pine Creek Orogen. Episodes 2012, 35, 264–272. [Google Scholar]
- Annesley, I.R.; Madore, C.; Kwok, Y.Y.; Kamo, S.L.; Troy, A.; Hughes, L. U–Pb geochronology and petrochemistry of late Barramundi pegmatites from the Ranger U deposit, Northern Territory, Australia. In Uranium Deposits: From Their Genesis to Their Environmental Aspect, Proceedings of the International Workshop “Uranium Deposits: From Their Genesis to their Environmental Aspects”, Uranium, Prague, 10–11 September 2002; Czech Geological Survey: Prague, Czech Republic, 2002. [Google Scholar]
- Potma, W.; Fisher, L.; Schaubs, P.; Cleverley, J.; Corbel, S.; Lau, I.; Phang, C.; Hough, R. JSU–ERA Ranger Mineral System Project Final Report. CSIRO National Research Flagships, Minerals Down under; Northern Territory Geological Survey: Darwin, Australia, 2012.
- Pevely, S.; Hinman, M.; McLellan, A. Ranger 3 Deeps uranium deposit. In Australian Ore Deposits; Phillips, N., Ed.; Australasian Institute of Mining and Metallurgy: Carlton, Australia, 2017; pp. 461–464. [Google Scholar]
- Energy Resources of Australia Ltd. Ranger 3 Deeps Exploration Decline Project—Further Underground Drilling Results Released; Energy Resources of Australia Ltd.: Darwin, Australia, 2014. [Google Scholar]
- Polito, P.A.; Kyser, T.K.; Marlatt, J.; Alexandre, P.; Bajwah, Z.; Drever, G. Significance of alteration assemblages for the origin and evolution of the Proterozoic Nabarlek unconformity-related uranium deposit, Northern Territory, Australia. Econ. Geol. 2004, 99, 113–139. [Google Scholar]
- Kyser, K.; Hiatt, E.; Renac, C.; Durocher, K.; Holk, G.; Deckart, K. Diagenetic fluids in Paleo-and Meso-Proterozoic sedimentary basins and their implications for long protracted fluid histories. Mineral. Assoc. Can. Short Course 2000, 28, 225–262. [Google Scholar]
- Yavuz, F.; Karakaya, N.; Yıldırım, D.K.; Karakaya, M.Ç.; Kumral, M. A Windows program for calculation and classification of tourmaline-supergroup (IMA-2011). Comput. Geosci. 2014, 63, 70–87. [Google Scholar] [CrossRef]
- Henry, D.J.; Novak, M.; Hawthorne, F.C.; Ertl, A.; Dutrow, B.L.; Uher, P.; Pezzotta, F. Nomenclature of the tourmaline-supergroup minerals. Am. Mineral. 2011, 96, 895–913. [Google Scholar] [CrossRef]
- Bourdelle, F.; Cathelineau, M. Low-temperature chlorite geothermometry: A graphical representation based on a T–R2+ –Si diagram. Eur. J. Mineral. 2015, 27, 617–626. [Google Scholar] [CrossRef]
- Chaussidon, M.; Albarède, F. Secular boron isotope variations in the continental crust: An ion microprobe study. Earth Planet. Sci. Lett. 1992, 108, 229–241. [Google Scholar] [CrossRef]
- Dyar, M.D.; Wiedenbeck, M.; Robertson, D.; Cross, L.R.; Delaney, J.S.; Ferguson, K.; Francis, C.A.; Grew, E.S.; Guidotti, C.V.; Hervig, R.L. Reference minerals for the microanalysis of light elements. Geostand. Newsl. 2001, 25, 441–463. [Google Scholar] [CrossRef]
- Leeman, W.P.; Tonarini, S. Boron isotopic analysis of proposed borosilicate mineral reference samples. Geostand. Newsl. 2001, 25, 399–403. [Google Scholar] [CrossRef]
- Catanzaro, E.J. Boric Acid: Isotopic and Assay Standard Reference Materials; National Bureau of Standards, Institute for Materials Research: Washington, DC, USA, 1970; Volume 260. [Google Scholar]
- Rosenberg, P.E.; Foit Jr, F.F. Magnesiofoitite from the uranium deposits of the Athabasca Basin, Saskatchewan, Canada. Can. Mineral. 2006, 44, 959–965. [Google Scholar] [CrossRef]
- Wiewióra, A.; Weiss, Z. Crystallochemical classifications of phyllosilicates based on the unified system of projection of chemical composition: II. The chlorite group. Clay Miner. 1990, 25, 83–92. [Google Scholar] [CrossRef]
- Plissart, G.; Féménias, O.; Mãruntiu, M.; Diot, H.; Demaiffe, D. Mineralogy and geothermometry of gabbro-derived listvenites in the Tisovita–Iuti ophiolite, Southwestern Romania. Can. Mineral. 2009, 47, 81–105. [Google Scholar] [CrossRef]
- Beaufort, D.; Patrier, P.; Laverret, E.; Bruneton, P.; Mondy, J. Clay alteration associated with Proterozoic unconformity-type uranium deposits in the East Alligator Rivers uranium field, Northern Territory, Australia. Econ. Geol. 2005, 100, 515–536. [Google Scholar] [CrossRef]
- Billault, V.; Beaufort, D.; Patrier, P.; Petit, S. Crystal chemistry of Fe-sudoites from uranium deposits in the Athabasca Basin (Saskatchewan, Canada). Clays Clay Miner. 2002, 50, 70–81. [Google Scholar] [CrossRef]
- Martz, P. Caractéristiques, Chronologie et Rôles des Circulations Fluides dans le Bassin D’athabasca et Son Socle: Implications dans la Formation et L’évolution du Gisement D’uranium de Cigar Lake. Unpublished Ph.D. Thesis, Université de Lorraine, Nancy, France, 2017. [Google Scholar]
- Vengosh, A.; Starinsky, A.; Kolodny, Y.; Chivas, A.R.; Raab, M. Boron isotope variations during fractional evaporation of sea water: New constraints on the marine vs. nonmarine debate. Geology 1992, 20, 799. [Google Scholar] [CrossRef]
- Barth, S. Boron isotope variations in nature: A synthesis. Geol. Rundsch. 1993, 82, 640–651. [Google Scholar] [CrossRef]
- Palmer, M.R.; Swihart, G.H. Boron isotope geochemistry; an overview. Rev. Mineral. Geochem. 1996, 33, 709–744. [Google Scholar]
- Meyer, C.; Wunder, B.; Meixner, A.; Romer, R.L.; Heinrich, W. Boron-isotope fractionation between tourmaline and fluid: An experimental re-investigation. Contrib. Mineral. Petro. 2008, 156, 259–267. [Google Scholar] [CrossRef]
- Kowalski, P.M.; Wunder, B.; Jahn, S. Ab initio prediction of equilibrium boron isotope fractionation between minerals and aqueous fluids at high P and T. Geochim. Cosmochim. Acta 2013, 101, 285–301. [Google Scholar] [CrossRef]
- Molnár, F.; Mänttäri, I.; O’Brien, H.; Lahaye, Y.; Pakkanen, L.; Johanson, B.; Käpyaho, A.; Sorjonen-Ward, P.; Whitehouse, M.; Sakellaris, G. Boron, sulphur and copper isotope systematics in the orogenic gold deposits of the Archaean Hattu schist belt, eastern Finland. Ore Geol. Rev. 2016, 77, 133–162. [Google Scholar] [CrossRef]
- MacGregor, J.; Grew, E.S.; De Hoog, J.C.; Harley, S.L.; Kowalski, P.M.; Yates, M.G.; Carson, C.J. Boron isotopic composition of tourmaline, prismatine, and grandidierite from granulite facies paragneisses in the Larsemann Hills, Prydz Bay, East Antarctica: Evidence for a non-marine evaporite source. Geochim. Cosmochim. Acta 2013, 123, 261–283. [Google Scholar] [CrossRef]
- Binns, R.A.; Ayres, D.E.; Wilmshurst, J.R.; Ramsden, A.R. Petrology and geochemistry of alteration associated with uranium mineralization at Jabiluka, Northern Territory, Australia. In Uranium in the Pine Creek Geosyncline; IAEA: Vienna, Austria, 1980. [Google Scholar]
- Polito, P.A.; Kyser, T.K.; Alexandre, P.; Hiatt, E.E.; Stanley, C.R. Advances in understanding the Kombolgie Subgroup and unconformity-related uranium deposits in the Alligator Rivers Uranium Field and how to explore for them using lithogeochemical principles. Aust. J. Earth Sci. 2011, 58, 453–474. [Google Scholar] [CrossRef]
- Williams, L.B.; Hervig, R.L.; Holloway, J.R.; Hutcheon, I. Boron isotope geochemistry during diagenesis. Part, I. Experimental determination of fractionation during illitization of smectite. Geochim. Cosmochim. Acta 2001, 65, 1769–1782. [Google Scholar] [CrossRef]
- Richard, A.; Boulvais, P.; Mercadier, J.; Boiron, M.-C.; Cathelineau, M.; Cuney, M.; France-Lanord, C. From evaporated seawater to uranium-mineralizing brines: Isotopic and trace element study of quartz–dolomite veins in the Athabasca system. Geochim. Cosmochim. Acta 2013, 113, 38–59. [Google Scholar] [CrossRef]
- Fontes, J.C.; Matray, J.M. Geochemistry and origin of formation brines from the Paris Basin, France: 1. Brines associated with Triassic salts. Chem. Geol. 1993, 109, 149–175. [Google Scholar] [CrossRef]
- London, D.; Morgan, G.B.; Wolf, M.B. Boron in granitic rocks and their contact aureoles. Boron 1996, 33, 299–330. [Google Scholar]


| Analysis # | SiO2 | TiO2 | Al2O3 | FeO | MgO | CaO | Na2O | K2O | F | H2O | B2O3 | Total |
|---|---|---|---|---|---|---|---|---|---|---|---|---|
| 2 | 37.93 | 0.00 | 35.25 | 0.35 | 10.03 | 0.16 | 0.53 | 0.00 | 0.10 | 2.97 | 10.98 | 98.27 |
| 3 | 38.17 | 0.00 | 35.18 | 0.33 | 9.55 | 0.15 | 0.47 | 0.00 | 0.13 | 2.92 | 10.91 | 97.76 |
| 4 | 38.31 | 0.02 | 36.10 | 0.17 | 9.88 | 0.16 | 0.44 | 0.00 | 0.02 | 3.02 | 11.09 | 99.21 |
| 5 | 37.02 | 0.00 | 34.75 | 0.26 | 9.59 | 0.17 | 0.36 | 0.00 | 0.08 | 2.87 | 10.72 | 95.78 |
| 6 | 38.11 | 0.00 | 35.74 | 0.14 | 9.78 | 0.13 | 0.43 | 0.04 | 0.14 | 2.93 | 11.00 | 98.41 |
| 7 | 37.95 | 0.04 | 35.96 | 0.15 | 9.29 | 0.18 | 0.50 | 0.06 | 0.12 | 2.96 | 10.93 | 98.09 |
| 8 | 38.38 | 0.03 | 35.58 | 0.18 | 9.87 | 0.12 | 0.47 | 0.25 | 0.04 | 3.04 | 11.03 | 98.97 |
| 9 | 37.75 | 0.00 | 36.00 | 0.24 | 9.47 | 0.17 | 0.42 | 0.00 | 0.05 | 2.96 | 10.95 | 98.00 |
| 10 | 38.14 | 0.00 | 36.01 | 0.22 | 9.47 | 0.16 | 0.42 | 0.01 | 0.12 | 2.94 | 11.00 | 98.44 |
| 11 | 38.59 | 0.00 | 35.88 | 0.23 | 9.73 | 0.11 | 0.43 | 0.31 | 0.06 | 3.04 | 11.07 | 99.43 |
| 12 | 38.68 | 0.02 | 35.75 | 0.17 | 8.22 | 0.17 | 0.44 | 0.00 | 0.13 | 2.89 | 10.80 | 97.22 |
| 13 | 37.97 | 0.00 | 36.28 | 0.18 | 9.10 | 0.22 | 0.44 | 0.01 | 0.06 | 2.97 | 10.94 | 98.15 |
| 14 | 38.61 | 0.00 | 34.71 | 0.24 | 9.53 | 0.17 | 0.49 | 0.04 | 0.08 | 2.96 | 10.88 | 97.69 |
| 16 | 37.89 | 0.00 | 35.88 | 0.18 | 8.79 | 0.25 | 0.44 | 0.06 | 0.06 | 2.95 | 10.83 | 97.30 |
| 18 | 37.63 | 0.00 | 35.06 | 0.12 | 9.92 | 0.15 | 0.39 | 0.09 | 0.09 | 2.93 | 10.88 | 97.24 |
| 19 | 37.25 | 0.00 | 34.87 | 0.17 | 9.83 | 0.16 | 0.48 | 0.08 | 0.10 | 2.93 | 10.79 | 96.64 |
| 20 | 37.65 | 0.00 | 35.49 | 0.15 | 9.60 | 0.14 | 0.45 | 0.16 | 0.11 | 2.95 | 10.88 | 97.53 |
| 21 | 38.74 | 0.00 | 36.00 | 0.31 | 9.52 | 0.14 | 0.45 | 0.04 | 0.06 | 3.00 | 11.08 | 99.33 |
| 22 | 37.09 | 0.04 | 35.83 | 0.23 | 9.07 | 0.20 | 0.37 | 0.07 | 0.08 | 2.91 | 10.78 | 96.64 |
| 24 | 37.75 | 0.02 | 36.00 | 0.24 | 9.66 | 0.17 | 0.48 | 0.09 | 0.07 | 3.00 | 10.99 | 98.46 |
| 26 | 38.18 | 0.00 | 35.58 | 0.24 | 9.59 | 0.16 | 0.38 | 0.04 | 0.12 | 2.92 | 10.97 | 98.16 |
| 27 | 38.81 | 0.00 | 35.94 | 0.29 | 9.42 | 0.15 | 0.39 | 0.22 | 0.07 | 3.01 | 11.06 | 99.34 |
| 28 | 36.70 | 0.01 | 34.70 | 0.11 | 9.88 | 0.14 | 0.49 | 0.00 | 0.05 | 2.92 | 10.71 | 95.70 |
| 29 | 37.37 | 0.03 | 35.33 | 0.23 | 9.63 | 0.23 | 0.48 | 0.00 | 0.09 | 2.95 | 10.84 | 97.15 |
| 30 | 36.07 | 0.00 | 33.94 | 0.25 | 10.17 | 0.12 | 0.50 | 0.09 | 0.00 | 2.94 | 10.60 | 94.68 |
| 31 | 38.35 | 0.00 | 35.88 | 0.20 | 9.76 | 0.20 | 0.45 | 0.06 | 0.07 | 3.00 | 11.05 | 99.00 |
| 32 | 37.57 | 0.00 | 35.99 | 0.27 | 9.23 | 0.29 | 0.45 | 0.05 | 0.13 | 2.94 | 10.89 | 97.77 |
| 33 | 38.31 | 0.01 | 35.63 | 0.22 | 9.62 | 0.09 | 0.42 | 0.10 | 0.04 | 2.98 | 10.99 | 98.40 |
| 34 | 37.10 | 0.00 | 35.04 | 0.08 | 9.78 | 0.14 | 0.45 | 0.03 | 0.02 | 2.95 | 10.78 | 96.37 |
| 35 | 37.60 | 0.01 | 34.94 | 0.07 | 9.93 | 0.09 | 0.46 | 0.12 | 0.10 | 2.93 | 10.85 | 97.08 |
| 36 | 36.05 | 0.02 | 33.63 | 0.17 | 10.28 | 0.12 | 0.55 | 0.06 | 0.13 | 2.88 | 10.56 | 94.41 |
| 37 | 37.85 | 0.00 | 35.46 | 0.17 | 9.64 | 0.15 | 0.49 | 0.02 | 0.10 | 2.95 | 10.91 | 97.73 |
| 38 | 38.30 | 0.00 | 34.81 | 0.51 | 9.84 | 0.18 | 0.55 | 0.06 | 0.03 | 3.02 | 10.94 | 98.23 |
| 39 | 37.18 | 0.01 | 35.09 | 0.31 | 9.58 | 0.23 | 0.43 | 0.03 | 0.13 | 2.90 | 10.79 | 96.64 |
| 40 | 37.74 | 0.08 | 35.47 | 0.30 | 9.73 | 0.21 | 0.39 | 0.04 | 0.11 | 2.94 | 10.94 | 97.92 |
| 41 | 37.71 | 0.00 | 34.95 | 0.27 | 9.29 | 0.21 | 0.45 | 0.01 | 0.06 | 2.93 | 10.77 | 96.62 |
| 42 | 38.06 | 0.00 | 35.72 | 0.35 | 9.79 | 0.17 | 0.47 | 0.27 | 0.07 | 3.03 | 11.02 | 98.94 |
| 43 | 37.85 | 0.04 | 34.64 | 0.38 | 9.87 | 0.15 | 0.61 | 0.04 | 0.02 | 3.01 | 10.86 | 97.47 |
| 44 | 35.53 | 0.06 | 32.51 | 0.32 | 9.53 | 0.12 | 0.58 | 0.04 | 0.12 | 2.79 | 10.24 | 91.80 |
| 45 | 37.54 | 0.05 | 34.94 | 0.05 | 9.89 | 0.14 | 0.48 | 0.04 | 0.02 | 2.97 | 10.84 | 96.97 |
| 46 | 38.16 | 0.04 | 34.24 | 0.21 | 9.75 | 0.12 | 0.65 | 0.18 | 0.06 | 3.01 | 10.81 | 97.21 |
| 47 | 38.52 | 0.01 | 35.89 | 0.10 | 9.43 | 0.15 | 0.44 | 0.00 | 0.06 | 2.97 | 11.01 | 98.57 |
| 48 | 36.61 | 0.07 | 34.43 | 0.14 | 10.90 | 0.15 | 0.54 | 0.00 | 0.10 | 2.97 | 10.85 | 96.73 |
| 49 | 37.40 | 0.00 | 34.48 | 0.35 | 9.63 | 0.21 | 0.50 | 0.08 | 0.10 | 2.93 | 10.74 | 96.37 |
| 101 | 36.56 | 0.01 | 32.88 | 4.97 | 8.83 | 0.33 | 0.42 | 0.12 | 0.00 | 3.01 | 10.74 | 97.97 |
| 105 | 37.89 | 0.00 | 35.21 | 0.16 | 9.41 | 0.20 | 0.39 | 0.01 | 0.00 | 2.95 | 10.84 | 97.06 |
| 106 | 39.35 | 0.02 | 36.63 | 0.22 | 9.66 | 0.22 | 0.49 | 0.02 | 0.00 | 3.09 | 11.25 | 100.96 |
| 108 | 38.57 | 0.00 | 35.01 | 0.23 | 9.39 | 0.28 | 0.47 | 0.05 | 0.00 | 3.01 | 10.89 | 97.90 |
| 119 | 35.64 | 0.02 | 33.63 | 0.28 | 8.56 | 0.22 | 0.40 | 0.03 | 0.00 | 2.81 | 10.24 | 91.96 |
| 134 | 40.00 | 0.00 | 36.71 | 0.16 | 10.01 | 0.14 | 0.55 | 0.01 | 0.00 | 3.13 | 11.39 | 102.12 |
| 139 | 37.90 | 0.02 | 33.24 | 0.45 | 8.92 | 0.16 | 0.67 | 0.09 | 0.00 | 2.96 | 10.52 | 94.93 |
| 140 | 37.75 | 0.01 | 33.71 | 0.18 | 8.67 | 0.29 | 0.38 | 0.09 | 0.00 | 2.89 | 10.49 | 94.46 |
| 141 | 36.29 | 0.02 | 33.27 | 1.73 | 9.78 | 0.25 | 0.45 | 0.04 | 0.00 | 2.94 | 10.61 | 95.38 |
| 144 | 39.66 | 0.00 | 35.53 | 0.47 | 8.86 | 0.27 | 0.49 | 0.07 | 0.00 | 3.05 | 11.03 | 99.46 |
| 145 | 38.57 | 0.00 | 34.24 | 0.39 | 9.22 | 0.39 | 0.46 | 0.03 | 0.00 | 2.99 | 10.78 | 97.07 |
| 146 | 38.07 | 0.00 | 34.58 | 0.26 | 9.61 | 0.22 | 0.47 | 0.02 | 0.00 | 2.98 | 10.82 | 97.04 |
| 148 | 39.31 | 0.02 | 35.80 | 0.43 | 8.17 | 0.32 | 0.52 | 0.07 | 0.00 | 3.04 | 10.90 | 98.57 |
| 150 | 37.01 | 0.02 | 34.69 | 0.20 | 9.27 | 0.20 | 0.41 | 0.04 | 0.00 | 2.91 | 10.65 | 95.40 |
| 151 | 36.56 | 0.00 | 33.36 | 0.28 | 8.66 | 0.17 | 0.38 | 0.02 | 0.00 | 2.81 | 10.32 | 92.59 |
| 152 | 39.16 | 0.01 | 35.95 | 0.41 | 9.82 | 0.18 | 0.52 | 0.06 | 0.00 | 3.09 | 11.18 | 100.38 |
| Analysis # | Na2O | MgO | Al2O3 | SiO2 | K2O | CaO | MnO | FeO | TiO2 | Total | Calculated T (°C) |
|---|---|---|---|---|---|---|---|---|---|---|---|
| Chl1 2 | 0.06 | 6.94 | 21.66 | 27.54 | 0.81 | 0.09 | 0.13 | 33.10 | 0.03 | 90.36 | 162 |
| Chl1 3 | 0.08 | 7.26 | 20.71 | 27.18 | 0.60 | 0.13 | 0.19 | 32.83 | 0.04 | 89.03 | 169 |
| Chl1 4 | 0.00 | 7.97 | 20.77 | 26.84 | 0.44 | 0.11 | 0.04 | 32.55 | 0.04 | 88.76 | 182 |
| Chl1 6 | 0.04 | 7.23 | 20.82 | 26.40 | 0.36 | 0.07 | 0.02 | 35.16 | 0.04 | 90.12 | 216 |
| Chl1 8 | 0.00 | 7.92 | 19.53 | 25.95 | 0.19 | 0.09 | 0.14 | 34.35 | 0.03 | 88.19 | 240 |
| Chl1 13 | 0.03 | 9.11 | 19.03 | 25.95 | 0.06 | 0.12 | 0.07 | 33.44 | 0.02 | 87.83 | 279 |
| Chl1 20 | 0.02 | 6.71 | 19.39 | 25.76 | 0.02 | 0.04 | 0.04 | 36.79 | 0.05 | 88.80 | 248 |
| Chl1 21 | 0.00 | 7.59 | 19.29 | 25.11 | 0.04 | 0.03 | 0.07 | 35.28 | 0.04 | 87.45 | 298 |
| Chl1 22 | 0.05 | 8.27 | 19.15 | 25.51 | 0.04 | 0.07 | 0.07 | 33.37 | 0.10 | 86.64 | 246 |
| Chl1 33 | 0.00 | 6.93 | 20.86 | 25.68 | 0.05 | 0.02 | 0.05 | 35.29 | 0.01 | 88.87 | 224 |
| Chl1 38 | 0.04 | 6.95 | 20.36 | 25.08 | 0.05 | 0.08 | 0.16 | 36.79 | 0.01 | 89.51 | 332 |
| Chl1 39 | 0.02 | 7.12 | 20.17 | 25.26 | 0.50 | 0.11 | 0.09 | 33.18 | 0.03 | 86.47 | 221 |
| Chl1 44 | 0.05 | 6.88 | 21.30 | 26.94 | 0.60 | 0.13 | 0.23 | 32.79 | 0.03 | 88.96 | 167 |
| Chl1 45 | 0.00 | 8.31 | 20.01 | 25.84 | 0.07 | 0.02 | 0.01 | 33.82 | 0.14 | 88.21 | 235 |
| Chl1 46 | 0.01 | 7.89 | 20.22 | 25.78 | 0.35 | 0.03 | 0.07 | 33.46 | 0.08 | 87.89 | 227 |
| Chl1 52 | 0.03 | 7.31 | 19.70 | 24.80 | 0.11 | 0.11 | 0.07 | 35.30 | 0.09 | 87.53 | 312 |
| Chl2 153 | 0.02 | 21.76 | 25.30 | 32.56 | 0.01 | 0.11 | 0.05 | 6.16 | 0.02 | 86.00 | 101 |
| Chl2 154 | 0.00 | 23.40 | 25.33 | 32.31 | 0.03 | 0.08 | 0.00 | 4.54 | 0.02 | 85.71 | 109 |
| Chl2 155 | 0.02 | 26.82 | 23.40 | 31.83 | 0.03 | 0.01 | 0.00 | 3.58 | 0.00 | 85.68 | 136 |
| Chl2 156 | 0.04 | 25.31 | 21.04 | 30.25 | 0.02 | 0.13 | 0.00 | 6.99 | 0.00 | 83.78 | 163 |
| Chl2 157 | 0.03 | 22.99 | 21.62 | 30.25 | 0.00 | 0.05 | 0.03 | 10.03 | 0.00 | 85.01 | 153 |
| Chl2 158 | 0.00 | 23.96 | 24.48 | 31.26 | 0.07 | 0.05 | 0.08 | 5.70 | 0.04 | 85.64 | 129 |
| Chl2 159 | 0.03 | 23.77 | 24.66 | 31.81 | 0.06 | 0.05 | 0.13 | 4.80 | 0.00 | 85.29 | 117 |
| Chl2 160 | 0.02 | 25.14 | 24.39 | 31.65 | 0.02 | 0.03 | 0.01 | 3.88 | 0.00 | 85.15 | 125 |
| Chl2 161 | 0.00 | 23.82 | 24.68 | 31.42 | 0.04 | 0.06 | 0.00 | 4.52 | 0.00 | 84.53 | 119 |
| Chl2 162 | 0.02 | 24.97 | 23.95 | 31.47 | 0.05 | 0.05 | 0.00 | 3.85 | 0.00 | 84.36 | 124 |
| Chl2 163 | 0.00 | 24.02 | 23.69 | 31.45 | 0.03 | 0.05 | 0.00 | 4.79 | 0.01 | 84.06 | 119 |
| Chl2164 | 0.03 | 26.40 | 22.02 | 30.72 | 0.04 | 0.07 | 0.00 | 4.45 | 0.00 | 83.73 | 151 |
| Chl2 165 | 0.00 | 25.71 | 23.87 | 31.40 | 0.06 | 0.06 | 0.00 | 3.97 | 0.00 | 85.06 | 133 |
| Chl2 166 | 0.00 | 22.65 | 24.18 | 30.87 | 0.04 | 0.05 | 0.05 | 5.87 | 0.00 | 83.73 | 119 |
| Analysis # | Na (apfu) | Mg (apfu) | Al tot (apfu) | Al IV (apfu) | Al VI (apfu) | Si (apfu) | K (apfu) | Ca (apfu) | Mn (apfu) | Fe (apfu) | Ti (apfu) |
|---|---|---|---|---|---|---|---|---|---|---|---|
| Chl1 2 | 0.01 | 1.10 | 2.70 | 1.08 | 1.62 | 2.92 | 0.11 | 0.01 | 0.01 | 2.93 | 0.00 |
| Chl1 3 | 0.02 | 1.16 | 2.63 | 1.07 | 1.55 | 2.93 | 0.08 | 0.02 | 0.02 | 2.96 | 0.00 |
| Chl1 4 | 0.00 | 1.28 | 2.64 | 1.11 | 1.53 | 2.89 | 0.06 | 0.01 | 0.00 | 2.93 | 0.00 |
| Chl1 6 | 0.01 | 1.16 | 2.64 | 1.16 | 1.48 | 2.84 | 0.05 | 0.01 | 0.00 | 3.16 | 0.00 |
| Chl1 8 | 0.00 | 1.30 | 2.53 | 1.15 | 1.38 | 2.85 | 0.03 | 0.01 | 0.01 | 3.16 | 0.00 |
| Chl1 13 | 0.01 | 1.49 | 2.46 | 1.15 | 1.32 | 2.85 | 0.01 | 0.01 | 0.01 | 3.07 | 0.00 |
| Chl1 20 | 0.00 | 1.11 | 2.52 | 1.15 | 1.37 | 2.85 | 0.00 | 0.00 | 0.00 | 3.40 | 0.00 |
| Chl1 21 | 0.00 | 1.26 | 2.54 | 1.20 | 1.34 | 2.80 | 0.01 | 0.00 | 0.01 | 3.30 | 0.00 |
| Chl1 22 | 0.01 | 1.37 | 2.52 | 1.15 | 1.36 | 2.85 | 0.01 | 0.01 | 0.01 | 3.11 | 0.01 |
| Chl1 33 | 0.00 | 1.13 | 2.69 | 1.19 | 1.49 | 2.81 | 0.01 | 0.00 | 0.00 | 3.22 | 0.00 |
| Chl1 38 | 0.01 | 1.14 | 2.63 | 1.25 | 1.39 | 2.75 | 0.01 | 0.01 | 0.01 | 3.38 | 0.00 |
| Chl1 39 | 0.00 | 1.19 | 2.66 | 1.17 | 1.49 | 2.83 | 0.07 | 0.01 | 0.01 | 3.11 | 0.00 |
| Chl1 44 | 0.01 | 1.10 | 2.70 | 1.10 | 1.60 | 2.90 | 0.08 | 0.01 | 0.02 | 2.95 | 0.00 |
| Chl1 45 | 0.00 | 1.35 | 2.58 | 1.17 | 1.41 | 2.83 | 0.01 | 0.00 | 0.00 | 3.09 | 0.01 |
| Chl1 46 | 0.00 | 1.29 | 2.62 | 1.17 | 1.45 | 2.83 | 0.05 | 0.00 | 0.01 | 3.07 | 0.01 |
| Chl1 52 | 0.01 | 1.22 | 2.59 | 1.23 | 1.37 | 2.77 | 0.02 | 0.01 | 0.01 | 3.30 | 0.01 |
| Chl2 153 | 0.00 | 3.08 | 2.83 | 0.91 | 1.91 | 3.09 | 0.00 | 0.01 | 0.00 | 0.49 | 0.00 |
| Chl2 154 | 0.00 | 3.30 | 2.82 | 0.95 | 1.87 | 3.05 | 0.00 | 0.01 | 0.00 | 0.36 | 0.00 |
| Chl2 155 | 0.00 | 3.78 | 2.61 | 0.99 | 1.62 | 3.01 | 0.00 | 0.00 | 0.00 | 0.28 | 0.00 |
| Chl2 156 | 0.01 | 3.73 | 2.45 | 1.01 | 1.45 | 2.99 | 0.00 | 0.01 | 0.00 | 0.58 | 0.00 |
| Chl2 157 | 0.01 | 3.39 | 2.52 | 1.01 | 1.51 | 2.99 | 0.00 | 0.01 | 0.00 | 0.83 | 0.00 |
| Chl2 158 | 0.00 | 3.41 | 2.76 | 1.01 | 1.74 | 2.99 | 0.01 | 0.01 | 0.01 | 0.46 | 0.00 |
| Chl2 159 | 0.01 | 3.38 | 2.77 | 0.97 | 1.80 | 3.03 | 0.01 | 0.01 | 0.01 | 0.38 | 0.00 |
| Chl2 160 | 0.00 | 3.56 | 2.73 | 0.99 | 1.74 | 3.01 | 0.00 | 0.00 | 0.00 | 0.31 | 0.00 |
| Chl2 161 | 0.00 | 3.41 | 2.79 | 0.98 | 1.81 | 3.02 | 0.00 | 0.01 | 0.00 | 0.36 | 0.00 |
| Chl2 162 | 0.00 | 3.57 | 2.71 | 0.98 | 1.73 | 3.02 | 0.01 | 0.01 | 0.00 | 0.31 | 0.00 |
| Chl2 163 | 0.00 | 3.46 | 2.70 | 0.96 | 1.74 | 3.04 | 0.00 | 0.01 | 0.00 | 0.39 | 0.00 |
| Chl2164 | 0.01 | 3.84 | 2.53 | 1.00 | 1.53 | 3.00 | 0.00 | 0.01 | 0.00 | 0.36 | 0.00 |
| Chl2 165 | 0.00 | 3.66 | 2.68 | 1.00 | 1.68 | 3.00 | 0.01 | 0.01 | 0.00 | 0.32 | 0.00 |
| Chl2 166 | 0.00 | 3.30 | 2.78 | 0.98 | 1.80 | 3.02 | 0.00 | 0.01 | 0.00 | 0.48 | 0.00 |
| Analysis # | δ11B | 1σ | Analysis # | δ11B | 1σ | Analysis # | δ11B | 1σ |
|---|---|---|---|---|---|---|---|---|
| 1 | 1.78 | 0.62 | 27 | 1.80 | 0.41 | 52 | 4.84 | 0.76 |
| 2 | 1.15 | 0.37 | 28 | 2.72 | 0.54 | 53 | 4.34 | 0.91 |
| 3 | 1.22 | 1.01 | 29 | 4.41 | 0.50 | 54 | 4.26 | 0.89 |
| 4 | 0.58 | 0.70 | 30 | 2.66 | 0.52 | 55 | 4.81 | 1.07 |
| 5 | 2.15 | 1.22 | 31 | 2.92 | 0.49 | 56 | 2.69 | 0.52 |
| 6 | 1.70 | 0.53 | 32 | 2.91 | 0.40 | 57 | 3.45 | 0.37 |
| 7 | 1.39 | 0.49 | 33 | 3.66 | 0.38 | 58 | 6.22 | 0.72 |
| 8 | 3.19 | 0.58 | 34 | 3.36 | 0.42 | 59 | 3.37 | 0.41 |
| 9 | 2.55 | 1.07 | 35 | 3.17 | 0.46 | 60 | 3.31 | 0.51 |
| 10 | 5.40 | 0.85 | 36 | 1.66 | 1.29 | 61 | 4.67 | 0.52 |
| 11 | 3.94 | 0.72 | 37 | 8.09 | 1.78 | 62 | 6.70 | 1.18 |
| 12 | 1.73 | 0.49 | 38 | 4.65 | 0.45 | 63 | 5.77 | 0.91 |
| 13 | 3.20 | 0.57 | 39 | 5.45 | 0.51 | 64 | 7.55 | 0.28 |
| 14 | 3.61 | 0.39 | 40 | 5.63 | 0.71 | 65 | 9.38 | 0.60 |
| 15 | 3.90 | 0.60 | 41 | 4.73 | 0.40 | 66 | 8.75 | 0.53 |
| 16 | 3.62 | 0.97 | 42 | 4.95 | 0.86 | 67 | 2.67 | 0.40 |
| 17 | 4.34 | 0.54 | 43 | 4.88 | 0.51 | 68 | 0.80 | 0.90 |
| 18 | 2.02 | 0.51 | 44 | 4.79 | 0.49 | 69 | 2.50 | 0.52 |
| 19 | 1.77 | 0.47 | 45 | 7.42 | 0.61 | 70 | 3.74 | 0.52 |
| 20 | 0.82 | 0.66 | 46 | 4.23 | 0.53 | 71 | 4.66 | 0.48 |
| 21 | 2.07 | 0.47 | 47 | 2.84 | 0.85 | 72 | 3.35 | 0.44 |
| 22 | 3.47 | 0.59 | 48 | 3.99 | 0.75 | 73 | 4.34 | 0.52 |
| 23 | 3.43 | 0.52 | 49 | 3.59 | 0.43 | 74 | 1.45 | 0.76 |
| 24 | 3.31 | 0.55 | 50 | 3.88 | 0.47 | 75 | 1.93 | 0.52 |
| 25 | 3.18 | 0.55 | 51 | 3.97 | 0.35 | 76 | 3.22 | 0.66 |
| 26 | 3.13 | 0.52 |
| Analysis # | Si(T) | B(T) | Al(T) | Total (T) | Al(Z) | Total (Z) | Al(Y) | Ti(Y) | Fe2+(Y) | Mn2+(Y) | Mg(Y) | Total (Y) |
|---|---|---|---|---|---|---|---|---|---|---|---|---|
| 2 | 6.01 | 0.00 | 0.00 | 6.01 | 6.00 | 6.00 | 0.58 | 0.00 | 0.05 | 0.00 | 2.37 | 2.99 |
| 3 | 6.08 | 0.00 | 0.00 | 6.08 | 6.00 | 6.00 | 0.61 | 0.00 | 0.04 | 0.00 | 2.27 | 2.92 |
| 4 | 6.00 | 0.00 | 0.00 | 6.00 | 6.00 | 6.00 | 0.67 | 0.00 | 0.02 | 0.00 | 2.31 | 3.00 |
| 5 | 6.00 | 0.00 | 0.00 | 6.00 | 6.00 | 6.00 | 0.64 | 0.00 | 0.04 | 0.00 | 2.32 | 3.00 |
| 6 | 6.02 | 0.00 | 0.00 | 6.02 | 6.00 | 6.00 | 0.66 | 0.00 | 0.02 | 0.00 | 2.30 | 2.98 |
| 7 | 6.03 | 0.00 | 0.00 | 6.03 | 6.00 | 6.00 | 0.74 | 0.01 | 0.02 | 0.00 | 2.20 | 2.97 |
| 8 | 6.05 | 0.00 | 0.00 | 6.05 | 6.00 | 6.00 | 0.61 | 0.00 | 0.02 | 0.00 | 2.32 | 2.95 |
| 9 | 5.99 | 0.01 | 0.00 | 6.00 | 6.00 | 6.00 | 0.73 | 0.00 | 0.03 | 0.00 | 2.24 | 3.01 |
| 10 | 6.03 | 0.00 | 0.00 | 6.03 | 6.00 | 6.00 | 0.71 | 0.00 | 0.03 | 0.00 | 2.23 | 2.97 |
| 11 | 6.06 | 0.00 | 0.00 | 6.06 | 6.00 | 6.00 | 0.64 | 0.00 | 0.03 | 0.00 | 2.28 | 2.94 |
| 12 | 6.22 | 0.00 | 0.00 | 6.22 | 6.00 | 6.00 | 0.78 | 0.00 | 0.02 | 0.00 | 1.97 | 2.78 |
| 13 | 6.03 | 0.00 | 0.00 | 6.03 | 6.00 | 6.00 | 0.79 | 0.00 | 0.02 | 0.00 | 2.16 | 2.97 |
| 14 | 6.17 | 0.00 | 0.00 | 6.17 | 6.00 | 6.00 | 0.53 | 0.00 | 0.03 | 0.00 | 2.27 | 2.84 |
| 16 | 6.08 | 0.00 | 0.00 | 6.08 | 6.00 | 6.00 | 0.79 | 0.00 | 0.02 | 0.00 | 2.10 | 2.92 |
| 18 | 6.01 | 0.00 | 0.00 | 6.01 | 6.00 | 6.00 | 0.60 | 0.00 | 0.02 | 0.00 | 2.36 | 2.99 |
| 19 | 6.00 | 0.01 | 0.00 | 6.01 | 6.00 | 6.00 | 0.62 | 0.00 | 0.02 | 0.00 | 2.36 | 3.00 |
| 20 | 6.01 | 0.00 | 0.00 | 6.01 | 6.00 | 6.00 | 0.68 | 0.00 | 0.02 | 0.00 | 2.29 | 2.99 |
| 21 | 6.08 | 0.00 | 0.00 | 6.08 | 6.00 | 6.00 | 0.66 | 0.00 | 0.04 | 0.00 | 2.23 | 2.92 |
| 22 | 5.98 | 0.00 | 0.02 | 6.00 | 6.00 | 6.00 | 0.79 | 0.01 | 0.03 | 0.00 | 2.18 | 3.00 |
| 24 | 5.97 | 0.01 | 0.02 | 6.00 | 6.00 | 6.00 | 0.69 | 0.00 | 0.03 | 0.00 | 2.28 | 3.01 |
| 26 | 6.05 | 0.00 | 0.00 | 6.05 | 6.00 | 6.00 | 0.65 | 0.00 | 0.03 | 0.00 | 2.27 | 2.95 |
| 27 | 6.10 | 0.00 | 0.00 | 6.10 | 6.00 | 6.00 | 0.66 | 0.00 | 0.04 | 0.00 | 2.21 | 2.90 |
| 28 | 5.96 | 0.01 | 0.03 | 6.00 | 6.00 | 6.00 | 0.61 | 0.00 | 0.02 | 0.00 | 2.39 | 3.01 |
| 29 | 5.99 | 0.01 | 0.01 | 6.00 | 6.00 | 6.00 | 0.67 | 0.00 | 0.03 | 0.00 | 2.30 | 3.01 |
| 30 | 5.92 | 0.02 | 0.06 | 6.00 | 6.00 | 6.00 | 0.50 | 0.00 | 0.03 | 0.00 | 2.49 | 3.02 |
| 31 | 6.03 | 0.00 | 0.00 | 6.03 | 6.00 | 6.00 | 0.65 | 0.00 | 0.03 | 0.00 | 2.29 | 2.97 |
| 32 | 6.00 | 0.00 | 0.00 | 6.00 | 6.00 | 6.00 | 0.77 | 0.00 | 0.04 | 0.00 | 2.20 | 3.00 |
| 33 | 6.06 | 0.00 | 0.00 | 6.06 | 6.00 | 6.00 | 0.64 | 0.00 | 0.03 | 0.00 | 2.27 | 2.94 |
| 34 | 5.98 | 0.01 | 0.01 | 6.00 | 6.00 | 6.00 | 0.65 | 0.00 | 0.01 | 0.00 | 2.35 | 3.01 |
| 35 | 6.02 | 0.00 | 0.00 | 6.02 | 6.00 | 6.00 | 0.60 | 0.00 | 0.01 | 0.00 | 2.37 | 2.98 |
| 36 | 5.93 | 0.02 | 0.05 | 6.00 | 6.00 | 6.00 | 0.47 | 0.00 | 0.02 | 0.00 | 2.52 | 3.02 |
| 37 | 6.03 | 0.00 | 0.00 | 6.03 | 6.00 | 6.00 | 0.66 | 0.00 | 0.02 | 0.00 | 2.29 | 2.97 |
| 38 | 6.08 | 0.00 | 0.00 | 6.08 | 6.00 | 6.00 | 0.52 | 0.00 | 0.07 | 0.00 | 2.33 | 2.92 |
| 39 | 5.99 | 0.01 | 0.00 | 6.00 | 6.00 | 6.00 | 0.66 | 0.00 | 0.04 | 0.00 | 2.30 | 3.01 |
| 40 | 6.00 | 0.01 | 0.00 | 6.01 | 6.00 | 6.00 | 0.64 | 0.01 | 0.04 | 0.00 | 2.31 | 3.00 |
| 41 | 6.08 | 0.00 | 0.00 | 6.08 | 6.00 | 6.00 | 0.65 | 0.00 | 0.04 | 0.00 | 2.23 | 2.92 |
| 42 | 6.01 | 0.00 | 0.00 | 6.01 | 6.00 | 6.00 | 0.64 | 0.00 | 0.05 | 0.00 | 2.30 | 2.99 |
| 43 | 6.06 | 0.00 | 0.00 | 6.06 | 6.00 | 6.00 | 0.53 | 0.01 | 0.05 | 0.00 | 2.35 | 2.94 |
| 44 | 6.03 | 0.00 | 0.00 | 6.03 | 6.00 | 6.00 | 0.50 | 0.01 | 0.05 | 0.00 | 2.41 | 2.97 |
| 45 | 6.02 | 0.00 | 0.00 | 6.02 | 6.00 | 6.00 | 0.60 | 0.01 | 0.01 | 0.00 | 2.36 | 2.98 |
| 46 | 6.14 | 0.00 | 0.00 | 6.14 | 6.00 | 6.00 | 0.49 | 0.01 | 0.03 | 0.00 | 2.34 | 2.86 |
| 47 | 6.08 | 0.00 | 0.00 | 6.08 | 6.00 | 6.00 | 0.68 | 0.00 | 0.01 | 0.00 | 2.22 | 2.92 |
| 48 | 5.87 | 0.03 | 0.11 | 6.00 | 6.00 | 6.00 | 0.39 | 0.01 | 0.02 | 0.00 | 2.60 | 3.03 |
| 49 | 6.05 | 0.00 | 0.00 | 6.05 | 6.00 | 6.00 | 0.58 | 0.00 | 0.05 | 0.00 | 2.32 | 2.95 |
| 101 | 5.91 | 0.03 | 0.05 | 6.00 | 6.00 | 6.00 | 0.22 | 0.00 | 0.67 | 0.01 | 2.13 | 3.03 |
| 105 | 6.08 | 0.00 | 0.00 | 6.08 | 6.00 | 6.00 | 0.65 | 0.00 | 0.02 | 0.00 | 2.25 | 2.93 |
| 106 | 6.08 | 0.00 | 0.00 | 6.08 | 6.00 | 6.00 | 0.67 | 0.00 | 0.03 | 0.00 | 2.22 | 2.92 |
| 108 | 6.15 | 0.00 | 0.00 | 6.15 | 6.00 | 6.00 | 0.58 | 0.00 | 0.03 | 0.00 | 2.23 | 2.85 |
| 119 | 6.05 | 0.00 | 0.00 | 6.05 | 6.00 | 6.00 | 0.73 | 0.00 | 0.04 | 0.02 | 2.17 | 2.95 |
| 134 | 6.10 | 0.00 | 0.00 | 6.10 | 6.00 | 6.00 | 0.60 | 0.00 | 0.02 | 0.00 | 2.28 | 2.90 |
| 139 | 6.26 | 0.00 | 0.00 | 6.26 | 6.00 | 6.00 | 0.47 | 0.00 | 0.06 | 0.00 | 2.20 | 2.74 |
| 140 | 6.25 | 0.00 | 0.00 | 6.25 | 6.00 | 6.00 | 0.58 | 0.00 | 0.03 | 0.00 | 2.14 | 2.75 |
| 141 | 5.95 | 0.02 | 0.03 | 6.00 | 6.00 | 6.00 | 0.39 | 0.00 | 0.24 | 0.00 | 2.39 | 3.02 |
| 144 | 6.25 | 0.00 | 0.00 | 6.25 | 6.00 | 6.00 | 0.60 | 0.00 | 0.06 | 0.00 | 2.08 | 2.75 |
| 145 | 6.22 | 0.00 | 0.00 | 6.22 | 6.00 | 6.00 | 0.51 | 0.00 | 0.05 | 0.00 | 2.22 | 2.78 |
| 146 | 6.12 | 0.00 | 0.00 | 6.12 | 6.00 | 6.00 | 0.55 | 0.00 | 0.04 | 0.00 | 2.30 | 2.88 |
| 148 | 6.27 | 0.00 | 0.00 | 6.27 | 6.00 | 6.00 | 0.73 | 0.00 | 0.06 | 0.00 | 1.94 | 2.73 |
| 150 | 6.04 | 0.00 | 0.00 | 6.04 | 6.00 | 6.00 | 0.67 | 0.00 | 0.03 | 0.00 | 2.26 | 2.96 |
| 151 | 6.16 | 0.00 | 0.00 | 6.16 | 6.00 | 6.00 | 0.62 | 0.00 | 0.04 | 0.00 | 2.18 | 2.84 |
| 152 | 6.09 | 0.00 | 0.00 | 6.09 | 6.00 | 6.00 | 0.59 | 0.00 | 0.05 | 0.00 | 2.28 | 2.91 |
| Analysis # | Ca(X) | Na(X) | K(X) | vacancy(X) | Total(X) | OH(V) | OH(W) | F(W) | O(W) | Total(V+W) |
|---|---|---|---|---|---|---|---|---|---|---|
| 2 | 0.03 | 0.16 | 0.00 | 0.81 | 1.00 | 3.00 | 0.14 | 0.05 | 0.81 | 4.00 |
| 3 | 0.03 | 0.15 | 0.00 | 0.83 | 1.00 | 3.00 | 0.11 | 0.07 | 0.83 | 4.00 |
| 4 | 0.03 | 0.13 | 0.00 | 0.84 | 1.00 | 3.00 | 0.15 | 0.01 | 0.84 | 4.00 |
| 5 | 0.03 | 0.11 | 0.00 | 0.86 | 1.00 | 3.00 | 0.10 | 0.04 | 0.86 | 4.00 |
| 6 | 0.02 | 0.13 | 0.01 | 0.84 | 1.00 | 3.00 | 0.09 | 0.07 | 0.84 | 4.00 |
| 7 | 0.03 | 0.15 | 0.01 | 0.80 | 1.00 | 3.00 | 0.14 | 0.06 | 0.80 | 4.00 |
| 8 | 0.02 | 0.14 | 0.05 | 0.79 | 1.00 | 3.00 | 0.19 | 0.02 | 0.79 | 4.00 |
| 9 | 0.03 | 0.13 | 0.00 | 0.84 | 1.00 | 3.00 | 0.14 | 0.03 | 0.84 | 4.00 |
| 10 | 0.03 | 0.13 | 0.00 | 0.84 | 1.00 | 3.00 | 0.10 | 0.06 | 0.84 | 4.00 |
| 11 | 0.02 | 0.13 | 0.06 | 0.79 | 1.00 | 3.00 | 0.18 | 0.03 | 0.79 | 4.00 |
| 12 | 0.03 | 0.14 | 0.00 | 0.83 | 1.00 | 3.00 | 0.10 | 0.07 | 0.83 | 4.00 |
| 13 | 0.04 | 0.14 | 0.00 | 0.83 | 1.00 | 3.00 | 0.15 | 0.03 | 0.83 | 4.00 |
| 14 | 0.03 | 0.15 | 0.01 | 0.81 | 1.00 | 3.00 | 0.15 | 0.04 | 0.81 | 4.00 |
| 16 | 0.04 | 0.14 | 0.01 | 0.81 | 1.00 | 3.00 | 0.16 | 0.03 | 0.81 | 4.00 |
| 18 | 0.03 | 0.12 | 0.02 | 0.84 | 1.00 | 3.00 | 0.12 | 0.05 | 0.84 | 4.00 |
| 19 | 0.03 | 0.15 | 0.02 | 0.81 | 1.00 | 3.00 | 0.15 | 0.05 | 0.80 | 4.00 |
| 20 | 0.02 | 0.14 | 0.03 | 0.80 | 1.00 | 3.00 | 0.14 | 0.06 | 0.80 | 4.00 |
| 21 | 0.02 | 0.14 | 0.01 | 0.83 | 1.00 | 3.00 | 0.14 | 0.03 | 0.83 | 4.00 |
| 22 | 0.04 | 0.12 | 0.01 | 0.84 | 1.00 | 3.00 | 0.13 | 0.04 | 0.83 | 4.00 |
| 24 | 0.03 | 0.15 | 0.02 | 0.81 | 1.00 | 3.00 | 0.17 | 0.04 | 0.80 | 4.00 |
| 26 | 0.03 | 0.12 | 0.01 | 0.85 | 1.00 | 3.00 | 0.09 | 0.06 | 0.85 | 4.00 |
| 27 | 0.03 | 0.12 | 0.04 | 0.81 | 1.00 | 3.00 | 0.15 | 0.04 | 0.81 | 4.00 |
| 28 | 0.02 | 0.15 | 0.00 | 0.82 | 1.00 | 3.00 | 0.17 | 0.03 | 0.81 | 4.00 |
| 29 | 0.04 | 0.15 | 0.00 | 0.81 | 1.00 | 3.00 | 0.15 | 0.05 | 0.81 | 4.00 |
| 30 | 0.02 | 0.16 | 0.02 | 0.80 | 1.00 | 3.00 | 0.22 | 0.00 | 0.78 | 4.00 |
| 31 | 0.03 | 0.14 | 0.01 | 0.82 | 1.00 | 3.00 | 0.15 | 0.04 | 0.82 | 4.00 |
| 32 | 0.05 | 0.14 | 0.01 | 0.80 | 1.00 | 3.00 | 0.13 | 0.07 | 0.80 | 4.00 |
| 33 | 0.02 | 0.13 | 0.02 | 0.84 | 1.00 | 3.00 | 0.14 | 0.02 | 0.84 | 4.00 |
| 34 | 0.02 | 0.14 | 0.01 | 0.83 | 1.00 | 3.00 | 0.17 | 0.01 | 0.82 | 4.00 |
| 35 | 0.02 | 0.14 | 0.03 | 0.82 | 1.00 | 3.00 | 0.13 | 0.05 | 0.82 | 4.00 |
| 36 | 0.02 | 0.18 | 0.01 | 0.79 | 1.00 | 3.00 | 0.16 | 0.07 | 0.77 | 4.00 |
| 37 | 0.03 | 0.15 | 0.00 | 0.82 | 1.00 | 3.00 | 0.13 | 0.05 | 0.82 | 4.00 |
| 38 | 0.03 | 0.17 | 0.01 | 0.79 | 1.00 | 3.00 | 0.20 | 0.02 | 0.79 | 4.00 |
| 39 | 0.04 | 0.13 | 0.01 | 0.82 | 1.00 | 3.00 | 0.12 | 0.07 | 0.81 | 4.00 |
| 40 | 0.04 | 0.12 | 0.01 | 0.84 | 1.00 | 3.00 | 0.12 | 0.06 | 0.83 | 4.00 |
| 41 | 0.04 | 0.14 | 0.00 | 0.82 | 1.00 | 3.00 | 0.15 | 0.03 | 0.82 | 4.00 |
| 42 | 0.03 | 0.14 | 0.05 | 0.77 | 1.00 | 3.00 | 0.19 | 0.04 | 0.77 | 4.00 |
| 43 | 0.03 | 0.19 | 0.01 | 0.78 | 1.00 | 3.00 | 0.21 | 0.01 | 0.78 | 4.00 |
| 44 | 0.02 | 0.19 | 0.01 | 0.78 | 1.00 | 3.00 | 0.16 | 0.06 | 0.78 | 4.00 |
| 45 | 0.02 | 0.15 | 0.01 | 0.82 | 1.00 | 3.00 | 0.17 | 0.01 | 0.82 | 4.00 |
| 46 | 0.02 | 0.20 | 0.04 | 0.74 | 1.00 | 3.00 | 0.23 | 0.03 | 0.74 | 4.00 |
| 47 | 0.03 | 0.14 | 0.00 | 0.84 | 1.00 | 3.00 | 0.13 | 0.03 | 0.84 | 4.00 |
| 48 | 0.03 | 0.17 | 0.00 | 0.81 | 1.00 | 3.00 | 0.17 | 0.05 | 0.78 | 4.00 |
| 49 | 0.04 | 0.16 | 0.02 | 0.79 | 1.00 | 3.00 | 0.16 | 0.05 | 0.79 | 4.00 |
| 101 | 0.06 | 0.13 | 0.03 | 0.79 | 1.00 | 3.00 | 0.25 | 0.00 | 0.75 | 4.00 |
| 105 | 0.03 | 0.12 | 0.00 | 0.84 | 1.00 | 3.00 | 0.16 | 0.00 | 0.84 | 4.00 |
| 106 | 0.04 | 0.15 | 0.00 | 0.81 | 1.00 | 3.00 | 0.19 | 0.00 | 0.81 | 4.00 |
| 108 | 0.05 | 0.15 | 0.01 | 0.80 | 1.00 | 3.00 | 0.20 | 0.00 | 0.80 | 4.00 |
| 119 | 0.04 | 0.13 | 0.01 | 0.82 | 1.00 | 3.00 | 0.18 | 0.00 | 0.82 | 4.00 |
| 134 | 0.02 | 0.16 | 0.00 | 0.81 | 1.00 | 3.00 | 0.19 | 0.00 | 0.81 | 4.00 |
| 139 | 0.03 | 0.22 | 0.02 | 0.74 | 1.00 | 3.00 | 0.26 | 0.00 | 0.74 | 4.00 |
| 140 | 0.05 | 0.12 | 0.02 | 0.81 | 1.00 | 3.00 | 0.19 | 0.00 | 0.81 | 4.00 |
| 141 | 0.04 | 0.14 | 0.01 | 0.81 | 1.00 | 3.00 | 0.22 | 0.00 | 0.78 | 4.00 |
| 144 | 0.05 | 0.15 | 0.01 | 0.79 | 1.00 | 3.00 | 0.21 | 0.00 | 0.79 | 4.00 |
| 145 | 0.07 | 0.14 | 0.01 | 0.78 | 1.00 | 3.00 | 0.22 | 0.00 | 0.78 | 4.00 |
| 146 | 0.04 | 0.15 | 0.00 | 0.81 | 1.00 | 3.00 | 0.19 | 0.00 | 0.81 | 4.00 |
| 148 | 0.06 | 0.16 | 0.01 | 0.77 | 1.00 | 3.00 | 0.23 | 0.00 | 0.77 | 4.00 |
| 150 | 0.04 | 0.13 | 0.01 | 0.83 | 1.00 | 3.00 | 0.17 | 0.00 | 0.83 | 4.00 |
| 151 | 0.03 | 0.12 | 0.00 | 0.84 | 1.00 | 3.00 | 0.16 | 0.00 | 0.84 | 4.00 |
| 152 | 0.03 | 0.16 | 0.01 | 0.80 | 1.00 | 3.00 | 0.20 | 0.00 | 0.80 | 4.00 |
© 2019 by the authors. Licensee MDPI, Basel, Switzerland. This article is an open access article distributed under the terms and conditions of the Creative Commons Attribution (CC BY) license (http://creativecommons.org/licenses/by/4.0/).
Share and Cite
Gigon, J.; Skirrow, R.G.; Harlaux, M.; Richard, A.; Mercadier, J.; Annesley, I.R.; Villeneuve, J. Insights into B-Mg-Metasomatism at the Ranger U Deposit (NT, Australia) and Comparison with Canadian Unconformity-Related U Deposits. Minerals 2019, 9, 432. https://doi.org/10.3390/min9070432
Gigon J, Skirrow RG, Harlaux M, Richard A, Mercadier J, Annesley IR, Villeneuve J. Insights into B-Mg-Metasomatism at the Ranger U Deposit (NT, Australia) and Comparison with Canadian Unconformity-Related U Deposits. Minerals. 2019; 9(7):432. https://doi.org/10.3390/min9070432
Chicago/Turabian StyleGigon, Joséphine, Roger G. Skirrow, Matthieu Harlaux, Antonin Richard, Julien Mercadier, Irvine R. Annesley, and Johan Villeneuve. 2019. "Insights into B-Mg-Metasomatism at the Ranger U Deposit (NT, Australia) and Comparison with Canadian Unconformity-Related U Deposits" Minerals 9, no. 7: 432. https://doi.org/10.3390/min9070432
APA StyleGigon, J., Skirrow, R. G., Harlaux, M., Richard, A., Mercadier, J., Annesley, I. R., & Villeneuve, J. (2019). Insights into B-Mg-Metasomatism at the Ranger U Deposit (NT, Australia) and Comparison with Canadian Unconformity-Related U Deposits. Minerals, 9(7), 432. https://doi.org/10.3390/min9070432