Article

Singularity Analysis of Volcanic Ages and Implications for Tectonic Setting in the Mesozoic, Great Xing’an Range, Northeast China

1
School of the Earth Sciences and Resources, China University of Geosciences, Beijing 100083, China
2
State Key Laboratory of Geological Process and Mineral Resources, China University of Geosciences, Beijing 100083, China
*
Author to whom correspondence should be addressed.
Minerals 2019, 9(7), 419; https://doi.org/10.3390/min9070419
Submission received: 10 May 2019 / Revised: 23 June 2019 / Accepted: 5 July 2019 / Published: 9 July 2019

Abstract

:
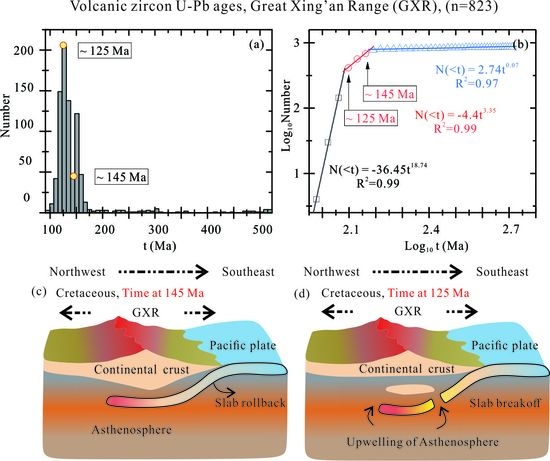
Frequency distribution of zircon U–Pb ages has been commonly utilized to interpret the age of a magmatic event. Anomalies in age peaks are related to plate movement caused by mantle convection during the formation of supercontinents and continent crust growth. In this paper, a singularity analysis method (frequency anomalies) is used to analyze a dataset (n = 823, discordance lower than 10%) of zircon U–Pb ages from the Great Xing’an Range (GXR), in order to characterize the causal relationship between age transitions and Pacific Plate subduction. The number-age plot result shows that there is a peak around at 125 Ma, and the log–log plot reveals that there are two transitional ages (knee points) at 125 Ma and 145 Ma. The age densities of the peak at 125 Ma and the transition at 145 Ma can both be fitted by power law functions, which indicate transitional ages have the characteristic of singularity. Combined with the subduction geological background in the late Mesozoic, the possible singularity mechanisms corresponding to the age peak at 125 Ma and the transition at 145 Ma are slab rollback and slab breakoff of the Pacific Plate, which is consistent with conclusions from geology and geochemistry. This result suggests that singularity analysis can be used as a new method to quantitatively characterize volcanic activities and tectonic setting in geological processes.

Graphical Abstract

1. Introduction

The Great Xing’an Range (GXR, Figure 1), east of the Central Asian Orogenic Belt (CAOB or Altaid), is dominated by Mesozoic volcanic rocks and other associated igneous rocks [1,2,3,4]. There has been much debate concerning the tectonic setting in which these rocks formed, and two main proposals have been put forward: (1) subduction of the Mongol–Okhotsk Ocean from the north [5,6], and (2) subduction of the Pacific Plate from the east [4,7]. Previous studies suggested that the exact eruption ages and spatial distribution of the volcanic rocks and granites are the key factors for understanding the tectonic setting [4,7,8,9,10,11]. This study attempts to address this issue from a new view point, using a singularity analysis method on the basis of a dataset (n = 823) of volcanic zircon U–Pb ages.
The concept of singularity for a geological application point of view was originally introduced by Cheng [12], and can be defined as a special phenomenon with anomalous energy release or material accumulation occurring within narrow spatial–temporal intervals in geological processes. Since then, the singularity model has been widely used in various fields of geological science for characterizing geo-events with scaling properties [13]. In early studies, the singularity model was applied to the identification of the distributive patterns of ore deposits and the separation of geochemical anomalies from the background [14,15,16]. Recently, this model was used to understand the formation and growth of continental crust [17,18], and to predict the lifetime of global plate movement [19], and to characterize the flare up of magmatic activities in Himalayas [20]. However, singularity analysis has not yet been applied to volcanic zircon ages to understand the tectonic setting of the GXR.
In this study, we present a singularity analysis method to analyze a dataset (n = 823) of volcanic zircon U–Pb ages in the Mesozoic from the GXR in order to characterize the relationship between transitional ages (knee points on a log–log plot) and Paleo-Pacific Plate subduction.

2. Data and Methods

2.1. Data

The data used for this study were taken from Zhang et al. [4,9]. The rock types for zircon LA-ICP-MS dating include basalt, olivine basalt, basaltic andesite, andesite, dacite, rhyolite, rhyolitic tuff. In order to control the quality of the dataset, the discordance (discordance = (1 − (206Pb/238U age/275Pb/235U age) × 100) of ages above 10% are excluded. There were 823 ages from 95 to 515 Ma (Supplementary Materials, Table S1).

2.2. Singularity Analysis

The singularity analysis method can be described by the Pareto model from a probability point of view. The Pareto (power-law) model, on the other hand, is a scale-free (invariant) distribution that describes variations or anomalous outputs from geo-processes. Singularity analysis was introduced by Cheng [12], and the singularity index is:
k l o g μ ε 1 μ ε 2 l o g ε 1 ε 1
where μ is a measurement, and ε is a local scale. Furthermore, the singularity index (k) is
y i = c x i k i
k i = l o g y i l o g c x i
R i 2 = l o g x i l o g x ¯ l o g y i l o g y ¯ l o g x i l o g x ¯ 2 · l o g y i l o g y ¯ 2
where the value yi is proportional to the power (−ki) of the input xi (>0), and i is the box number based on the gliding box method for singularity modeling [23]. R i 2 is the correlation of the curve. Ordinary density of an object (ρ) is
ρ = m v v
ρ = d m v d v
where m(v) represents the mass contained in a volume (v). The fractal density of ages around age peaks [20] is
ρ t = N t t = c t k i
where Nt) represents the number of ages around an age t within the time range of Δt, and ρt) is the average fractal density of the age around the peak. Δt is (Ma) the interval for calculating N(Δt).

3. Results

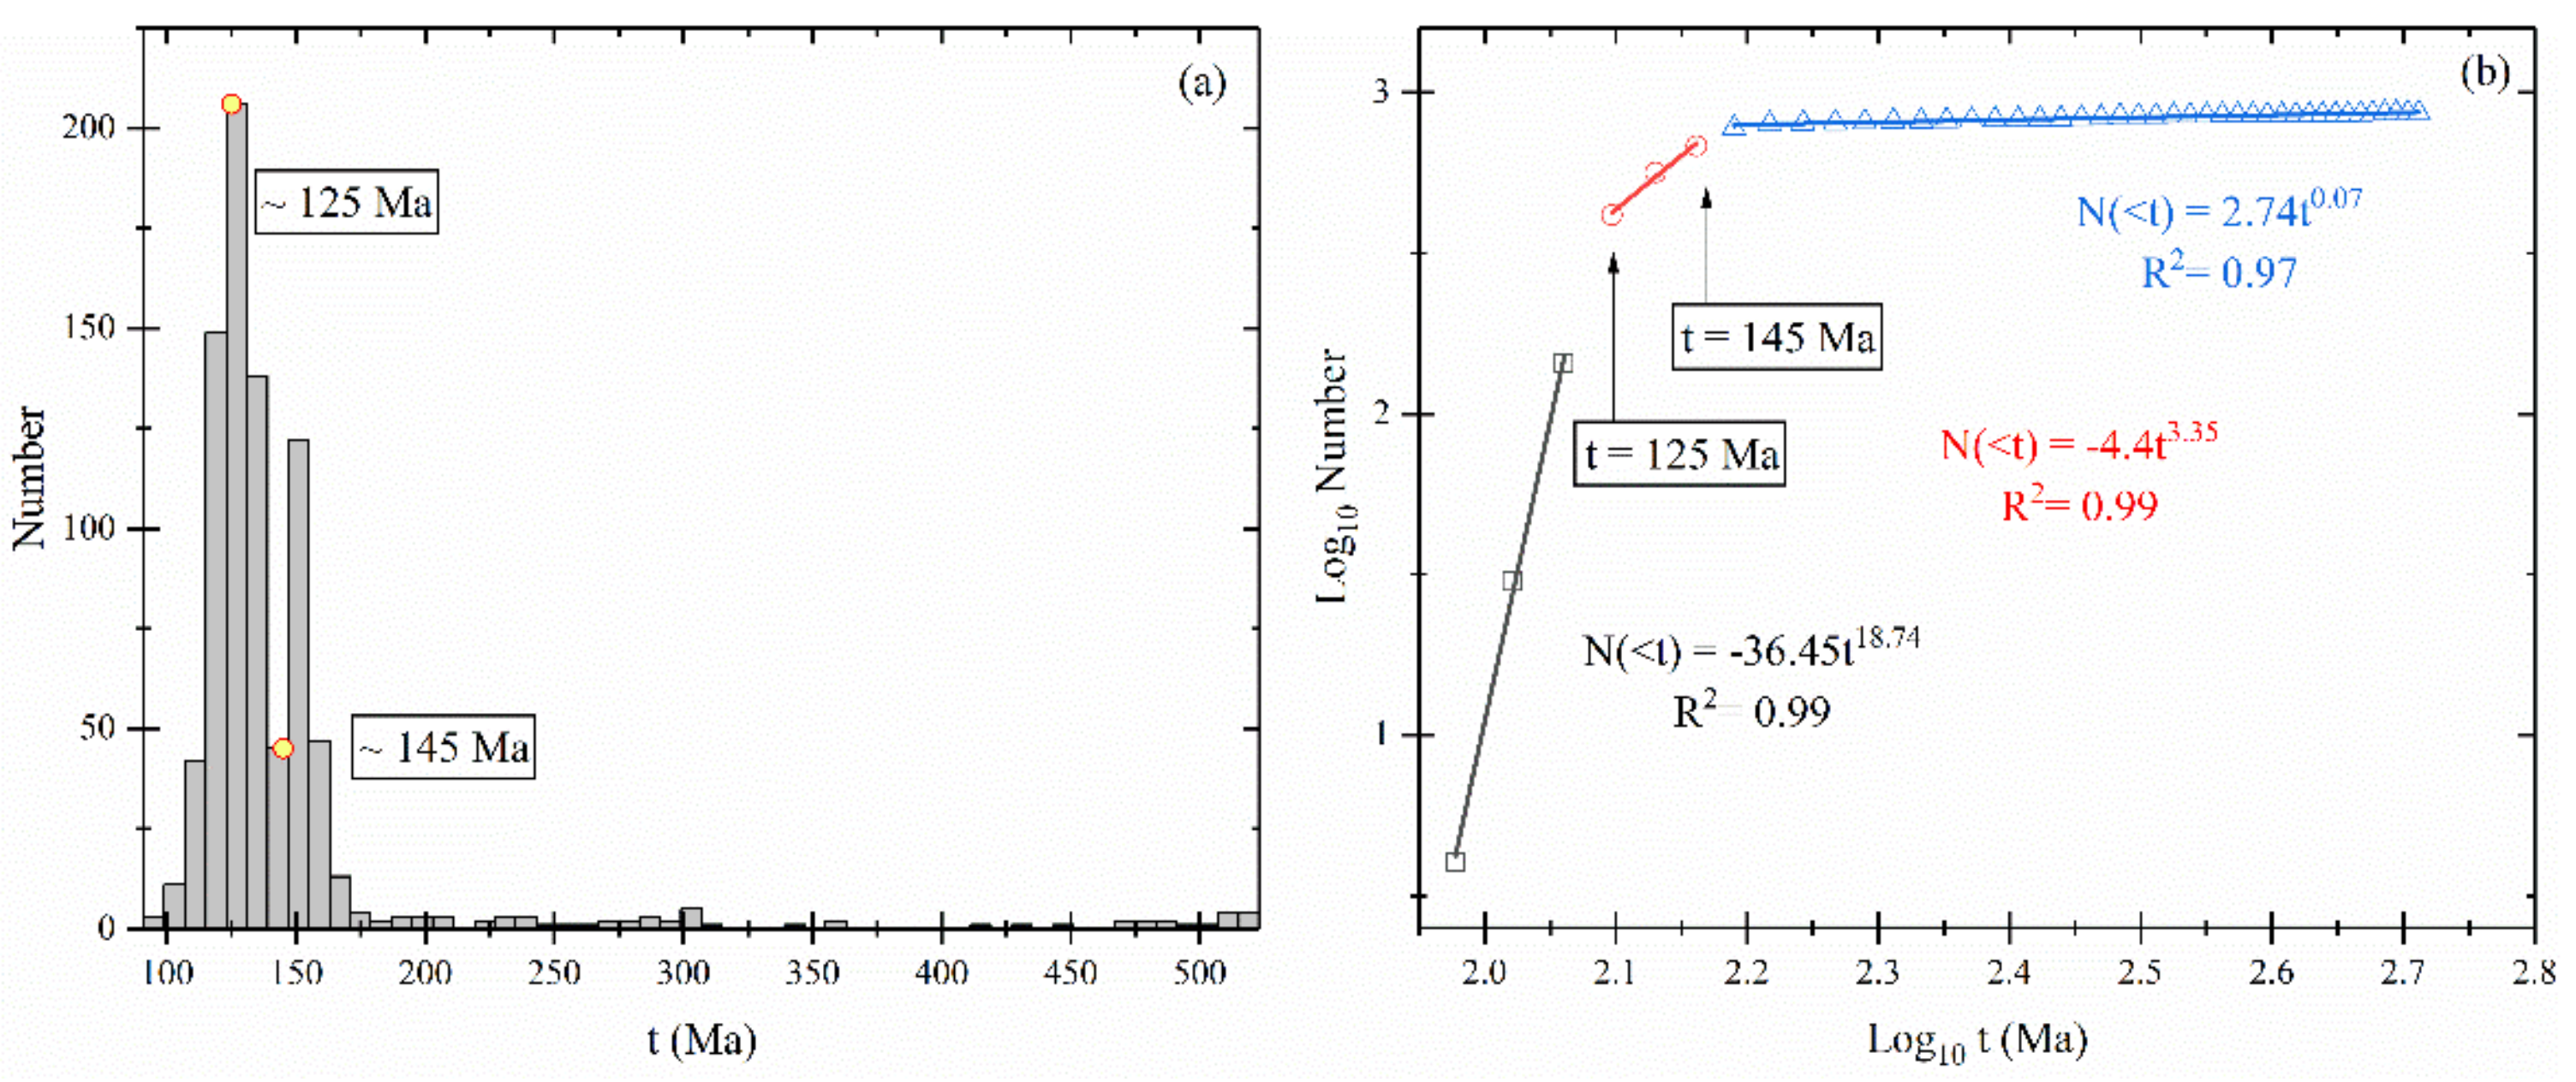
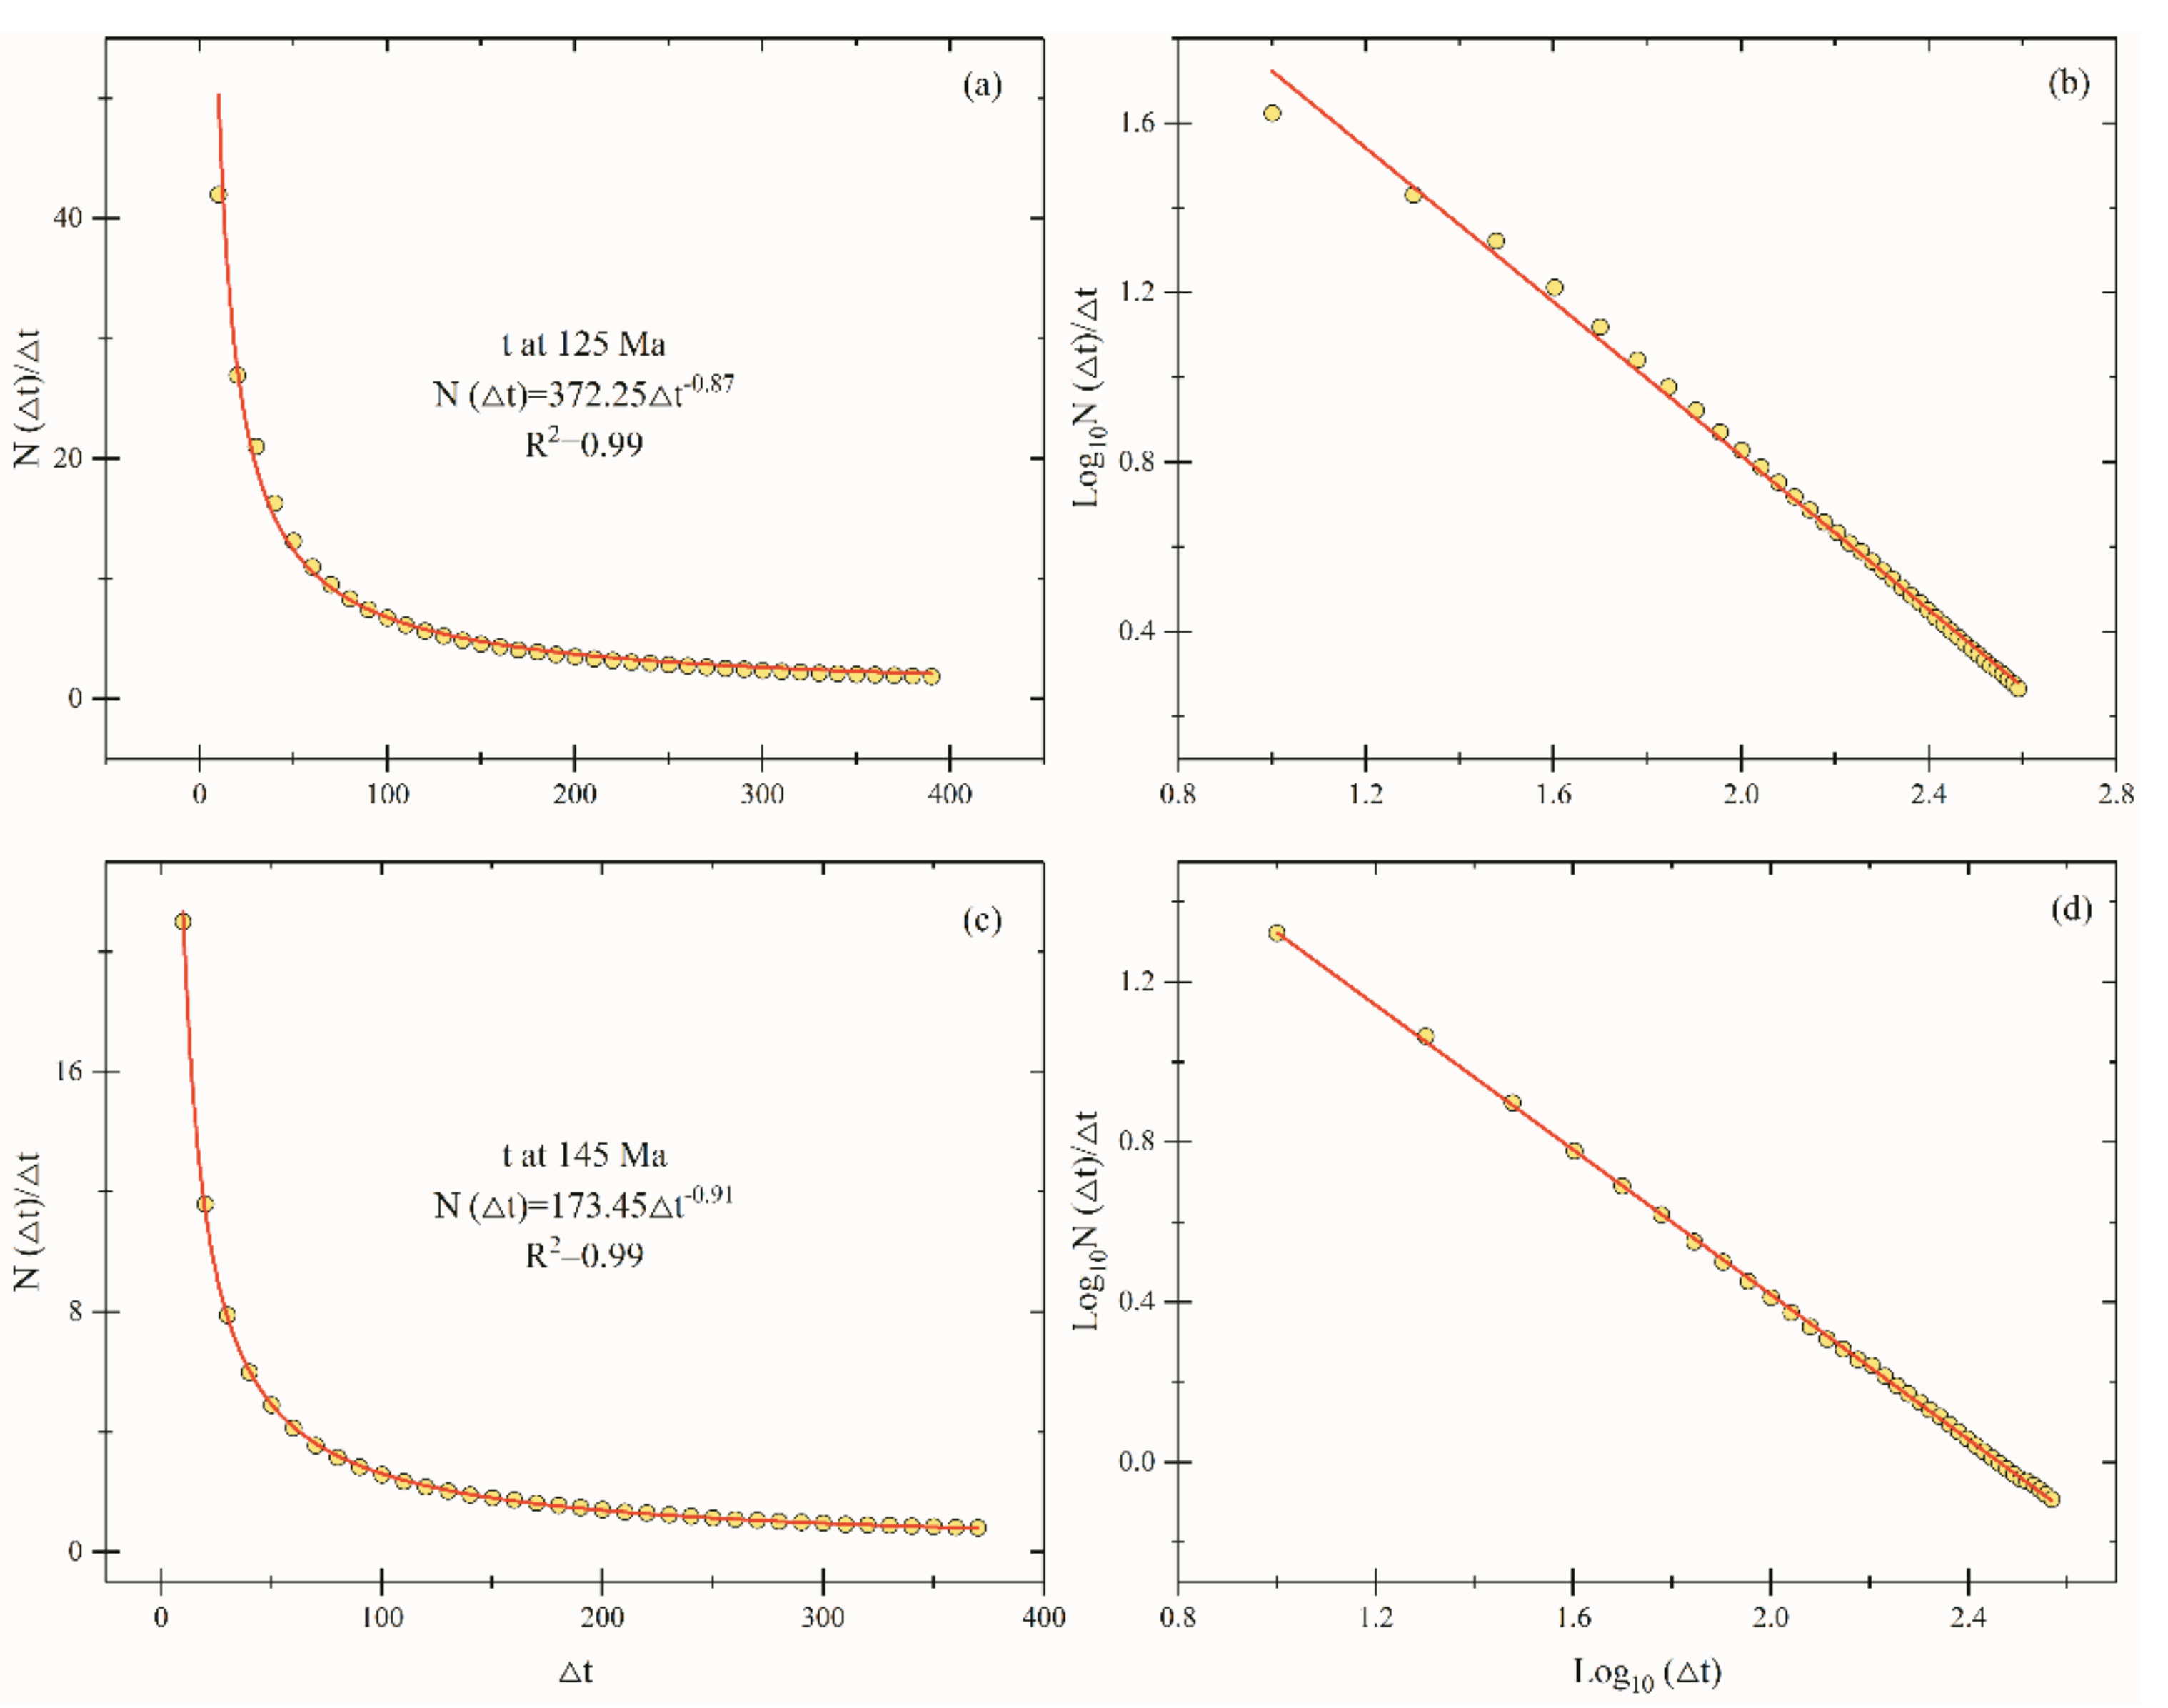
The singularity analysis results for volcanic zircon U–Pb ages of the GXR from 98 to 515 Ma are shown in Figure 2 and Figure 3. The histogram of volcanic zircon U–Pb ages (bin = 4 Ma) shows an obvious peak at 125 Ma (Figure 2a), while the cumulative number-age distribution (bin = 10 Ma) exhibits two abnormal age points at 145 and 125 Ma (Figure 2b). Three solid lines were fitted separately by the least square method for the data before 125 Ma from 95 to 125 Ma (N(<t) = −36.45t18.74, R2 = 0.99), between 125 and 154 Ma (N(<t) = −4.4t3.35, R2 = 0.99), and after 145 Ma ranging from 145 to 515 Ma (N(<t) = 2.74t0.07, R2 = 0.97), respectively. The average fractal density at around 145 and 125 Ma could be fitted by the power-law distribution (Figure 3a,b).

4. Discussion

4.1. Advantages of Singularity and Mechanisms of the Power-Law Distribution

Compared to probability-age diagrams, the singularity method (e.g., singularity analysis, fractal analysis) has the advantage of enhancing and amplifying abnormal ages, especially age peaks and transitional ages. For example, the singularity intensity of global zircon U–Pb age peaks actually depicts a descending trend and may signify mantle cooling [18]. A persistent ca. 760 Ma cycle was identified in global zircon records from 4.4 Ga to present by a statistical method [17]. These results mentioned in the two examples above are very difficult to demonstrate by the conventional probability-age method or the histogram-age method. In addition, a small dataset of U–Pb ages could be analyzed by the singularity method [20]. Thus, the advantages of the analysis method are obvious.
Zhang et al. [4,9] analyzed a large number of U–Pb ages in volcanic rocks and thus provided us with a possible opportunity to study magmatic processes and volcanic activities [24]. From a geochronological and geochemical perspective, Zhang et al. [4,9] analyzed the geochemical difference between the Northern and Southern GXR and discussed the geodynamic setting of the Mesozoic volcanic rocks in the GXR. An age peak at 125 Ma could be easily identified by a histogram-age diagram and may be caused by the delamination of a thickened lower crust [9]. However, no valley value of age at 145 Ma was recognized [4,9], which may be linked to slab rollback [24]. In this study, an age peak at 125 Ma and a transition age at 145 Ma are easily recognized by the cumulative number-age and singularity methods (Figure 2 and Figure 3). These results can be analyzed to reveal more detail about magmatic processes and plate movement [24].
Singularity analysis can be described by power-law distribution [18], and the mechanisms may correspond to phase transition (PT), self-organized criticality (SOC), or multiplicative cascade processes (MCP) [13,18,25].
The singularity analysis is from point of fractal and non-linear view, which is quite different from geology view (e.g., geo-tectonics, geodynamics), and may be useful for us to understand geological processes.

4.2. Implications for Tectonic Setting

There are two main schemes that have been proposed to interpret the tectonic setting in which the Mesozoic volcanic rocks in the Great Xing’an Range were formed.
The first model suggests that the geological background of the Mesozoic volcanic rocks was subduction of the Mongol–Okhotsk Ocean and subsequent magmatism [5,26]. Although it may be argued that the Jurassic basalt exposed in the western part of the GXR might be linked to the subduction and closure of the Mongol–Okhotsk Ocean, the following lines of evidence do not support this interpretation. Firstly, Mesozoic volcanic rocks are widely distributed not only in the main continental area of China but also in Korea and Japan [2], which cannot be explained by the subduction of the Mongol–Okhotsk Ocean. Secondly, the ophiolitic mélange along the Solon-Ker suture zone at the southern margin of the GXR and the Late Permian intermediate and felsic intrusions indicates that the final closure of the Mongol–Okhotsk Ocean occurred during the Middle or end-Permian (252–272 Ma) [27,28]. It is very difficult to interpret why large-scale volcanic rocks are in the early Cretaceous, rather than in the Permian.
The second model that has been proposed involves the subduction of the Paleo-Pacific Plate beneath Eastern China [7,11,29]. There are several of lines of evidence that support this interpretation. On the one hand, the direction of the Mesozoic volcanic rocks is in an NNE direction, parallel to the NNE-oriented Asian continental margin [4]. On the other hand, it has been demonstrated that Mesozoic accretionary complexes are extensively developed along the whole eastern margin of the Asian continent [2,8,11], undoubtedly indicating a subduction regime related to the Paleo-Pacific Plate. Lastly, the volcanic rock zircon U–Pb age peak is at about 125 Ma [9], which is mostly linked to the subduction of the Paleo-Pacific Plate beneath the GXR in the Mesozoic, rather than to the subduction of the Mongol–Okhotsk Ocean beneath the GXR in the late Paleozoic [28,30,31]. The cumulative number-age distribution of volcanic rock ages in the GXR (Figure 1b) shows that there are obviously two abnormal transitions at about 145 and 125 Ma. These transition ages can be stated as the transitional condition of the plate movement [25,32], which is linked to the shifting of Paleo-Pacific Plate subduction in the Mesozoic [18,20].
Thus, the regime of subduction of the Paleo-Pacific Plate is most likely the tectonic setting for volcanic rocks in the GXR.

4.3. Possible Mechanisms Corresponding to Age Transitions

As the results show in Figure 2, 125 Ma is the age peak in the histogram, while 145 Ma is the transition in the cumulative number-age distribution diagram. The average fractal densities at about 125 and 145 Ma were fitted by the power-law functions (Figure 3). This suggests that ages at 125 and 145 Ma are subject to a fractal model and can be described by the singularity analysis method [18,23,33,34,35,36].
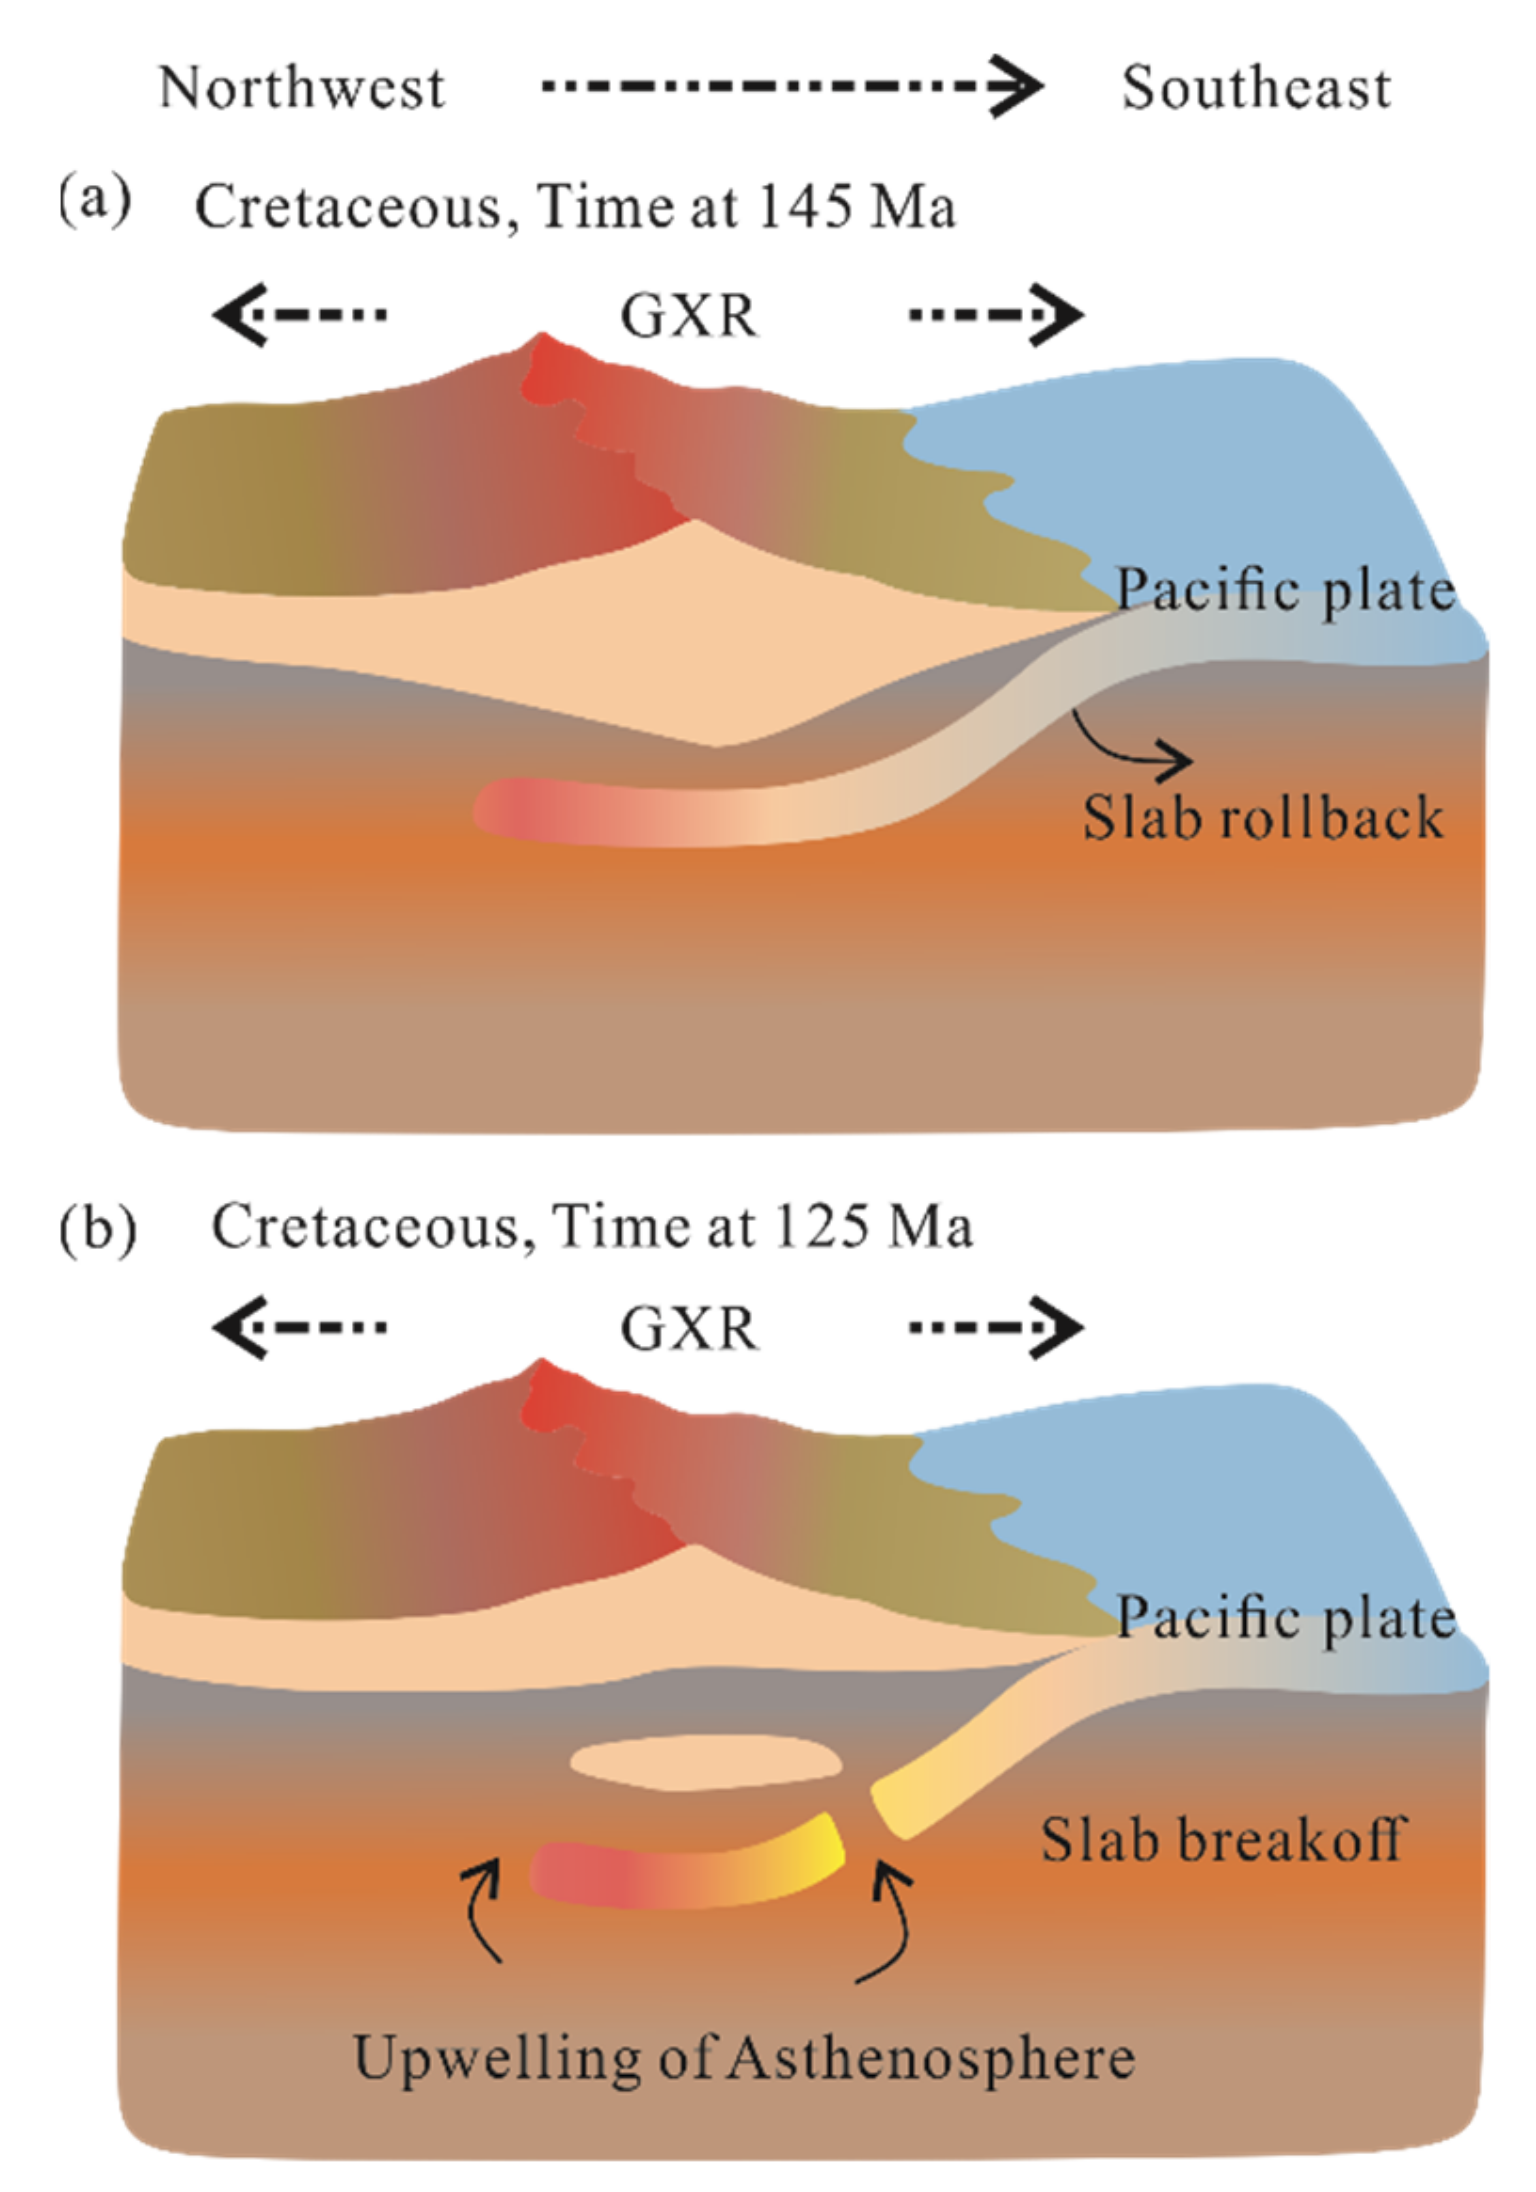
Singularity can be defined as an abnormal phenomenon occurring within narrow temporal intervals in geological processes [18]. The mechanisms of the singularity (Figure 4) of age peaks may be associated with deep subduction, slab avalanches, or slab breakoff [18,20]. The processes of subduction and slab breakoff occurred, facilitating the downwelling and upwelling of asthenosphere, which triggered a series of magmatic and volcanic events [9,11,20]. Both granitoids and volcanic rocks show a peak at about 125 Ma [9,11]. Furthermore, A1-type granitoids developed widely, and the high zircon saturation temperatures in intrusive rocks indicate that there was an extension in tectonic setting and the upwelling of asthenosphere in the Mesozoic in the GXR [7,37,38]. Therefore, the age peak at 125 Ma in the GXR may be linked to slab breakoff from the subducted Paleo-Pacific Plate.
The transition time at about 145 Ma shown in the cumulative number-age distribution diagram (Figure 2b) may be linked to the shifting of the subducted Paleo-Pacific Plate. From mathematical and physical perspectives, the transition time at about 145 Ma indicates a shift in the conditions of subduction [13,25]. Previous studies argued that the transition may be corresponding to the delamination of the thickened crust of the subducted Paleo-Pacific Plate [8,9]. This view relates to the key issue of whether the subduction direction of the Paleo-Pacific Plate shifted or not. As discussed above, slab breakoff from the subducted Paleo-Pacific Plate caused large-scale magmatic and volcanic events. In other words, a shift in the direction of subduction of the Paleo-Pacific Plate may have resulted in a transition at about 145 Ma. Data from Archean cratons have demonstrated that delamination was related to the rollback of subducted flat slabs, rather than an angle shift of subducted flat slabs [39]. Furthermore, thermo-mechanical numerical modeling and geochronology of the metamorphic core complex in Eastern China revealed that the rollback of the subducted Pacific Plate occurred before delamination [40,41,42,43,44,45,46,47]. Volcanic ages in the Cretaceous became younger from west to east, as shown in Figure 1, also implying that slab rollback coupled with back-arc extension were related to Pacific Plate subduction and subsequent volcanic activities [8,9,11]. Therefore, the possible mechanism of the transition age at 145 Ma may be linked to the rollback of the subducted Pacific Plate. The model shown in Figure 4 may be the best to explain the age peak at 125 Ma and the transition at 145 Ma.

5. Conclusions

Age distribution can reveal significant information about geological processes. In this paper, a singularity analysis method (frequency anomalies) is further used to analyze a small dataset of zircon U–Pb ages from the Great Xing’an Range (GXR) in order to characterize the causational relationship between age abnormality and Pacific Plate subduction. The results show that the age densities around the peak at 145 Ma and the transition at 125 Ma can be fitted by power-law functions. The possible mechanisms corresponding to the age peak at 145 Ma and the transition at 125 Ma are slab rollback and slab breakoff of the Pacific Plate, which is consistent with conclusions from geology and geochemistry. This study suggests that singularity analysis can be used as a new tool to quantitatively characterize volcanic activities and tectonic setting in geological processes.

Supplementary Materials

The following are available online at https://www.mdpi.com/2075-163X/9/7/419/s1, Table S1: The volcanic zircon U–Pb age datasets used for singularity analysis in this study, Great Xing’an Range, Northeast China.

Author Contributions

P.Z. analyzed the data and wrote the paper; Q.C. made significant contributions to the development of the singularity analysis.

Funding

This paper was jointly supported by National Key R & D Program of China (grant number 2016YFC0600501), National Basic Research Program of China (grant number 2015CB452605), Geological Survey Project of China (grant number DD20160045 and DD20190459) and Nature Science Foundation of China (grant number 41430320 and 41572315).

Acknowledgments

P. Zhu would like to thank W. Wang and J. Wang for their thoughtful suggestions. Thanks are due to three anonymous reviewers for their constructive reviews on this manuscript.

Conflicts of Interest

The authors declare no conflict of interest.

References

  1. Jahn, B.M. The Central Asian Orogenic Belt and growth of the continental crust in the Phanerozoic. Geol. Soc. Lond. Spec. Publ. 2004, 226, 73–100. [Google Scholar] [CrossRef]
  2. Wu, F.; Lin, J.; Wilde, S.; Zhang, X.; Yang, J. Nature and significance of the Early Cretaceous giant igneous event in eastern China. Earth Planet. Sci. Lett. 2005, 233, 103–119. [Google Scholar] [CrossRef]
  3. Zhang, H.; Wang, F.; Xu, W.; Cao, H.; Pei, F. Petrogenesis of Early-Middle Jurassic intrusive rocks in northern Liaoning and central Jilin provinces, northeast China: Implications for the extent of spatial-temporal overprinting of the Mongol-Okhotsk and Paleo-Pacific tectonic regimes. Lithos 2016, 256, 132–147. [Google Scholar] [CrossRef]
  4. Zhang, J.; Ge, W.; Wu, F.; Wilde, S.A.; Yang, J.; Liu, X. Large-scale Early Cretaceous volcanic events in the northern Great Xing’an Range, Northeastern China. Lithos 2008, 102, 138–157. [Google Scholar] [CrossRef]
  5. Meng, Q.R. What drove late Mesozoic extension of the northern China-Mongolia tract? Tectonophysics 2003, 369, 155–174. [Google Scholar] [CrossRef]
  6. Fan, W.M.; Guo, F.; Wang, Y.J.; Lin, G. Late Mesozoic calc-alkaline volcanism of post-orogenic extension in the northern Da Hinggan Mountains, northeastern China. J. Volcanol. Geotherm. Res. 2003, 121, 115–135. [Google Scholar] [CrossRef]
  7. Zhu, P.; Cheng, Q.; Zhang, Z.; Wang, Z. Genesis and implications of the Late Jurassic Hailesitai granites in the northern Greater Khingan Range: Evidence from zircon U-Pb dating and Hf isotope. Geol. Mag. 2017, 154, 963–982. [Google Scholar] [CrossRef]
  8. Wang, F.; Zhou, X.; Zhang, L.; Ying, J.; Zhang, Y.; Wu, F.; Zhu, R. Late Mesozoic volcanism in the Great Xing’an Range (NE China): Timing and implications for the dynamic setting of NE Asia. Earth Planet. Sci. Lett. 2006, 251, 179–198. [Google Scholar] [CrossRef]
  9. Zhang, J.; Gao, S.; Ge, W.; Wu, F.; Yang, J.; Wilde, S.A.; Li, M. Geochronology of the Mesozoic volcanic rocks in the Great Xing’an Range, northeastern China: Implications for subduction-induced delamination. Chem. Geol. 2010, 276, 144–165. [Google Scholar] [CrossRef]
  10. Wu, F.; Sun, D.; Ge, W.; Zhang, Y.; Grant, M.L.; Wilde, S.A.; Jahn, B. Geochronology of the Phanerozoic granitoids in northeastern China. J. Asian Earth Sci. 2011, 41, 1–30. [Google Scholar] [CrossRef] [Green Version]
  11. Wang, T.; Guo, L.; Zhang, L.; Yang, Q.; Zhang, J.; Tong, Y.; Ye, K. Timing and evolution of Jurassic-Cretaceous granitoid magmatisms in the Mongol-Okhotsk belt and adjacent areas, NE Asia: Implications for transition from contractional crustal thickening to extensional thinning and geodynamic settings. J. Asian Earth Sci. 2015, 97, 365–392. [Google Scholar] [CrossRef]
  12. Cheng, Q. Mapping singularities with stream sediment geochemical data for prediction of undiscovered mineral deposits in Gejiu, Yunnan Province, China. Ore Geol. Rev. 2007, 32, 314–324. [Google Scholar] [CrossRef]
  13. Lovejoy, S.; Schertzer, D. Scaling and multifractal fields in the solid earth and topography. Nonlinear Process. Geophys. 2007, 14, 293–315. [Google Scholar] [CrossRef]
  14. Xia, Q.; Zhao, P.; Cheng, Q.; Chen, Y.; Zhang, S. Platinum and Palladium in Coal Rock and Geochemical Anomaly in Eastern Yunnan Province, Southwest China. J. China Univ. Geosci. 2008, 19, 354–362. [Google Scholar]
  15. Wang, W.; Zhao, J.; Cheng, Q. Fault trace-oriented singularity mapping technique to characterize anisotropic geochemical signatures in Gejiu mineral district, China. J. Geochem. Explor. 2013, 134, 27–37. [Google Scholar] [CrossRef]
  16. Liu, Y.; Zhou, K.; Cheng, Q. A new method for geochemical anomaly separation based on the distribution patterns of singularity indices. Comput. Geosci. 2017, 105, 139–147. [Google Scholar] [CrossRef]
  17. Chen, G.; Cheng, Q. Cyclicity and Persistence of Earth’s Evolution Over Time: Wavelet and Fractal Analysis. Geophys. Res. Lett. 2018, 45, 8223–8230. [Google Scholar] [CrossRef]
  18. Cheng, Q. Singularity analysis of global zircon U-Pb age series and implication of continental crust evolution. Gondwana Res. 2017, 51, 51–63. [Google Scholar] [CrossRef]
  19. Cheng, Q. Extrapolations of secular trends in magmatic intensity and mantle cooling: Implications for future evolution of plate tectonics. Gondwana Res. 2018, 63, 268–273. [Google Scholar] [CrossRef]
  20. Cheng, Q. Singularity analysis of magmatic flare-ups caused by India-Asia collisions. J. Geochem. Explor. 2018, 189, 25–31. [Google Scholar] [CrossRef]
  21. Shen, P.; Pan, H.; Seitmuratova, E.; Jakupova, S. U-Pb zircon, geochemical and Sr–Nd–Hf–O isotopic constraints on age and origin of the ore-bearing intrusions from the Nurkazgan porphyry Cu–Au deposit in Kazakhstan. J. Asian Earth Sci. 2016, 116, 232–248. [Google Scholar] [CrossRef]
  22. Zhang, C.; Ma, C.; Liao, Q.; Zhang, J.; She, Z. Implications of subduction and subduction zone migration of the Paleo-Pacific Plate beneath eastern North China, based on distribution, geochronology, and geochemistry of Late Mesozoic volcanic rocks. Int. J. Earth Sci. 2011, 100, 1665–1684. [Google Scholar] [CrossRef]
  23. Cheng, Q. The gliding box method for multifractal modeling. Comput. Geosci. 1999, 25, 1073–1079. [Google Scholar] [CrossRef]
  24. Zhu, P.; Cheng, Q.; Chen, G. New fractal evidence of Pacific Plate subduction in the late Mesozoic, Great Xing’an Range, Northeast China. J. Earth Sci. 2019, 1–10. [Google Scholar] [CrossRef]
  25. Newman, M. Power laws, Pareto distributions and Zipf’s law. Contemp. Phys. 2005, 46, 323–351. [Google Scholar] [CrossRef]
  26. Wang, P.J.; Liu, W.Z.; Wang, S.X.; Song, W.H. 40Ar/39Ar and K/Ar dating on the volcanic rocks in the Song-liao basin, NE China: Constraints on stratigraphy and basin dynamics. Int. J. Earth Sci. 2002, 91, 331–340. [Google Scholar] [CrossRef]
  27. Ma, X.; Chen, C.; Zhao, J.; Qiao, S.; Zhou, Z. Late Permian intermediate and felsic intrusions in the eastern Central Asian Orogenic Belt: Final-stage magmatic record of Paleo-Asian Oceanic subduction? Lithos 2019, 326, 265–278. [Google Scholar] [CrossRef]
  28. Fu, D.; Huang, B.; Kusky, T.M.; Li, G.; Wilde, S.A.; Zhou, W.; Yu, Y. A Middle-Permian ophiolitic mélange belt in the Solonker Suture zone, Western Inner Mongolia, China: Implications for the evolution of the Paleo-Asian Ocean. Tectonics 2018, 37, 1292–1320. [Google Scholar] [CrossRef]
  29. Song, S.; Wang, M.; Xu, X.; Wang, C.; Niu, Y.; Allen, M.B.; Su, L. Ophiolites in the Xing’an-Inner Mongolia accretionary belt of the CAOB: Implications for two cycles of seafloor spreading and accretionary orogenic events. Tectonics 2015, 34, 2221–2248. [Google Scholar] [CrossRef]
  30. Deng, C.; Sun, D.; Li, G.; Lu, S.; Tang, Z.; Gou, J.; Yang, Y. Early Cretaceous volcanic rocks in the Great Xing’an Range: Late effect of a flat-slab subduction. J. Geodyn. 2019, 124, 38–51. [Google Scholar] [CrossRef]
  31. Zhang, X.; Yuan, L.; Xue, F.; Yan, X.; Mao, Q. Early Permian A-type granites from central Inner Mongolia, North China: Magmatic tracer of post-collisional tectonics and oceanic crustal recycling. Gondwana Res. 2015, 28, 311–327. [Google Scholar] [CrossRef]
  32. McMillan, P.F.; Stanley, H.E. Going supercritical. Nat. Phys. 2010, 6, 479–480. [Google Scholar] [CrossRef]
  33. Cheng, Q. Multifractality and spatial statistics. Comput. Geosci. 1999, 25, 949–961. [Google Scholar] [CrossRef]
  34. Liu, Y.; Cheng, Q.; Xia, Q.; Wang, X. Application of singularity analysis for mineral potential identification using geochemical data: A case study: Nanling W-Sn-Mo polymetallic metallogenic belt, South China. J. Geochem. Explor. 2013, 134, 61–72. [Google Scholar] [CrossRef]
  35. Cheng, Q. Fractal density and singularity analysis of heat flow over ocean ridges. Sci. Rep. 2016, 6, 19167. [Google Scholar]
  36. Wang, W.; Cheng, Q.; Zhang, S.; Zhao, J. Anisotropic singularity: A novel way to characterize controlling effects of geological processes on mineralization. J. Geochem. Explor. 2018, 189, 32–41. [Google Scholar] [CrossRef]
  37. Eby, G.N. The A-type granitoids: A review of their occurrence and chemical characteristics and speculations on their petrogenesis. Lithos 1990, 26, 115–134. [Google Scholar] [CrossRef]
  38. Frost, C.D.; Frost, B.R. On ferroan (A-type) granitoids: Their compositional variability and modes of origin. J. Petrol. 2010, 52, 39–53. [Google Scholar] [CrossRef]
  39. Kusky, T.M.; Windley, B.F.; Wang, L.; Wang, Z.; Li, X.; Zhu, P. Flat slab subduction, trench suction, and craton destruction: Comparison of the North China, Wyoming, and Brazilian cratons. Tectonophysics 2014, 630, 208–221. [Google Scholar] [CrossRef]
  40. Li, Z.; Li, X. Formation of the 1300-km-wide intracontinental orogen and post-orogenic magmatic province in Mesozoic South China: A flat-slab subduction model. Geology 2007, 35, 179–182. [Google Scholar] [CrossRef]
  41. Wang, T.; Zheng, Y.; Zhang, J.; Zeng, L.; Donskaya, T.; Guo, L.; Li, J. Pattern and kinematic polarity of late Mesozoic extension in continental NE Asia: Perspectives from metamorphic core complexes. Tectonics 2011, 30, 1–27. [Google Scholar] [CrossRef]
  42. Liu, J.; Davis, G.A.; Lin, Z.; Wu, F. The Liaonan metamorphic core complex, Southeastern Liaoning Province, North China: A likely contributor to Cretaceous rotation of Eastern Liaoning, Korea and contiguous areas. Tectonophysics 2005, 407, 65–80. [Google Scholar] [CrossRef]
  43. Lin, W.; Faure, M.; Chen, Y.; Ji, W.; Wang, F.; Wu, L.; Charles, N.; Wang, J.; Wang, Q. Late Mesozoic compressional to extensional tectonics in the Yiwulüshan massif, NE China and its bearing on the evolution of the Yinshan-Yanshan orogenic belt, Part I: Structural analyses and geochronological constraints. Gondwana Res. 2013, 23, 54–77. [Google Scholar] [CrossRef]
  44. Lin, W.; Charles, N.; Chen, Y.; Chen, K.; Faure, M.; Wu, L.; Wang, F.; Li, Q.; Wang, J.; Wang, Q. Late Mesozoic compressional to extensional tectonics in the Yiwulüshan massif, NE China and their bearing on the Yinshan-Yanshan orogenic belt, Part II: Anisotropy of magnetic susceptibility and gravity modeling. Gondwana Res. 2013, 23, 78–94. [Google Scholar] [CrossRef]
  45. Liu, J.; Shen, L.; Ji, M.; Guan, H.; Zhang, Z.; Zhao, Z. The Liaonan/Wanfu metamorphic core complexes in the Liaodong Peninsula: Two stages of exhumation and constraints on the destruction of the North China Craton. Tectonics 2013, 32, 1121–1141. [Google Scholar] [CrossRef]
  46. Dmitrienko, L.V.; Li, S.Z.; Cao, X.Z.; Suo, Y.H.; Wang, Y.M.; Dai, L.M.; Somerville, I.D. Large-scale morpho-tectonics of the ocean-continent transition zone between the Western Pacific Ocean and the East Asian Continent: A link of deep process to the Earth’s surface system. Geol. J. 2016, 51, 263–285. [Google Scholar] [CrossRef]
  47. Huangfu, P.; Wang, Y.; Cawood, P.A.; Li, Z.; Fan, W.; Gerya, T.V. Thermo-mechanical controls of flat subduction: Insights from numerical modeling. Gondwana Res. 2016, 40, 170–183. [Google Scholar] [CrossRef] [Green Version]
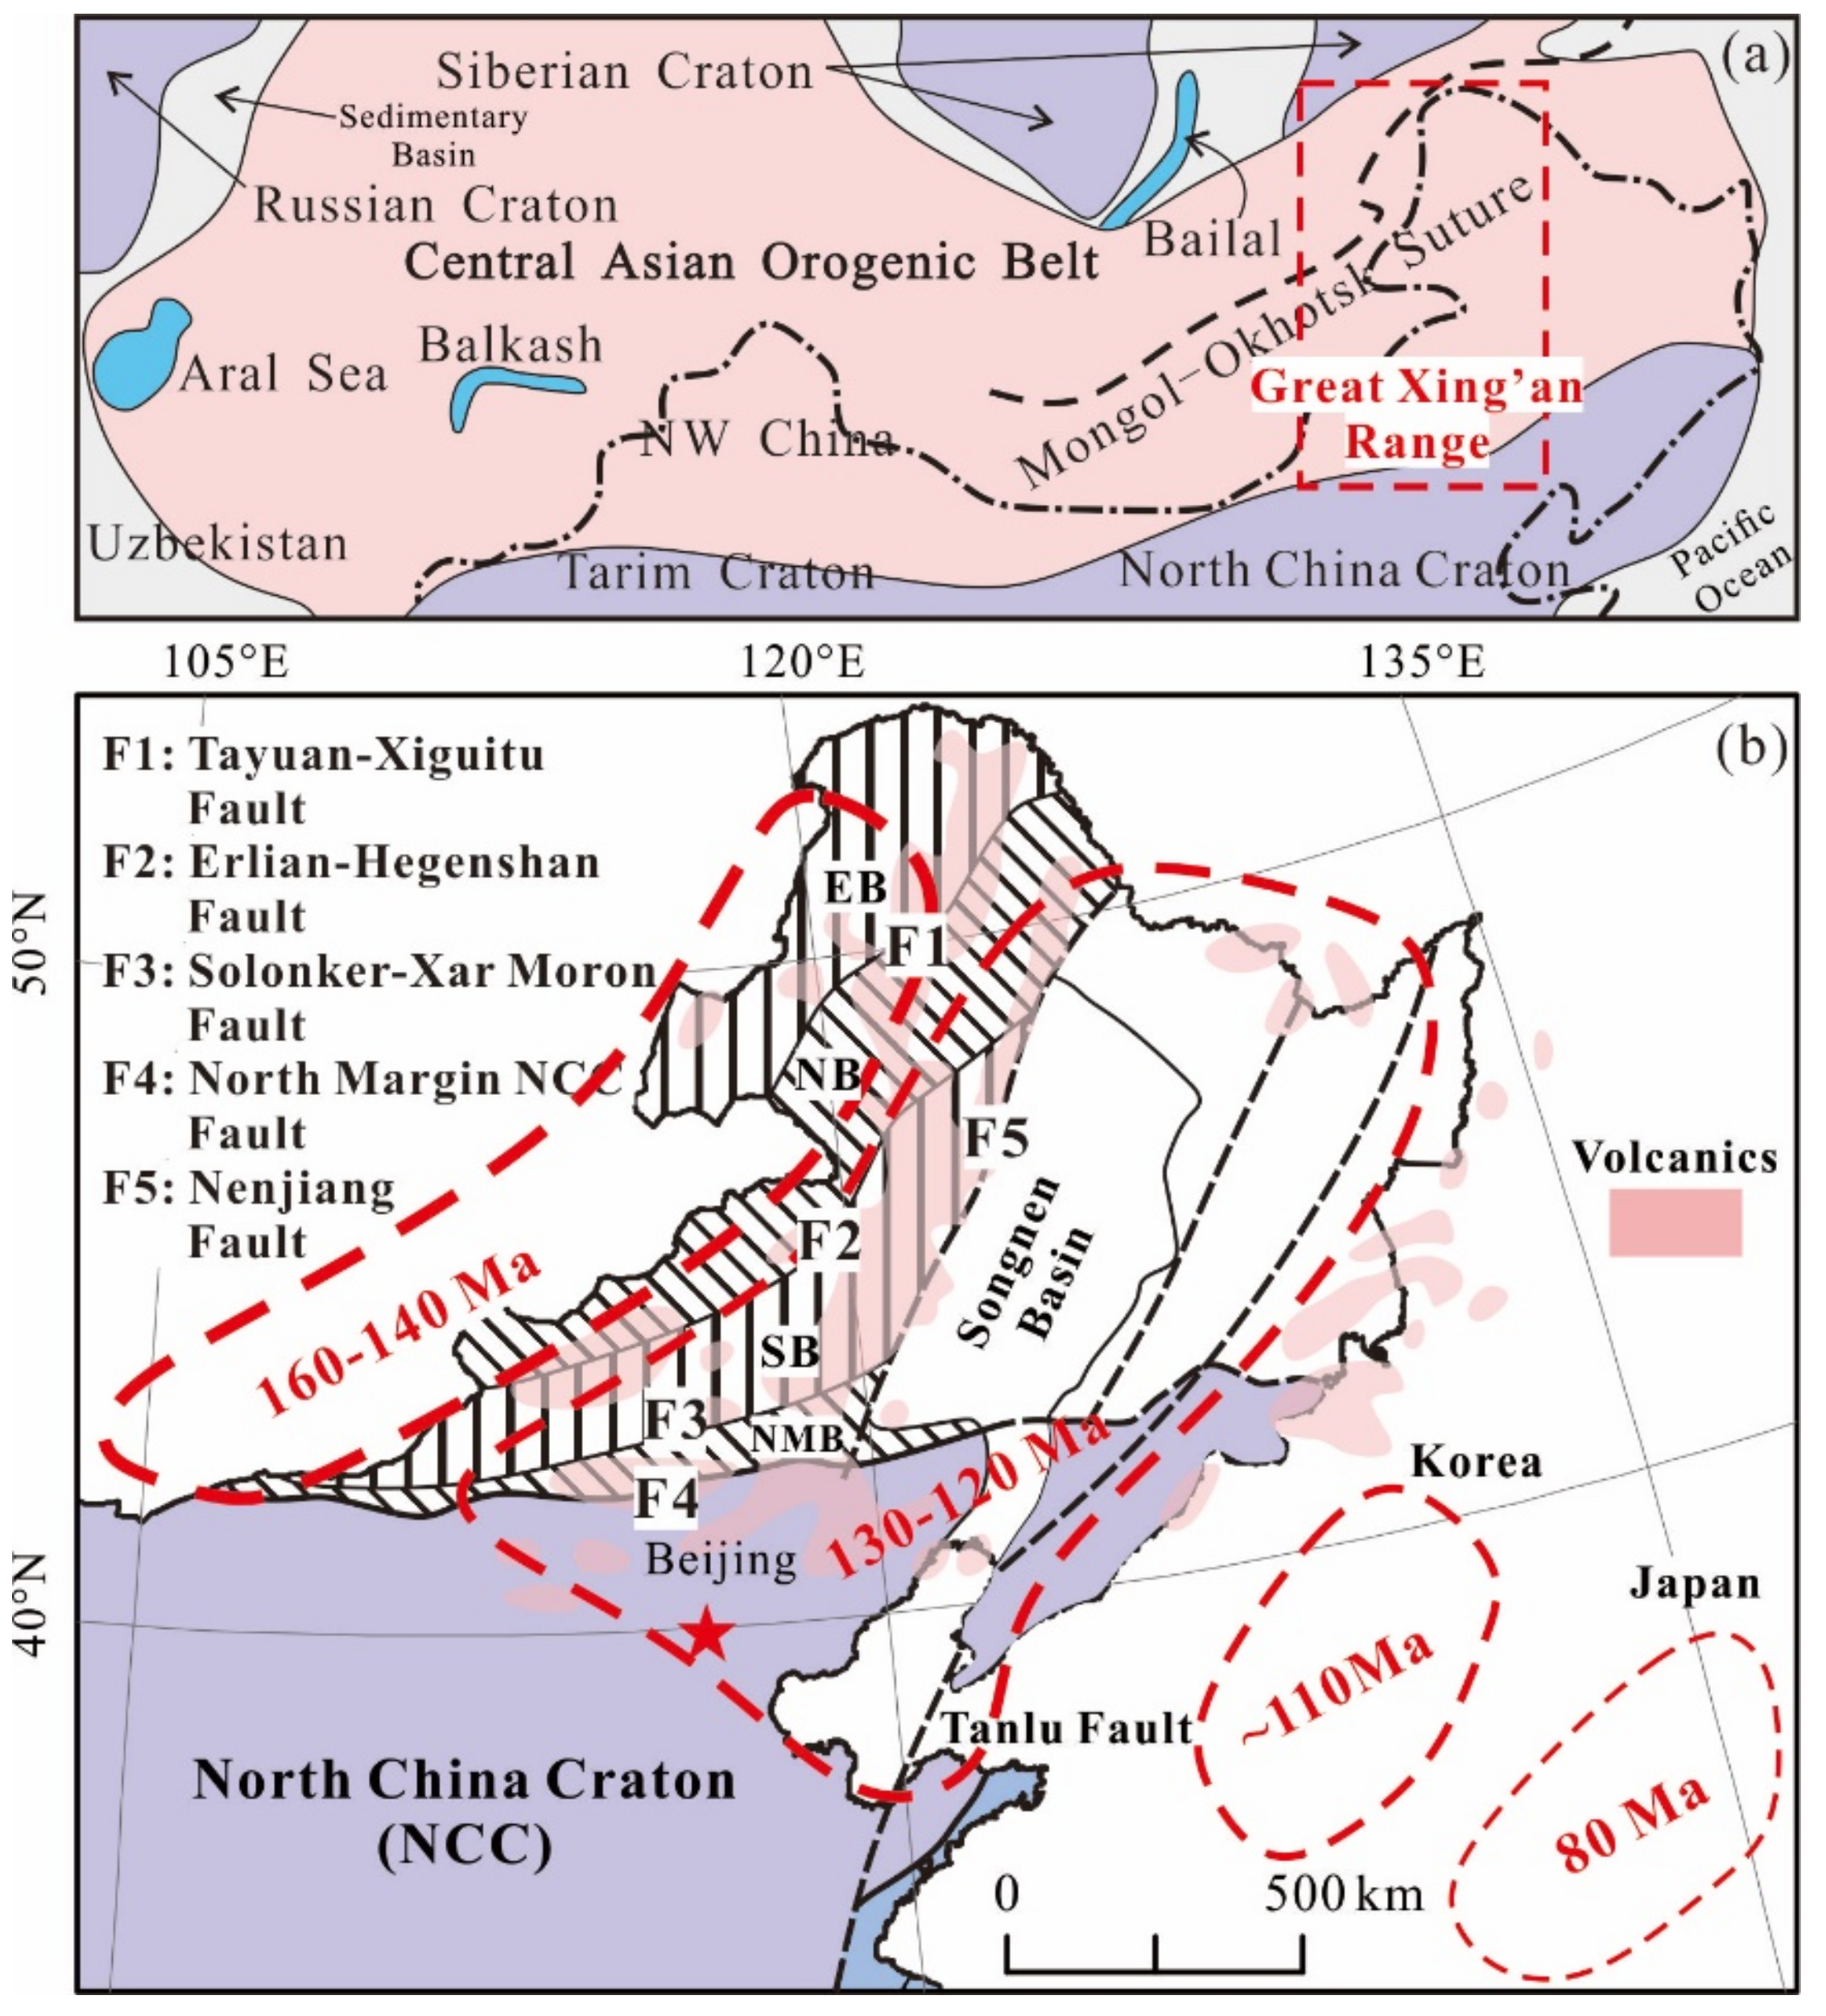
Figure 1. Geological sketch map of the Central Asian Orogenic Belt (CAOB) and Great Xing’an Range (GXR). (a) is after [21]. (b) is modified from [22]. Ages in red indicate the Pacific oceanward migration of Pacific subduction in Jurassic and Cretaceous [22]. The GXR is composed of blocks EB, NB, SB and NMB. EB, Erguna Block; NB, North Great Xing’an Range Block; SB, South Great Xing’an Range Block; NMB, North Margin Block of North China Craton.
Minerals 09 00419 g001
Figure 2. Statistical results of volcanic rock ages in the Great Xing’an Range (GXR). (a) The histogram of volcanic rock ages in the GXR; the data were taken from Zhang et al. [4,9], bin = 8 Ma, n = 823. (b) The cumulative number-age distribution of volcanic rock ages in the GXR at bin = 10 Ma. Dots represent the cumulative number of ages below the age threshold (t). Three solid lines in different colors were fitted separated by the least square method for the data from 95 to 125 Ma (black color), between 125 and 145 Ma (red color), and after 145 Ma (blue color) ranging from 145 to 515 Ma. The equations of linear fitting and their coefficients of determination are shown on the graphs.
Minerals 09 00419 g002
Figure 3. The results of singularity analysis of volcanic zircon U–Pb ages. Graphs (a) and (b) show the average density at 125 Ma while (c) and (d) show the average density at 145 Ma. The yellow circles stand for fractal density at every interval, and the red lines are fitted by the power-law functions. Graphs on the left side are plotted on an ordinary scale, and graphs on the right side are plotted on a log–log scale.
Minerals 09 00419 g003
Figure 4. Sketch diagram of possible mechanisms corresponding to the transitions at 125 and 145 Ma in the GXR. The anomalies in age transition identified are linked to plate subduction or collision caused by short spurts of mantle convection during the formation of supercontinents and continent crust growth [13,18,26]. The transition at 145 Ma may be related to slab rollback due to the subduction of the Pacific Plate, while the transition at 125 Ma may be related to slab breakoff of the Pacific Plate, coupled with the upwelling of asthenosphere, the delamination of thickened crust, and magmatic eruptions. Great Xing’an Range, GXR, Northeast China, East Asia.
Minerals 09 00419 g004