Abstract
The crystal chemistry of five optically anisotropic uvarovite samples from different localities (California, Finland, Russia, and Switzerland) were studied with electron-probe microanalysis (EPMA) and the Rietveld method. Monochromatic synchrotron high-resolution powder X-ray diffraction (HRPXRD) data were used, and Rietveld refinement was carried out with the cubic space group, . The general formula for garnet is [8]X3[6]Y2[4]Z3[4]O12. Uvarovite has the ideal formula, Ca3Cr2Si3O12, which may be written as Ca3{Cr,Al,Fe}Σ2[Si3O12] because of solid solutions. HRPXRD traces show multiple cubic garnet phases in each sample that has a heterogeneous chemical composition. The optical and back-scattered electron (BSE) images and elemental maps contain lamellar and concentric zoning as well as patchy intergrowths. With increasing a unit-cell parameter for uvarovite solid solutions, the Z–O distance remains constant, and the average <X–O> distance increases slightly in response to the Cr3+ ⇔ Al3+ cation substitution in the Y site. The Y–O distance increases most because Cr3+ (radius = 0.615 Å) is larger than Al3+ (radius = 0.545 Å) cations. The Fe3+ (radius = 0.645 Å) cation is also involved in this substitution. Structural mismatch between the cubic garnet phases in the samples gives rise to strain-induced optical anisotropy.
1. Introduction
Several studies have documented birefringent garnets with lamellar or oscillatory features, which were referred to as “chemical zoning” instead of separate phases, e.g., [1,2,3,4]. Such birefringent garnets appear to contain a few cubic garnet phases that grow as oscillatory zoning or by re-sorption and re-precipitation that gives rise to patchy features, e.g., [5,6,7].
Birefringence in garnet was reported over a century ago, e.g., [8,9], but the origin remains questionable. Some almandine, grossular, spessartine, andradite, uvarovite, and hydrogarnet samples are anisotropic under cross-polarized light, which may indicate that they are not optically cubic, e.g., [10,11,12,13]. Several reasons were given for the birefringence, but the main one appears to be cation orders in the X and Y sites that cause a symmetry reduction, e.g., [1,10,14,15]. Other suggested reasons for the birefringence in garnet were discussed and are not repeated here [16].
Six birefringent uvarovite samples were investigated with various experimental techniques, and the results were presented [17,18,19]. The water content in these samples ranges from 0.07 to 0.34 wt. %, and they exhibit no compositional zoning. Their selected-area electron diffraction (SAED) patterns are consistent with cubic symmetry. Microtwinning was not observed in their high-resolution transmission electron microscopy (HRTEM) images. Hydroxyl groups are not the primary cause for the anisotropic behavior in uvarovite, but cation ordering on the Y octahedral positions causes birefringence, as indicated by single-crystal X-ray diffraction studies [19]. The structure of their uvarovite samples was refined in various noncubic space groups, including triclinic, monoclinic, and orthorhombic, and it was concluded that partial long-range Cr3+/Al ordering on the Y site was the most prominent noncubic feature. The structure of a synthetic uvarovite was refined in the cubic space group [18]. Crystal structures that were refined in unnecessarily low symmetry space groups were heavily criticized [20,21].
Diffraction peaks from garnets showing split reflections were observed, e.g., [11,22,23,24,25,26,27]. Recently, multi-phase intergrowths of two or three cubic garnet phases were observed with HRPXRD; all birefringent garnets showed split reflections [5,7,16,28,29].
The general formula for common silicate garnet is [8]X3[6]Y2[4]Z3[4]O12, Z = 8, and space group , where the eight-fold coordinated dodecahedral X site contains Mg, Fe2+, Mn2+, or Ca cations; the six-fold coordinated octahedral Y site contains Al, Cr3+, Fe3+, Mn3+, Ti4+, or Zr4+ cations; and the four-fold coordinated tetrahedral Z site contains Si or Fe3+ cations or (O4H4) groups, e.g., [7,30,31,32,33]. The structure consists of alternating ZO4 tetrahedra and YO6 octahedra with X atoms forming XO8 dodecahedra (Figure 1). The eight O atoms in the XO8 dodecahedron occur at the corners of a distorted cube. Each O atom is four-coordinated tetrahedrally by two X, one Y, and one Z cation. The O atom occupies a general position, whereas the cations are located at special positions with fixed atom coordinates. If substitution with a different size cation occurs on the Y site in uvarovite solid solutions, for example, then the Y–O distance changes significantly, whereas the Z–O and average <X–O> distances change by minor amounts [7]. Nomenclature of the garnet supergroup was recently given [34].

Figure 1.
Part of the garnet structure viewed down the c axis, showing the linkages of the various polyhedra (X = yellow dodecahedra, Y = pink octahedra, Z = green tetrahedra, and grey spheres = O atoms).
This study examines the crystal chemistry of five optically anisotropic uvarovite samples from different localities. Each sample contains multiple cubic garnet phases, but one crystal fragment is an isotropic cubic phase. This work is part of a large study on garnet-group minerals [35,36,37,38,39]. Briefly, this study indicates that intergrowth of multiple cubic phases in a crystal of uvarovite causes strain-induced optical anisotropy.
2. Experimental Methods
2.1. Sample Description
The localities and some characteristics of the five uvarovite samples used in this study are given (Table 1). The crystals were a few millimeters in size and varied in color from light to dark green. The specimen of sample 5 contained crystals that were either dark (5a and 5b were intergrowths of two cubic phases) or light green (5c was a cubic, isotropic phase). All the other samples were birefringent, so they were not optically cubic (Figure 2).

Table 1.
Localities of the uvarovite samples† used in this study.
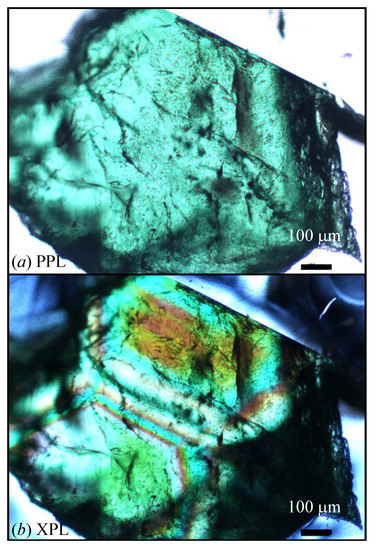
Figure 2.
(a) Plane-polarized (PPL) and (b) cross-polarized (XPL) light images for uvarovite (Uv) sample 1 from Russia. The images are from a double-sided polished thin section of 50 μm thickness. Except for sample 5c, all the other Uv samples are birefringent in XPL.
2.2. Electron-Probe Microanalysis (EPMA)
Quantitative chemical compositions, backscattered electron (BSE) images, and X-ray elemental maps were collected with a JEOL JXA-8200 WD-ED electron-probe microanalyzer (EPMA) (JEOL, Tokyo, Japan). Point analyses were obtained with the wavelength-dispersive (WD) method. The JEOL operating program on a Solaris platform was used for ZAF correction and data reduction. The operating conditions were 15 kV accelerating voltage, 20 nA beam current, and 5 μm beam diameter. The counting time was 20 s on peak and 10 s on background. Relative analytical errors were 1% for major elements and 5% for minor elements. The following standards were used: almandine-pyrope (MgKα), grossular (CaKα), almandine (FeKα, AlKα, and SiKα), rutile (TiKα), spessartine (MnKα), chromite (CrKα), and zircon (ZrLα). EPMA data were analyzed with the spreadsheet of Locock [40], and some data points are given in Table 2. The variations of the cations in the Y site are shown graphically together with an indication of the number of data points measured.
Table 2.
Electron-probe microanalysis (EPMA) results for the five uvarovite samples † (including grossular (Grs) and andradite (Adr)) used in this study. Some samples contain more than one garnet phase (ϕ).
2.3. Synchrotron High-Resolution Powder X-Ray Diffraction (HRPXRD)
The samples were studied with HRPXRD that was performed at beamline 11-BM, Advanced Photon Source (APS), Argonne National Laboratory (ANL). A small fragment (about 2 mm in diameter) of the sample was crushed to a fine powder using a corundum mortar and pestle. The crushed sample was loaded into a Kapton capillary (0.8 mm internal diameter) and rotated during the experiment at a rate of 90 rotations per second. Data were collected at 22 °C to a maximum 2θ of about 50° with a step size of 0.001° and a step time of 0.1 s per step. HRPXRD traces were collected with a unique multianalyzer detection assembly consisting of twelve independent silicon (111) crystal analyzers and LaCl3 scintillation detectors that reduced the angular range to be scanned and allowed for rapid acquisition of data. A silicon (NIST 640c) and alumina (NIST 676a) standard (ratio of ⅓Si:⅔Al2O3 by weight) was used to calibrate the instrument and refine the monochromatic wavelength (λ = 0.41390(2) or 0.41424(2) Å) used in the experiment (see Table 3). Additional details of the experimental setup are given elsewhere [41,42,43]. The above experimental techniques were used to characterize many minerals [44,45,46,47,48,49,50,51,52,53,54,55,56].
Table 3.
High-resolution powder X-ray diffraction (HRPXRD) data and Rietveld refinement statistical indicators for five uvarovite samples.
2.4. Rietveld Structure Refinement
HRPXRD data were analyzed with the Rietveld method [57], as implemented in the GSAS program [58], and using the EXPGUI interface [59]. Scattering curves for neutral atoms were used. The starting atom coordinates, cell parameter, and space group, , were taken from [31]. The background was modeled using a shifted Chebyschev polynomial (eight terms). In the GSAS program, the reflection-peak profiles were fitted using a pseudo-Voigt (type-3) profile-shape function [60,61]. A full-matrix, least-squares refinement was carried out by varying the parameters in the following sequence: a scale factor, unit cell parameter, atom coordinates, and isotropic displacement parameters. No impurities or unindexed peaks were observed in the samples. When more than one phase was detected in the traces, the separate phases were refined together with the site occupancy factors (sofs) in terms of the dominant atoms in the X, Y, and Z sites. In the multiphase samples, the isotropic displacement parameter, U, for similar sites were constrained to be equal. Toward the end of the refinement, all parameters were allowed to vary simultaneously, and the refinement converged.
3. Results
The samples appeared homogeneous in plane-polarized light (PPL), but they were birefringent under cross-polarized light (XPL) with lamellae (Figure 2). Sample 5c was isotropic and was a single cubic phase. The back-scattered electron (BSE) images contained light and dark areas that indicated different compositions (Figure 3). These BSE images showed patchy features (e.g., Figure 3a) or lamellar features that represented different compositions (Figure 3b,c). The brighter areas (higher mean atomic number) corresponded to Cr-/Fe-rich uvarovite, whereas the darker areas (lower mean atomic number) corresponded to Al-rich uvarovite, Ca3{Al,Cr,Fe}Ʃ2Si3O12.
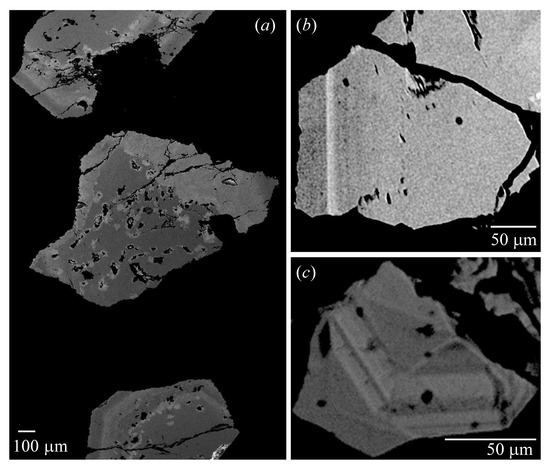
Figure 3.
Back-scattered electron (BSE) images showing well-defined lamellar features in all the images. (a) Uv sample 1 from Russia-A, (b) Uv sample 3 from Russia-B, and (c) Uv sample 5 from California. The crystals in (a) also contain patchy features that arise from dissolution and re-precipitation. The scale bars are shown.
The BSE image and X-ray elemental maps showed the distribution of Al, Cr, and Ti atoms for sample 1 (Figure 4) and sample 5 (Figure 5). Concentric and lamellar features clearly showed a heterogeneous distribution of the Al atoms (Figure 4b). The lamellar features indicated epitaxial growth and represented two different compositions that were visible in the images. Two separate compositions can be deduced from the elemental maps and quantitative spot analyses (Table 2; Figure 6). The EPMA compositions from the various points were not averaged because of their heterogeneous distribution in each sample. Instead, a composition for each phase in a sample was given (Table 2), and the distribution of the cations in the Y site was shown (Figure 6). After examining EPMA and HRPXRD results, probable compositions were given for each phase in Table 2.
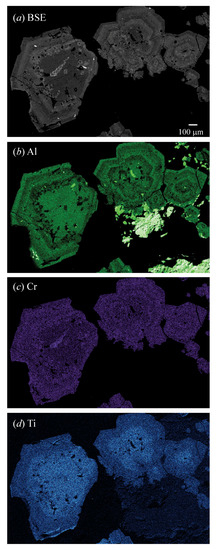
Figure 4.
Uv sample 1 from Russia: (a) BSE image contains light and dark concentric features that indicate different compositions. The X-ray elemental maps show the distribution of (b) Al, (c) Cr3+, and (d) Ti4+ atoms that occur in the Y site. The Fe3+ map is homogeneous and is not shown. The concentric features indicate epitaxial growth and two different compositions are observed (Table 2). The scale bar in (a) is 100 μm.

Figure 5.
Uv sample 2 from Switzerland: (a) BSE image contains light and dark patches that indicate different compositions. The X-ray elemental maps show the inverse distribution of (b) Al and (c) Cr atoms. The Fe and Mg maps are homogeneous and are not shown. The light and dark patches are formed by dissolution and re-precipitation of the Uv crystals. The scale bar in (a) is 50 μm.
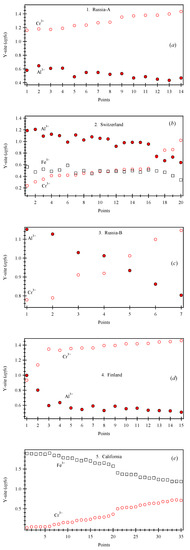
Figure 6.
Variations for the dominant Y-site cations for the five Uv samples: (a) 1. Russia-A, (b) 2. Switzerland, (c) 3. Russia-B, (d) 4. Finland, and (e) 5. California. For each EPMA data point, apfu were obtained from each sample (some are given in Table 2), and the cations on the Y site are shown graphically. The point analyses are ordered in terms of the dominant Y-site cation.
Instead of lamellar or epitaxial features, sample 5 displayed patchy features with heterogeneous distribution of Al atoms (Figure 5). This sample contained two cubic phases. It was possible to find a light green crystal fragment that was a cubic isotropic phase (i.e., sample 5c).
The complete HRPXRD traces for the samples are given (Figure 7). The expanded traces showed that each reflection peak was split because each sample contained different cubic phases (Figure 8). Sample 5c represented a single cubic phase because the peaks were sharp, narrow, and symmetrical (Figure 7f and Figure 8f).
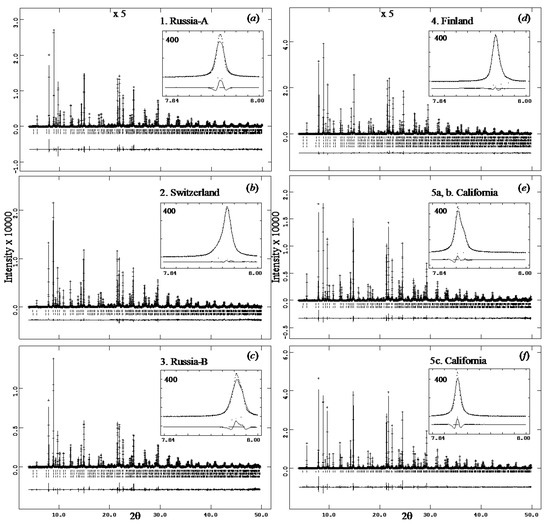
Figure 7.
Complete HRPXRD traces for the five Uv samples: (a) 1. Russia-A, (b) 2. Switzerland, (c) 3. Russia-B, (d) 4. Finland, (e) 5a, b. California, and (f) 5c. California. The difference curve (Iobs − Icalc) is shown at the bottom of each trace. Short vertical lines indicate allowed reflection positions. The intensities and difference curves that are above 20° 2θ are multiplied by 5. The inserts contain the 400 reflection that occurs at a low 2θ angle, and the range is the same for each sample.
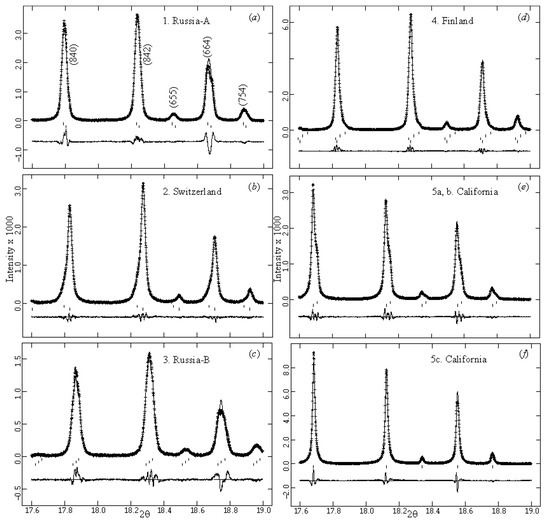
Figure 8.
Expanded scale for the same set of reflections for five samples: (a) 1. Russia-A, (b) 2. Switzerland, (c) 3. Russia-B, (d) 4. Finland, (e) 5a, b. California, and (f) 5c. California. For the multiple-phase cubic samples, each reflection peak is split, asymmetrical, or broad (a, b, and e = two phases, c = three phases, d = four phases), whereas a cubic single-phase garnet has sharp, narrow, and symmetrical peaks (f).
The unit-cell parameters and the Rietveld refinement statistical indicators for the phases in the five samples are given (Table 3). Their atom coordinates, isotropic displacement parameters, and sofs are given (Table 4). Bond distances and angles for each phase are listed (Table 5). The unit cell parameters and bond distances are displayed (Figure 9).
Table 4.
Atom coordinatesa, isotropic displacement parameters, U × 100 (Å2), and sofs for five uvarovite samples (including Grs and Adr).
Table 5.
Selected bond distances (Å) and angles (°) for five uvarovite samples.
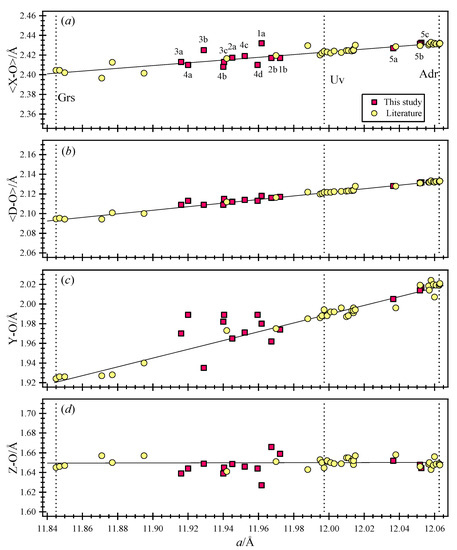
Figure 9.
Structural variations for five uvarovite samples that occur between grossular (Grs; a = 11.845(1) Å [31]) and andradite (Adr; a = 12.06259(1) [7]) (dashed vertical lines). A dashed vertical line for a synthetic uvarovite (Uv) is shown (a = 11.997 Å [18]). The (a) average <X–O>, (b) mean <D–O>, (c) Y–O, and (d) Z–O distances vary linearly with the a unit cell parameter. The intervals on the y-axis are the same in each plot (0.11 Å). The Z–O distances are nearly constant. The <X–O> and <D–O> distances change by small amounts, but the Y–O distances change the most and show the most scatter. Phase 1b and, in particular, phase 2b may contain minor amounts of (O4H4) hydrogarnet substitution because their Z–O distance increases as their Y–O distance decreases. Error bars are smaller than the symbols.
4. Discussion
Both the EPMA results and the HRPXRD data indicated that all the uvarovite samples were chemically heterogeneous. EPMA point analyses were used to obtain an estimate of the individual phase composition (Table 2; Figure 6).
There are several assumptions made in calculating a chemical formula for garnet using EPMA data so that the formula is stoichiometric with no atom vacancies and results in a general formula, X3Y2Z3O12. Cation vacancies are possible in garnets and are well-known in hydrogarnets, e.g., [63,64,65,66,67]. Atom vacancies are common in minerals, and this is tested by refining the cation sofs as the O-atom sof is set to 1 (Table 4). Using all the atoms obtained by EPMA, sofs are calculated in terms of the dominant atoms in the X(Ca), Y(Cr/Al/Fe), and Z(Si) sites and then converted to electrons (Table 4). The Δe values for these sites are reported in the last three lines in Table 4. The agreement between EPMA and refinements results are quite good, except for phases that occur in such small amounts that their structures cannot be refined with sufficient accuracy (e.g., phase 4a).
Complete HRPXRD traces are shown for the five samples (Figure 7). A single cubic isotropic phase is observed for sample 5c (Figure 7f and Figure 8f). The expanded HRPXRD traces clearly show multiple cubic phases (Figure 8). Each peak in the birefringent uvarovite samples is split, but the isotropic sample 5c shows sharp, symmetric, and narrow peaks. The split reflections indicate multiple cubic phases: samples 1, 2, and 5 contain two phases; sample 3 contains three phases; and sample 4 contains four phases. Different compositions corresponding to the different cubic uvarovite phases were also observed in BSE images and point analyses (Table 1; Figure 6).
Vacancies in the Z site (<10%), if real, may indicate minor (O4H4) substituting for the SiO4 group. If (O4H4) substitution occurs, then Z(sof) is <1, the unit cell edge increases, the Si–O bond distance increases, and, simultaneously, the Y–O distance decreases from their corresponding values in the hydrous phase [63]. Based on these criteria, (O4H4) substitutions appear to be insignificant in our samples except for phases 2b and 1b (Table 5, Figure 9).
Data from this study are shown in Figure 9, which was previously developed to show the structural variations across the entire cubic garnet-group minerals, including cubic hydrogarnets [7,63]. Figure 9 was constructed with data taken from the literature, e.g., [30,31,64,65,66,67,68,69,70,71,72,73,74,75,76,77,78,79,80,81,82,83,84,85,86,87,88,89]. All the single-crystal structure refinements of garnets were done in the cubic space group, , and only single phases were observed with the single-crystal method, which is not appropriate for studying a multiple-phase assemblage because of the complications that arise from diffraction of the different phases. The bond distances obtained by single-crystal and HRPXRD methods are similar. Multiple phases in grossular could not be observed with TEM [10] but were easily observed with HRPXRD (this study; [28]). Multiphases also occur in other minerals such as apatite [90], genthelvite [91], and nepheline [92].
The O atom is at a general position in the garnet structure, and the coordinates for all the cation sites are fixed. Because each O atom is four-coordinated by one Z, one Y, and two X sites in a tetrahedral configuration, substitution on any one cation site has only minor effects on the other sites, as reflected in their bond distances [7]. The Z–O distances are nearly constant and are within the range 1.64 to 1.65 Å because the Z site is nearly filled with Si atoms (Figure 9). The X site is nearly filled with Ca atoms, so the <X–O> distance increases slightly in response to substitution in the Y site (Figure 9). Therefore, the Z and X sites have minor influence on the structural variations in uvarovite solid solutions, which is controlled mainly by Cr, Al, and Fe atoms in the Y site. Sample 5 from California plots close to end-member andradite, so it is inappropriate to call it uvarovite, especially for phase 5a, which is Adr94Grs4Uv1 (Table 2).
Sample 5 contains two cubic phases. Phases 5b and 5c have unit cell parameters, and bond distances are identical to each other (5b and 5c in Table 5; Figure 9). Phase 5a contains less Fe3+ cations than phases 5b or 5c (Table 4). This difference results in large differences in the sofs for the Y site (Table 4) and Y–O distances (Figure 9). The Z–O and average <X–O> distances are nearly the same for all phases in sample 5 because they contain similar numbers of Si and Ca atoms, respectively (Table 4; Figure 9). The larger unit cell parameters of phases 5b and 5c over 5a results from a larger number of Fe atoms in phases 5b and 5c. This difference in unit cell parameters is 0.015 Å (Table 3).
The Y–O distance increases the most because of the substitutions of large Fe3+ (radius = 0.645 Å) and Cr3+ (radius = 0.615 Å) cations for smaller Al3+ (radius = 0.535 Å) cations, as required for solid solutions between anhydrous grossular (Ca3Al2Si3O12), uvarovite (Ca3Cr2Si3O12), and andradite (Ca3Fe3+2Si3O12). For some samples, there appears to be an increase in Z–O distance and a corresponding decrease in Y–O distance, which may indicate minor hydrogarnet substitution [28,64,65]. A good example is phase 2b (Figure 9).
The <D–O> distances (<D–O> = {(Z–O) + (Y–O) + (X–O) + (X’–O)}/4) vary linearly with the a unit cell parameter [16]. All data points shown in Figure 9 essentially fall on the linear line for <D–O>, but the other distances (Z–O, <X–O>, and Y–O) show varying degrees of scatter. Better coordination of the O atom over the cations appears to be important for the garnet structure.
Lamellar “zones” in grossular–andradite (Grs–Adr) solid solutions are Al3+- or Fe3+-rich, and they have an inverse relation with regard to these cations occupying the Y site, e.g., [1,3,4,24,93]. In order to simulate cation order in garnets, many single-crystal studies were done in space groups with symmetries that were lower than cubic (see Introduction). However, this study, as well as our other studies on garnets, show that such lamellar “zones” represent two or three different cubic phases [5,7,16,28]. The different cubic phases are evident from HRPXRD traces (Figure 7 and Figure 8) and BSE images (Figure 3, Figure 4 and Figure 5). Oscillatory zoning in garnet-group minerals may be primary growth features, as these are similar to those observed in erythrite [94]. The patchy features observed in BSE images may arise from secondary dissolution and re-precipitation.
Hirai and Nakazawa [24] observed stratified (110) layers in an iridescent grandite garnet, where the layers were composed of Fe-rich (Adr87) and Al-rich (Adr78) lamellae. Their selected-area electron diffraction (SAED) pattern showed two phases because spots were split normal to the lamellae. From the split reflections, the difference in unit cell size for the two phases was about 0.02 Å. They interpreted the lamellae as arising from exsolution [23,24] instead of oscillatory zoning, e.g., [1,2,3,4]. In our studies on andradites that contained lamellae, two or three different cubic phases were observed [5,16].
5. Conclusions
Uvarovite garnets have cubic symmetry and can exist as a single-phase or an intergrowth of a few cubic uvarovite phases, which occurs as epitaxial growth features (“chemical zoning”) instead of exsolution (e.g., Figure 3b,c). The different phases can also form by hydrothermal alteration where the original phase is dissolved, re-precipitated, and occurs as patchy features (e.g., Figure 3a, Figure 4 and Figure 5). Such patchy features were observed in other garnets [6,33]. Single-phase uvarovite is optically isotropic, whereas the multiphase uvarovite samples are anisotropic because of the strain arising from structural mismatch (differences in unit cell parameters and bond distances). The coexistence of multicubic phases is caused by compositional variations at the Y site (Al, Cr, and Fe substitutions) that also control the structural variations because the atoms occupying the Y site have different sizes.
Garnets exist in various geological environments and have extensive uses in society. The birefringence problem in garnet has perplexed researchers for over a century. This study on uvarovite garnet shows that structural mismatch between the cubic phases in the intergrowths gives rise to strain-induced birefringence. The presence of these different phases can easily be detected with high-resolution synchrotron X-rays. This study also clarifies that uvarovite garnet is cubic, which is in contrast to recent studies that claim the presence of low symmetry that arises from cation ordering.
Author Contributions
J.J.S. performed the EPMA experiment and analyzed the chemical composition data. S.M.A. conceived the project, analyzed the HRPXRD data, and wrote the manuscript. Both authors contributed to editing the manuscript.
Funding
This project was funded by a NSERC Discovery Grant (10013896) to SMA.
Acknowledgments
We thank the three anonymous reviewers for useful suggestions that helped improve this manuscript. We thank the Royal Ontario Museum (ROM) for providing some uvarovite samples. R. Marr is thanked for his help with the electron probe analyses and B. Gelfand is thanked for his help with the SCXRD work. The HRPXRD data were collected at the X-ray Operations and Research beamline 11-BM, Advanced Photon Source (APS), Argonne National Laboratory (ANL). Use of the APS was supported by the U.S. Dept. of Energy, Office of Science, Office of Basic Energy Sciences, under Contract No. DE-AC02-06CH11357.
Conflicts of Interest
The authors declare no conflict of interest.
References
- Akizuki, M. Origin of optical variations in grossular-andradite garnet. Am. Mineral. 1984, 66, 403–409. [Google Scholar]
- Ivanova, T.I.; Shtukenberg, A.G.; Punin, Y.O.; Frank-Kamenetskaya, O.V.; Sokolov, P.B. On the complex zonality in grandite garnets and implications. Mineral. Mag. 1998, 62, 857–868. [Google Scholar] [CrossRef]
- Jamtveit, B. Oscillatory zonation patterns in hydrothermal grossular-andradite garnet: Nonlinear dynamics in regions of immiscibility. Am. Mineral. 1991, 76, 1319–1327. [Google Scholar]
- Pollok, K.; Jamtveit, B.; Putnis, A. Analytical transmission electron microscopy of oscillatory zoned grandite garnets. Contrib. Mineral. Petrol. 2001, 141, 358–366. [Google Scholar] [CrossRef]
- Antao, S.M.; Zaman, M.; Gontijo, V.L.; Camargo, E.S.; Marr, R.A. Optical anisotropy, zoning, and coexistence of two cubic phases in andradites from Quebec and New York. Contrib. Mineral. Petrol. 2015, 169, 10. [Google Scholar] [CrossRef]
- Ague, J.J.; Axler, J.A. Interface coupled dissolution-reprecipitation in garnet from subducted granulites and ultrahigh-pressure rocks revealed by phosphorous, sodium, and titanium zonation. Am. Mineral. 2016, 101, 1696–1699. [Google Scholar] [CrossRef]
- Antao, S.M. Three cubic phases intergrown in a birefringent andradite-grossular garnet and their implications. Phys. Chem. Miner. 2013, 40, 705–716. [Google Scholar] [CrossRef]
- Brewster, D. On the optical figures produced by the disintegrated surfaces of crystals. Philos. Mag. Ser. 4 1853, 6, 16–30. [Google Scholar] [CrossRef]
- Mallard, E. Anomalies optiques. Ann. Mines. Mem. VII Ser. 1876, 10, 60. [Google Scholar]
- Allen, F.M.; Buseck, P.R. XRD, FTIR, and TEM studies of optically anisotropic grossular garnets. Am. Mineral. 1988, 73, 568–584. [Google Scholar]
- Brown, D.; Mason, R.A. An occurrence of sectored birefringence in almandine from the Gangon terrane, Labrador. Can. Mineral. 1994, 32, 105–110. [Google Scholar]
- Deer, W.A.; Howie, R.A.; Zussman, J. Rock-forming minerals: Volume 1A Orthosilicates; Longman Group Limited: New York, NY, USA, 1982. [Google Scholar]
- Rossman, G.R.; Aines, R.D. The hydrous components in garnets: Grossular-hydrogrossular. Am. Mineral. 1991, 76, 1153–1164. [Google Scholar]
- Frank-Kamenetskaya, O.V.; Rozhdestvenskaya, L.V.; Shtukenberg, A.G.; Bannova, I.I.; Skalkina, Y.A. Dissymmetrization of crystal structures of grossular-andradite garnets Ca3(Al, Fe)2(SiO4)3. Struct. Chem. 2007, 18, 493–503. [Google Scholar] [CrossRef]
- Takéuchi, Y.; Haga, N.; Umizu, S.; Sato, G. The derivative structure of silicate garnets in grandite. Z. Krist. 1982, 158, 53–99. [Google Scholar] [CrossRef]
- Antao, S.M.; Klincker, A.M. Origin of birefringence in andradite from Arizona, Madagascar, and Iran. Phys. Chem. Miner. 2013, 40, 575–586. [Google Scholar] [CrossRef]
- Andrut, M.; Wildner, M. The crystal chemistry of birefringent natural uvarovites: Part I. Optical investigations and UV-VIS-IR absorption spectroscopy. Am. Mineral. 2001, 86, 1219–1230. [Google Scholar] [CrossRef]
- Andrut, M.; Wildner, M. The crystal chemistry of birefringent natural uvarovites. Part III. Application of the superposition model of crystal fields with a characterization of synthetic cubic uvarovite. Phys. Chem. Miner. 2002, 29, 595–608. [Google Scholar] [CrossRef]
- Wildner, M.; Andrut, M. The crystal chemistry of birefringent natural uvarovites: Part II. Single-crystal X-ray structures. Am. Mineral. 2001, 86, 1231–1251. [Google Scholar] [CrossRef]
- Baur, W.H.; Fischer, R.X. On the significance of small deviations from higher symmetry. Mineral. Mag. 2003, 67, 793–797. [Google Scholar] [CrossRef]
- Baur, W.H.; Tillmanns, E. How to avoid unnecessarily low symmetry in crystal structure determination. Acta Crystallogr. 1986, B42, 95–111. [Google Scholar] [CrossRef]
- Bank, H. Über grossular und hydrogrossular. Z. Dtsch. Gemmol. Ges. 1982, 31, 93–96. [Google Scholar]
- Hirai, H.; Nakazawa, H. Visualizing low symmetry of a grandite garnet on precession photographs. Am. Mineral. 1986, 71, 1210–1213. [Google Scholar]
- Hirai, H.; Nakazawa, H. Grandite garnet from Nevada: Confirmation of origin of iridescence by electron microscopy and interpretation of a moiré-like texture. Am. Mineral. 1986, 71, 123–126. [Google Scholar]
- Koritnig, S.; Rösch, H.; Schneider, A.; Seifert, F. Der Titan-zirkon-granat aus den Kalksilikatfels-Einschlüssen des Gabbro im Radautal, Harz, Bundesrepublik Deutschland. Tsch. Mineral. Petrogr. Mitt. 1978, 25, 305–313. [Google Scholar] [CrossRef]
- Manning, P.G.; Owens, D.R. Electron microprobe, X-ray diffraction, and spectral studies of South African and British Columbian “jades”. Can. Mineral. 1977, 15, 512–517. [Google Scholar]
- Zabinski, W. “Hydrogarnets”, Polska Akademia Nauk Oddzial Krakowie, Komisja Nauk Mineralogicznych, Prace Mineralogiczne. Geol. Warszawa 1966, 3, 1–69. [Google Scholar]
- Antao, S.M. Is near-endmember birefringent grossular non-cubic? New evidence from synchrotron diffraction. Can. Mineral. 2013, 51, 771–784. [Google Scholar] [CrossRef]
- Schingaro, E.; Lacalamita, M.; Mesto, E.; Ventruti, G.; Pedrazzi, G.; Ottolini, L.; Scordari, F. Crystal chemistry and light elements analysis of Ti-rich garnets. Am. Mineral. 2016, 101, 371–384. [Google Scholar] [CrossRef]
- Armbruster, T. Structure refinement of hydrous andradite, Ca3Fe1.54Mn0.02Al0.26(SiO4)1.65(O4H4)1.35, from the Wessels mine, Kalahari manganese field, South Africa. Eur. J. Mineral. 1995, 7, 1221–1225. [Google Scholar] [CrossRef]
- Novak, G.A.; Gibbs, G.V. The crystal chemistry of the silicate garnets. Am. Mineral. 1971, 56, 1769–1780. [Google Scholar]
- Ungaretti, L.; Leona, M.; Merli, M.; Oberti, R. Non-ideal solid-solution in garnet: Crystal-structure evidence and modelling. Eur. J. Mineral. 1995, 7, 1299–1312. [Google Scholar] [CrossRef]
- Antao, S.M.; Cruickshank, L.A. Two cubic phases in kimzeyite garnet from the type locality Magnet Cove, Arkansas. Acta Crystallogr. 2016, B72, 846–854. [Google Scholar] [CrossRef] [PubMed]
- Grew, E.S.; Locock, A.J.; Mills, S.J.; Galuskina, I.O.; Galuskin, E.V.; Hålenius, U. Nomenclature of the garnet supergroup. Am. Mineral. 2013, 98, 785–811. [Google Scholar] [CrossRef]
- Antao, S.M. Schorlomite and morimotoite: what’s in a name? Powder Diffr. 2014, 29, 346–351. [Google Scholar] [CrossRef]
- Antao, S.M.; Cruickshank, L.A. Crystal structure refinements of tetragonal (OH,F)-rich spessartine and henritermierite garnets. Acta Crystallogr. 2018, B74, 104–114. [Google Scholar] [CrossRef]
- Antao, S.M.; Mohib, S.; Zaman, M.; Marr, R.A. Ti-rich andradites: Chemistry, structure, multi-phases, optical anisotropy, and oscillatory zoning. Can. Mineral. 2015, 53, 133–158. [Google Scholar] [CrossRef]
- Antao, S.M.; Suarez Nieto, N.S.; Cruickshank, L.A.; Gwanmesia, G.D. Crystal structure refinements of pyrope-majorite solid solutions between Prp100Mj0 and Prp17Mj83. Adv. X-Ray Anal. 2015, 59, 192–211. [Google Scholar]
- Antao, S.M.; Zaman, M.; Suarez Nieto, N.S.; Gontijo, V.L.; Marr, R.A. Structural variations in pyrope-almandine solid solutions. Adv. X-Ray Anal. 2014, 58, 90–107. [Google Scholar]
- Locock, A.J. An excel spreadsheet to recast analyses of garnet into end-member components, and a synopsis of the crystal chemistry of natural silicate garnets. Comput. Geosci. 2008, 34, 1769–1780. [Google Scholar] [CrossRef]
- Antao, S.M.; Hassan, I.; Wang, J.; Lee, P.L.; Toby, B.H. State-of-the-art high-resolution powder X-ray diffraction (HRPXRD) illustrated with Rietveld structure refinement of quartz, sodalite, tremolite, and meionite. Can. Mineral. 2008, 46, 1501–1509. [Google Scholar] [CrossRef]
- Lee, P.L.; Shu, D.; Ramanathan, M.; Preissner, C.; Wang, J.; Beno, M.A.; Von Dreele, R.B.; Ribaud, L.; Kurtz, C.; Antao, S.M.; et al. A twelve-analyzer detector system for high-resolution powder diffraction. J. Synchrotron Radiat. 2008, 15, 427–432. [Google Scholar] [CrossRef] [PubMed]
- Wang, J.; Toby, B.H.; Lee, P.L.; Ribaud, L.; Antao, S.M.; Kurtz, C.; Ramanathan, M.; Von Dreele, R.B.; Beno, M.A. A dedicated powder diffraction beamline at the advanced photon source: Commissioning and early operational results. Rev. Sci. Instrum. 2008, 79, 085105. [Google Scholar] [CrossRef] [PubMed]
- Antao, S.M.; Duane, M.J.; Hassan, I. DTA, TG, and XRD studies of sturmanite and ettringite. Can. Mineral. 2002, 40, 1403–1409. [Google Scholar] [CrossRef]
- Ehm, L.; Antao, S.M.; Chen, J.H.; Locke, D.R.; Michel, F.M.; Martin, C.D.; Yu, T.; Parise, J.B.; Lee, P.L.; Chupas, P.J.; et al. Studies of local and intermediate range structure in crystalline and amorphous materials at high pressure using high-energy X-rays. Powder Diffr. 2007, 22, 108–112. [Google Scholar] [CrossRef]
- Antao, S.M.; Hassan, I. Thermal analyses of sodalite, tugtupite, danalite, and helvite. Can. Mineral. 2002, 40, 163–172. [Google Scholar] [CrossRef]
- Skinner, L.B.; Benmore, C.J.; Antao, S.M.; Soignard, E.; Amin, S.A.; Bychkov, E.; Rissi, E.; Parise, J.B.; Yarger, J.L. Structural changes in vitreous GeSe4 under pressure. J. Phys. Chem. C 2011, 116, 2212–2217. [Google Scholar] [CrossRef]
- Hassan, I.; Antao, S.M.; Parise, J.B. Haüyne: Phase transition and high-temperature structures obtained from synchrotron radiation and Rietveld refinements. Mineral. Mag. 2004, 68, 499–513. [Google Scholar] [CrossRef]
- Antao, S.M. Structural trends for celestite (SrSO4), anglesite (PbSO4), and barite (BaSO4): Confirmation of expected variations within the SO4 groups. Am. Mineral. 2012, 97, 661–665. [Google Scholar] [CrossRef]
- Ehm, L.; Michel, F.M.; Antao, S.M.; Martin, C.D.; Lee, P.L.; Shastri, S.D.; Chupas, P.J.; Parise, J.B. Structural changes in nanocrystalline mackinawaite (FeS) at high presure. J. Appl. Crystallogr. 2009, 42, 15–21. [Google Scholar] [CrossRef]
- Parise, J.B.; Antao, S.M.; Michel, F.M.; Martin, C.D.; Chupas, P.J.; Shastri, S.; Lee, P.L. Quantitative high-pressure pair distribution function analysis. J. Synchrotron Radiat. 2005, 12, 554–559. [Google Scholar] [CrossRef]
- Antao, S.M. Crystal structure of morimotoite from Ice River, Canada. Powder Diffr. 2014, 29, 325–330. [Google Scholar] [CrossRef]
- Antao, S.M. Crystal-structure analysis of four mineral samples of anhydrite, CaSO4, using synchrotron high-resolution powder X-ray diffraction data. Powder Diffr. 2011, 26, 326–330. [Google Scholar] [CrossRef]
- Antao, S.M.; Hassan, I.; Crichton, W.A.; Parise, J.B. Effects of high pressure and temperature on cation ordering in magnesioferrite, MgFe2O4, using in situ synchrotron X-ray powder diffraction up to 1430 K and 6 GPa. Am. Mineral. 2005, 90, 1500–1505. [Google Scholar] [CrossRef]
- Antao, S.M.; Hassan, I. Gaudefroyite, Ca8Mn3+6[(BO3)6(CO3)2O6]: High-temperature crystal structure. Can. Mineral. 2008, 46, 183–193. [Google Scholar] [CrossRef]
- Antao, S.M.; Hassan, I.; Parise, J.B. The structure of danalite at high temperature obtained from synchrotron radiation and Rietveld refinements. Can. Mineral. 2003, 41, 1413–1422. [Google Scholar] [CrossRef]
- Rietveld, H.M. A profile refinement method for nuclear and magnetic structures. J. Appl. Crystallogr. 1969, 2, 65–71. [Google Scholar] [CrossRef]
- Larson, A.C.; Von Dreele, R.B. General Structure Analysis System (GSAS); Los Alamos National Laboratory Report; LAUR 86-748; Los Alamos National Laboratory: Los Alamos, NM, USA, 2000.
- Toby, B.H. EXPGUI, a graphical user interface for GSAS. J. Appl. Crystallogr. 2001, 34, 210–213. [Google Scholar] [CrossRef]
- Cagliotti, G.; Paoletti, A.; Ricci, F.P. Choice of collimators for a crystal spectrometer for neutron diffraction. Nucl. Instrum. 1958, 3, 223–228. [Google Scholar] [CrossRef]
- Thompson, P.; Cox, D.E.; Hastings, J.B. Rietveld refinement of Debye-Scherrer synchrotron X-ray data from alumina. J. Appl. Crystallogr. 1987, 20, 79–83. [Google Scholar] [CrossRef]
- Kitamura, K.; Komatsu, H. Optical anisotropy associated with growth striation of yttrium garnet, Y3(Al,Fe)5O12. Krist. und Technik. 1978, 13, 811–816. [Google Scholar] [CrossRef]
- Antao, S.M. Crystal chemistry of birefringent hydrogrossular. Phys. Chem. Miner. 2015, 42, 455–474. [Google Scholar] [CrossRef]
- Basso, R.; Cimmino, F.; Messiga, B. Crystal chemical and petrological study of hydrogarnets from a Fe-gabbro metarodingite (Gruppo Di Voltri, Western Liguria, Italy). Neues Jahrb. Fur Mineral. Abh. 1984, 150, 247–258. [Google Scholar]
- Basso, R.; Cimmino, F.; Messiga, B. Crystal chemistry of hydrogarnets from three different microstructural sites of a basaltic metarodingite from the Voltri Massif (Western Liguria, Italy). Neues Jahrb. Fur Mineral. Abh. 1984, 148, 246–258. [Google Scholar]
- Basso, R.; Dellagiusta, A.; Zefiro, L. A crystal chemical study of a Ti-containing hydrogarnet. Neues Jahrb. Fur Mineral. Mon. 1981, 5, 230–236. [Google Scholar]
- Basso, R.; Dellagiusta, A.; Zefiro, L. Crystal-structure refinement of plazolite—A highly hydrated hatural hydrogrossular. Neues Jahrb. Fur Mineral. Mon. 1983, 6, 251–258. [Google Scholar]
- Adamo, I.; Gatta, G.D.; Rotitoti, N.; Diella, V.; Pavese, A. Green andradite stones: Gemological and mineralogical characterisation. Eur. J. Mineral. 2010, 23, 91–100. [Google Scholar] [CrossRef]
- Agrosì, G.; Schingaro, E.; Pedrazzi, G.; Scandale, E.; Scordari, R. A crystal chemical insight into sector zoning of a titanian andradite (“melanite”) crystal. Eur. J. Mineral. 2002, 14, 785–794. [Google Scholar] [CrossRef]
- Armbruster, T.; Birrer, J.; Libowitzky, E.; Beran, A. Crystal chemistry of Ti-bearing andradites. Eur. J. Mineral. 1998, 10, 907–921. [Google Scholar] [CrossRef]
- Armbruster, T.; Geiger, C.A. Andradite crystal chemistry, dynamic X-site disorder and structural strain in silicate garnets. Eur. J. Mineral. 1993, 5, 59–71. [Google Scholar] [CrossRef]
- Armbruster, T.; Geiger, C.A.; Lager, G.A. Single crystal X-ray structure study of synthetic pyrope almandine garnets at 100 and 293 K. Am. Mineral. 1992, 77, 518–527. [Google Scholar]
- Chakhmouradian, A.R.; McCammon, C.A. Schorlomite: A discussion of the crystal chemistry, formula, and inter-species boundaries. Phys. Chem. Miner. 2005, 32, 277–289. [Google Scholar] [CrossRef]
- Ferro, O.; Galli, E.; Papp, G.; Quartieri, S.; Szakall, S.; Vezzalini, G. A new occurrence of katoite and re-examination of the hydrogrossular group. Eur. J. Mineral. 2003, 15, 419–426. [Google Scholar] [CrossRef]
- Geiger, C.A.; Armbruster, T. Mn3Al2Si3O12 spessartine and Ca3Al2Si3O12 grossular garnet: Structural dynamic and thermodynamic properties. Am. Mineral. 1997, 82, 740–747. [Google Scholar] [CrossRef]
- Geiger, C.A.; Armbruster, T.; Lager, G.A.; Jiang, K.; Lottermoser, W.; Amthauer, G. A combined temperature dependent 57Fe mössbauer and single crystal X-ray diffraction study of synthetic almandine: Evidence for the Gol’danskii-Karyagin effect. Phys. Chem. Miner. 1992, 19, 121–126. [Google Scholar] [CrossRef]
- Gramaccioli, C.M.; Pilati, T.; Demartin, F. Atomic displacement parameters for spessartine Mn3Al2Si3O12 and their lattice-dynamical interpretation. Acta Crystallogr. 2002, B58, 965–969. [Google Scholar] [CrossRef] [PubMed]
- Lager, G.A.; Armbruster, T.; Faber, J. Neutron and X-ray-diffraction study of hydrogarnet Ca3Al2(O4H4)3. Am. Mineral. 1987, 72, 756–765. [Google Scholar]
- Lager, G.A.; Armbruster, T.; Rotella, F.J.; Rossman, G.R. OH substitution in garnets: X-ray and neutron diffraction, infrared, and geometric-modeling studies. Am. Mineral. 1989, 74, 840–851. [Google Scholar]
- Lager, G.A.; Rossman, G.R.; Rotella, F.J.; Schultz, A.J. Neutron-diffraction structure of a low-water grossular at 20 K. Am. Mineral. 1987, 72, 766–768. [Google Scholar]
- Munno, R.; Rossi, G.; Tadini, C. Crystal chemistry of kimzeyite from Stromboli, Aeolian Islands, Italy. Am. Mineral. 1980, 65, 188–191. [Google Scholar]
- Novak, G.A.; Meyer, H.O.A. Refinement of the crystal structure of a chrome pyrope garnet: An inclusion in natural diamond. Am. Mineral. 1970, 55, 2124–2127. [Google Scholar]
- Peterson, R.C.; Locock, A.J.; Luth, R.W. Positional disorder of oxygen in garnet: The crystal-structure refinement of schorlomite. Can. Mineral. 1995, 33, 627–631. [Google Scholar]
- Sacerdoti, M.; Passaglia, E. The crystal structure of katoite and implications within the hydrogrossular group of minerals. Bull. Minéral. 1985, 108, 1–8. [Google Scholar] [CrossRef]
- Schingaro, E.; Scordari, F.; Capitanio, F.; Parodi, G.; Smith, D.C.; Mottana, A. Crystal chemistry of kimzeyite from Anguillara, Mts. Sabatini, Italy. Eur. J. Mineral. 2001, 13, 749–759. [Google Scholar] [CrossRef]
- Schingaro, E.; Scordari, F.; Pedrazzi, G.; Malitesta, C. Ti and Fe speciation by X-ray photoelectron spectroscopy (XPS) and mössbauer spectroscopy for a full crystal chemical characterisation of Ti-garnets from Colli Albani (Italy). Annali Di Chimica 2004, 94, 185–196. [Google Scholar] [CrossRef]
- Scordari, F.; Schingaro, E.; Pedrazzi, G. Crystal chemistry of melanites from Mt. Vulture (Southern Italy). Eur. J. Mineral. 1999, 11, 855–869. [Google Scholar] [CrossRef]
- Smyth, J.R.; Madel, R.E.; McCormick, T.C.; Munoz, J.L.; Rossman, G.R. Crystal-structure refinement of a F-bearing spessartine garnet. Am. Mineral. 1990, 75, 314–318. [Google Scholar]
- Weber, H.P.; Virgo, D.; Huggins, F.E. A neutron-diffraction and 57Fe Mössbauer study of a synthetic Ti-rich garnet. Carnegie Inst. Wash. Year Book 1975, 74, 575–579. [Google Scholar]
- Baikie, T.; Schreyer, M.K.; Wong, C.L.; Pramana, S.S.; Klooster, W.T.; Ferraris, C.; McIntyre, G.J.; White, T.J. A multi-domain gem-grade Brazilian apatite. Am. Mineral. 2012, 97, 1574–1581. [Google Scholar] [CrossRef]
- Antao, S.M.; Hassan, I. A two-phase intergrowth of genthelvite from Mont Saint-Hilaire, Quebec. Can. Mineral. 2010, 48, 1217–1223. [Google Scholar] [CrossRef]
- Antao, S.M.; Nicholls, J.W. Crystal chemistry of three volcanic K-rich nepheline samples from Oldoinyo Lengai, Tanzania and Mount Nyiragongo, Eastern Congo, Africa. Front. Earth Sci. 2018, 6, 155. [Google Scholar] [CrossRef]
- Akizuki, M. Growth structure and crystal symmetry of grossular garnets from the Jeffrey mine, Asbestos, Quebec, Canada. Am. Mineral. 1989, 74, 859–864. [Google Scholar]
- Antao, S.M.; Dhaliwal, I. Growth Oscillatory Zoning in Erythrite, Ideally Co3(AsO4)2·8H2O: Structural Variations in Vivianite-Group Minerals. Minerals 2017, 7, 136. [Google Scholar] [CrossRef]
© 2019 by the authors. Licensee MDPI, Basel, Switzerland. This article is an open access article distributed under the terms and conditions of the Creative Commons Attribution (CC BY) license (http://creativecommons.org/licenses/by/4.0/).