Article

Basalt Tectonic Discrimination Using Combined Machine Learning Approach

1
State Key Laboratory of Hydraulic Engineering Simulation and Safety, Tianjin University, Tianjin 300354, China
2
Institute of Geology and Geophysics, Chinese Academy of Sciences, Beijing 100029, China
3
College of Engineering, Louisiana State University, Baton Rouge, LA 70803, USA
*
Author to whom correspondence should be addressed.
Minerals 2019, 9(6), 376; https://doi.org/10.3390/min9060376
Submission received: 20 March 2019 / Revised: 6 June 2019 / Accepted: 18 June 2019 / Published: 22 June 2019
(This article belongs to the Section Mineral Geochemistry and Geochronology)

Abstract

:
Geochemical discrimination of basaltic magmatism from different tectonic settings remains an essential part of recognizing the magma generation process within the Earth’s mantle. Discriminating among mid-ocean ridge basalt (MORB), ocean island basalt (OIB) and island arc basalt (IAB) is that matters to geologists because they are the three most concerned basalts. Being a supplement to conventional discrimination diagrams, we attempt to utilize the machine learning algorithm (MLA) for basalt tectonic discrimination. A combined MLA termed swarm optimized neural fuzzy inference system (SONFIS) was presented based on neural fuzzy inference system and particle swarm optimization. Two geochemical datasets of basalts from GEOROC and PetDB served as to test the classification performance of SONFIS. Several typical discrimination diagrams and well-established MLAs were also used for performance comparisons with SONFIS. Results indicated that the classification accuracy of SONFIS for MORB, OIB and IAB in both datasets could reach over 90%, superior to other methods. It also turns out that MLAs had certain advantages in making full use of geochemical characteristics and dealing with datasets containing missing data. Therefore, MLAs provide new research tools other than discrimination diagrams for geologists, and the MLA-based technique is worth extending to tectonic discrimination of other volcanic rocks.

1. Introduction

Magmatic rocks (e.g., basalt and granite) form in a wide variety of tectonic settings, which primarily include mid-ocean ridges, ocean islands and island arcs. Many scholars have expressed concern regarding the restoration of the original tectonic setting of ancient magmatic rocks [1,2]. The establishment of the plate tectonics hypothesis has brought the study of a tectonic setting discrimination of magmatic rocks to the forefront of geological research [3]. Previous studies have shown that it is difficult to achieve this goal through only the macro geological setting, and understanding the chemical composition of these rocks is crucial for accurate tectonic setting discrimination [1,4,5,6]. Magmatic rocks formed in different tectonic settings have unique geochemical characteristics, which are mainly reflected in the differences in composition [7,8,9,10]. The contents of major elements, trace elements and isotopic composition can be obtained by whole-rock geochemical analysis. Thus, it is feasible to discriminate the tectonic settings where magma formed and the chemical properties of magmatic source areas through elemental composition [11]. Basalt, as a typical magmatic rock, is widely distributed in the earth’s crust, and its chemical element content can provide sufficient information about mantle sources, mantle partial melting, magma crystallization processes and mantle metasomatism [12,13]. What is more, basalts are mafic rocks, which are closer to the composition of the parental magma that was extracted from its mantle source [14,15]. For these reasons, basalt is usually the research object of tectonic setting discrimination [16,17,18].
Mid-ocean ridge basalt (MORB), ocean island basalt (OIB) and island arc basalt (IAB) are the three main types of basalts most concerned by academia. MORBs erupt at mid-ocean ridge without subduction. MORBs are derived from the depleted upper mantle, and have a high degree of partial melting. MORBs generally have the characteristics of low K2O, TiO2 and depleted incompatible elements. OIBs are distributed as islands far away from the subduction zone, and within plate hotspot activity. OIBs come from the LILE-enriched regions of the lower mantle, whose origin is related to the mantle plume. IABs are typical products of subduction zone magmatism, which are derived from the depleted upper mantle and components from the subducted slab [19,20,21,22,23]. Thus, how to discriminate the tectonic settings of basalts has become an essential issue in geochemistry [24,25,26].
The basalt discrimination diagram method is an important scientific discovery after the rise of plate tectonics. In the 1970s, a group of scholars, represented by Pearce, devoted themselves to the geochemical tectonic discrimination of basalts, and established the discrimination diagram method, which opened up a new approach to the basalt geodynamics research [10,27,28,29]. According to different source compositions of MORB, OIB and IAB, they explored the influence of the depth of magma formed, the degree of partial melting, magma evolution on the basalt geochemical properties [30,31,32]. Starting from the statistical theory and combining with typical regional case studies, they put forward many basalt tectonic discrimination diagrams, and achieved great results [33,34,35,36,37,38,39]. Subsequently, the discrimination diagram method was rapidly extended, which promoted the development of basalt research and plate tectonics. However, with the accumulation of geochemical data, it is found that the common discrimination diagrams are not always applicable to new datasets [1,8,12,13,40,41,42]. Some scholars are still trying to explore other methods to establish new discrimination diagrams. Linear discriminant analysis [4], primordial mantle-normalized diagrams [43] and other geochemical discrimination tools [44] have been proposed sequentially as alternatives. Despite some progress, there has been no widespread academic response. Since then, the discrimination diagram method has fallen into a bottleneck. Therefore, we attempt to utilize the artificial intelligence method to discriminate among MORB, OIB and IAB.
The main aim of this paper is to propose a new hybrid artificial intelligence method for tectonic setting discrimination of basalts, which we have termed swarm optimized neural fuzzy inference system (SONFIS). A set of scientific and reasonable model evaluation criteria were established, which included the quantitative classification accuracy and confusion matrix visualization. Two geochemical datasets of basalts were compiled to validate SONFIS. The classification performance of SONFIS was evaluated using the same datasets through comparisons with other well-established machine learning (ML) models, such as support vector machine (SVM), random forest (RF) and naive Bayes (NB). Moreover, the logistic regression classifier (LRC) and multilayer perceptron (MLP), which have not been applied in tectonic discrimination, have also been included for comparison.
This paper is organized as follows. A literature review is introduced in Section 2. Section 3 depicts the limitations of conventional discrimination diagrams and how to overcome these problems. In Section 4, the mathematical principles of the main methods used, including the neural fuzzy inference system (NFIS) and particle swarm optimization (PSO), are briefly described. Section 5 presents the proposed hybrid SONFIS method and its implementation procedure. Section 6 illustrates and discusses the results of comparative experiments and the applicability of ML modeling in tectonic discrimination. Conclusions and future work are finally provided in Section 7.

2. Literature Review

Data sharing has dramatically expanded with the establishment of some open-access and comprehensive global geochemical databases, such as GEOROC [45] and PetDB [46], which provide reliable data support for big data analysis [47,48]. Big data makes it possible to reevaluate the conventional discrimination diagrams that are based on small samples and traditional statistics [49,50,51]. Li et al. [43], Wang et al. [13] and Di et al. [7,18] adopted discrimination diagrams to conduct big data mining research on global data samples respectively, which again showed the inapplicability of the statistical method. In an attempt to make a simplification, tectonic setting discrimination was transformed into a multi-classification task, and ML techniques were introduced into geochemical tectonic discrimination due to their dominant classification performance and innate adaptability to big data [1,4,8,40,52]. At present, this technique is still scarcely applied for tectonic discrimination, despite its extensive application in other fields [3,53,54,55]. Only several commonly used ML algorithms (MLAs) have been utilized in a few cases beyond basalts, such as classification trees (CT), SVM, decision tree (DT), RF, sparse multinomial regression (SMR), NB and k-nearest neighbors (KNN), as summarized in Table 1. These cases indicate that the ML technique, which can utilize more elements and have excellent generalization capability, has a good potential for tectonic discrimination, and it is expected to become another common method in addition to conventional discrimination diagrams.

2.1. Neural Fuzzy Inference System (NFIS)

To provide options for geochemists, MLAs applied in tectonic discrimination still need to be explored [10,56]. This study introduces a robust and quantitative MLA called NFIS. Developed since 1993, NFIS integrates the concise form of fuzzy logic with the learning algorithm of neural networks. It is a hierarchical topology based on neural networks to provide the fuzzy function of the fuzzy system [57]. The unified model not only has the self-learning ability of neural networks, but also makes up for the uninterpretability of neural networks using fuzzy logic [58,59]. Additionally, the unified model utilizes a hybrid algorithm of back-propagation and least squares estimation to adjust the antecedent and consequent parameters, and can automatically generate if-then rules [60]. Structurally, NFIS is an adaptive multi-layer feedforward neural network, composed by individual layers for fuzzification, product, normalization, defuzzification and output [61]. The algorithm has been widely used in different fields (e.g., financial industry [58], hydraulic engineering [59,60], and mining industry [61]) due to its excellent performance. Even so, literature surveys show that there is no research regarding the application of NFIS to geochemical tectonic discrimination, thus leading us to provide such applications in our current study.

2.2. Particle Swarm Optimization (PSO)

On the other hand, model parameter selection has a significant influence on classification performance in ML modeling [60]. However, in previous studies, model parameters were not specially optimized when different MLAs were used for tectonic setting discrimination, but instead manual adjustment and grid searches have been common methods of parameter tuning, which makes it difficult to explore the full potential of model performance. Swarm intelligence optimization has always been an area of high priority research as a burgeoning evolutionary computation technique. The advantages of metaheuristic optimization techniques provide solutions to the parameter optimization problem using soft computing [62]. A number of well-known metaheuristic algorithms, such as genetic algorithm [63], ant colony optimization [64], differential evolution [65] and PSO [66], have been put forward as possible optimization techniques to address the parameter optimization weaknesses. Among them, PSO is considered as a promising and powerful optimization technique, thus it was selected to search for optimal parameters with NFIS [67]. PSO, which was originally attributed to Kennedy and Eberhart [66], is an advanced evolutionary algorithm for solving the continuous global optimization problem using a non-linear technique. The idea was initially inspired by the bird flock patterns, and then a simplified model was established using swarm intelligence [68,69]. The PSO-based algorithm is well suited to deal with non-linear and non-convex design spaces with discontinuities on account of easy implementation, high precision, good robustness and fast convergence [70]. The algorithm has attracted extensive attention in academic circles due to its strong ability to solve practical problems [58,59,60,61]. Therefore, PSO can automatically optimize the antecedent and consequent parameters, which subsequently improves the adaptability of NFIS.

3. Problem Description and Research Contribution

Some problems with existing discrimination diagrams are described. With the outstanding classification nature of MLAs, SONFIS and other MLAs can overcome the above problems to some extent, that is the main contribution of this paper.

3.1. Limitations of Conventional Discrimination Diagrams

Though basalt discrimination diagrams are widely used, they have some inherent limitations.
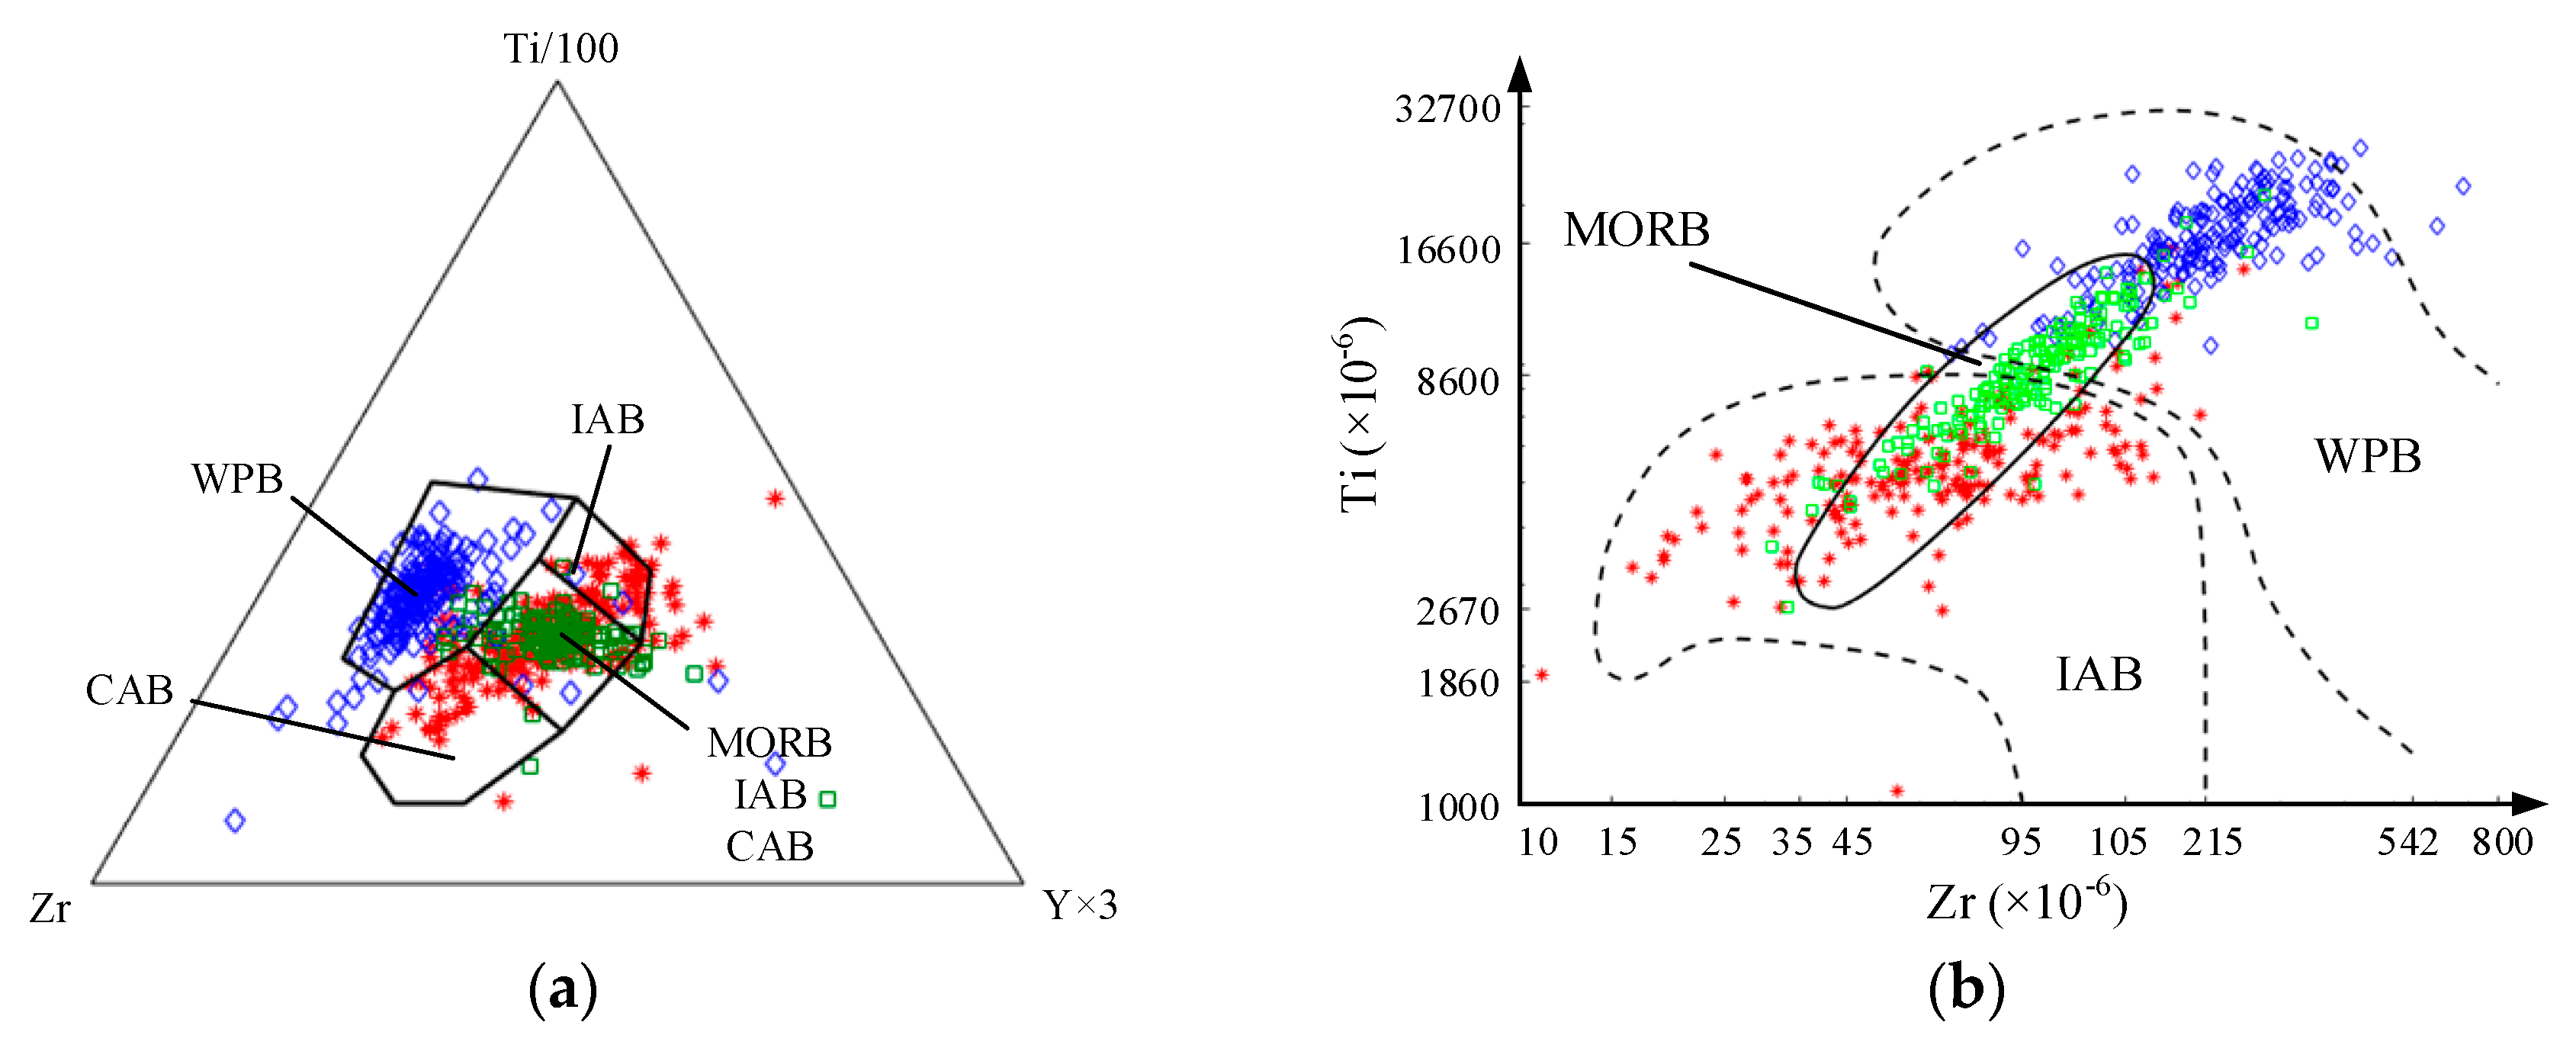
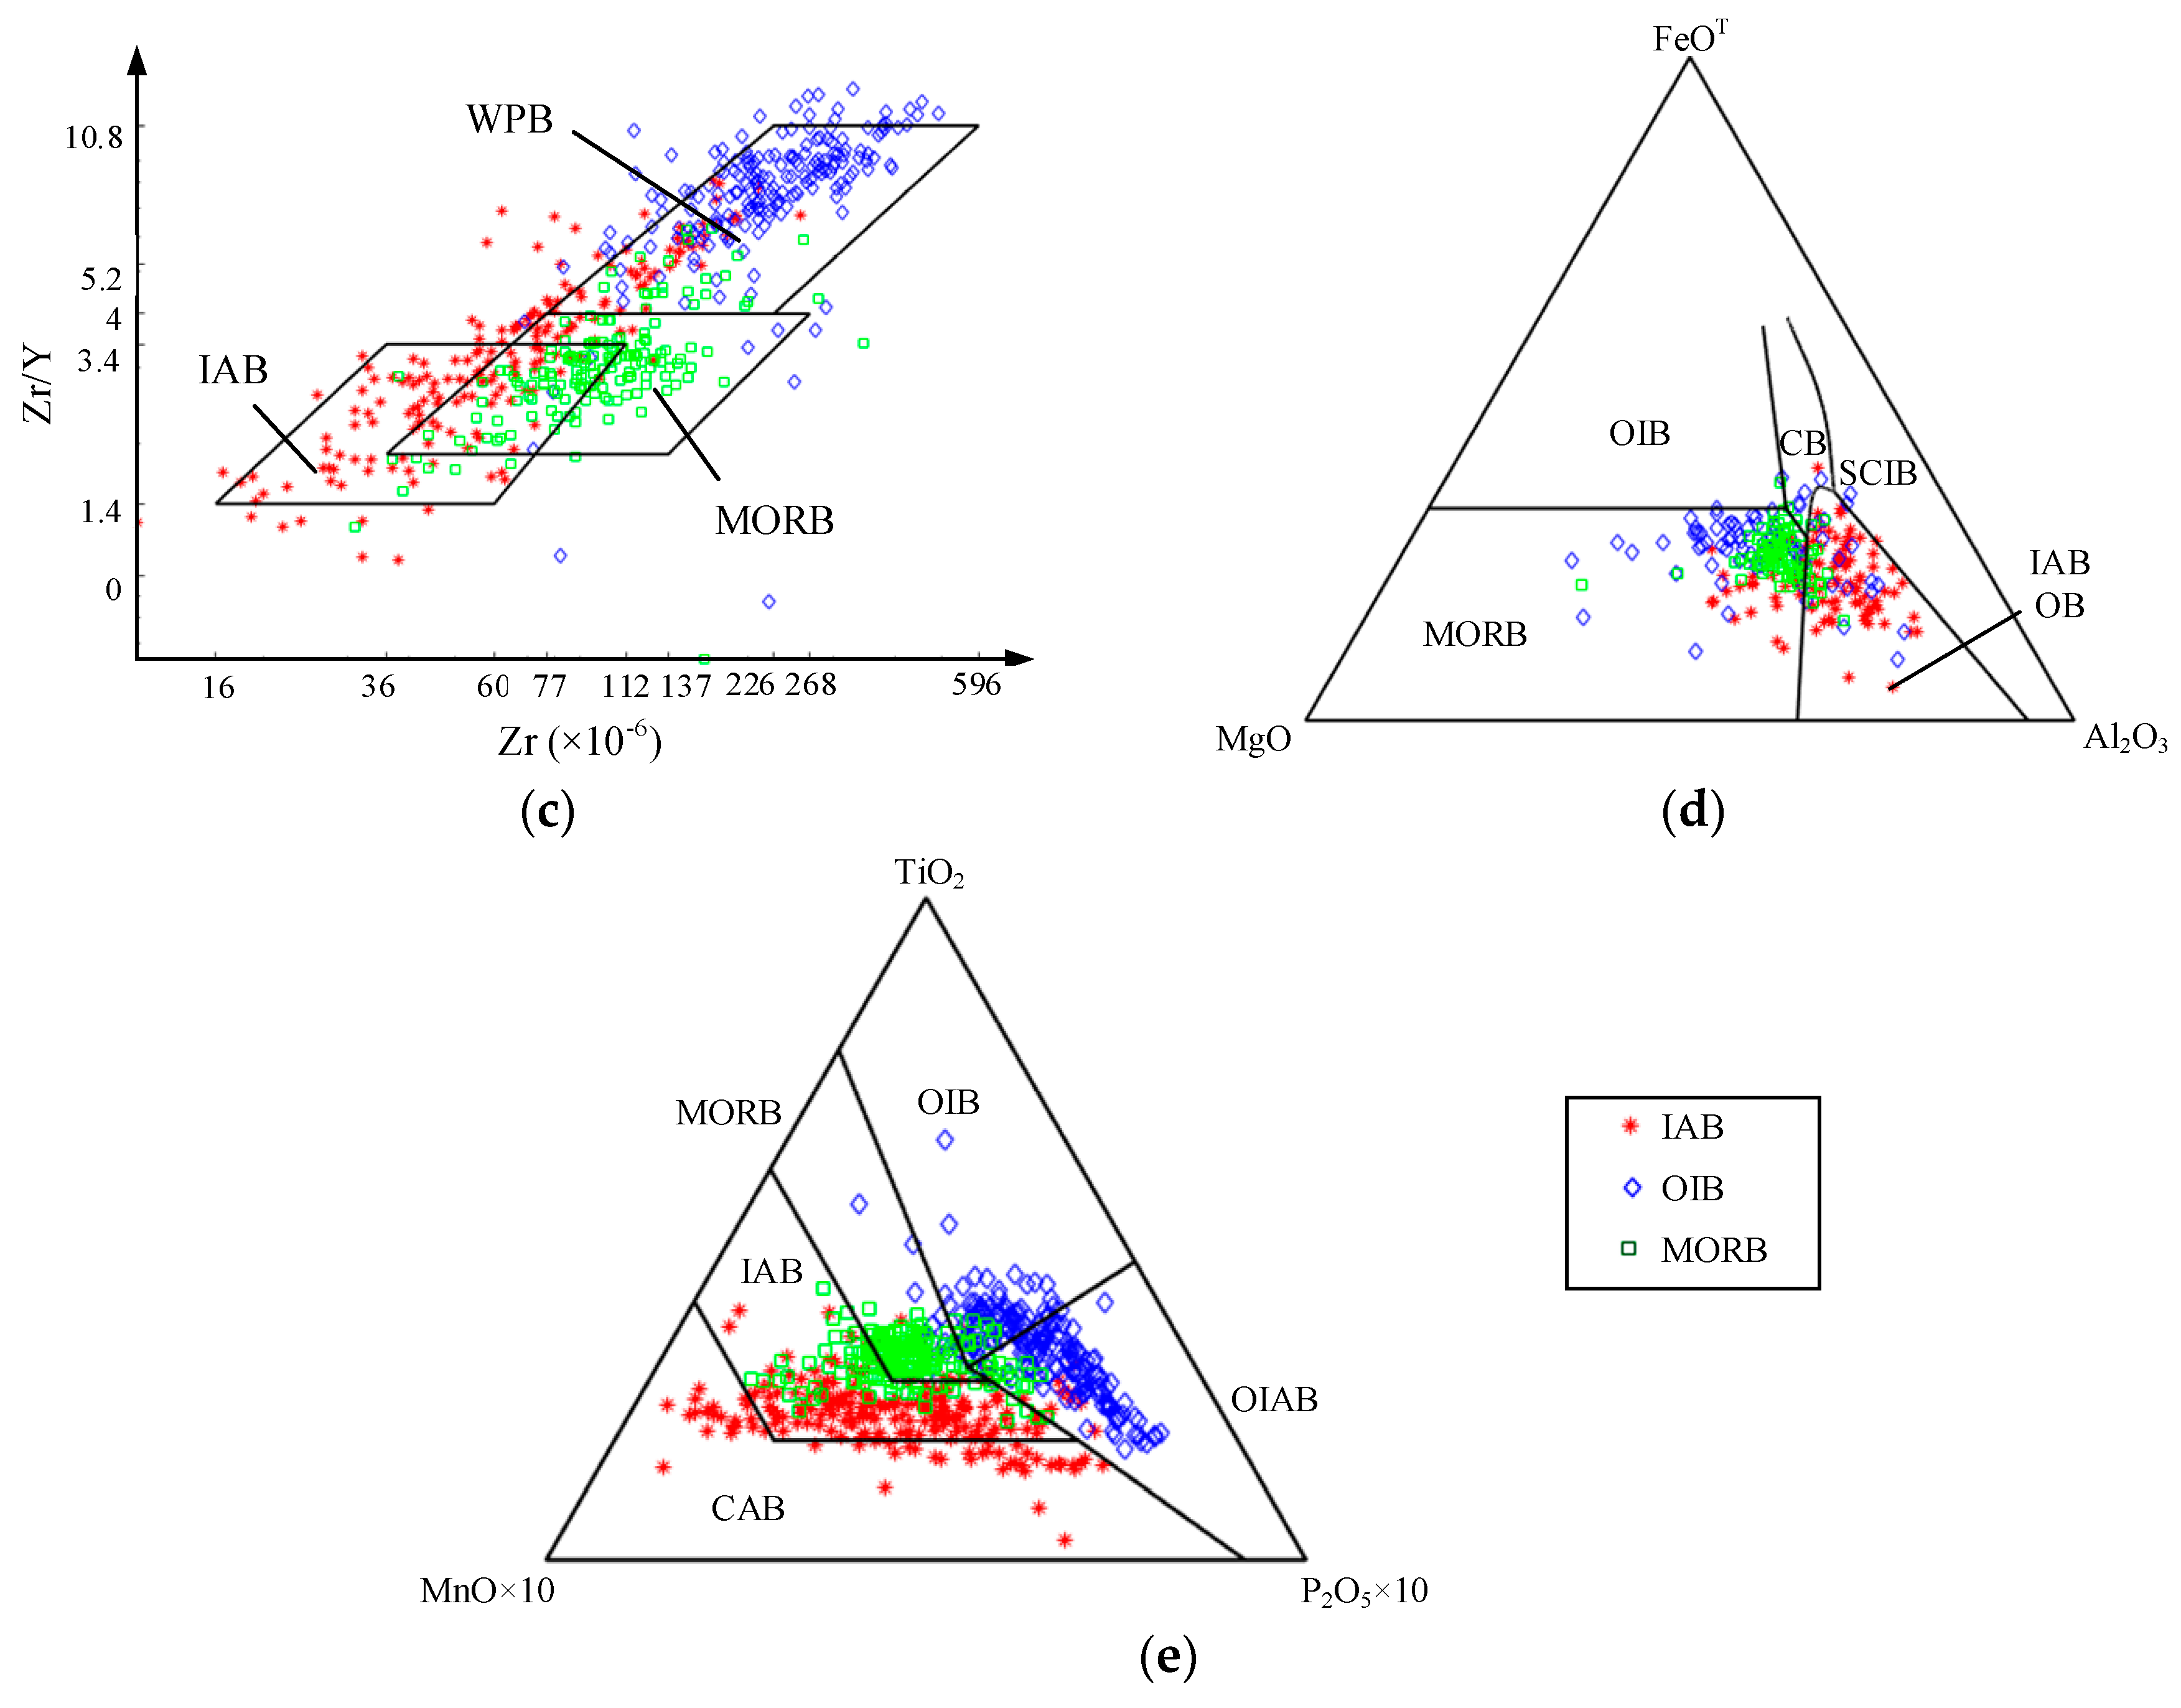
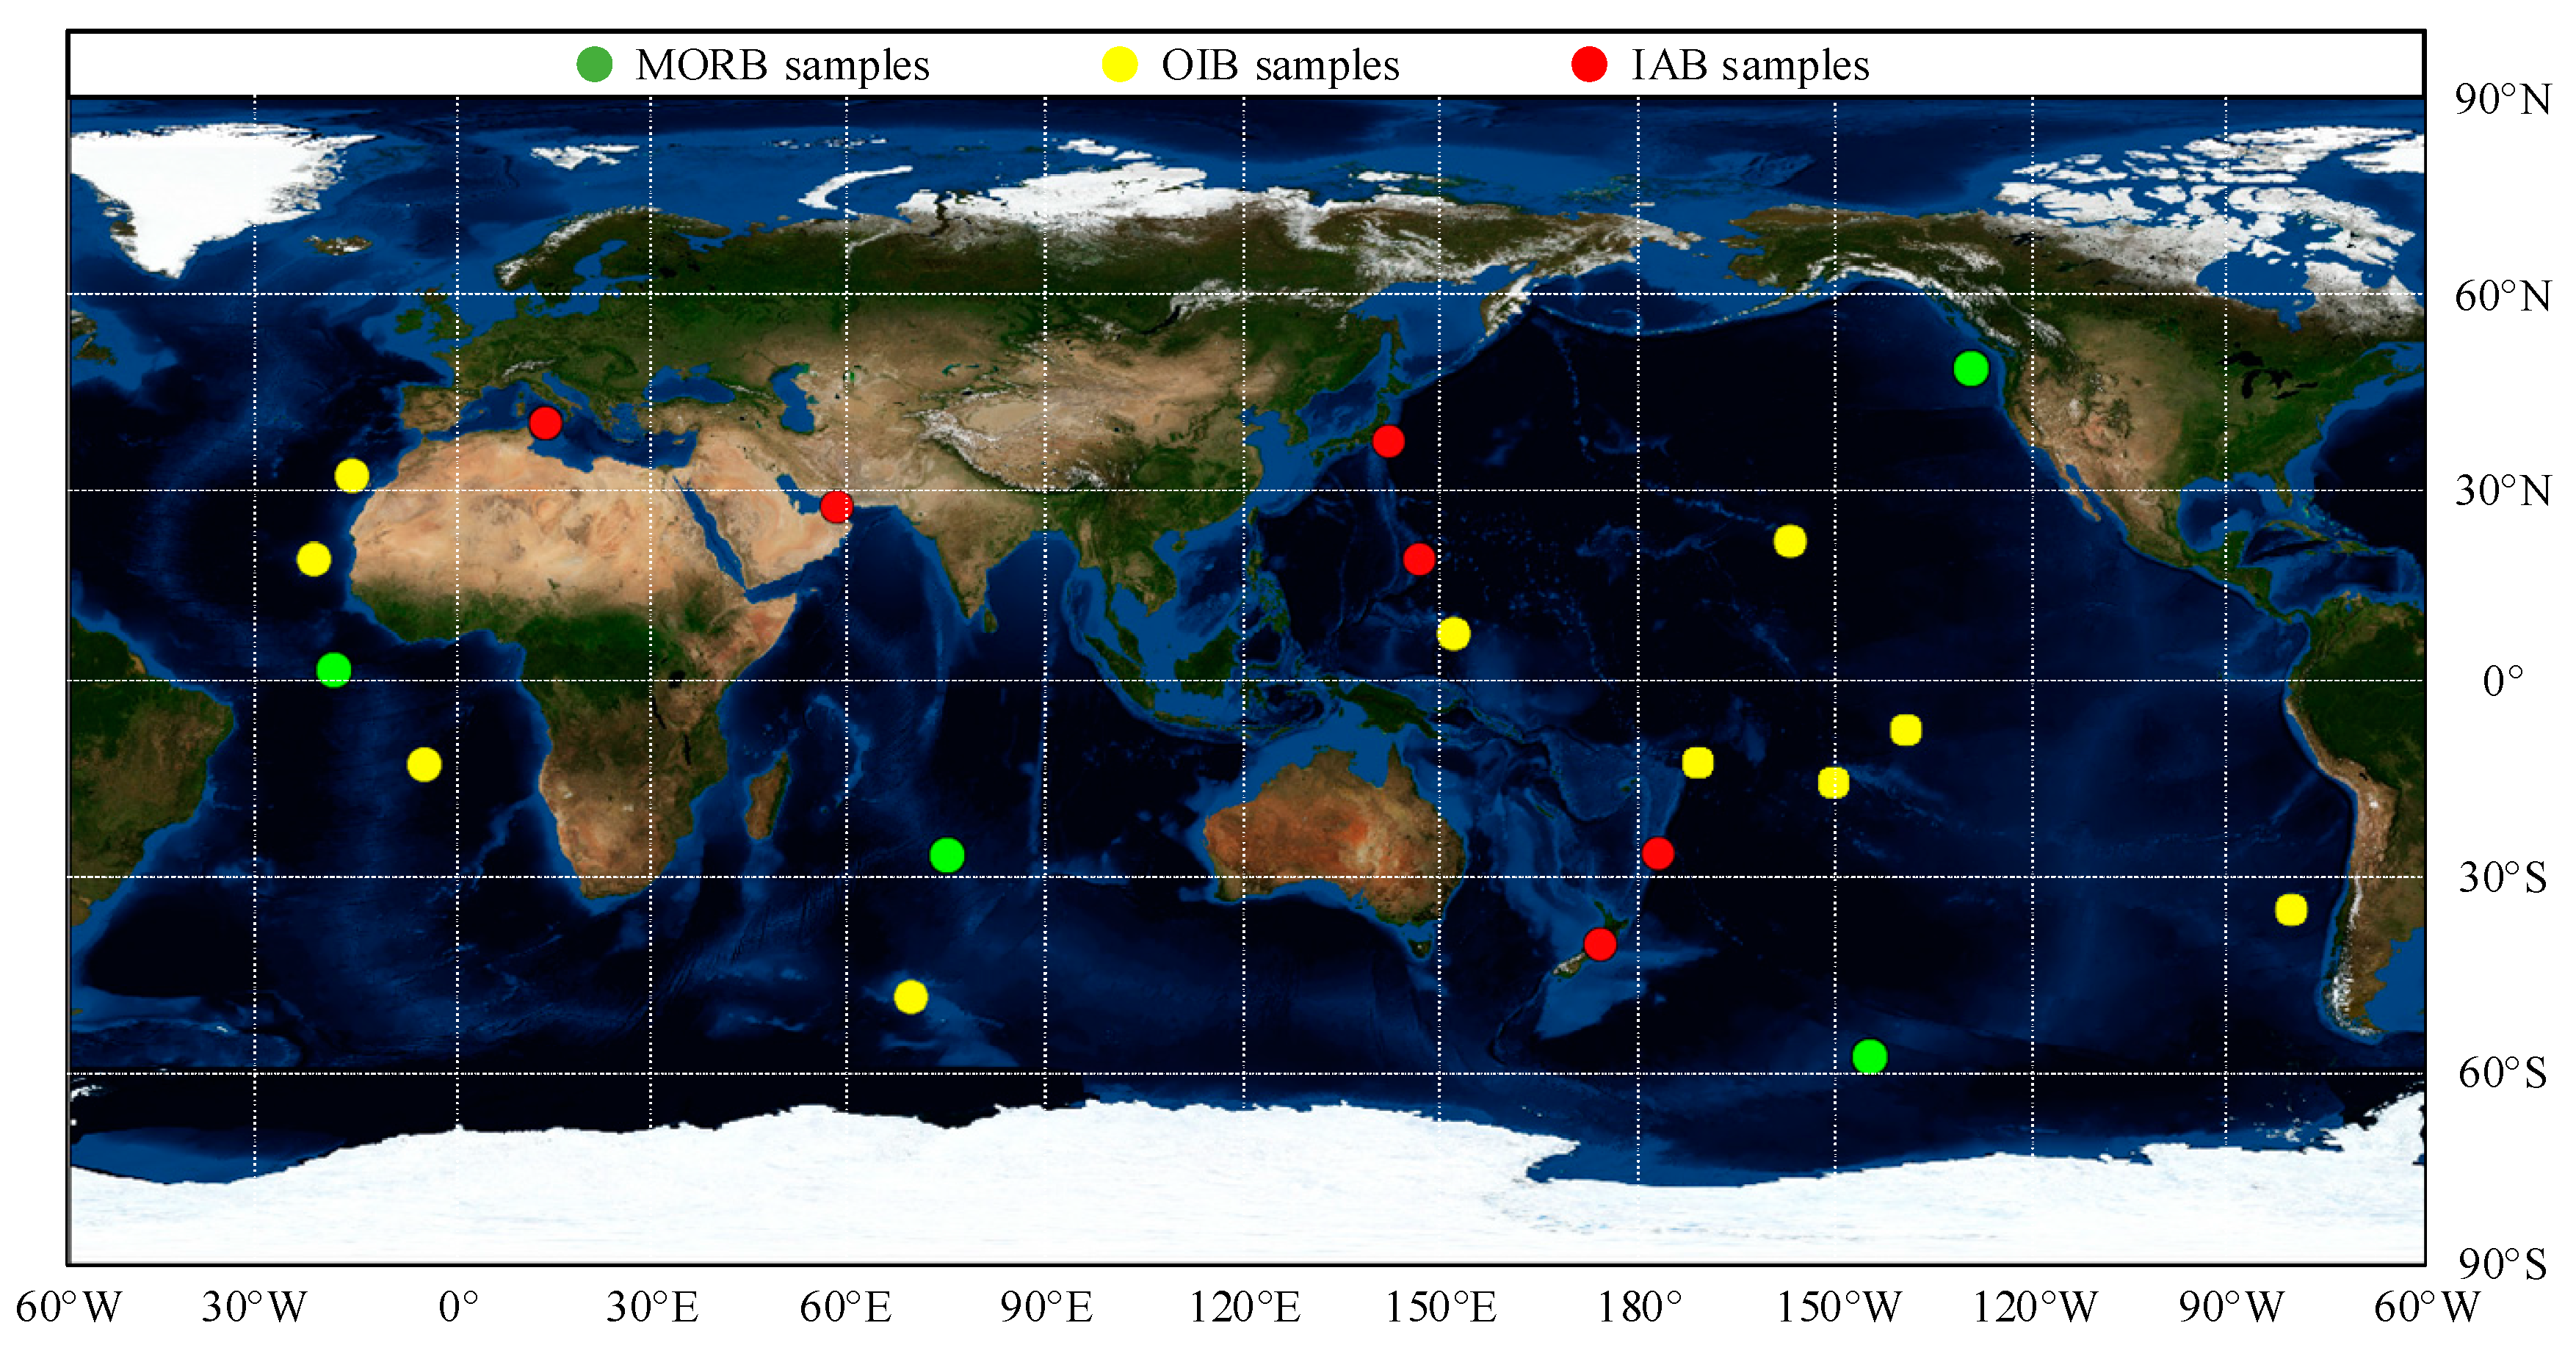
  • Restricted by the earlier data processing technique, the sampling method was adopted and the typical region was taken as a research example, thus the discrimination diagrams were obtained. Although the discrimination diagrams obtained have achieved great results, with the accumulation of massive geochemical data, the earlier discrimination diagrams may not be applicable. Plotting compiled global data on some classical discrimination diagrams illustrates the problem, with a significant amount of these data being misclassified (see Figure 1) [53]. There is also significant overlap among MORB, OIB and IAB samples.
  • Binary or ternary discrimination diagrams are the most commonly used for basalt tectonic discrimination. In other words, only a few elements or element ratios are utilized, which could affect the discrimination effect. In addition, when information about related elements in a discrimination diagram is missing, the diagram is not available.
As such, the expanded known compositional ranges of basalts that form in different tectonic settings mean that the earlier developed discrimination diagrams have significant limitations that cast doubt on the validity of results obtained using these diagrams [42].

3.2. Feasibility of MLAs for Tectonic Discrimination

MLAs can overcome the two limitations of conventional discrimination diagrams. Taking SONFIS as an example, the advantages of MLAs over discrimination diagrams are described.
  • MLAs originated from the era of big data, with strong adaptability to all kinds of data. As a classifier, SONFIS can be trained based on the geochemical data of a large number of basalt samples with known tectonic settings. For the samples with unknown tectonic settings, the geochemical data measured can be directly input into the trained SONFIS, then the corresponding tectonic setting can be easily acquired. When different data serve as to train the SONFIS, the model parameters update adaptively to get a new different classifier. In summary, the performance of the classifier is related to the quantity and quality of geochemical data trained.
  • MLAs have no limit on the amount of input geochemical data. Theoretically, the more the effective information, the better the performance of the classifier. For samples with unknown tectonic settings, the classification effect of SONFIS is also still satisfactory even if some input data are missing. Therefore, the MLA-based classifiers have excellent compatibility and robustness.
The advantages of MLAs can make up for the limitations of conventional discrimination diagrams, that is, the MLA-based discrimination method can supplement the discrimination diagrams. This technique will be fully demonstrated through two datasets (in Section 5.2) and comparative experiments (in Section 6).

4. Mathematical Principles of Main Algorithms

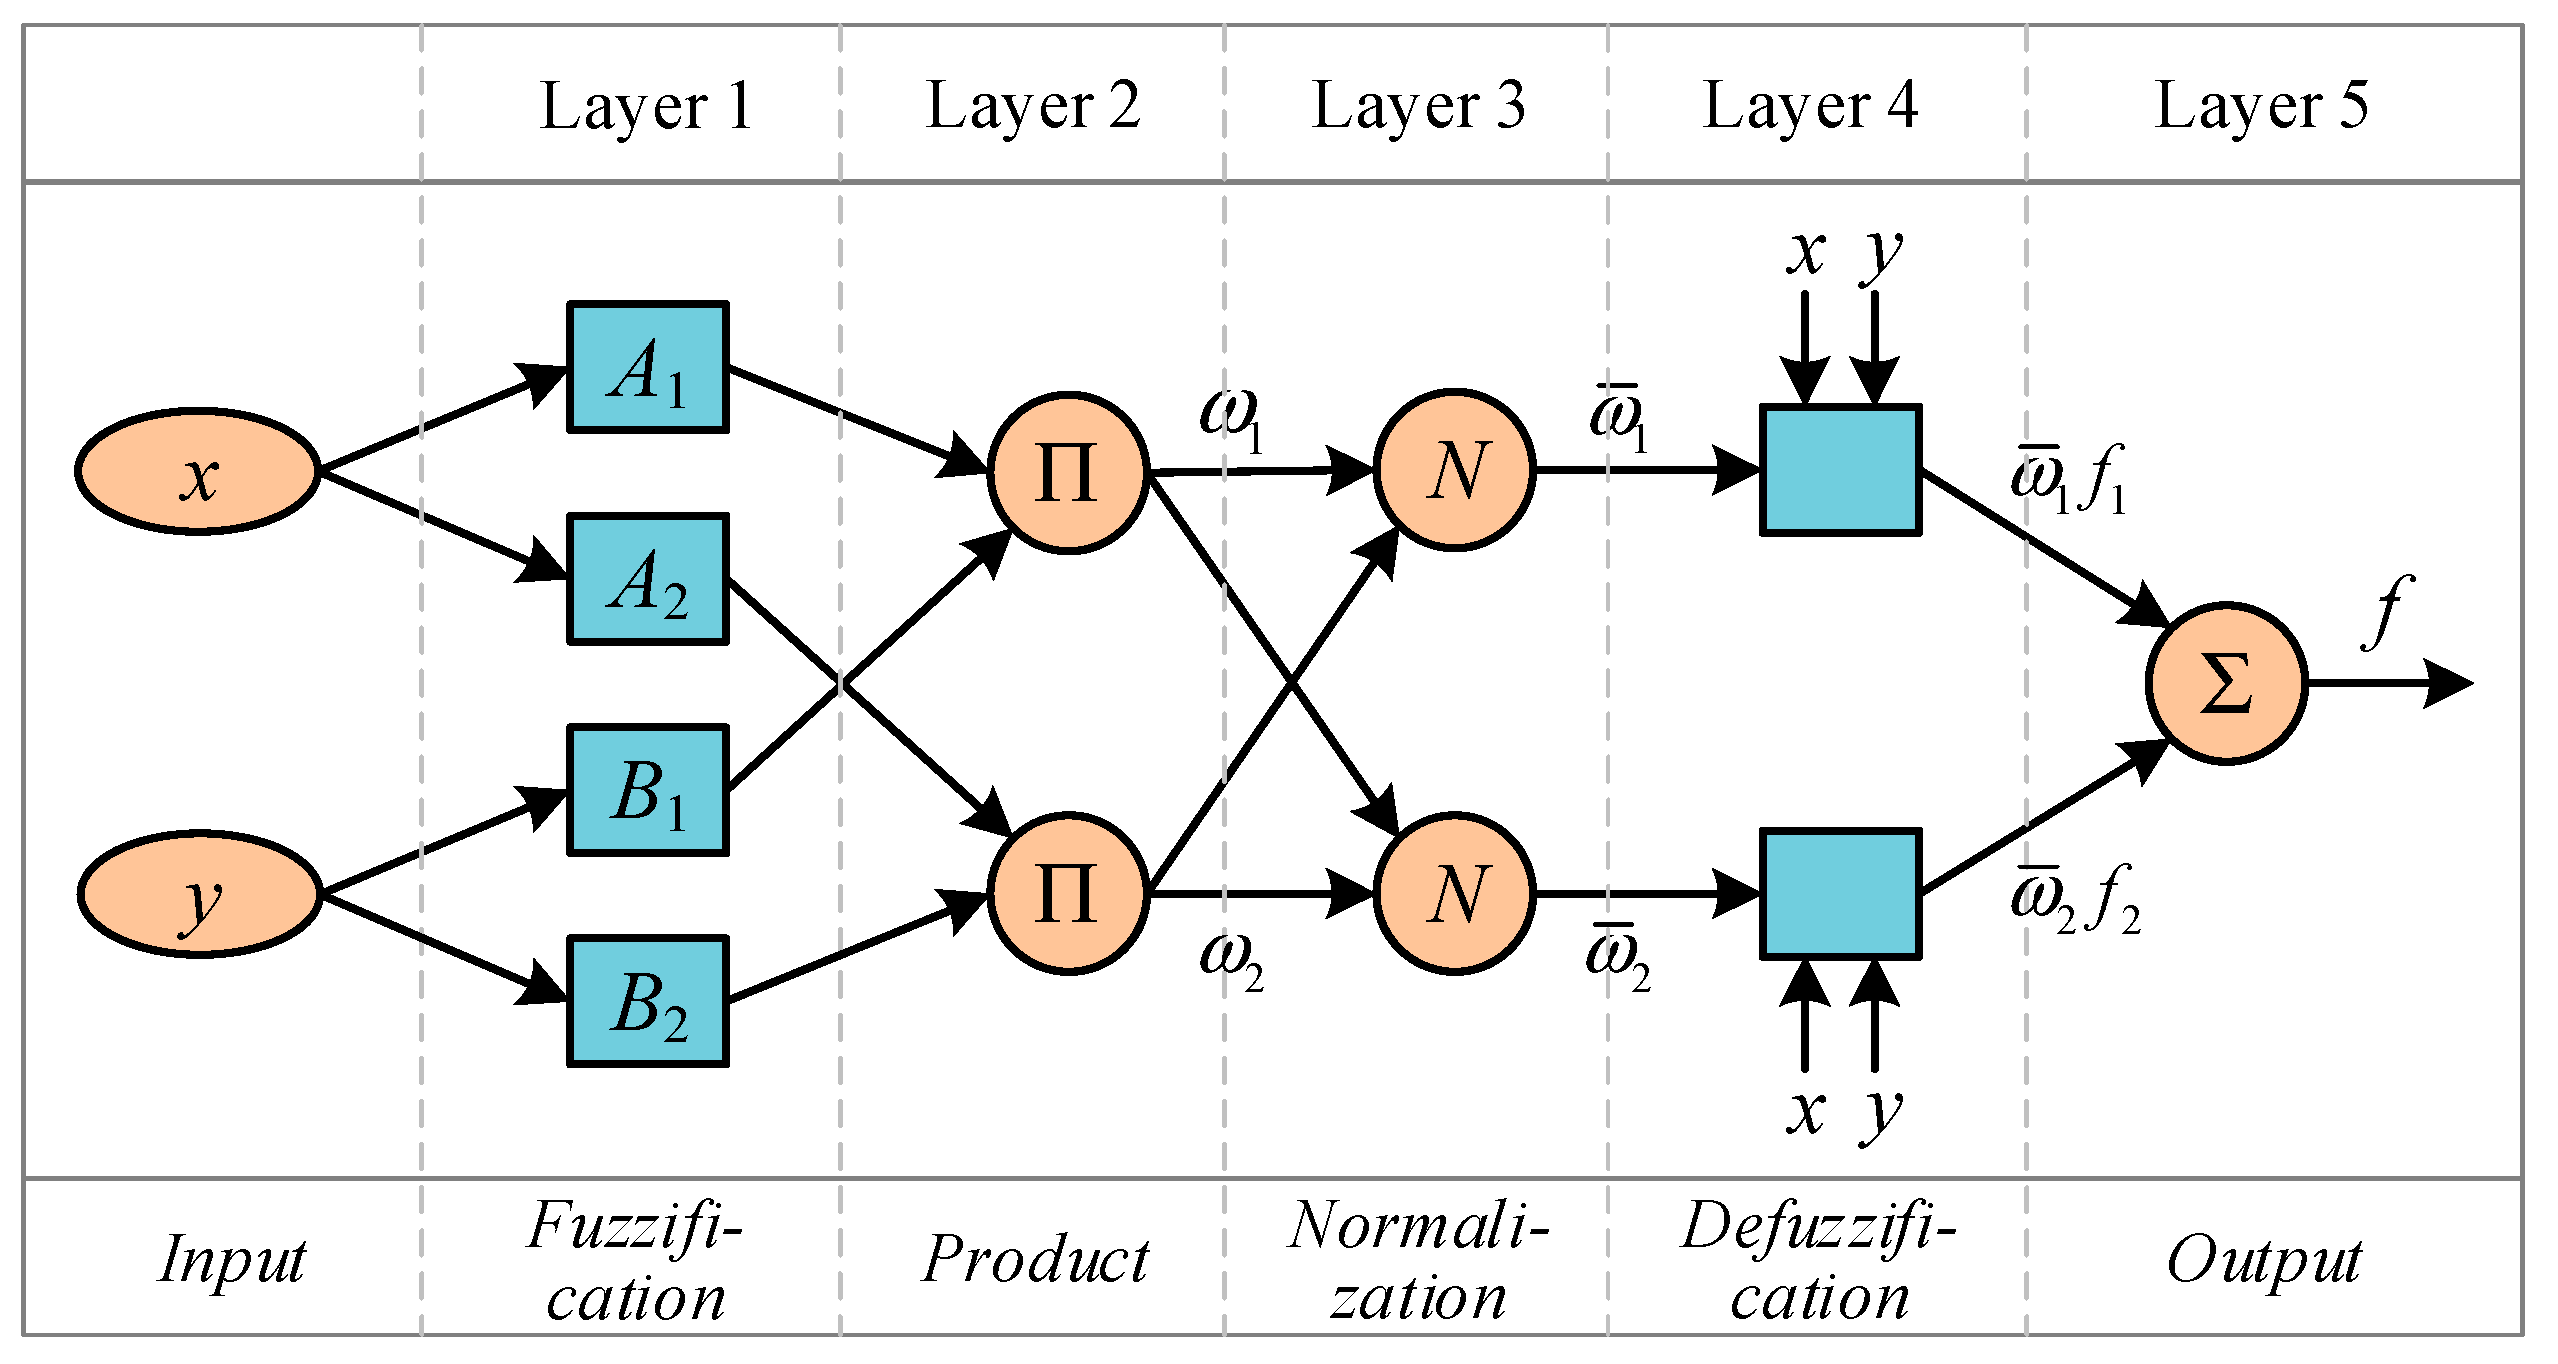
4.1. Neural Fuzzy Inference System (NFIS)

In order to provide a simplified visual process, the NFIS architecture with two inputs and one output is illustrated in Figure 2, where circles and squares represent fixed and adaptive nodes, respectively [71]. The mathematical principle of NFIS is explained within the diagram of this general structure.
For a first-order Takagi-Sugeno fuzzy model, a common rule is set with two fuzzy if-then rules, which is presented as follows:
Rule   ( i )     If   x   is   A i   and   y   is   B i ,   then   f i =   p 0 i   +   p 1 i x +   p 2 i y ,   i   =   1 , 2 ,
where A and B are specified as the membership functions for inputs x, y, and p 0 , p 1 , p 2 are function parameters of output f. It should also be noted that the node in the i-th position of the k-th layer is denoted as O i k , and the node functions in the same layer are of the same function family as described below.

4.1.1. Layer 1: Fuzzification Layer

The fuzzy membership values for input factors are generated using a membership function in this layer, as seen in Equation (1). The Gaussian membership function, namely Equation (2), is considered as the input membership function.
O i 1 = μ A i ( x ) ,   O i 1 = μ B i ( y ) ,   i = 1 , 2 ,  
μ A i ( x ) = e ( x c i ) 2 2 σ i 2 ,   μ B i ( y ) = e ( y c i ) 2 2 σ i 2 ,   i = 1 , 2 ,
where A and B are the linguistic variables, μ A i ( x ) and μ B i ( y ) are the Gaussian membership functions, and σ and c are the antecedent parameters that respectively control the shapes of μ A i ( x ) and μ B i ( y ) .

4.1.2. Layer 2: Product Layer

Every node in Layer 2 computes the firing strength ω i of the rule-based on Equation (3), which is the product of all incoming signals.
O i 2 = ω i = μ A i ( x ) μ B i ( y ) ,   i = 1 , 2 .

4.1.3. Layer 3: Normalization Layer

Normalization in this layer is done in accordance with Equation (4). The output, called normalized firing strength ω ¯ i , is calculated based on the ratio of the i-th rule’s firing strength to the sum of all rules’ firing strengths.
O i 3 = ω ¯ i = ω i ω 1 + ω 2 ,   i = 1 , 2 .

4.1.4. Layer 4: Defuzzification Layer

The layer is used for defuzzification where the value of the rule consequence for each node is calculated as follows.
O i 4 = ω ¯ i f i = ω ¯ i ( p 0 i + p 1 i x + p 2 i y ) ,   i = 1 , 2 ,
where p 0 i , p 1 i and p 2 i are the consequent parameters of the output function f i .

4.1.5. Layer 5: Output Layer

In this layer, the overall output is generated through the summation of all incoming signals.
O i 5 = i ω ¯ i f i = i ω i f i i ω i ,   i = 1 , 2 .

4.2. Particle Swarm Optimization (PSO)

PSO is initialized with a set of random particles (solutions) that have random positions and velocities. Seeking an optimal solution through an iterative process is the next step of the algorithm, in which particle positions are adjusted based on experimentation with the particle of interest and that of other particles. To find a potential solution, the best position of each particle tracked is called the personal best p b e s t . The global best g b e s t is also the global best value achieved by other particles in the swarm.
Each particle can be trained to accelerate from its own p b e s t and g b e s t positions during the learning process. This can be achieved by calculating the new velocity term for every particle based on its distance from the p b e s t and g b e s t positions. The p b e s t and g b e s t velocities are then randomly weighted to produce a new velocity value for the particle, which then affects the next position of the particle in the next iteration.
Compared with other optimization algorithms, the main advantage of PSO is its simplicity. The velocity update equation (see Equation (7)) and movement equation (see Equation (8)) are the only equations required in PSO. Equation (7) is used to adjust the velocity vectors given to p b e s t and g b e s t , while Equation (8) determines the actual motion of particles through their specific velocity vectors. Furthermore, Shi and Eberhart [72] introduced the inertia weight w into PSO in order to improve the convergence speed. The inertia weight determines the contribution rate of the particle’s previous velocity to its velocity at the current step.
v n e w = w v + r 1 C 1 ( p b e s t p ) + r 2 C 2 ( g b e s t p ) ,
p n e w = p + v n e w ,
where v n e w , v , p n e w and p are the new velocity, current velocity, new position and current position, respectively. C 1 and C 2 are the acceleration constants, p b e s t is the personal best position and g b e s t is the global best position among all particles. r 1 and r 2 are random values in the range (0,1) sampled from a uniform distribution, and w is the inertia weight.

5. Methodology

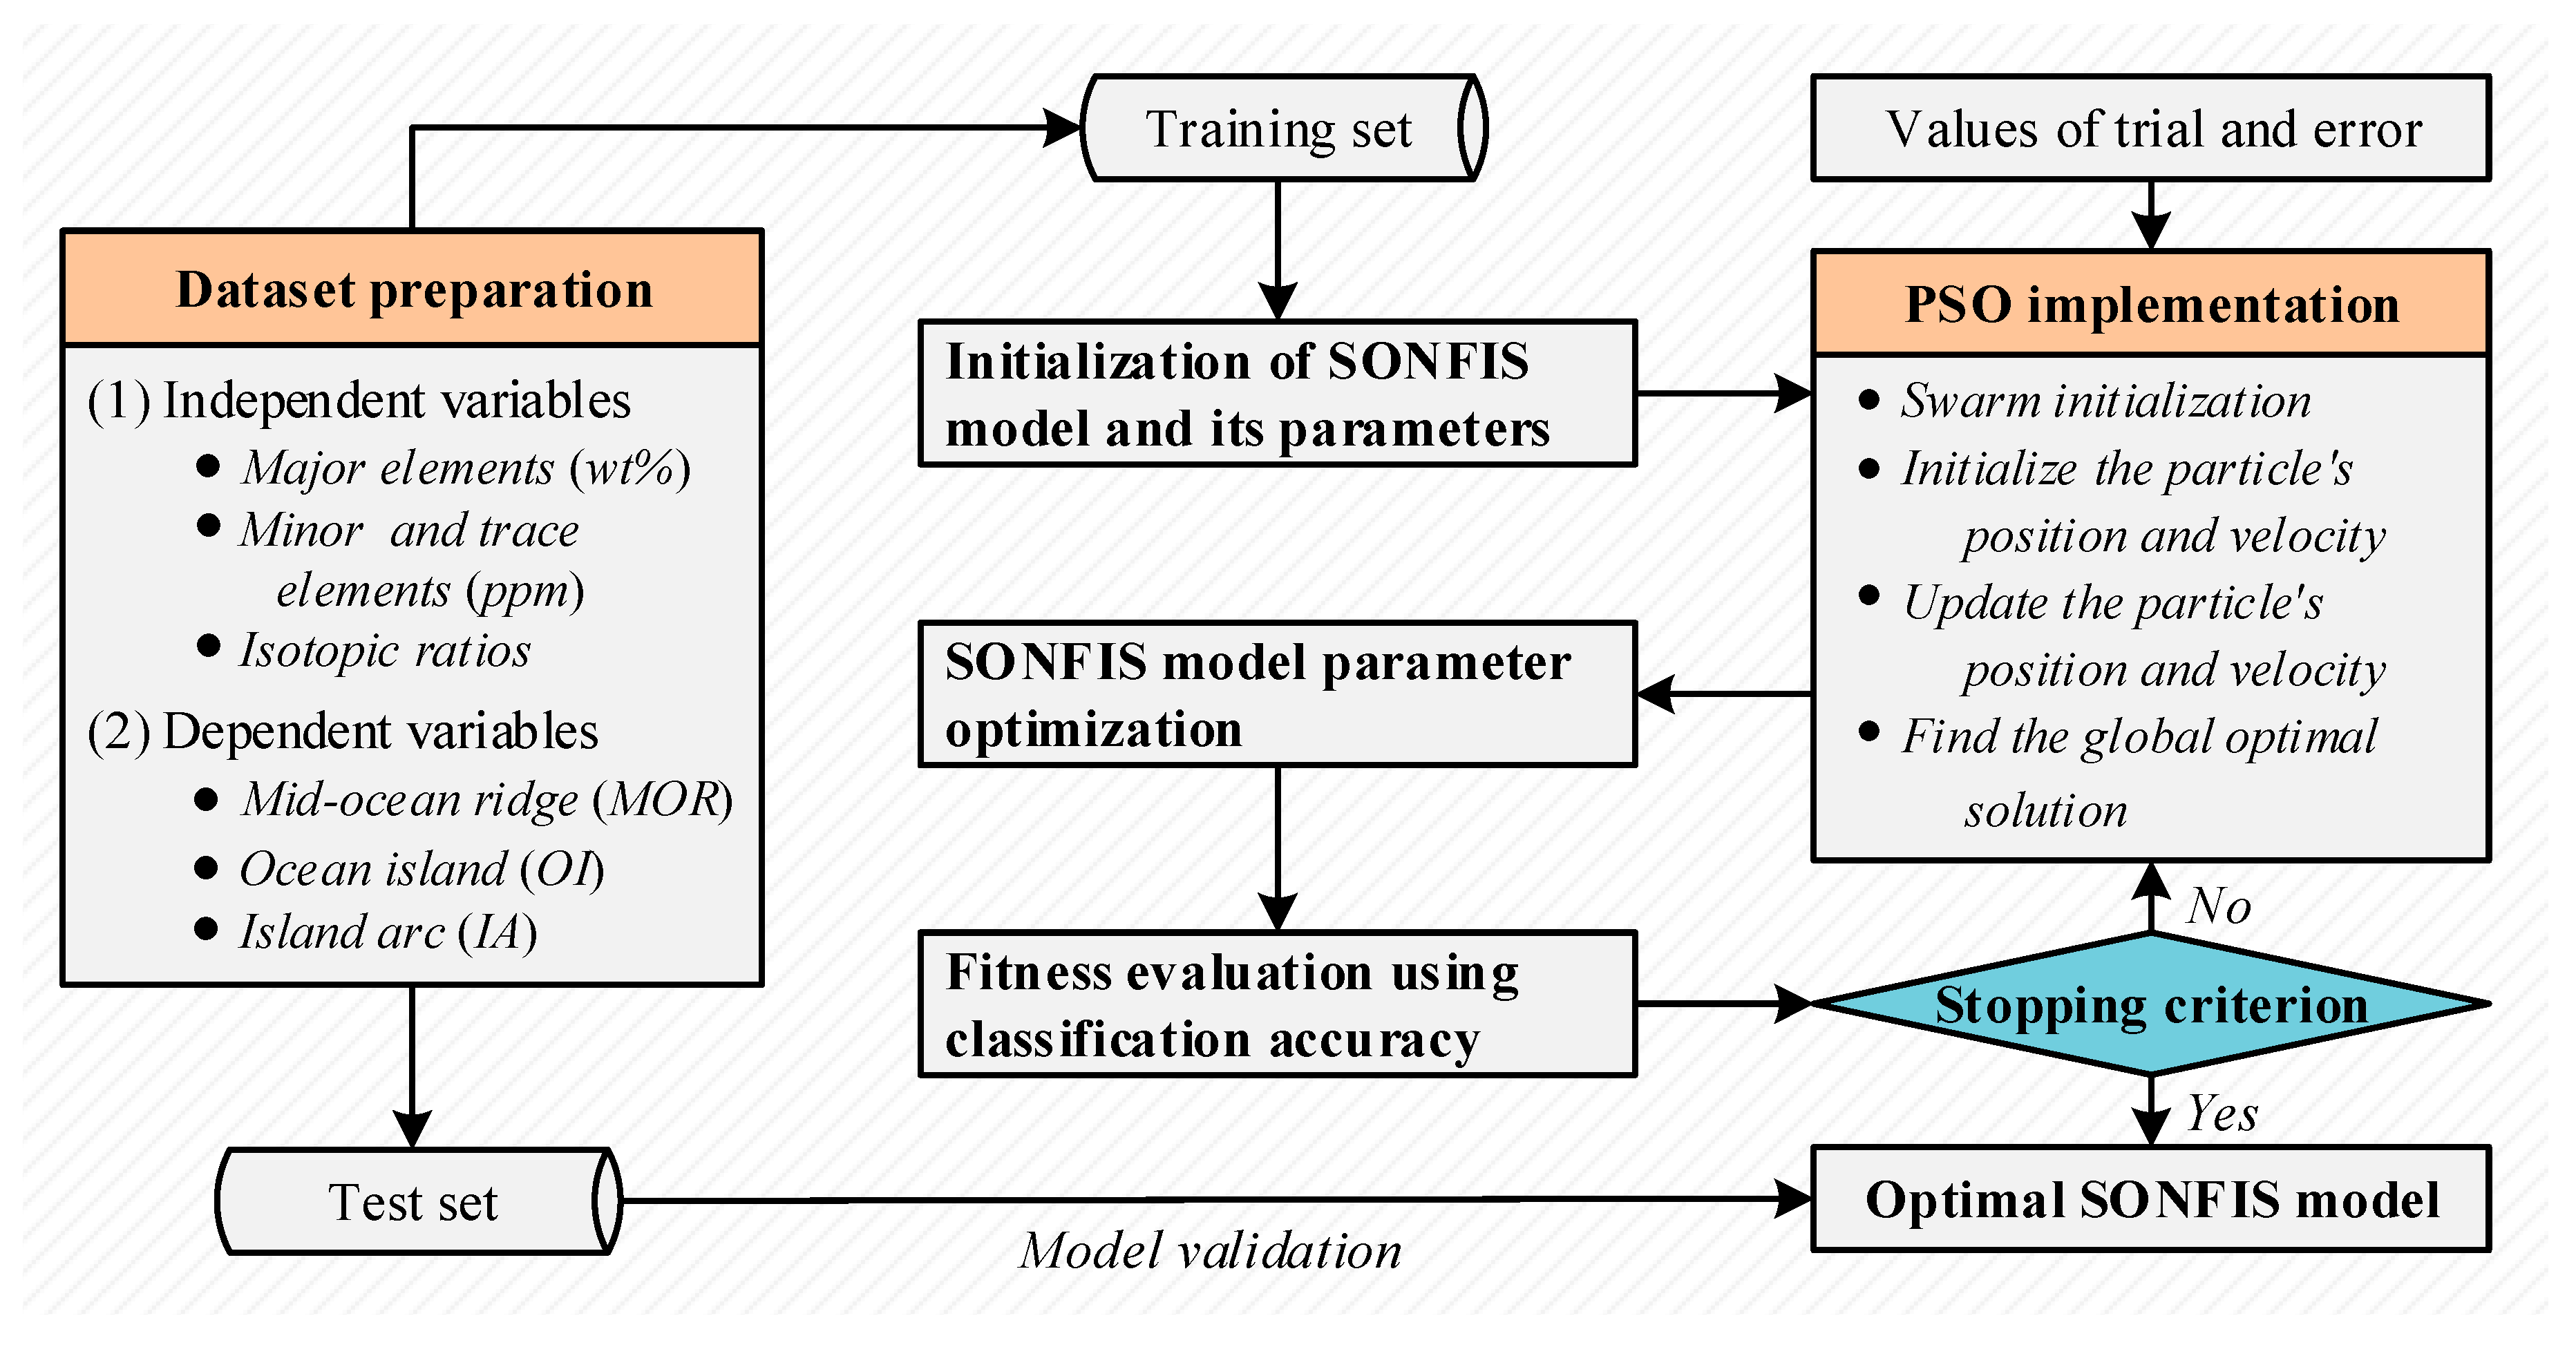
5.1. Overall Methodology: The Proposed Hybrid SONFIS Method

A new hybrid artificial intelligence method for tectonic discrimination of basalts, called SONFIS, was put forward based on NFIS and PSO methods. PSO was introduced to improve the flexibility and generalization ability of NFIS by seeking the optimal parameters corresponding to different datasets. The architecture of the proposed hybrid SONFIS method is shown in Figure 3. The procedure of SONFIS is outlined below.
Step 1: Dataset preparation. The training and test sets were determined by percentage segmentation. The independent and dependent variables were also specified.
Step 2: Model initialization. An initial SONFIS model was generated after all antecedent and consequent parameters were confirmed by trial and error.
Step 3: Parameter optimization. PSO was employed to optimize the model by searching for the optimal values of the antecedent and consequent parameters. Cross-validation played an important role therein.
Step 4: Fitness evaluation. The overall classification accuracy was taken as the fitness function, which was the bridge between NFIS and PSO. Model tuning was based on fitness evaluation results.
Step 5: Model validation. The maximum number of iterations or certain classification precision was considered as the stopping criterion. Once the optimal parameters were found, the SONFIS obtained was validated.

5.2. Methodology Implementation Procedure

5.2.1. Data Acquisition and Preprocessing

The two geochemical datasets of basalts from GEOROC and PetDB were used to test the classification performance of the proposed SONFIS model. One was a high-dimensional dataset, and the other was low-dimensional. The usability of SONFIS could be validated by using both types of datasets.

Dataset 1 with High-Dimensional Features

An extensive dataset of 938 basalt samples was obtained after data cleaning [1]. The dataset included 296 MORB samples from the East Pacific Rise, Mid Atlantic Ridge, Indian Ocean and Juan de Fuca Ridge. Three hundred and nineteen OIB samples were from St. Helena, the Canary, Cape Verde, Caroline, Crozet, Hawaii-Emperor, Juan Fernandez, Marquesas, Mascarene, Samoan and Society islands. The remaining 323 IAB samples came from the Aeolian, Izu-Bonin, Kermadec, Kurile, Lesser Antilles, Mariana, Scotia and Tonga arcs. The global distribution map of basalt samples is shown in Figure 4. Each basalt sample was assigned with 11 major elements (SiO2, TiO2, Al2O3, Fe2O3, FeOT, CaO, MgO, MnO, K2O, Na2O and P2O5), 35 minor and trace elements (La, Ce, Pr, Nd, Sm, Eu, Gd, Tb, Dy, Ho, Er, Tm, Yb, Lu, Sc, V, Cr, Co, Ni, Cu, Zn, Ga, Rb, Sr, Y, Zr, Nb, Sn, Cs, Ba, Hf, Ta, Pb, Th and U) and five isotopic ratios (143Nd/144Nd, 87Sr/86Sr, 206Pb/204Pb, 207Pb/204Pb and 208Pb/204Pb). Accordingly, every sample was represented by a 51-dimensional vector. The basic statistics for each dimension are shown in Table 2.

Dataset 2 with Low-Dimensional Features

The data volume of the low-dimensional dataset was larger than that of dataset 1, containing 1582 basalt samples [10]. Five hundred and thirty-nine MORB samples came from the Atlantic and Pacific mid-ocean ridges, 463 OIB samples were mainly distributed in the Atlantic and Pacific regions and 580 IAB samples were from the west and east coast of the Pacific Rim. Unlike dataset 1, each basalt sample in dataset 2 contained only 12 elements, which were K2O, CaO, SiO2, MgO, NiO, Na2O, FeOT, TiO2, Al2O3, MnO, Cr2O3 and P2O5. The basic statistics for each element corresponding to three different tectonic settings are presented in Table 3.
It should be noted that both datasets contained missing data [1,10]. Nothing was done with the missing data in this study, once again illustrating the superiority of the proposed SONFIS method. What was more, each geochemical feature in both datasets was treated as an input attribute, while the output classes were unified into three basalt tectonic settings, that is, MORB, OIB and IAB. Since the fuzzy membership values of the SONFIS model were between 0 and 1, the values of the input features were adjusted to fit this range. Three output classes, MORB, OIB and IAB, were symbolized by 0, 1 and 2, respectively. Percentage segmentation is a conventional method used for model validation in ML modeling. Both datasets were then randomly split into two subsets, one as a training set (80%) and the other as a test set (20%) [10]. The segmentation results of the two datasets are shown in Table 4 and Table 5, separately.

5.2.2. Model Parameter Configuration

For parameter learning and tuning, the K-fold cross-validation technique was adopted for model optimization in order to verify the classification performance of the training model and adjust the parameters, as shown in Figure 5 [1,8,10]. As a general rule for providing empirical evidence, K = 10 is generally preferred. The raw dataset was first divided into 10 subsets. The hold-out method was then repeated 10 times, such that each time, one of the 10 subsets was used as the test set and the remaining nine subsets were grouped together to form a training set. The error estimation was finally averaged over all 10 trials to get the total effectiveness of the model.
The fuzzy c-means clustering [60] was employed to transfer all training samples into c = 10 clusters, which was determined by trial and error. The fuzzy if-then rules were generated by clusters, and the optimal parameters of the rule were acquired through the PSO algorithm, as shown in Figure 3. During the optimization process, different combinations of antecedent and consequent parameters were generated, and each combination was tested with 10-fold cross-validation, resulting in a total of 100 iterations. The variant of classification accuracy was used for fitness evaluation. When the optimization was completed, the optimal position g b e s t of the swarm was obtained, providing the highest classification accuracy once the stopping criterion was satisfied. The optimized values of the antecedent and consequent parameters of SONFIS were then determined, and the corresponding model was finally validated using the test set prior to being used for discriminating the tectonic settings of unknown samples.

5.2.3. Model Performance Evaluation

Evaluation metrics are fundamental to evaluating the proposed SONFIS method with existing datasets. Using specific metrics, model performance evaluation results can be reasonably given and accurately expressed. A comprehensive evaluation system, including the classification accuracy and confusion matrix, was used to assess the classification effect of each MLA. The classification accuracy Ci of an individual program i depended on the number of samples correctly classified and was quantitatively evaluated by Equation (9) [53].
C i = T N × 100 %
where T is the number of sample cases correctly classified, and N is the total number of sample cases.
As a visual tool, the confusion matrix is often used to describe the performance of a classifier on the test set for which the actual values are known, and intuitively exhibits classification precision [10]. It can also be described as a specific type of contingency table with two dimensions and identical sets of classes in each dimension. The horizontal dimension denotes the actual class, and the vertical dimension denotes the predicted class. The number of correct and incorrect predictions were summarized with count values, and consequently broken down by each class. Some derived indexes (e.g., precision and recall) could also be derived from the confusion matrix. In summary, a confusion matrix provided insight not only into identifying the errors being made by a classifier, but more importantly, the types of errors being made.

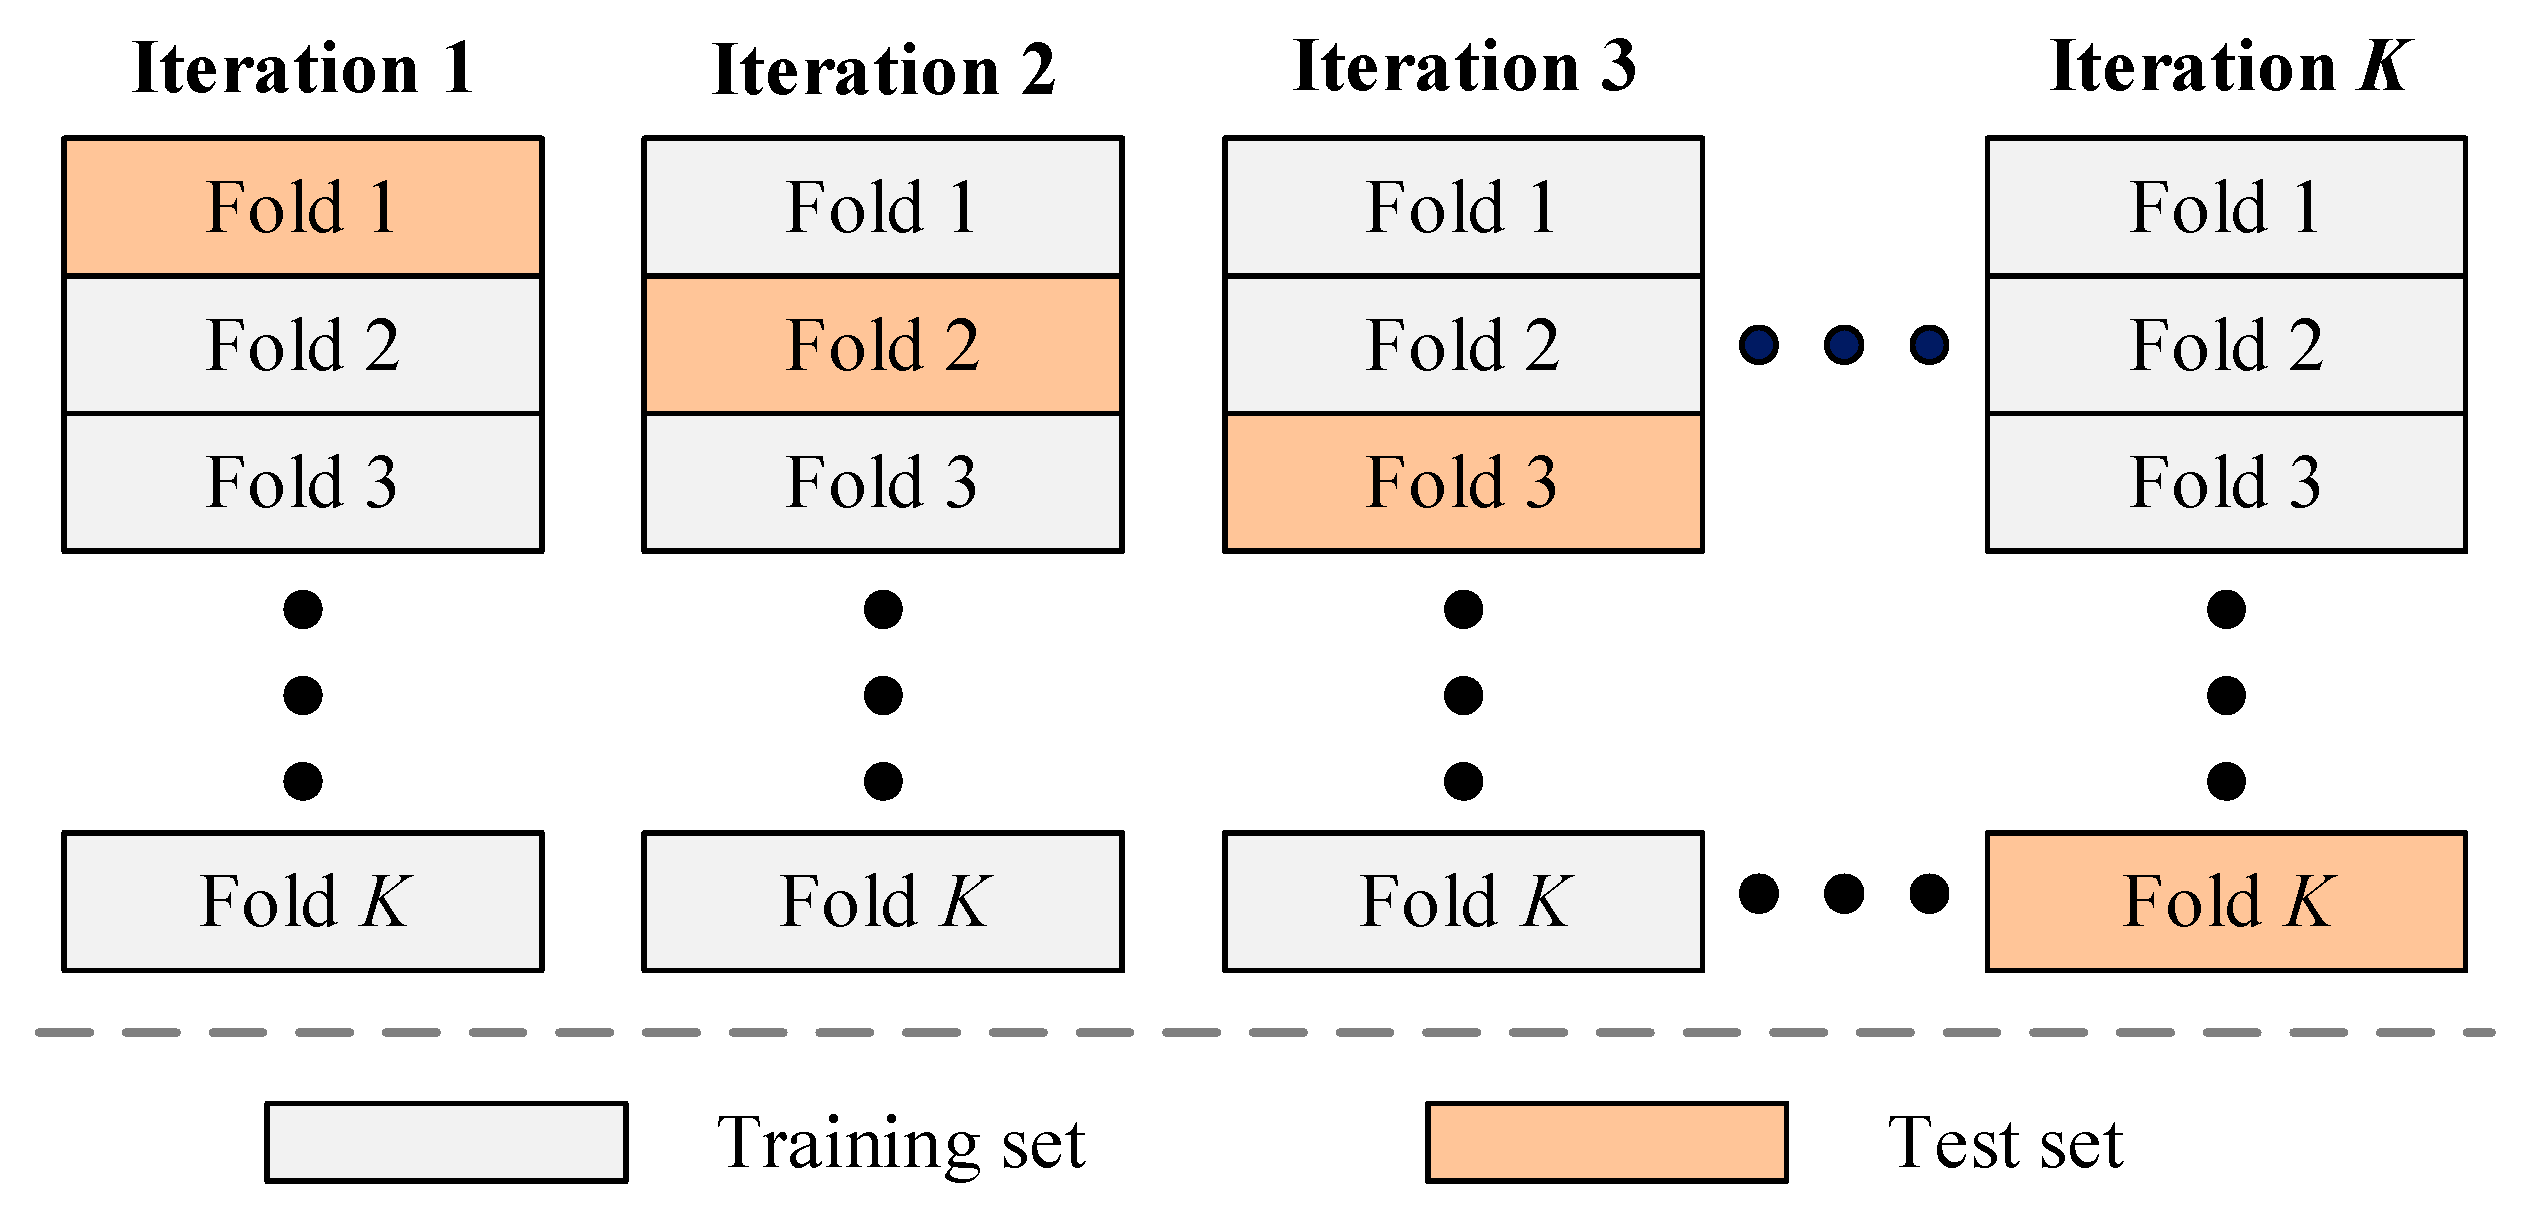
5.2.4. Model Validation Scheme Design

To assess the classification performance of the proposed SONFIS method when processing geochemical data, several experiments were carried out using the two datasets described in Section 5.2.1. It is imperative to verify the effectiveness of the PSO algorithm using optimizing model parameters, and then compare it with two other common optimization techniques, manual adjustment and grid search. Furthermore, three additional common MLAs (SVM, RF and NB) were also compared with the SONFIS model. The new LRC and MLP models were also additionally used for performance comparison. Finally, the proposed SONFIS method and the other five MLAs were all implemented in MATLAB® R2016b.

6. Results and Discussion

6.1. Optimization Effect Verification

The parameters of NFIS were tuned based on the same datasets (in Section 5.2.1) and computing platform (Intel® CoreTM i7-8700 CPU @ 3.20 GHz, 16 GB of RAM, and a 64-bit windows 10 OS), using manual adjustment, grid search and a PSO algorithm (i.e., SONFIS), sequentially. Each method was conducted ten times, and the average classification accuracy obtained was used as the comparison value. The results show that the classification accuracy of SONFIS was approximately five to ten percent higher than that of the other two optimized models when discriminating among the tectonic settings of basalts. The improvement of classification performance was consistent with literature [58]. The SONFIS model converged after 100 iterations, consequently taking less time, which suggested the PSO algorithm was superior in both performance and efficiency for parameter optimization.

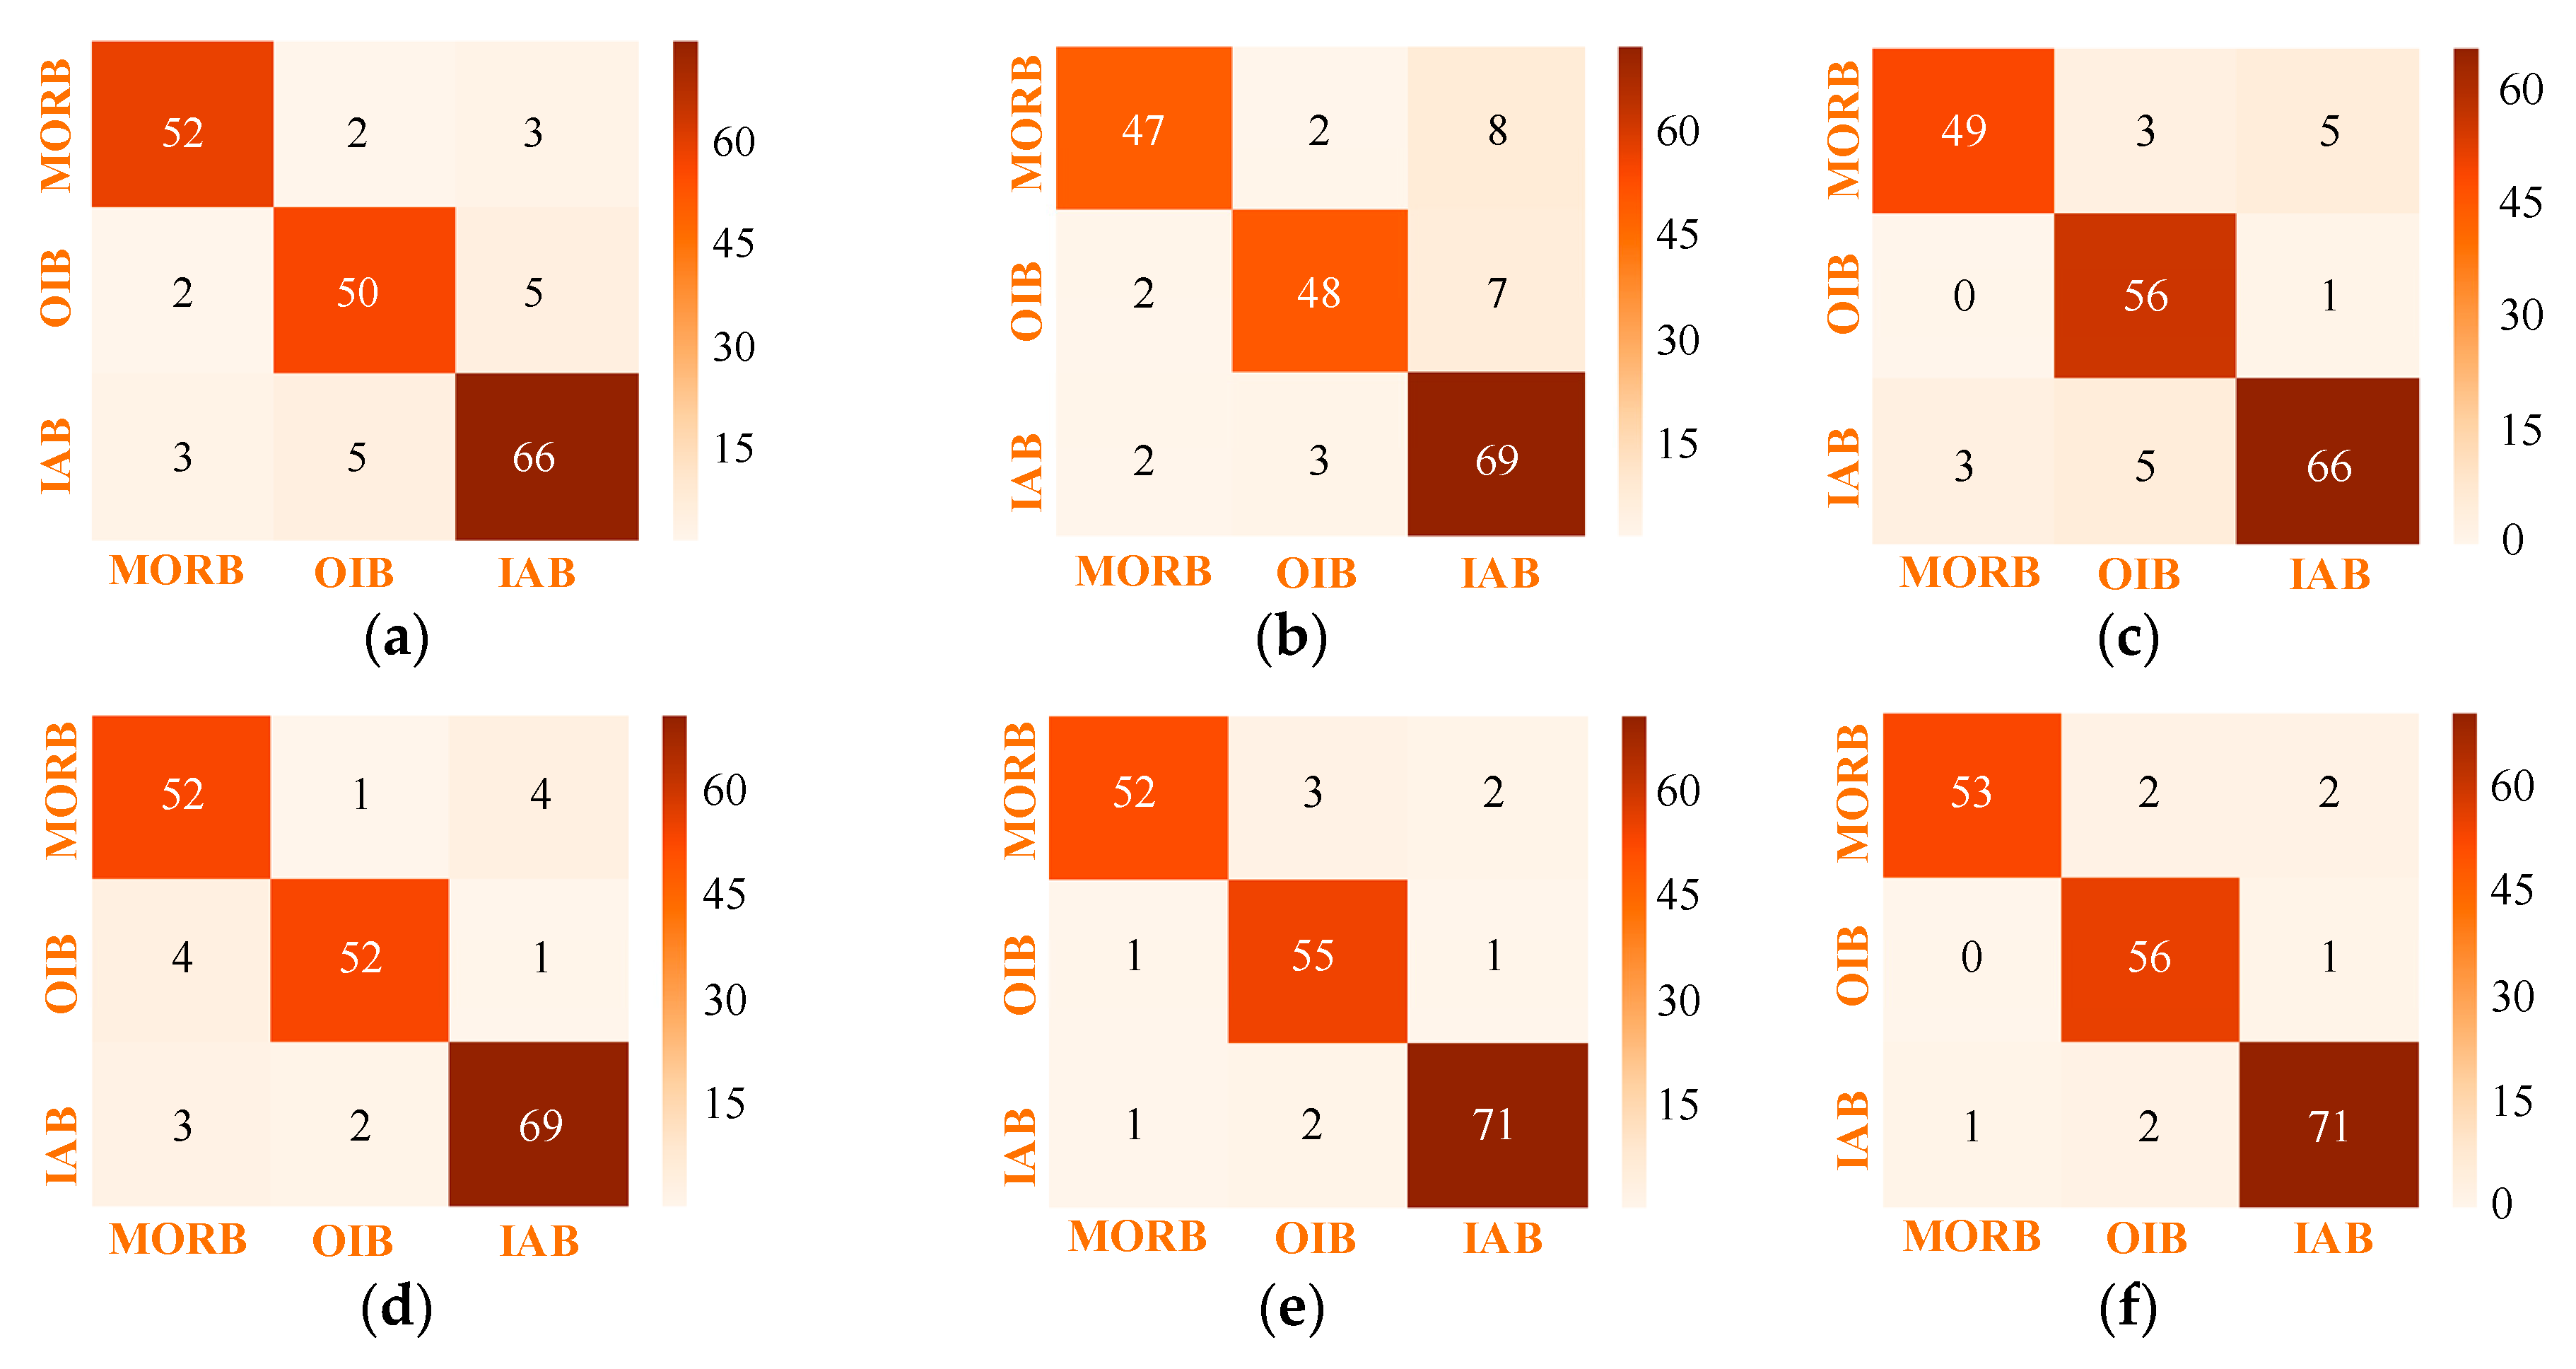
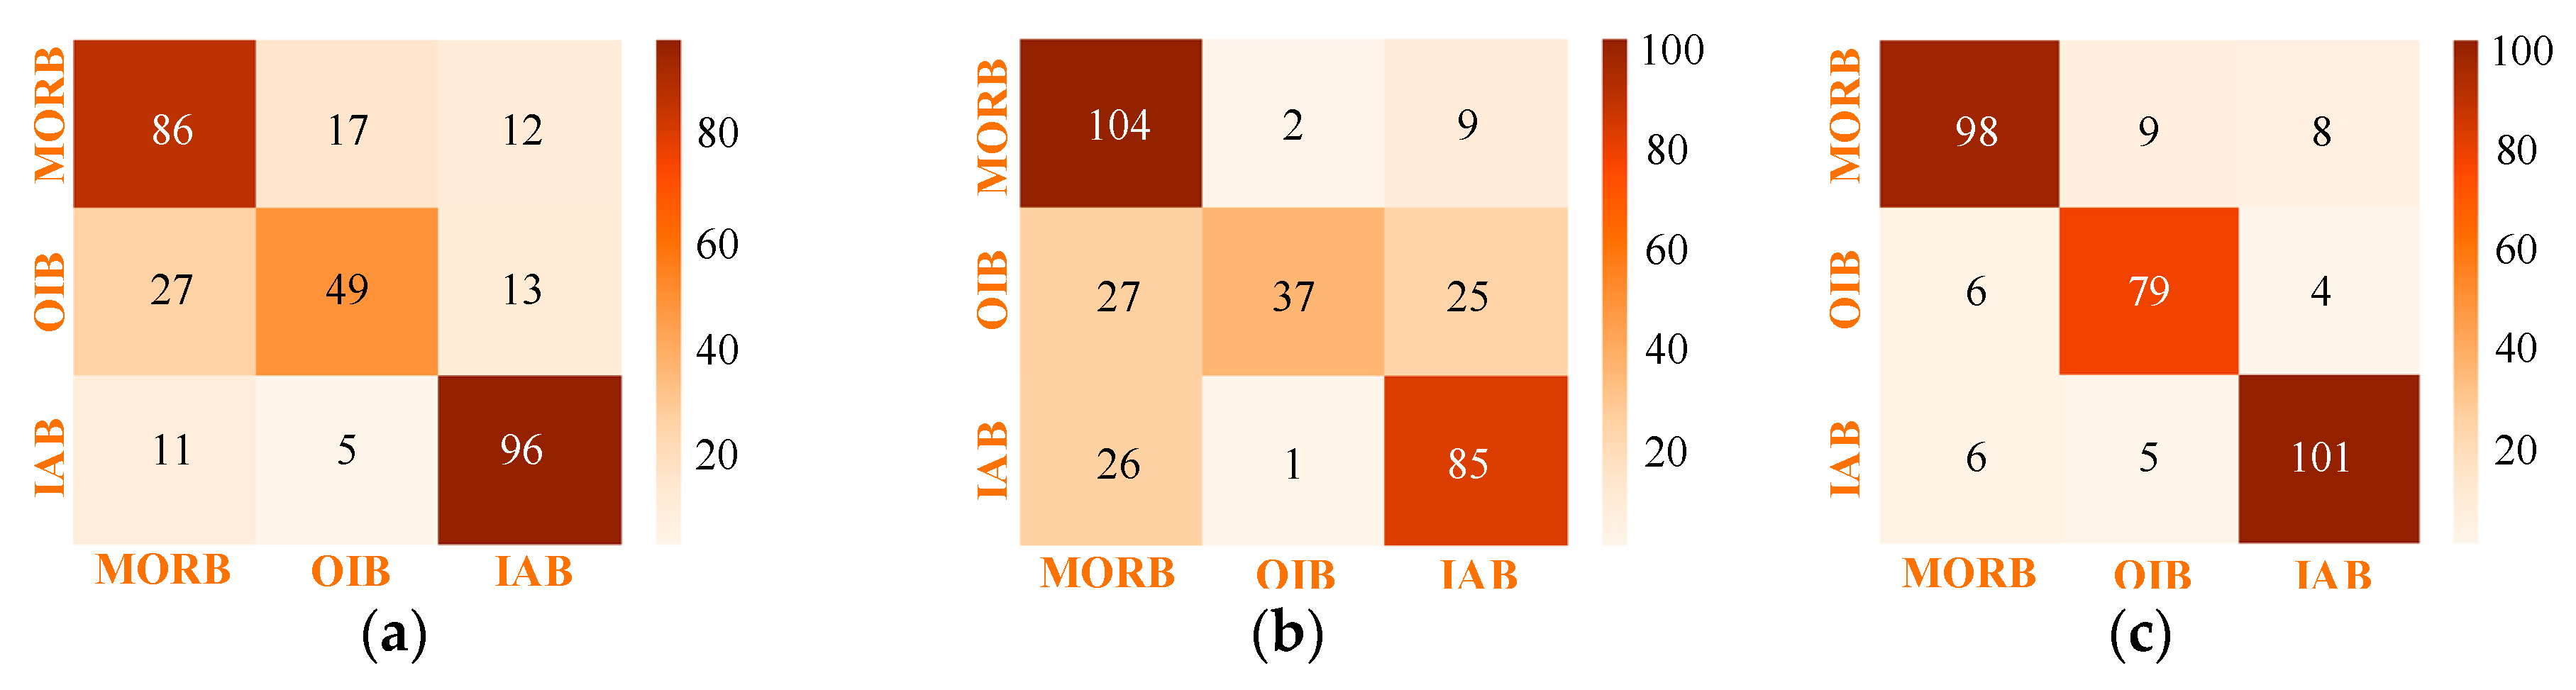
6.2. MLA Performance Comparison

For dataset 1, the basalt tectonic discrimination results obtained by six MLAs are shown in Table 4 and Figure 6. It can be seen from Table 4 that all MLAs had good classification performance for the three tectonic settings. The data demonstrated that SONFIS was the most capable, followed by RF, SVM and MLP, all of which had an overall classification accuracy of over 90%. However, LRC and NB did not perform well in comparison. SONFIS also demonstrated top performance in terms of the classification accuracy of single tectonic setting. The discrimination effects of MLP on OIB and RF on IAB were also outstanding. In Figure 6, darker colored squares on the main diagonal indicated higher accuracy of the classification results. In the confusion matrix for each MLA, the squares on the main diagonal were the darkest, indicating that the number of correct classifications was large. Again, the SONFIS model performed best in the three classes. Overall, all MLAs used could take advantage of the high-dimensional information in dataset 1 and had a remarkable discrimination ability, which was not achieved in the discrimination diagrams [53]. These results were additionally consistent with previous results obtained by Ueki et al. [8].
For dataset 2, the basalt tectonic discrimination results acquired by six MLAs are shown in Table 5 and Figure 7. In this dataset, there were only a few elements and no isotopes. As noted by Petrelli and Perugini [40], a small number of elements can affect the classification effect of MLAs, which was also confirmed by the classification results below. For example, the three models, MLP, SVM and RF, did well in the dataset 1, but did not perform well with dataset 2. However, the SONFIS model still classified best, with the single and overall classification accuracy reaching about 95%, demonstrating that the integration of the PSO algorithm improved the adaptability of SONFIS. The effects of information loss were also visually illustrated in Figure 7. Unlike Figure 6, not all of the darkest squares were on the main diagonal within every subgraph. However, the confusion matrix corresponding to the SONFIS model was consistent with Figure 6, which demonstrated the advantages of using the combined model.

6.3. Contrast with Conventional Discrimination Diagrams

Some scholars [26,53] have utilized conventional discrimination diagrams to classify the corresponding dataset in Section 5.2.1 into MORB, OIB and IAB respectively, which facilitates the performance contrast between MLAs and discrimination diagrams. For dataset 1, Han et al. [53] adopted the TiO2-MnO-P2O5, FeOT-MgO-Al2O3, Ti-Zr-Y, Zr/Y-Zr and Ti-Zr five common diagrams for tectonic discrimination (see Figure 1). In the initial state, the discrimination effect of the Ti-Zr diagram was outstanding, whose classification accuracy was about 75%. When the missing data was processed, the classification accuracy of the Zr/Y-Zr diagram could reach 90%, but it was still inferior to some MLAs (e.g., MLP, SVM, RF and SONFIS). For dataset 2, Li et al. [26] established the novel FeOT/Na2O-FeOT/CaO diagram, which had the excellent classification effect for MORB, OIB and IAB through trial and error, while the discrimination effect between MORB (or OIB) and IAB was still not satisfactory. On the contrary, the proposed SONFIS method performed well for each tectonic setting.
The contrast may be incomplete because it did not cover all the basalt discrimination diagrams, but it still showed several advantages of MLAs: (1) MLAs could take advantage of all the element information, even if the dataset contained missing data, that is, MLAs were less selective about samples. (2) The classification accuracy of MLAs was often higher, and the classification effect of single setting was uniform. (3) MLAs could be easily transplanted to tectonic discrimination of other volcanic rocks.

6.4. Discussion: Applicability and Deficiency of MLA-Based Discrimination Method

MLAs can extract valuable information from diverse data, which was taken into account in the selection of basalt samples. The geochemical data used in this paper were global data of the Cenozoic era, with a certain tectonic environment background, excluding data before the Cenozoic era. The amount of data was large and the source was numerous, including the fresh, altered and metamorphic basalts. The richness and diversity of geochemical datasets made for a reliable SONFIS model with high classification accuracy. Nevertheless, it was insufficient that basalts that were influenced by crustal contamination had not been considered because only three types of tectonic settings (MORB, OIB and IAB) were studied. More tectonic settings also need to be classified accurately by MLAs in the follow-up study.
Compared with binary or ternary discrimination diagrams, another deficiency of MLAs was that the high-dimensional data (more than three dimensions) were difficult to visualize. Although geologists could directly call on the trained model for tectonic discrimination and obtain satisfactory classification results, the visualization problem would limit its practical application to some extent. It is imperative to solve the visualization problem, and many high dimensional visualization (dimensionality reduction) methods are being tried, such as principal component analysis and t-SNE. In addition, some MLAs belong to the black box model, which makes it difficult for geochemists to utilize the internal classification rules directly. The reasonable interpretation of classification results obtained by MLAs also needs to be resolved.

7. Conclusions and Future Work

A combined technique based on fuzzy logic and neural networks, termed NFIS, was newly introduced into the research area of tectonic discrimination of basalts in this paper. A metaheuristic optimization algorithm PSO was also utilized to avoid model parameters restricting the classification performance of NFIS. As such, NFIS and PSO were combined to construct a novel intelligent discrimination method called SONFIS. The accuracy and generalizability of NFIS were compared with that of five well-established MLAs using high-dimensional and low-dimensional datasets. The model evaluation results were subsequently represented by classification accuracy calculations and confusion matrix visualization. The conclusions are summarized as follows:
  • It could be found from Section 6.1 that with the help of PSO, the overall classification accuracy of SONFIS was about 5% higher than that of NFIS optimized by manual adjustment and grid search. Compared with grid search-optimized NFIS, SONFIS was more complicated, but it demonstrated better classification performance, indicating that the combined model was worth exploring.
  • SONFIS had excellent generalization capacity, since PSO could automatically search for optimal parameters for different datasets. SONFIS could also be accurately applied to both high-dimensional and low-dimensional datasets, which was valuable for the study of petrology and geochemistry.
  • The comparative experiments show that SONFIS was competitive for the two datasets used, demonstrating classification accuracy over 90% for both datasets. Furthermore, more elements could be utilized by SONFIS, giving it a superior ability to avoid the unreliability of the discrimination results.
  • The other five well-established MLAs were also excellent methods for the tectonic discrimination of basalts, showing that ML was a particularly useful and promising tool in geochemical research. The combination of large databases and ML techniques might yield unexpected results.
Although ML had outstanding potential in petrological and geochemical research, it inevitably had some disadvantages, such as difficulty in interpretation and expression. It is necessary to explore effective methods to solve these problems in future studies, so as to improve the usability of ML in Earth Science.

Author Contributions

Overall framework design, M.L.; Methodology and validation, Q.R.; Data collection and preliminary analysis, S.H.; Draft review and editing, Y.Z.; Investigation and conceptualization, Q.Z.; Data curation and formal analysis, J.S. All the authors discussed the results and commented on the manuscript.

Funding

This research was jointly funded by the National Natural Science Foundation for Excellent Young Scientists of China (Grant No. 51622904), the Tianjin Science Foundation for Distinguished Young Scientists of China (Grant No. 17JCJQJC44000) and the National Natural Science Foundation for Innovative Research Groups of China (Grant No. 51621092).

Conflicts of Interest

The authors declare no conflict of interest.

References

  1. Vermeesch, P. Tectonic discrimination of basalts with classification trees. Geochim. Cosmochim. Acta 2006, 70, 1839–1848. [Google Scholar]
  2. Ryan, K.M.; Williams, D.M. Testing the reliability of discrimination diagrams for determining the tectonic depositional environment of ancient sedimentary basins. Chem. Geol. 2007, 242, 103–125. [Google Scholar] [CrossRef]
  3. Liu, K.; Liu, W.B. Machine learning and identification of the tectonic environment of basalt in the continental plate. Eng. Technol. Manag. 2017. [Google Scholar] [CrossRef]
  4. Vermeesch, P. Tectonic discrimination diagrams revisited. Geochem. Geophys. Geosyst. 2006, 7, Q06017. [Google Scholar] [CrossRef]
  5. Guo, Q.Q.; Xiao, W.J.; Windley, B.F.; Mao, Q.G.; Han, C.M.; Qu, J.F.; Ao, S.J.; Li, J.L.; Yong, Y. Provenance and tectonic settings of Permian turbidites from the Beishan Mountains, NW China: Implications for the Late Paleozoic accretionary tectonics of the southern Altaids. J. Asian Earth Sci. 2012, 49, 54–68. [Google Scholar] [CrossRef]
  6. Chen, C.; Ren, Y.S.; Zhao, H.L.; Yang, Q.; Shang, Q.Q. Age, tectonic setting, and metallogenic implication of Phanerozoic granitic magmatism at the eastern margin of the Xing’an-Mongolian Orogenic Belt, NE China. J. Asian Earth Sci. 2017, 144, 368–383. [Google Scholar] [CrossRef]
  7. Di, P.F.; Wang, J.R.; Zhang, Q.; Yang, J.; Chen, W.F.; Pan, Z.J.; Du, X.L.; Jiao, S.T. The evaluation of basalt tectonic discrimination diagrams: Constraints on the research of global basalt data. Bull. Miner. Petrol. Geochem. 2017, 36, 891–896. [Google Scholar]
  8. Ueki, K.; Hino, H.; Kuwatani, T. Geochemical discrimination and characteristics of magmatic tectonic settings: A machine-learning-based approach. Geochem. Geophys. Geosyst. 2018, 19, 1327–1347. [Google Scholar]
  9. Shi, Y.; Huang, Q.W.; Liu, X.J.; Krapež, B.; Yu, J.H.; Bai, Z.A. Provenance and tectonic setting of the supra-crustal succession of the Qinling Complex: Implications for the tectonic affinity of the North Qinling Belt, Central China. J. Asian Earth Sci. 2018, 158, 112–139. [Google Scholar]
  10. Ren, Q.B.; Li, M.C.; Han, S. Tectonic discrimination of olivine in basalt using data mining techniques based on major elements: A comparative study from multiple perspectives. Big Earth Data 2019, 1–18. [Google Scholar] [CrossRef]
  11. Mao, X.; Li, L.; Liu, Z.; Zeng, R.; Dick, J.M.; Yue, B.; Ai, Q. Multiple magma conduits model of the Jinchuan Ni-Cu-(PGE) deposit, northwestern China: Constraints from the geochemistry of platinum-group elements. Minerals 2019, 9, 187. [Google Scholar] [CrossRef]
  12. Wang, J.R.; Chen, W.F.; Zhang, Q.; Jin, W.J.; Jiao, S.T.; Wang, Y.X.; Yang, J.; Pan, Z.J. MORB data mining: Reflection of basalt discrimination diagram. Geotecton. Met. 2017, 41, 420–431. [Google Scholar]
  13. Wang, J.R.; Chen, W.F.; Zhang, Q.; Jiao, S.T.; Yang, J.; Pan, Z.J.; Wang, S. Preliminary research on data mining of N-MORB and E-MORB: Discussion on method of the basalt discrimination diagrams and the character of MORB’s mantle source. Acta Petrol. Sin. 2017, 33, 993–1005. [Google Scholar]
  14. Green, D.H. The origin of basaltic and nephelinitic magmas in the earth’s mantle. Tectonophysics 1969, 7, 409–422. [Google Scholar] [CrossRef]
  15. Wood, D.A. The application of a Th-Hf-Ta diagram to problems of tectonomagmatic classification and to establishing the nature of crustal contamination of basaltic lavas of the British Tertiary Volcanic Province. Earth Planet. Sci. Lett. 1980, 50, 11–30. [Google Scholar] [CrossRef]
  16. Zhang, Y.; Yu, K.; Qian, H. LA-ICP-MS analysis of clinopyroxenes in basaltic pyroclastic rocks from the Xisha Islands, northwestern South China Sea. Minerals 2018, 8, 575. [Google Scholar] [CrossRef]
  17. Shu, S.; Yang, X.; Liu, L.; Liu, W.; Cao, J.; Gao, E. Dual geochemical characteristics for the basic intrusions in the Yangtze Block, South China: New evidence for the breakup of Rodinia. Minerals 2018, 8, 228. [Google Scholar] [CrossRef]
  18. Di, P.F.; Chen, W.F.; Zhang, Q.; Wang, J.R.; Tang, Q.Y.; Jiao, S.T. Comparison of global N-MORB and E-MORB classification schemes. Acta Petrol. Sin. 2018, 34, 264–274. [Google Scholar]
  19. Yoder, H.S., Jr.; Tilley, C.E. Origin of basalt magmas: An experimental study of natural and synthetic rock systems. J. Petrol. 1962, 3, 342–532. [Google Scholar] [CrossRef]
  20. Hofmann, A.W.; White, W.M. Mantle plumes from ancient oceanic crust. Earth Planet. Sci. Lett. 1982, 57, 421–436. [Google Scholar] [CrossRef]
  21. Pearce, J.A.; Lippard, S.J.; Roberts, S. Characteristics and tectonic significance of supra-subduction zone ophiolites. Geol. Soc. Lond. Spec. Publ. 1984, 16, 77–94. [Google Scholar] [CrossRef]
  22. Zindler, A.; Hart, S. Chemical geodynamics. Ann. Rev. Earth Planet. Sci. 1986, 14, 493–571. [Google Scholar] [CrossRef]
  23. Sun, S.S.; McDonough, W.F. Chemical and isotopic systematics of oceanic basalts: Implications for mantle composition and processes. Geol. Soc. Lond. Spec. Publ. 1989, 42, 313–345. [Google Scholar] [CrossRef]
  24. Safonova, I.; Maruyama, S.; Kojima, S.; Komiya, T.; Krivonogov, S.; Koshida, K. Recognizing OIB and MORB in accretionary complexes: A new approach based on ocean plate stratigraphy, petrology and geochemistry. Gondwana Res. 2016, 33, 92–114. [Google Scholar] [CrossRef]
  25. Bi, J.H.; Ge, W.C.; Yang, H.; Wang, Z.H.; Tian, D.X.; Liu, X.W.; Xu, W.L.; Xing, D.H. Geochemistry of MORB and OIB in the Yuejinshan Complex, NE China: Implications for petrogenesis and tectonic setting. J. Asian Earth Sci. 2017, 145, 475–493. [Google Scholar] [CrossRef]
  26. Li, Y.Q.; Du, X.L.; Jin, W.J.; Du, J.; Zhang, Q.; Wang, J.R.; Ma, Z. A comparative study of olivine in mid-ocean ridge basalt (MORB), ocean island basalt (OIB) and island arc basalt (IAB). Chin. J. Geol. 2018, 53, 1228–1239. [Google Scholar]
  27. Pearce, J.A.; Cann, J.R. Ophiolite origin investigated by discriminant analysis using Ti, Zr and Y. Earth Planet. Sci. Lett. 1971, 12, 339–349. [Google Scholar] [CrossRef]
  28. Pearce, J.A.; Cann, J.R. Tectonic setting of basic volcanic rocks determined using trace element analyses. Earth Planet. Sci. Lett. 1973, 19, 290–300. [Google Scholar] [CrossRef]
  29. Pearce, J.A. Statistical analysis of major element patterns in basalts. J. Petrol. 1976, 17, 15–43. [Google Scholar] [CrossRef]
  30. Hirose, K.; Kawamoto, T. Hydrous partial melting of lherzolite at 1 GPa: The effect of H2O on the genesis of basaltic magmas. Earth Planet. Sci. Lett. 1995, 133, 463–473. [Google Scholar] [CrossRef]
  31. Farnetani, C.G.; Richards, M.A.; Ghiorso, M.S. Petrological models of magma evolution and deep crustal structure beneath hotspots and flood basalt provinces. Earth Planet. Sci. Lett. 1996, 143, 81–94. [Google Scholar] [CrossRef]
  32. Arndt, N.T.; Kerr, A.C.; Tarney, J. Dynamic melting in plume heads: The formation of Gorgona komatiites and basalts. Earth Planet. Sci. Lett. 1997, 146, 289–301. [Google Scholar] [CrossRef]
  33. Pearce, J.A.; Norry, M.J. Petrogenetic implications of Ti, Zr, Y, and Nb variations in volcanic rocks. Contrib. Mineral. Petrol. 1979, 69, 33–47. [Google Scholar] [CrossRef]
  34. Wood, D.A.; Joron, J.L.; Treuil, M. A re-appraisal of the use of trace elements to classify and discriminate between magma series erupted in different tectonic settings. Earth Planet. Sci. Lett. 1979, 45, 326–336. [Google Scholar] [CrossRef]
  35. Shervais, J.W. Ti-V plots and the petrogenesis of modern and ophiolitic lavas. Earth Planet. Sci. Lett. 1982, 59, 101–118. [Google Scholar] [CrossRef]
  36. Mullen, E.D. MnO/TiO2/P2O5: A minor element discriminant for basaltic rocks of oceanic environments and its implications for petrogenesis. Earth Planet. Sci. Lett. 1983, 62, 53–62. [Google Scholar] [CrossRef]
  37. Pearce, J.A.; Peate, D.W. Tectonic implications of the composition of volcanic arc magmas. Ann. Rev. Earth Planet. Sci. 1995, 23, 251–285. [Google Scholar] [CrossRef]
  38. Workman, R.K.; Hart, S.R. Major and trace element composition of the depleted MORB mantle (DMM). Earth Planet. Sci. Lett. 2005, 231, 53–72. [Google Scholar] [CrossRef]
  39. Galoyan, G.; Rolland, Y.; Sosson, M.; Corsini, M.; Melkonyan, R. Evidence for superposed MORB, oceanic plateau and volcanic arc series in the Lesser Caucasus (Stepanavan, Armenia). Comptes Rendus Geosci. 2007, 339, 482–492. [Google Scholar] [CrossRef]
  40. Petrelli, M.; Perugini, D. Solving petrological problems through machine learning: The study case of tectonic discrimination using geochemical and isotopic data. Contrib. Min. Petrol. 2016, 171, 81. [Google Scholar] [CrossRef]
  41. Wang, J.R.; Pan, Z.J.; Zhang, Q.; Chen, W.F.; Yang, J.; Jiao, S.T.; Wang, S.H. Intra-continental basalt data mining: The diversity of their constituents and the performance in basalt discrimination diagrams. Acta Petrol. Sin. 2016, 32, 1919–1933. [Google Scholar]
  42. Liu, X.L.; Zhang, Q.; Li, W.C.; Yang, F.C.; Zhao, Y.; Li, Z.; Jiao, S.T.; Wang, J.R.; Zhang, N.; Wang, S.S.; et al. Applicability of large-ion lithophile and high field strength element basalt discrimination diagrams. Int. J. Dig. Earth 2018, 11, 752–760. [Google Scholar] [CrossRef]
  43. Li, C.S.; Arndt, N.T.; Tang, Q.Y.; Ripley, E.M. Trace element indiscrimination diagrams. Lithos 2015, 232, 76–83. [Google Scholar] [CrossRef]
  44. Zhang, L. MATPLOT: A MATLAB standalone application for geochemical data analysis and plotting. Acta Petrol. Sin. 2018, 34, 495–502. [Google Scholar]
  45. GEOROC. Available online: http://georoc.mpch-mainz.gwdg.de/georoc/ (accessed on 20 June 2019).
  46. PetDB. Available online: http://www.earthchem.org/petdb (accessed on 20 June 2019).
  47. Zhang, Q.; Zhou, Y.Z. Reflections on the scientific research method in the era of big data. Bull. Mineral. Petrol. Geochem. 2017, 36, 881–885. [Google Scholar]
  48. Zhang, Q.; Zhou, Y.Z. Big data helps geology develop rapidly. Acta Petrol. Sin. 2018, 34, 3167–3172. [Google Scholar]
  49. Luo, J.M.; Zhang, Q. Big data opens up new way for geology study: Mining of all data enhances the researchful precision. Chin. J. Geol. 2018, 53, 1207–1214. [Google Scholar]
  50. Zhang, Q.; Jiao, S.T.; Lu, X.X. Discussion on causality and correlation in geological research. Acta Petrol. Sin. 2018, 34, 275–280. [Google Scholar]
  51. Zhou, Y.Z.; Chen, S.; Zhang, Q.; Xiao, F.; Wang, S.G.; Liu, Y.P.; Jiao, S.T. Advances and prospects of big data and mathematical geoscience. Acta Petrol. Sin. 2018, 34, 255–263. [Google Scholar]
  52. Han, S.; Li, M.C.; Ren, Q.B. Discriminating among tectonic settings of spinel based on multiple machine learning algorithms. Big Earth Data 2019. [Google Scholar] [CrossRef]
  53. Han, S.; Li, M.C.; Ren, Q.B.; Liu, C.Z. Intelligent determination and data mining for tectonic settings of basalts based on big data methods. Acta Petrol. Sin. 2018, 34, 3207–3216. [Google Scholar]
  54. Jiao, S.T.; Zhou, Y.Z.; Zhang, Q.; Jin, W.J.; Liu, Y.P.; Wang, J. Study on intelligent discrimination of tectonic settings based on global gabbro data from GEOROC. Acta Petrol. Sin. 2018, 34, 3189–3194. [Google Scholar]
  55. Trépanier, S.; Mathieu, L.; Daigneault, R.; Faure, S. Precursors predicted by artificial neural networks for mass balance calculations: Quantifying hydrothermal alteration in volcanic rocks. Comput. Geosci. 2016, 89, 32–43. [Google Scholar] [CrossRef] [Green Version]
  56. Ren, Q.B.; Wang, G.; Li, M.C.; Han, S. Prediction of rock compressive strength using machine learning algorithms based on spectrum analysis of geological hammer. Geotech. Geol. Eng. 2019, 37, 475–489. [Google Scholar] [CrossRef]
  57. Jang, J.S. ANFIS: Adaptive-network-based fuzzy inference system. IEEE Trans. Syst. Man Cybern. 1993, 23, 665–685. [Google Scholar] [CrossRef]
  58. Chen, M.Y. A hybrid ANFIS model for business failure prediction utilizing particle swarm optimization and subtractive clustering. Inf. Sci. 2013, 220, 180–195. [Google Scholar] [CrossRef]
  59. Basser, H.; Karami, H.; Shamshirband, S.; Akib, S.; Amirmojahedi, M.; Ahmad, R.; Jahangirzadeh, A.; Javidnia, H. Hybrid ANFIS-PSO approach for predicting optimum parameters of a protective spur dike. Appl. Soft Comput. 2015, 30, 642–649. [Google Scholar] [CrossRef]
  60. Bui, K.T.T.; Bui, D.T.; Zou, J.G.; Van Doan, C.; Revhaug, I. A novel hybrid artificial intelligent approach based on neural fuzzy inference model and particle swarm optimization for horizontal displacement modeling of hydropower dam. Neural Comput. Appl. 2018, 29, 1495–1506. [Google Scholar] [CrossRef]
  61. Shahnazar, A.; Rad, H.N.; Hasanipanah, M.; Tahir, M.M.; Armaghani, D.J.; Ghoroqi, M. A new developed approach for the prediction of ground vibration using a hybrid PSO-optimized ANFIS-based model. Environ. Earth Sci. 2017, 76, 527. [Google Scholar] [CrossRef]
  62. Boussaïd, I.; Lepagnot, J.; Siarry, P. A survey on optimization metaheuristics. Inf. Sci. 2013, 237, 82–117. [Google Scholar] [CrossRef]
  63. Tang, K.S.; Man, K.F.; Kwong, S.; He, Q. Genetic algorithms and their applications. IEEE Sig. Proc. Mag. 1996, 13, 22–37. [Google Scholar] [CrossRef]
  64. Marco, D.; Mauro, B.; Thomas, S. Ant colony optimization. IEEE Comput. Intell. Mag. 2007, 1, 28–39. [Google Scholar]
  65. Storn, R.; Price, K. Differential evolution–a simple and efficient heuristic for global optimization over continuous spaces. J. Glob. Optim. 1997, 11, 341–359. [Google Scholar] [CrossRef]
  66. Kennedy, J.; Eberhart, R.C. Particle swarm optimization. In Proceedings of the International Conference on Neural Networks, Perth, Australia, 27 November–1 December 1995; pp. 1942–1948. [Google Scholar] [CrossRef]
  67. Song, S.; Kong, L.; Gan, Y.; Su, R. Hybrid particle swarm cooperative optimization algorithm and its application to MBC in alumina production. Prog. Nat. Sci. 2008, 18, 1423–1428. [Google Scholar] [CrossRef]
  68. Momeni, E.; Armaghani, D.J.; Hajihassani, M.; Amin, M.F.M. Prediction of uniaxial compressive strength of rock samples using hybrid particle swarm optimization-based artificial neural networks. Measurement 2015, 60, 50–63. [Google Scholar] [CrossRef]
  69. Chatterjee, S.; Sarkar, S.; Hore, S.; Dey, N.; Ashour, A.S.; Balas, V.E. Particle swarm optimization trained neural network for structural failure prediction of multistoried RC buildings. Neural Comput. Appl. 2017, 28, 2005–2016. [Google Scholar] [CrossRef]
  70. Wang, D.; Tan, D.; Liu, L. Particle swarm optimization algorithm: An overview. Soft Comput. 2018, 22, 387–408. [Google Scholar] [CrossRef]
  71. Rini, D.P.; Shamsuddin, S.M.; Yuhaniz, S.S. Particle swarm optimization for ANFIS interpretability and accuracy. Soft Comput. 2016, 20, 251–262. [Google Scholar] [CrossRef]
  72. Shi, Y.; Eberhart, R. A modified particle swarm optimizer. In Proceedings of the IEEE World Congress on Computational Intelligence, Anchorage, Alaska, 4–9 May 1998; pp. 69–73. [Google Scholar] [CrossRef]
Figure 1. Classical basalt tectonic discrimination diagrams: (a) diagram of Ti-Zr-Y, (b) diagram of Ti-Zr, (c) diagram of Zr/Y-Zr, (d) diagram of FeOT-MgO-Al2O3 and (e) diagram of TiO2-MnO-P2O5. Abbreviations: WPB—within plate basalt; CAB—calc-alkali basalt; CB—continental basalt; SCIB—spread center island basalt; OB—orogenic basalt; OIAB—oceanic island alkali basalt.
Minerals 09 00376 g001aMinerals 09 00376 g001b
Figure 2. General architecture of the neural fuzzy inference system (NFIS) model.
Minerals 09 00376 g002
Figure 3. Architecture description of the proposed hybrid swarm optimized neural fuzzy inference system (SONFIS) method for tectonic discrimination of basalts.
Minerals 09 00376 g003
Figure 4. Global distribution map of basalt sample collection sites.
Minerals 09 00376 g004
Figure 5. K-fold cross-validation technique.
Minerals 09 00376 g005
Figure 6. Confusion matrix visualization of tectonic discrimination of basalts in dataset 1 based on different MLAs: (a) logistic regression classifier (LRC); (b) naïve Bayes (NB); (c) multilayer perceptron (MLP); (d) support vector machine (SVM); (e) random forest (RF) and (f) SONFIS.
Minerals 09 00376 g006
Figure 7. Confusion matrix visualization of tectonic discrimination of basalts in dataset 2 based on different MLAs: (a) logistic regression classifier (LRC); (b) naïve Bayes (NB); (c) multilayer perceptron (MLP); (d) support vector machine (SVM); (e) random forest (RF) and (f) SONFIS.
Minerals 09 00376 g007aMinerals 09 00376 g007b
Table 1. A summary of ML models and application scenarios in a few cases.
AuthorsMLAsRock TypesTectonic Settings
Vermeesch [1]CTBasaltMOR, OI and IA
Petrelli and Perugini [40]SVMVolcanic rocksCA, IA, IOA, BAB, CF, MOR, OP and OI
Liu and Liu [3]SVM and DTBasaltCP and PF
Ueki et al. [8]SVM, RF and SMRVolcanic rocksCA, IA, IOA, BAB, CF, MOR, OP and OI
Han et al. [53]NB, KNN, SVM and RFBasaltMOR, OI and IA
Jiao et al. [54]SVM, KNN and RFGabbroCF, CM, IV and OI
Abbreviations: MOR—mid-ocean ridge; OI—ocean island; IA—island arc; CA—continental arc; IOA—intra-oceanic arc; BAB—back-arc basin; CF—continental flood; OP—oceanic plateau; CP—continental plateau; PF—plateau flood; CM—convergent margin; IV—intraplate volcanic.
Table 2. Basic statistics for dataset 1 with high-dimensional features.
No.ElementsMin.Max.MeanNo.ElementsMin.Max.Mean
1SiO236.5554.3049.1527V27.00622.00284.65
2TiO20.184.911.8128Cr0.003700.00246.80
3Al2O38.5226.1615.7129Co10.00460.0045.83
4Fe2O30.0019.334.2530Ni0.00900.00120.27
5FeOT1.2415.117.6131Cu5.006001.00112.14
6CaO0.3514.8110.5432Zn28.70441.0095.77
7MgO1.5722.607.3933Ga9.0048.0018.96
8MnO0.0119.000.2034Rb0.00116.7315.14
9K2O0.029.680.7035Sr6.681590.00385.88
10Na2O0.745.952.7036Y7.00296.0030.86
11P2O50.012.350.2937Zr0.00988.30145.80
12La0.00317.0017.0938Nb0.00130.0019.17
13Ce0.00420.0036.8539Sn0.4512.002.00
14Pr0.3626.205.8640Cs0.005.000.32
15Nd0.00780.0021.3641Ba1.301088.00219.33
16Sm0.52923.006.8242Hf0.1121.903.69
17Eu0.20288.002.2343Ta0.016.801.23
18Gd1.0343.605.5244Pb0.0047.003.89
19Tb0.1028.300.9745Th0.0027.002.47
20Dy0.00594.007.9346U0.006.200.74
21Ho0.296.101.0147143Nd/144Nd0.500.520.51
22Er0.80259.003.584887Sr/86Sr0.700.710.70
23Tm0.112.800.4849206Pb/204Pb17.0838.4618.93
24Yb0.26193.003.3850207Pb/204Pb15.3915.8315.56
25Lu0.04243.000.9451208Pb/204Pb18.8340.1738.29
26Sc0.0088.0034.95
The unit of the major element concentration is wt%, and so is the minimum, maximum and mean. Moreover, the unit of the minor and trace element concentration is ppm, and so is the minimum, maximum and mean.
Table 3. Basic statistics for dataset 2 with low-dimensional features.
ElementsMORBOIBIAB
Min.Max.MeanMin.Max.MeanMin.Max.Mean
K2O0.010.050.020.000.380.030.000.090.01
CaO0.100.540.310.020.580.310.010.660.21
SiO229.9341.8540.1234.7142.4339.7127.3242.9339.01
MgO36.4351.3046.6423.6451.7145.4725.2452.6642.65
NiO0.010.440.200.010.430.220.000.550.16
Na2O0.010.100.020.000.530.140.000.210.02
FeOT7.7223.9012.597.5842.3314.287.1137.3517.18
TiO20.010.110.030.000.190.030.000.210.03
Al2O30.010.550.060.000.950.090.000.940.06
MnO0.010.530.200.030.730.210.080.760.27
Cr2O30.010.210.060.000.230.050.000.290.04
P2O50.010.140.070.010.100.030.000.120.02
The unit of the element concentration is wt%, and so is the minimum, maximum and mean.
Table 4. Classification accuracy of tectonic discrimination of basalts in dataset 1 based on six MLAs.
Tectonic SettingsTraining SetTest SetClassification Accuracy (%)
LRCNBMLPSVMRFSONFIS
MORB2395791.2382.4685.9691.2391.2392.98
OIB2625787.7284.2198.2591.2396.4998.25
IAB2497489.1993.2489.1993.2495.9595.95
Total75018889.3687.2390.9692.0294.6895.74
Marked in italics and bold denotes the classification accuracy of the best classifier for different tectonic settings.
Table 5. Classification accuracy of tectonic discrimination of basalts in dataset 2 based on six MLAs.
Tectonic SettingsTraining SetTest SetClassification Accuracy (%)
LRCNBMLPSVMRFSONFIS
MORB42411574.7890.4385.2284.3582.6196.52
OIB3748955.0641.5788.7629.2185.3994.38
IAB46811285.7175.8990.1887.5092.8697.32
Total126631673.1071.5287.9769.9487.2896.20
Marked in italics and bold denotes the classification accuracy of the best classifier for different tectonic settings.

