Article

Comparison of Methods for Determining the Thresholds of Geochemical Anomalies and the Prospecting Direction—A Case of Gold Deposits in the Gouli Exploration Area, Qinghai Province

1
Faculty of Earth Resources, China University of Geosciences, Wuhan 430074, China
2
Shandong Zhaojin Technology Co., Ltd., Yantai 265400, China
*
Author to whom correspondence should be addressed.
Minerals 2019, 9(6), 368; https://doi.org/10.3390/min9060368
Submission received: 4 April 2019 / Revised: 3 June 2019 / Accepted: 10 June 2019 / Published: 18 June 2019

Abstract

:
Geochemical anomalies play an important role in mineral exploration, because they are closely related to the formation of ore deposits. In this paper, the Au in the geochemical samples of 1:50,000 stream sediments in the Gouli exploration area, Qinghai Province, is selected as an example. The cumulative frequency method, local singularity analysis, and exploration data analysis method are used to process the Au data and determine the abnormal thresholds. Robust principal component analysis is used to explore the elemental associations. Among them, the effect of local singularity analysis is the best and it delineates the weak geochemical anomalies not delineated by cumulative frequency method and exploration data analysis method, which shows its superiority. Robust principal component analysis shows that Sb, W, and As are closely related to Au mineralization. Three anomalous areas are delineated in the Gouli exploration area. Gold ore-body is found to occur within anomaly area I. The other anomalous areas are highly consistent with abnormal elemental composition of Sb, W, and As. Moreover, these two areas are extremely conformable with the high-value areas determined by the binary state method. The optimality of the three methods are compared comprehensively, it is pointed out that it is more reasonable to use the local singularity analysis to determine the abnormal threshold. The anomaly areas II and III of Au determined by local singularity analysis have shown great potential for prospecting.

1. Introduction

At the International Conference in Sydney in 1976, the abnormal threshold was defined as a value determined by the geochemical makers according to some analysis and test results of samples. It can identify the anomalies associated with the mineralization. A general definition of abnormal threshold was put forward as the value that can distinguish abnormal and non-abnormal data. The determination of the threshold of geochemical anomalies is directly related to the identification of mineralization information. Therefore, the determination of the threshold of geochemical anomalies is very significant for mineral exploration.
Since the 1970s, many countries in the world have carried out regional geochemical surveys successively and obtained primary and secondary samples, such as rocks, stream sediments, water, and soil. Results from primary and secondary samples are used to produce multi-element geochemical data covering a wide area, which provide important geochemical data for mineral resources exploration and environmental assessment. With the decrease of anomaly intensity, the element anomalies of concealed ore-bodies become more important. At present, the study of geochemical anomalies has gradually turned to weak geochemical anomalies [1,2,3,4,5].
Gold deposits in the Gouli exploration area were recently discovered, and the overall research level remains relatively low. The research methods are mainly based on mineral surveys. Ore mineralogy [6], metallogenic chronology [7,8,9], isotope geochemistry [10], and fluid inclusion [10] are used to analyze the genesis of gold deposits; the evaluation of the metallogenic potential of gold deposits is also based on regional tectonic setting and tectono-magmatic evolution processes [6], while the geochemical anomalies in the Gouli exploration area are seldom studied. Based on the geochemical anomalies of Au, this paper evaluates the gold metallogenic potential in the Gouli exploration area and delineates the gold metallogenic target areas.
There are many kinds of methods for determining the threshold of geochemical anomalies: the traditional statistical method [11], direct graphical method [12], geochemical section method [13], martensitic distance method [14], single element calculation [15], cumulative frequency method [16], local singularity analysis [4,17], exploration data analysis method [18], etc. However, the first five methods are mainly aimed at the geochemical data with normal distribution. The cumulative frequency method, local singularity analysis, and exploration data analysis method are applicable to the general data, without considering the influence of "outliers". After several processing and analyzing experiments, the three representative methods are selected.

2. Study Area and Data

2.1. Geological Settings

The Gouli exploration area is covered by grassland and is located in the South East part of the Eastern Kunlun tectonic belt (Eastern Kunlun Central Orogenic Belt) and between latitudes 35°40′24″ N and 35°48′36″ N and between longitudes 98°37′30″ E and 98°48′45″ E (Figure 1C). Since the Phanerozoic eons, there have been two major tectonic movements in the region, namely, the early Paleozoic Caledonian movement (the original Tethys evolution), Late Paleozoic, and the early Mesozoic Paleotethys evolution.
The Gouli area is located between the Kunzhong fault and Kunbei fault, which is mainly restricted by the Kunzhong and Kunbei fault zones (Figure 1A,B). The structural deformation is intense and fault structures have developed. The structures in the mining area are mainly NE-extending faults of different grades and sequences, followed by NW-extending and nearly EW-extending faults with genetic connection, and a few SN- extending and NNW-extending faults (Figure 1C). The NE-extending faults are mainly compressive or compressive-torsional faults, which constitute the main faults and are characterized by episodic activities. These faults control the distribution direction of strata and magmatic rocks in the area. Results of LA-ICP-MS (Laser Ablation Inductively Coupled Plasma Mass Spectrometry) zircon U-Pb isotope dating of the study area conducted at Wuhan Sample Solution Analytical Technology Co. Ltd., gives 230 ± 1.2 Ma for monzonite granite, and 210 ± 2 Ma for syenite granite. The formation ages of the rock masses are basically the same as that of the gold deposits in Eastern Kunlun (250–205 Ma) [10,19,20,21]. Hence, it is presumed that the fault structure may be genetically related to gold and polymetallic mineralization.
In addition to the Holocene alluvial deposits and residual slope deposits, the strata exposed in the mining area are mainly schist, gneiss, amphibolite, and marble of the Jinshuikou Group. Magmatic rocks are well developed in the mining area. The intrusive rocks are mainly syenite granite and monzonite granite, as well as some granodiorite and plagioclase granite. Ultrabasic dikes, diorite porphyrites dikes, and quartz veins are occasionally exposed. Most of the rock masses and dikes in this area are developed in the gneiss of Jinshuikou Group, and have intrusive contact and fault contact with the gneiss (Figure 1C).
The Yelonggou and the Gazhima gold deposits are both located in the strata of the Jinshuikou Group and in a fault structural system (Figure 1C). According to mining data in the area, the contents of Au in all rock types of Jinshuikou Group are 2–3 times higher than the average crustal value, and the abundance of Au in granite is higher, which provides fluid and some material sources for gold mineralization [22,23].

2.2. Data Sources and Eigenvalues Statistics

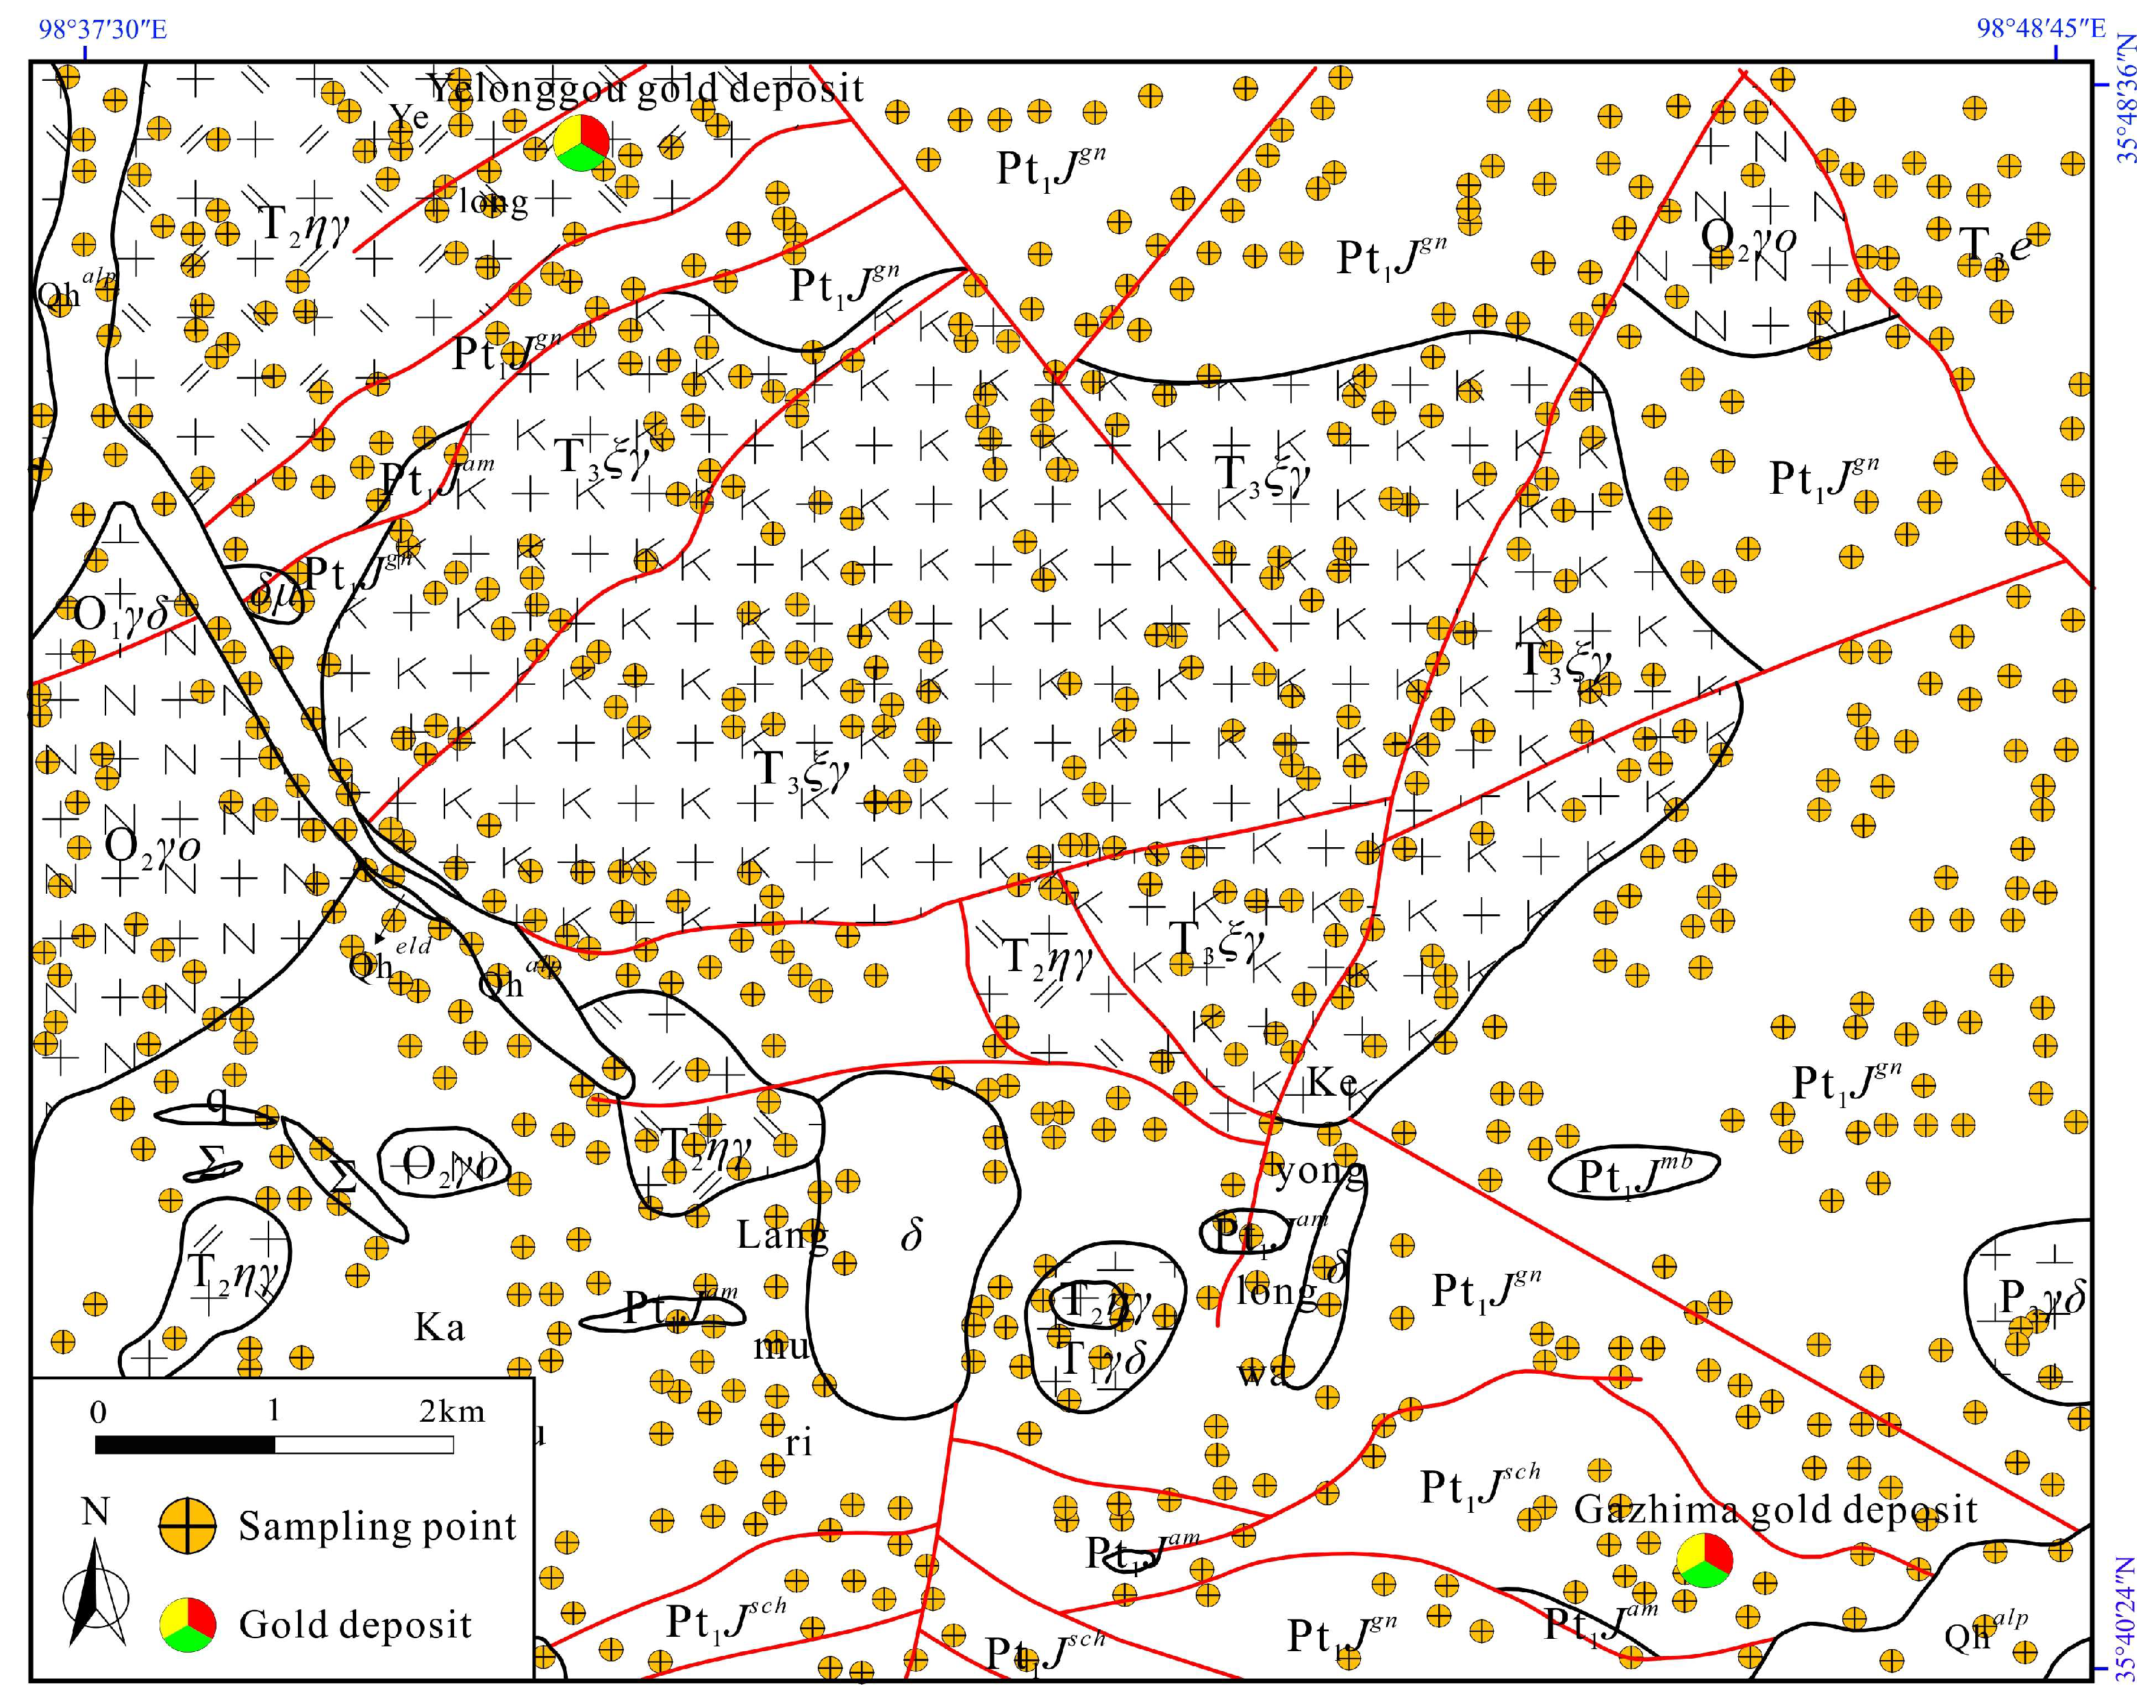
The 764 samples collected in the regional geochemical survey were 1:50,000 stream sediment geochemical analysis samples from an area of 125 km2 (Figure 2). Au, Ag, Cu, Cr, As, Sb, Ni, Zn, and other elements were analyzed in Hebei Institute of regional geology and Mineral Resources Research Laboratory (Hebei, China). The concentrations of Au were tested by graphite furnace-atomic absorption spectrometry (GF-AAS) [24,25]. The concentrations of Ag were tested by emission spectrometry (ES). The concentrations of Cu, Cr, Ni, and Zn were tested by X-ray fluorescence (XRF) [26]. The concentrations of As and Sb were tested by hydride generation-atomic fluorescence spectrometry (HG-AFS).
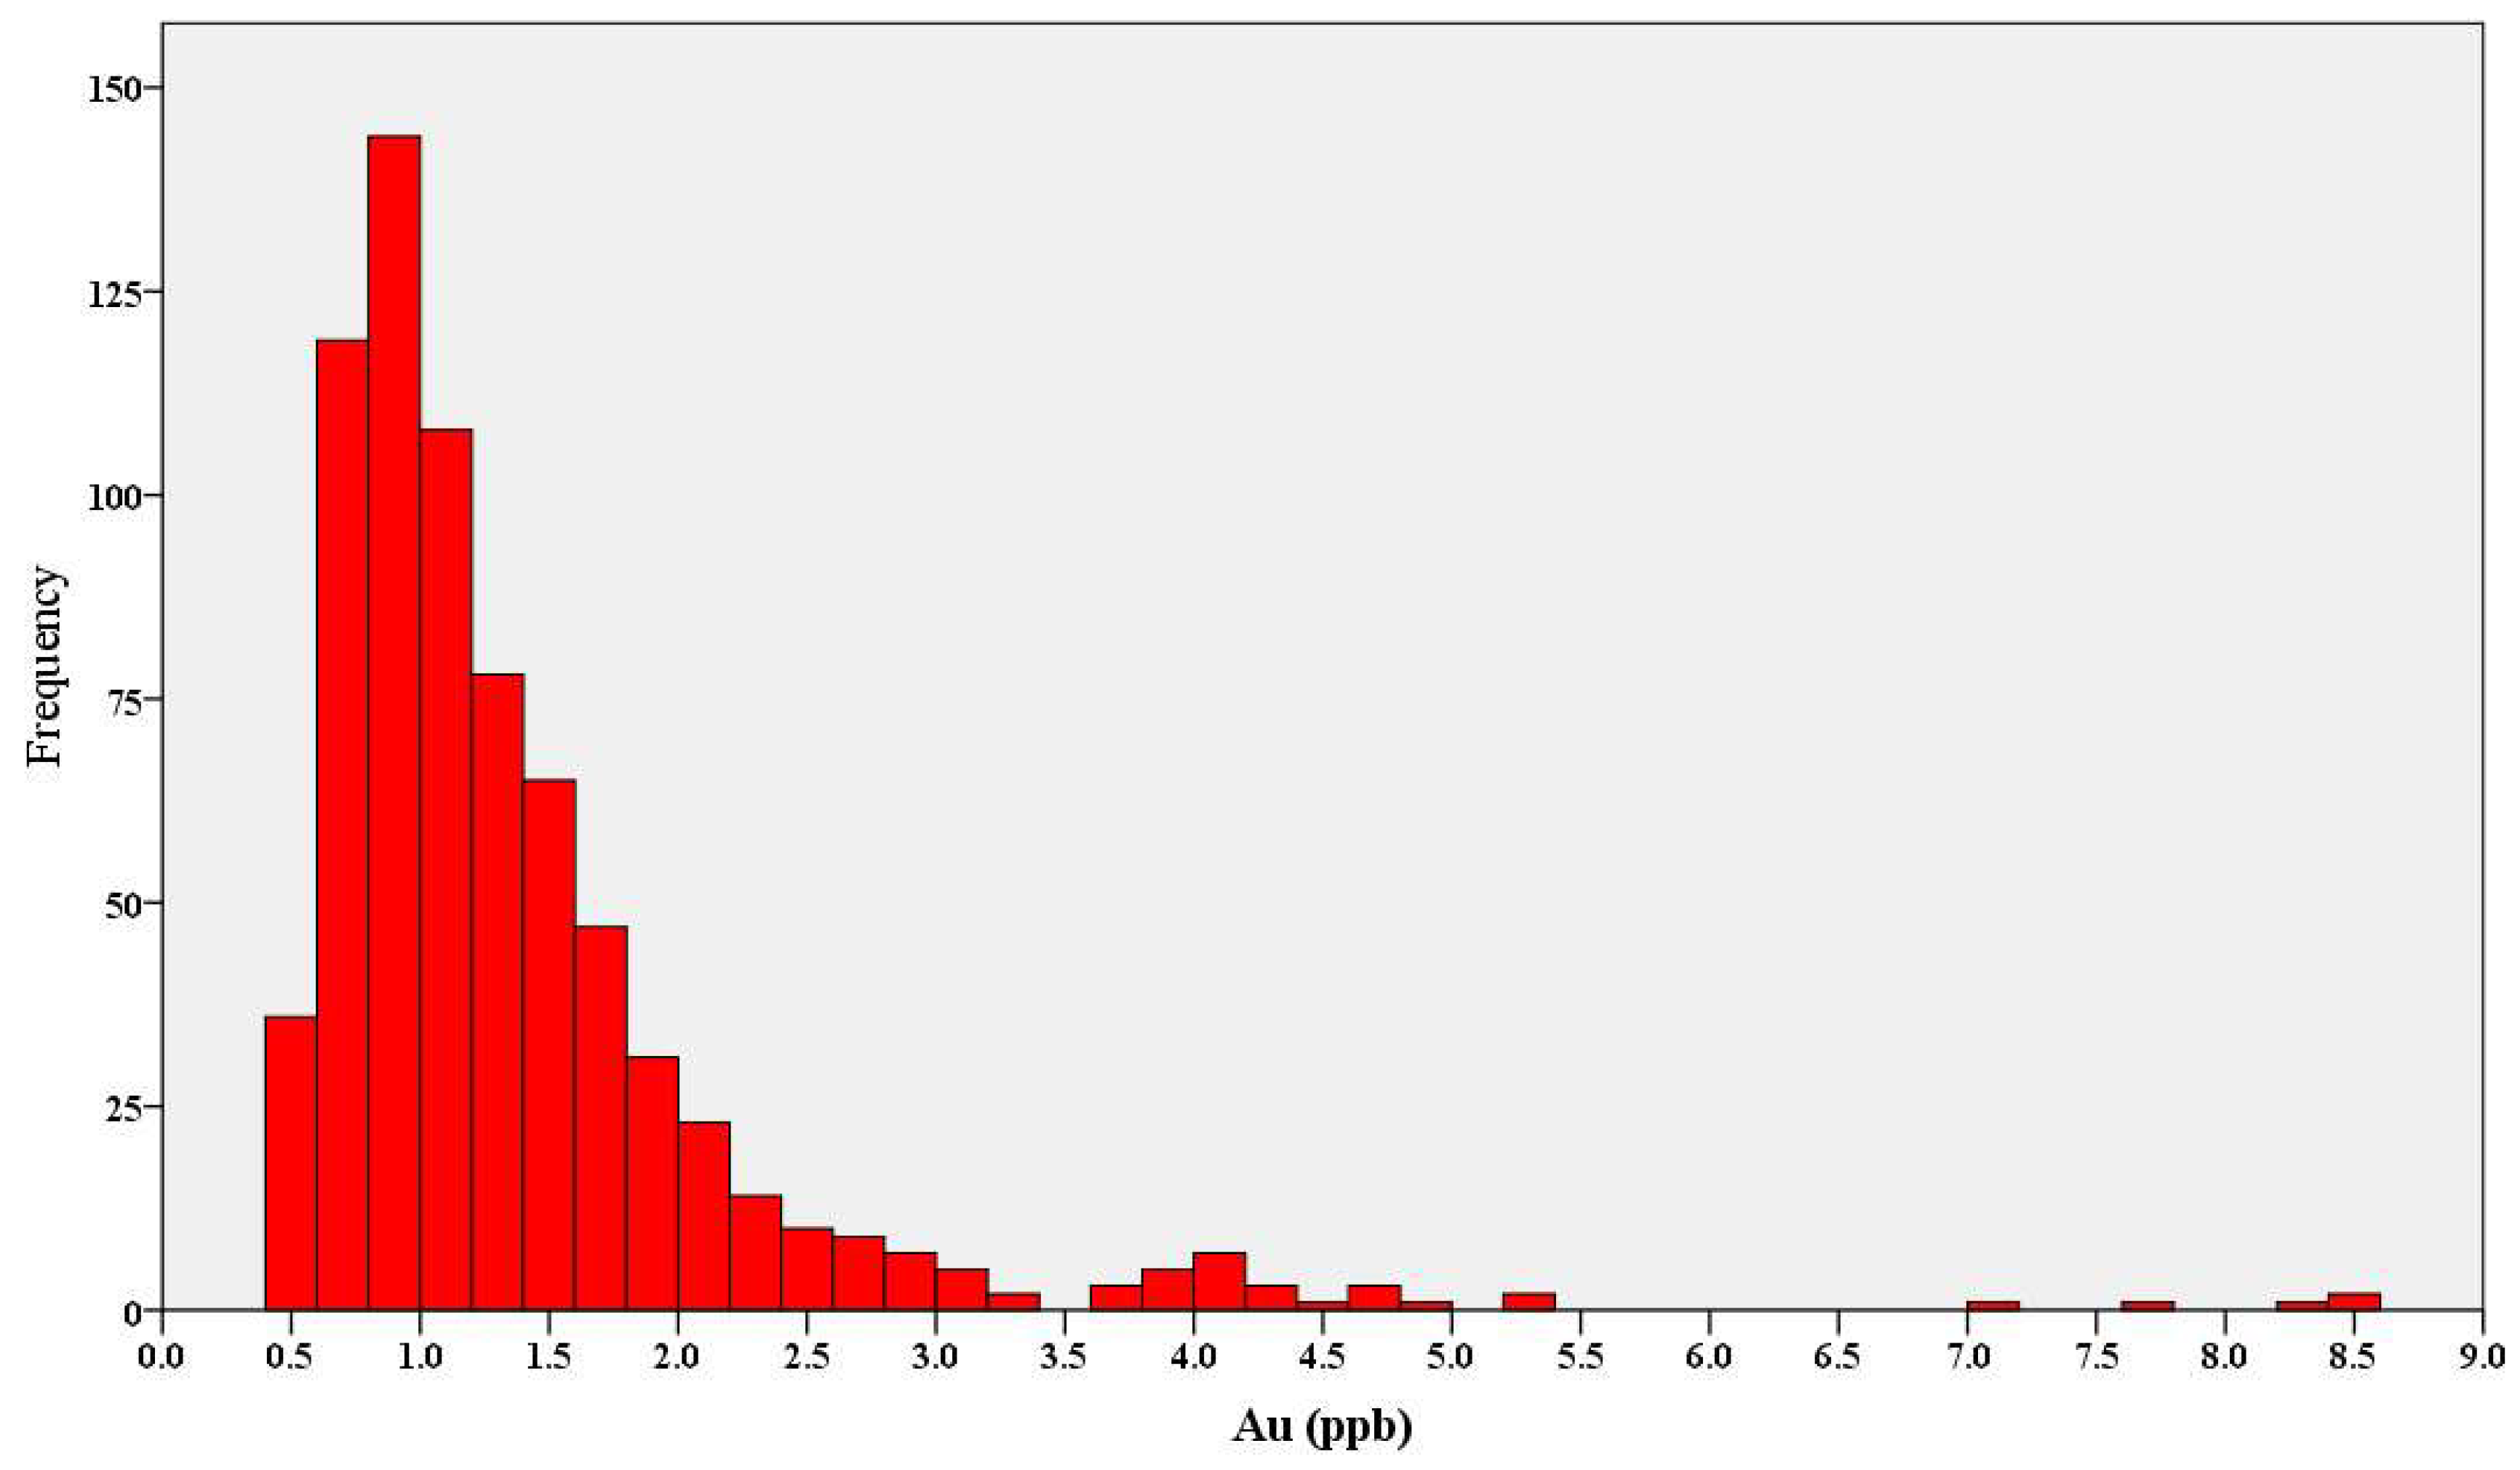
The estimated range of the concentrations of Au in the study area is shown in Figure 3. The majority of the samples yielded low concentration of Au, while smaller portion are characterized by relatively high concentration. In general, the maximum concentration of Au recorded in the study area is 8.5 ppb, and the minimum concentration is 0.5 ppb.
According to the above geological characteristics of the mining area, the eigenvalues of stratigraphic units and intrusive rocks of different ages in the study area are statistically analyzed respectively (Table 1). We know that the closer the skewness is to 0, the closer the kurtosis is to 3, then the closer the distribution of the data is to normal distribution. It can be seen from Table 1 that the distribution of Au in the study area does not conform to normal distribution. The characteristic distributions of the whole area are closer to those of Triassic intrusive rocks and Jinshuikou Group strata. Therefore, it is reasonable to use the uniform abnormal threshold in the study area.

3. Methods

This paper mainly presents statistics on the spatial distribution of Au anomalies in the Gouli exploration area. We know that the spatial distribution of Au must be influenced by strata, structures, magmatic rocks, and other ore-controlling factors. From the above, we can see that the enrichment of Au in strata of the Jinshuikou Group is beneficial to the enrichment of Au. The role of structures and magmatic rocks are also significant to Au enrichment. In other words, the more developed the strata of the Jinshuikou Group, the structures, and the magmatic rocks are, the more enriched the distribution of Au is. Au enrichment must be accompanied by associated elements of enrichment. In this paper, the cumulative frequency method, local singularity analysis, and exploration data analysis method are used to analyze the spatial distribution of Au, and robust principal component analysis is used to analyze the Au and its associated elements.

3.1. Cumulative Frequency Method

The method of cumulative frequency sorts a group of data in order from small to large, and takes the part of the data at the top of the element as the abnormal part to research. The determination of the top data ratio is based on the geological characteristics of the study area and the results of previous comprehensive research on the characteristics of the study area, such as geophysics, geochemistry, remote sensing, and other characteristics of the study area; the top data ratio is generally 85% [27,28,29]. Geochemical exploration practice shows that the concentrations of geochemical elements in the crust or in a geological body are randomly distributed. To accurately describe this set of random variables, according to the relevant theories of probability theory and mathematical statistics, the probability distribution function can be obtained; that is, the relationship between the element concentration and its corresponding probability is:
F ( x ) = p ( c x ) = x f ( c ) dc
In Equation (1), f ( x ) is the probability density function, and p ( c x ) is the probability that the concentration is less than or equal to a certain value x. One of the premises of using the statistical integral method is that F ( x ) exists for any element of any geological body, that is, f ( x ) is integrable for any element of any geological body. Because the distribution of geochemical elements is random, the expression of f ( c ) is determined by the specific distribution of elements.
If the distribution of geochemical data obeys normal distribution, its probability density function is:
f ( x ) = 1 2 π σ e ( x μ ) 2 2 σ 2
Therefore, the probability distribution function of this element can be expressed as:
F ( x ) = p ( c x ) = x 1 2 π σ e ( c μ ) 2 2 σ 2 dc
In Equations (2) and (3), μ is the expected value of the element (i.e., the average) and σ is the standard deviation of the element. The element concentration corresponding to the cumulative frequency of the element can be obtained by integral calculus with Equation (3), that is, the abnormal threshold value of the element is determined by the cumulative frequency method. The equations for calculating μ and σ are:
μ = 1 n i = 1 n x i = x ¯
σ = 1 n 1 i = 1 n ( x i x ¯ ) 2
In Equations (4) and (5), n represents the number of elements, and x ¯ represents the average number of elements.
It is convenient to use probability theory and mathematical statistics for geochemical data with normal distribution, but it is not suitable for geochemical data with general distribution. This is mainly because the integral function form is not well defined, and the integration process is also very complicated. According to Table 1, the distribution of Au in this study area does not obey normal distribution, so it is not suitable for integral calculus. In this paper, we will use the C program to determine the abnormal threshold of the Au; the code can be found in the Appendix A.

3.2. Local Singularity Analysis

The essences of fractal geometry are self-similarity and scale-invariance. Self-similarity refers to the statistical similarity between parts and the whole in shape, function, information, structure, and other aspects; Scale-invariance refers to enlarging or reducing the size appropriately without altering the structure of the object [30]. In the field of geology, fractal application has been very extensive, for example, Sanderson et al. [31] studied the fractal relationship between the thickness and grade of the La Codosera gold deposit vein in Spain. In china, Ding et al. [32] studied the fractal distribution of gold deposits, while Shi et al. [33] studied the continuous multi-fractal distribution model of geochemical fields. In this study, the authors will take the local singularity analysis in a multi-fractal analysis as an example.
The local singularity analysis is an important progress for fractal or multi-fractal modeling of geochemical data [4]. It is defined as the characterization of the anomalous behaviors of singular physical processes that often result in anomalous amounts of energy release or material accumulation within a narrow spatio-temporal interval [1,34,35,36]. The singularity can be estimated from observed element concentration within small neighborhoods based on the following equation:
X = c × r α E
where X represents element concentrations, c is a constant value, α is the singularity, r is a normalized distance measure, such as block cell edge, and E is the Euclidian dimension [37]. The window-based method can be used to estimate the singularity index α [1,34,35,36] based on either raw point geochemical data or raster maps using the following steps: (1) define a set of sliding squares (or other shapes) windows A ( r ) with variable window sizes, r min =   < r 1 < r 2 < < r n = r max , and calculate the average concentration C [ A ( r i ) ] for each window size for a given location on the map, where C [ A ( r i ) ] is equal to the sum of all the cell concentrations divided by the total number of cells within the window; (2) plot the pair data set of C [ A ( r i ) ] ( i = 1 , 2 , , n ), and r i in a log–log graph, and obtain the following linear relationship:
log C [ A ( r i ) ] = c + ( α 2 ) log ( r )
The value of α − 2 can be estimated from the slope of the fitted straight line; in step (3), perform a similar procedure to all other locations on the geochemical map. For a geochemical map, most of the areas are linked with a singularity value α close to 2, representing a normal background, whereas the areas with α > 2 or α < 2 represent a depleted pattern and enrichment pattern of element concentrations, respectively [34]. In other words, if α > 2, it means that the element is depleted, if α < 2, it means that the element is highly enriched. The value of singularity index reflects the degree of local mineralization singularity and mineralization enrichment intensity. In the case of α < 2, when α is infinitely close to 2, the concentration at the same window as α is the abnormal threshold of the element.

3.3. Exploration Data Analysis Method

The exploration data analysis method [38] uses boxplot to interpret the distribution of data and determine the abnormal threshold [39]; this method does not require that the data (raw data, after processing of positive cosine, inverse cosine, or logarithm) obey normal distribution. As shown in Figure 4, five parameters (maximum, upper quartile, median, lower quartile, and minimum) are defined in the boxplot. These parameters can describe the important characteristics, structure, and distribution of the data [40]. The detailed method sorts the data from large to small in order to determine the maximum, minimum, lower quartile ( Q 1 ), median ( Q 2 ), and upper quartile ( Q 3 ). The internal divergence ( h s ), the upper limit of the abnormal points ( F l ), and the threshold of the abnormal points ( F u ) can be determined with the following Equations (8)–(10).
h s = | Q 3 Q 1 |
F l = Q 1 1.5 × h s
F u = Q 3 + 1.5 × h s
All data less than F l or greater than F u are outliers, in which above F u are called upper outliers (equivalent to positive anomaly), below F l are lower outliers (equivalent to negative anomaly); it can be seen from Equations (9) and (10) that the upper and lower outliers are determined only by the internal divergence, but are less affected by other factors.

3.4. Robust Principal Component Analysis

Robust Principal Component Analysis (RPCA) is a very effective method for identifying geochemical element assemblages. However, as typical compositional data, the closure effect of geochemical data may cause virtual correlation of the original data in the process of principal component analysis [41,42,43,44]. In order to weaken the influence of the closure effect, geochemical data need to be “opened” in pretreatment. At present, the main methods of “opening” data are the additive log-ratio (alr) [42], centered log-ratio (clr) [42], and isometric log-ratio (ilr) [45,46]. Carranza [46] compares in detail the application effects of the above three methods in the delineation of geochemical anomalies in stream sediments. Because the denominator selection of the alr-transformation is artificial, the sum of all variables after clr-transformation is zero [46,47,48] and the resulting data are collinear, so alr-transformation and clr-transformation are not suitable for robust statistics but ilr-transformation is. The ilr-transformation solves the problem of data collinearity resulting from the clr-transformation, while preserving all its advantages, such as isometry between the simplex and real space [45]. Even so, the dimensions of data are reduced by one dimension after ilr-transformation, so it is difficult to interpret the results of ilr-transformation. The problem of data interpretation is solved by using ilr-transformation to transform the compositional data into the European space, combining with the loadings and scores, and then transforming the loadings and scores into the clr space to get the connection with the original data [49]. The results of RPCA are presented in a compositional biplot to present loadings (representing information of variables) and scores (representing information of observations). The scores of RPCA are interpreted to reflect the presence of mineralization.

4. Results

4.1. The Results Processed by Cumulative Frequency Method, Local Singularity Analysis and Exploration Data Analysis Method

The three methods mentioned above show that the abnormal threshold of Au determined by local singularity analysis is the smallest, followed by cumulative frequency method, as shown in Table 2.
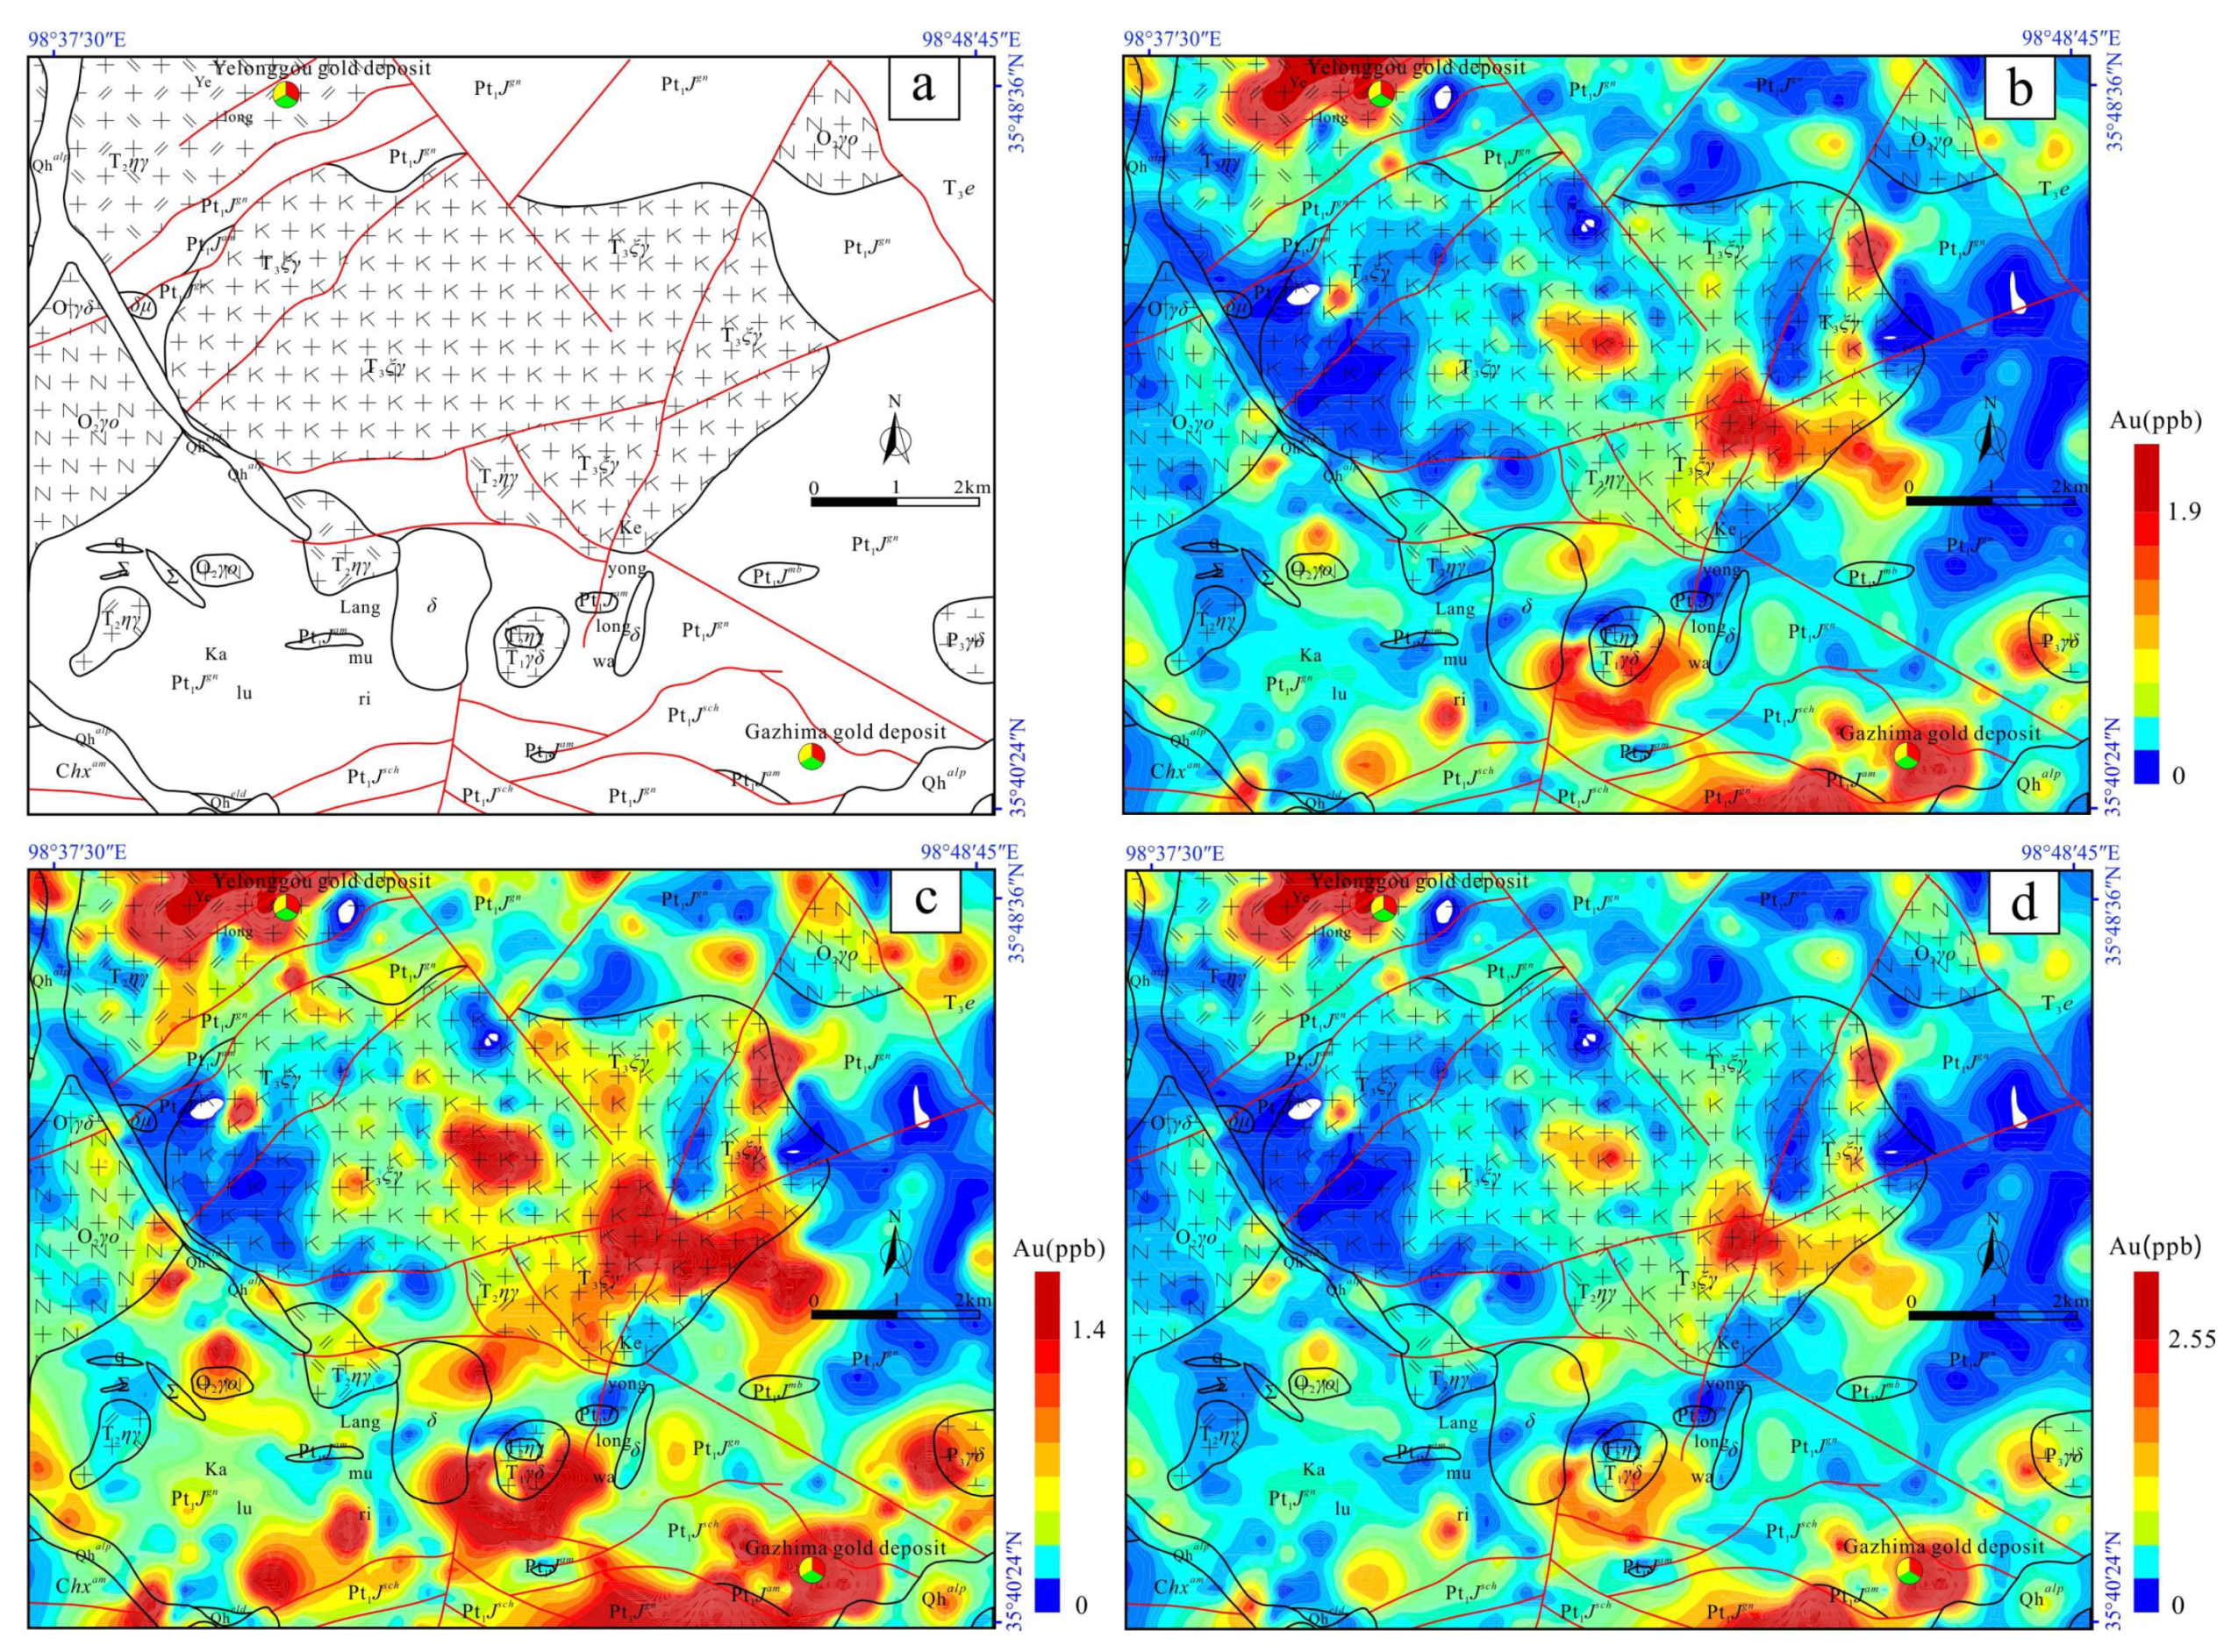
From Table 2, we can see that the gold deposits of the Gouli exploration area in Qinghai Province mainly occur in the Triassic intrusive rocks and Jinshuikou Group strata. According to the abnormal thresholds of Au determined by the above three methods, abnormal isoline graphs are drawn by Surfer software and superimposed on mineral geological maps, as shown in Figure 5.

4.2. The Results Processed by RPCA

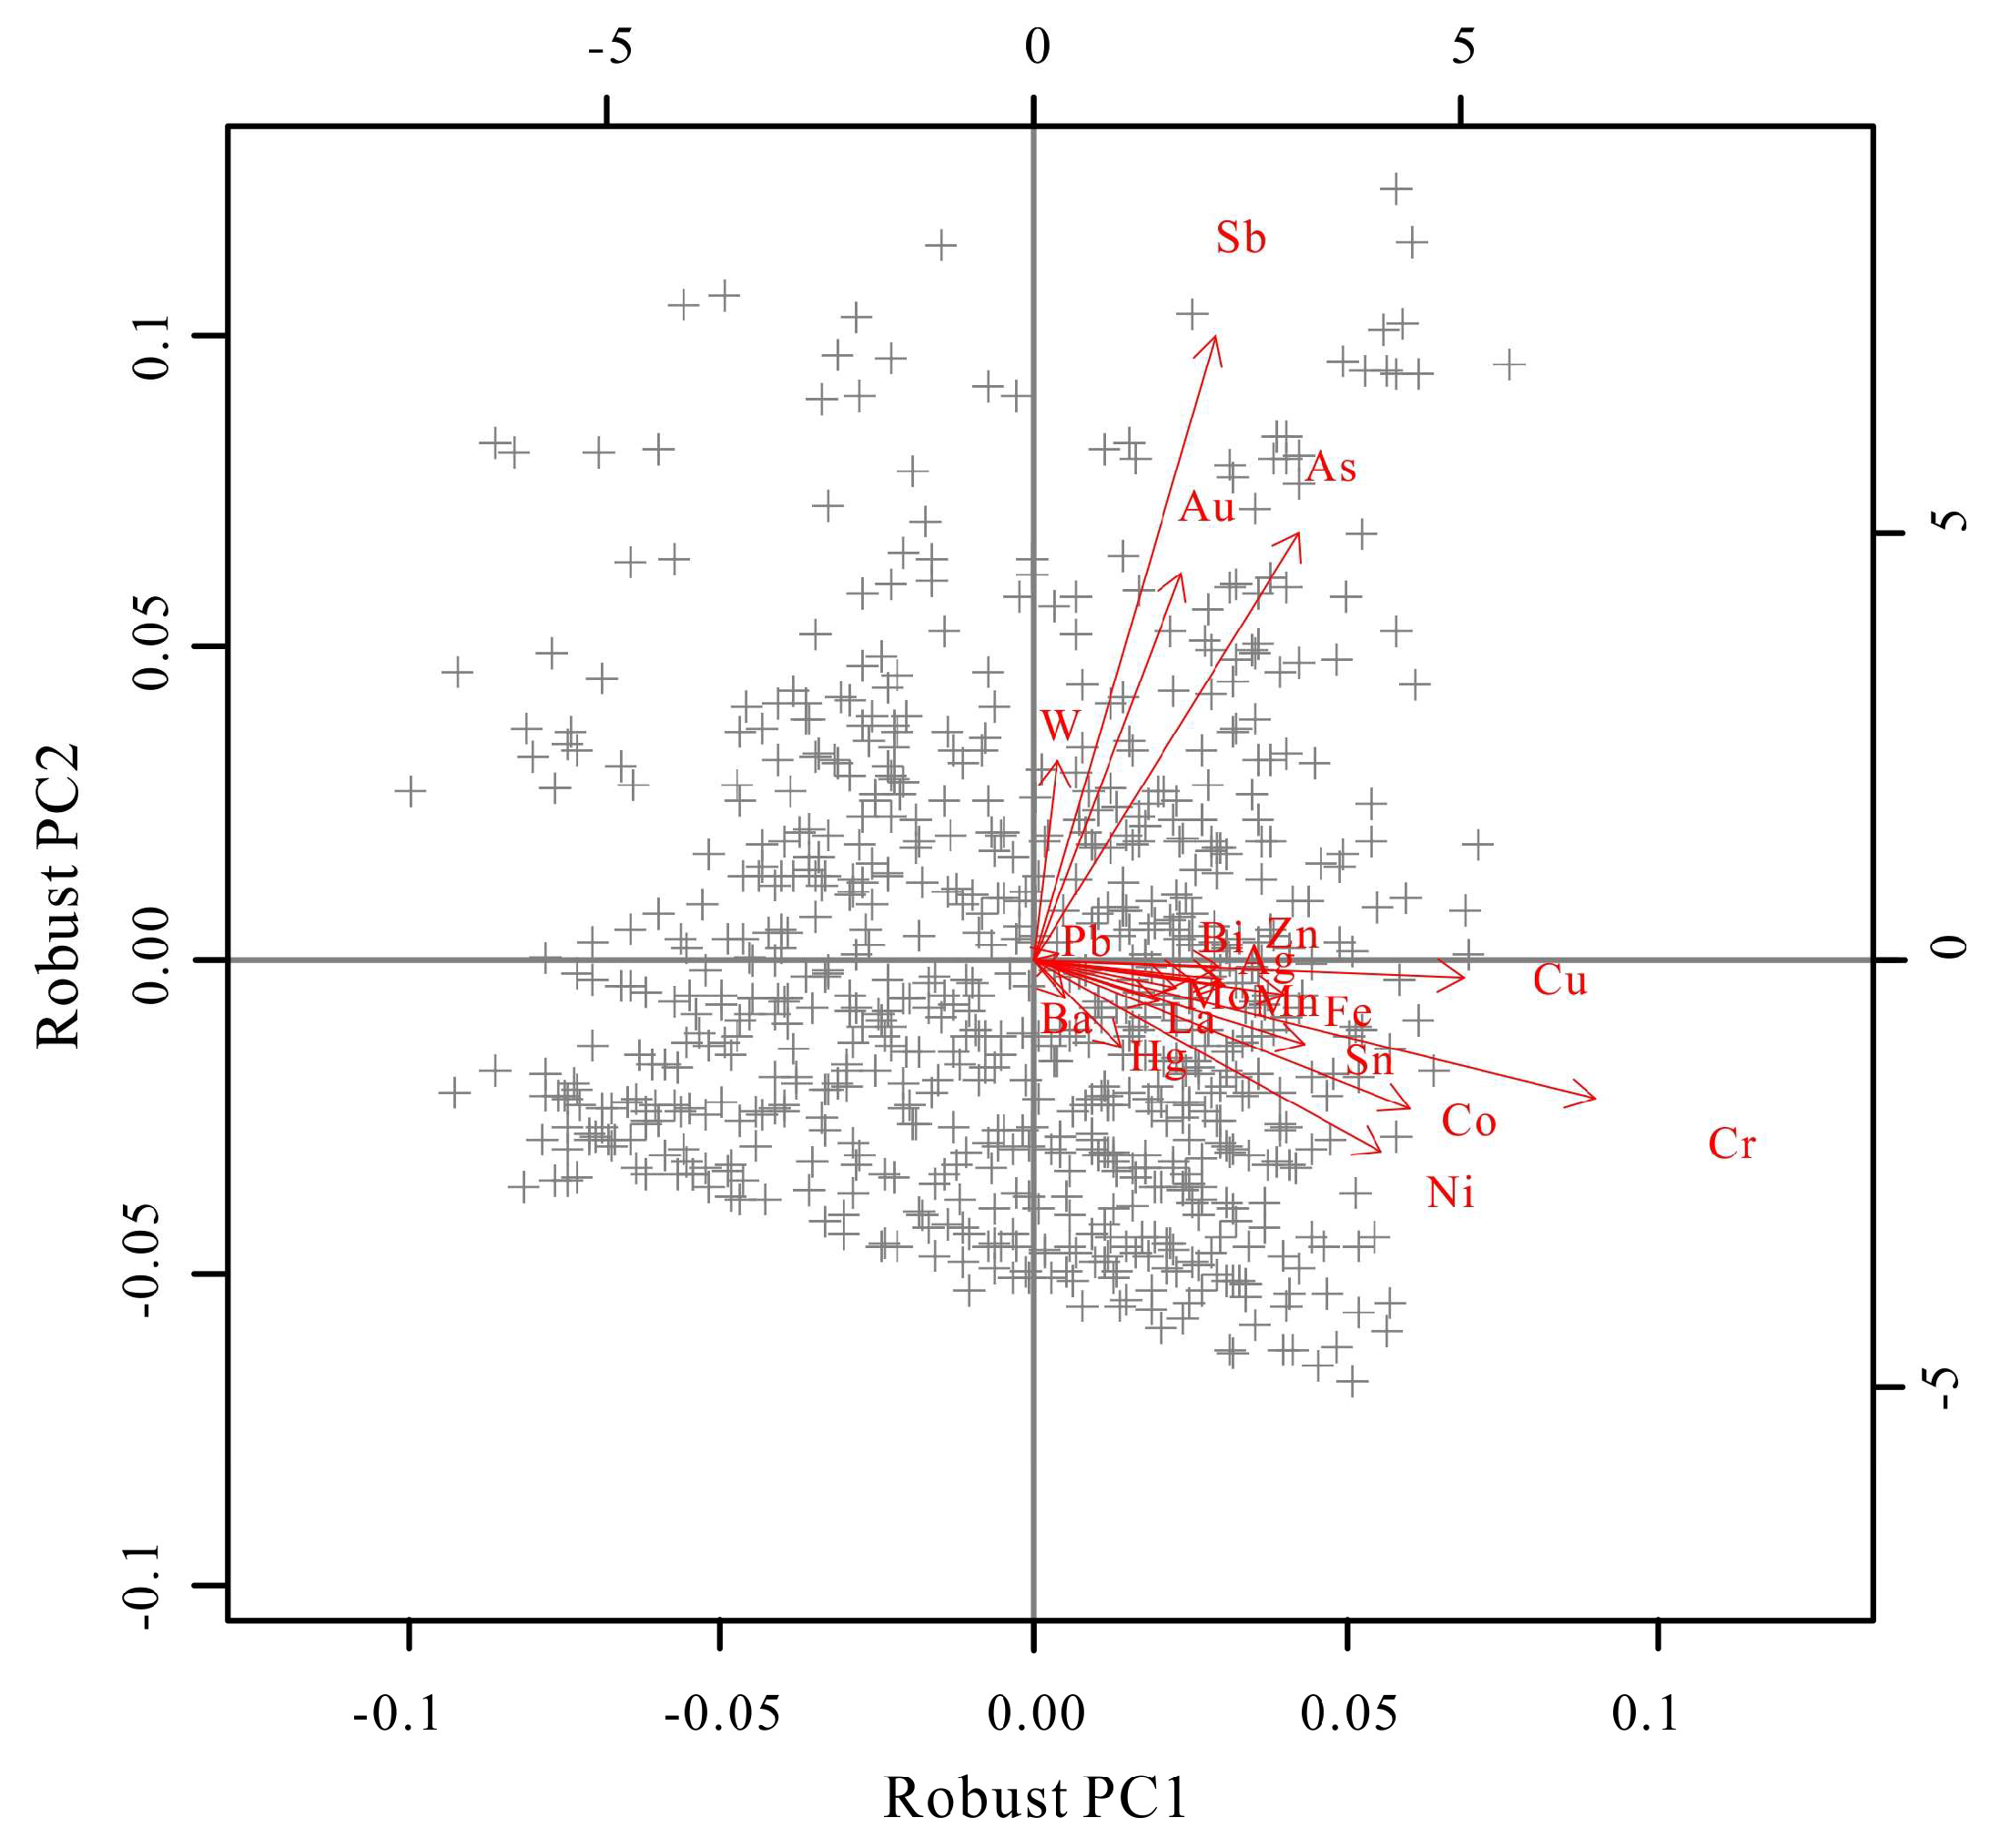
The results of RPCA for clr-transformed regional geochemical data were used to explore the elemental associations. The resulting loadings were visualized graphically in a biplot (Figure 6). The first group from the loadings of PC1 consists of Zn, Cu, Co, Cr, Ba, Pb, Fe, Hg, Mo, Mn, Bi, Sn, La, Ag, and Ni, and the second group from the loadings of PC2 consists of As, Sb, Au, and W. As can be seen from Figure 6, the angle between Au and Sb is the smallest, followed by W and As, indicating that Au and Sb, W, and As have strong correlation.
RPCA is used to explore the elemental associations. Sb, W, and As are closely related to Au mineralization; in other words, Au, Sb, W, and As may have the same behavior in magmatic fluids. So Sb, W, and As are good geochemical indicators for tracing the Au mineralization in the Gouli exploration area, Qinghai Province. To identify the anomalies related to Au, Sb, W, and As, the singularity indices and the concentrations of Au, Sb, W, and As in the same window as the singularity index α are calculated by Geodas and Arcgis software (Table 3).

5. Discussion

5.1. Relationship between Fracture and Mineralization

It can be seen that the distribution of Au anomalies is closely related to faults when the spatial distribution of Au anomalies are superimposed on the geological map. Distribution of the Au anomaly areas in Figure 5b–d are beaded in the NE direction, consistent with the NE-extending main faults; the anomaly area of Yelonggou is consistent with the faults developed in the Middle Triassic monzonite granite, and the extension direction of the anomaly area of Gazhima is also consistent with the nearly EW-extending faults. The distribution directions of other minor anomaly areas are roughly the same as the extending of sub-faults. It can be concluded that the fault structures not only control the distribution direction of gold deposits, but also provide channels for the migration and enrichment of Au. The relationship between fault structure and gold deposits in the study area is indeed very close.
According to the data of the study area, during the Late Variscan-Indosinian orogenic period, successive activities (with the characteristics of strike-slip fault) took place along the fault zone (Figure 1A,B), accompanied by massive intrusion of rock-magma (Figure 1C), which made metallogenic fluids migrate along the fault zone system in large amounts and extract gold and other metallogenic materials of wall rocks along the way. When the gold-bearing fluid entered the ore-controlling and ore-hosting structure, the gold-bearing hydrothermal fluid and wall rocks underwent metasomatic alteration due to the regional thermodynamic action, which eventually led to the formation of the Yelonggou gold deposit. The Deep fault in the Kunzhong region controlled the regional mineralization (Figure 1B), the Kunzhong fault is the northern slope structural belt in the Caledonian period, while the Wahongshan-Hot Spring fault zone (Figure 1A) underwent multiple transformations and superimposed transformation of deformation at different tectonic levels later, accompanied by massive intrusion of rock-magma, which made metallogenic fluids migrate along the fault zone system in large amounts and extract gold and other metallogenic materials of wall rocks along the way. The ore-bearing fluid was transported to the ore-hosting site and precipitated to form the Gazhima gold deposit. Therefore, it can be concluded that the faults in the study area are mainly ore-hosting structures.

5.2. The Choice of the Optimal Solution Method

As can be seen from Figure 5b–d, the anomaly areas are mainly distributed in the Middle Triassic monzonite granite, Late Triassic syenite granite, and Jinshuikou Group strata. However, the anomaly areas delineated by the three methods are distinctly different in many aspects.
The abnormal threshold calculated by cumulative frequency method is 1.9 ppb. The abnormal thresholds of elements delineated by accumulative frequency method have certain artificiality and empiricism. This mainly relies on the content of sampling elements to be sorted, which is more practical in the case of simple geological conditions, but less practical in areas with very complex geological conditions.
The area delineated by exploration data analysis method is the largest (the abnormal threshold is 2.55 ppb), and many abnormal areas have been left out. The anomaly shapes are scattered and not continuous, and the shapes are small-scale block distributions. The concentrations of most elements in the study area are regarded as background values. This is because exploration data analysis method does not require data to obey normal distribution or lognormal distribution from the structure of data itself. It can resist the influence of ultra-high and ultra-low values. However, when geochemical sampling is carried out in mining areas or in areas with high background values, such as enrichment areas of individual elements, the range of data varies greatly, and there are more middle and high values, which makes the quartile spacing smaller and causes more missing anomalies.
As we can see, the anomaly areas calculated by the above two methods mainly develop along NE-extending faults, especially at the intersection of faults (Figure 5b,d). However, the above two methods only consider the frequency distribution and not the spatial variations of geochemical data from low background patterns. In other words, they do not consider the compositional nature of geochemical data [47,48,50,51,52,53,54,55].
The formation of ore deposits is the result of the coupling of various geological ore-controlling factors (such as strata, structure, rock mass, alteration, etc.) and various metallogenic processes (physics, chemistry, and biology) in the specific geological tectonic environment [56]. The ore deposits are distributed in time and space in multi-stage zonation, and are regarded as geological anomalies. Local singularity analysis emphasizes that mineralization and the formation of ore deposits are the result of geological anomalies and other ore-controlling factors [34], which are not the characteristics of cumulative frequency method and exploration data analysis method. Moreover, the local singularity analysis delineates the weak anomaly areas in the Gouli exploration area (Figure 5c); in this respect, the local singularity analysis is not only a powerful multifractal tool to identify weak anomalies, but also a kind of local neighborhood statistical analysis that can reduce the effects of regional background and provide useful statistical information by involving the data within a small singularity around a specific spatial location [1,4,34,37,49,57,58,59,60,61,62,63,64,65,66]. The coverage is still relatively thick in Qinghai Province with high altitude, which means that the geochemical anomalies in stream sediments are very weak and easy to be ignored. With the discovery of a large number of ore deposits, concealed ore-bodies have become the trend for prospecting in the future. For deep-buried concealed ore-bodies, the geochemical anomalies exposed on the surface are very weak. Comparatively speaking, the cumulative frequency method and the exploration data analysis method have better effects for areas with obvious anomalies, but for areas with weak anomalies, the effects of the two methods are not as significant as those of local singularity analysis. Therefore, the authors believe that it is optimal to use local singularity analysis to determine the abnormal threshold of Au in the Gouli exploration area, Qinghai Province.

5.3. Mineralization-Related Associated Elements

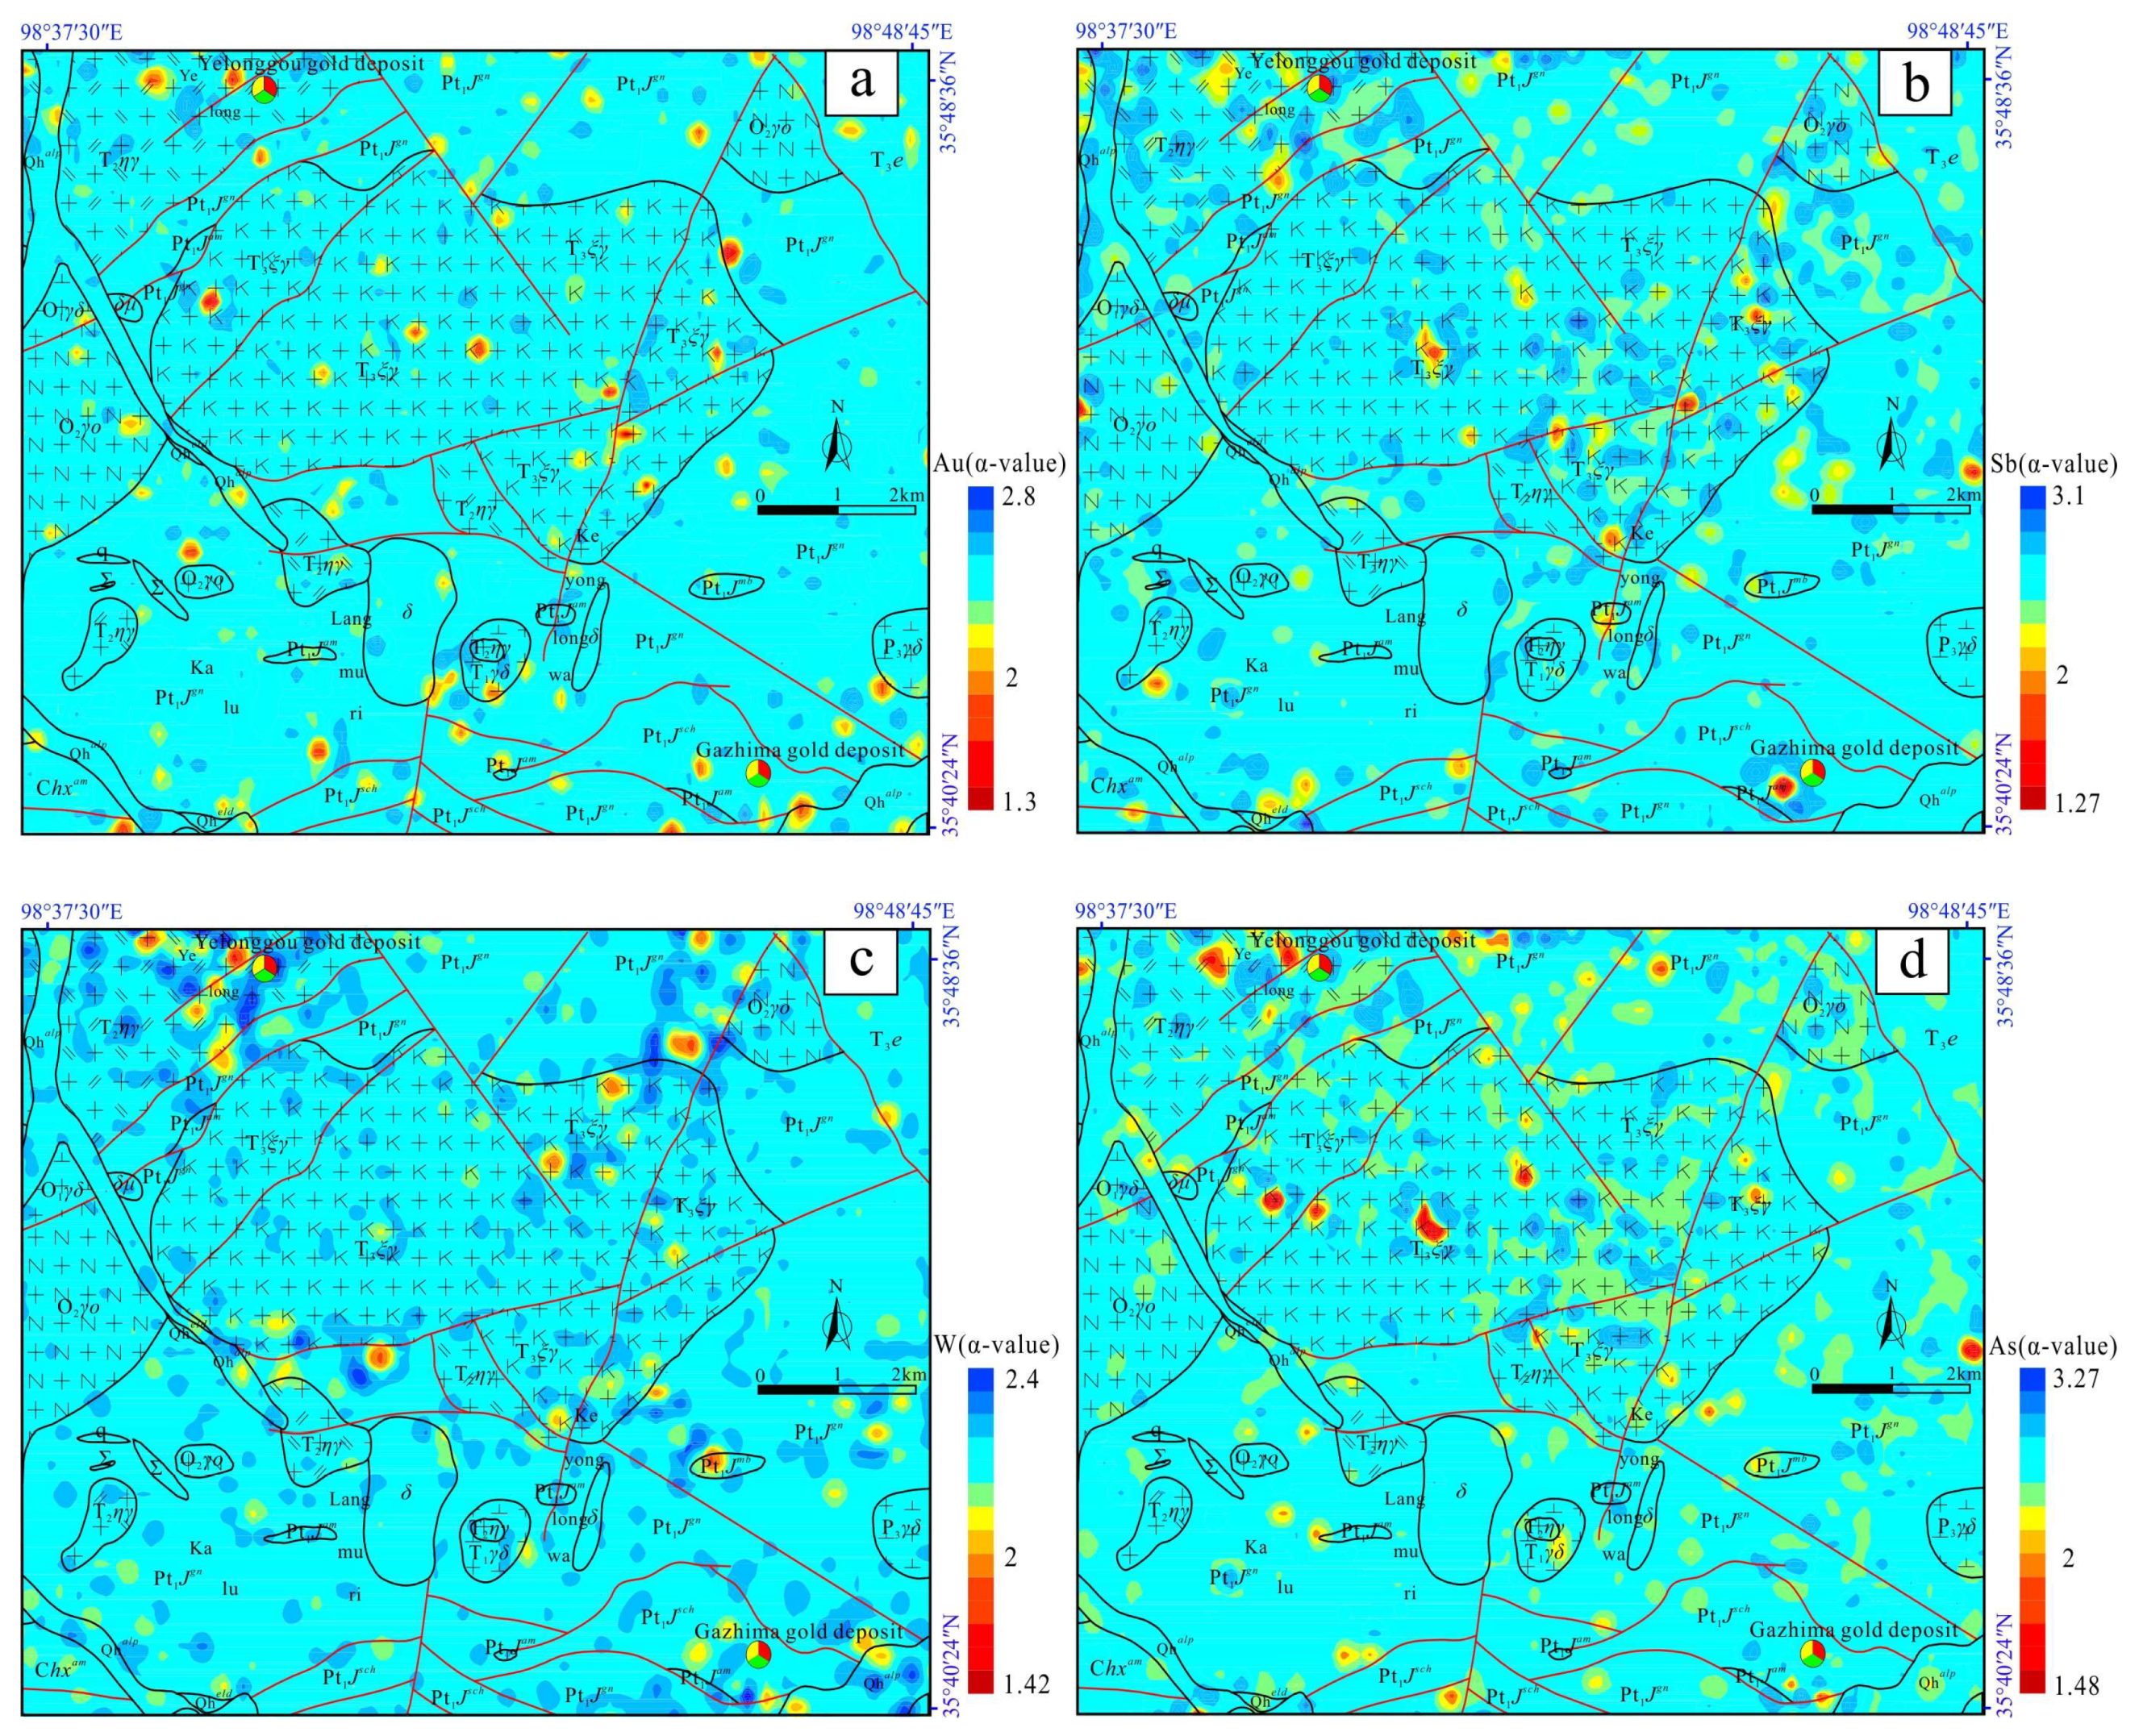
The spatial distributions of singularity indexes of Au, Sb, W, and As (Figure 7a–d) are generally consistent and mainly spread in the NE-extending fault, according to the main fault direction in the study area, suggesting that the mineralization of Au is similar with that of Sb, W, or As. A singularity index α < 2 represents elements that are enriched, while a singularity index α > 2 represents elements that are depleted. The areas of enriched elements in the study area are small and dispersed (Figure 7a–d). In the case of spatial scattered distribution, the Yelonggou gold deposit and Gazhima gold deposit occur in or near to the anomalous areas with low singularity index, suggesting that the local singularity analysis can well identify the geochemical anomalies.
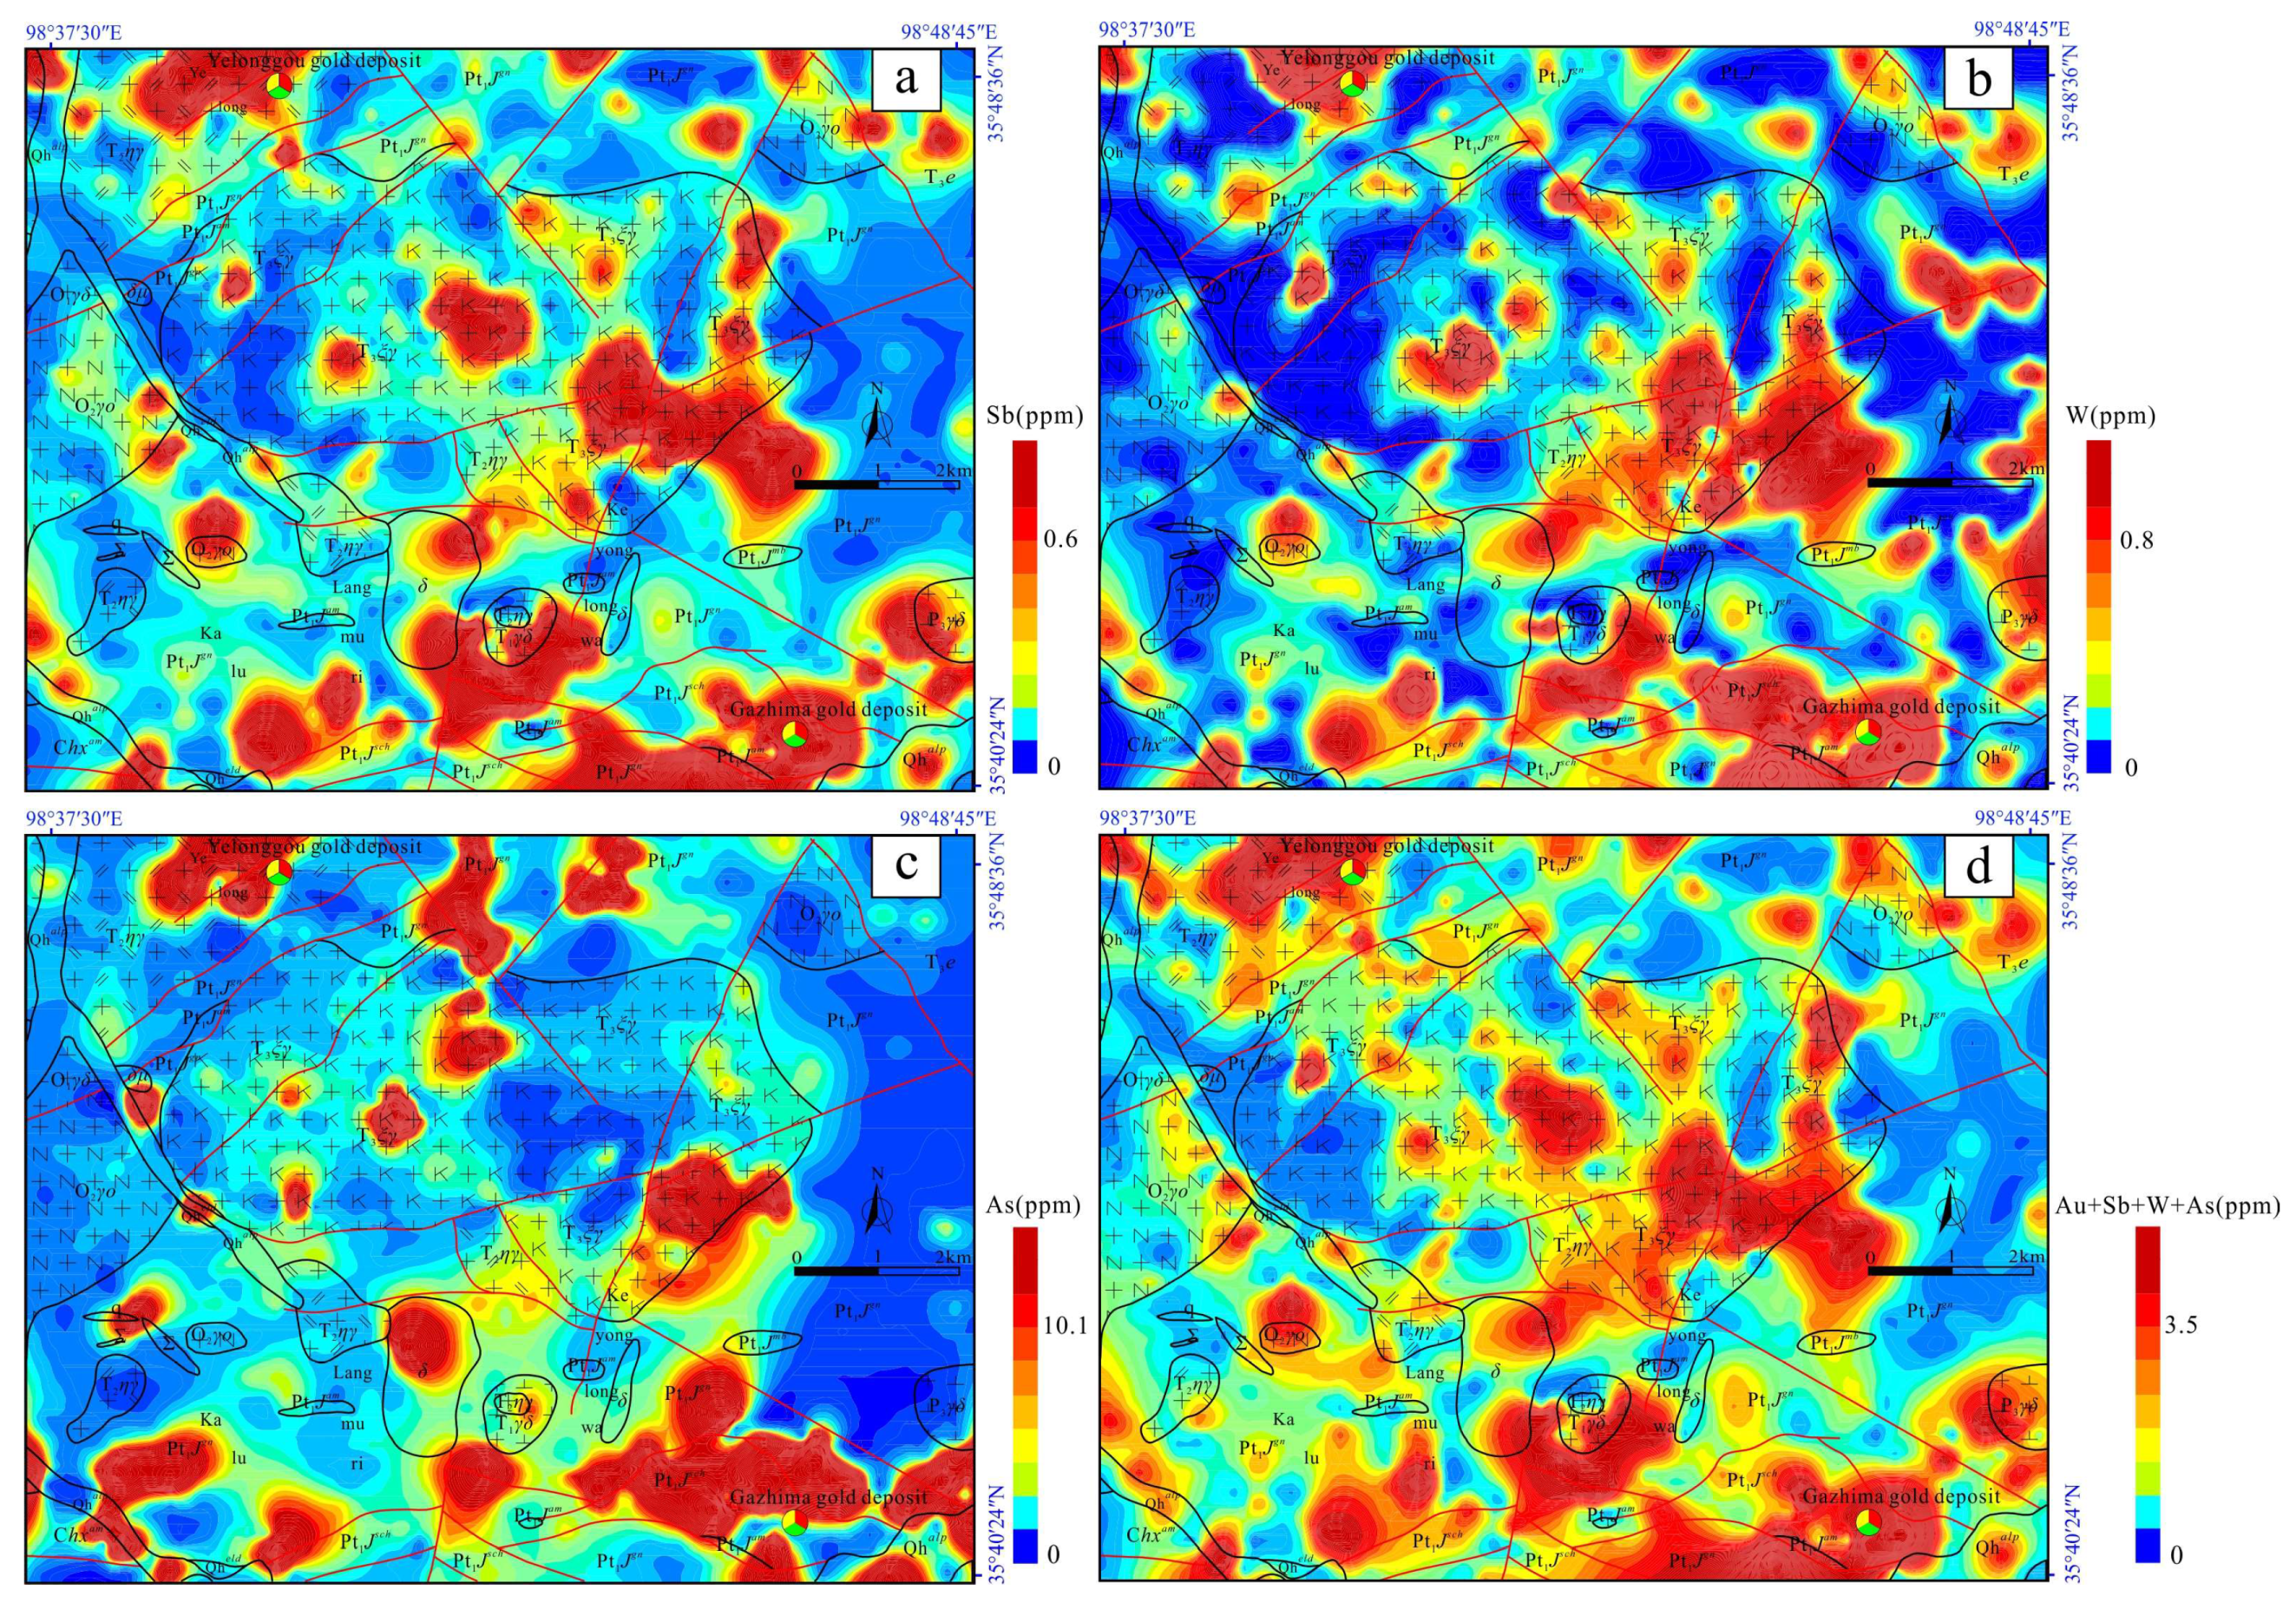
The spatial distributions of Sb, W, and As, and the compositional elements of Au, Sb, W, and As contour maps obtained by local singularity analysis are shown in Figure 8. Positions of high concentrations of Sb, W, and As located in Yelonggou area, and Gazhima area results were the same (Figure 8a–c), especially at the intersection of NNE-extending and NE-extending faults. The values of compositional elements of Au, Sb, W, and As (Figure 8d) are calculated based on the scores from the ilr-transformation, which is a comprehensive reflection of Au mineralization in the Gouli exploration area, Qinghai Province. The spatial distribution of the compositional elements not only highlights the known areas of Au mineralization, but also identifies new anomaly areas, which means the analysis by the compositional elements is more reasonable than those by single elements. Meanwhile, the abnormal spatial distribution of the compositional elements is highly consistent with that of Au. Therefore, the compositional elements of Au, Sb, W, and As can be good geochemical comprehensive indicators for tracing the Au mineralization.

5.4. Delineation of Prospecting Targets and Anomaly Verification

At present, three gold ore-bodies have been delineated in Yelonggou area, including one industrial ore-body, one low-grade ore-body, and one gold mineralized body. The ore-bodies were mostly veins, stratiform, and lenticular. The widths of gold ore-bodies are generally 0.21–2.57 m. The ore-bodies were controlled by single engineering, so it was speculated that the length of the longest was 80 m and the maximum extension was 133 m. The Au average grade ranged generally from 1.21 ppm to 8.85 ppm. The ore-bodies were strictly controlled by the mineralized alteration zone and produced in the fault gouges in the structural alteration zone. The ore minerals in gold ore-bodies are mainly pyrite, limonite, and a little arsenopyrite, while gangue minerals were mainly quartz, followed by feldspar, sericite, calcite, chlorite, epidote, amphibole, pyroxene, and graphite.
One copper-gold ore-body, one silver-gold ore-body, one gold ore-body, and three mineralized bodies have been delineated in Gazhima area [67]. The No. 1 copper-gold ore-body was lenticular and stratiform, controlled by trench 01, trench 02, and trench 11. The length of the ore-body is about 100 m and the thickness is 13.2 m, and the Au average grade is 0.73%. The ore-body occurred in quartzite of altered fracture zone FS1, and it could be seen that altered mineralizations were pyritization, ferritization, silicification, and partial malachitization. The wall rocks of the upper and lower wall were weakly altered biotite schist. The No. 2 gold ore-body is lenticular and stratiform, controlled by trench 04 and trench 12. The length of the ore-body was not determined and the thickness is about 1 m, with an average Au grade of 1.2 ppm. The ore-body occurred in quartzite of altered fracture zone FS1. It could be seen that altered mineralizations were pyritization, ferritization, kaolinization, silicification, and partial malachitization. The wall rocks of the upper and lower wall were mica schist. The No. 3 ore-body was a silver-gold ore-body and the main ore-body in the working area. It was found in FS8 quartzite of altered zone, controlled by trench 21 and trench 32. The length of the ore-body was about 250 m and the thickness was 3 m, and the Au average grade was 3.04 ppm. The ore-body occurred in quartzite of the altered fractured zone. There were many impurities in the quartzite, which appears gray-white and smoky-gray. The main mineralizations were galena mineralization and ferritization, while the wall rocks were relatively fragmented and strongly altered, and the main wall rock alterations were chloritization, kaolinization, and sericitization. The No. 4 gold mineralized body was lenticular and stratiform, controlled by trench 01, trench 02, trench 03, trench 04, trench 11, and trench 12. The length of the mineralized body was about 350 m and the thickness was 1–3 m, and the Au average grade was 0.24–0.9 ppm. The mineralized body occurred in the altered fracture zone. It could be seen that altered mineralizations were pyritization, ferritization, kaolinization, silicification, and partial malachitization. The wall rocks of the upper and lower wall were weakly altered biotite schist. The No. 5 silver-gold mineralized body was lenticular, controlled by trench 21, trench 23, trench 32, trench 24, trench 26, and trench 19. The length of the mineralized body was about 1600 m and the thickness was 1–15 m. The main mineralizations were pyritization and galena mineralization. The No. 6 gold mineralized body was lenticular and stratiform, controlled by trench 08 and trench 09. The length of the ore-body was unmeasured and the thickness was 1–4.5 m, and the Au average grade was 0.13–0.18 ppm. The mineralized body occurred in the altered fractured zone. It could be seen that altered mineralizations were pyritization, ferritization, kaolinization, and silicification. The wall rocks of the upper and lower walls were mica schist.
According to geological maps for the field and the Yelonggou and Gazhima gold deposits, we can conclude the output characteristics of gold deposits in the Gouli exploration area, Qinghai Province: (1) There are faults or structure alteration zones; (2) the geological unit is Triassic intrusive rock or Jinshuikou Group strata; (3) mineralization alteration is mainly pyritization, ferritization, and galena mineralization; (4) there are strong anomalies for Au; (5) there are the abnormal compositional elements of Sb, As, and W. According to the binary state thinking, the following scoring rules are stipulated (Table 4).
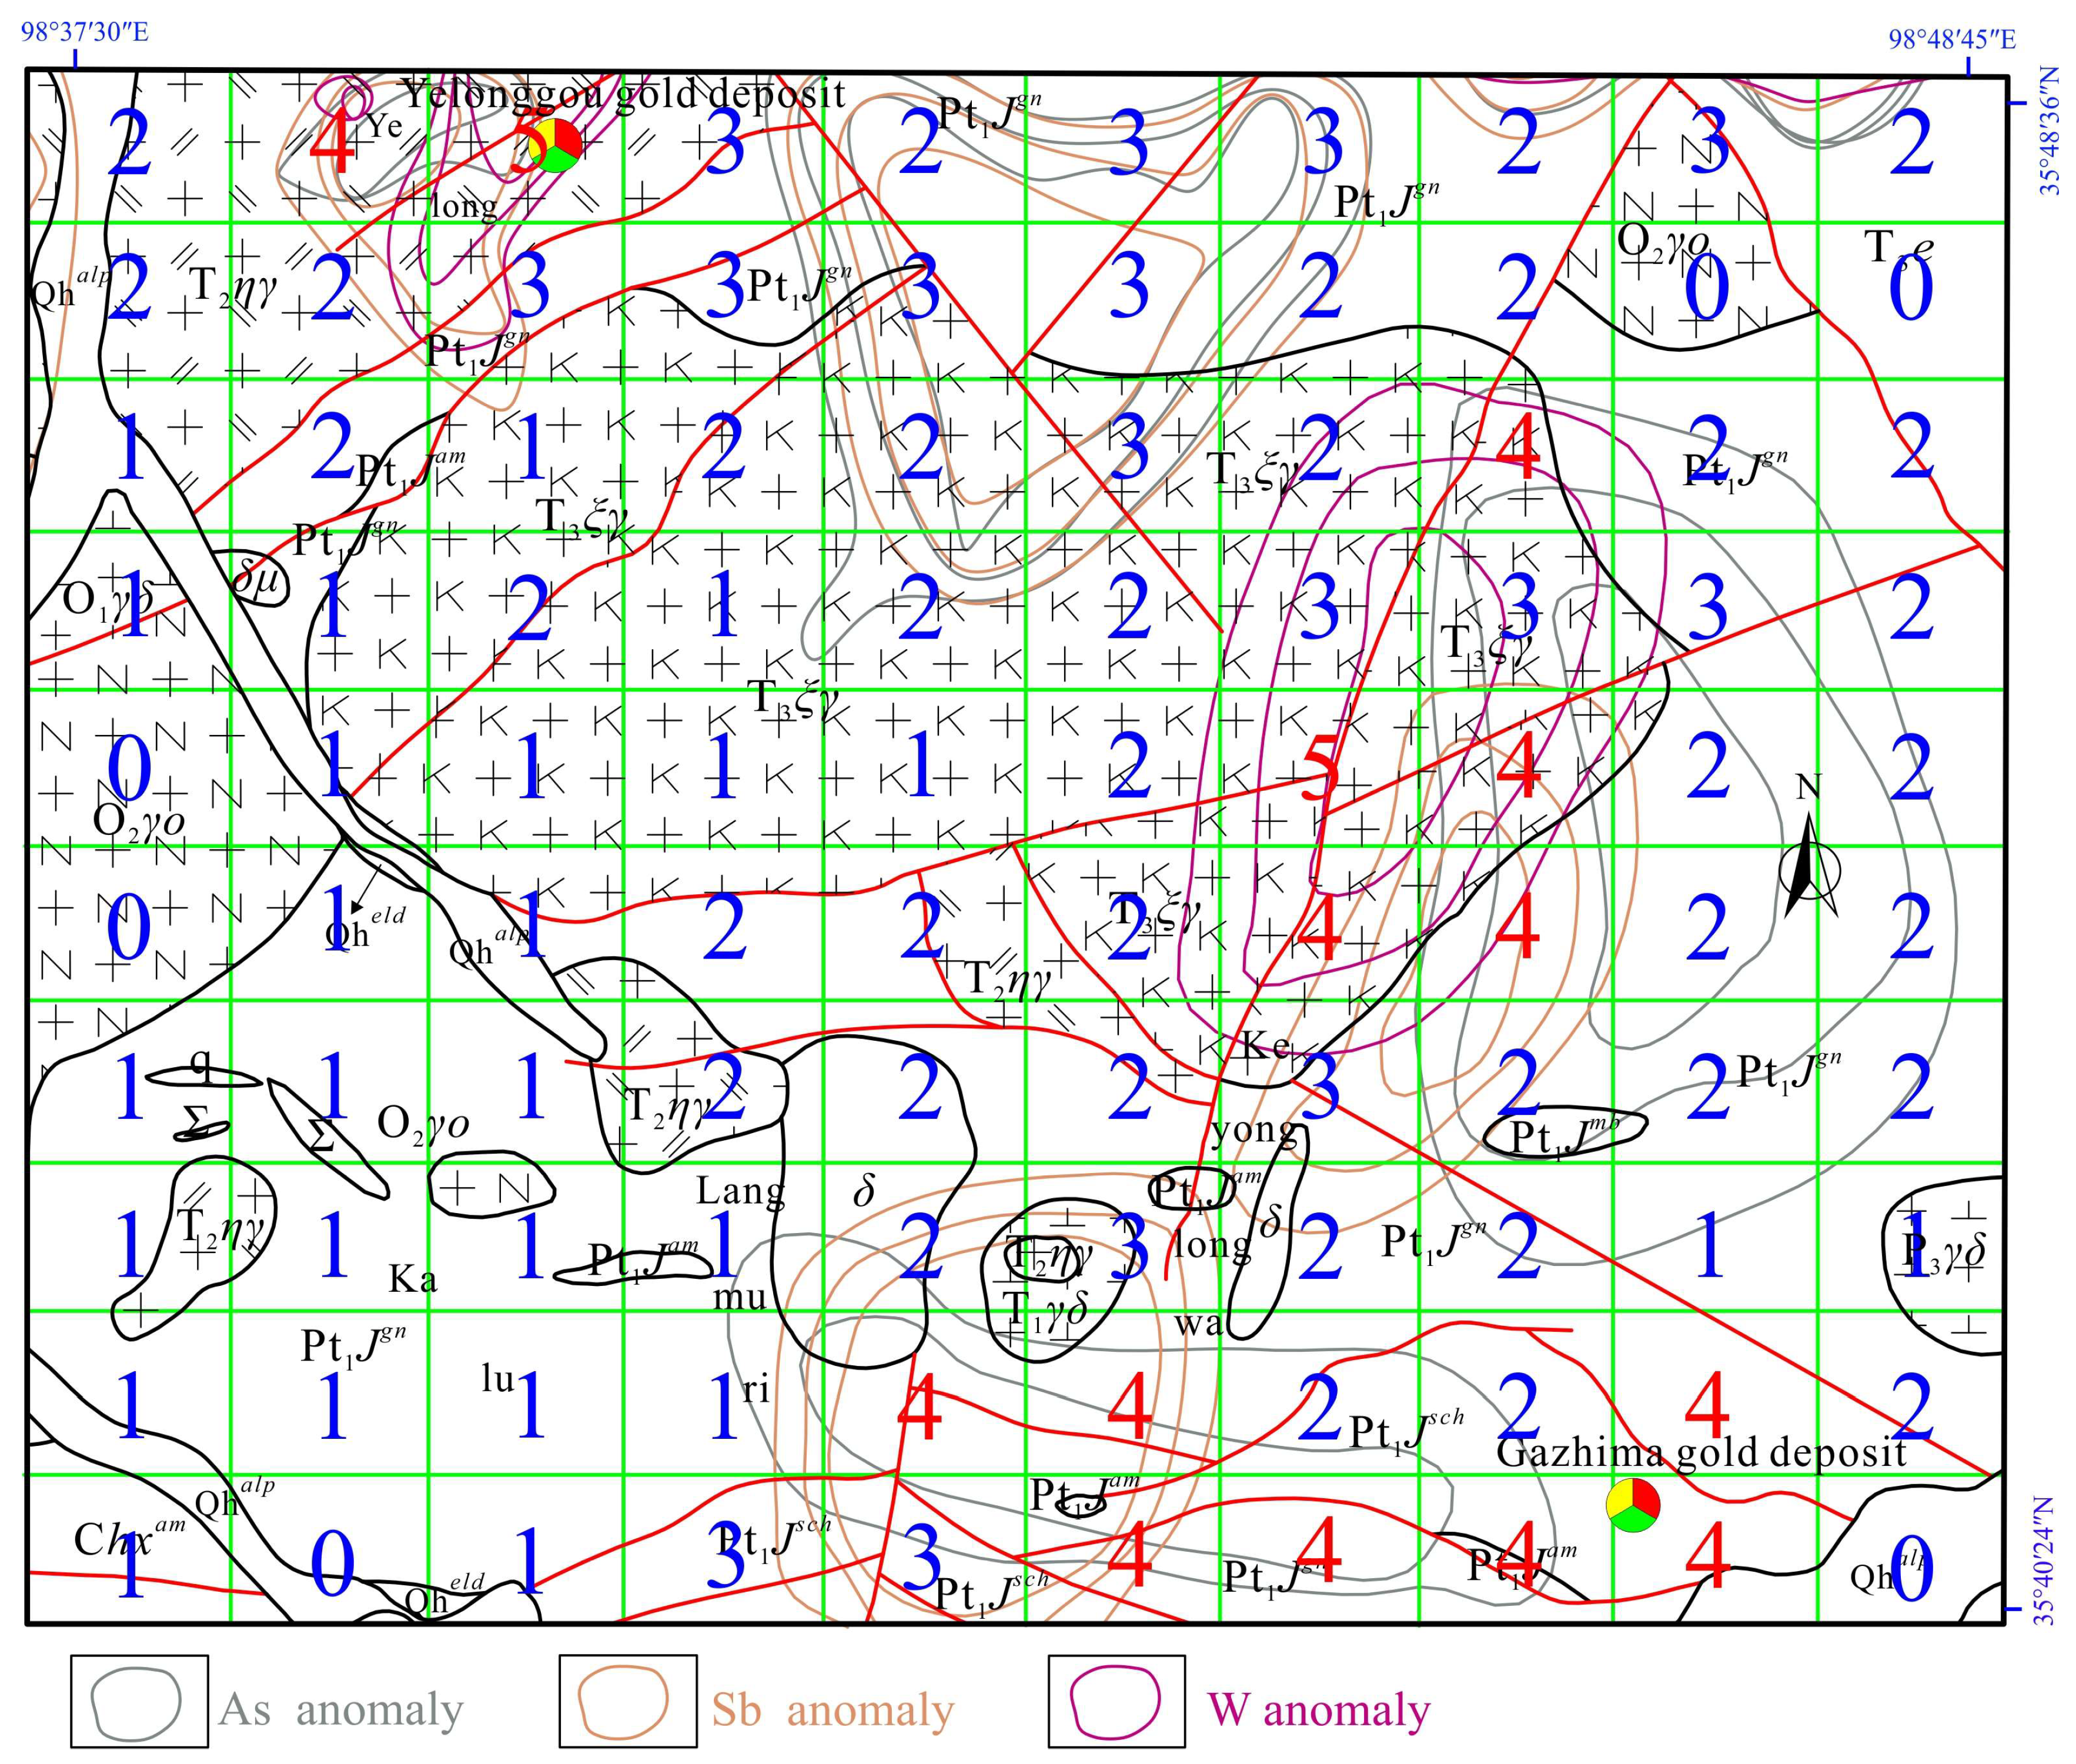
The higher the cumulative sum of these scores, the higher the prospecting potential. In this paper, the whole area is divided into 100 small areas based on the density of 1.25 km × 1 km. According to the binary state scoring rules, the scores are shown in Figure 9.
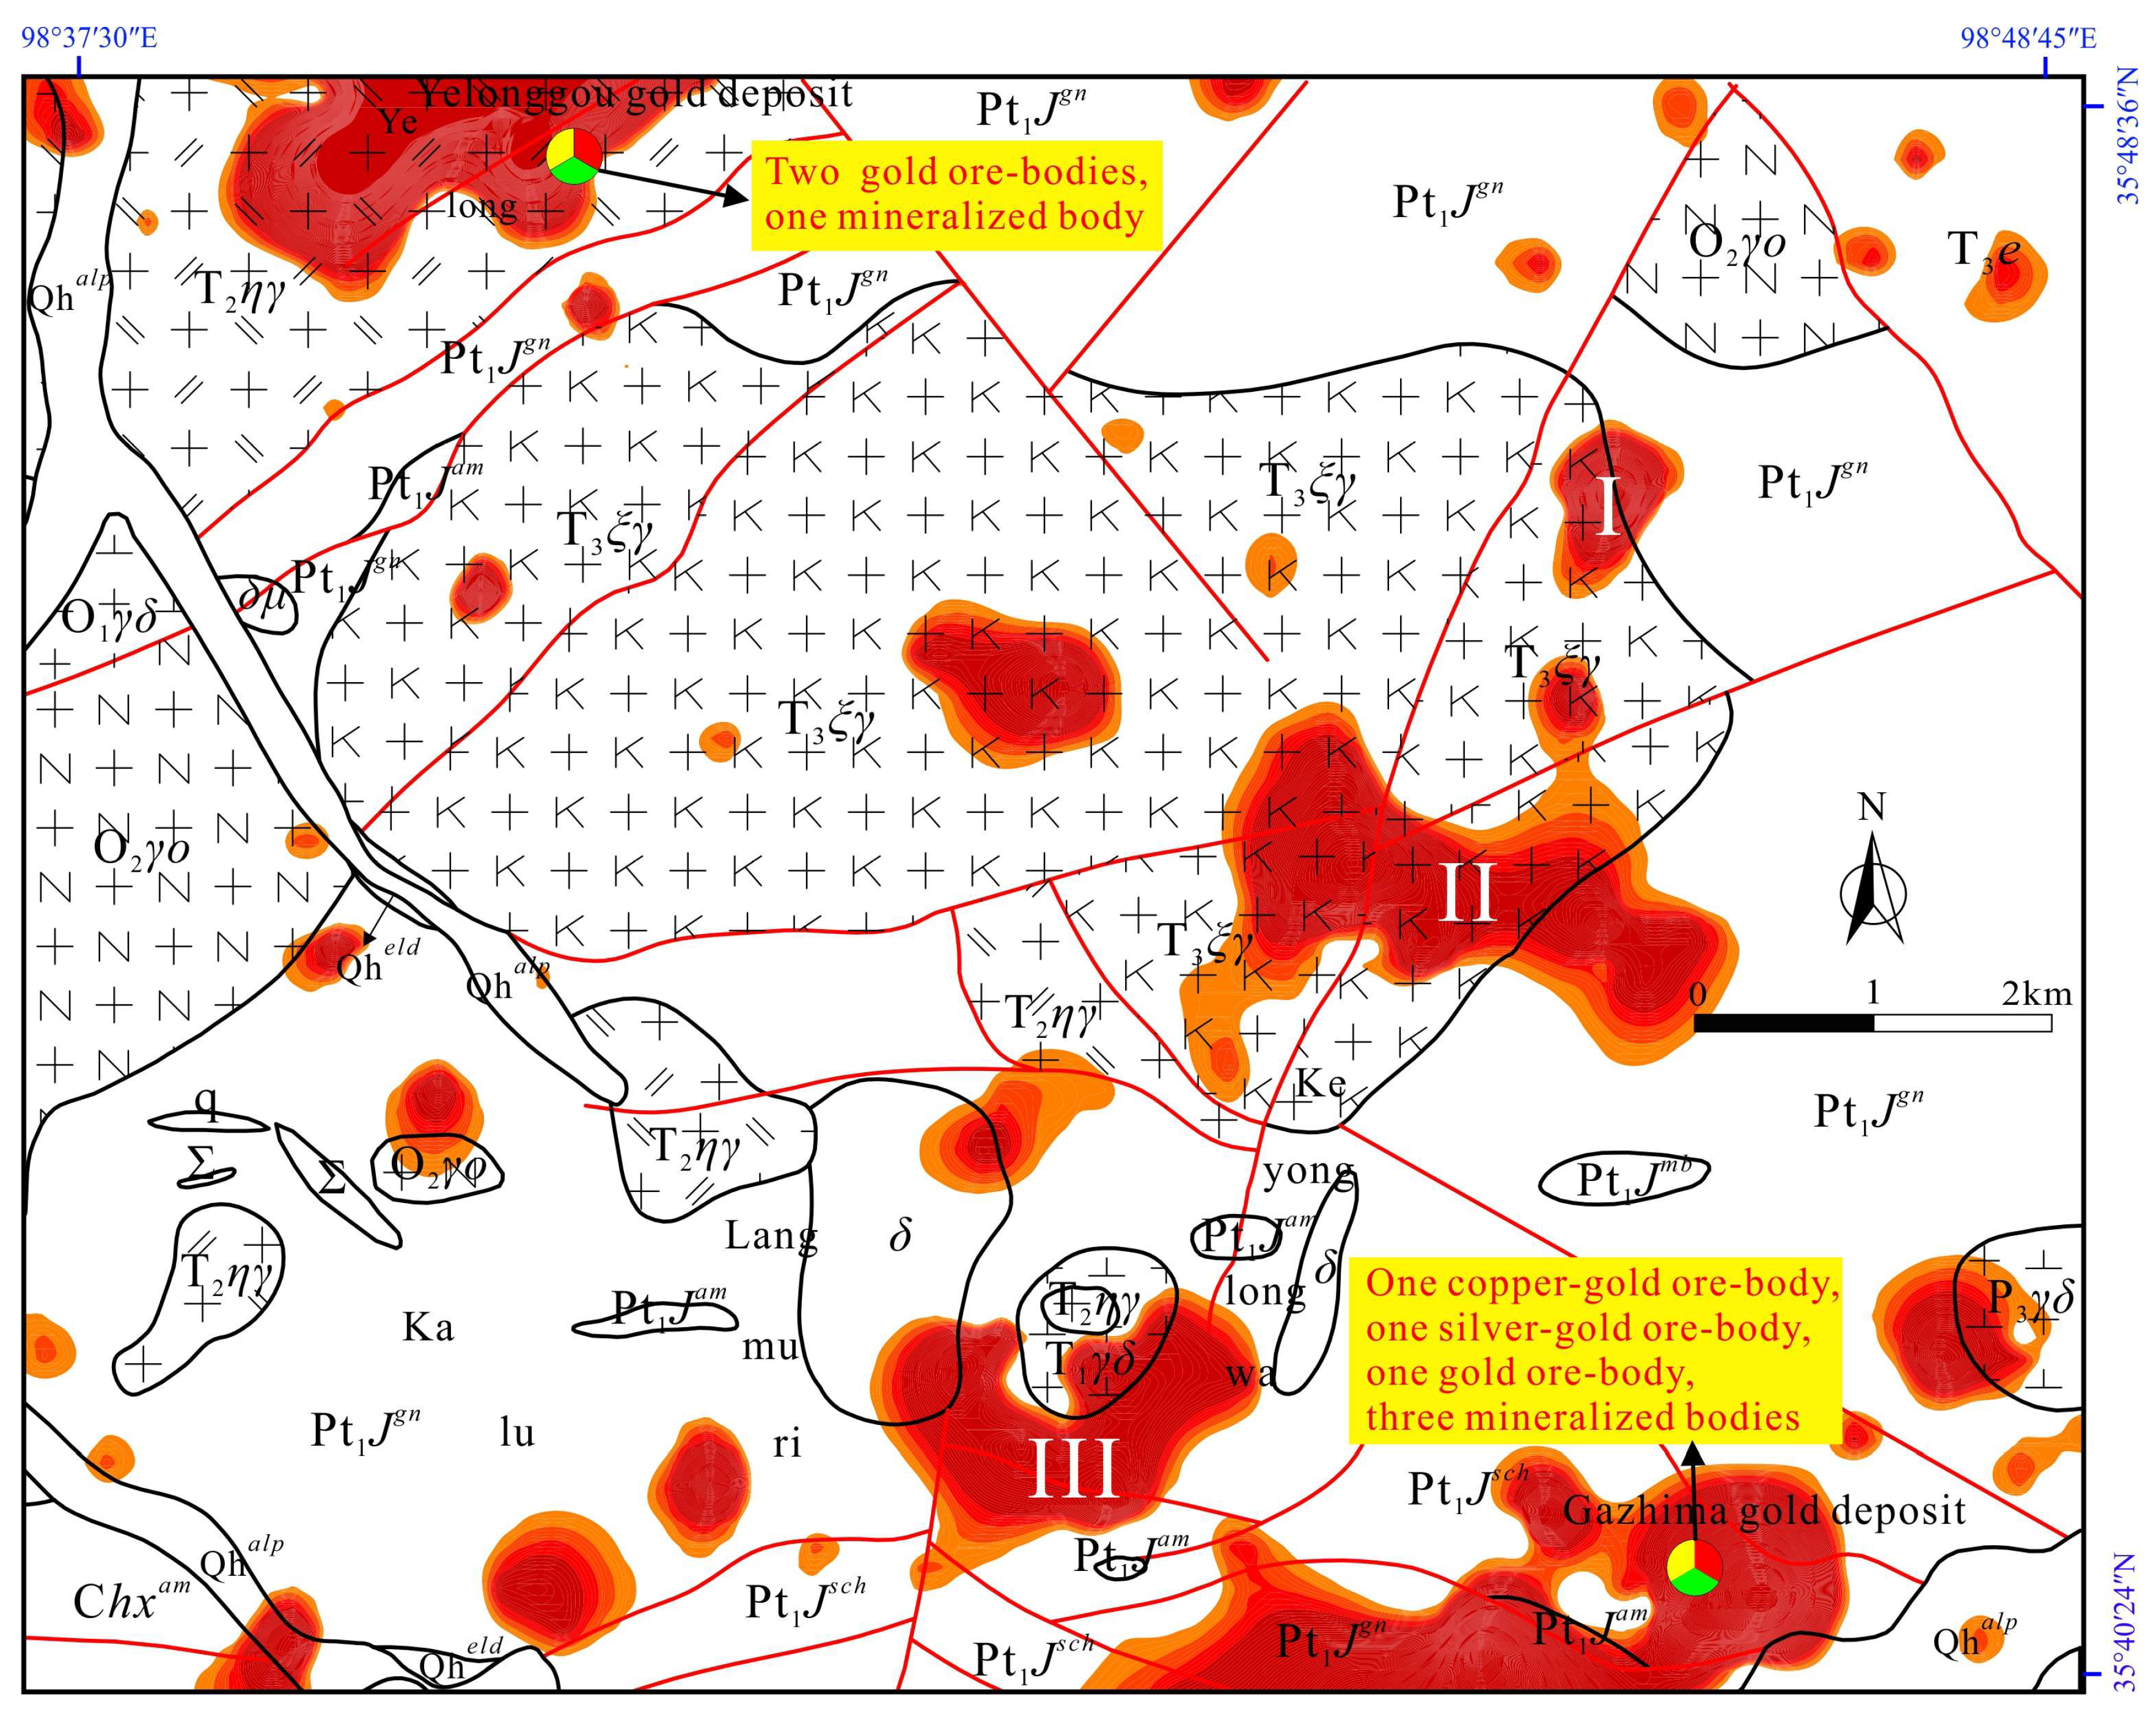
The highest score is 5, followed by 4 (Figure 9). The areas according to the two scores may have great prospecting potentials. We can see that Yelonggou and Gazhima gold deposits are both in the highest score areas. Compared with the high-score areas in Figure 9, the anomaly areas I, II, and III can be taken as prospecting targets for gold (Figure 10) in the Gouli exploration area, which may have great prospecting potential for gold.
Trench 01 (TC01) (Figure 11) was used to verify the anomaly area I (Figure 10) in the Gouli exploration area. The Au mineralization alteration zone (Figure 11a) hosting one gold ore-body was found successively; the gold ore-body is strictly controlled by the NE-extending fault. There are honeycomb-like erosion holes in the ore-body, the average grade of gold ore-body is 63 ppm, while maximum grade is 202 ppm. Mineralization alteration is very intense and the width of mineralization alteration zone is about 13 m. Mineralization characteristics show strong ferritization (Figure 11b,f), malachitization (Figure 11c,d), pyritization in the quartz vein (Figure 11e), and silicification. In the northern part of the gold ore-body, the width of the fractured alteration zone is about 20 m, silicification and ferritization are strong, and soil anomalies show that gold and silver are abnormally high, with a gold grade of 1.34 ppm.
Anomaly areas I, II, and III are in a NE-extending fault, which indicates that the metallogenic conditions of anomaly areas II and III are similar to that of anomaly area I. Therefore, anomaly areas II and III have high prospecting potential for gold.

6. Conclusions

Based on the detailed comparison of the geochemical anomaly processing methods of Au and the study of the anomaly threshold of Au and its associated elements in the Gouli exploration area, Qinghai Province, the following conclusions are drawn in this paper:
(1) Comparing with the cumulative frequency method and the exploration data analysis method, the authors consider that local singularity analysis is the optimum method to be applied in the study area. The local singularity analysis not only highlights the strong Au anomaly areas, but also delineates the weak gold anomaly areas. Under complex geological backgrounds, it is a powerful tool for identifying weak anomalies.
(2) Anomaly areas II and III have similar anomaly intensity to anomaly area I and are in the same tectonic system. Moreover, anomaly areas II and III are located in the anomaly areas of compositional elements of Sb, W, and As, which are most closely related to Au. Therefore, anomaly areas II and III can be delineated as prospecting targets for gold deposits in the Gouli exploration area, Qinghai Province, which have great prospecting potential.

Author Contributions

J.W. was the chief investigator of the project. D.C. wrote the original draft. J.W. and W.S. supervised and reviewed the manuscript. J.W., D.C., W.S., H.L., and X.Z. took part in the field investigation. D.C., W.W., H.L., and X.Z. performed the figure and table production, and discussed and interpreted the data.

Funding

The research was jointly supported by the Demonstration Project of Prospecting and Technology Application in the Exploration Area of China Geological Survey (No. 121201004000150017, No. 121201004000172201 and No. 121201004000160901).

Acknowledgments

The authors would like to thank Ren-guang Zuo and the reviewers for their valuable comments, which significantly improved the manuscript. Thanks to Hongzhi Zhou, Xu Zhao, and Hafizullah Abba Ahmed of China University of Geosciences (Wuhan) for their help with the manuscript. We would like to acknowledge No. 8 Geological Team of Qinghai Nonferrous Metals Geological Exploration Bureau for their help in the fieldwork, and Hebei Institute of regional geology and Mineral Resources Research Laboratory for the geochemical analysis of Au and other elements and Wuhan Sample Solution Analytical Technology Co., Ltd. for the zircon U-Pb isotope dating conducted by LA-ICP-MS.

Conflicts of Interest

The authors declare no conflict of interest.

Appendix A

 #include <stdio.h>
 #include <stdlib.h>
 main()
 {
      FILE *fp;
      char filename [50];//Used to store the filename.
      int i,j, n,flag;
      float data[1 00000] = {0},temp,t,num;
      printf(" Please input the filename: ");
      gets(filename);
//The TXT file and C program engineering files must be placed in the same folder.
       fp=fopen(filename,"r");
      //Input the amount of the element.
      scanf("%d",&n);
      for(i=0;i<n;i++)
       fscanf(fp,"%f",&data[i]);
       fclose(fp);
      for(i=0;i<n;i++)
           printf("%.2f\n",data[i]);
      for(j=0;j<n-1;j++)
              { //Traversing all data of the element concentration.
                  for(i=0;i<n-1-j;i++)
                  { //Sorting the elements from small to large.
                 if(data[i]> data[i+1])
                 {
                     temp=data[i];
                     data[i]= data[i+1];
                     data[i+1]=temp;
                   }
                 }
               }
      for(i=0;i<n;i++)
       {
           t=float(i+1);
           num=float(n);
           if(t/num>=0.85)
          {//Determine the location of elements at a cumulative frequency of 85%.
                   flag=i;
              break;
              }
              }
           //Determine the abnormal threshold value of this element.
   printf("The abnormal threshold of the element is %.2f ppb.\n",data[flag]);
         }
		

References

  1. Cheng, Q.M. Singularity theory and methods for mapping geochemical anomalies caused by buried sources and for predicting undiscovered mineral deposits in covered areas. J. Geochem. Explor. 2012, 122, 55–70. [Google Scholar] [CrossRef]
  2. Cheng, Q.M. Vertical distribution of elements in regolith over mineral deposits and implications for mapping geochemical weak anomalies in covered areas. Geochem. Explor. Env. Anal. 2014, 143, 277–289. [Google Scholar] [CrossRef]
  3. Zheng, Y.Y.; Sun, X.; Gao, S.B.; Wang, C.M.; Zhao, Z.Y.; Wu, S.; Li, J.D.; Wu, X. Analysis of stream sediment data for exploring the Zhunuo porphyry Cu deposit, southern Tibet. J. Geochem. Explor. 2014, 143, 19–30. [Google Scholar] [CrossRef]
  4. Zuo, R.G.; Wang, J.; Chen, G.X.; Yang, M.G. Identification of weak anomalies: A multifractal perspective. J. Geochem. Explor. 2015, 148, 12–24. [Google Scholar] [CrossRef]
  5. Wang, J.; Zuo, R.G. An extended local gap statistic for identifying geochemical anomalies. J. Geochem. Explor. 2016, 164, 86–93. [Google Scholar] [CrossRef]
  6. Chen, J.J. Paleozoic-Mesozoic Tectono-Magmatic Evolution and Gold Mineralization in Gouli Area, East End of East Kunlun Orogen. Ph.D. Thesis, China University of Geosciences, Wuhan Shi, China, 2018. [Google Scholar]
  7. Yang, B.R.; Zhang, L.B.; Ma, Z.X.; Wang, X.Y. Study on Metallogenic Geological Background of Gold Deposits in Gouli Area, Qinghai. Min. Explor. 2018, 9, 1920–1925. [Google Scholar]
  8. Yan, Q.Z.; Pei, X.Z.; Li, R.B.; Li, Z.C.; Pei, L.; Liu, C.J.; Chen, Y.X.; Hu, C.G.; Zhang, Y.; Wang, X.; et al. Detrital Zircon U-Pb Age and Geological Significance of Metamorphic Strata at Gouli Area in the Central Tectonic Belt of East Kunlun. Northwestern Geol. 2017, 50, 165–181. [Google Scholar]
  9. Wang, L.W.; Yu, Y.Q.; Zhao, Y.J.; Liu, S.L. Geological Characteristics and Signs of Uranium Polymetallic Deposits in Eastern Meadow of Qinghai Province. Chin. Manganese Ind. 2017, 35, 45–54. [Google Scholar]
  10. Chen, G.J. Metallogenesis of Gold Deposits in Gouli Regional and Peripheral Area of East Kunlun, Qinghai Province. Ph.D. Thesis, Jilin University, Changchun, China, 2014. [Google Scholar]
  11. Gobett, G.J.S.; Goodfellow, W.D.; Chapman, R.P.; Chork, C.K. Exploration geochemistry—Distribution of elements and recognition of anomalies. J. Int. Assoc. Math. Geol. 1975, 7, 415–442. [Google Scholar]
  12. Luo, X.R.; Wen, M.L.; Fei, O.Y. Exploration Geochemistry Beijing. Metall. Ind. Press 2007, 196–199. [Google Scholar]
  13. Zhou, J.T.; Zhao, B. Identification and evaluation of low level display strata in geochemical logging. Mud Logging Eng. 2003, 2, 43–47. [Google Scholar]
  14. Li, X.H.; Li, C.L. A new method for fast delineation of geochemical synthetic anomalies-Mahalanobis distance method and program. Comput. Tech. Geophys. Geochem. Explor. 1993, 4, 338–341. [Google Scholar]
  15. Ma, W.Y. Extraction and Evaluation of Geochemical Anomaly Information; Northwest Normal University: Lanzhou Shi, China, 2013. [Google Scholar]
  16. Miller, R.L.; Goldberg, E.D. The normal disteribution in geochemistry. Geochim. Cosmochim. Acta. 1995, 8, 53–62. [Google Scholar] [CrossRef]
  17. Chen, X.; Xu, R.K.; Zheng, Y.Y.; Jiang, X.J.; Du, W.Y. Identifying potential Au-Pb-Ag mineralization in SE Shuangkoushan, North Qaidam, Western China: Combined log-ratio approach and singularity mapping. J. Geochem. Explor. 2018, 189, 109–121. [Google Scholar] [CrossRef]
  18. Li, Q.Z.; Zhou, J.; Liu, L.; Zhang, J.R.; Zhang, J.C. Comparison of methods for determining the threshold of geochemical anomalies of rocks: A case study of Sigu tin deposit, Yunnan Province. Contrib. Geol. Miner. Resour. Res. 2015, 30, 429–434. [Google Scholar]
  19. Zhao, C.S. Gold and Silver Mineralization in Eastern Kunlun Orogenic Belt, Qinghai Province(D); Jilin University: Changchun Shi, China, 2004. [Google Scholar]
  20. Xia, R. Paleo-Tethys Orogenic Process and Gold Mineralization in East Kunlun (D); China University of Geosciences: Beijing, China, 2017. [Google Scholar]
  21. Shi, C.; Li, R.S.; He, S.P.; Yu, P.S.; Wang, C. Determination of the Age for Gold Mineralization and its Relationship with Tectonomagmatism in the Eastern Segment of Kunlun Orogenic Belt; Summary of theses of the Annual Meeting of the Chinese Geological Society in 2013-The Branch of Metallogenic Law and Prospecting Breakthrough of the Important Metallogenic Belts in Northwest China; China Geological Society: Bejing, China, 2013; p. 3. [Google Scholar]
  22. Wang, X.Y.; Ma, Z.X.; Li, W.J.; Zhang, X.Y.; Cui, Z.Y. Geological characteristics and ore-controlling factors of gold deposits in Gouli area of Qinghai Province. Chin. Manganese Ind. 2017, 35, 45–54. [Google Scholar]
  23. Wang, F.L.; Xiao, X.Q.; Chen, S.S. Geological characteristics and prospecting prospects of gold deposits in Gouli area, Qinghai. Gold Sci. Technol. 2011, 19, 45–48. [Google Scholar]
  24. Xie, X.J.; Wang, X.Q.; Zhang, Q.; Zhou, G.H.; Cheng, H.X.; Liu, D.; Cheng, Z.Z.; Xu, S.F. Multi-scale geochemical mapping in China. Geochem. Explor. Environ. Anal. 2008, 8, 333–341. [Google Scholar] [CrossRef]
  25. Xie, X.J.; Mu, X.Z.; Ren, T.X. Geochemical mapping in China. J. Geochem. Explor. 1997, 60, 99–113. [Google Scholar]
  26. Ren, J.F.; Zhou, J.B.; Lu, X.G.; Lin, J.; Mu, K.L. EDXRF-1024 Portable High Precision X-ray Fluorescence Analyzer. Nucl. Sci. Tech. 2006, 9, 698–700. [Google Scholar]
  27. Yuan, Y.T. Comparative Study of Geochemical Data Processing Methods. Ph.D. Thesis, China University of Geosciences, Beijing, China, 2015. [Google Scholar]
  28. Chen, J.R.; Wang, J.W.; Fu, F. Various Methods for Determining the Threshold of Geochemical Anomalies and the Discussion of Rationality; Collection of Papers II of Geological Society of Jiangxi Province in 2015; Geological Society of Jiangxi Province: Nanchang Shi, China, 2015. [Google Scholar]
  29. Xiong, C.; Ge, L.Q.; Luo, Y.Y.; Gu, Y. Comparison of multiple method to determine the geochemical anomalies in the threshold. Sichuan Nonferrous Met. 2012, 1, 52–61. [Google Scholar]
  30. Yang, X.F.; Liu, C.G.; Zhang, T.R.; Zheng, Y. Geochemical Prospecting Method; Geological Publishing House: Bejing, China, 2007. [Google Scholar]
  31. Sanderson, D.J.; Roberts, S.; Gumiel, P.A. Fractal relationship between vein thickness and gold grade in drill core from La Codosera Spain. Econ. Geol. 1994, 89, 168–173. [Google Scholar] [CrossRef]
  32. Ding, S.J.; Zhai, Y.S.; Deng, J. Fractal Study on the Distribution of Gold Deposits in China. Geol. Rev. 1998, 44, 188–193. [Google Scholar]
  33. Shi, J.F. Geochemical Distribution and Scaling Law of Elements in Zhuji, Zhejiang Province. Geosci. J. Chin. Univ. Geosci. 2001, 26, 167–171. [Google Scholar]
  34. Cheng, Q.M. Mapping singularities with stream sediment geochemical data for prediction of undiscovered mineral deposits in Gejiu, Yunnan Province, China. Ore Geol. Rev. 2007, 32, 314–324. [Google Scholar] [CrossRef]
  35. Cheng, Q.M. Non-linear theory and power-law models for information integration and mineral resources quantitative assessments. Math. Geosci. 2008, 40, 503–532. [Google Scholar] [CrossRef]
  36. Cheng, Q.M.; Agterberg, F.P. Singularity analysis of ore-mineral and toxic trace elements in stream sediments. Comput. Geosci. 2009, 35, 234–244. [Google Scholar] [CrossRef]
  37. Agterberg, F.P. Multifractals and geostatistics. J. Geochem. Explor. 2012, 122, 113–123. [Google Scholar] [CrossRef]
  38. Shi, C.Y. Application of exploration data analysis (EDA) technology. Geol. Explor. 1993, 11, 52–58. [Google Scholar]
  39. Hu, Y.K. Multivariate Analysis in Geochemistry; China University of Geosciences press: Wuhan, China, 1991. [Google Scholar]
  40. Emmanuei, J.M.; Carranza, E.J.M. Geochemical Anomaly and Mineral Prospectivity Mapping in GIS; The Netherlands Hardbound: Culemborg, The Netherlands, 2008; p. 368. [Google Scholar]
  41. Chayes, F.; Trochimczyk, J. An effect of closure on the structure of principal components. J. Int. Assoc. Math. Geol. 1978, 10, 323–333. [Google Scholar] [CrossRef]
  42. Aitchison, J. The statistical analysis of compositional data. J. R. Stat. Soc. 1986, 44, 139–177. [Google Scholar]
  43. Gregory, F.P. The statistical analysis of compositional data. Technometrics 1988, 30, 120–121. [Google Scholar]
  44. Zhou, D. Statistical Analysis of Geological Compositional Data-Difficulties and Explorations. J. Earth Sci. 1998, 23, 147–152. [Google Scholar]
  45. Egozcue, J.J.; Pawlowsky-Glahn, V.; Mateu-Figueras, G.; Barcelo-Vidal, C. Isometric logratio transformations for compositional data analysis. Math. Geol. 2003, 35, 279–300. [Google Scholar] [CrossRef]
  46. Carranza, E.J.M. Analysis and mapping of geochemical anomalies using logratio-transformed stream sediment data with censored values. J. Geochem. Explor. 2011, 110, 167–185. [Google Scholar] [CrossRef]
  47. Filzmoser, P.; Hron, K.; Reimann, C. Principal component analysis for compositional data with outliers. Envireonmetrics 2009, 20, 621–632. [Google Scholar] [CrossRef]
  48. Aitchison, L. The statistical analysis of compositional data. J. R. Stat. Soc. Ser. B 1982, 44, 139–177. [Google Scholar] [CrossRef]
  49. Afzal, P.; Alghalandis, Y.F.; Khakzad, A.; Moarefvand, P.; Omran, N.R. Delineation of mineralization zones in porphyry Cu deposits by fractal concentration-volume modeling. J. Geochem. Explor. 2011, 108, 220–232. [Google Scholar] [CrossRef]
  50. Filzmoser, P.; Hron, K. Outlier detection for compositional data using robust methods. Math. Geosci. 2008, 40, 233–248. [Google Scholar] [CrossRef]
  51. Filzmoser, P.; Hron, K. Correlation analysis for compositional data. Math. Geosci. 2009, 41, 905–919. [Google Scholar] [CrossRef]
  52. Filzmoser, P.; Hron, K.; Reimann, C. Univariate statistical analysis of environmental (compositional) data: Problems and possibilities. Sci. Total Env. 2009, 407, 6100–6108. [Google Scholar] [CrossRef] [PubMed]
  53. Reimann, C.; Filzmoser, P.; Garrett, R.G. Factor analysis applied to regional geochemical data: Problems and possibilities. Appl. Geochem. 2002, 17, 185–206. [Google Scholar] [CrossRef]
  54. Zuo, R.G. Identification of geochemical anomalies associated with mineralization in the Fanshan district, Fujian, China. J. Geochem. Explor. 2014, 139, 170–176. [Google Scholar] [CrossRef]
  55. Zuo, R.G.; Xia, Q.L.; Wang, H.C. Compositional data analysis in the study of integrated geochemical anomalies associated with mineralization. Appl. Geochem. 2013, 28, 202–211. [Google Scholar] [CrossRef]
  56. Cheng, Q.M. Singular mineralization processes and mineral resources quantitative prediction: New theories and methods. Earth Sci. Front. 2007, 14, 042–053. [Google Scholar]
  57. Bai, J.; Porwal, A.; Hart, C.; Ford, A.; Yu, L. Mapping geochemical singularity using multifractal analysis: Application to anomaly definition on stream sediments data from Funin Sheet, Yunnan, China. J. Geochem. Explor. 2010, 104, 1–11. [Google Scholar] [CrossRef]
  58. Liu, Y.; Cheng, Q.M.; Xia, Q.L.; Wang, X.Q. Application of singularity analysis for mineral potential identification using geochemical data-a case study: Nanling W-Sn-Mo polymetallic metallogenic belt, South China. J. Geochem. Explor. 2013, 134, 61–72. [Google Scholar] [CrossRef]
  59. Sun, X.; Gong, Q.J.; Wang, Q.F.; Yang, L.Q.; Wang, C.M.; Wang, Z.L. Application of local singularity model to delineate geochemical anomalies in Xiong’ershan gold and molybdenum ore district, Western Henan province, China. J. Geochem. Explor. 2010, 107, 21–29. [Google Scholar] [CrossRef]
  60. Sun, X.; Zheng, Y.Y.; Wang, C.M.; Zhao, Z.Y.; Geng, X.B. Identifying geochemical anomalies associated with Sb–Au–Pb–Zn–Ag mineralization in North Himalaya, southern Tibet. Ore Geol. Rev. 2016, 73, 1–12. [Google Scholar] [CrossRef]
  61. Wang, W.L.; Zhao, J.; Cheng, Q.M. Application of singularity index mapping technique to gravity/magnetic data analysis in southeastern Yunnan mineral district, China. J. Appl. Geophys. 2013, 92, 39–49. [Google Scholar] [CrossRef]
  62. Xiao, F.; Chen, J.G.; Zhang, Z.Y.; Wang, C.B.; Wu, G.M.; Agterberg, F.P. Singularity mapping and spatially weighted principal component analysis to identify geochemical anomalies associated with Ag and Pb-Zn polymetallic mineralization in Northwest Zhejiang, China. J. Geochem. Explor. 2012, 122, 90–100. [Google Scholar] [CrossRef]
  63. Zhao, J.; Zuo, R.; Chen, S.; Kreuzer, O.P. Application of the tectono-geochemistry method to mineral prospectivity mapping: A case study of the Gaosong tin-polymetallic deposit, Gejiu district, SW China. Ore Geol. Rev. 2015, 71, 719–734. [Google Scholar] [CrossRef]
  64. Zuo, R.G.; Cheng, Q.M.; Agterberg, F.P.; Xia, Q.L. Application of singularity mapping technique to identify local anomalies using stream sediment geochemical data, a case study from Gangdese, Tibet, western China. J. Geochem. Explor. 2009, 101, 225–235. [Google Scholar] [CrossRef]
  65. Zuo, R.G.; Xia, Q.L.; Zhang, D.J. A comparison study of the C–A and S–A models with singularity analysis to identify geochemical anomalies in covered areas. Appl. Geochem. 2013, 33, 165–172. [Google Scholar] [CrossRef]
  66. Zuo, R.G.; Carranza, E.J.M.; Wang, J. Spatial analysis and visualization of exploration geochemical data. Earth Sci. Rev. 2016, 158, 9–18. [Google Scholar] [CrossRef]
  67. Chen, J.; Li, Z.D. Application of 1:10000 soil geochemical survey in the general survey of gold deposits in Gazhima area. Mod. Min. 2016, 32, 188–190. [Google Scholar]
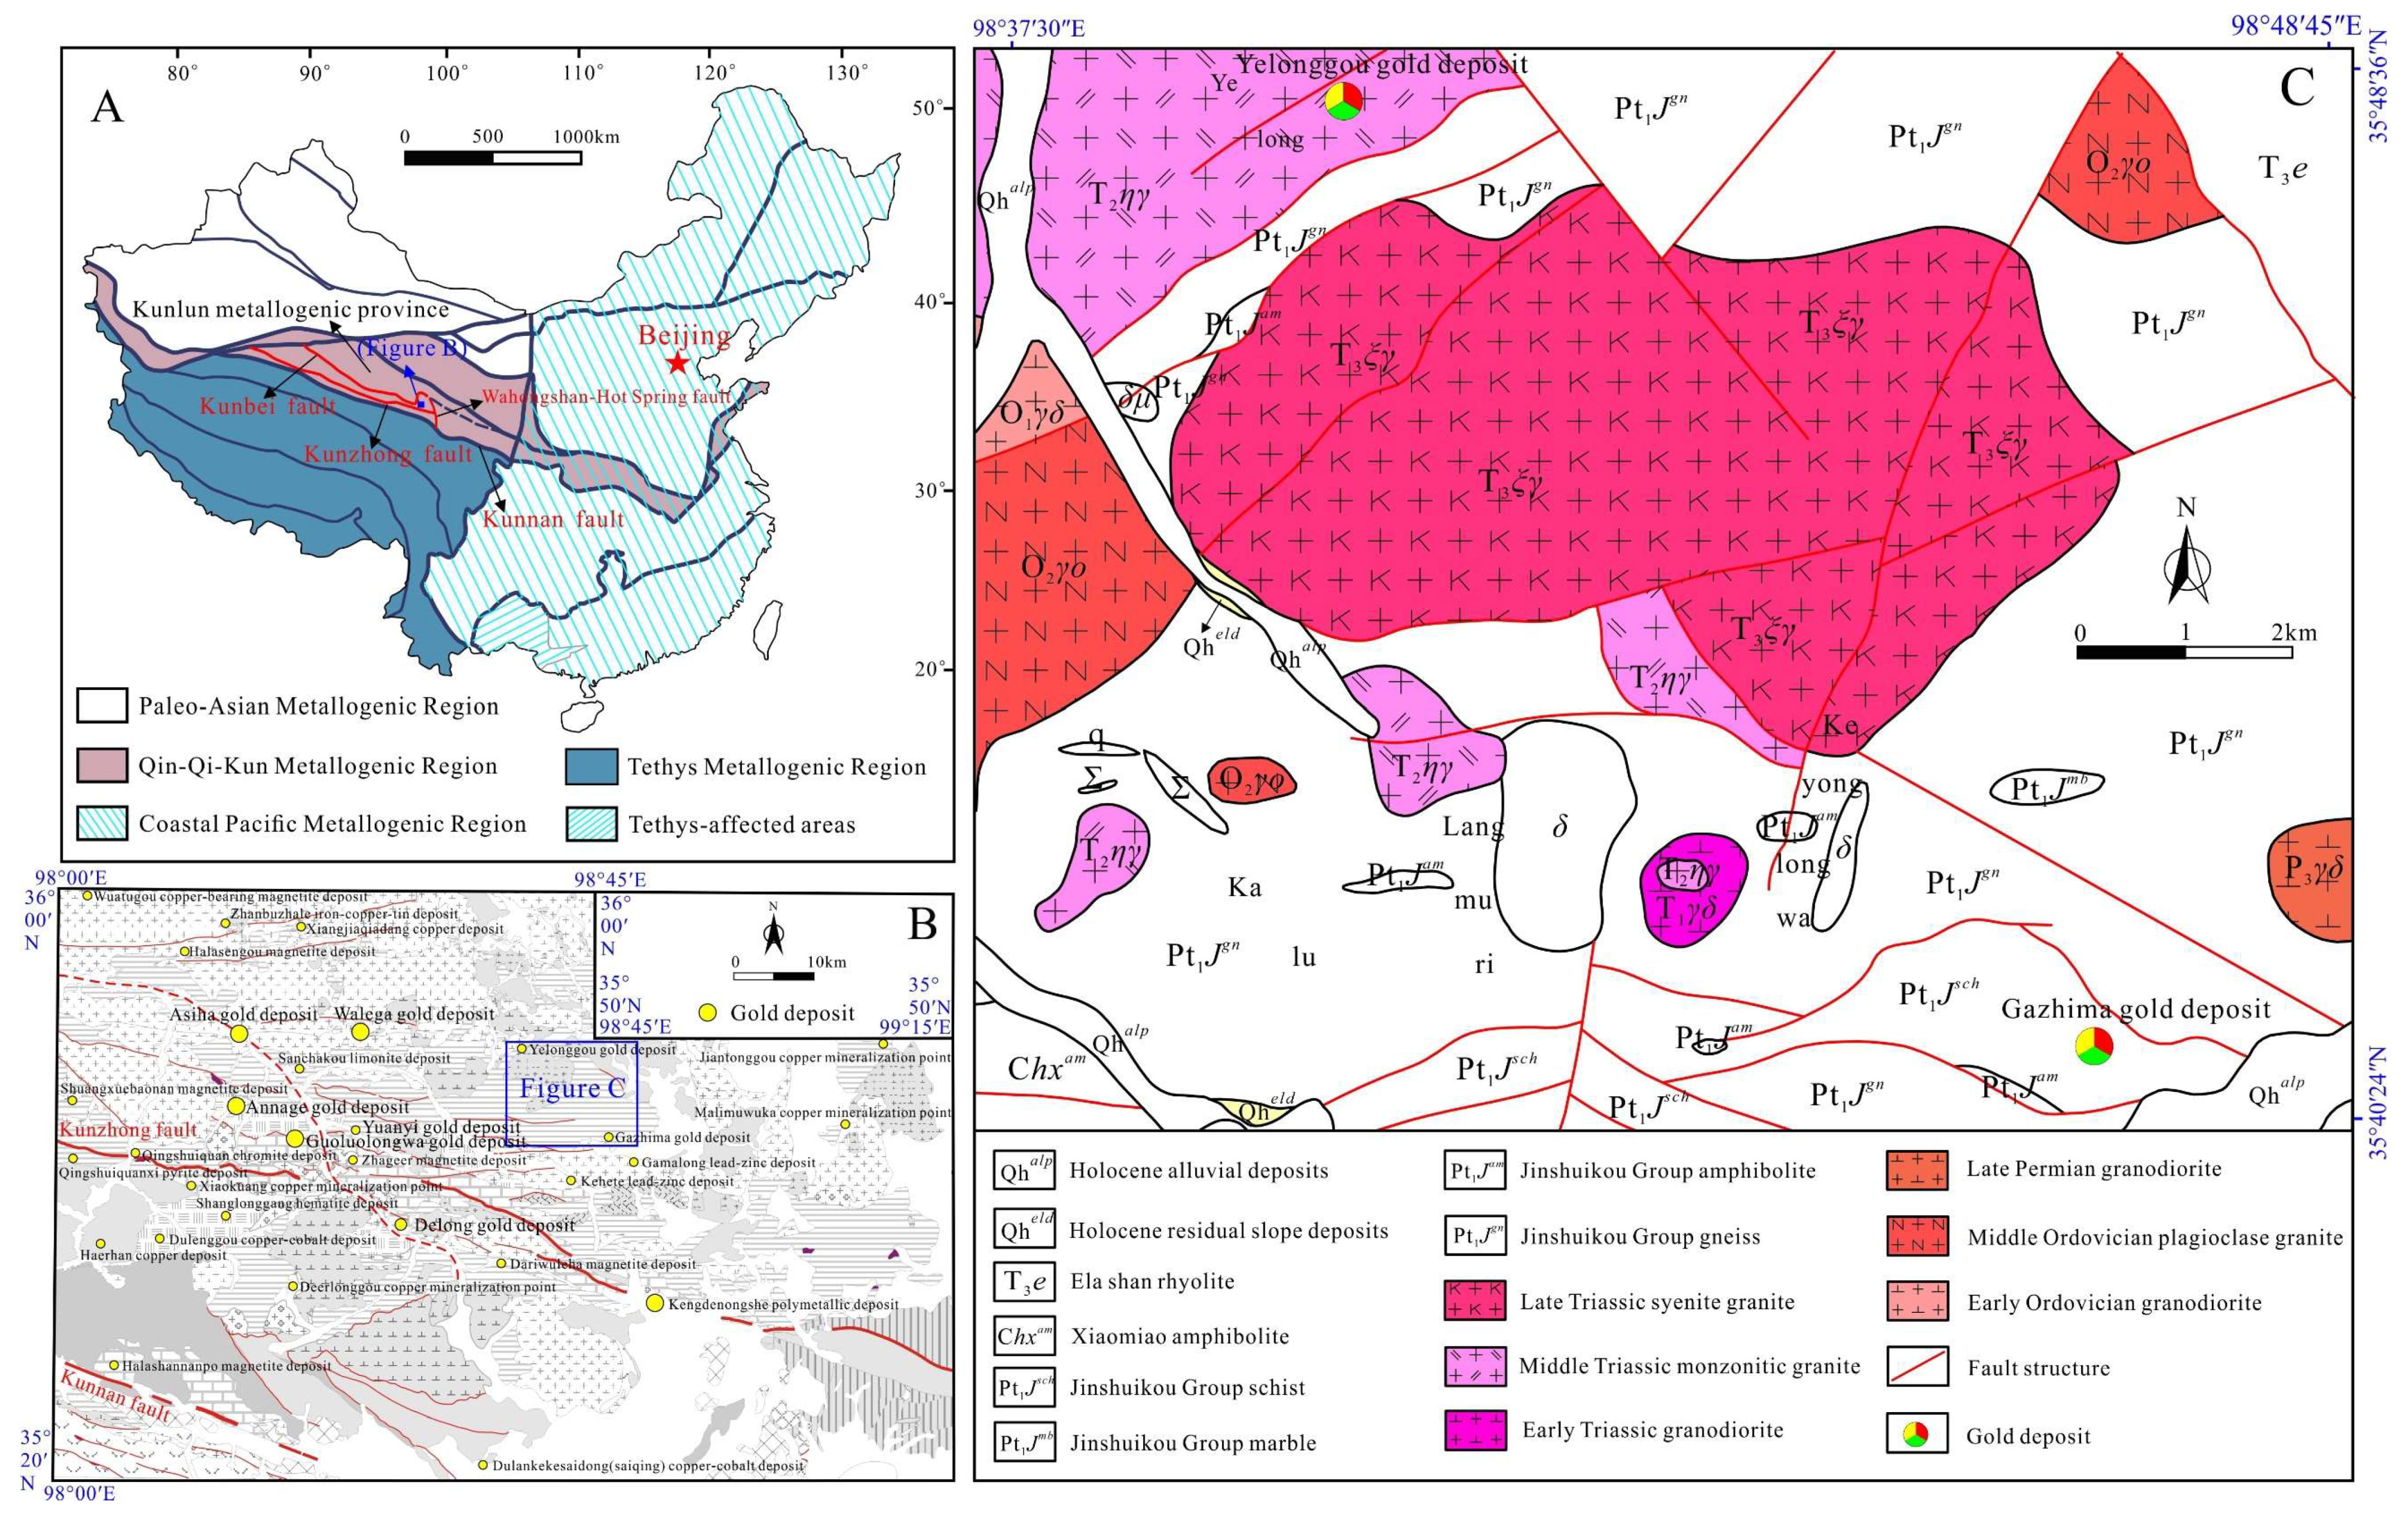
Figure 1. (A) The landscape zoning map of China and the location of the Gouli area; (B) regional geological map of the Gouli area; (C) a quarter of a geological map of the Gouli exploration area in Qinghai Province (measured).
Minerals 09 00368 g001
Figure 2. The map of the sampling location in the Gouli exploration area.
Minerals 09 00368 g002
Figure 3. The histogram of concentration of Au in the study area.
Minerals 09 00368 g003
Figure 4. Schematic diagram of Boxplot.
Minerals 09 00368 g004
Figure 5. (a) Structure outline map in the Gouli exploration area, Qinghai Province; (b) spatial distribution of Au anomalies by cumulative frequency method; (c) spatial distribution of Au anomalies by local singularity analysis; (d) spatial distribution of Au anomalies by exploration data analysis method.
Minerals 09 00368 g005
Figure 6. Biplots of RPCA based on clr-transformed data for the regional geochemical data from the Gouli exploration area. The lower and left axis scales represent the variable loading values in PC1 (principal component 1) and PC2 (principal component 2), respectively (the position of element symbols represents the variable loading values), while the upper and right axes represent the principal component scores corresponding to the upper and right axes, respectively (the position of gray cross symbols represents the score).
Minerals 09 00368 g006
Figure 7. Maps showing the spatial distribution of the singularity index for Au (a), Sb (b), W (c), and As (d) in the Gouli exploration area, Qinghai Province.
Minerals 09 00368 g007
Figure 8. The spatial distribution maps of associated elements Sb (a), W (b), and As (c), and compositional elements of Au, Sb, W, and As (d) by local singularity analysis.
Minerals 09 00368 g008
Figure 9. Score diagram of binary states of 100 small areas. Note: The figures of red and blue in the picture are the scores of each small area.
Minerals 09 00368 g009
Figure 10. The prospecting targets of gold by local singularity analysis in the Gouli exploration area, Qinghai Province.
Minerals 09 00368 g010
Figure 11. Representative photographs of anomaly area I from the Gouli exploration area, Qinghai Province. (a) The position of the gold ore-body in TC01; (b,f) the gold ore-body with strong ferritization; (c,d) the gold ore-body with strong malachitization; (e) the gold ore-body with strong pyritization in the quartz vein.
Minerals 09 00368 g011
Table 1. Au eigenvalue table of different geological units in the study area.
Geological UnitsAmountMean ValueMedianStandard DeviationVarianceSkewnessKurtosisMinimum ValueMaximum Value
Whole area7641.321.10.950.913.4617.570.58.4
Quaternary401.210.750.572.558.140.54.4
Late Triassic intrusive rocks1611.361.10.930.863.0714.480.57.7
Middle Triassic intrusive rocks611.641.31.432.063.0410.280.68.3
Permian intrusive rocks341.731.70.740.540.16−1.420.92.6
Ordovician intrusive rocks401.040.950.360.131.664.090.62.4
The strata of the Ela mountains261.291.050.680.460.86−0.190.52.7
The strata of Jinshuikou Group3851.3110.950.93.4417.840.58.4
The strata of Xiaomiao171.20.90.510.261.441.810.82.2
Note: Geological units have no dimension, the dimension of amount is a piece, and the dimension of the remaining values in the table is ppb.
Table 2. Comparison table of three methods in Gouli exploration area.
MethodsAbnormal Threshold ValuesAbnormal AreasGeological Body Occurrence
Cumulative frequency method1.99.47Triassic intrusive rocks and Jinshuikou Group strata
Local singularity analysis1.714Triassic intrusive rocks and Jinshuikou Group strata
Exploration data analysis method2.557.66Triassic intrusive rocks and Jinshuikou Group strata
Note: The dimension of abnormal threshold value is ppb, the dimension of abnormal area is km2, and the rest is dimensionless.
Table 3. The concentrations of Au, Sb, W, and As, and compositional elements in the same window as singularity index (α).
ElementsMaximum ValueMinimum ValueThe Concentration at the Same Window as Singularity Index α when Singularity Index (α) Is Close to 2 Infinitely
Au (ppb)8.40.51.4
Sb (ppm)5.160.20.6
W (ppm)6.050.50.8
As (ppm)86.791.9510.1
Au + Sb + W + As (ppm)68.541.862.4
Note: The values of compositional elements of Au, Sb, W, and As are calculated by the scores from the ilr-transformation.
Table 4. The scoring rules table of binary state.
Output Characteristics of Gold DepositsYes (Scoring)No (Scoring)
If there are faults or structure alteration zones10
If the geological unit is Triassic intrusive rock or Jinshuikou Group strata 1 0
If mineralization alteration is mainly pyritization, ferritization and galena mineralization10
If there are strong anomalies of Au10
If there are the abnormal compositional elements of Sb, As, and W10