Article

Tectonic and Thermal Controls on the Nano-Micro Structural Characteristic in a Cambrian Organic-Rich Shale

1
Key Laboratory of Computational Geodynamics, College of Earth and Planetary Sciences, University of Chinese Academy of Sciences, Beijing 100049, China
2
Shanxi Huapu Testing Technology Co., Ltd., Taiyuan 030000, China
*
Author to whom correspondence should be addressed.
Minerals 2019, 9(6), 354; https://doi.org/10.3390/min9060354
Submission received: 16 April 2019 / Revised: 24 May 2019 / Accepted: 27 May 2019 / Published: 10 June 2019
(This article belongs to the Special Issue Nanomineralogy)

Abstract

:
Until recently, the characteristics of nano-microscale structures in the naturally deformed, overmature, marine shales were poorly known. Thermally overmature Lujiaping shales in the complex tectonic area of the northeast part of the upper Yangtze area, China have experienced strong tectonic deformation and are considered as potentially important strata for shale gas exploration. Naturally deformed samples from the main source rocks are selected from the Lower Cambrian Lujiaping Formation in the Dabashan Thrust-fold Belt to investigate nanometer- to micrometer-sized structures. A combination of scanning electron microscope (SEM), low-pressure nitrogen adsorption (LPNA), and low-field nuclear magnetic resonance (NMR) suggests that the pore types are dominantly fracture-related pores with a lesser abundance of mineral-hosted pores. These two pore types account for the 90% of total pore space. Organic matter (OM)-hosted pores are rare and make up a small part of the pore systems (less than 10%) due to high thermal maturity and intensive tectonic compression. Overall, the Lujiaping deformed, overmature samples have abundant nanometer- to micrometer-sized inorganic pores. High-resolution SEM images provide direct evidence of the formation of nano- and microsized structures such as OM–clay aggregates and silica nanograins. OM–clay aggregates are commonly observed in samples, which also exhibit abundant open microfractures and interparticle pores. Quartz can occur as silica nanograins and botryoids typically 20–100 nm in size, which may influence porosity through the creation or occupying interparticle pore space.

1. Introduction

Unconventional natural gas production from organic rich shales makes up an ever increasing percentage of total natural gas production all over the world [1,2]. Shale gas exploration and development, initiated successfully in the North America and extended to China, will have application in several other countries in the coming years [1,2,3,4]. Organic-rich shale currently produces commercial unconventional hydrocarbons and exhibits a wide variation in nano- and microscale geological attributes and geochemical properties [1,2,3,4,5]. The lower Cambrian Lujiaping Formation marine, organic-rich shales in the Dabashan Thrust-fold Belt of South China are being studied for their potential as shale gas reservoirs [6,7,8,9,10]. Several studies have discussed structural style and conditions of shale gas enrichment [6,10], while other studies have characterized microstructures and associated reservoir quality [7,8,9]. Such investigations concentrate on nano- to microscale pore systems in the Lujiaping Shale using high-pressure methane sorption analysis, mercury injection capillary pressure (MICP), low-pressure nitrogen adsorption (LPNA), low-field nuclear magnetic resonance (NMR), and focused ion beam-scanning electron microscope imaging (FIB-SEM). These techniques have been used both qualitatively and quantitatively to determine pore sizes and pore types in shale for many years [11,12,13,14,15,16,17,18]. In this paper, the tectonic and thermal controls on the evolution of nanometer- to micrometer-size pore structures and inorganic/organic structures in the Lujiaping shales are discussed.
The contribution of thermogenic, OM-hosted nanopores to overall porosity is such that organic porosity can be as high as 40% of total porosity [19,20,21,22,23,24]. However, recent studies have suggested that organic porosity in naturally deformed shales are poorly developed, and that fractured-related and mineral-hosted pores are more widely recognized as being the most significant components of porosity in naturally deformed shales [25,26,27]. The discovery of mineral-hosted and fracture-related pore systems in naturally deformed shales sparked many questions concerning their characteristics, prediction, and reservoir quality: (1) Are such pore networks primary (hosted within initially particles and shale matrix) versus secondary (formed during tectonic deformation)? (2) Is the lack of organic pore development due to thermal evolution, tectonism, or the combination of the both? (3) What is the function of tectonism in the occurrence and thermal evolution of organic pore systems? In addition, the formation of nanosized to microsized structures (clay–organic nanocomposites and nanograins) in the process of tectonic evolution has also attracted much attention from scholars. The answers to such questions are central to making wise decisions on the benefits or detriment of microstructural properties in shale gas reservoirs.
The structural evolution of organic-rich shale in complex tectonic areas of South China has received little attention [7,8,9,25,26]. In this paper, we use outcrop samples from the fractured and folded shale layers of the Lujiaping Formation to study the influence of the tectonic deformation and thermal maturity on the nanometer- to micrometer-sized structures. The main objectives of this paper are to (1) describe the deformation microstructures and mineralogy of the Lujiaping Shale samples, (2) characterize the common pore types, (3) quantify the pore size distribution (PSD), (4) describe the features of OM–clay aggregates and silica nanograins, and (5) discuss the evolution of reservoir characteristics in Cambrian organic-rich shale during thermal maturation and structural deformation. We hope these results will provide a fundamental starting point for continued research on the reservoir properties in naturally deformed, overmature shale systems.

2. Geological Background and Sample Characterization

The Sichuan Basin, which is a huge superposed basin and the largest shale gas-producing region in China, is geologically complicated due to a complex interaction of multistage tectonic movements and sedimentary history [28,29,30,31]. Since the Yanshanian movement (~180–140 Ma), fold belts and detachment belts, as well as thrust belts, have formed in the peripheral areas by intensive lateral compression, which has caused complex folds and faults combinations [29]. The basin is bounded by the Longmenshan fault in the west, the Micangshan uplift in the north, the Dabashan intracontinental orogen in the northeast, the Daloushan in the southeast, and the Emei-Daliangshan fold belt in the southwest [29] (Figure 1a). The Dabashan thrust-fold belt is separated into the South Dabashan and the North Dabashan by the NW-striking Chengkou fault in the transitional zone of the northeast edge of the upper Yangtze block; thus forming a thrusting nappe, ductile shear zone in the front edge of the orogen [6,7,10] (Figure 1b). Shale gas in these deformed rocks is well-preserved and exploration activity has revealed a high gas content [7,8].
Representative shale samples were selected from two groups of organic-rich, overmature samples characterized by different deformation structures and from two outcrops (e.g., Longtian and Xiuqi in Chongqing) [9,25,26]. Nanosized to microsized structural characteristics within the Lujiaping Formation are studied in relation to structural deformation and maturation. The sample numbers are abbreviated as L1, L2, L3, and L4 in the fractured zone of Longtian and D1, D2, D3, and D4 in the intensive folds of Xiuqi. Primary sedimentary structures from the Longtian outcrop are difficult to discern due to the presence of brittle deformation structures and abundant calcite veins. Some microfractures developed along grain cleavage or other preexisting weak zones are filled with calcite and partially faulted, showing certain displacement and movement directions and strongly brittle deformation (Figure 2a,b). Four deformed shales taken from the Xiuqi outcrop have been mylonitized almost completely, resulting in distinct anisotropy. We have observed abundant evidence of ductile or brittle deformation such as microfolds, S-C fabric, microfracture, and cataclastic flow in these shales at millimeter and micrometer scales (Figure 2c,d).

3. Methods

3.1. Geochemistry and Petrology

Before experimental analyses of organic geochemistry, each sample was ground to a fine powder (less than 100 mesh) and removed carbonates using hydrochloric acid. The total organic carbon (TOC) was measured by a LECO CS-230 Carbon/Sulfur Analyzer (San Joseph, MI, USA). A 3Y-Leica DMR XP microscopy (Lycra, Frankfurt, Germany) equipped with a microphotometer (MPV-Ⅲ) was used to measure the Ro of shale samples with vitrinite particles measured at least 30 times. The samples prepared for whole-rock mineralogical analysis were crushed and sieved to 80 mesh size, mixed with ethanol, and then smear mounted on glass slides for random powder X-ray diffraction (XRD) analysis. Scanning range is 5°–80° and speed 4°/min.

3.2. Thin Section Microscopy and SEM Imaging Analyses

The nano-microscale structures were directly observed and described using thin section and SEM. All polished thin sections were analyzed for rock fabrics and microstructures. Standard procedures were used in preparing the thin-section. Thin sections are 30–40 μm thick and 3 cm long, and petrographic studies were done using a Leica DMLP polarizing microscope (Lycra, Frankfurt, Germany) with a Leica DFC450C camera system. The SEM is equipped with low and high secondary electron probes and an X-ray spectrometer. Samples were cut into 5 mm × 5 mm × 5 mm chips and polished to 0.1 mm thick using argon ion-milling. Gold coating is 20 nm thick. Structures can be measured on SEM images using the ImageJ software that is chosen for 2-D and 3-D modeling [32].

3.3. Low-Pressure Nitrogen Adsorption (LPNA)

LPNA analyses have been used to quantify pore structures using N2 adsorption at −196 °C by an automated pore size analyzer (Autosorb IQ, Quantachrome, Boynton Beach, FL, USA). The pore size distribution analysis was calculated using the density function theory (DFT) calculation model, which can provide a more accurate approach for pore size analysis in the micro- to mesopore-scale [26]. Therefore, in the present study, powered samples were analyzed with N2 adsorption to obtain information about micropores and mesopores; macropores are also observed by SEM imaging.

3.4. Low-Field Nuclear Magnetic Resonance (NMR)

The samples were also taken for low-field NMR, which has been widely used in porous rocks, such as coal, gas shale, and oil shale [13,19,33,34,35]. The theory of this method is that T2 can provide abundant information associated with pore fluids in porous rocks in a typical low-field NMR measurement. In other words, the pore fluid shows a linear relationship with the NMR T2. All samples were resaturated with water for NMR analyses. Based on this theory, the pore size distribution (PSD) can be reflected in the NMR T2 spectrum, with a lager pore space having a longer NMR T2 relaxation time and smaller pores having a shorter relaxation time [19]. A detailed description of such methods can be found in Yao et al. [13].

4. Results

4.1. Organic Geochemistry and Mineralogy

Organic geochemistry and mineralogy of Lujiaping sediments are well-documented as rich source rocks [7,8,9]. It is important to characterize the TOC, Ro, and mineral composition of samples because each of these parameters has a significant effect on pore structural evolution and pore type [19,36]. Organic geochemistry and mineralogy data of the shale samples are shown in Table 1. All shale samples display high-quality organic carbon (TOC > 2.17%), while Ro ranges from 2.92% to 3.26%. The dominant mineral constituents throughout all samples are quartz, carbonate, and feldspar with an average of 48%, 16%, and 11%, respectively; clay minerals and pyrite with an average of 17% and 6.5%, respectively. These samples have a high content of brittle minerals.
The literature shows that the Lujiaping Formation organic-rich shales have variable TOC content, Ro, and mineral composition [7,8,9]. Ma et al. [7] and Han et al. [8] measured the TOC values of 0.44% and 6.91%, and vitrinite-like macerals reflectance (Ro) between 3.3% and 4.3% with type II kerogen for the Lower Cambrian Lujiaping shale in the Dabashan arc-like thrust-fold belt, southwestern China. Other studies of the Lujiaping Formation describe similar mineralogy to those presented here [9]. As pointed out by Zhu et al. [9], the Lujiaping Shale samples are all quartz and carbonate minerals rich and all contain greater than 50% relatively brittle minerals (quartz, carbonate, and feldspar). In general, the shale with high levels of brittle minerals can increase the effectiveness of hydraulic fracturing of a shale gas reservoir.

4.2. Nanometer- to Micrometer-Sized Pore Structures

Gas storage structures of shale form by both depositional and diagenetic processes, affected by thermal evolution and tectonic deformation [9,12,19,23,25,26,36]. Abundant nanometer- to micrometer-sized pores can be observed in shale matrix exhibiting variance in size, shape, and abundance [12,19,20]. Loucks et al. [20] suggested that geoscientists working on shales use pore size terminology whereby nanopores have widths less than 1000 nm. Pore space can also be divided into micropores (pore width <2 nm), mesopores (pore width between 2 and 50 nm), and macropores (pore width >50 nm) as recommended by the International Union of Pure and Applied Chemistry (IUPAC). Loucks et al. [20] and Slatt and O’Brien [37] used SEM to characterize and define abundant types of gas storage space, such as OM pores, interparticle pores, intraparticle pore, microchannels, and microfractures.
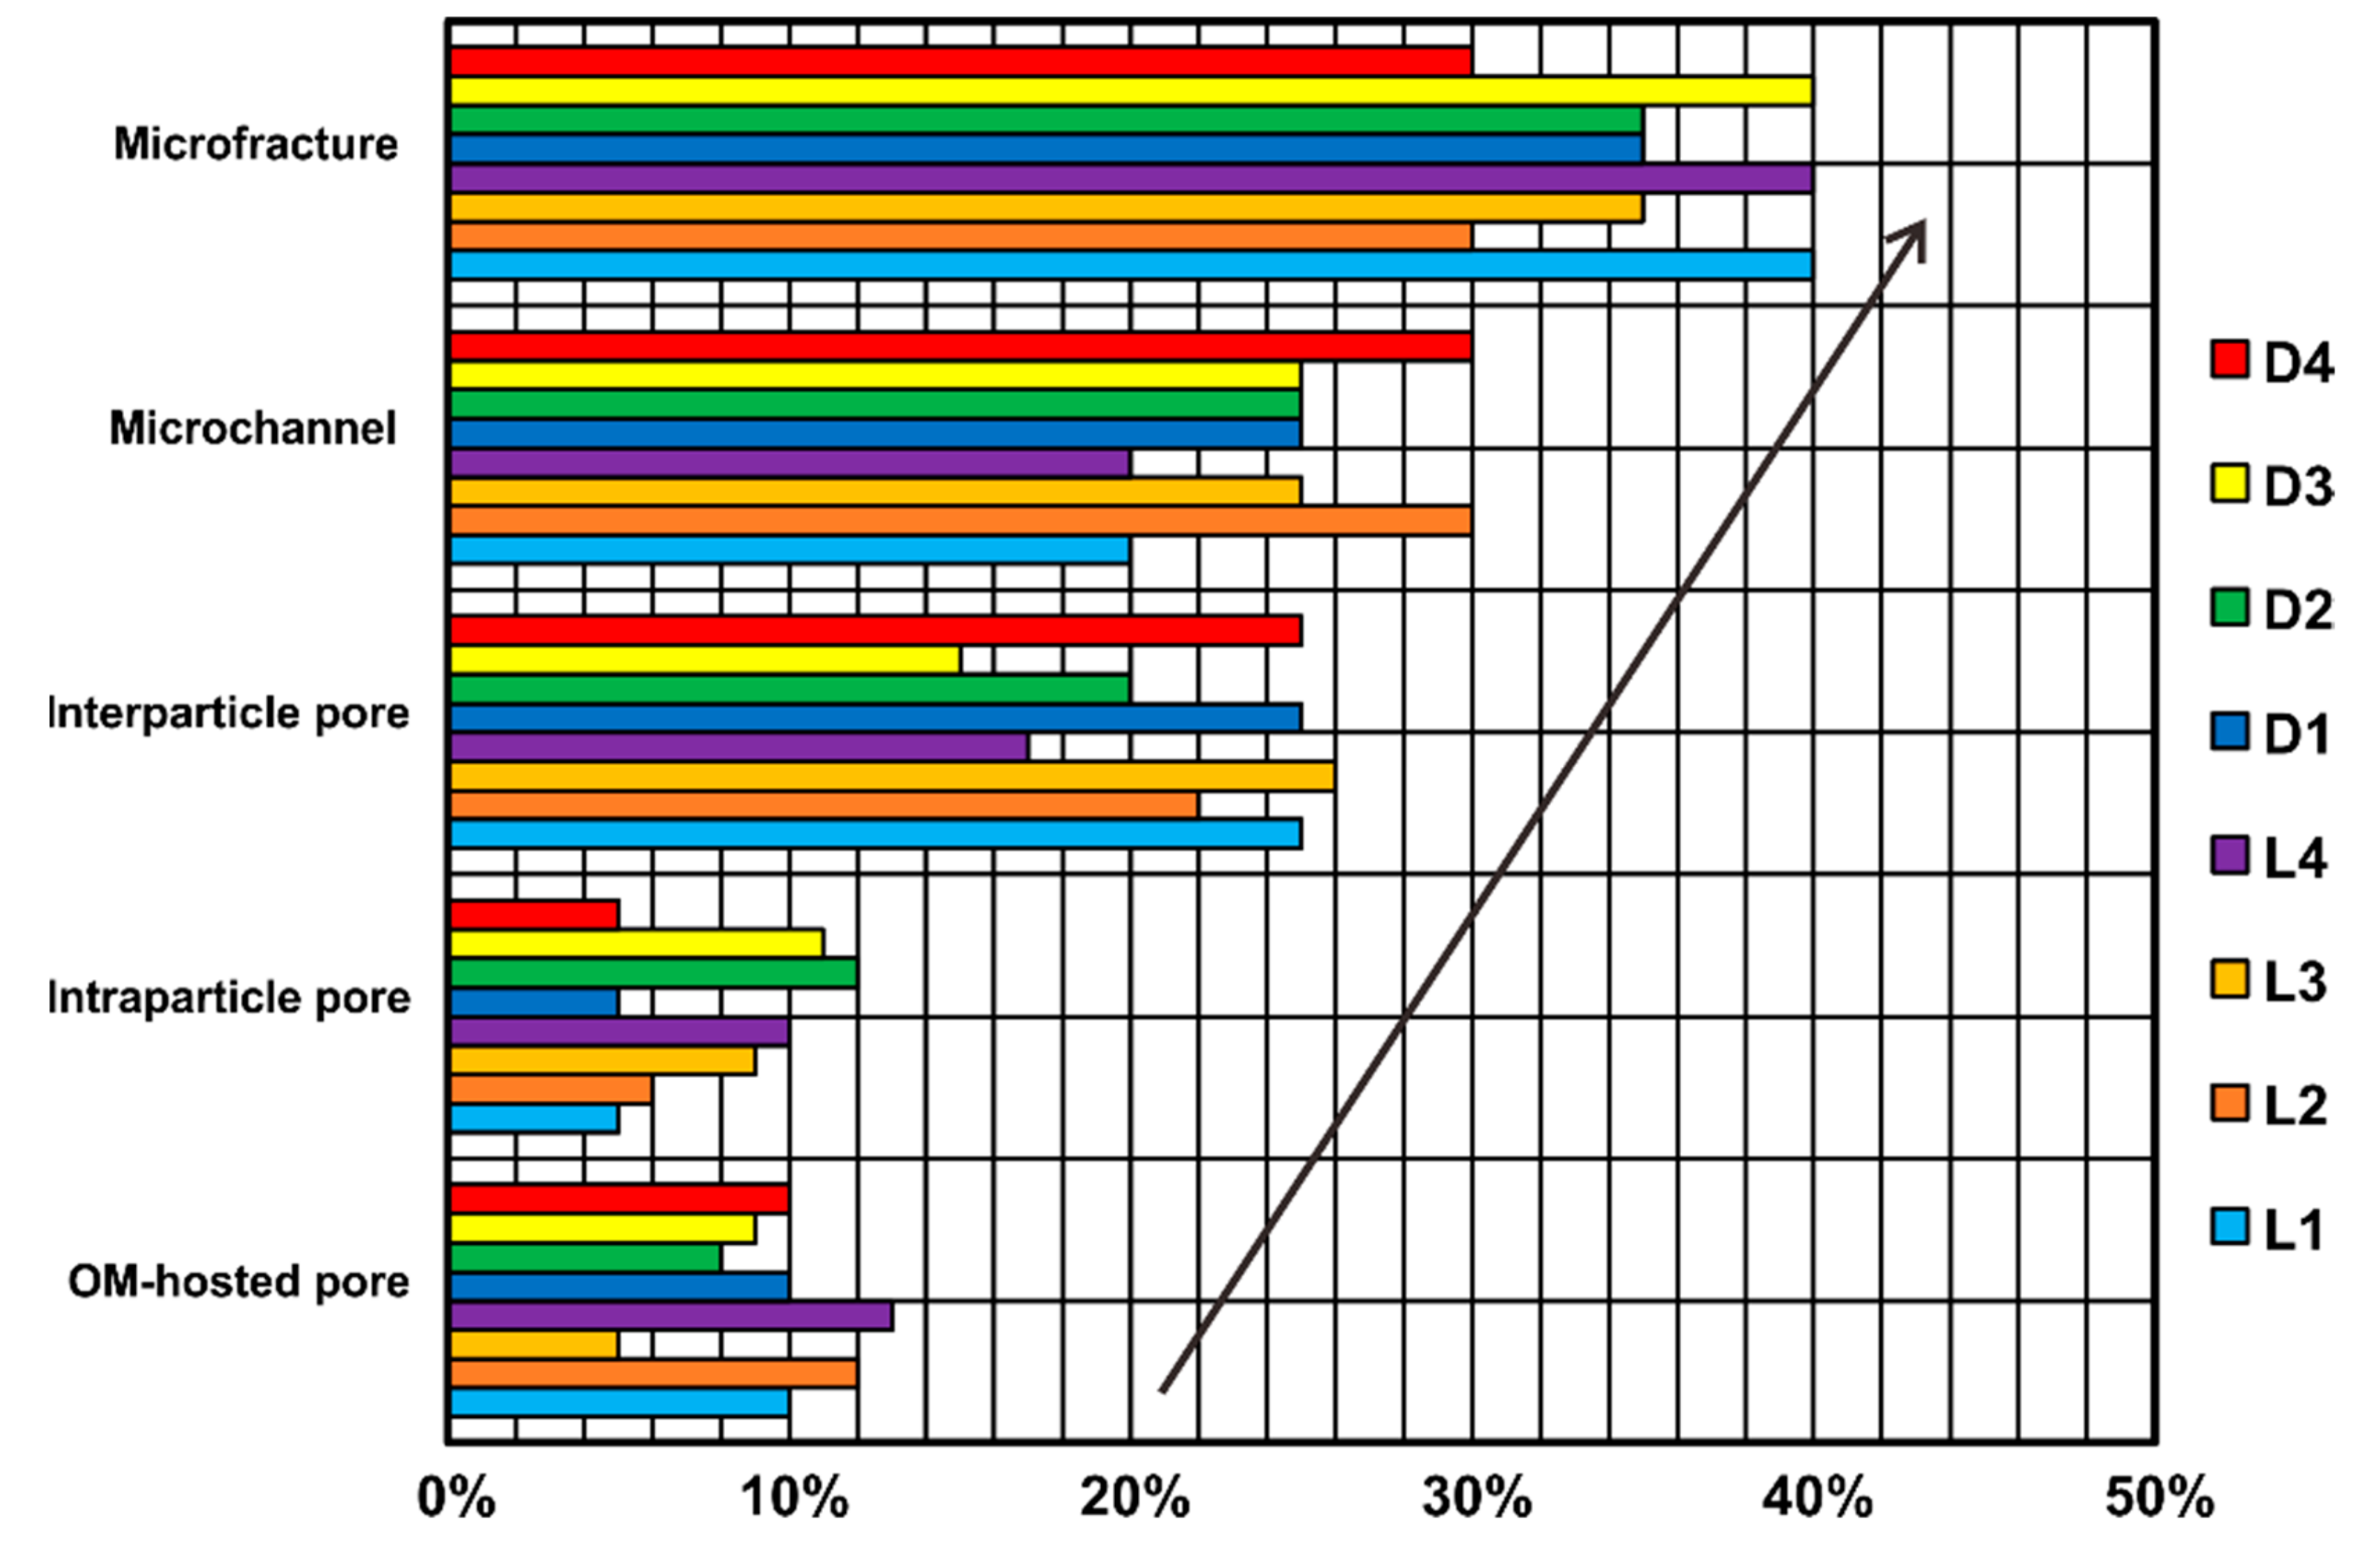
A major aim of this study is to document and characterize visible pore types using FIB-SEM and to define major pore networks. Several recent articles have addressed pore types and pore networks in the Lujiaping Shale using FIB-SEM, gas adsorption, high-pressure mercury injection, and low-field NMR [7,8,9]. However, none of these studies clarified the size distribution of different types of shale pores and compared these results. Several types of pores occur within the samples: (1) OM-hosted pore, (2) mineral-hosted pore (e.g., intraparticle pore and interparticle pore), and (3) fracture-related pore (e.g., microchannel and microfracture). OM-hosted pore is one of the important matrix-related pore types and associated with organic particles; mineral-hosted pore is another matrix-related pore space and associated with mineral grains, and lastly, fracture-related pore is linear nanometer to micrometer size opening whose derivation is not controlled by individual matrix particles [20]. The relative abundance of each pore type quantified by this investigation is plotted on a histogram (Figure 3), following the Slatt and O’Brien [37], Loucks et al. [20], and Ko et al. [38] classification. These pore types were quantified by point counting SEM images using ImageJ software, as discussed in the Section 3.2. Note that there is plenty of evidence of pore networks within OM–clay aggregates of the deformed shales studied in this investigation. Characterizing different pore types and pore networks in the OM–clay aggregates is discussed later.

4.2.1. Fracture-Related Pores

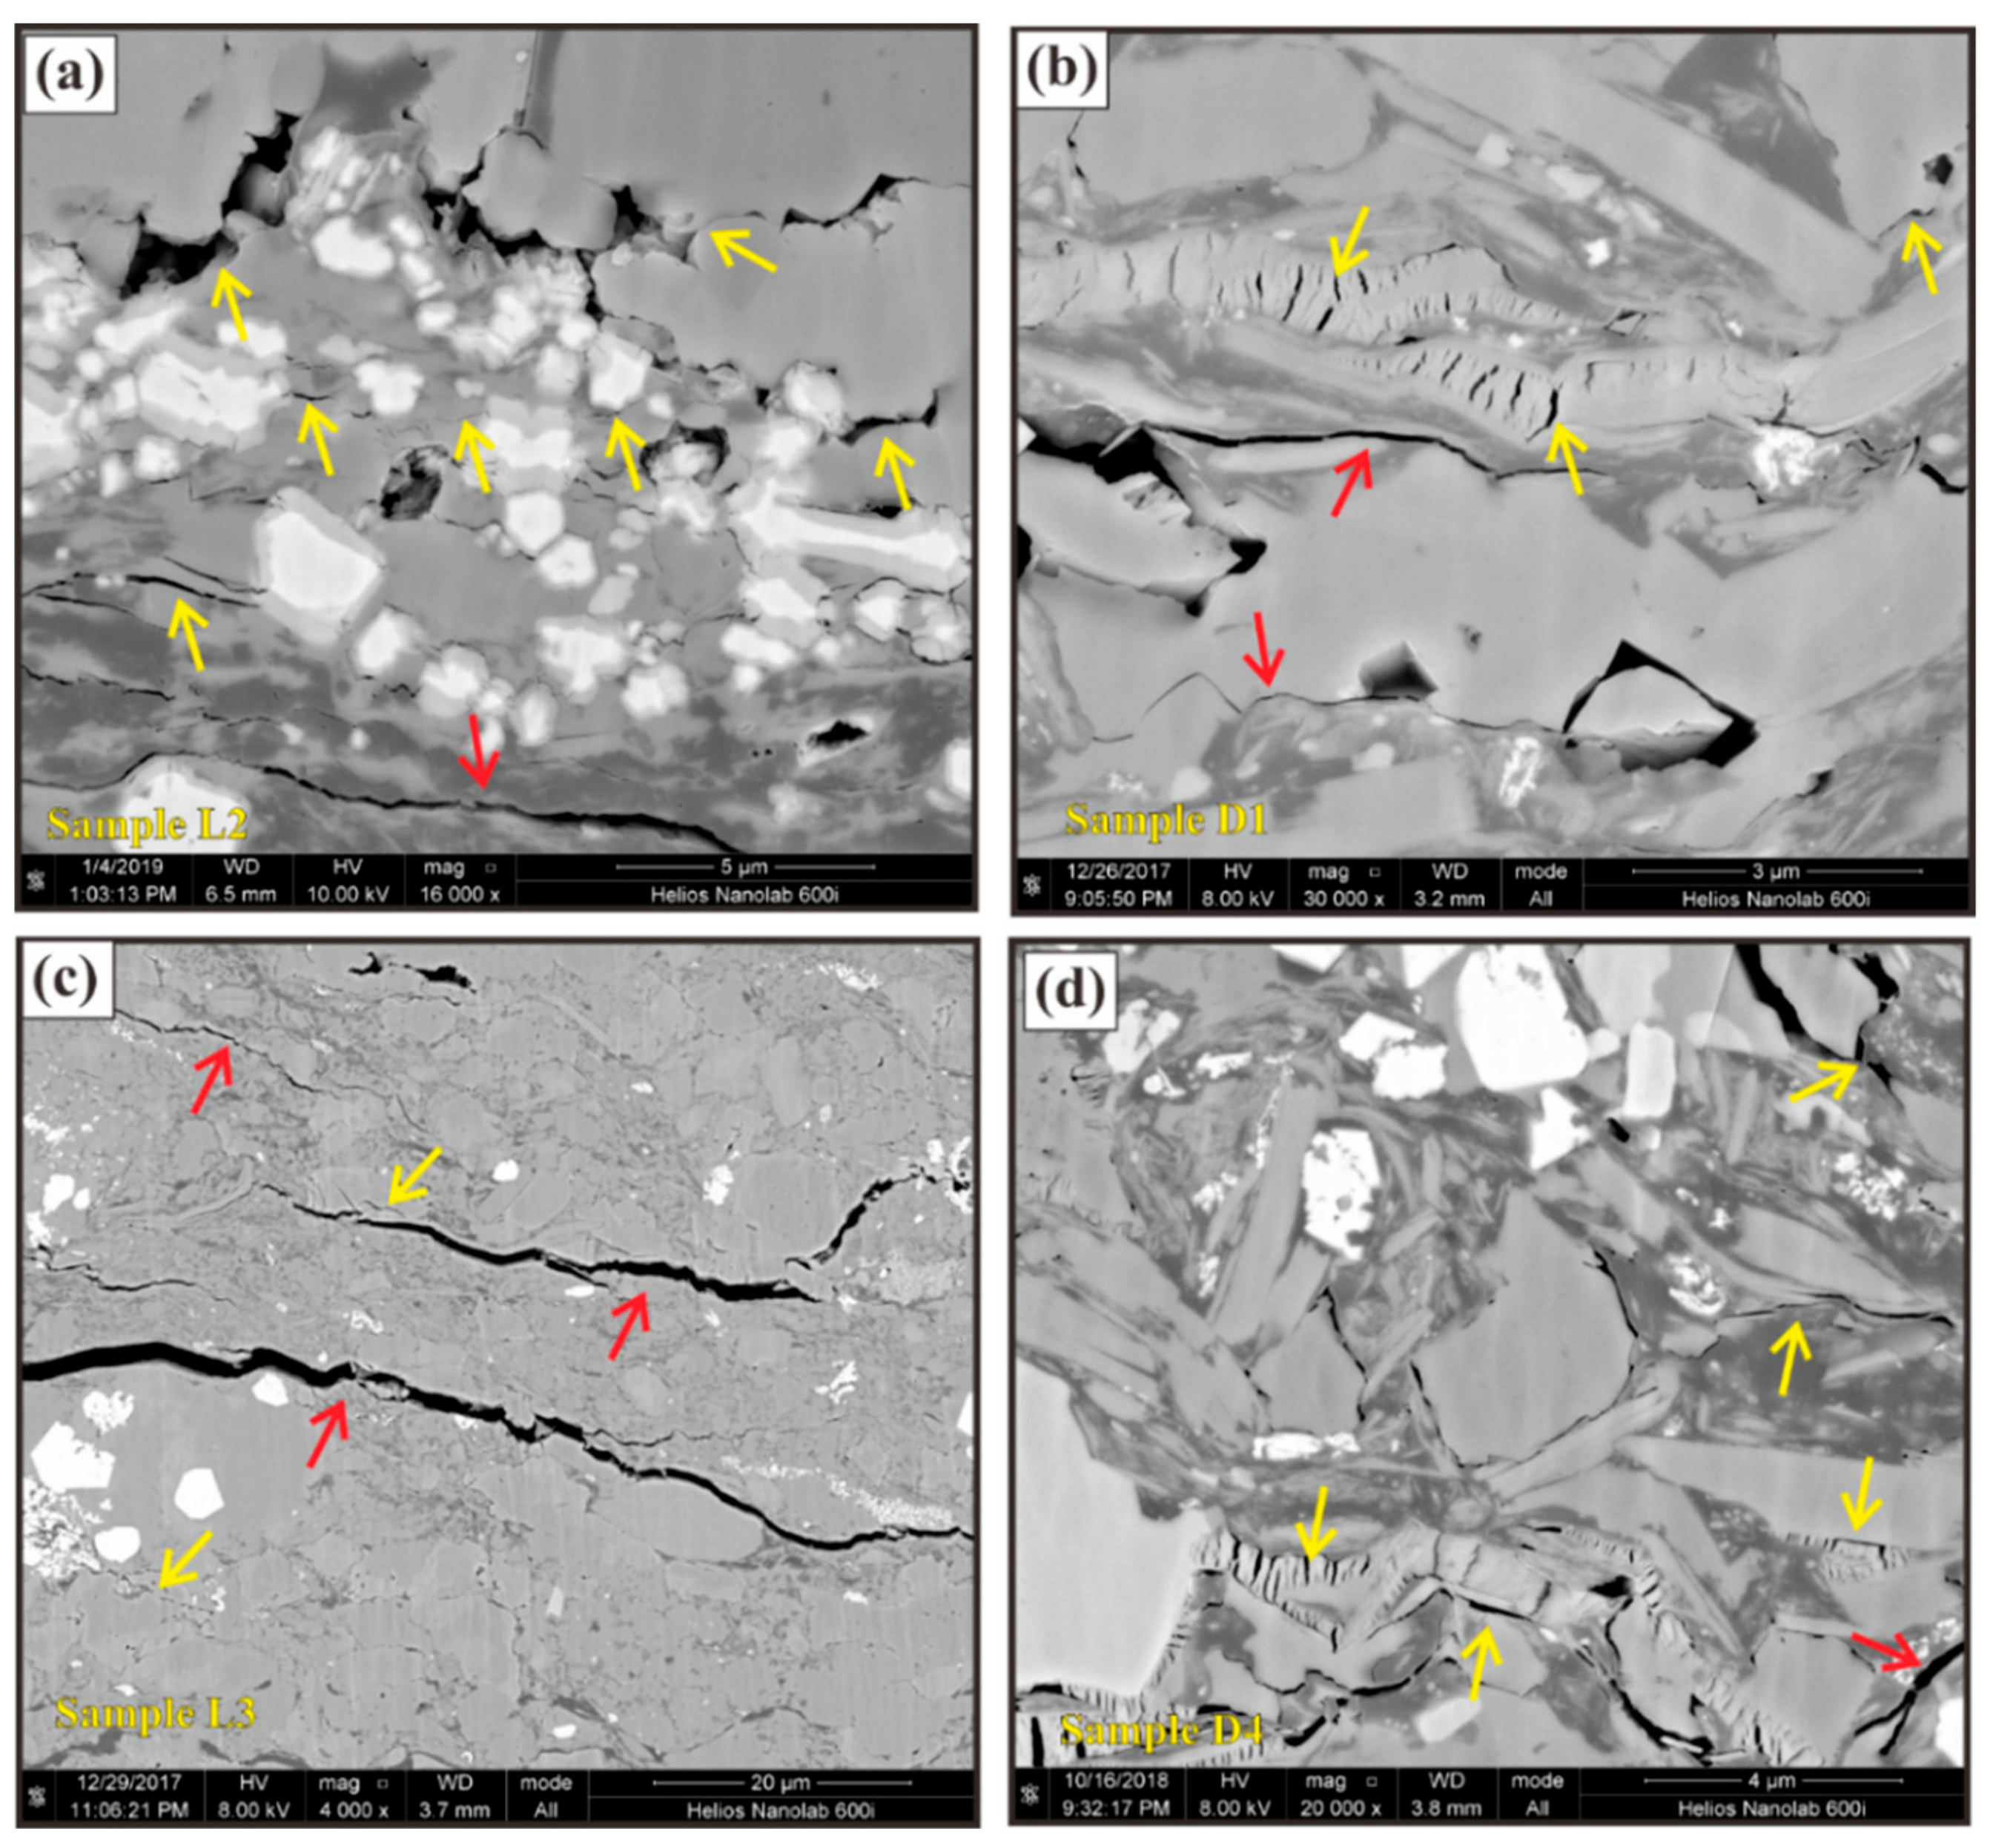
Microchannels and microfractures are the two most common fracture-related pores in the naturally deformed Lujiaping samples (Figure 4). The relative abundance of microchannels and microfractures appears to vary with tectonism. For example, in deformed shales, microchannels and microfractures are more abundant [9,11,25,39,40] than that in undeformed shales [19,20,37]. A large quantity of open microchannels and microfractures has been found in the samples that we have investigated using SEM-based imaging. These open fracture-related pores are nonmatrix pores, which can have an important effect on hydrocarbon production [11,20,37]. Lujiaping shale gas reservoirs have large amounts of microchannels and microfractures that are not cemented and impermeable. Therefore, the presence of preexisting fractures can have a strong influence on induced fracture propagation. These open pores are linear nanometer to micrometer-sized openings, whereas microchannels have relatively smaller size and a stronger local connection than that of the microfracture [37]. Microchannels occur within the matrix of shale samples have various sizes and shapes (Figure 4a,b), and may provide significant permeability pathways. Such microchannels observed by SEM are generally more than 100 nm in width and 200 nm in length. Microfractures in the Lujiaping deformed shales occur at a variety of widths and lengths (Figure 4c,d). They are more than 300 nm in width and 2000 nm in length. Such pore types are open and may connect to adjacent pores (example Figure 4b) and create even better permeability [20]. Figure 4 shows fracture-related pores within the deformed Lujiaping Shale that are similar to pores described by Zhu et al. [9].
Note that fracture-related pores can be produced during both thermal maturity and tectonic deformation [9,22,23,24,25]. Formation of thermally controlled fractures is related to thermal cracking within OM or at the boundary between OM and mineral particles [22,23,24]. Instead, tectonically controlled fractures are primarily related to the presence of brittle mineral grains [9,25,39,40]. Such fractures appear extend far enough to cut through or around mineral particles.

4.2.2. Mineral-Hosted Pores

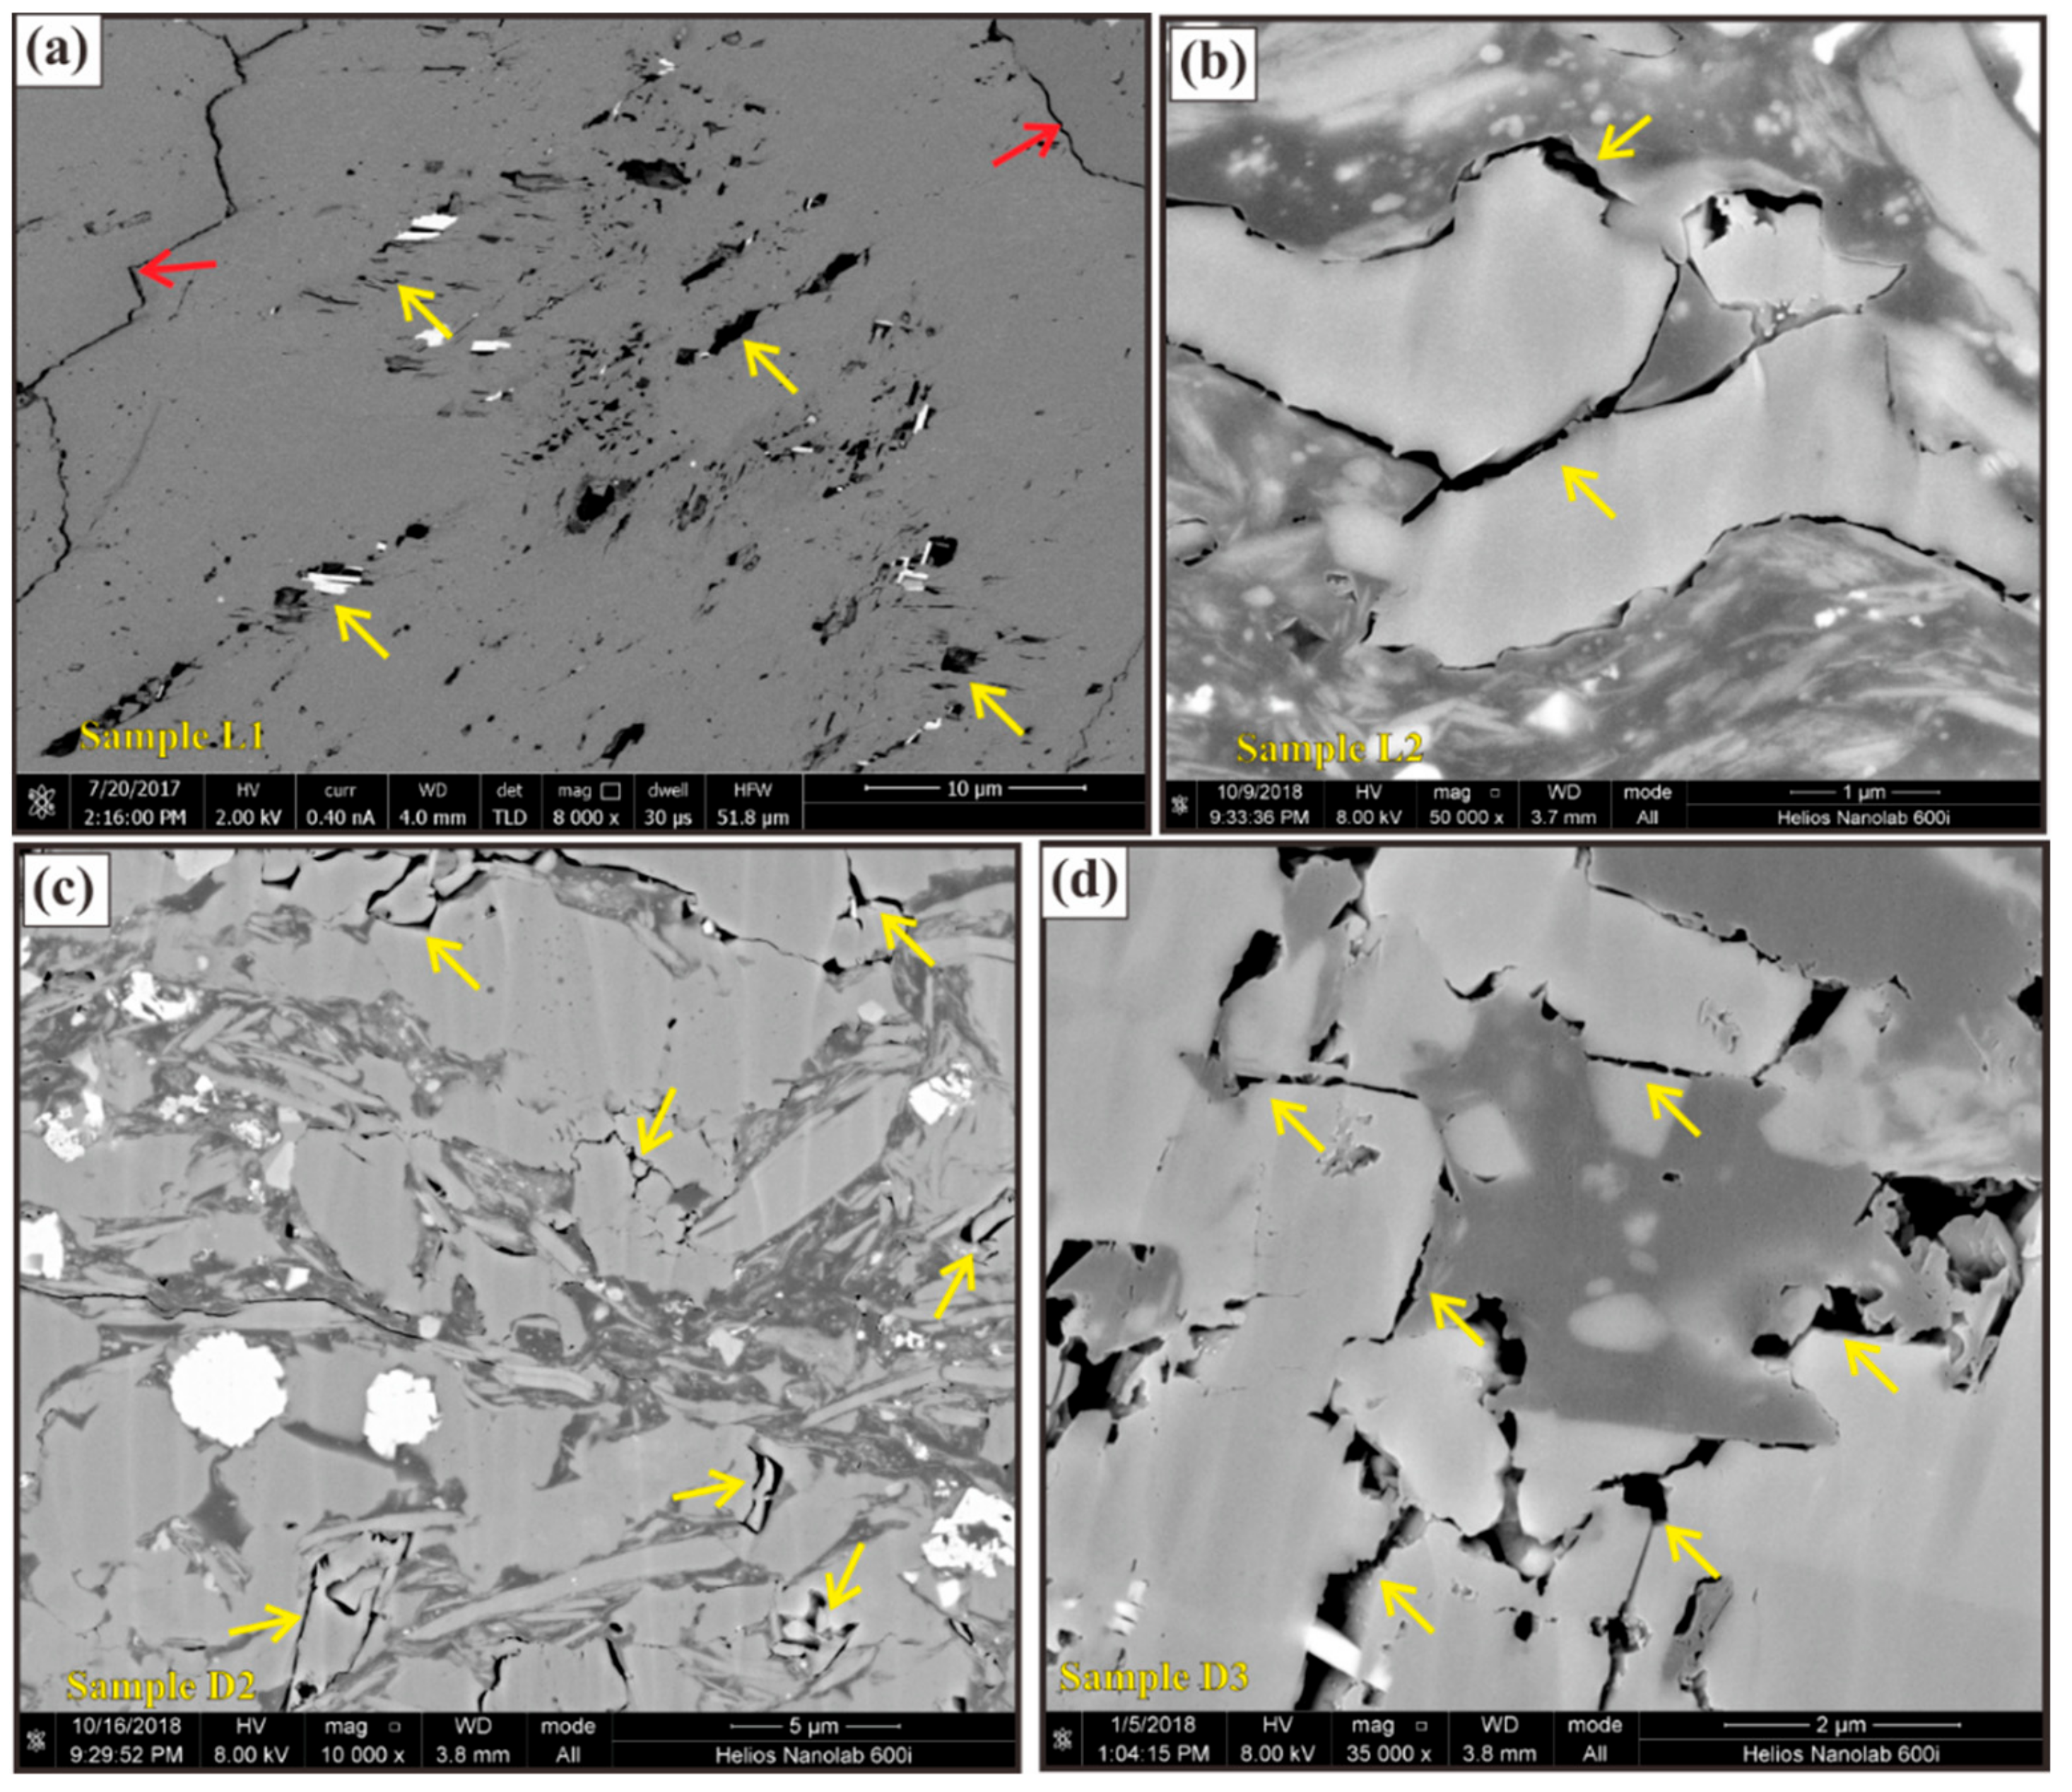
Mineral-hosted pores described in this study consist of interparticle and intraparticle pores. Interparticle pore is the second most common pore type (Figure 5) and includes interparticle clay pores (Figure 5a) and the open pores between framework brittle mineral grains (Figure 5b–d). Many interparticle pores have been damaged or reformed by tectonic deformation. During this process, pores also develop a preferred orientation (Figure 5a). These tectonism-induced interparticle pores within the Lujiaping Formation have been seen in other studies [7,9], and are most likely well connected and may provide interconnected pathways for shale gas flow. Zhu et al. [9] showed excellent examples of interparticle pores that exist along the edges of OM particles or clays, or occur between rigid grains (their Figure 6) of deformed shales. Such pores range between 100 and 5000 nm within the macropore size range and can significantly contribute to an effective pore network [9].
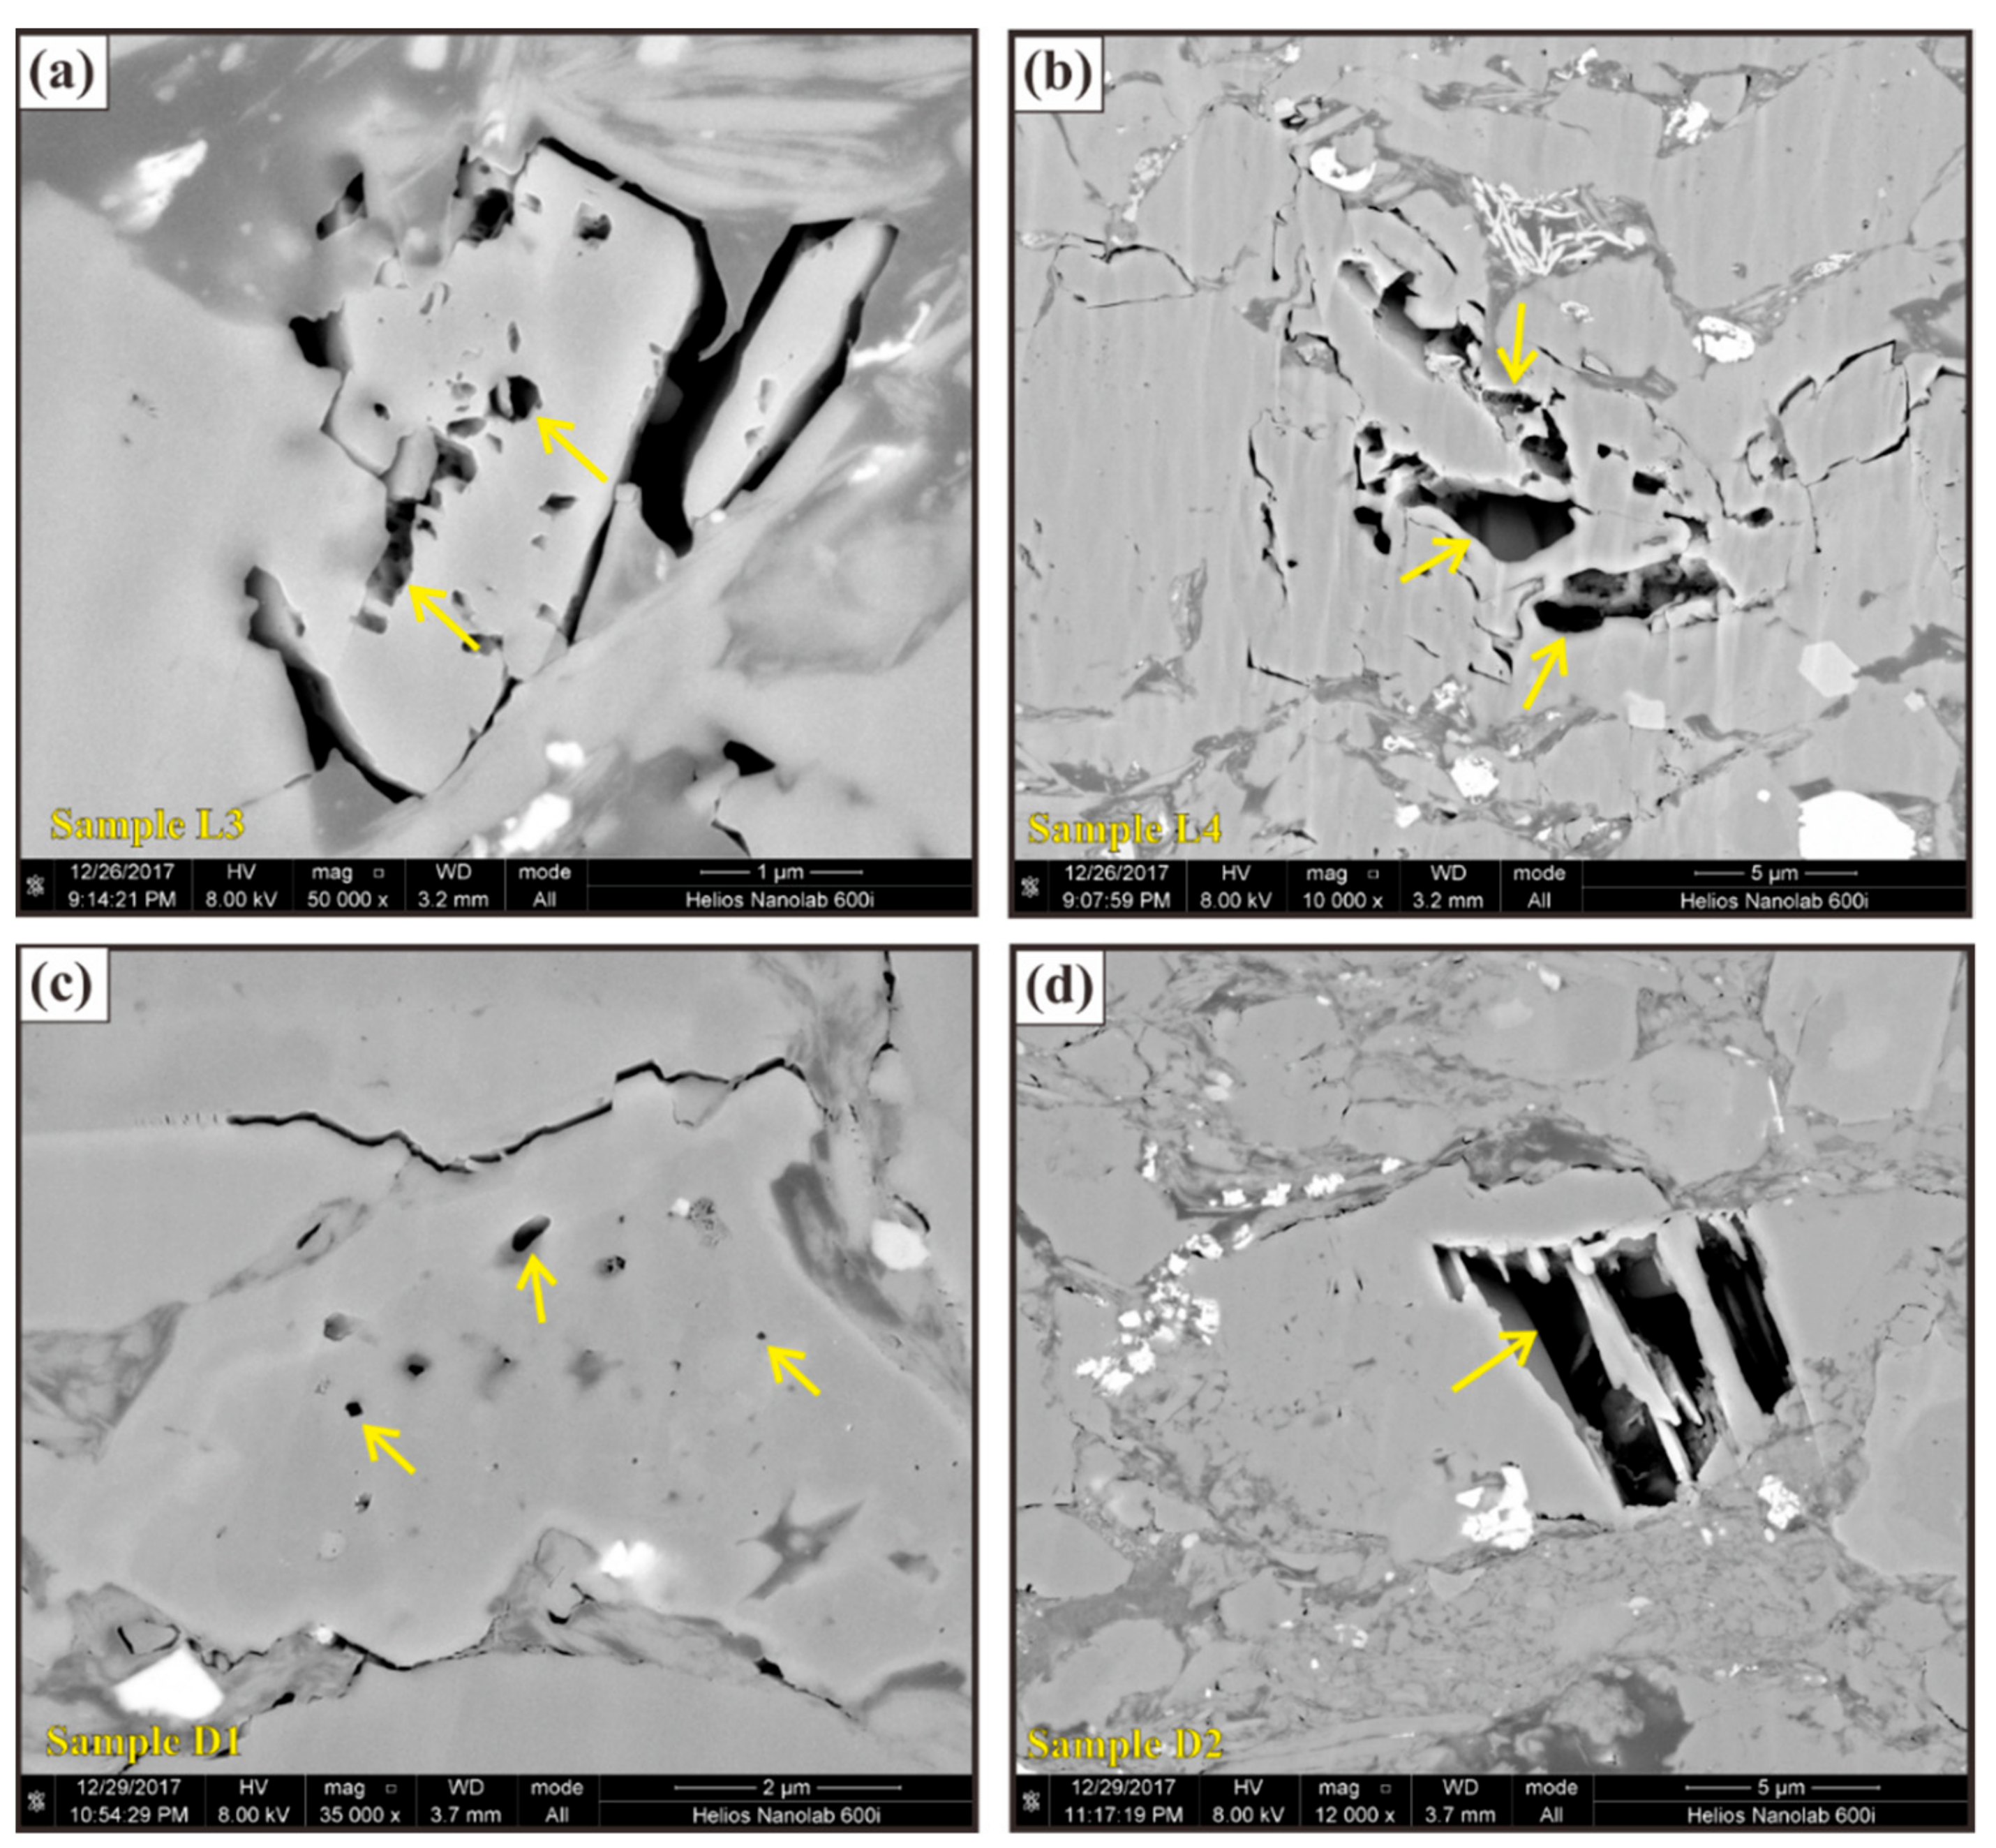
Intraparticle pore is the third most common pore type (Figure 6) and range in size from 20 nm to 5000 nm with the mesopore to macropore size range. Most intraparticle pores are within calcite and feldspar and form by dissolution in unstable grains. These pores develop in local domains and may not be well connected to the effective pore network. Loucks et al. [20] also recognized intraparticle dissolution pores in undeformed marine shales. According to Loucks et al. [20], this type of intraparticle dissolution pore occurs along crystal rims or within grains and is most likely developed in the subsurface by corrosive fluids. It is generally believed that these pores are formed by the dissolution of unstable minerals by organic acids generated during hydrocarbon generation of organic carbon. Zhu et al. [25] suggested that a large number of dissolution pores developed in deformed shales may have resulted from the open porous network systems produced by tectonism in shale. Such open systems can potentially transmit acidic fluids, resulting in minerals dissolution.

4.2.3. OM-Hosted Pores

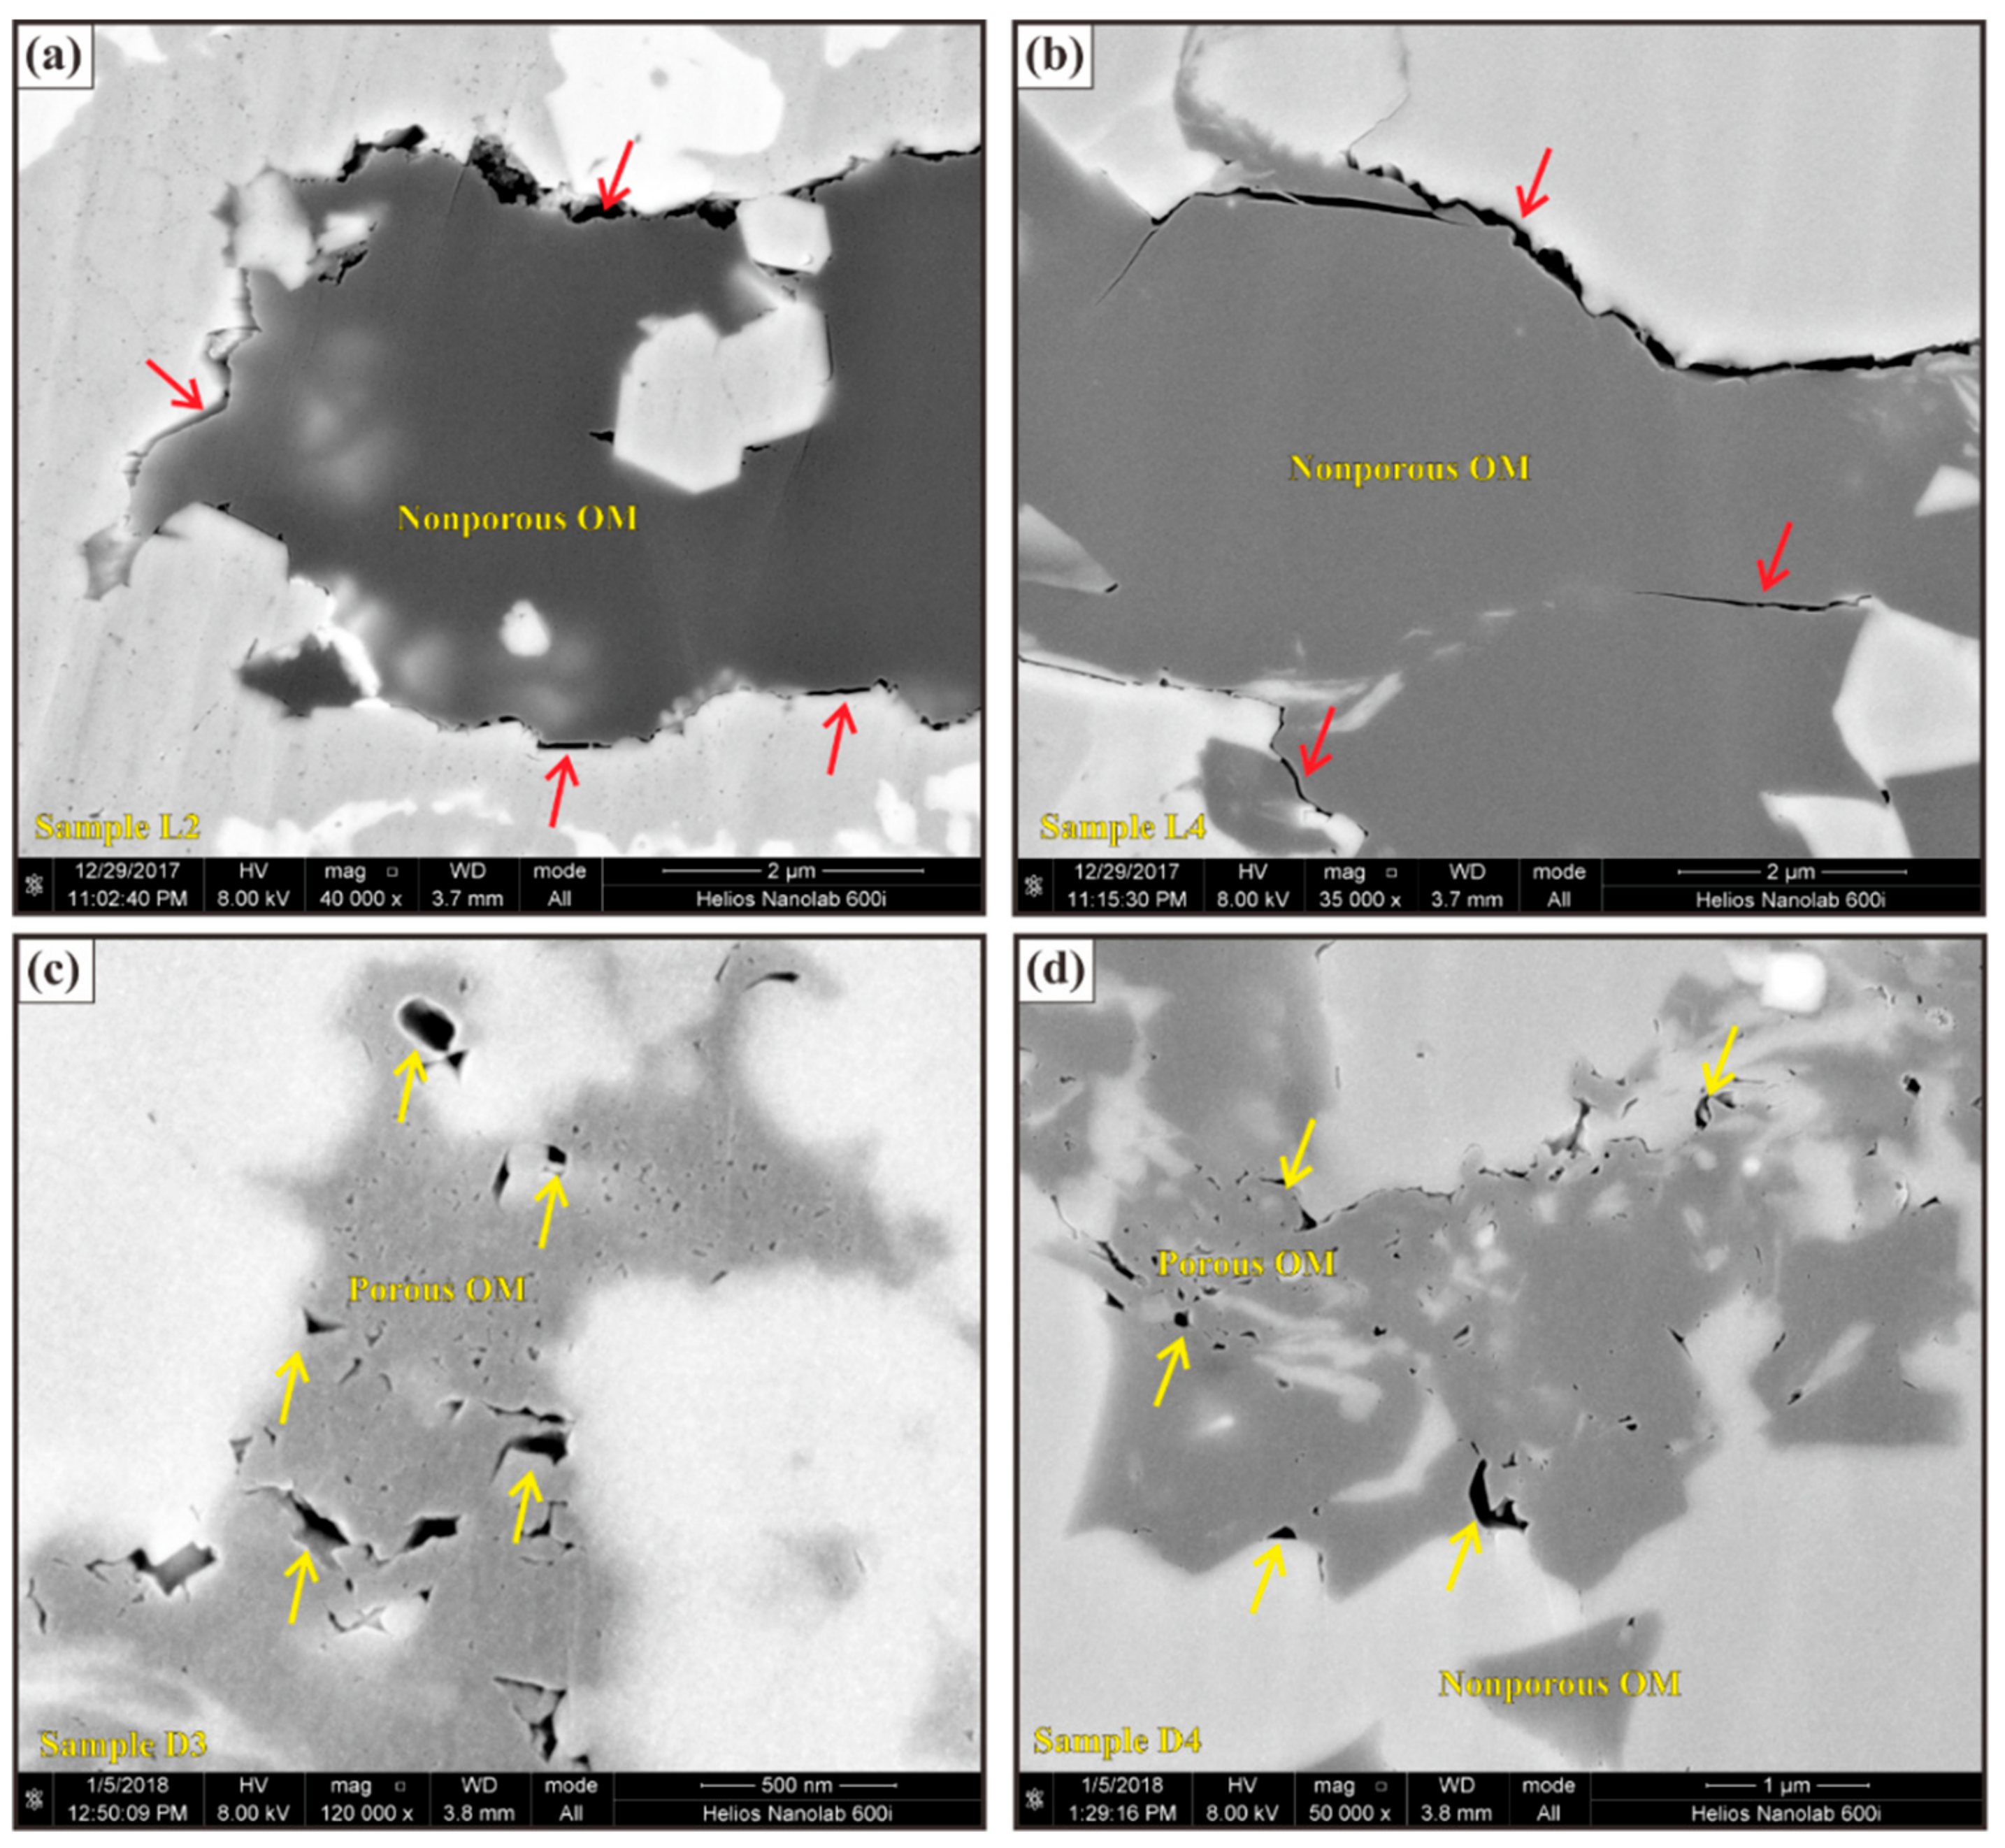
Recent studies have shown that OM-hosted pores usually display isolated, bubble-like, elliptical cross-sections, and are generally produced during hydrocarbon maturation [19,20,21,22,23,24]. OM pores are relatively uncommon in all of the deformed samples (Figure 7). OM-hosted pores can only be observed in samples D3 and D4 due to rigid mineral frameworks (Figure 7c,d). There is no evidence of OM pores in the samples L1–L4 (Figure 7a,b). The OM-hosted pores have angular or subangular shapes, with most of the pores being smaller than 50 nm. In addition, the sizes of these OM-hosted pores in our deformed shales appear to be five orders of magnitude smaller than those found in other marine shales (e.g., Barnett Shale and Longmaxi Shale) [19,20,32,36,37]. Similarly, rare OM-hosted pores were observed in deformed shales from previous investigations [7,9,25]. A large number of observations of the Cambrian shales in South China [7,8,9] have confirmed that organic porosity is not well developed. The reasons for a lack of OM-hosted pores may include (1) the burial depth (more than 7000 m) and strong compaction, (2) high degree of thermal evolution (Ro > 3%), and (3) strongly tectonic deformation. Ma et al. [7] and Zhu et al. [9] stated that few OM pores would develop in Lujiaping shale during the folding and thrusting movements from the Late Triassic time. Furthermore, the angularity of the pores in samples D3 and D4 may be due to one or more of the reasons outlined above [25,26].
Only a few OM pores can be preserved because the organic grains are gradually undergoing significant hydrocarbon generation followed by tectonic compression. Therefore, we use Figure 8 to reveal the structure evolution of OM pores during both thermal maturity and tectonic deformation. With hydrocarbon maturation increase, the OM pores may experience a series of processes, such as development, growth, and mineral-filling. If the shales are influenced by the tectonic compaction, pore shapes tend to appear less rounded, and show more branch-like and line-like edges due to lack of support and protection of the surrounding minerals. These parallel-elongate secondary pores show rectilinear alignment, which is a regularity perhaps related to the structural deformation.
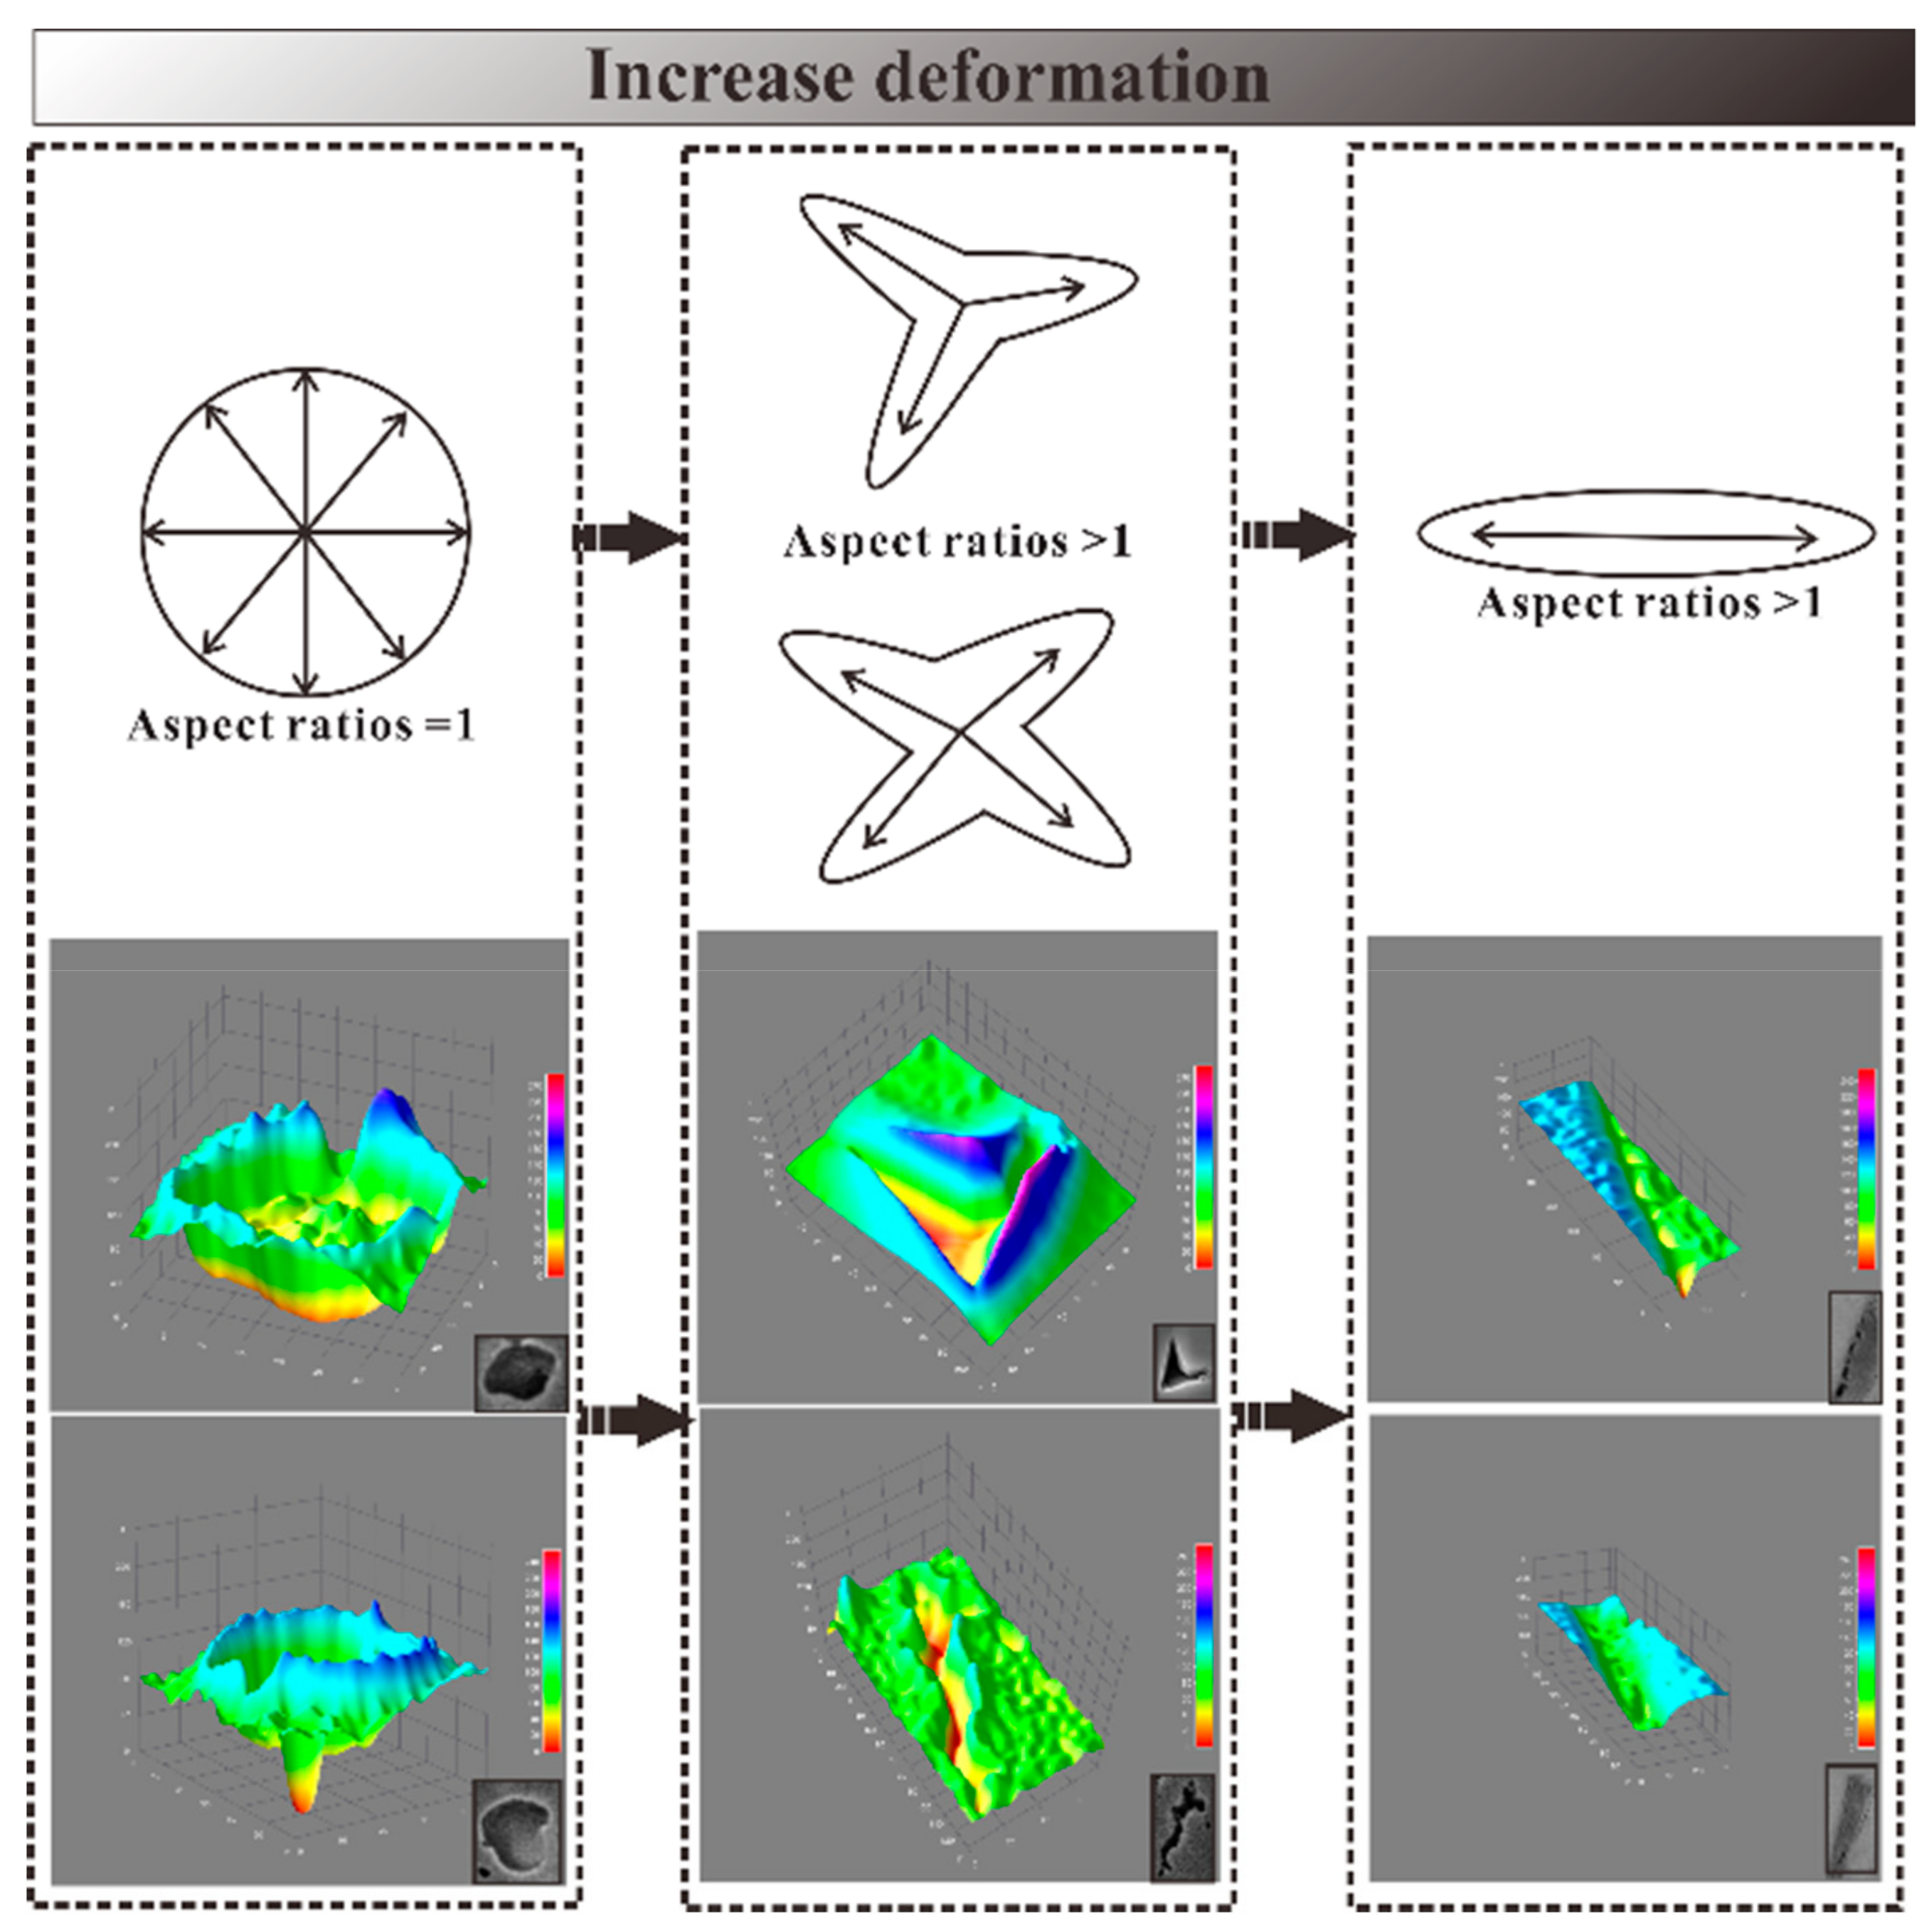
Also, we use the aspect ratio of pores to discuss the evolution of pore morphology during hydrocarbon maturation and tectonism. In general, pores within shale matrix appear to be nonequant. Loucks et al. [19] suggested that average aspect ratios (length divided by width) of pores within OM from Barnett shale have a mean of 2.8:1. Figure 9 illustrates four pores of different aspect ratios and extending directions taken from OM pores of the Lujiaping shales. The detailed features of pore shape in two dimensions and three dimensions are identified by SEM and the software ImageJ Pore shapes can be extracted from gray value, showing a very clear pore shape and surface morphology.

4.2.4. Pore Size Distribution (PSD)

Pore size distribution (PSD) was documented using a combination of LPNA to measure the micro- to mesopore range and low-field NMR to measure micro- to macropore PSD [9,13,26,33,34,35]. Both of these two methods indirectly measure nanometer-size pore structures. Nanometer- to micrometer-size pore structures and pore types can be observed qualitatively by SEM imaging [19,20].
The results of the LPNA analysis reveal that there is a distinct bimodal PSD within the Lujiaping Formation (Figure 10a,b). Two subgroups of pore sizes are evident: one ranging from 0.8 to 3 nm and the second ranging from 3 to 10 nm (Figure 10a,b). Figure 10a,b suggests that micropores dominate more of the pore volume than mesopores. The total pore volume of these samples is largely controlled by pore sizes smaller than 10 nm. All of the eight samples have a similar bimodal PSD. Low-field NMR measurement was conducted on eight samples from the Lujiaping Formation. As noted in the methods section, samples were resaturated with water for analyses. T2 relaxation time curves can provide an estimation of PSD of shale samples. Such curves cannot provide quantitative data on actual pore sizes; however they could indirectly reflect PSD. The shape of the T2 relaxation time curves of samples, such as L1, L4, and D4, shown in Figure 10c,d, reveals a relative PSD similar to that of the LPNA curves in Figure 10a,b. The T2 relaxation time curves of most of the other samples show unimodal PSDs, indicating that the samples are dominated by micro- to mesopores. Under the examination of SEM, it is evident that most macropores larger than 50 nm are fracture-related and mineral-hosted pores, whereas pores smaller than 50 nm may be OM-hosted pores and part mineral-hosted pores (Figure 4, Figure 5, Figure 6 and Figure 7). All samples develop abundant fracture-related and mineral-hosted pores. These fracture-related and mineral-hosted pores are macropore-sized. Most larger pores cannot be measured by LPNA or shown by NMR T2 relaxation time curves. A combination of SEM, LPNA, and low-field NMR could lend support to our study of nanometer- to micrometer-size pore structures in the Lujiaping samples.

4.3. Nanometer- to Micrometer-Size Material Structures

4.3.1. OM–Clay Aggregates

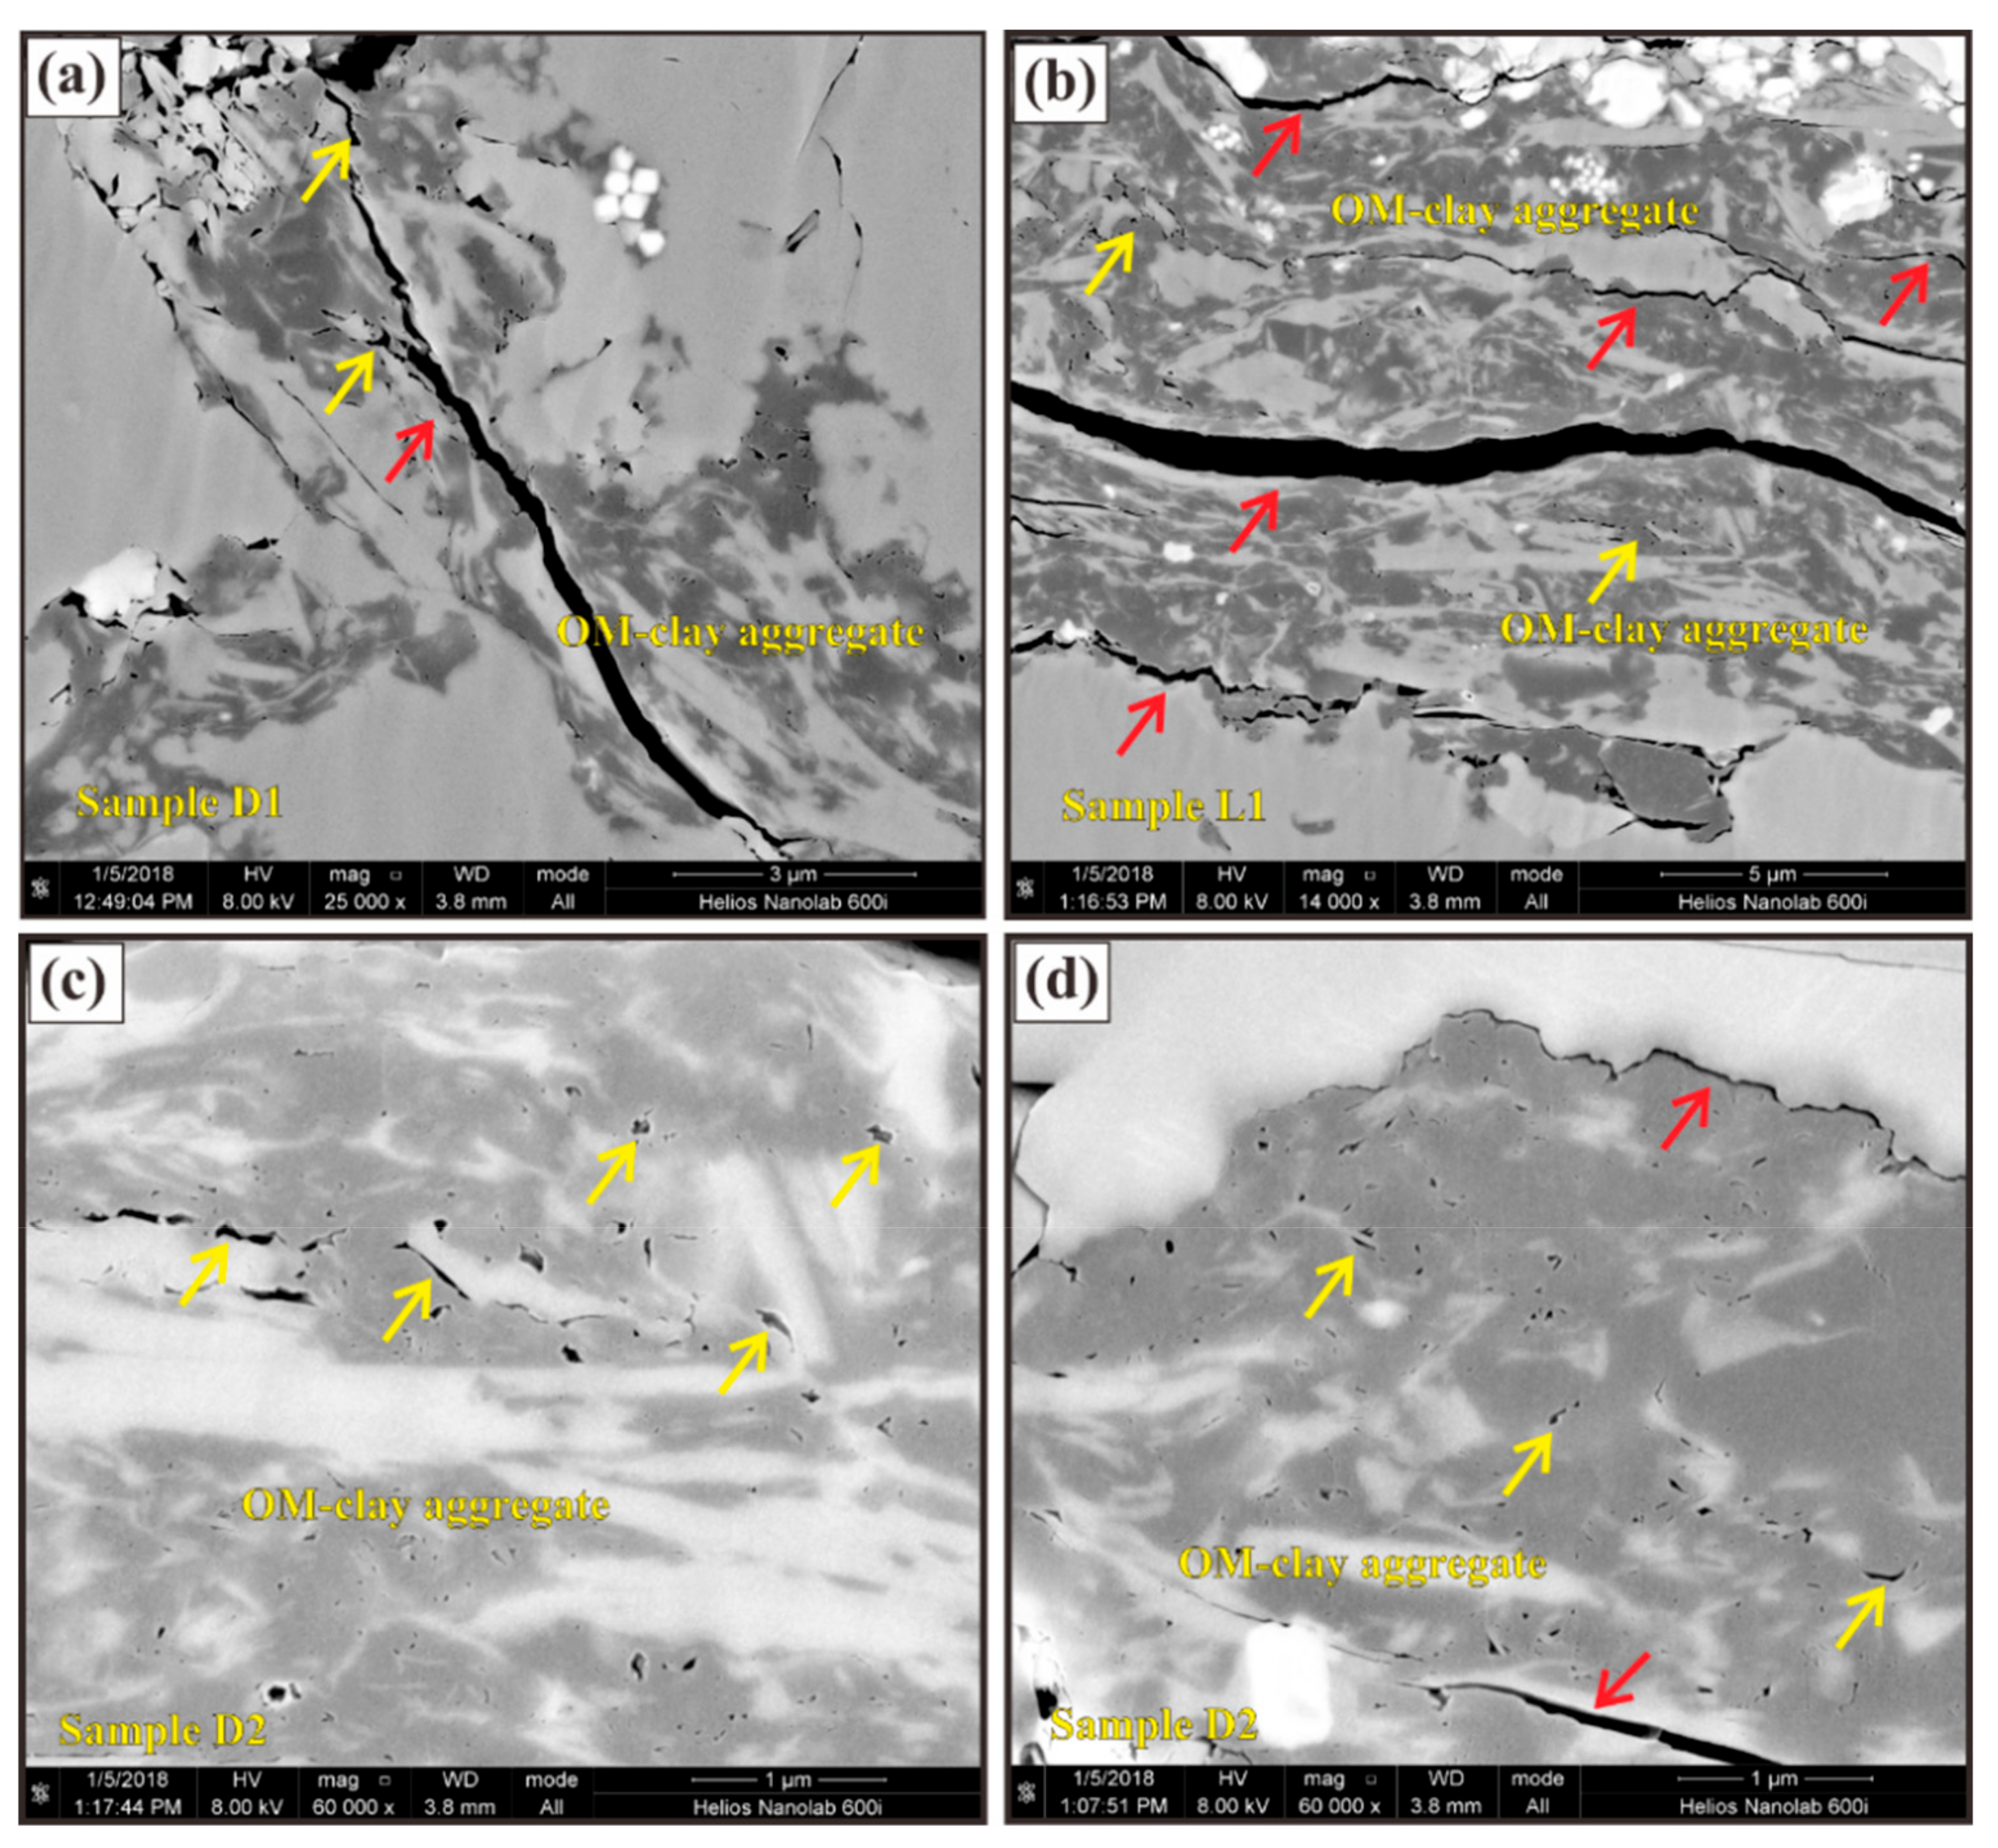
Lujiaping Shale has been defined as a rock containing abundant OM and clay minerals. OM and clay minerals are frictionally weak relative to other common grains (e.g., quartz, feldspar, pyrite, and calcite). Some important deformation microstructures may be controlled by the content and mechanical properties of organic grains and clay minerals in shale [41,42,43]. Observations of our naturally deformed samples reveal that OM–clay aggregates within the shale matrix are common (Figure 11). Other studies of the Lujiaping Formation describe similar OM–clay aggregates to those shown in this paper [7,9]. We infer that such OM–clay aggregates can affect the preservation of organic carbon in marine black shale, perhaps especially in deformed shales. A large volume of literature has presented data on the preservation mechanism of organic carbon revealing that large amounts of the OM preserved in most shales are intimately associated with clay minerals [41,42,43,44,45]. Organic grains adsorb onto clay mineral surfaces or concentrate in interlayer or interparticle pores of clays.
Pore structures within OM–clay aggregates were commonly observed and well developed in all deformed shales (Figure 11). The aggregates contain abundant microfractures and interparticle pores. The aggregates are generally open and with good connectivity between aggregates, which is a function of both thermal evolution and tectonic deformation. Other Lujiaping studies have noted similar pore structures in the OM–clay aggregates [7,9]. Zhu et al. [9] report well-developed and high-connectivity pore networks in the Lujiaping Shale. Four types of pores have been identified in OM–clay aggregates (see their Figure 8) [9]. They also showed an evolutionary model of the formation of OM–clay aggregates during tectonic deformation (see their Figure 9), suggesting that these nanometer- to micrometer-sized material structures are naturally formed and are beneficial to the preservation of organic carbon during thermal and tectonic evolution.

4.3.2. Silica Nanograins

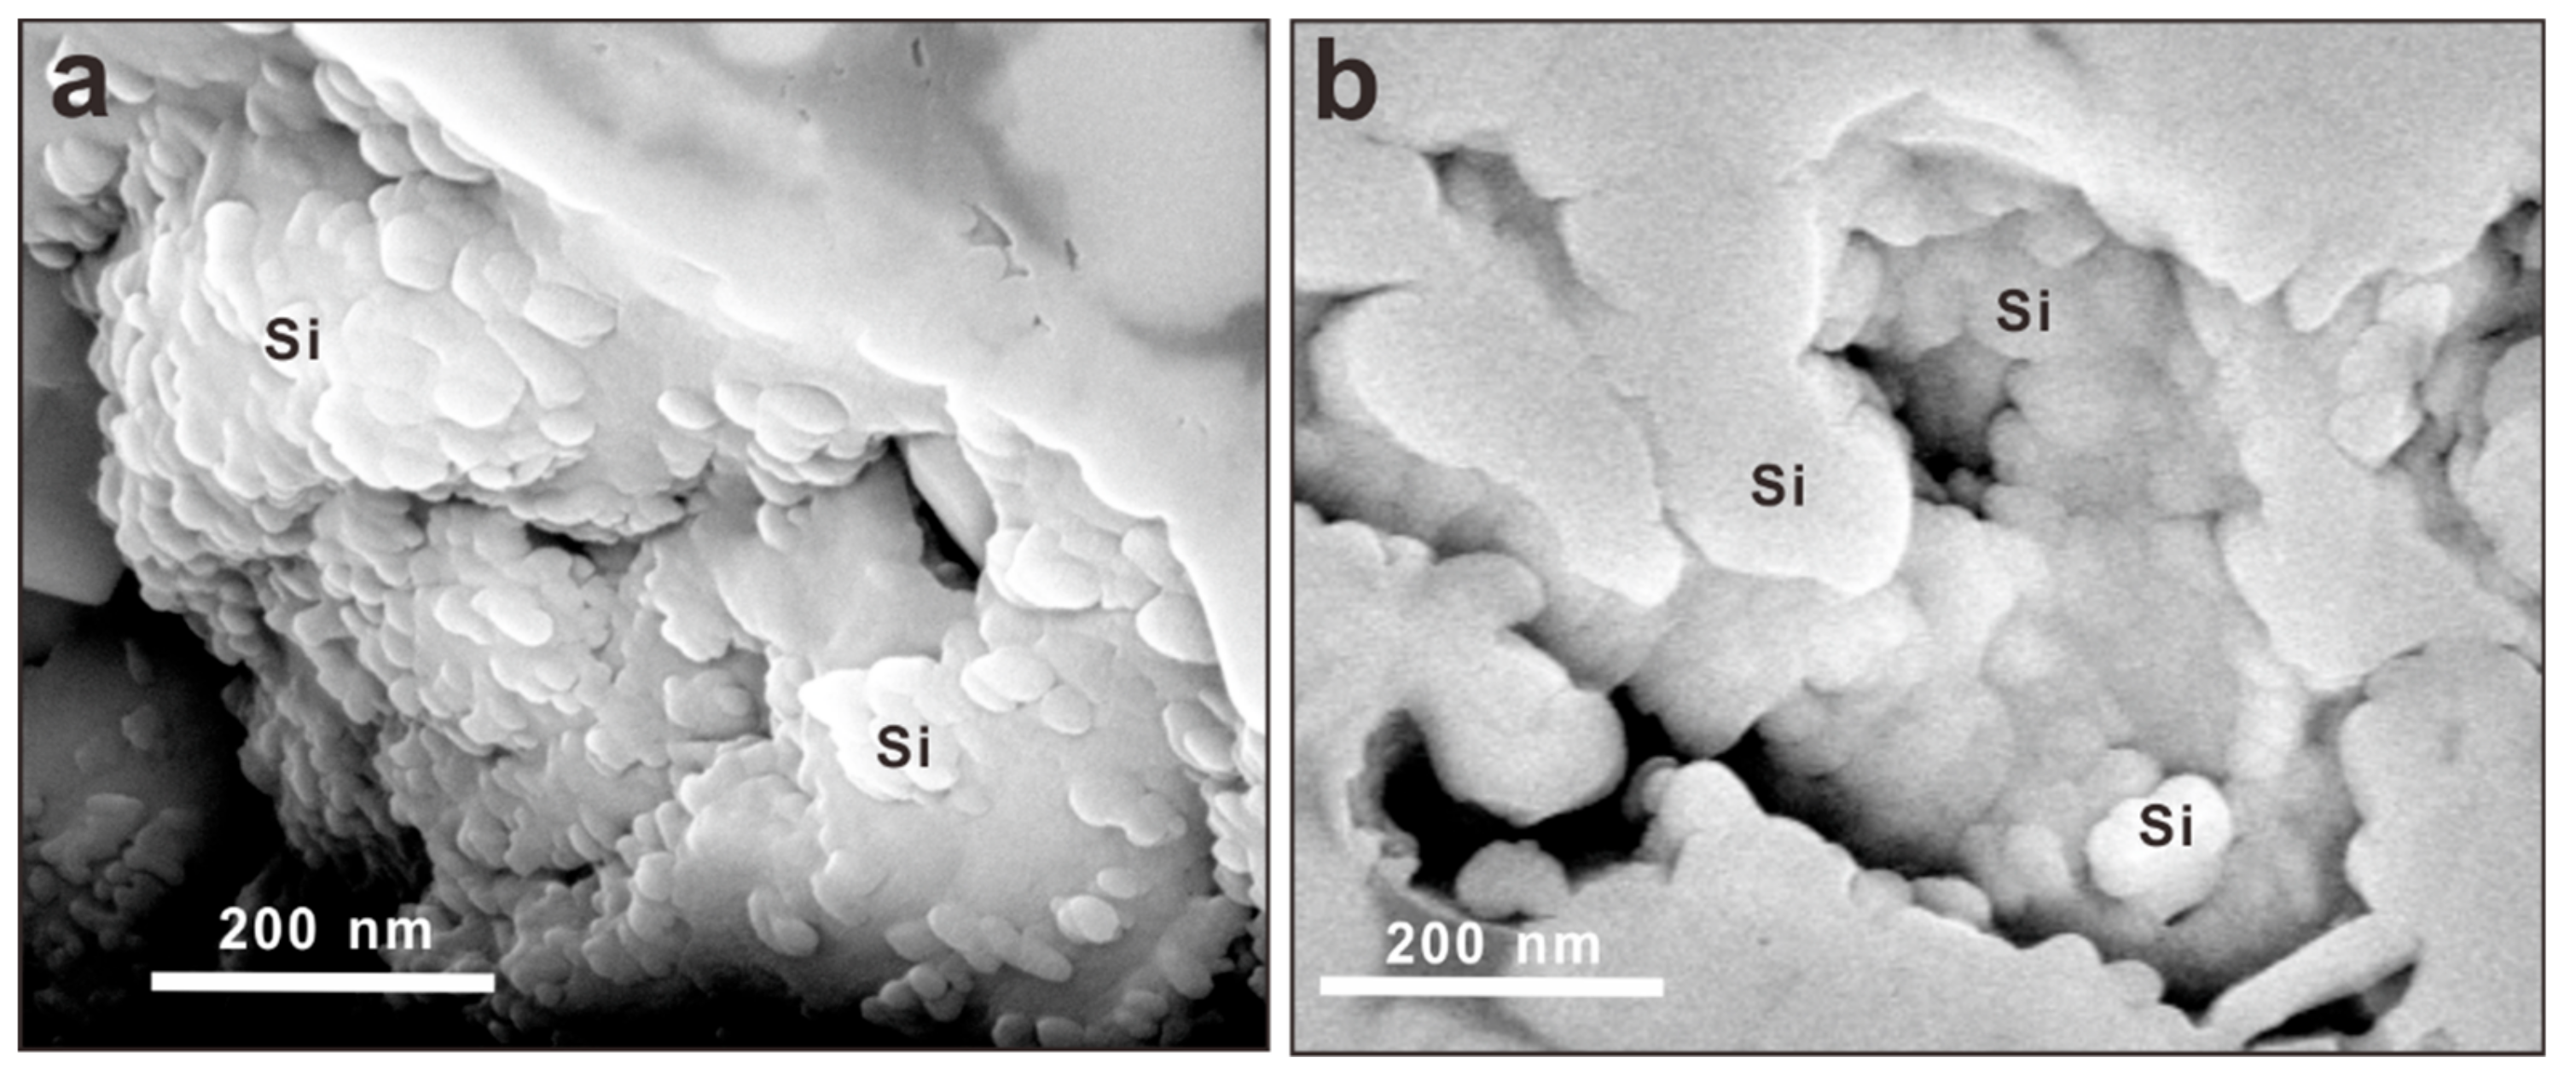
The XRD analyses show that Lujiaping Shale is a very siliceous mudstone with 27 wt %–65 wt % silica (average 48%). A study of shale samples with high-resolution SEM reveals that quartz minerals occur as silica nanograins and botryoids typically 20–100 nm in size and can be only observed under high magnification (Figure 12). Drake et al. [46] also recognized abundant silica nanospheres in the less argillaceous facies of the Upper Devonian Woodford Shale. They used SEM to observe four distinct forms of quartz: (1) randomly distributed angular detrital silica grains (less than 60 μm), (2) siliceous microfossils, (3) tiny euhedral quartz overgrowths and quartz crystals (less than 10 μm), and (4) silica nanospheres (200–500 nm). They believed that such silica nanospheres are ubiquitous in the Woodford Shale, and 2–3 times more common than the other three types of silica grains. Interparticle quartz nanopores between the quartz nanograins are common and apparent. However, the origin of these nanograins is unknown. It is not clear whether they are related to thermal and tectonic evolution in our samples. Drake et al. [46] suggested that such silica nanograins may be a product of microbial precipitation.

5. Discussion

5.1. Influence of Combined Thermal Evolution and Tectonic Deformation on the Development of the Nanometer- to Micrometer-Sized Structures

Nanometer- to micrometer-sized structures vary due to tectonic deformation and systematically across thermal maturity in organic-rich rocks, but a comprehensive dual study of the effect of tectonism and organic maturity on pore structures and processes in organic-rich shales is lacking. OM-hosted pores are mainly nanometer- to micrometer-sized, and are widely developed in gas shales, such as the Longmaxi Shale, the Yanchang Shale, the Barnett Shale, and the Marcellus Shale [19,20,36,37,47,48,49,50,51]. Recent studies of the Barnett Shale in North America that use SEM imaging suggest that the porosity within OM particles can be higher than 40% of total porosity [22,23,24]. Some scholars believe that organic nanopores are produced by exsolution of gaseous hydrocarbons during the secondary thermal cracking of liquid hydrocarbons in the gas window [20,21,22,52], but other geologists disagree with this conclusion, and have observed and found that OM-hosted nanopores can be formed within organic carbon in oil window [53]. The debate is not settled and additional investigations are needed to better understand the thermal control of pores in OM.
On the other hand, several authors have noted that tectonism can significantly affect nanometer- to micrometer-sized sedimentary structures and pore networks along with the proportion of various pore types in organic-rich rocks [7,9,25,54,55,56,57,58,59,60]. Based on the results of a structural evolutionary analysis on organic-rich shale, Zhu et al. [9] suggested that clay–organic aggregates and related interparticle pores and open microfractures are formed by tectonic deformation. Also, a conclusive relationship between nanometer- to micrometer-sized pore structure evolution and tectonism was found in other cases, such as the deformed Longmaxi Shale [25]. In particular, Zhu et al. [25] show the development of abundant macropores in the Longmaxi Shale and suggest, similar to the findings of Liang et al. [26], that the proportions of different pore types were significantly changed by structural deformation, and that strongly deformed shales have the least organic pores and the lowest adsorption capacity. The microstructures of tectonically deformed coal (TDC) have also been analyzed in detail by coal geologists [54,55,56,57,58,59,60,61,62]. These studies have mainly focused on three different aspects: (1) development of TDCs by brittle and ductile deformation of coal seams, (2) macro- and micro-deformation behavior of TDCs, and (3) impact of tectonism and coal rank on the characteristics of pore structures. Brittle deformation in coals has been shown to increase porosity, permeability, and pore size relative to undeformed coals, whereas ductile deformation could result in the development of more nanosized pores, which has a significant effect on the adsorption capacity of coal. Note that gas outburst and strongly ductile deformation are closely related due to their occurrence in coalfield shear zones [54,55,56,57,58,59,60]. Such relationships have been documented by different workers [54,55,56,57,58,59,60]. For example, Pan et al. [55] summarized the importance of different deformation mechanisms on the evolution of coal pores. Brittle deformation can produce more mesopores and enhance the interconnectivity of the pore systems, whereas ductile deformation strongly affects micropores, methane adsorption capacity, as well as coalbed methane contents. Li et al. [56] described and recognized how tectonic deformation could influence the macromolecular structures and the presence of nanoscale pores smaller than 100 nm.
In addition, other factors, such as deposition, compaction, and magmatic intrusion, are also well known [20]. However, the impact of combined thermal evolution and tectonic deformation in the development of the nanometer- to micrometer-sized pore and material structures has not been well studied and understood. This observation is mainly based on qualitative and quantitative comparisons between shales of varying maturity and structural deformation. The geological controls on organic porosity development are complex. Thermal maturity and the TOC content are the two most important controls on organic nanopores of the gas shales, but the trend is broad, which indicates other secondary factors are present [12,21,22,23,24,28,48]. For example, clay doping, clay catalysis, microbial degradation, water film, tectonism, etc. may mask or exacerbate the effects of such thermal controls.
Compared to the previous studies on most undeformed mature or high mature shale reservoirs [19,20,21,22,23,24,36,37,38,47], our results demonstrate significant variations in pore structures related to tectonic deformation and thermal maturity. Generally, we expect to find positive relationships between OM-hosted pore volumes and the whole pore network, or between OM-hosted pores and TOC. In our set of samples, however, no relationships were detected between the total pore volumes and OM-hosted pores or between OM-hosted pore volumes and TOC (Figure 7). We suggest that important relationships may be apparent among samples of different maturity or TOC content in undeformed shales, whereas in the case of our deformed shale samples, these relationships are obstructed by strong influences in tectonism. In addition, this lack of correlation between OM-hosted pore volumes and the total pore volume within these shale samples suggest that both fracture-related and mineral-hosted pores are significant contributors to the pore network. Tectonic deformation usually has a positive correlation with the fracture-related pores [9,25]. All of our eight samples have a higher count of microfractures than the undeformed shales. A positive relationship between mineral-hosted pores and tectonism, as well as a generally negative correlation between OM-hosted pores and tectonism also implies that tectonic deformation may significantly control pore types within organic-rich Lujiaping shales. Organic porosity is no longer the prevailing dominant pore type in deformed shales due to both strong tectonic deformation and overmature organic carbon [7,9,25]. Samples that have more fracture-related and mineral-hosted pores are dominated by abundant brittle mineral grains. Such naturally deformed overmature shales show greater connectivity and gas storage space because they have more open fractures and mineral-hosted, microscale pore volumes compared to undeformed mature or highly mature shales.
The authors suggest that OM pores are poorly-developed in deformed shales and further suggest that mineral-hosted porosity, microchannels, and microfractures are significant aspects of the storage and migration of gas. Therefore, our study supports the ideas that (1) thermal maturity is mainly responsible for the formation of organic pore structures, (2) tectonism is largely responsible for mineral-hosted or fracture-related pore structure evolution, (3) total porosity is altered during thermal maturity and structural deformation, (4) a decrease in organic pores may be related to structural deformation, and (5) mineral-hosted pores and microfractures can contribute to gas storage and migration pathways in deformed overmature shales. In the present study, no significant correlations have been observed between abundance of OM and pore volumes measured via SEM, in part due to the limitation of resolution, but organic micropores and mesopores could be indirectly obtained by LPNA and NMR curves. Our overall observations suggest that fracture-related pores together with mineral-hosted pores jointly contribute to the pore network in shales, which is in agreement with other Lujiaping shale studies [7,8,9].

5.2. Evolution of Reservoir Characteristics in Cambrian Organic-Rich Shale during Thermal Maturation and Structural Deformation

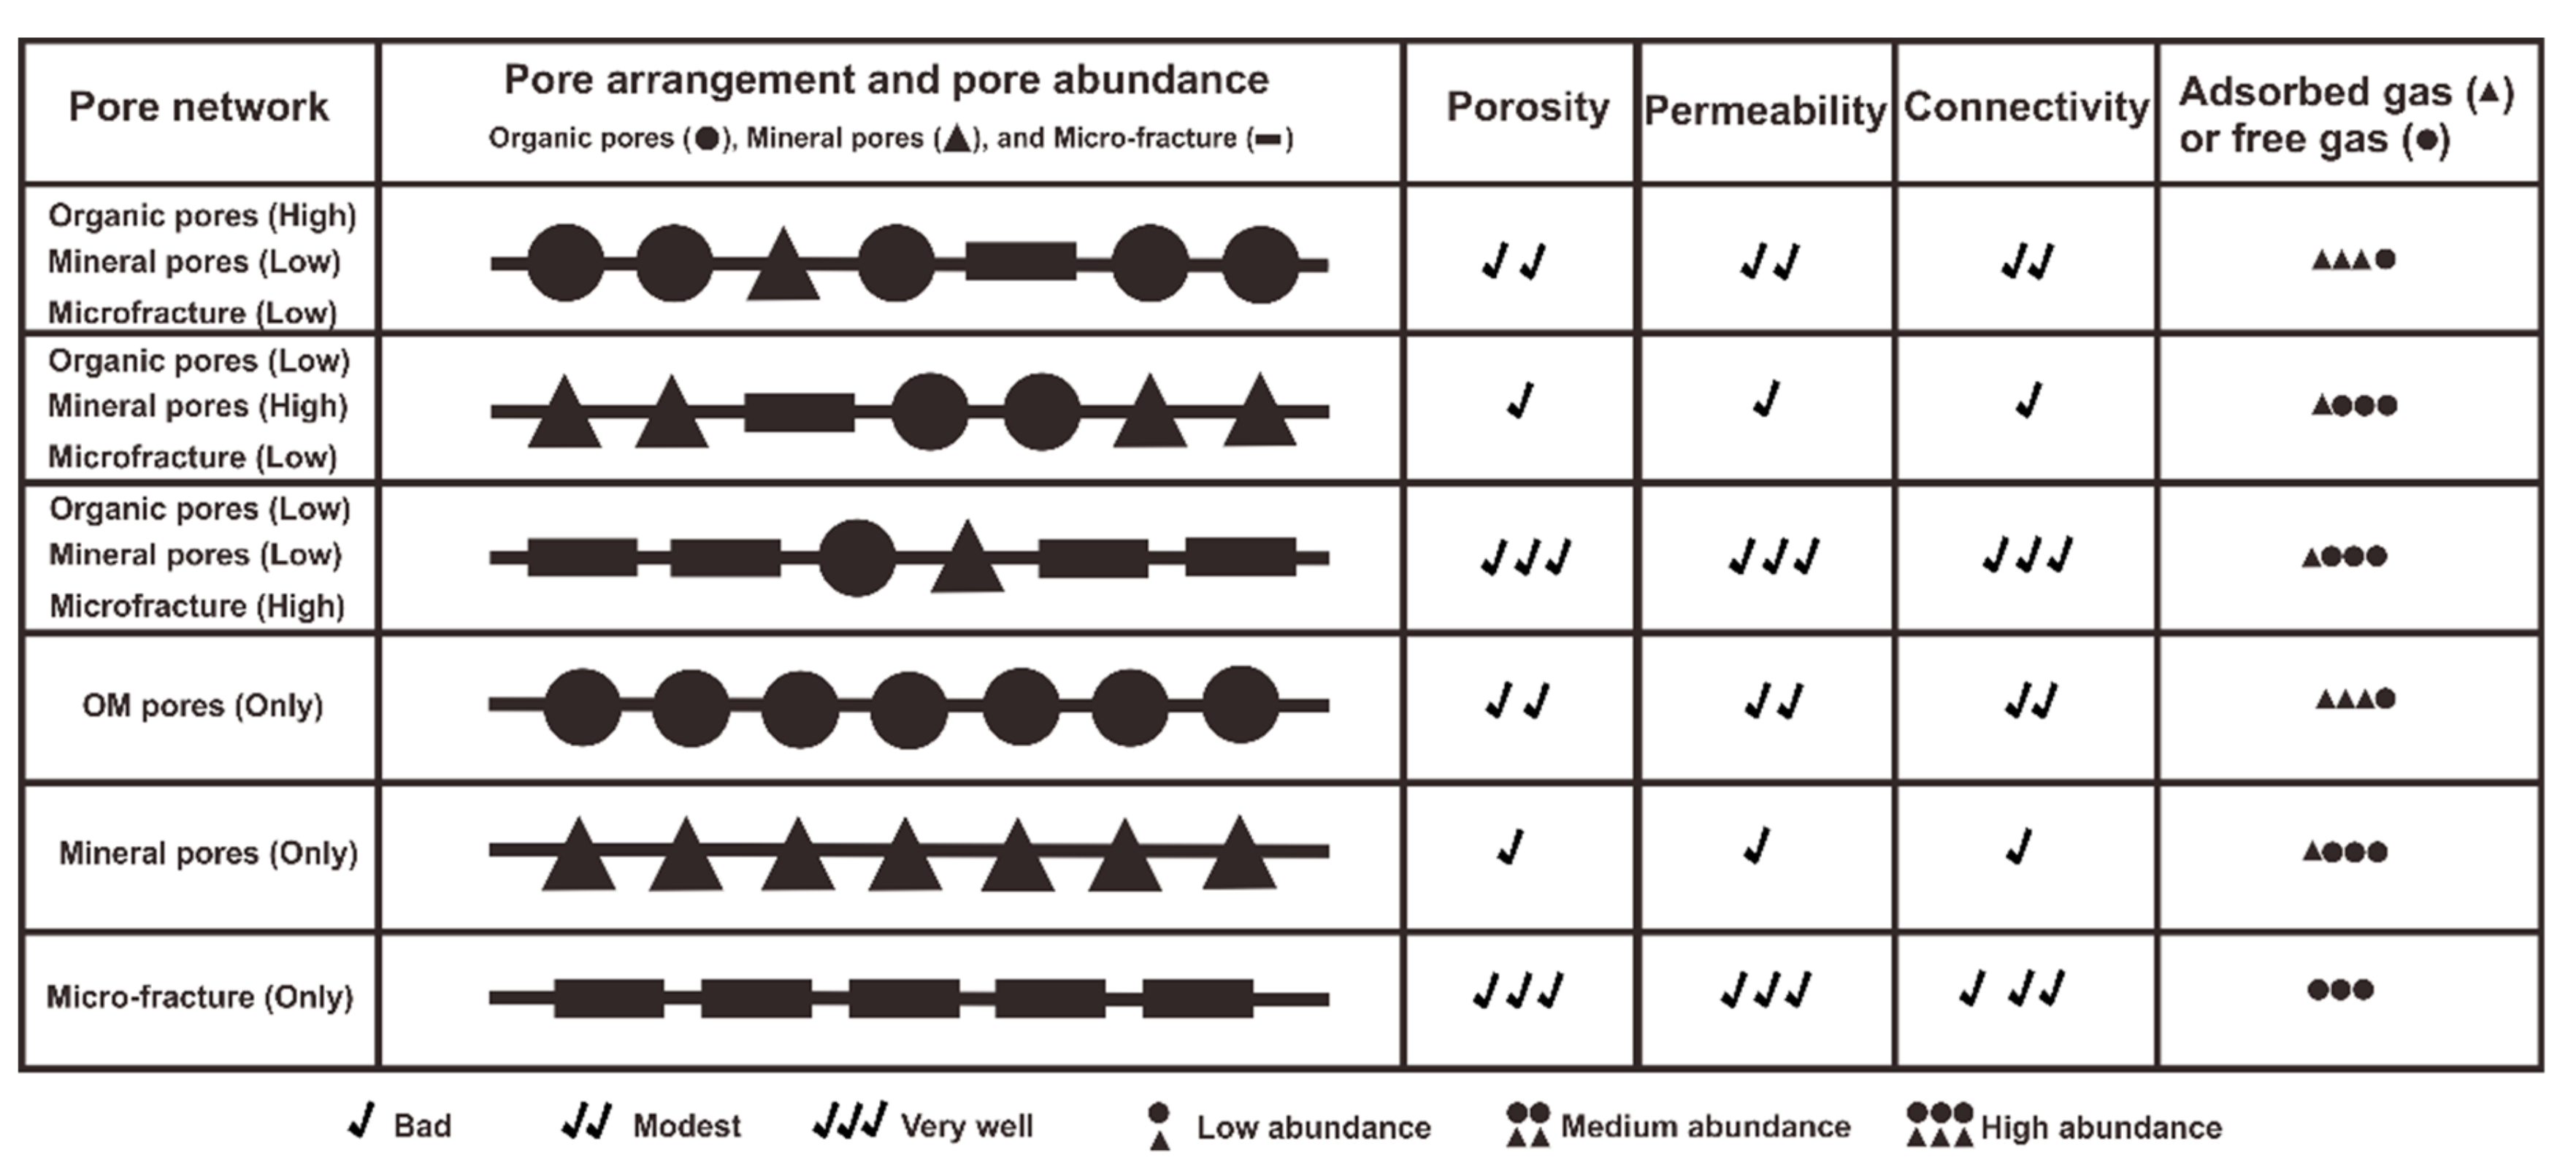
Figure 13 illustrates diagrammatically some hypothetical relationships between arrangement and abundance of the three different pore types and porosity, permeability, connectivity, and gas storage characteristics in deformed, organic-rich shale. If organic pores are dominant in shales, then modest porosity, permeability, and connectivity of OM within shales is expected. Shale gas in this case will mainly be adsorbed gas. If mineral-hosted pores are dominant, then bad to poor porosity, and permeability should be expected. Shale gas storage, where mineral-hosted pores are dominant, will be free gas. Finally, if the microfractures are dominant in shales, these layers may produce relatively good porosity and permeability within shales, and shale gas is also predominantly free gas.

6. Conclusions

In this study, we investigated the variations and features in the nanometer- to micrometer-sized structures related to thermal maturity and tectonic deformation in the Lower Cambrian Lujiaping overmature shale. The Lujiaping Formation in the Dabashan Thrust-fold Belt has experienced several episodes of intensive tectonic motion after the end of hydrocarbon generation. The deformation of organic-rich shale is clearly evident. Our results reveal the following conclusions:
(1) All shale samples show high-quality OM content (TOC > 2.17%) and the Ro ranges from 2.92% to 3.26%. The dominant mineral constituents are relatively brittle minerals such as quartz, carbonate, and feldspar, with a combined average of 70 wt %.
(2) The Lujiaping Formation pore network is dominated by inorganic porosity, such as fracture-related and mineral-hosted pores. OM-hosted pores observed by SEM are not dominant contributors to the pore network, but may exist as micropores and mesopores.
(3) Our study demonstrates a link between pore structure, and pore type thermal evolution and tectonism. Further research is needed to comprehensively assess the relative importance and abundance of mineral-hosted versus OM-hosted pore types as well as fracture-related pores throughout the Lujiaping Shale. Moreover, we expect our findings to be applicable to other organic-rich, overmature, and strongly deformed shales developed in complex tectonic areas.
(4) We use high-resolution SEM images to observe two main types of nanometer- to micrometer-sized material structures, such as OM–clay aggregates and silica nanograins. Such structures could increase initial gas storage space through the formation of the microfractures and interparticle pore space.

Author Contributions

Conceptualization, H.Z. and Y.J.; Methodology, C.H.; Software, Y.Q.; Validation, L.J., K.Y. and Y.L.; Formal Analysis, X.S.; Investigation, H.F.; Resources, C.H.; Data Curation, P.Q.; Writing—Original Draft Preparation, H.Z.; Writing—Review and Editing, Y.J.; Visualization, H.Z.; Supervision, H.Z.; Project Administration, Y.J. and W.L.; Funding Acquisition, Y.J. and W.L.

Funding

This research was financially supported by the National Natural Science Foundation of China (Grant Nos. 41530315, 41872160, 41372213, 41672201), the National Natural Science Foundation of China for Youth (Grant No. 41804080), the National Science and Technology Major Project of China (Grant Nos. 2016ZX05066003, 2016ZX05066006), the Strategic Priority Research Program of the Chinese Academy of Sciences (Grant No. XDA05030100), and the Sichuan Science and Technology Support Program (Grant No. 2016JZ0037).

Acknowledgments

We thank anonymous reviewers for their critical and constructive reviews. The authors would like to thank Mengyan Shi, Yuzhen Han, Lilong Yan, Libing Wang, Kai Chen, and Le Zhang for sampling work and their constructive comments.

Conflicts of Interest

The authors declare no conflict of interest.

References

  1. Gu, Y.; Wan, Q.; Qin, Z.; Luo, T.; Li, S.; Fu, Y.; Yu, Z. Nanoscale Pore Characteristics and Influential Factors of Niutitang Formation Shale Reservoir in Guizhou Province. J. Nanosci. Nanotechnol. 2017, 17, 6178–6189. [Google Scholar] [CrossRef]
  2. Aguilera, R. Shale gas reservoirs: Theoretical, practical and research issues. Pet. Res. 2016, 1, 10–26. [Google Scholar] [CrossRef]
  3. Hochella, M.F., Jr. Nanoscience and technology: the next revolution in the Earth sciences. Earth Planet. Sci. Lett. 2002, 203, 593–605. [Google Scholar] [CrossRef]
  4. Jia, B.; Tsau, J.S.; Barati, R. A review of the current progress of CO2 injection EOR and carbon storage in shale oil reservoirs. Fuel 2019, 236, 404–427. [Google Scholar] [CrossRef]
  5. Li, Z.; Liang, Z.; Jiang, Z.; Gao, F.; Zhang, Y.; Yu, H.; Xiao, L.; Yang, Y. The Impacts of Matrix Compositions on Nanopore Structure and Fractal Characteristics of Lacustrine Shales from the Changling Fault Depression, Songliao Basin, China. Minerals 2019, 9, 127. [Google Scholar] [CrossRef]
  6. Li, Z.; Liu, S.; Luo, Y.; Liu, S.; Xu, G. Structural style and deformation mechanism of the southern Dabashan foreland fold-and-thrust belt, central China. Front. Earth Sci. China 2007, 1, 181–193. [Google Scholar] [CrossRef]
  7. Ma, Y.; Zhong, N.; Li, D.; Pan, Z.; Cheng, L.; Liu, K. Organic matter/clay mineral intergranular pores in the Lower Cambrian Lujiaping Shale in the north-eastern part of the upper Yangtze area, China: A possible microscopic mechanism for gas preservation. Int. J. Coal Geol. 2015, 137, 38–54. [Google Scholar] [CrossRef]
  8. Han, H.; Zhong, N.; Ma, Y.; Huang, C.; Wang, Q.; Chen, S.; Lu, J. Gas storage and controlling factors in an over-mature marine shale: A case study of the Lower Cambrian Lujiaping shale in the Dabashan arc-like thrust–fold belt, southwestern China. J. Nat. Gas Sci. Eng. 2016, 33, 839–853. [Google Scholar] [CrossRef]
  9. Zhu, H.; Ju, Y.; Qi, Y.; Huang, C.; Zhang, L. Impact of tectonism on pore type and pore structure evolution in organic-rich shale: Implications for gas storage and migration pathways in naturally deformed rocks. Fuel 2018, 228, 272–289. [Google Scholar] [CrossRef]
  10. Kang, J.; Sun, Y.; Men, Y.; Tian, J.; Yu, Q.; Yan, J.; Liu, J. Shale gas enrichment conditions in the frontal margin of Dabashan orogenic belt, south China. J. Nat. Gas Sci. Eng. 2018, 54, 11–24. [Google Scholar] [CrossRef]
  11. Ougier-Simonin, A.; Renard, F.; Boehm, C.; Vidal-Gilbert, S. Microfracturing and microporosity in shales. Earth Sci. Rev. 2016, 162, 198–226. [Google Scholar] [CrossRef] [Green Version]
  12. Ross, D.J.; Bustin, R.M. The importance of shale composition and pore structure upon gas storage potential of shale gas reservoirs. Mar. Pet. Geol. 2009, 26, 916–927. [Google Scholar] [CrossRef]
  13. Yao, Y.; Liu, D.; Che, Y.; Tang, D.; Tang, S.; Huang, W. Petrophysical characterization of coals by low-field nuclear magnetic resonance (NMR). Fuel 2010, 89, 1371–1380. [Google Scholar] [CrossRef]
  14. Zhu, H.; Ju, Y.; Lu, W.; Han, K.; Qi, Y.; Neupane, B.; Han, Y. The characteristics and evolution of micro-nano scale pores in shales and coals. J. Nanosci. Nanotechnol. 2017, 17, 6124–6138. [Google Scholar] [CrossRef]
  15. Ju, Y.; Huang, C.; Sun, Y.; Wan, Q.; Lu, X.; Lu, S.; He, H.; Wang, X.; Zou, C.; Wu, J.; et al. Nanogeosciences: Research History, Current Status, and Development Trends. J. Nanosci. Nanotechnol. 2017, 17, 5930–5965. [Google Scholar] [CrossRef]
  16. Chen, F.; Lu, S.; Ding, X.; Zhao, H.; Ju, Y. Total Porosity Measured for Shale Gas Reservoir Samples: A Case from the Lower Silurian Longmaxi Formation in Southeast Chongqing, China. Minerals 2019, 9, 5. [Google Scholar] [CrossRef]
  17. Xi, Z.; Tang, S.; Wang, J.; Yi, J.; Guo, Y.; Wang, K. Pore structure and fractal characteristics of Niutitang shale from China. Minerals 2018, 8, 163. [Google Scholar] [CrossRef]
  18. Curtis, M.E.; Sondergeld, C.H.; Ambrose, R.J.; Rai, C.S. Microstructural investigation of gas shales in two and three dimensions using nanometer-scale resolution imagingMicrostructure of Gas Shales. AAPG Bull. 2012, 96, 665–677. [Google Scholar] [CrossRef]
  19. Loucks, R.G.; Reed, R.M.; Ruppel, S.C.; Jarvie, D.M. Morphology, genesis, and distribution of nanometer-scale pores in siliceous mudstones of the Mississippian Barnett Shale. J. Sediment. Res. 2009, 79, 848–861. [Google Scholar] [CrossRef]
  20. Loucks, R.G.; Reed, R.M.; Ruppel, S.C.; Hammes, U. Spectrum of pore types and networks in mudrocks and a descriptive classification for matrix-related mudrock pores. AAPG Bull. 2012, 96, 1071–1098. [Google Scholar] [CrossRef] [Green Version]
  21. Curtis, M.E.; Cardott, B.J.; Sondergeld, C.H.; Rai, C.S. Development of organic porosity in the Woodford Shale with increasing thermal maturity. Int. J. Coal Geol. 2012, 103, 26–31. [Google Scholar] [CrossRef]
  22. Milliken, K.L.; Rudnicki, M.; Awwiller, D.N.; Zhang, T. Organic matter–hosted pore system, Marcellus formation (Devonian), Pennsylvania. AAPG Bull. 2013, 97, 177–200. [Google Scholar] [CrossRef]
  23. Löhr, S.C.; Baruch, E.T.; Hall, P.A.; Kennedy, M.J. Is organic pore development in gas shales influenced by the primary porosity and structure of thermally immature organic matter? Org. Geochem. 2015, 87, 119–132. [Google Scholar] [CrossRef] [Green Version]
  24. Lu, J.; Ruppel, S.C.; Rowe, H.D. Organic matter pores and oil generation in the Tuscaloosa marine shale. AAPG Bull. 2015, 99, 333–357. [Google Scholar] [CrossRef]
  25. Zhu, H.; Ju, Y.; Huang, C.; Han, K.; Qi, Y.; Shi, M.; Qian, J. Pore structure variations across structural deformation of Silurian Longmaxi Shale: An example from the Chuandong Thrust-Fold Belt. Fuel 2019, 241, 914–932. [Google Scholar] [CrossRef]
  26. Liang, M.; Wang, Z.; Gao, L.; Li, C.; Li, H. Evolution of pore structure in gas shale related to structural deformation. Fuel 2017, 197, 310–319. [Google Scholar] [CrossRef]
  27. Ju, Y.; Sun, Y.; Tan, J.; Bu, H.; Han, K.; Li, X.; Fang, L. The composition, pore structure characterization and deformation mechanism of coal-bearing shales from tectonically altered coalfields in eastern China. Fuel 2018, 234, 626–642. [Google Scholar] [CrossRef]
  28. Hao, F.; Zou, H.; Lu, Y. Mechanisms of shale gas storage: Implications for shale gas exploration in ChinaMechanisms of Shale Gas Storage. AAPG Bull. 2013, 97, 1325–1346. [Google Scholar] [CrossRef]
  29. Liu, Y.; Qiu, N.; Xie, Z.; Yao, Q.; Zhu, C. Overpressure compartments in the central paleo-uplift, Sichuan Basin, southwest China. AAPG Bull. 2016, 100, 867–888. [Google Scholar] [CrossRef]
  30. Feng, W.; Wang, F.; Guan, J.; Zhou, J.; Wei, F.; Dong, W.; Xu, Y. Geologic structure controls on initial productions of lower Silurian Longmaxi shale in south China. Mar. Pet. Geol. 2018, 91, 163–178. [Google Scholar] [CrossRef]
  31. Ju, Y.; Wang, G.; Bu, H.; Li, Q.; Yan, Z. China organic-rich shale geologic features and special shale gas production issues. J. Rock Mech. Geotech. Eng. 2014, 6, 196–207. [Google Scholar] [CrossRef] [Green Version]
  32. Tang, X.; Jiang, Z.; Jiang, S.; Li, Z. Heterogeneous nanoporosity of the Silurian Longmaxi Formation shale gas reservoir in the Sichuan Basin using the QEMSCAN, FIB-SEM, and nano-CT methods. Mar. Pet. Geol. 2016, 78, 99–109. [Google Scholar] [CrossRef]
  33. Zhang, P.; Lu, S.; Li, J.; Chen, C.; Xue, H.; Zhang, J. Petrophysical characterization of oil-bearing shales by low-field nuclear magnetic resonance (NMR). Mar. Pet. Geol. 2018, 89, 775–785. [Google Scholar] [CrossRef]
  34. Liu, Y.; Yao, Y.; Liu, D.; Zheng, S.; Sun, G.; Chang, Y. Shale pore size classification: An NMR fluid typing method. Mar. Pet. Geol. 2018, 96, 591–601. [Google Scholar] [CrossRef]
  35. Zhang, S.; Yan, J.; Hu, Q.; Wang, J.; Tian, T.; Chao, J.; Wang, M. Integrated NMR and FE-SEM methods for pore structure characterization of Shahejie shale from the Dongying Depression, Bohai Bay Basin. Mar. Pet. Geol. 2019, 100, 85–94. [Google Scholar] [CrossRef]
  36. Chalmers, G.R.; Bustin, R.M.; Power, I.M. Characterization of gas shale pore systems by porosimetry, pycnometry, surface area, and field emission scanning electron microscopy/transmission electron microscopy image analyses: Examples from the Barnett, Woodford, Haynesville, Marcellus, and Doig units Characterization of Gas Shale Pore Systems. AAPG Bull. 2012, 96, 1099–1119. [Google Scholar] [CrossRef]
  37. Slatt, R.M.; O’Brien, N.R. Pore types in the Barnett and Woodford gas shales: Contribution to understanding gas storage and migration pathways in fine-grained rocks. AAPG Bull. 2011, 95, 2017–2030. [Google Scholar] [CrossRef]
  38. Ko, L.T.; Loucks, R.G.; Zhang, T.; Ruppel, S.C.; Shao, D. Pore and pore network evolution of Upper Cretaceous Boquillas (Eagle Ford–equivalent) mudrocks: Results from gold tube pyrolysis experiments. AAPG Bull. 2016, 100, 1693–1722. [Google Scholar] [CrossRef]
  39. Ding, W.; Li, C.; Li, C.; Xu, C.; Jiu, K.; Zeng, W.; Wu, L. Fracture development in shale and its relationship to gas accumulation. Geosci. Front. 2012, 3, 97–105. [Google Scholar] [CrossRef] [Green Version]
  40. Zeng, W.; Zhang, J.; Ding, W.; Zhao, S.; Zhang, Y.; Liu, Z.; Jiu, K. Fracture development in Paleozoic shale of Chongqing area (South China). Part one: Fracture characteristics and comparative analysis of main controlling factors. J. Asian Earth Sci. 2013, 75, 251–266. [Google Scholar] [CrossRef]
  41. Kennedy, M.J.; Löhr, S.C.; Fraser, S.A.; Baruch, E.T. Direct evidence for organic carbon preservation as clay-organic nanocomposites in a Devonian black shale; from deposition to diagenesis. Earth Planet. Sci. Lett. 2014, 388, 59–70. [Google Scholar] [CrossRef]
  42. Zhu, X.; Cai, J.; Wang, G.; Song, M. Role of organo-clay composites in hydrocarbon generation of shale. Int. J. Coal Geol. 2018, 192, 83–90. [Google Scholar] [CrossRef]
  43. Morley, C.K.; von Hagke, C.; Hansberry, R.; Collins, A.; Kanitpanyacharoen, W.; King, R. Review of major shale-dominated detachment and thrust characteristics in the diagenetic zone: Part II, rock mechanics and microscopic scale. Earth Sci. Rev. 2018, 176, 19–50. [Google Scholar] [CrossRef]
  44. Salmon, V.; Derenne, S.; Lallier-Vergès, E.; Largeau, C.; Beaudoin, B. Protection of organic matter by mineral matrix in a Cenomanian black shale. Organ. Geochem. 2000, 31, 463–474. [Google Scholar] [CrossRef] [Green Version]
  45. Kennedy, M.J.; Pevear, D.R.; Hill, R.J. Mineral surface control of organic carbon in black shale. Science 2002, 295, 657–660. [Google Scholar] [CrossRef]
  46. Drake, W.R.; Longman, M.W.; Kostelnik, J. The Role of Silica Nanospheres in Porosity Preservation in the Upper Devonian Woodford Shale on the Central Basin Platform, West Texas. In Proceedings of the RMAG and DWLS Fall Symposium: Geology and Petrophysics of Unconventional Mudrocks, Golden, CO, USA, 27 September 2017. [Google Scholar]
  47. Tan, J.; Horsfield, B.; Fink, R.; Krooss, B.; Schulz, H.M.; Rybacki, E.; Tocher, B.A. Shale gas potential of the major marine shale formations in the Upper Yangtze Platform, south China, Part III: Mineralogical, lithofacial, petrophysical, and rock mechanical properties. Energy Fuels 2014, 28, 2322–2342. [Google Scholar] [CrossRef]
  48. Tan, J.; Weniger, P.; Krooss, B.; Merkel, A.; Horsfield, B.; Zhang, J.; Tocher, B.A. Shale gas potential of the major marine shale formations in the Upper Yangtze Platform, South China, Part II: Methane sorption capacity. Fuel 2014, 129, 204–218. [Google Scholar] [CrossRef]
  49. Li, J.; Zhou, S.; Li, Y.; Ma, Y.; Yang, Y.; Li, C. Effect of organic matter on pore structure of mature lacustrine organic-rich shale: A case study of the Triassic Yanchang shale, Ordos Basin, China. Fuel 2016, 185, 421–431. [Google Scholar] [CrossRef]
  50. Song, L.; Martin, K.; Carr, T.R.; Ghahfarokhi, P.K. Porosity and storage capacity of Middle Devonian shale: A function of thermal maturity, total organic carbon, and clay content. Fuel 2019, 241, 1036–1044. [Google Scholar] [CrossRef]
  51. Kuila, U.; McCarty, D.K.; Derkowski, A.; Fischer, T.B.; Topór, T.; Prasad, M. Nano-scale texture and porosity of organic matter and clay minerals in organic-rich mudrocks. Fuel 2014, 135, 359–373. [Google Scholar] [CrossRef] [Green Version]
  52. Bernard, S.; Wirth, R.; Schreiber, A.; Schulz, H.M.; Horsfield, B. Formation of nanoporous pyrobitumen residues during maturation of the Barnett Shale (Fort Worth Basin). Int. J. Coal Geol. 2012, 103, 3–11. [Google Scholar] [CrossRef]
  53. Reed, R.M.; Loucks, R.G.; Ruppel, S.C. Comment on “Formation of nanoporous pyrobitumen residues during maturation of the Barnett Shale (Fort Worth Basin)” by Bernard et al. (2012). Int. J. Coal Geol. 2014, 127, 111–113. [Google Scholar] [CrossRef]
  54. Pan, J.; Wang, K.; Hou, Q.; Niu, Q.; Wang, H.; Ji, Z. Micro-pores and fractures of coals analysed by field emission scanning electron microscopy and fractal theory. Fuel 2016, 164, 277–285. [Google Scholar] [CrossRef]
  55. Pan, J.; Zhu, H.; Hou, Q.; Wang, H.; Wang, S. Macromolecular and pore structures of Chinese tectonically deformed coal studied by atomic force microscopy. Fuel 2015, 139, 94–101. [Google Scholar] [CrossRef]
  56. Li, X.; Ju, Y.; Hou, Q.; Li, Z.; Li, Q.; Wang, G. Nanopore Structure Analysis of Deformed Coal from Nitrogen Isotherms and Synchrotron Small Angle X-ray Scattering. J. Nanosci. Nanotechnol. 2017, 17, 6224–6234. [Google Scholar] [CrossRef]
  57. Liu, X.; Song, D.; He, X.; Nie, B.; Wang, L. Insight into the macromolecular structural differences between hard coal and deformed soft coal. Fuel 2019, 245, 188–197. [Google Scholar] [CrossRef]
  58. Song, Y.; Jiang, B.; Han, Y. Macromolecular response to tectonic deformation in low-rank tectonically deformed coals (TDCs). Fuel 2018, 219, 279–287. [Google Scholar] [CrossRef]
  59. Zhao, S.; Li, Y.; Wang, Y.; Ma, Z.; Huang, X. Quantitative study on coal and shale pore structure and surface roughness based on atomic force microscopy and image processing. Fuel 2019, 244, 78–90. [Google Scholar] [CrossRef]
  60. Yin, Y.; Zhao, T.; Zhang, Y.; Tan, Y.; Qiu, Y.; Taheri, A.; Jing, Y. An Innovative Method for Placement of Gangue Backfilling Material in Steep Underground Coal Mines. Minerals 2019, 9, 107. [Google Scholar] [CrossRef]
  61. Curtis, J.B. Fractured shale-gas systems. AAPG Bull. 2002, 86, 1921–1938. [Google Scholar] [CrossRef]
  62. Liu, J.; Yao, Y.; Liu, D.; Pan, Z.; Cai, Y. Comparison of three key marine shale reservoirs in the southeastern margin of the Sichuan basin, SW China. Minerals 2017, 7, 179. [Google Scholar] [CrossRef]
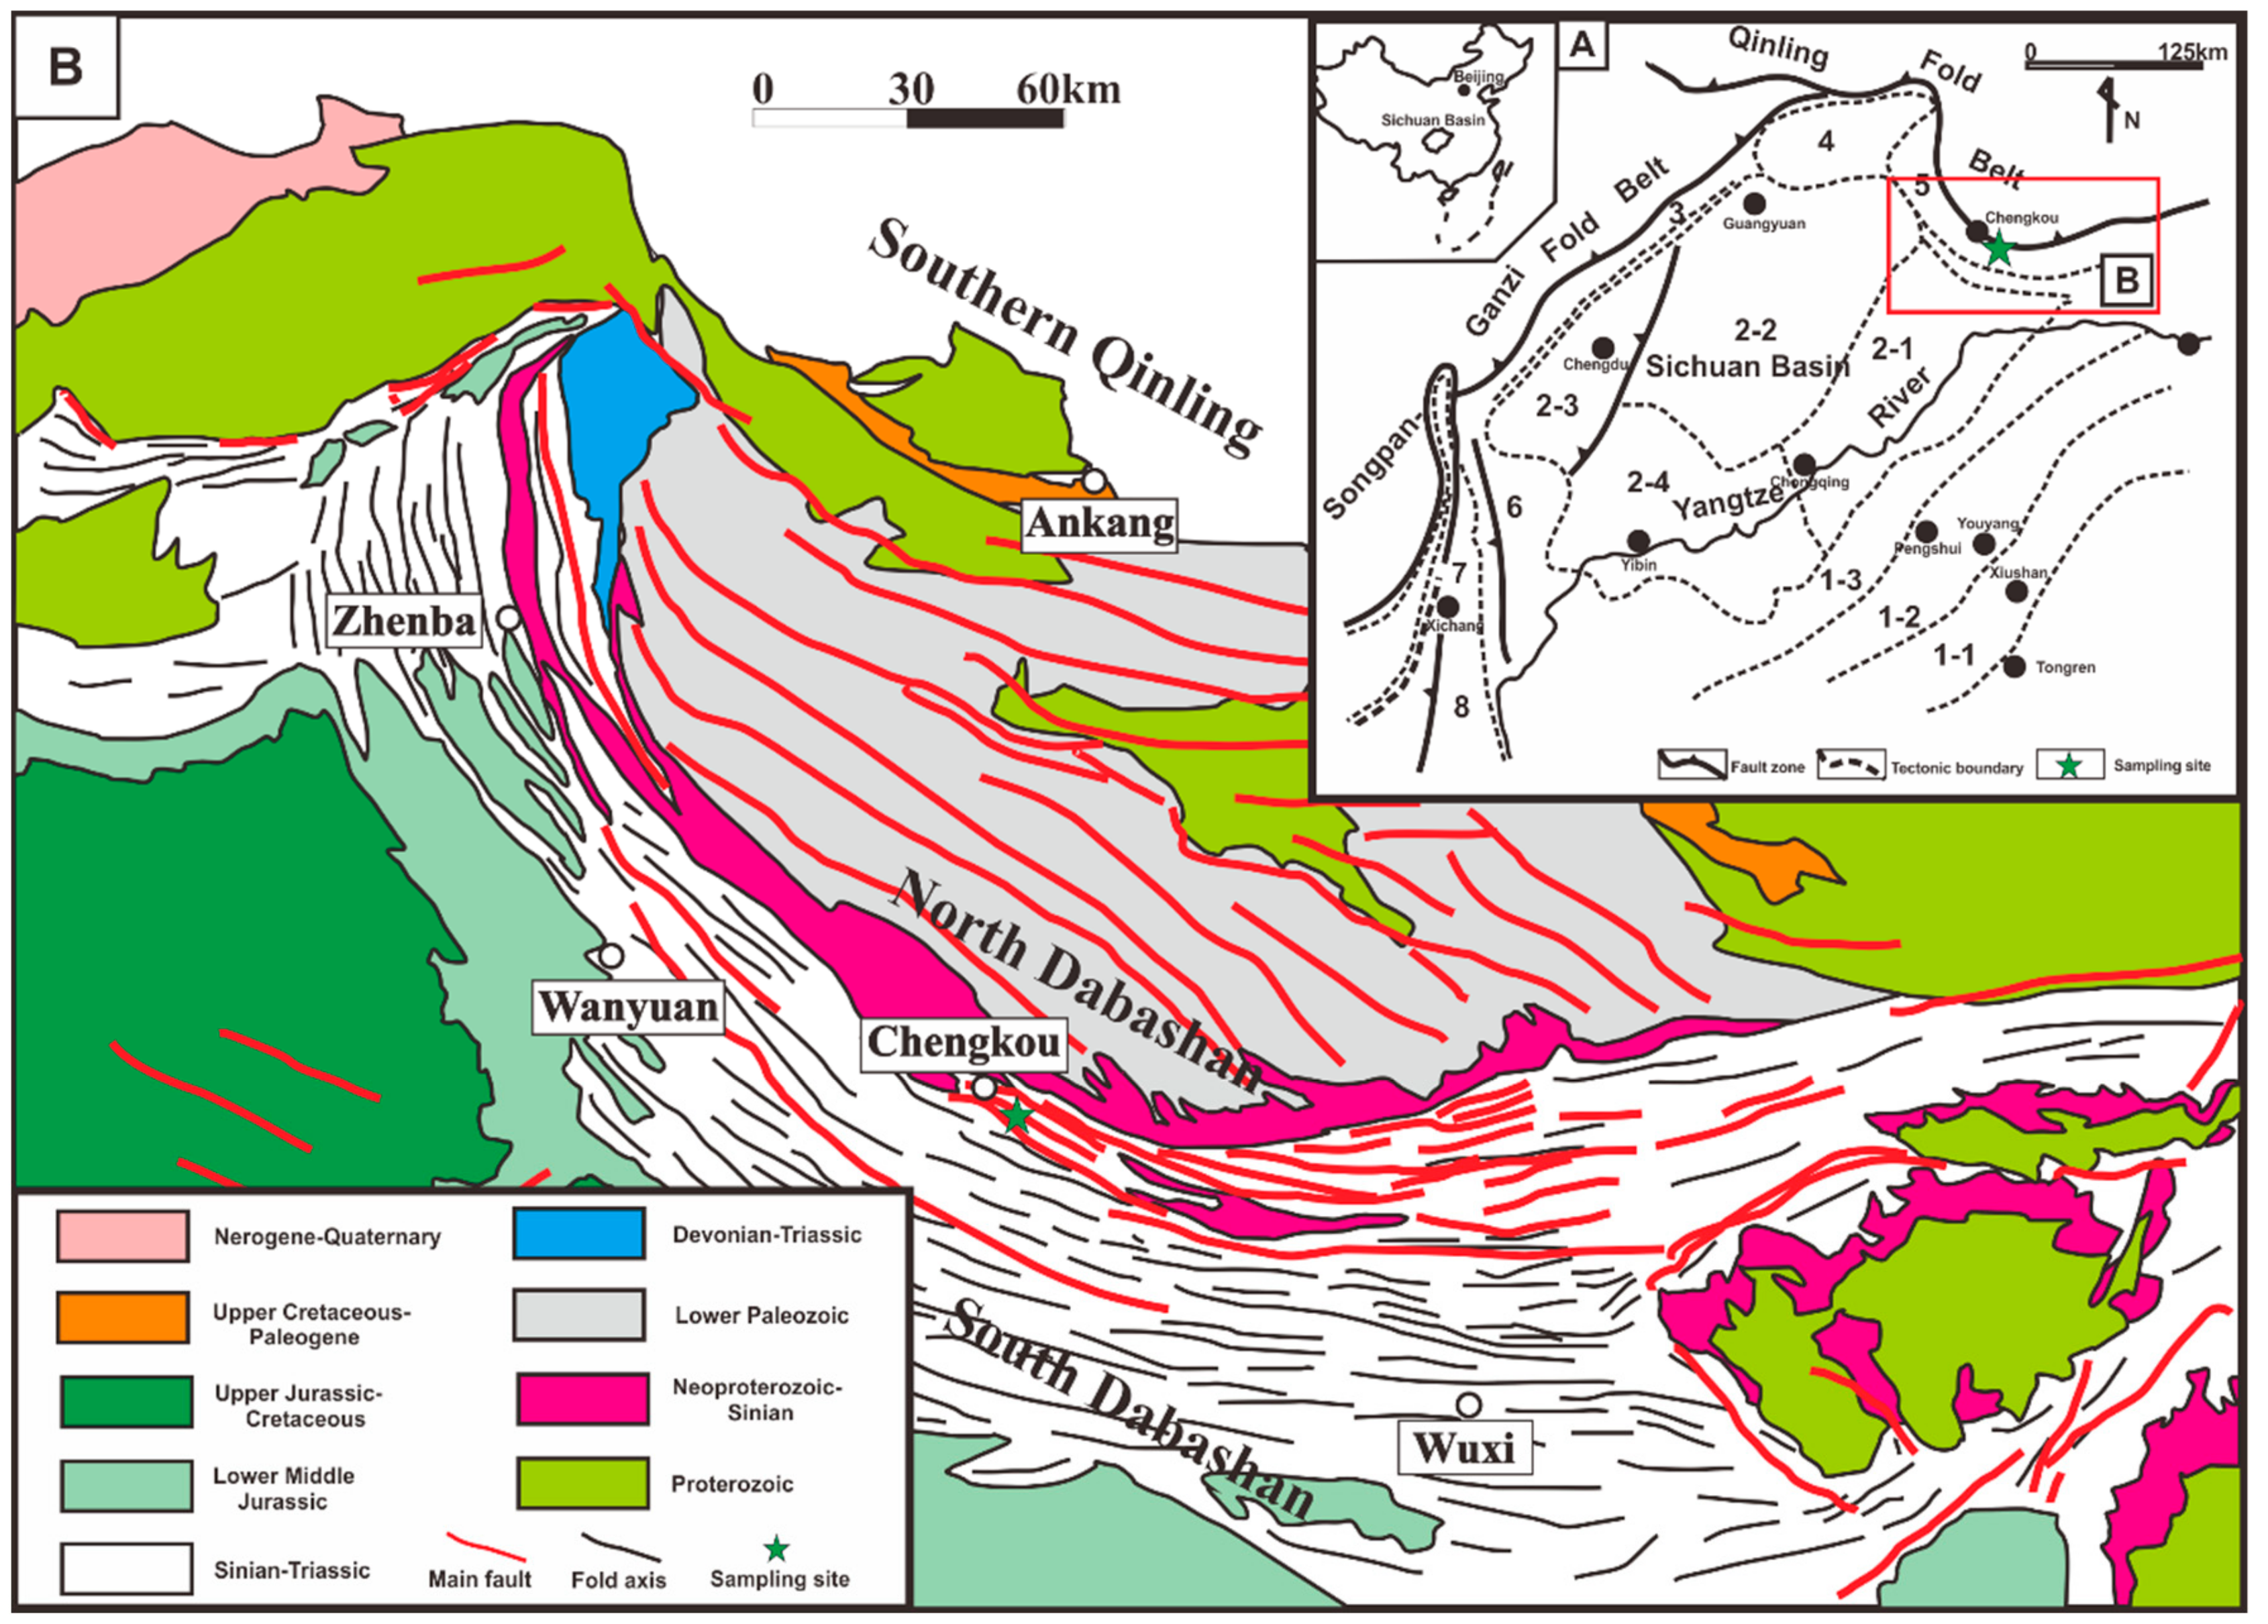
Figure 1. Simplified geological maps and location of the Sichuan Basin (a) and Dabashan (b) (Modified from Li et al. [6], Ma et al. [7], Kang et al. [10]). 1-1: Xuefengshan fold subzone; 1-2: Western Hubei-Eastern Chongqing-Northern Guizhou fold subzone; 1-3: Qiyueshan-Jinfoushan-Daloushan fold subzone; 2-1: Eastern Sichuan fold belt; 2-2: Central Sichuan fold belt; 2-3: Western Sichuan fold belt; 2-4: Southern Sichuan fold belt; 3: Longmenshan fold belt; 4: Michangshan fold belt; 5: Dabashan fold belt; 6: Emeishan-Daliangshan block-fault belt; 7: Xichang basin; 8: Kangdian tectonic belt.
Minerals 09 00354 g001
Figure 2. Optical photomicrograph of sample L1 (a) and L2 (b). Brittle deformation and “X” joints can be found, showing complex cross-cutting relationships. Optical photomicrograph of sample D3 (c) and D4 (d). Deformation continued after veins formation, resulting in the development of fault-fold microstructures, rotated porphyroclast, and further veining.
Minerals 09 00354 g002
Figure 3. Relative abundance of pore types within all shales. Fracture-related pores (e.g., microchannels and microfractures) account for the 60% of the total pore types, mineral-hosted pores (e.g., interparticle pores and intraparticle pores) account for ~30%, and OM-hosted pores account for ~10%.
Minerals 09 00354 g003
Figure 4. SEM photomicrograph images of fracture-related pores in Lujiaping deformed shales. Natural microchannels are indicated with yellow arrows whereas the microfractures are indicated with red arrows. (a) Fracture-related pores within sample L2; (b) fracture-related pores within sample D1; (c) fracture-related pores within sample L3; (d) fracture-related pores within sample D4.
Minerals 09 00354 g004
Figure 5. SEM photomicrograph images of interparticle pores in Lujiaping shales. Natural fracture-related pores are indicated with red arrows whereas the interparticle pores are indicated with yellow arrows. (a) SEM image showing abundant interparticle clay pores within sample L1; (b) SEM image showing abundant interparticle brittle mineral pores within sample L2; (c) SEM image showing abundant interparticle brittle mineral pores within sample D2; (d) SEM image showing abundant interparticle brittle mineral pores within sample D3.
Minerals 09 00354 g005
Figure 6. SEM photomicrograph images of intraparticle dissolution pores in Lujiaping deformed shales. The dissolution pores are indicated with yellow arrows. (a) SEM image showing abundant intraparticle dissolution pores within sample L3; (b) SEM image showing abundant intraparticle dissolution pores within sample L4; (c) SEM image showing abundant intraparticle dissolution pores within sample D1; (d) SEM image showing abundant intraparticle dissolution pores within sample D2.
Minerals 09 00354 g006
Figure 7. SEM photomicrograph images of OM-hosted pores in Lujiaping deformed shales. Natural thermally controlled fractures are indicated with red arrows whereas the OM pores are indicated with yellow arrows. (a) SEM image showing shrinkage crack pores within OM of sample L2; (b) SEM image showing shrinkage crack pores within OM of sample L4; (c) SEM image showing OM-hosted pores within sample D3; (d) SEM image showing OM-hosted pores within sample D4.
Minerals 09 00354 g007
Figure 8. Schematic diagrams showing OM pore evolution of organic-rich shales during both thermal maturity (ac) and tectonic deformation (ce).
Minerals 09 00354 g008
Figure 9. Evolution of the OM pore aspect ratio with increasing tectonic compression.
Minerals 09 00354 g009
Figure 10. (a,b) Plots of pore volume versus pore diameter (nm) showing a distinct bimodal pore size distribution (PSD) within samples obtained from LPNA measurement. (c,d) NMR T2 relaxation time curves of shale samples.
Minerals 09 00354 g010
Figure 11. SEM photomicrograph images of OM–clay aggregates and their related pore networks. Natural thermally or tectonically controlled fractures are indicated with red arrows whereas the OM pores are indicated with yellow arrows. (a) SEM image showing OM–clay aggregates of sample D1; (b) SEM image showing OM–clay aggregates and their related shrinkage crack pores and microfractures of sample L1; (c) SEM image showing OM–clay aggregates and their related pore systems within sample D2; (d) SEM image showing OM–clay aggregates and their related pore systems within sample D2.
Minerals 09 00354 g011
Figure 12. SEM images showing the development of abundant rounded silica nanograins. Silica nanograins have a minimum size of ~20 nm and a maximum size of ~100 nm. Black areas are the open interparticle pore space. (a) Features of the rounded silica nanograins within sample L1 and (b) features of the rounded silica nanograins within sample D3.
Minerals 09 00354 g012
Figure 13. Quantitative and qualitative description of hypothetical relationships between arrangement and abundance of three different pore types and porosity, permeability, connectivity, as well as gas storage characteristics.
Minerals 09 00354 g013
Table 1. Total organic carbon (TOC), Ro and XRD mineral composition characteristics of the shale samples.
Location of SamplesSample IDQuartz
(%)
Carbonate
(%)
Clays
(%)
Pyrite
(%)
Feldspar
(%)
TOC
(%)
Ro
(%)
Longtian outcrop,
Chongqing
L1382713686.553.14
L2562310364.143.03
L3651013645.243.01
L4572010373.573.26
Xiuqi outcrop,
Chongqing
D12722178242.172.92
D24272311143.492.93
D3479118198.572.99
D453735782.283.02