Article

A Study of Bubble Mineralization by Modified Glass Microspheres Based on a High-Speed Dynamic Microscopic Test System

1
School of Chemical Engineering and Technology, China University of Mining and Technology, Xuzhou 221116, China
2
National Engineering Research Center of Coal Preparation and Purification, China University of Mining and Technology, Xuzhou 221116, China
3
Henan Province Industrial Technology Research Institution of Resources and Materials, Zhengzhou University, Zhengzhou 450066, China
4
School of Electrical and Power Engineering, China University of Mining and Technology, Xuzhou 221116, China
*
Authors to whom correspondence should be addressed.
Minerals 2019, 9(6), 350; https://doi.org/10.3390/min9060350
Submission received: 30 April 2019 / Revised: 2 June 2019 / Accepted: 3 June 2019 / Published: 7 June 2019

Abstract

:
The microscopic study of bubble mineralization is an important means of flotation theory research. In order to visualize the research process, it is required that the particles have certain optical properties and the amount of bubbles is controllable. In this paper, the particles were glass microspheres modified with trimethylchlorosilane (TMCS). The modification effect was confirmed by Fourier-transform infrared spectroscopy (FTIR), contact angle measurements, and a flotation test. The FTIR analysis and flotation test verified that the functional group (-OH) of glass microspheres reacted with the functional group (-Si-Cl) of TMCS and that the glass microsphere surface was successfully modified. The results also showed that the contact angle and hydrophobicity of the glass microspheres of a given size increased with the increase of TMCS. A small glass microsphere required more TMCS during the modification step in order to have the same contact angle as a large glass microsphere. The microscopic process of bubble mineralization was captured by a high-speed dynamic analysis system. The probability of collision between large glass microspheres and bubbles was high, but so was the probability that the microspheres would detach from the bubble. Both the collision probability and the detachment probability between small glass microspheres and bubbles were small, and small glass microspheres were easily affected by the flotation fluid. Besides, small bubbles and fine glass microspheres had a higher flotation recovery than coarse glass microspheres and large bubbles.

1. Introduction

With deterioration of mineral resources and improvement of requirement of clean utilization, higher requirements for flotation efficiency are imposed. In order to meet these higher flotation efficiency requirements, more in-depth research on the basic theory and mechanism of flotation is necessary. Collision, adhesion, and detachment of particles to bubbles are flotation sub-processes that are affected by many factors such as the physical and chemical properties of the ore particles, bubble size, flotation equipment parameters, and fluid properties. An in-depth study of the flotation process can essentially optimize flotation [1,2].
Mineral particles have extremely complex surface physicochemical properties that make it difficult to grasp the desired factors to study. For example, the irregular shape, surface morphology, and complex components of the mineral particles can all interfere with the study of the influence of contact angles on mineralization behavior at the microscopic level. These complexities inconvenience the analysis of the test results as it becomes difficult to determine which factor is influencing which property. Furthermore, advanced optical measurement equipment high-speed dynamic microscopy is an effective method to study bubble and particle motion and/or mineralization micro-processes; however, these methods require the objects of interest to have good optical properties that can be captured by the camera. Usually, real mineral particles are opaque, while transparent glass microspheres have good reflectivity. Therefore, glass microspheres are the most suitable alternative to mineral particles in the study of bubble mineralization as they have regular morphology and a single composition. The particle size and density can be tuned to be close to that of minerals. However, the surface of glass microspheres is hydrophilic, which inhibits them from adhering to the surface of a bubble to form a mineralized bubble. In order to overcome the surface hydrophilicity of glass microspheres, surface modification is needed. This paper used surface-modified glass microspheres instead of mineral particles.
Several reports have been published that describe the use of surface modification technology in flotation research and related fields. The thickness of the bubble liquid film on different hydrophobic glass planes that had been pretreated with an organic agent was measured by charge coupled device (CCD) camera to study the effect of hydrophobicity on the bubble liquid film rupture process [3]. Wang et al. [4,5] used surface-modified particles to study the effect of the particle placement angle on the adhesion probability between a particle and bubble. They also studied the slip speed of particles in different solution environments and different surfaces. Nguyen et al. [6,7] used a high-speed dynamic camera to study the interaction between modified glass microspheres and bubbles and proposed that surface forces had little effect on the motion of particles over the bubble surface until the liquid film ruptured. They also used atomic force microscopy (AFM) to measure the change in force between the particle and bubble in different solutions at different approach speeds. They indicated that the interaction force between the bubble and particle was closely related to the approach speed of the bubble, which reflected the importance of the fluid dynamics in the collision between the bubble and particle [8]. Based on the deinking of waste paper, Emerson [9] studied the bubble–particle collision mechanism with glass microspheres. He photographed the collision process between bubbles and glass microspheres under different conditions by CCD and calculated the flotation probability. Verrelli et al. [10] used silanized glass microspheres to study the interaction between a glass microsphere and a stationary single bubble; they used computational fluid dynamics (CFD) to simulate the sliding trajectory of glass microspheres on the surface of the bubble. Koh et al. [11,12] studied the flotation effect of silanized glass microspheres of different sizes before and after being ground, and determined that the flotation rate of the ground glass microspheres was higher than that of the nonground microspheres.
Recently, researchers have gradually developed experimental research on bubble mineralization theory. Qin et al. [13,14] used electrolytic H2 flotation and a high-speed camera to study the matching relationship between cassiterite particle sizes and bubble sizes and found that there is an optimal size matching range between particles and bubbles in which the recovery rate is maximized. Meng [15] used an electrolysis flotation device and a microscopic image acquisition equipment (CCD equipped with microscopic lens) to study the effect of different flotation reagents on the flotation bubble size and the interaction between bubbles and diaspore particles. Gui et al. [16] used AFM to study the interaction between coal and coal, kaolin and coal and kaolin in different solutions, and the force between particles changed when the solution environment changed. Cui et al. [17] employed AFM to quantify the interactions between two air bubbles and between an air bubble and an octadecyltrichlorosilane (OTS)-hydrophobized mica under various aqueous conditions. They found that the bubble-OTS hydrophobic attraction with a decay length of 1.0 nm was independent of solution pH and salinity. Ali et al. [18] studied the effect of solid particles on the bubble size distribution and gas holdup, as well as the correlation between the bubble size distribution and gas holdup in column flotation. They revealed that hydrophobic particles affected the gas holdup through three different mechanisms modifying the Sauter mean diameter and rise velocity, namely surface interactions, the joint antagonistic effect of bubble loading and coalescence. Brozek, M et al. [19,20,21] took coal as the main research object to study the interaction between particles and bubbles from the perspective of the force analysis of particles on the bubble surface and the empirical formula of sub-process probability, and established models for analysis of the relationship between flotation recovery and particle size and the relationship between contact angle and maximum particle size.
Although many scholars have used modified glass microspheres to study the flotation microscopic process, few have reported on the use of glass microspheres to simulate the flotation of ore particles or detailed the modification process and mechanism of the glass microspheres. Few reports have also been published on the quantitative relationship between the amount of modification agents used and the extent of the modification effect. Furthermore, the interaction between modified glass microspheres and rising bubbles is rarely studied. Therefore, studying the surface modification of glass microspheres and its application in bubble mineralization have great significance for the study of the flotation mechanism. In this study, the surface modification methods and mechanisms were studied systematically, and the modified glass microspheres were used in bubble mineralization research.

2. Materials and Methods

2.1. Experimental Samples

The glass microspheres with a smooth surface, regular shape and good optical properties used in this experiment were purchased from Langfang Weiqi Glass Bead Co., Ltd. (Langfang, China). Figure 1 shows the size distribution of glass microspheres obtained with a Microtrac S3500 Particle Size Analyzer. It clearly shows that −350 + 40 μm was the dominant size fraction and had a yield of 94.78%, which was sieved to prepare the three size fractions, −250 + 125 μm, −125 + 74 μm, and −74 + 38 μm that were used in this study.
The true density of the glass microspheres was 2.52 g/cm3 as measured by the pycnometer test method. The chemical composition of the glass microspheres was obtained by X-ray fluorescence spectrometry and the results are shown in Table 1. The main chemical composition was SiO2, which was 71.86%, and there were small amounts of Na, Ca, Mg, Al, K, Fe, etc.
The shape of the glass microspheres observed by scanning electron microscopy (SEM) is shown in Figure 2.
There were some superfine impurities on the surface of the glass microspheres. The fine spheres attached to the surface of the large sphere might be caused by collision and adhesion among particles during the production of glass microspheres. The debris may be caused by collision among particles during screen.
The specific surface area of the glass microspheres was measured by the Brunauer Emmett Teller (BET) method in a nitrogen atmosphere. The specific surface area of the particles increased remarkably as the particle size decreased as shown in Table 2.

2.2. Experimental Agents

The main modification agents included a dilute acid solution (2.0% v/v H2SO4) and a dilute alkali solution (2.0% w/v NaOH) that were used as water-washing agents, cyclohexane (C6H12, AR), which acted as an organic solvent and trimethylchlorosilane (TMCS, C3H9ClSi, CP), which acted as a surface modifier. The main flotation agents included dodecylamine (DDA, C12H27N, AR) and methyl isobutyl carbinol (MIBC, C6H14O, AR). These chemicals were all purchased from Sinopharm Chemical Reagent Co., Ltd (China).

2.3. Experimental Methods

Experimental work included surface modification (water washing and modification), verification of modification, and bubble mineralization.

2.3.1. Surface Modification

Before modification, the surfaces of the glass microspheres must be pretreated to remove impurities and debris from the surface of the particles. The washing and modification methods used have been reported previously [11] and were refined. A 300 g sample of glass microspheres in a 500 mL conical flask was successively washed with the acid solution and the alkali solution. During each step, the conical flask was shaken in a shock box at 180 rpm in room temperature (20 °C) for about half an hour, after which the slurries were washed with de-ionized water and shaken with de-ionized water for about 24 h, and then filtered. The filter cakes were baked in an infrared drying oven for over 12 h to obtain water-washed glass microsphere samples with zero moisture for surface modification. In order to avoid the influence of impurities on the modification effect, cleaning contaminants should not be ignored. Multiple samples can be pretreated simultaneously.
After being dried, 50 g of the washed glass microspheres was placed in a surface modification device (shown in Figure 3). The thickness of the sample in the reaction vessel was kept below 10 mm. TMCS diluted with cyclohexane was added and left to react with the surfaces of the microspheres for over 12 h. The reaction vessel was shaken once every 3 h to complete the reaction. The reaction vessel was sealed to prevent the modifying agent from reacting with moisture in the air and a micro-syringe was used to add the modifying agent into the reaction vessel. A conduit in the device was used to direct the gas produced by reaction into a beaker for collection. After the reaction, the residual TMCS on the surface of the glass microspheres was rinsed off with cyclohexane, and the samples were filtered, dried and stored in a dry box for use.

2.3.2. Verification of Modification

Functional Group Analysis

The surface modification was completed by the reaction between the -Si-OH functional group of the glass microspheres and the -Si-Cl functional group of TMCS to form -Si-O-Si-(CH3)3 and HCl [11]; this means that the functional group of glass microspheres must be changed after modification. Infrared spectroscopy is an important and widely used analytical tool for identifying the functional groups of samples. Herein, a Thermo Scientific Nicolet iS 50 Fourier Transform Infrared FTIR spectrometer (Thermo Fisher Scientific; Massachusetts, USA) with a wavenumber range of 4000–400 cm−1 was used to record the FTIR spectra of unmodified and modified glass microspheres. KBr disks used to record the FTIR spectra were prepared from 2 mg of glass microspheres and 300 mg of KBr. The influences of background and vapor was considered during data analysis, and all experiments were conducted at 25 °C.

Flotation Test

To further identify the modification results, modified glass microspheres with −125 + 74 μm were selected to perform a flotation test. A 3 g sample was weighed and floated in a 40 mL flotation cell which was filled with 50 mg/L MIBC and 40 mg/L DDA solution. During flotation, particles were scraped for 1 min, collected, dried and calculated, the relationship between the flotation yield and the amount of TMCS used during the surface modification step was obtained.

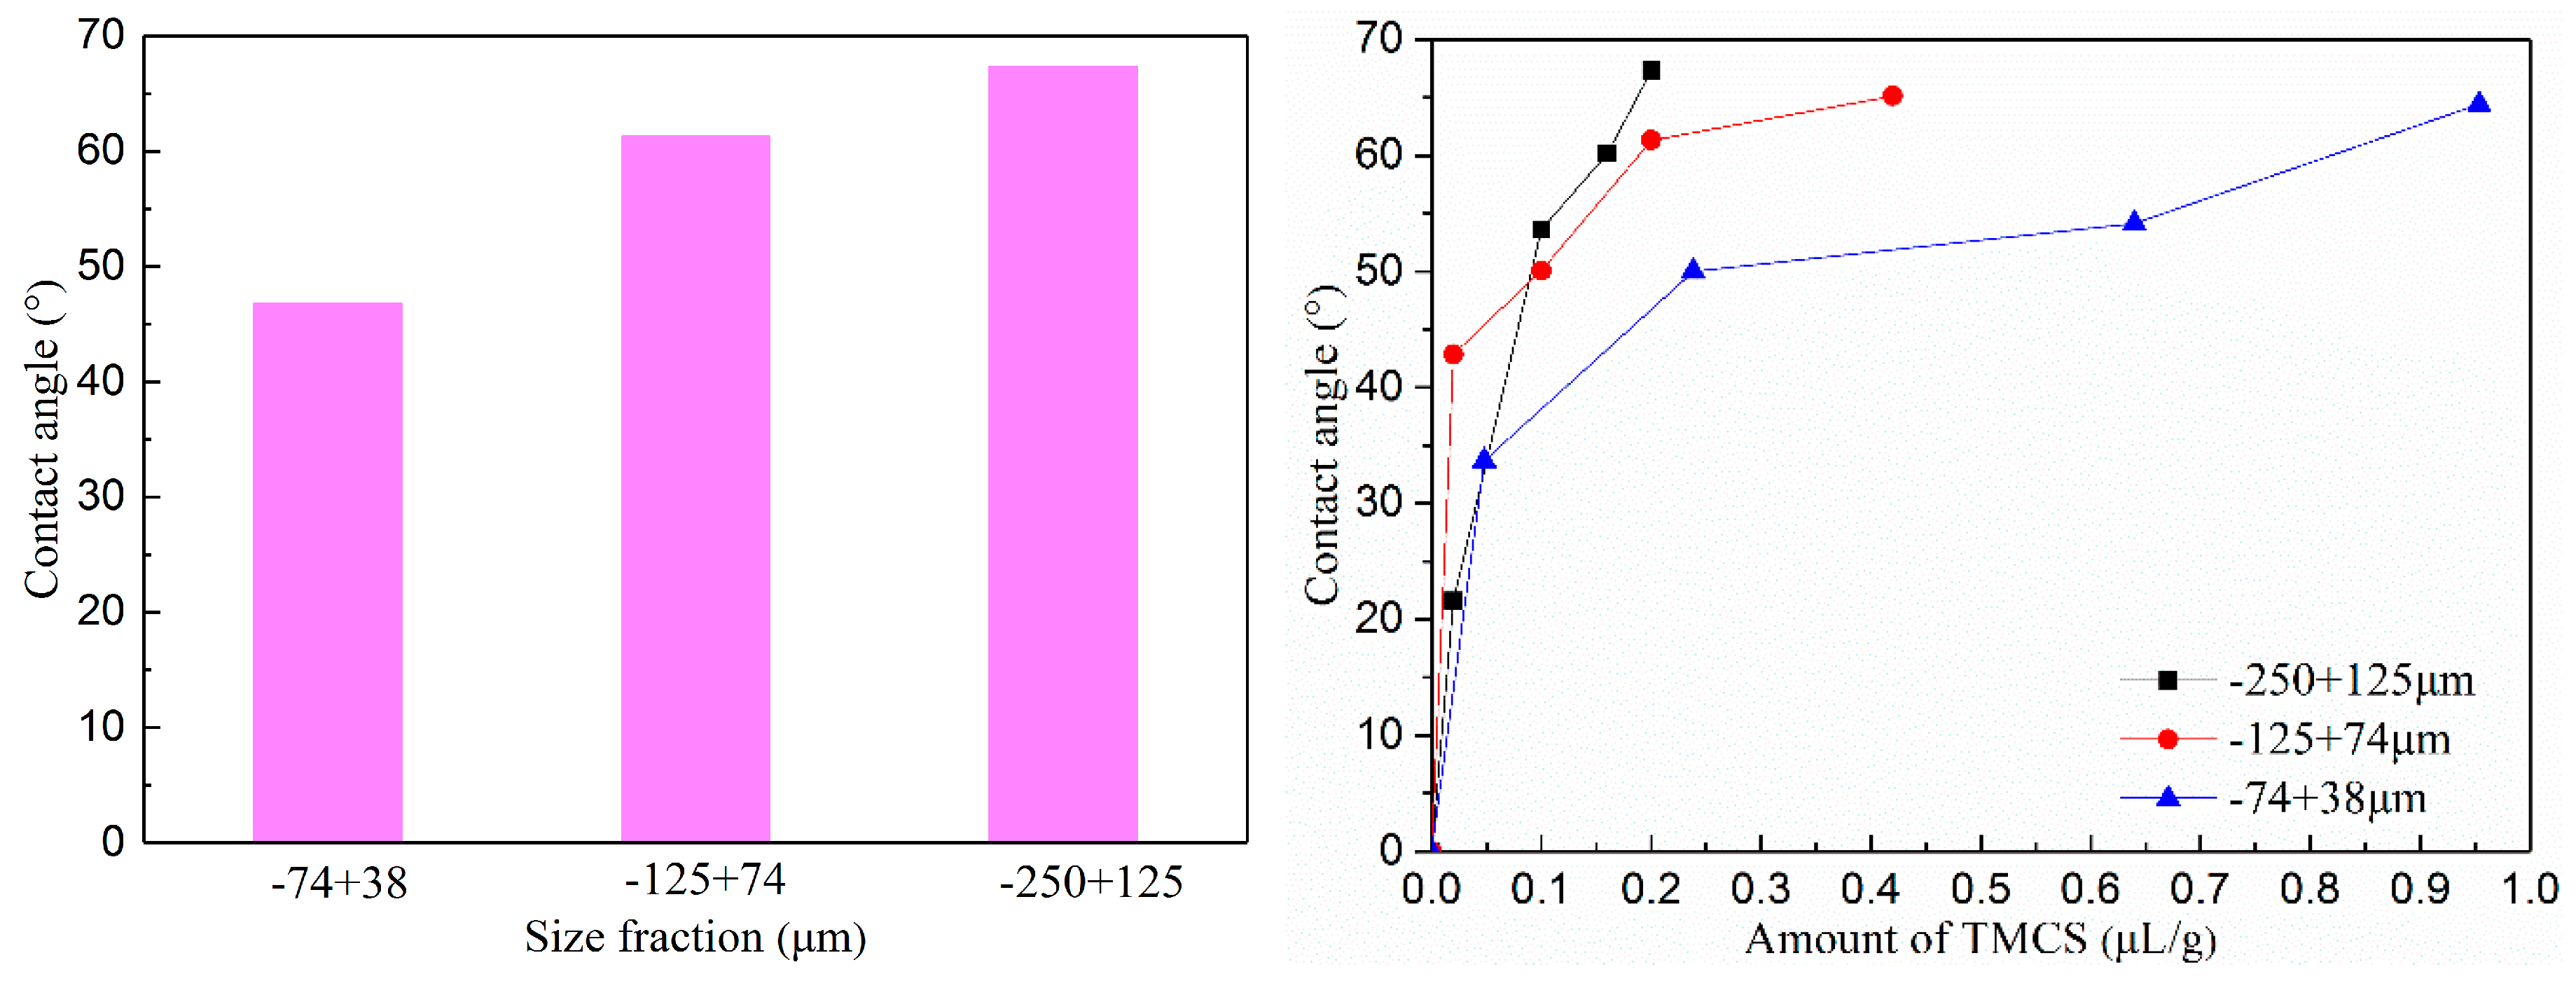
Contact Angle Measurement

There are two methods for detecting the degree to which the glass microspheres had been modified. The first method is to titrate the collected HCl with NaOH to measure the amount of TMCS used during the reaction. The second method is to filter and dry the modified glass microspheres, and then measure the surface hydrophobicity of the microspheres. The second method was used in this study and the Washburn dynamic method [22,23] was used to measure the contact angle of the modified glass microspheres.
The contact angle can be calculated by the Washburn equation [24,25] as follows:
ω 2 = c ρ 2 r cos θ 2 η t
where ω is the weight of penetrating liquid in the column (g), c is the filling bed geometry factor, η is the viscosity of liquid (mPa·s), ρ is the density of measuring liquid (g/mL), γ is the surface tension of the liquid (mN/m), θ is the wetting contact angle, and t is the time of wetting (s).
A K100 Force Tensiometer (KRUSS, Hamburg, Germany) was used to measure the contact angle of the modified particles (as shown in Figure 4 (left)). Filter paper was used to cover the bottom of the Washburn tube so that the 4.500 g of glass microspheres used in this experiment would not fall out after being placed in the tube. Then, a force was applied to compress each sample to the same compaction height to ensure the accuracy and repeatability of the tests. Next, the Washburn tube was placed in the hook of the tensiometer and the sample table was steadily lowered. During this time, the distance between the bottom of the tube and the water in the glass beaker was approximately 2 mm. When the bottom of the Washburn tube was close to the collector, the lowering of the Washburn tube was stopped immediately and the Tensiometer K100 began to record the mass change of the tube for a total of 600 s at 4 s intervals. The diagram of liquid wetting powder is shown in Figure 4 (right). All the experiments were conducted at 20 ℃ and the measured contact angle values presented in this paper are the average values.

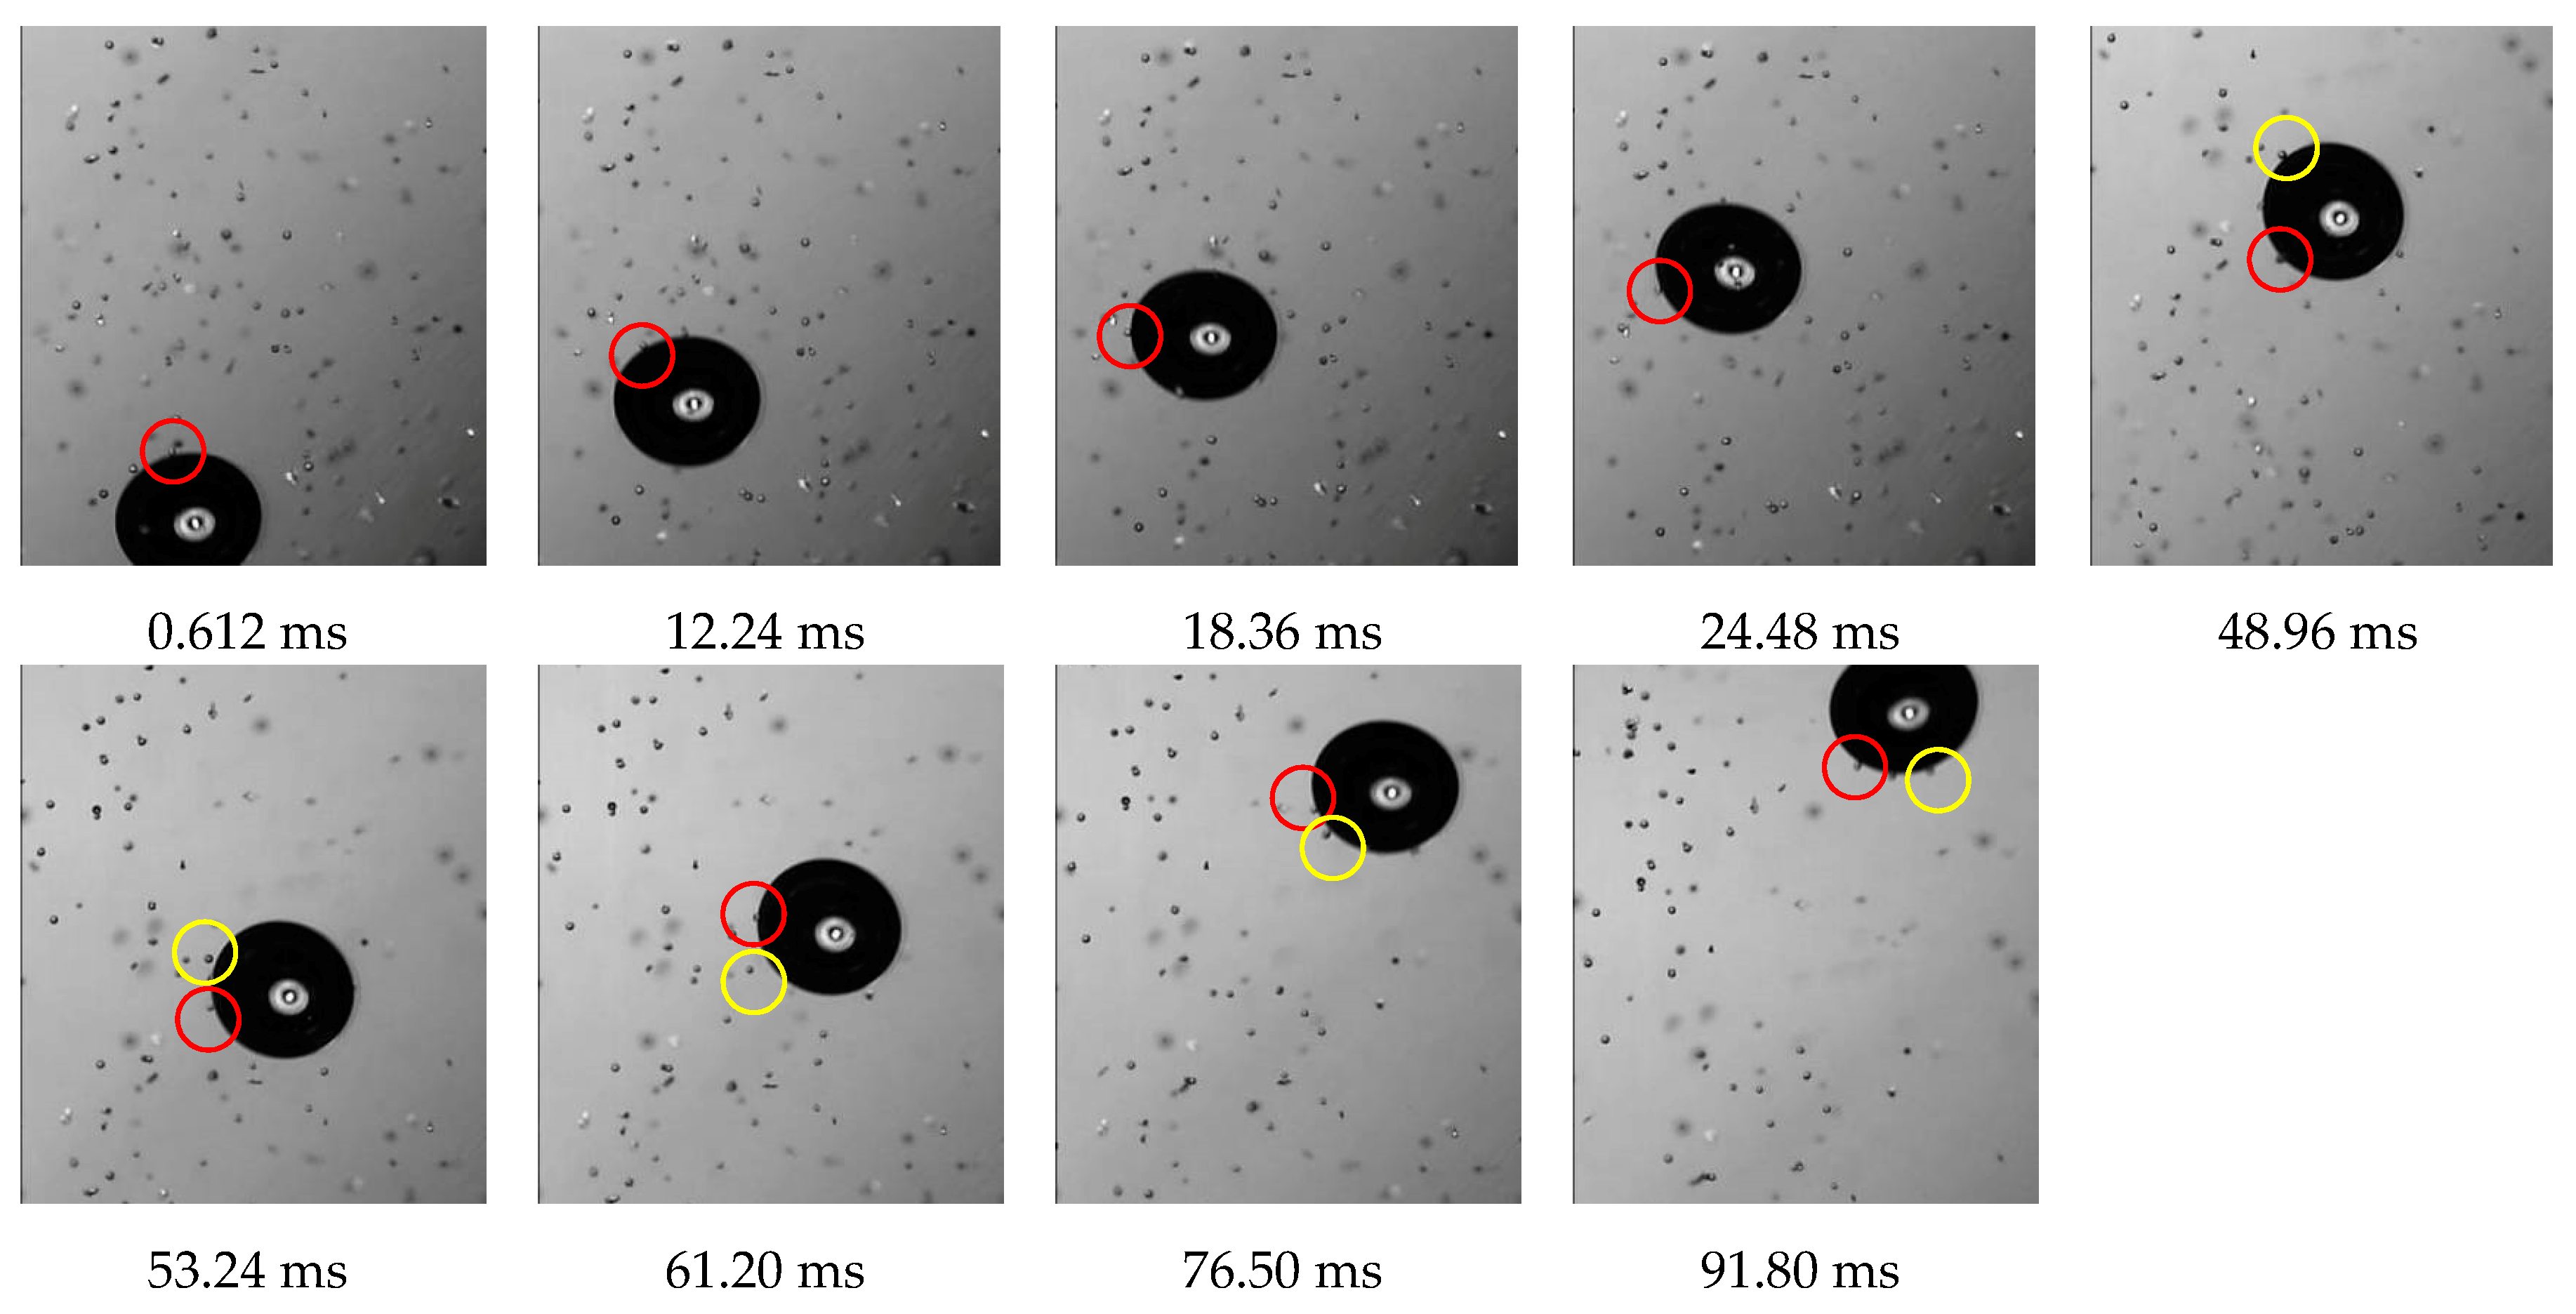
2.3.3. Bubble Mineralization

To observe the interaction between rising bubbles and falling modified glass microspheres, the rising single-bubble experimental device was set up as shown in Figure 5. The main components of this test system were a high-speed dynamic camera system (i-SPEED3, Olympus), microscopic lens (12X, Navitar), automatic syringe pump (JZB-1800, JYM Jianyuan), single bubble rising device (self-made), light and computer.
A fixed size needle was installed at the bottom of the single rising bubble device. Before starting the test, the device was filled with a 50 mg/L MIBC solution which overflowed into the center cylinder. The speed of the automatic syringe pump was set to ensure that bubbles continuously emerged from the needle. The modified glass microspheres were stirred and prewetted in the same solution as that which filled the single rising bubble device and fed into the device with the feeder. Glass microspheres were allowed to settle only by gravity and collided with bubbles. The video of the microsphere-bubble interaction could be captured by the high-speed camera at a frequency of 2000 frames per second. The images were stored in the computer and then processed using the i-SPEED Control and Image-Pro Plus software supplied with the high-speed dynamic camera system.
In the single rising bubble device, the effects of the bubble rising speed, bubble sizes, and glass microsphere sizes on flotation yield were quantified. Three types of needles (18#, 20#, 23#) were selected to control the bubble sizes. Three particle size fractions (−250 + 125 μm, −125 + 74 μm, −74 + 38 μm) were chosen to ensure the different particle sizes and the contact angle of all modified microspheres was kept at around the same value (55 ± 1°).

3. Results and Discussion

3.1. FTIR Spectra Analysis and Flotation Results of the Modified Glass Microspheres

Figure 6 shows the FTIR spectra of the glass microspheres before and after surface modification. According to Petit et al. [26], the peaks at 3437 cm−1 and 1626 cm−1 corresponded to the stretching bands and bending modes of hydroxyl (–OH), respectively. As shown in Figure 6, the number of –OH functional groups on the surface of the modified glass microspheres was significantly reduced compared with that before modification, which indicated that the -Si-OH functional group had reacted with the -Si-Cl functional group of TMCS.
Figure 7 shows the flotation flow chart (left) and the flotation yield and contact angle of the −125 + 74 μm glass microspheres (right). Clearly, the flotation yield and contact angle increased with the amount of TMCS used in the surface modification process. The flotation yield was positively correlated with the contact angle of the glass microspheres. The result is consistent with that of the previous study [11]. Contact angle reflects the hydrophobicity of particles [20], so the contact angle is the most common method used to describe surface hydrophobicity [27,28], the contact angles measured for the glass microspheres showed not only that the glass microspheres were highly hydrophobic but also that the hydrophobicity increased with the amount of surface modifier. The flotation test further confirmed the success of the surface modification process.

3.2. Change in Contact Angle after Surface Modification

Figure 8 illustrates the change in contact angle after surface modification. In Figure 8 (left), when the same amount of modified agent TMCS was used, the modification effect became stronger as the particle size increased because the large glass microspheres had a small specific surface area, which meant that less –OH was exposed on the surface. In other words, less TMCS was needed to achieve the same modification effect. Conversely, small glass microspheres had a large specific surface area, which meant that more –OH was exposed on the surface. Therefore, more TMCS was needed to achieve the same modification effect. These results were consistent with the specific surface area characteristics of different particle sizes given in Table 2.
The relationship between the contact angle of modified glass microspheres and the amount of TMCS is shown in Figure 8 (right). For the unmodified glass microspheres, the contact angle is 0°, meaning that they are highly hydrophilic. When the amount of TMCS was 0.02 μL/g, the contact angle of the −250 + 125 μm glass microspheres was 21.59°, and the contact angle was 67.33° when the amount of TMCS was 0.2 μL/g; the contact angle increased with the amount of TMCS used during the surface modification step. The same trend was found also for the other two size fractions. Figure 8 shows that the amount of TMCS consumed by glass microspheres of different sizes was different when the same contact angle was reached. For example, to obtain a contact angle of about 65°, the −250 + 125 μm glass microsphere needed 0.2 μL/g TMCS, while the −125 + 74 μm and −74 + 38 μm microspheres needed 0.42 μL/g and 0.95 μL/g, respectively. Of course, the surface of glass microspheres would by completely modified when sufficient TMCS was consumed.

3.3. Bubble Mineralization

Compared to the interaction between particles and a static bubble [4,6,7,29], the microscopic processes of collision, adhesion and detachment between falling particles and rising bubbles were expressed as follows.

3.3.1. Collision between Bubble and Glass Microspheres

The collision between bubbles and particles is the first part of bubble mineralization. Figure 9 shows images of the collision process between bubbles and modified glass microspheres of −250 + 125 μm captured by a high-speed dynamic camera.
During the ascent, a bubble carrying glass microspheres collided with falling glass microspheres, which were marked in red circles. The upper half of the bubble (between −90° and +90° from the left side to right side of bubble, as shown in Figure 10) was observed to be the main bubble-microsphere collision region, while glass microspheres rarely collided with the lower half region of the bubble. There was a kind of collision that may be caused by the disturbance of the rising bubble which can cause the glass microsphere to move upward and collide with the bubble. However, this type of collision rarely resulted in adhesion. The glass microspheres slid to the bubble bottom along the bubble surface after they collided with the bubble.
For the other two glass microsphere size fractions, especially the fine microspheres of −74 + 38 μm, the collision process was difficult to be captured because the sinking speed of the fine microspheres was quite slow, and the sinking direction was easily disturbed by rising bubbles. In other words, the two smaller size fractions of particles were too small to capture the collision process, which may be the reason fine particles held low collision probability. The result indicated that the large-sized glass microspheres had a greater probability of colliding with a bubble; this result was the same as that of collision theories [30].

3.3.2. Adhesion between Bubble and Glass Microspheres

In order to clearly and easily observe the attachment process between glass microspheres and bubbles, a small number of glass microspheres was added into the rising device and modified glass microspheres of −125 + 74 μm were selected as the observation objects. The recorded images are shown in Figure 11. That the bubbles carry glass microspheres can be seen in Figure 9, Figure 11 and Figure 12, but the coarse glass microspheres bounced off the rising bubble during collision, which was not conducive to the adhesion of the glass microspheres to the bubbles.
In Figure 11, two glass microspheres were respectively labeled with a red circle (“a”) and a yellow circle (“b”). At 0.612 ms, microsphere “a” approached the bubble, collided and then slid on the surface of the bubble, which was consistent with the phenomenon observed using a single static bubble device [29]. The relative position between “a” and the bubble was maintained after the microsphere slid to the bottom of the bubble at 24.48 ms and floated with the bubble. This result indicated that the adhesion process between “a” and the bubble was achieved in 24.48 ms. During this time, the intervening liquid film between “a” and the bubble experienced thinning and rupture, and the three-phase contact line was expanded to form a stable wetting perimeter [31,32]. Therefore, this time can be regarded as the induction time between “a” and the bubble. Microsphere “b” appeared and collided with the bubble at 48.96 ms but slid off the bubble surface at 61.2 ms. After that, “b” moved upwards due to the disturbance of the bubble and collided with the bubble again at 76.5 ms, at which point “b” finally attached to the bubble surface and disappeared from the lens. This phenomenon was a good way to directly explain the influence of fluid on flotation from a microscopic perspective.

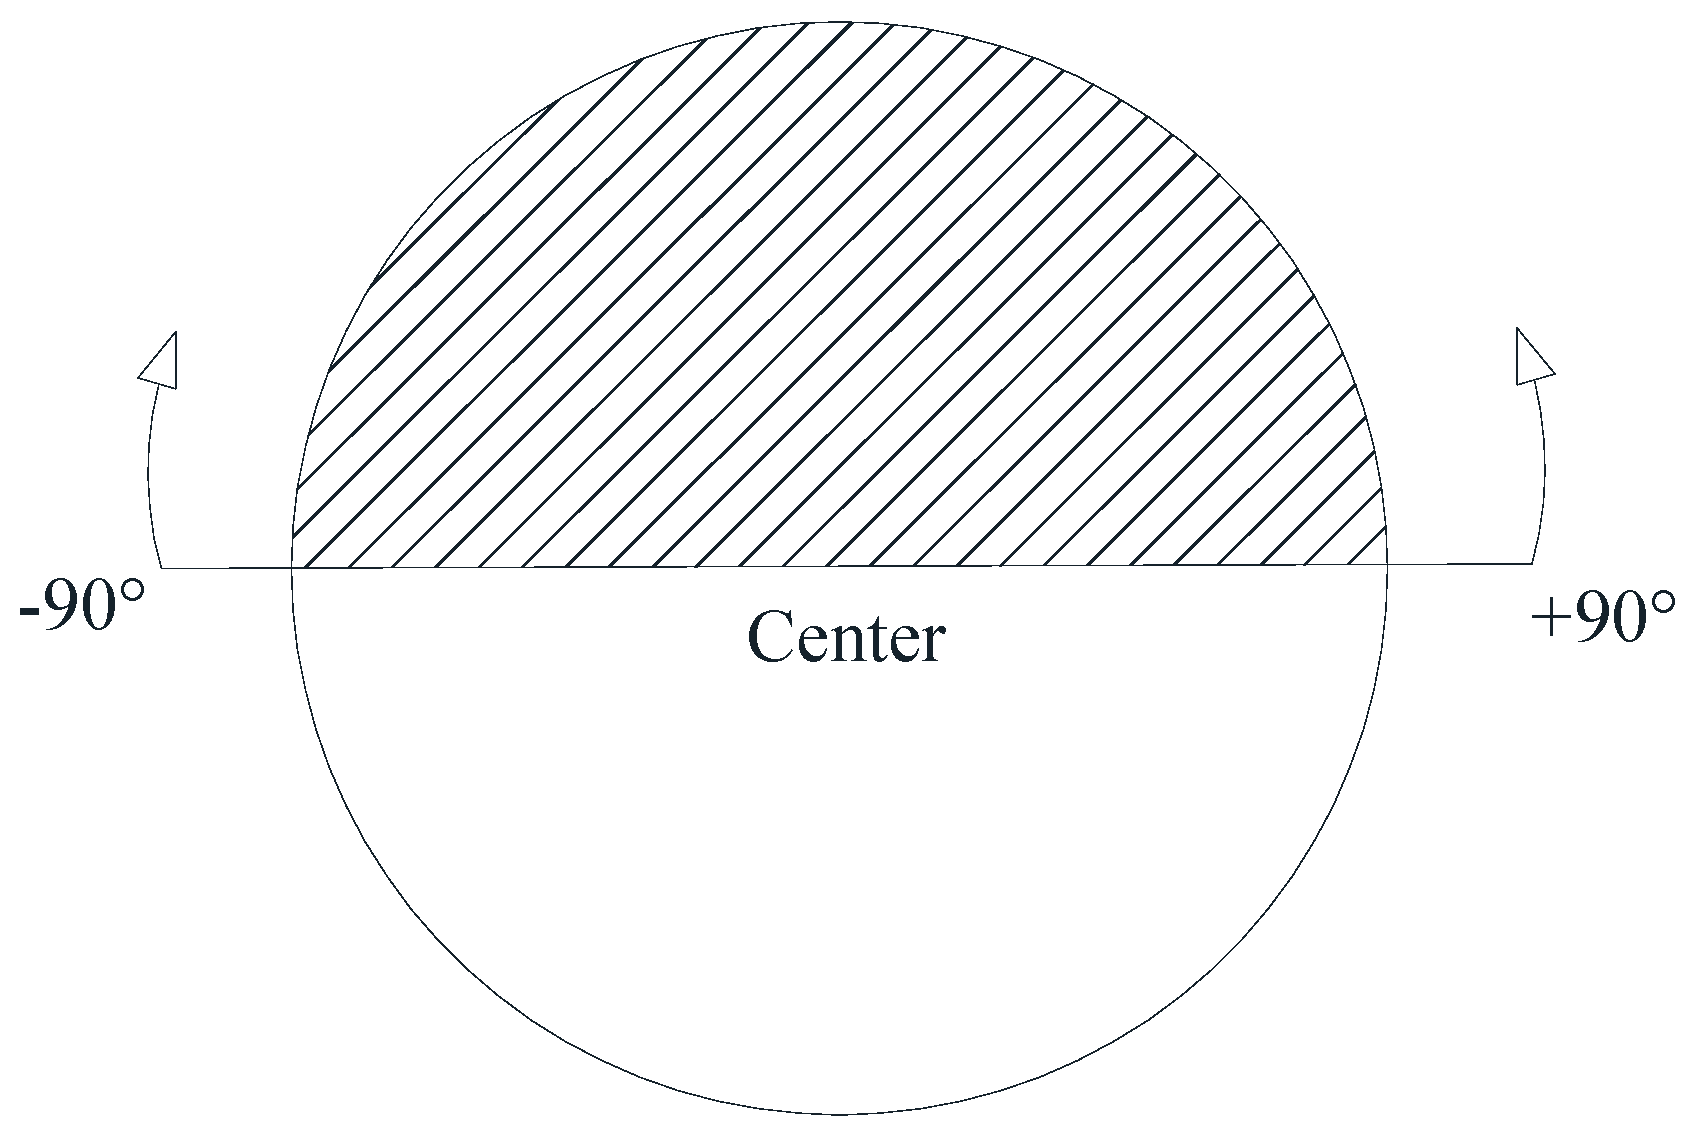
3.3.3. Detachment of the Glass Microspheres from Bubbles

The modified glass microspheres of −250 + 125 μm were selected to study the detachment of the glass microspheres from bubbles. The main reasons that glass microspheres detached from bubbles are listed as follows. First, the adhered glass microspheres were impacted by the next sliding particle and their adhesion would become unstable and detachment occur. Second, highly hydrophobic glass microspheres were hard to detach from bubbles once they adhered to the bubbles, however, they easily agglomerated and the gravity of the agglomerate would be increased for the excessive particles attached at the bubble bottom, which meant the force of detachment was increased to cause partially aggregate particles to fall off from bubbles. Third, the upward movement, rotation and deformation of rising bubbles all had negative effects on the stability between glass microspheres and bubbles, and induced detachment. These observed phenomena are consistent with the findings of previous studies [33,34,35,36], and an example is shown in Figure 12.
The particle marked with a red circle in Figure 12 collided with the bubble at 24.48 ms, then slid on the bubble surface for a while, before it slipped off the bubble surface at 38.56 ms. The contact time between the particle and the bubble lasted for 14.08 ms, which is shorter than the induction time between this glass microsphere and bubble.

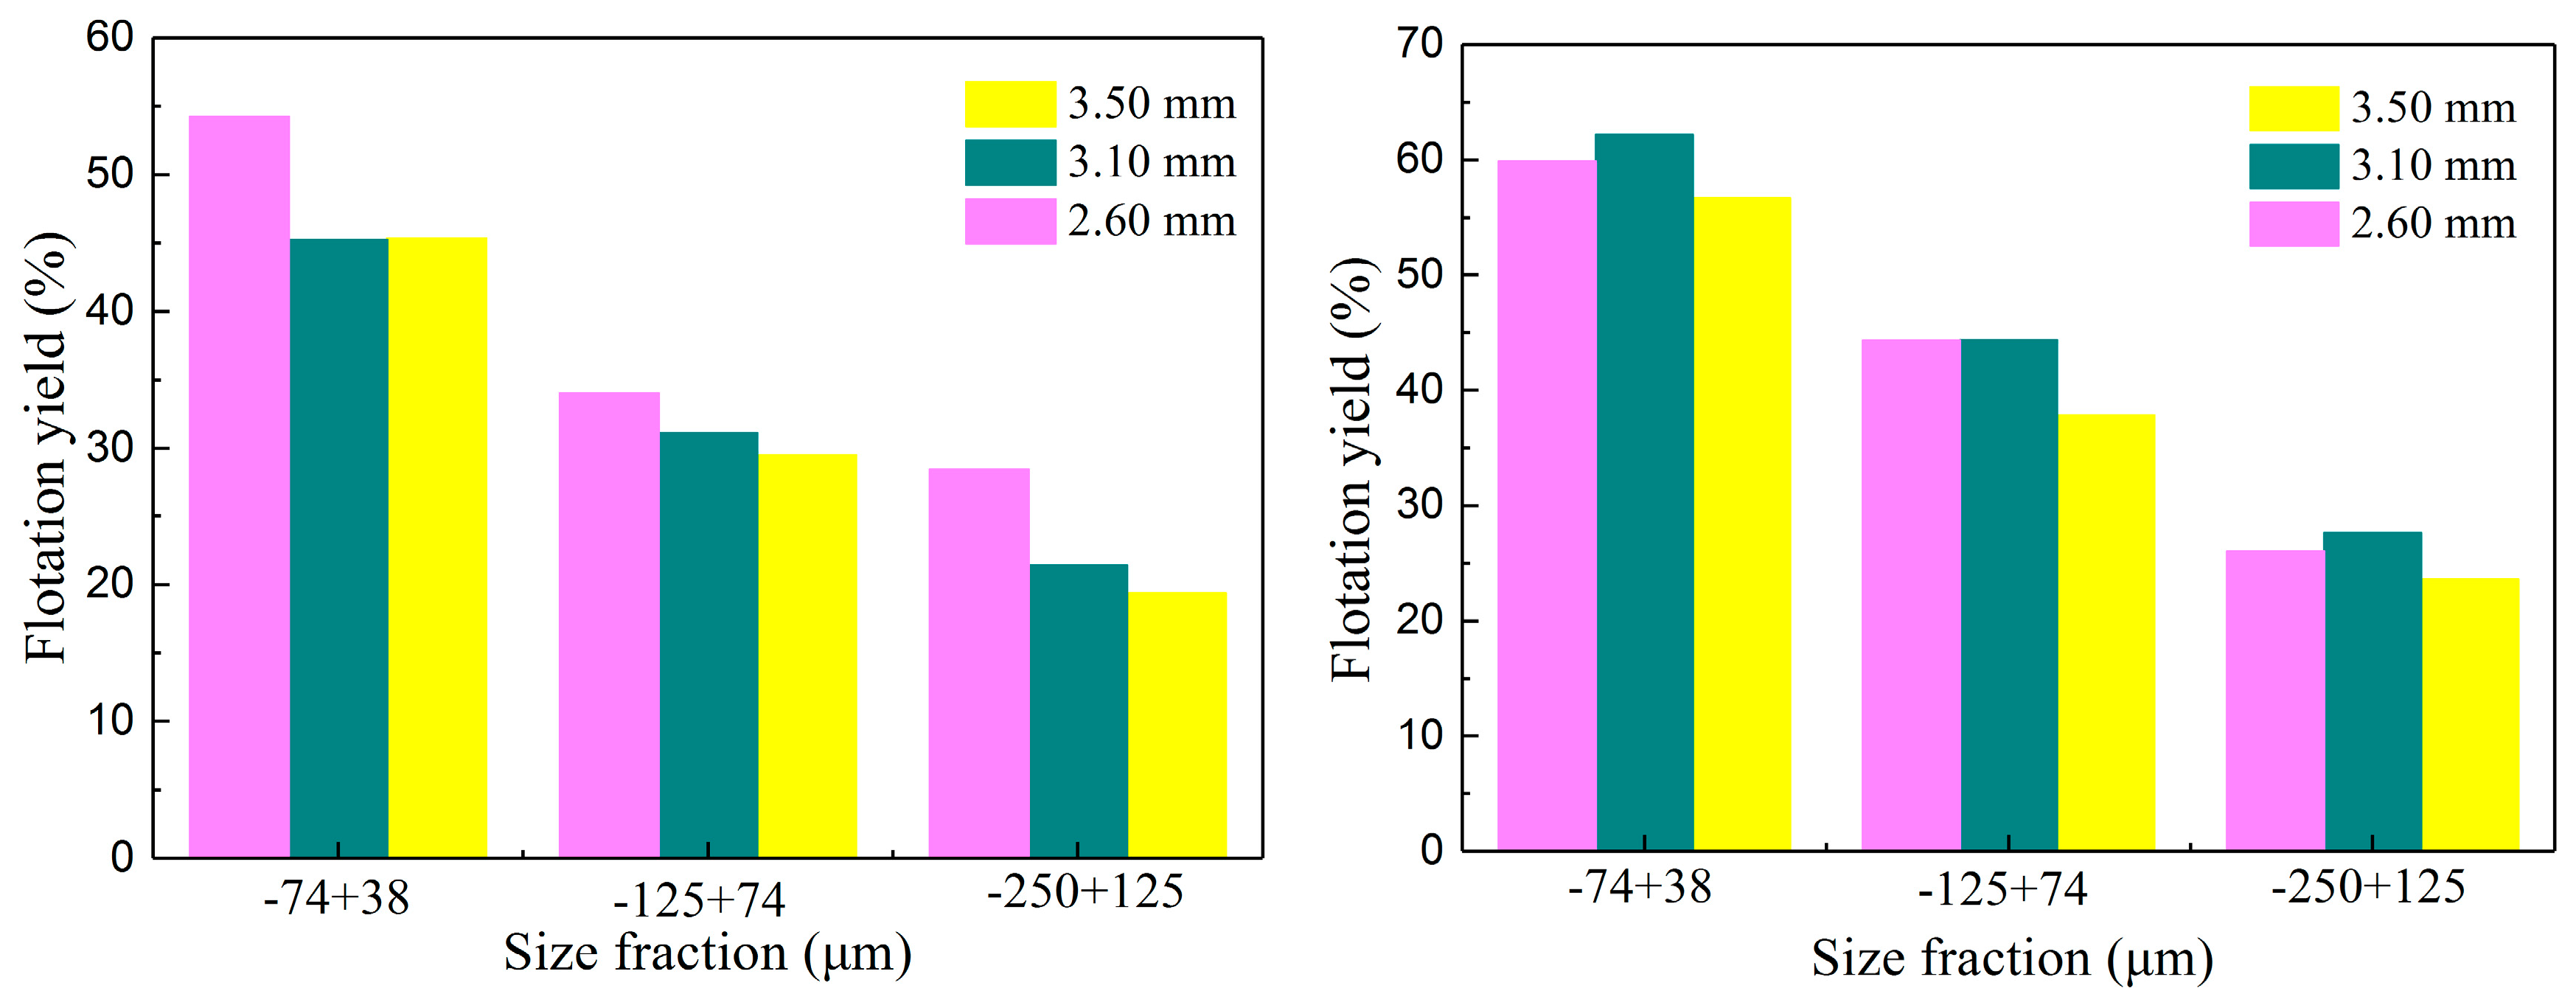
3.3.4. The Effects of Bubble and Glass Microsphere Sizes on Flotation Recovery

The effect of bubble and modified microsphere sizes on the flotation recovery is shown in Figure 13. The bubble diameter obtained with 18#, 20# and 23# needle was 3.50 mm, 3.10 mm and 2.60 mm, respectively. The results show that the flotation recovery mainly decreases with the increasing bubble and glass microsphere sizes, regardless of whether the pump speed was 400 mL/h or 1000 mL/h. It should be noted that the flotation recovery corresponding to the 3.50 mm bubbles is the lowest, especially for the −250 + 125 μm glass microsphere. When the pump speed was 400 mL/h and the glass microsphere size was −250 + 125 μm, the flotation recovery corresponding to 3.50 mm bubbles was 19.35%, while the flotation recovery corresponding to 3.10 mm bubbles and 2.60 mm bubbles was 21.38%and 28.48%, respectively. For the −74 + 38 μm particle size fraction, the flotation recovery corresponding to 3.50 mm, 3.10 mm and 2.60mm bubbles was 45.34%, 45.25% and 54.23%, respectively. A similar trend was observed when the pump speed was 1000 mL/h.
The observed effect of bubble and modified microsphere sizes on the flotation recovery discussed above can be attributed to changes in the film drainage rate. A film formed between small bubbles and small modified glass microspheres always has faster drainage kinetics compared to that formed between large bubbles and large modified glass microspheres due to the high Laplace pressure [37]. Based on the Navier–Stokes equation for film drainage between a bubble and a spherical particle under specific boundary conditions bubble size dependence on induction time becomes more evident for a large microsphere than for a small one [38]. Therefore, more time is needed for large bubbles and glass microspheres to attach to each other. The flotation recovery decreased with increasing sizes of bubbles and glass microspheres at the same flotation condition. Another interesting phenomenon that was observed during the whole experiment was that the smallest microspheres of -74+38 μm can be floated by the fluid behind bubbles even when they did not attach to bubbles. This was another reason why the -74+38 μm glass microspheres could get quite a high flotation recovery, which illustrated the recovery rate and low grade of fine particles in practical flotation.
When the pump speed was 1000 mL/h, there was little change in the rising speed of different size bubbles, but the number of bubbles was increased compared to the number of bubbles obtained with a pump speed of 400 mL/h, which meant that the collision probability at 1000 mL/h was greater than that at 400 mL/h. As a result, the flotation recovery of all three size fractions of the modified glass microspheres were higher at 1000 mL/h than at 400 mL/h, which affected the bubble feeding rate, even though the total air amount was kept constant for each test. The flotation recovery of 3.20 mm bubbles was higher than the flotation recovery of 2.60 mm bubbles, maybe because of the higher collision probability of bigger bubbles.

4. Conclusions

Modified glass microspheres were used in the study of bubble mineralization, and the main findings presented in this paper are listed as follows:
1. The amount of -OH present on the glass microsphere surface clearly decreased after surface modification with TMCS, which proved that modification was achieved by the reaction between the -Si-OH functional group of glass microspheres and the -Si-Cl functional group of TMCS; flotation test results further verified the success of surface modification.
2. As the amount of TMCS used during the surface modification step increased, the contact angle of the glass microspheres also increased, which meant the hydrophobicity was enhanced. To obtain the same contact angle, the amount of TMCS consumed by glass microspheres increased as the glass microsphere size decreased. This was observed for all glass microsphere size fractions.
3. The upper half of a rising bubble (between the −90° to +90°) was found to be the main area where bubble-microsphere collisions occurred. Many factors can affect the stability of the adhesion of the glass microspheres to the bubble surface: Fine microspheres could easily attach on the surface of bubbles and float with bubbles after collision; the buoyancy movement, rotation, and deformation of bubbles had a negative effect on the stability of adhesion of glass microspheres to bubbles and caused detachment. The properties of the glass microspheres, such as poor hydrophobicity and large particle size, are also important factors that can result in detachment.
4. Small bubbles and glass microspheres can provide high flotation recovery due to the thin wetting film, high stable attachment, and low detachment probability.

Author Contributions

Y.C., X.Y. and F.Z. designed the experiments; F.Z. performed the experiments, analyzed the data and wrote the drafts of the paper; Y.X. helped in the accomplish of the experiments, L.W. helped in the preparation of the paper and in checking the drafts of the paper.

Acknowledgments

This work was supported by National Nature Science Foundation of China (Grant Number 51574240) and National Nature Science Foundation of China (Grant Number U1704252).

Conflicts of Interest

The authors declare no conflict of interest.

References

  1. Fan, X.; Liu, K.; Tan, C.; Zhang, J. Research on Mineralization Mechanism of Flotation Bubble. Express Inf. Min. Ind. 2005, 21, 12–14. [Google Scholar]
  2. Mao, L.; Zhang, H. Progress in the research on foreign flotation theory. Nonferrous Min. Metall. 1989, 10–13. [Google Scholar]
  3. Mahnke, J.; Schulze, H.J.; Stöckelhuber, K.W.; Radoev, B. Rupture of thin wetting films on hydrophobic surfaces Part I: Methylated glass surfaces. Colloids Surf. 1999, 157, 1–9. [Google Scholar] [CrossRef]
  4. Wang, W.; Zhou, Z.; Nandakumar, K.; Xu, Z.; Masliyah, J.H. Attachment of individual particles to a stationary air bubble in model systems. Int. J. Miner. Process. 2003, 68, 47–69. [Google Scholar] [CrossRef]
  5. Wang, W.; Zhou, Z.; Nandakumar, K.; Xu, Z.; Masliyah, J.H. Effect of surface mobility on the particle sliding along a bubble or a solid sphere. J. Colloid Interface Sci. 2003, 259, 81–88. [Google Scholar] [CrossRef]
  6. Nguyen, A.V.; Evans, G.M. Movement of fine particles on an air bubble surface studied using high-speed video microscopy. J. Colloid Interface Sci. 2004, 273, 271–277. [Google Scholar] [CrossRef] [PubMed]
  7. Nguyen, A.V.; Evans, G.M. Attachment interaction between air bubbles and particles in froth flotation. Exp. Therm. Fluid Sci. 2004, 28, 381–385. [Google Scholar] [CrossRef]
  8. Nguyen, A.V.; Evans, G.M.; Nalaskowski, J.; Miller, J.D. Hydrodynamic interaction between an air bubble and a particle: Atomic force microscopy measurements. Exp. Therm. Fluid Sci. 2004, 28, 387–394. [Google Scholar] [CrossRef]
  9. Zachery, I.E. Particle and Bubble Interaction in Flotation Systems. Ph.D. Thesis, Auburn University, Auburn, AL, USA, May 2007. [Google Scholar]
  10. Verrelli, D.I.; Koh PT, L.; Nguyen, A.V. Particle–bubble interaction and attachment in flotation. Chem. Eng. Sci. 2011, 66, 5910–5921. [Google Scholar] [CrossRef]
  11. Koh, P.T.; Hao, F.P.; Smith, L.K.; Chau, T.T.; Bruckard, W.J. The effect of particle shape and hydrophobicity in flotation. Int. J. Miner. Process. 2009, 93, 128–134. [Google Scholar] [CrossRef]
  12. Koh PT, L.; Smith, L.K. The effect of stirring speed and induction time on flotation. Miner. Eng. 2011, 24, 442–448. [Google Scholar]
  13. Qin, W.Q.; Wang, P.P.; Ren, L.Y.; Wei, Q.; Peng, Z.B.; Gu, Y.L. Effect of matching relationship between particles and bubbles on the flotation of fine cassiterite. J. China Univ. Min. Technol. 2012, 41, 420–424. [Google Scholar]
  14. Ren, L. Interaction between Fine Cassiterite Particles and Bubbles and Its Effects on Flotation. Ph.D. Thesis, Central South University, Changsha, China, May 2012. [Google Scholar]
  15. Meng, X. Study on Effect of Surfactants on Interactions between Ultrafine Diaspore Particles and Bubbles. Master’s Thesis, Central South University, Changsha, China, May 2011. [Google Scholar]
  16. Gui, X.; Xing, Y.; Rong, G.; Cao, Y.; Liu, J. Interaction forces between coal and kaolinite particles measured by atomic force microscopy. Powder Technol. 2016, 301, 349–355. [Google Scholar] [CrossRef]
  17. Cui, X.; Shi, C.; Zhang, S.; Xie, L.; Liu, J.; Jiang, D.; Zeng, H. Probing effect of salinity and pH on surface interactions between air bubbles and hydrophobic solids: Implications on colloidal assembly at air/water interface. Chemistry 2017, 12, 1568–1577. [Google Scholar] [CrossRef] [PubMed]
  18. Ali, V.; Jocelyn, B.; Yun, C. Effect of particles on bubble size distribution and gas hold-up in column flotation. Int. J. Miner. Process. 2016, 157, 163–173. [Google Scholar]
  19. Brozek, M.; Mlynarczykowska, A. Application of the stochastic model for analysis of flotation kinetics with coal as an example. Physicochem. Probl. Miner. Process. 2007, 41, 31–44. [Google Scholar]
  20. Watanabe, M.; Kowalczuk, P.B.; Drzymala, J. Analytical solution of equation relating maximum size of floating particle and its hydrophobicity. Physicochem. Probl. Min. Process. 2011, 46, 13–20. [Google Scholar]
  21. Kowalczuk, P.B.; Drzymala, J. Surface flotation of particles on liquids. Principles and applications. Colloids Surf. A Physicochem. Eng. Asp. 2012, 393, 81–85. [Google Scholar] [CrossRef]
  22. Shen, D.; Xiao, J.; Chen, X. Comparison of Height Method and Pressure Method for Measurement of Powder Contact Angle. Sulphur Phosphorus Bulk Mater. Handl. Relat. Eng. 2007, 1, 9–12. [Google Scholar]
  23. Zou, W.; Cao, Y.; Liu, J. Surface thermodynamic characterization of fine coal by Washburn dynamic method. J. China Coal Soc. 2013, 7, 1271–1276. [Google Scholar]
  24. Siebold, A.; Walliser, A.; Nardin, M.; Oppliger, M.; Schultz, J. Capillary rise for thermodynamic characterization of solid particle surface. J. Colloid Interface Sci. 1997, 186, 60–70. [Google Scholar] [CrossRef]
  25. Washburn, E.W. The dynamics of capillary flow. Phys. Rev. 1921, 17, 273–283. [Google Scholar] [CrossRef]
  26. Tristan, P.; Ljiljana, P. FTIR spectroscopy of nanodiamonds: Methods and interpretation. Diam. Relat. Mater. 2018, 89, 52–66. [Google Scholar]
  27. Prestidge, C.A.; Ralston, J. Contact angle studies of particulate sulphide minerals. Miner. Eng. 1996, 9, 85–102. [Google Scholar] [CrossRef]
  28. Fronzi, M.; Assadi, M.; Hanaor, D. Theoretical insights into the hydrophobicity of low index CeO2 surfaces. Appl. Surf. Sci. 2019, 478, 68–74. [Google Scholar] [CrossRef]
  29. Zhang, F.; Xu, Y.; Yan, X.; Cao, Y.; Liu, G. Research of bubbles mineralization based on high-speed dynamic microscopic Test. J. China Univ. Min. Technol. 2016, 45, 1–7. [Google Scholar]
  30. Dai, Z.; Fornasiero, D.; Ralston, J. Particle-bubble collision models—A review. Adv. Colloid Interface Sci. 2000, 85, 231–256. [Google Scholar] [CrossRef]
  31. Xing, Y.; Gui, X.; Pan, L.; Pinchasik, B.E.; Cao, Y.; Liu, J.; Kappl, M.; Butt, H.J. Recent experimental advances for understanding bubble-particle attachment in flotation. Adv. Colloid Interface Sci. 2017, 246, 105–132. [Google Scholar] [CrossRef]
  32. Nguyen, A.V.; Ralston, J.; Schulze, H.J. On modelling of bubble–particle attachment probability in flotation. Int. J. Miner. Process. 1998, 53, 225–249. [Google Scholar] [CrossRef]
  33. Goel, S.; Jameson, G.J. Detachment of particles from bubbles in an agitated vessel. Miner. Eng. 2012, 36–38, 324–330. [Google Scholar] [CrossRef]
  34. Taran, E.; Nguyen, A.V. Surface deformation during bubble-particle colloidal interaction quantified by atomic force microscopy and numerical modeling. In Proceedings of the International Symposium on Separation Technologies for Minerals, Coal, and Earth Resources, Part of the 2011 SME Annual Meeting, Denver, CO, USA, 27 February–2 March 2012; pp. 19–26. [Google Scholar]
  35. Wang, G.; Evans, G.M.; Jameson, G.J. Bubble–particle detachment in a turbulent vortex I: Experimental. Miner. Eng. 2016, 92, 196–207. [Google Scholar] [CrossRef]
  36. Wang, G.; Evans, G.M.; Jameson, G.J. Experiments on the detachment of particles from bubbles in a turbulent vortex. Powder Technol. 2016, 302, 196–206. [Google Scholar] [CrossRef]
  37. Xing, Y.; Gui, X.; Cao, Y. Effect of bubble size on bubble-particle attachment and film drainage kinetics—A theoretical study. Powder Technol. 2017, 322, 140–146. [Google Scholar] [CrossRef]
  38. Wang, W.; Zhou, Z.; Nandakumar, K.; Masliyah, J.H.; Xu, Z. An induction time model for the attachment of an air bubble to a hydrophobic sphere in aqueous solutions. Int. J. Miner. Process. 2005, 75, 69–82. [Google Scholar] [CrossRef]
Figure 1. Laser particle size analysis of glass microspheres.
Minerals 09 00350 g001
Figure 2. SEM micrographs of different glass microspheres.
Minerals 09 00350 g002
Figure 3. A schematic of the setup used for the surface modification of the glass microspheres.
Minerals 09 00350 g003
Figure 4. K100 Force Tensiometer (left) and diagram of liquid wetting powder (right).
Minerals 09 00350 g004
Figure 5. A schematic of the single rising bubble device.
Minerals 09 00350 g005
Figure 6. FTIR spectroscopy of before and after surface modification of glass microspheres.
Minerals 09 00350 g006
Figure 7. Flotation flow chart of glass microspheres (left) and flotation yield of the −125 + 74 μm modified glass microspheres (right).
Minerals 09 00350 g007
Figure 8. The contact angles of glass microspheres after modification (left: 0.2 μL/g TMCS; right: different amounts of TMCS for different size fractions).
Minerals 09 00350 g008
Figure 9. Collision between glass microspheres and bubbles.
Minerals 09 00350 g009
Figure 10. The area on a bubble that easily collides with glass microspheres.
Minerals 09 00350 g010
Figure 11. Adhesion between glass microspheres and bubbles.
Minerals 09 00350 g011
Figure 12. Detachment of glass microspheres from bubbles.
Minerals 09 00350 g012
Figure 13. Flotation recovery of different bubble and glass microsphere sizes in 50 mg/L MIBC and 40 mg/L DDA solution; left: The pump speed was 400 mL/h, right: The pump speed was 1000 mL/h.
Minerals 09 00350 g013
Table 1. Chemical composition of glass microspheres.
ContentSiO2Na2OCaOMgOAl2O3K2OFe2O3SO3TiO2
%71.86 13.768.433.911.180.480.220.10.03
Table 2. Surface area of glass microspheres.
Size Fraction, μmSpecific Surface Area, m2/g
−250 + 1250.0699
−125 + 740.1093
−74 + 380.1890

