Article

Ore Genesis of the Chuduoqu Pb-Zn-Cu Deposit in the Tuotuohe Area, Central Tibet: Evidence from Fluid Inclusions and C–H–O–S–Pb Isotopes Systematics

1
College of Earth Sciences, Jilin University, Changchun 130061, China
2
Jilin Institute of Geological Survey, Changchun 130061, China
3
Qinghai Fifth Institute of Geological and Mineral Survey, Xining 810003, China
*
Author to whom correspondence should be addressed.
Minerals 2019, 9(5), 285; https://doi.org/10.3390/min9050285
Submission received: 11 April 2019 / Revised: 3 May 2019 / Accepted: 8 May 2019 / Published: 10 May 2019
(This article belongs to the Section Mineral Deposits)

Abstract

:
The Chuduoqu Pb-Zn-Cu deposit is located in the Tuotuohe area in the northern part of the Sanjiang Metallogenic Belt, central Tibet. The Pb-Zn-Cu ore bodies in this deposit are hosted mainly by Middle Jurassic Xiali Formation limestone and sandstone, and are structurally controlled by a series of NWW trending faults. In this paper, we present the results of fluid inclusions and isotope (C, H, O, S, and Pb) investigations of the Chuduoqu deposit. Four stages of hydrothermal ore mineralization are identified: quartz–specularite (stage I), quartz–barite–chalcopyrite (stage II), quartz–polymetallic sulfide (stage III), and quartz–carbonate (stage IV). Two types of fluid inclusions are identified in the Chuduoqu Pb-Zn-Cu deposit: liquid-rich and vapor-rich. The homogenization temperatures of fluid inclusions for stages I–IV are 318–370 °C, 250–308 °C, 230–294 °C, and 144–233 °C, respectively. Fluid salinities range from 2.07 wt. % to 11.81 wt. % NaCl equivalent. The microthermometric data indicate that the fluid mixing and cooling are two important mechanisms for ore precipitation. The H and O isotopic compositions of quartz indicate a primarily magmatic origin for the ore-forming fluids, with the proportion of meteoric water increasing over time. The C and O isotopic compositions of carbonate samples indicate that a large amount of magmatic water was still involved in the final stage of mineralization. The S and Pb isotopic compositions of sulfides, demonstrate that the ore minerals have a magmatic source. On a regional basis, the most likely source of the metallogenic material was regional potassium-enriched magmatic hydrothermal fluid. Specifically for the Chuduoqu Pb-Zn-Cu deposit, the magmatic activity of a syenite porphyry was the likely heat source, and this porphyry also provided the main metallogenic material for the deposit. Mineralization took place between 40 and 24 Ma. The Chuduoqu deposit is a mesothermal hydrothermal vein deposit and was formed in an extensional environment related to the late stage of intracontinental orogenesis resulting from India–Asia collision. The determination of the deposit type and genesis of Chuduoqu is important because it will inform and guide further exploration for hydrothermal-type Pb and Zn deposits in the Tuotuohe area and in the wider Sanjiang Metallogenic Belt.

1. Introduction

From north to south, the Tibetan Plateau comprises the Songpan–Ganze flysch complex, the eastern Qiangtang Terrane, the western Qiangtang Terrane, the Lhasa Terrane, and the Himalaya (Figure 1a, [1]) separated by the Jinsha, Longmu Tso–Shuanghu, Bangong–Nujiang, and Indus–Yarlung Zangbo suture zones, respectively. These blocks and terranes represent relicts of Tethyan oceanic material of various ages. The Sanjiang Metallogenic Belt is located between the Jinshajiang and Bangonghu–Nujiang sutures along the eastern and northern margins of the Tibetan Plateau and extends for nearly 1500 km [2]. This belt is an important Pb-Zn-producing region within the Himalayan–Tibetan metallogenic domain. The Sanjiang Metallogenic Belt evolved as part of a Paleozoic–Mesozoic Tethys archipelagic arc basin over which was sequentially superimposed a Tertiary foreland basin, a strike–slip pull-apart basin, and a thrust-nappe structure that formed during Himalayan orogenesis [3].
The conditions of metallogenesis in the Sanjiang Metallogenic Belt were favorable for the formation of large-scale deposits [6,7]. A series of Pb-Zn deposits developed during the Cenozoic, mainly along the margins of Mesozoic–Cenozoic continental basins. The main deposits are distributed from southeast to northwest and include the Jinding and Baiyangping super-large Pb-Zn deposits in the Lanping basin [8,9], the Zhaofayong Pb-Zn deposit in the Changdu Basin [10], and the Dongmozhazhua and Mohailaheng Pb-Zn deposits in the Yushu basin (Figure 1a) [11,12]. The Tuotuohe area, located in the northern part of the Sanjiang Metallogenic Belt, hosts several medium- to low-temperature hydrothermal-vein-type, porphyry-type, MVT and VMS-type deposits [13,14,15]. Many Pb-Zn deposits and other sites of mineralization have been discovered in the Tuotuohe area, including the Chaqupacha super-large Pb-Zn deposit, the Chuduoqu large Pb-Zn-Cu deposit, and the Basihu medium-sized Pb-Zn deposit, as well as the Nariniya, Nabaozhalong, and Zhalaxiageyong Pb-Zn deposits (Figure 2).
Exploration of the Chuduoqu Pb-Zn-Cu deposit started in 2007. From 2007 to 2011, the Qinghai Fifth Institute of Geological and Mineral Survey carried out work in the northern part of the deposit, where geochemical data indicate favorable conditions for mineralization, and a set of ~N–S-oriented ore-bearing zones was discovered. These zones show good surface and shallow-subsurface mineralization, weak deep mineralization, and generally unsatisfactory indications for ore-prospecting. In 2011, fracture zone SBIII was discovered, which is the major ore-controlling structural zone formed by the NWW-oriented fault, indicating that ore-prospecting be undertaken on this fracture zone. The Pb-Zn-rich ore body M9 in fracture zone SBIII was the first such body to be discovered in the hanging wall of the main fault, followed by Cu-Ag ore body M10 and Pb-Ag ore body M11 (Figure 3a) [15]. The Chuduoqu Pb-Zn deposit has estimated metal reserves of 402,547 t Pb, 112,672 t Zn, 9197 t Cu, and 593 t Ag [15].
Various studies have reported the geological features, mineralization, fluid inclusions, ore-controlling structures, and results of exploration of the Chuduoqu deposit [13,15]. Most of these studies have shown that this deposit formed in relation to Cenozoic magmatic hydrothermal activity. The deposit is a mesothermal hydrothermal type that is most likely associated with the intrusion of Cenozoic syenite porphyry dykes. However, the detailed characteristics and mechanisms of the mineralization of the Chuduoqu deposit are poorly constrained, especially when compared with the detailed information available for other Cenozoic Pb-Zn deposits in the Tuotuohe area.
The origin, properties, and evolution of the ore-forming fluids, as well as the genesis of the Chuduoqu deposit, are still not fully understood, which limits our overall understanding of the genesis of hydrothermal vein-type Pb-Zn mineralization in the region. Using field observations and petrographic studies, we investigated the ore-controlling structures, the composition and characteristics of fluid inclusions, and the stable (C–H–O–S) and radiogenic (Pb) isotope systematics of the Chuduoqu Pb-Zn-Cu deposit. In this paper, we report the results of our study, discuss the characteristics of the mineralizing fluids and metal sources as well as the mechanisms of mineralization, and constrain the genesis of the deposit. In doing so, we provide an important basis for understanding the Chuduoqu Pb-Zn-Cu deposit and similar deposits in the Tuotuohe area. Our findings should prove valuable for prospecting in the Tuotuohe area and in the Sanjiang Metallogenic Belt.

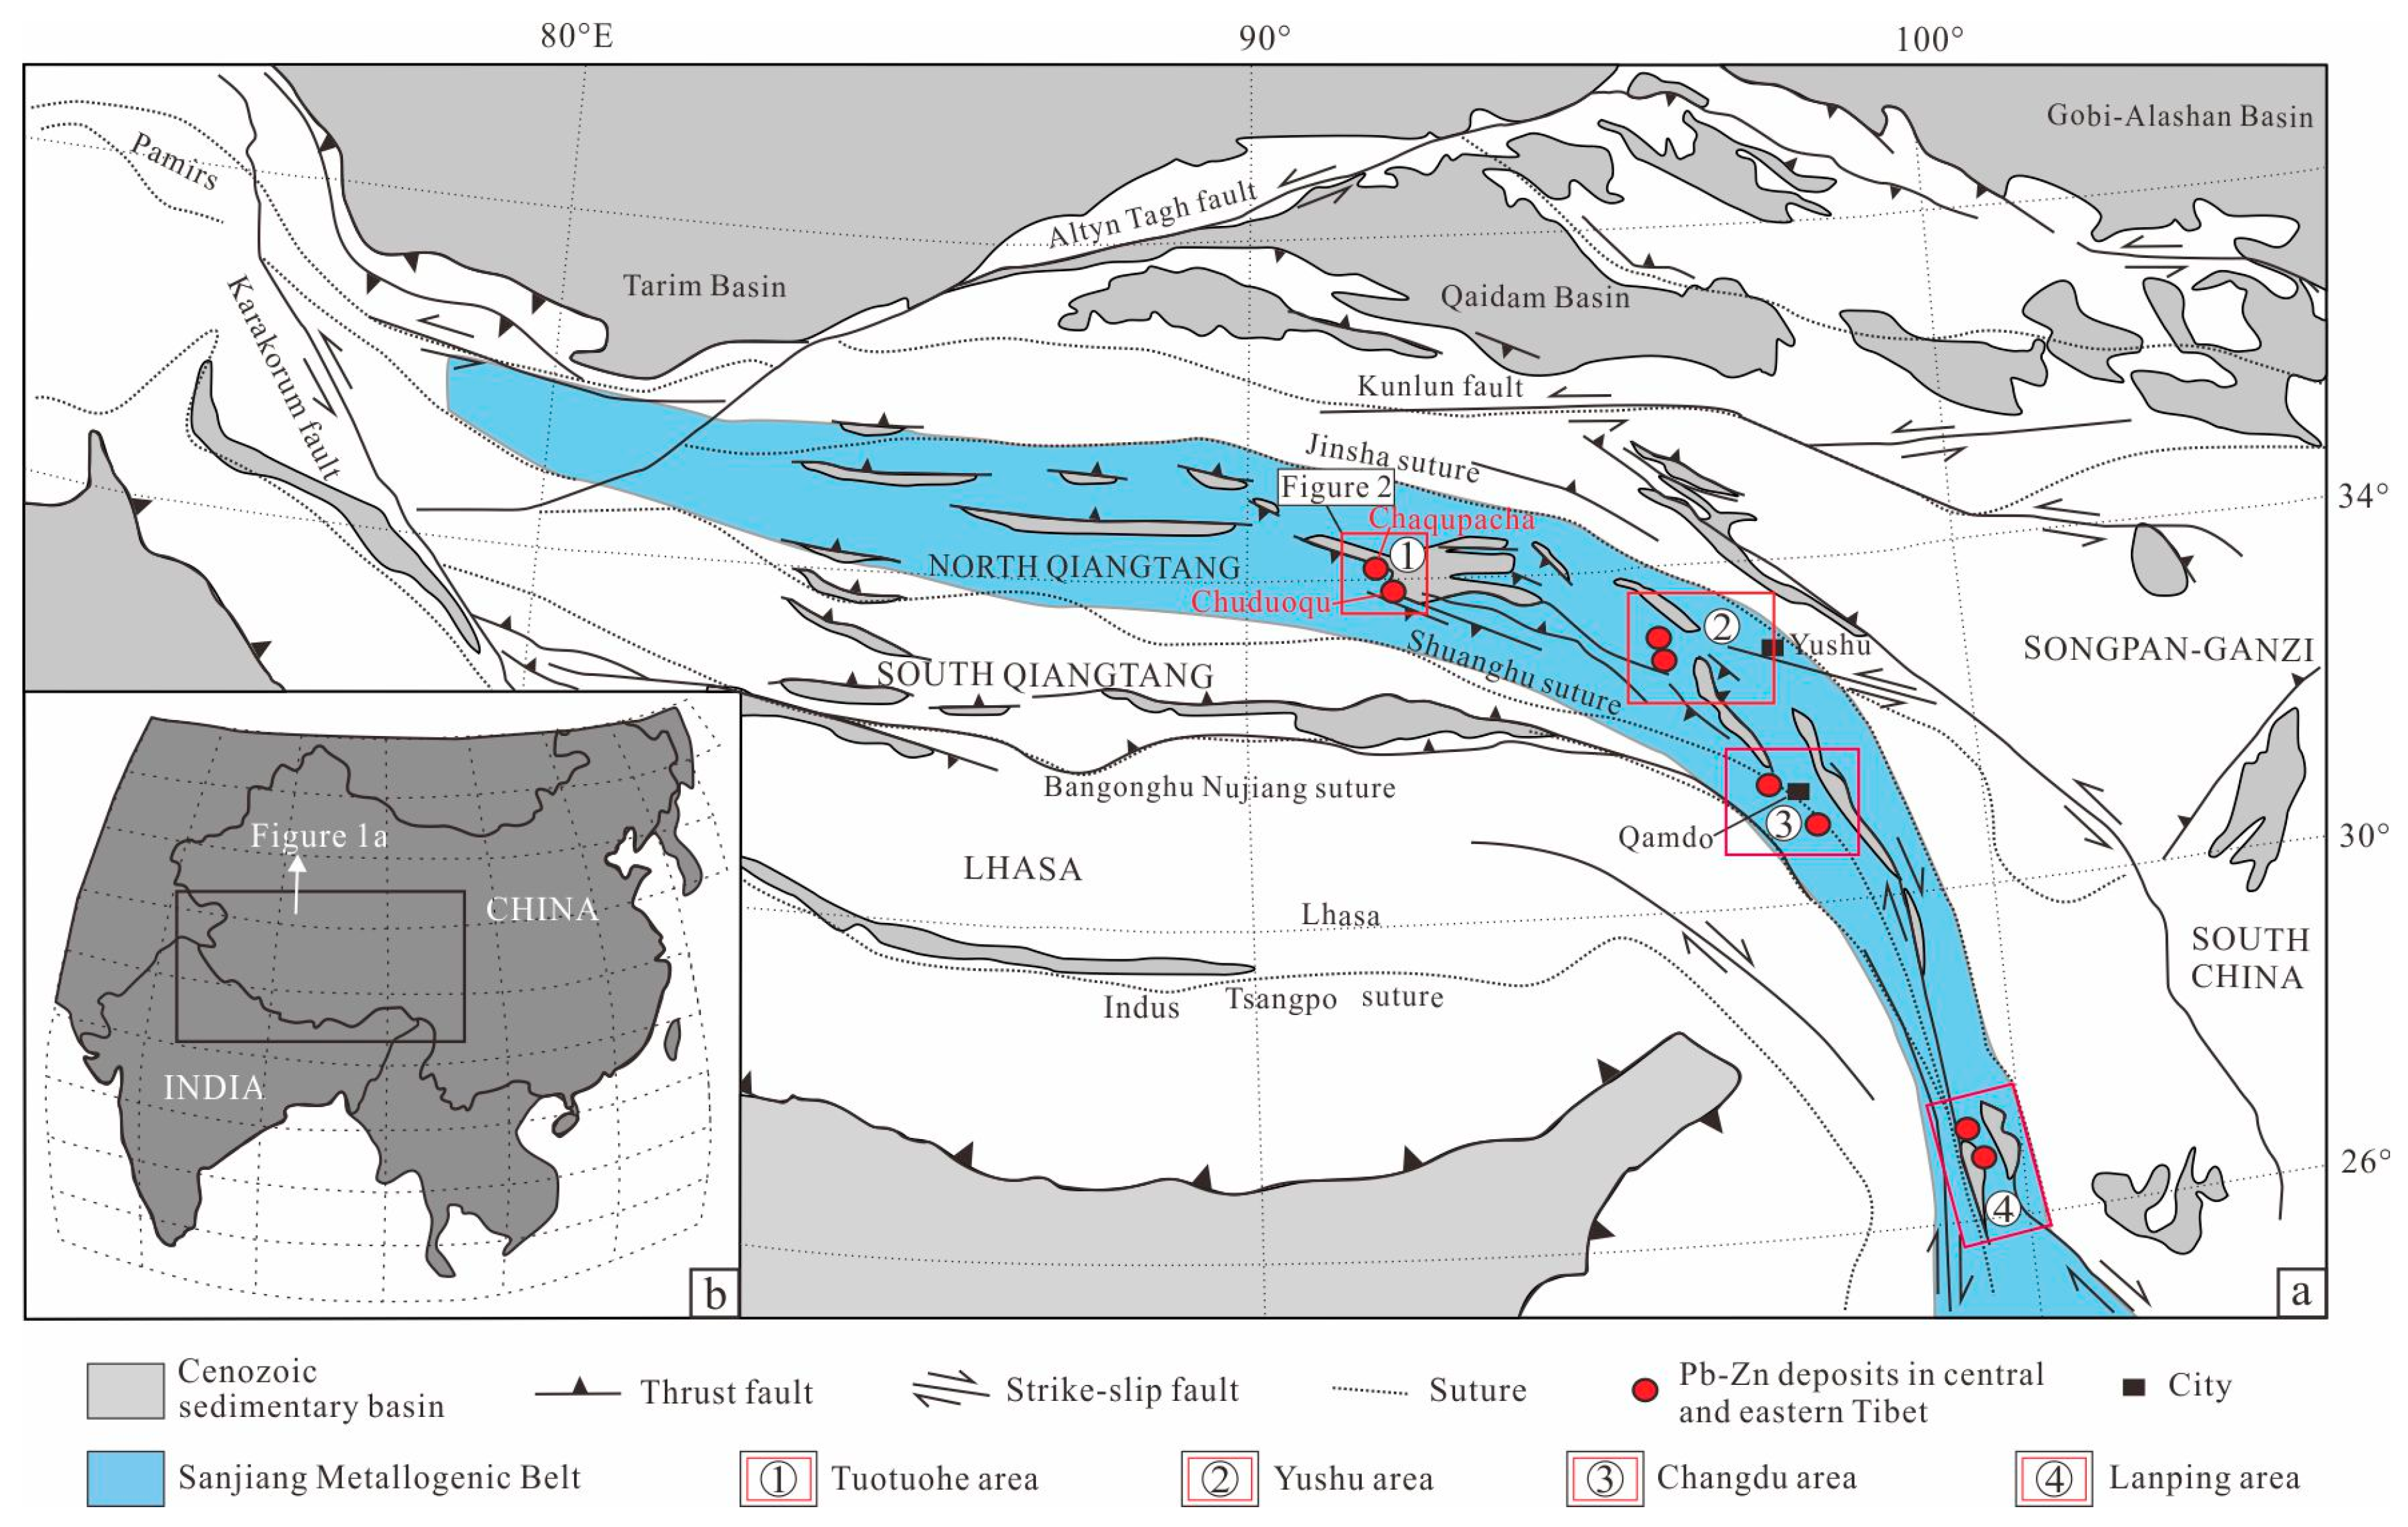
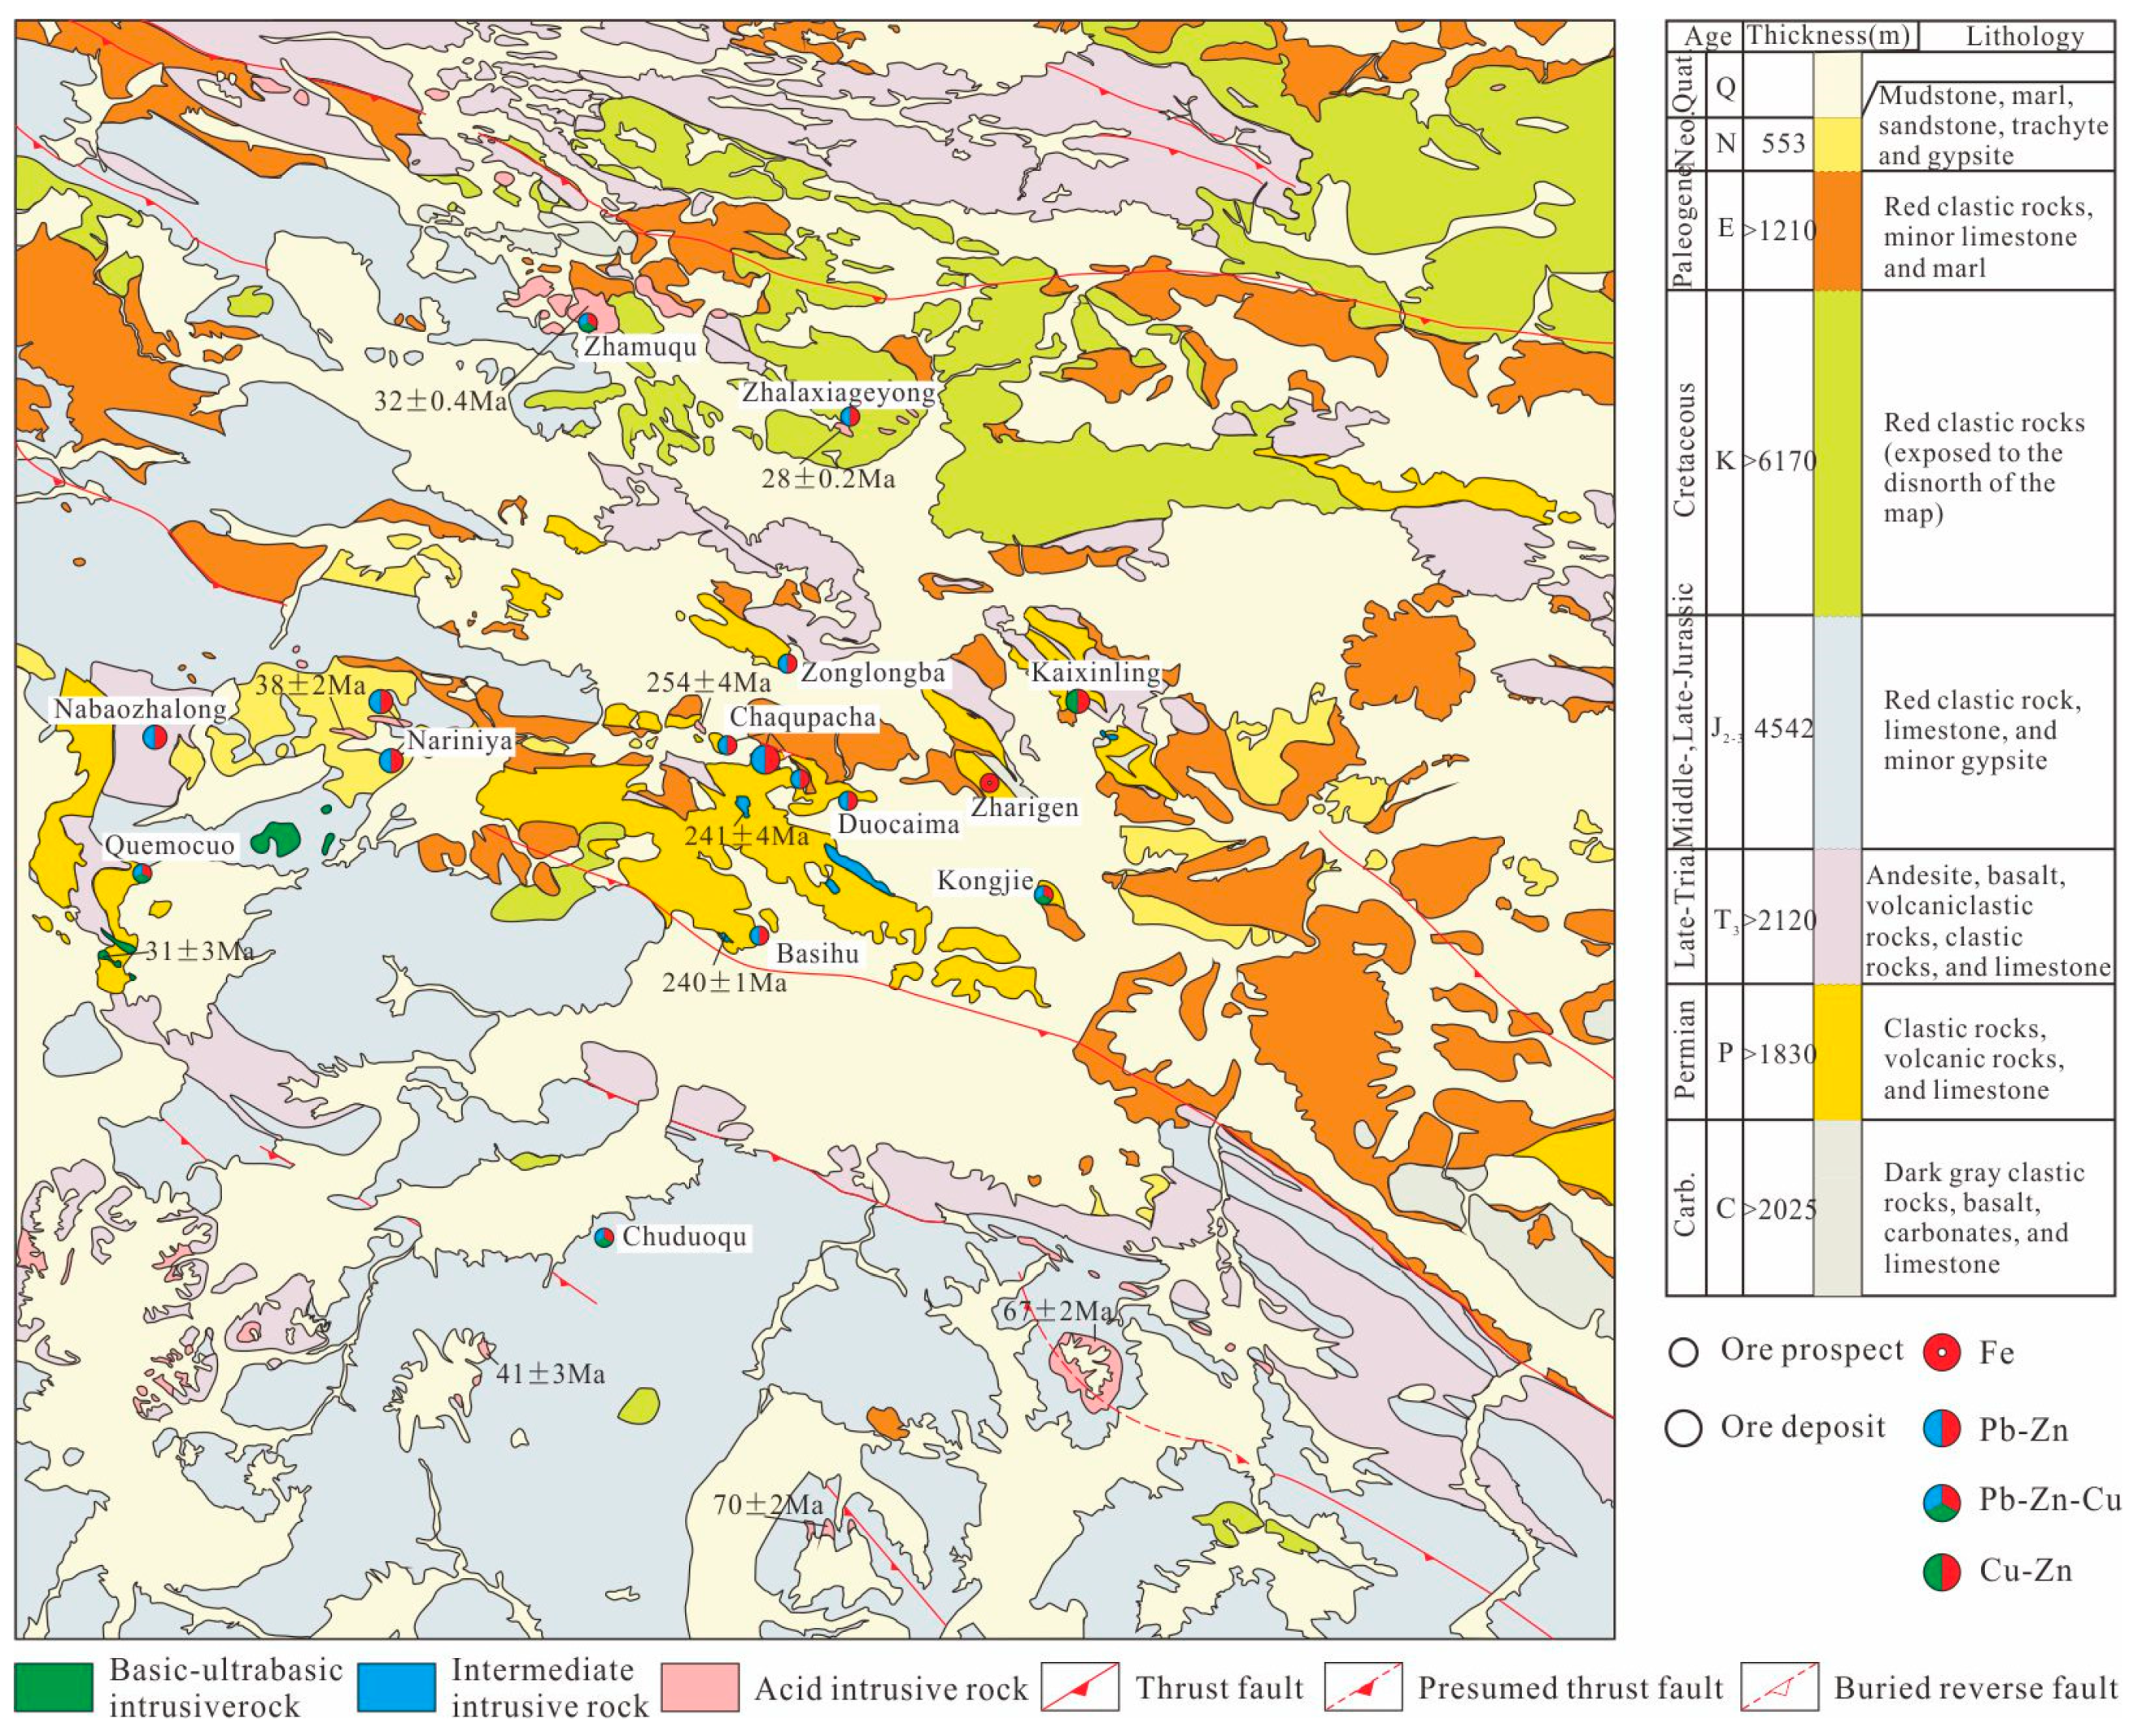
2. Geological Background

The Chuduoqu Pb-Zn-Cu deposit is located in the Tuotuohe area in the northern part of the Sanjiang Metallogenic Belt, central Tibet (Figure 1, [17]). The Tuotuohe area is positioned on the margin of the northern Qiangtang Terrane between the Jinsha River suture zone and the Longmucuo Shuanghu suture zone [6,15,16]. The oldest rocks in the Tuotuohe area are Carboniferous clastic and carbonate sediments that are thought to have formed in a passive continental margin setting (Figure 2, [18]); the Permian to Triassic units consist mainly of marine carbonate, clastic, and volcanic rocks. Recent studies of Permian magmatic rocks in the Yushu area have suggested that these units were deposited in a continental-margin-arc setting associated with northward subduction of the Shuanghu oceanic plate between ca. 275 and 248 Ma [19]. Lower and Middle Triassic rocks are absent from the area, meaning that the Upper Triassic rocks unconformably overlie the underlying units. During the Late Triassic, the Tuotuohe area was in a subduction setting involving the southward subduction of the Jinsha oceanic plate [20].
Lower Jurassic rocks are absent from the study area (Figure 2, [16,21]; Middle to Upper Jurassic units in the area consist of clastic and carbonate rocks of (from bottom to top) the Qumocuo, Buqu, Xiali, Suowa, and Xueshan Formations [22]. During the Cretaceous, the Tuotuohe area entered a continental sedimentary stage, when thick successions of clastic deposits were laid down. The Cenozoic units comprise terrigenous clastic and carbonate rocks of the Eocene Tuotuohe Formation, the Eocene–Oligocene Yaxicuo Formation, and the Miocene Wudaoliang Formation [18,23,24], which are exposed mainly in the northern part of the Tuotuohe area (Figure 2).
The Tuotuohe area contains a large-scale thrustnappe structure and strike-slip system as a result of India–Eurasia collisional orogenesis during the Cenozoic [2,9]. The thrustnappe structural belt comprises a series of NWW-trending thrust faults and folds, most of which dip to the southwest [25]. The large-scale thrustnappe in the Tuotuohe area underwent two main episodes of thrusting, one at around 52–42 Ma and the other at around 24 Ma [25]. Between these two episodes, strike-slip activity developed with the formation of a series of strike-slip fault systems [26].
Magmatic activity in the Tuotuohe area started during the late Paleozoic and ended during the Cenozoic. The magmatism was characterized by relatively weak intrusive and strong volcanic activity. Volcanic rocks are widespread at a regional scale. These volcanic rocks comprise Permian basaltic andesite interlayered with basalt; Late Triassic andesite, basalt, and pyroclastic rocks; and Cenozoic trachyte. The Cenozoic volcanic rocks are distributed mostly around the locality of Nariniya and dated at 45–22 Ma [27,28,29].
Magmatic intrusions are widely dispersed, with numerous igneous rock outcrops, but the total area covered by these rocks is quite small. Magmatic rocks include those formed during the Indosinian, Yanshanian, and Himalayan periods. Late Permian–early Triassic syenites and diorite bodies are found in the Chaqupacha deposit [30], and Middle Triassic diorite is present in the Basihu mine [31]. Late Cretaceous granites occur in the Longyala and Munai areas of the Tanggula mountains [32]. Paleogene olivine gabbro–diabase has been discovered in the Quemocuo mining area (Figure 2, [33]), and Cenozoic porphyry bodies have been discovered in the Zhamuqu, Nariniya, Zhalaxiageyong, and Saiduopugangri areas [13,32,34]. The Cenozoic volcanic rocks and granites mentioned above consist predominantly of shoshonitic to high-K calc-alkaline rocks and were formed in a geodynamic setting of crustal shortening, thickening and melting [27,28,29,32,35]. Their occurrence and ages are supporting evidence for Cenozoic crustal shortening and uplift of the plateau in the study area.

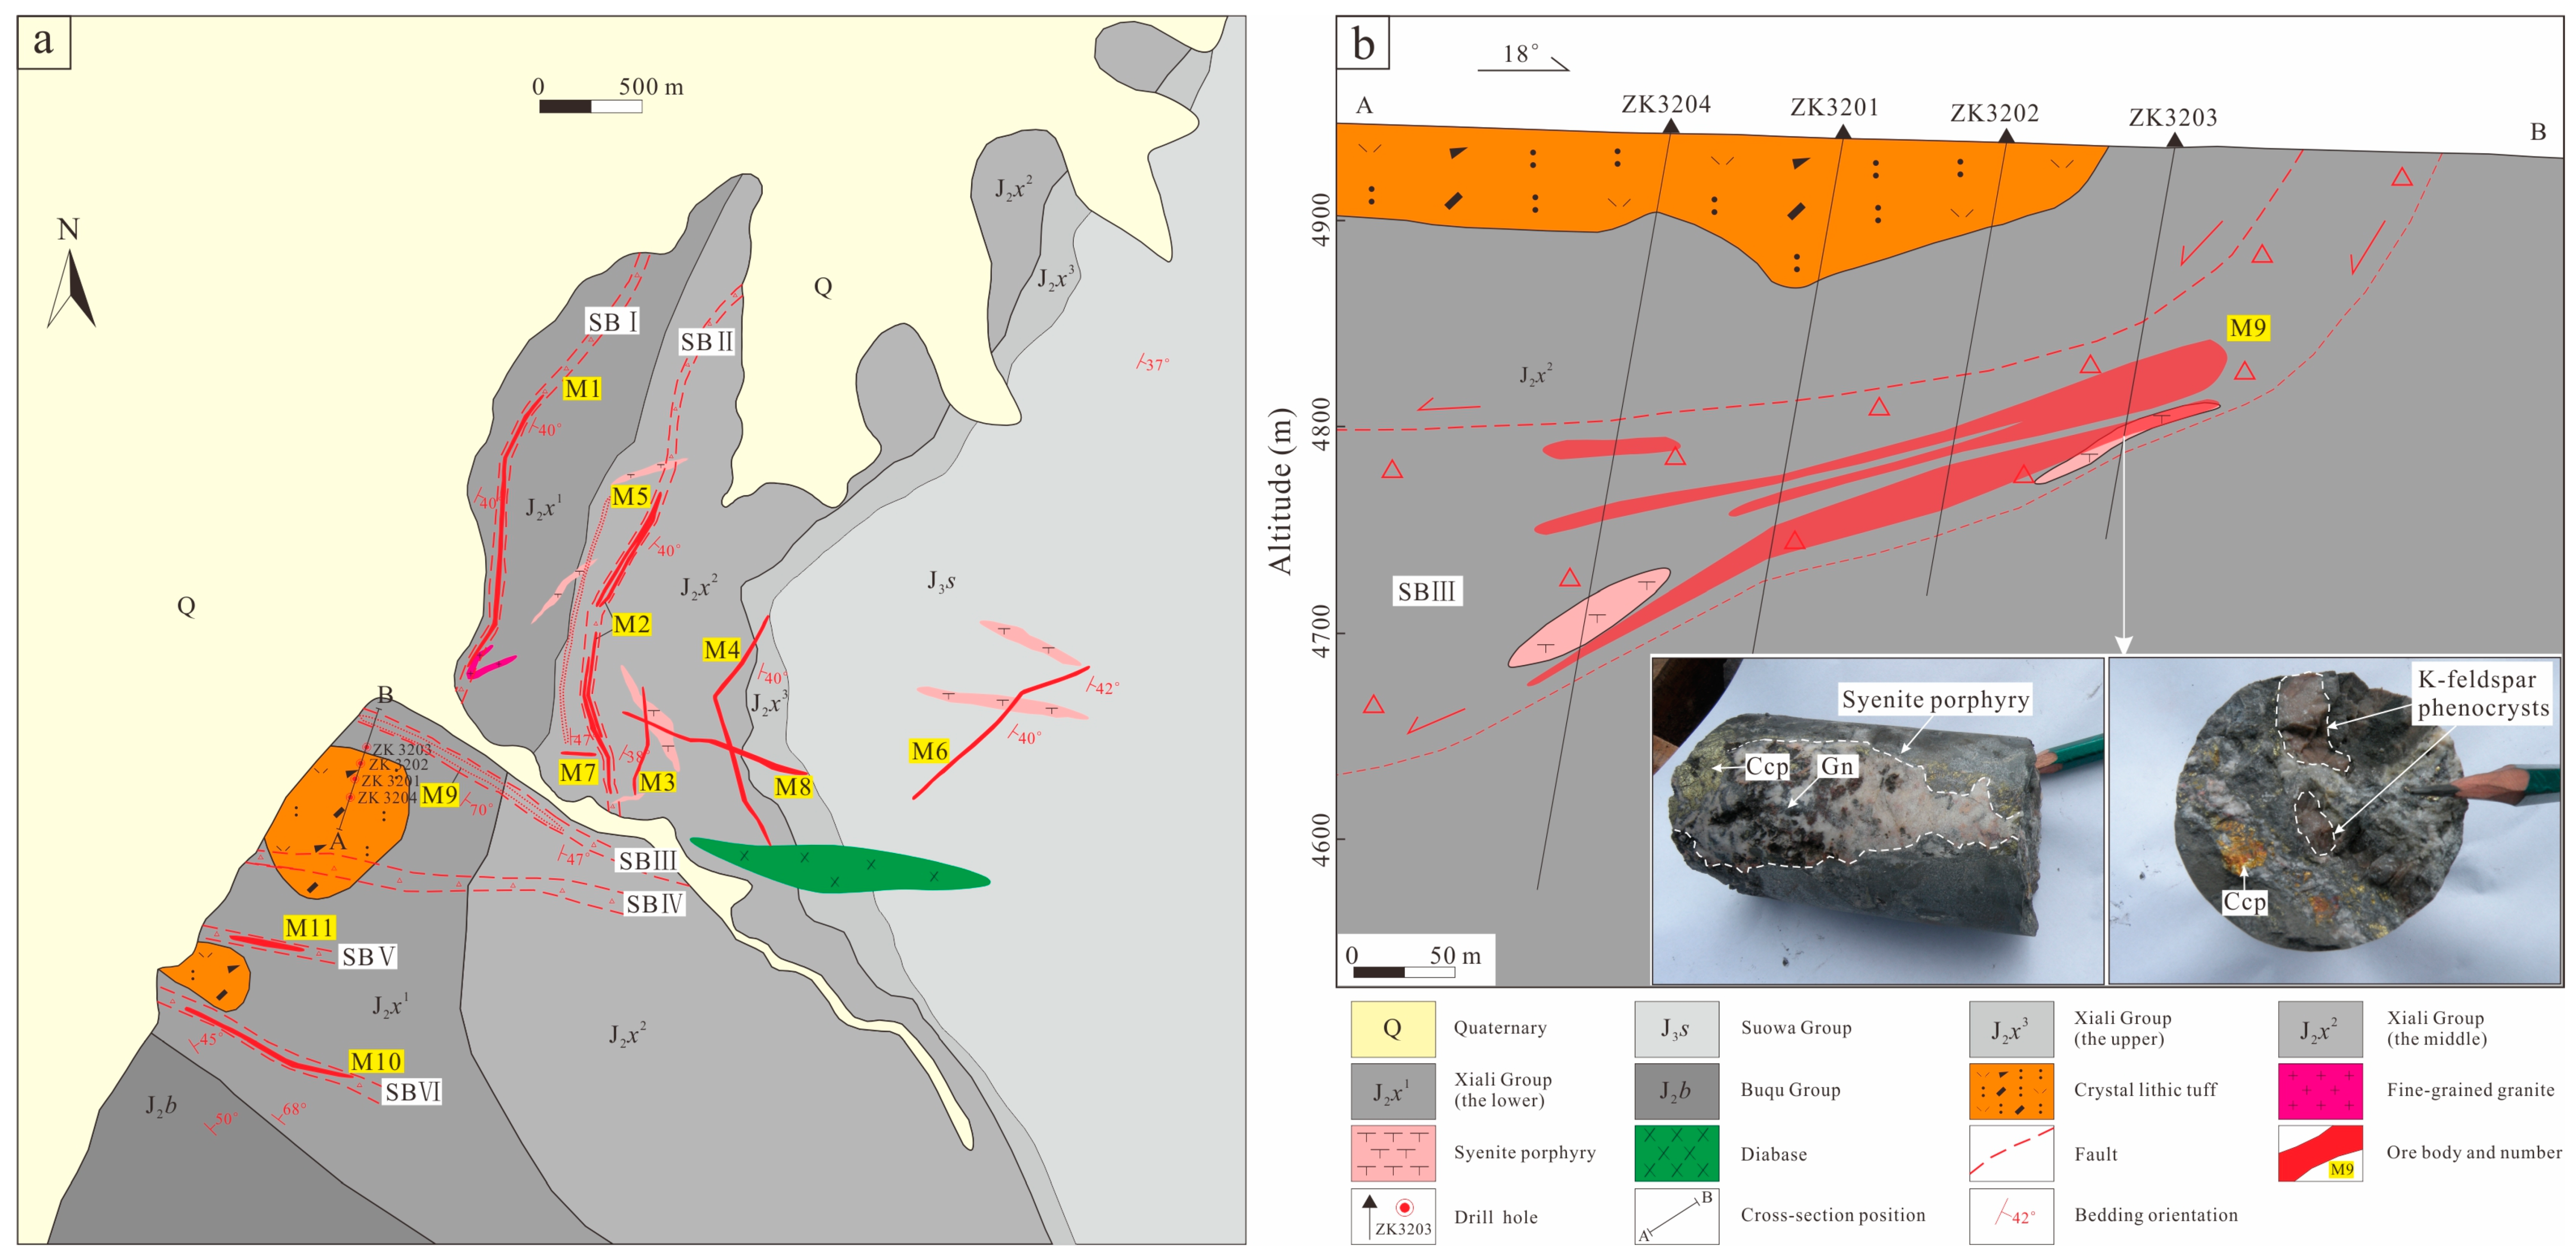
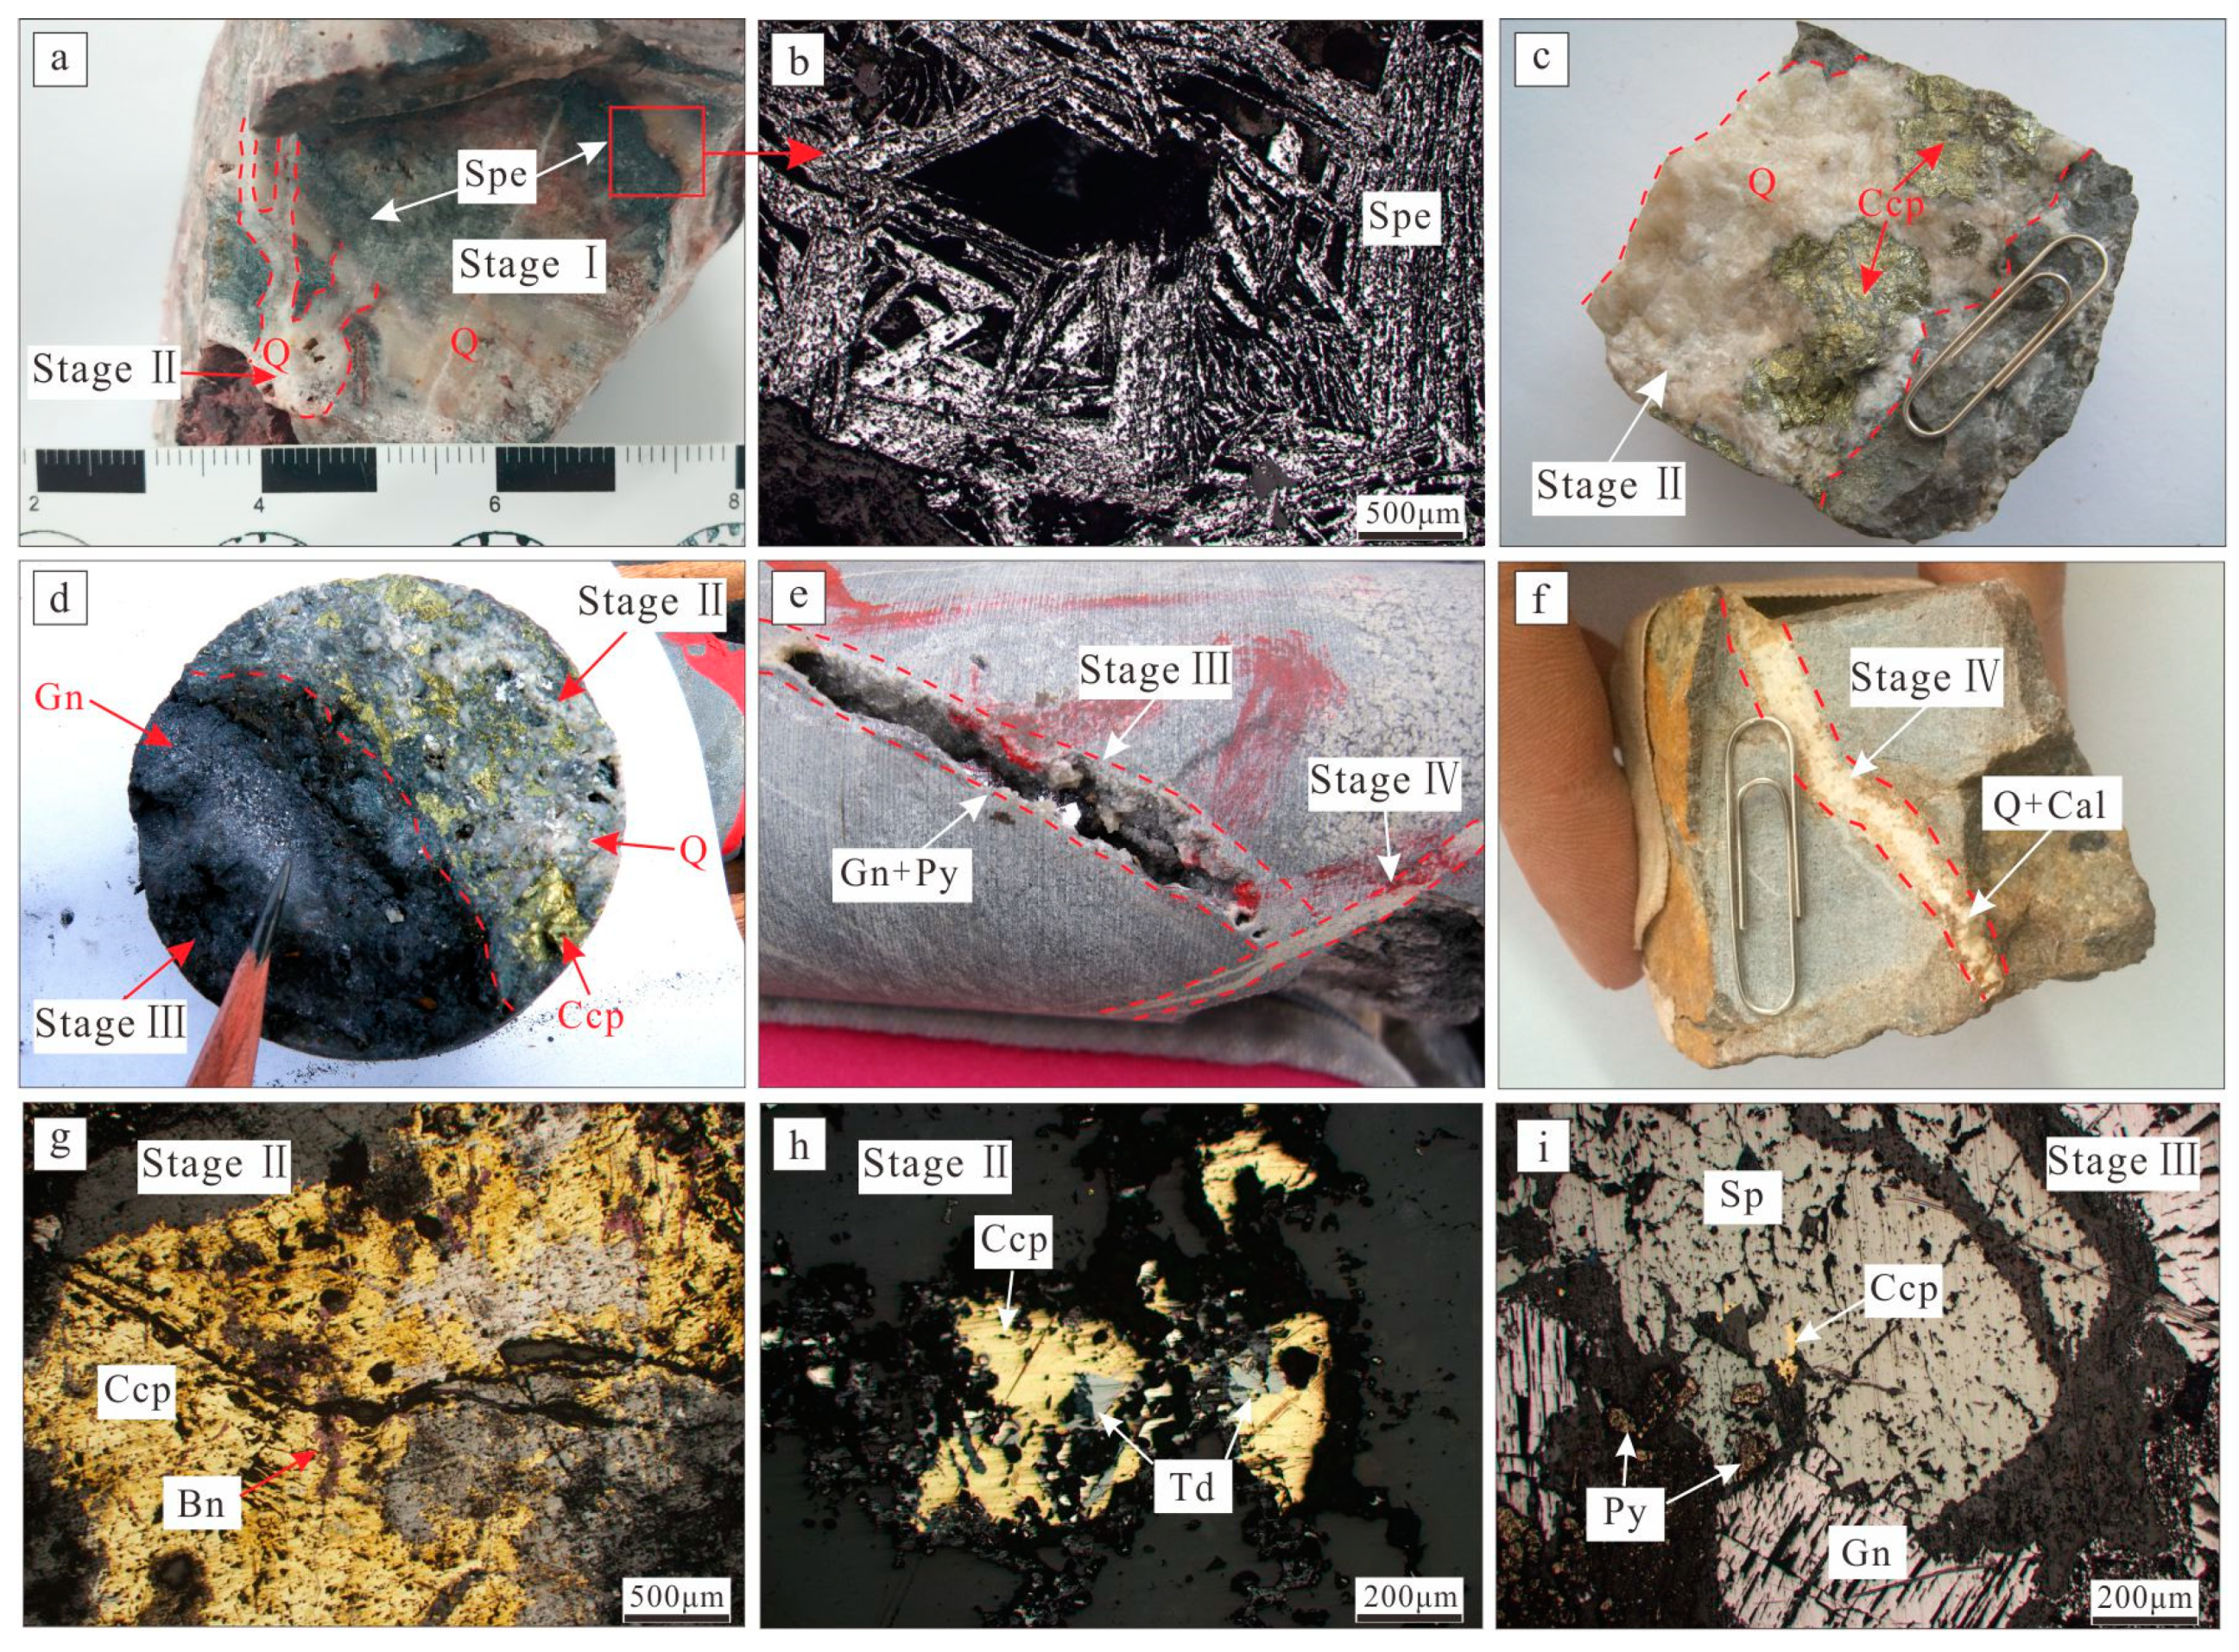
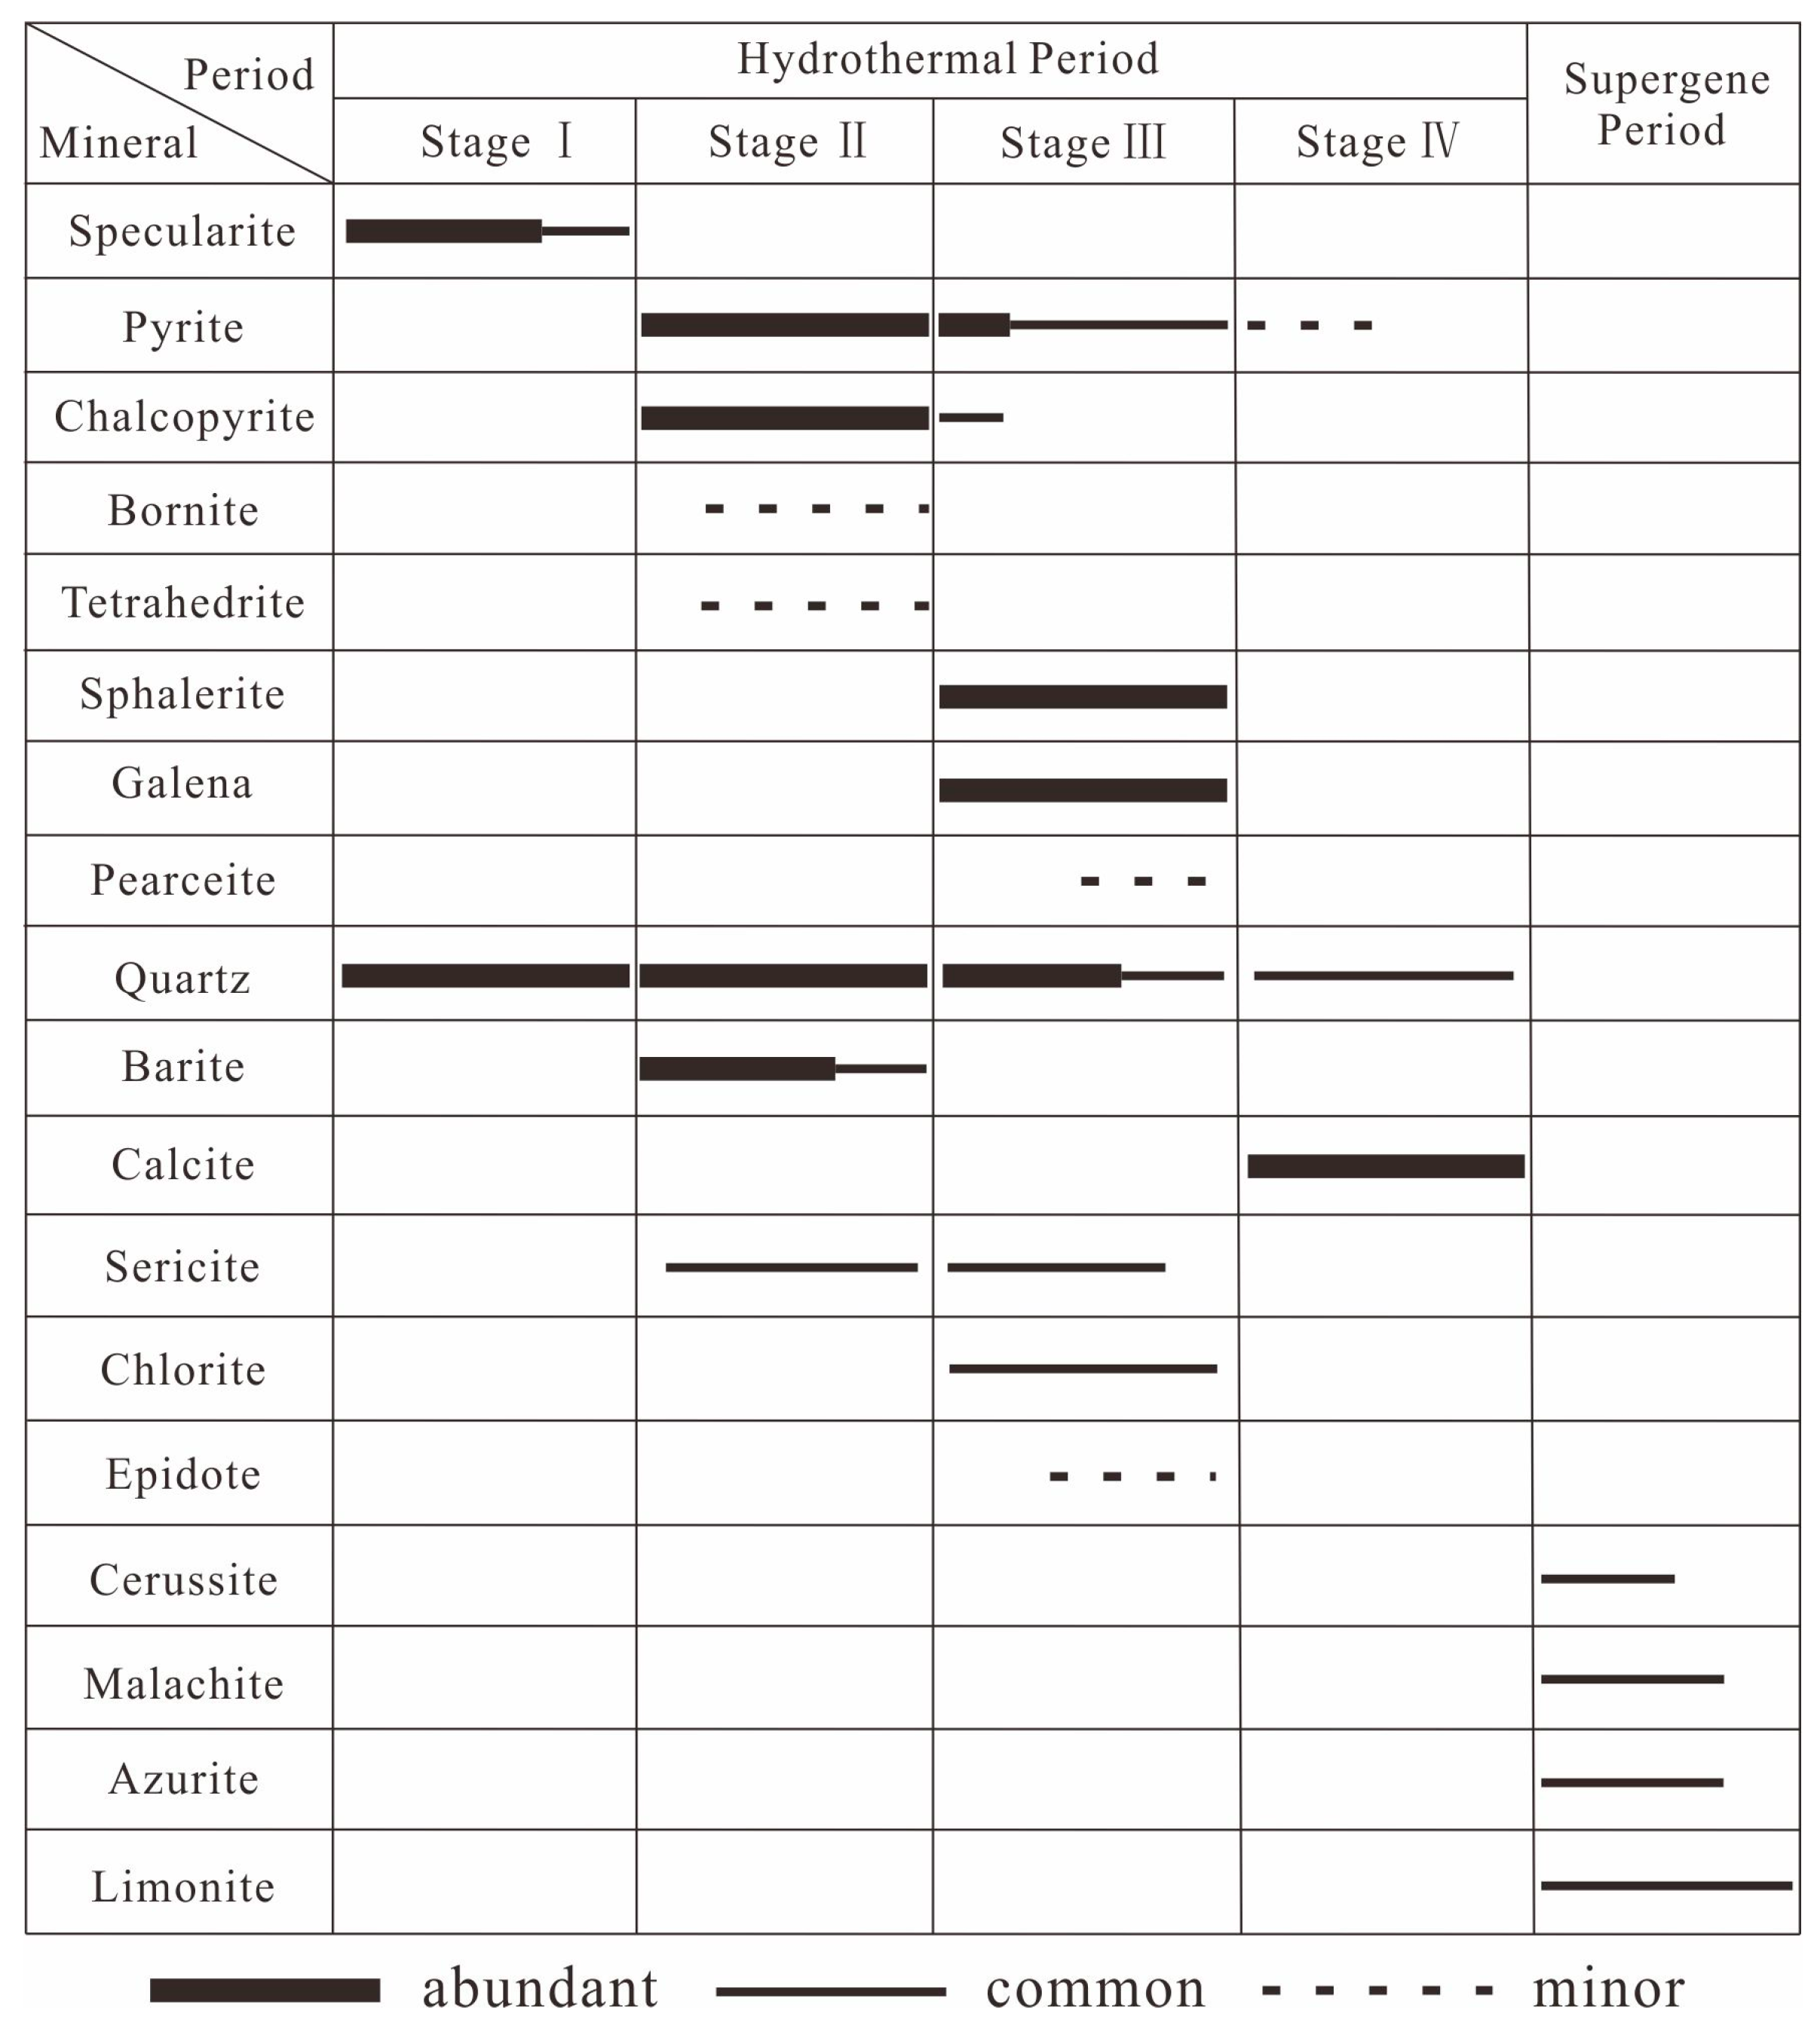
3. Ore Deposit Geology

Rocks exposed in the studied mining area include those of the Middle Jurassic Buqu and Xiali formations, the Upper Jurassic Suowa Formation, and Quaternary deposits (Figure 3a). The Middle Jurassic Buqu Formation (J2b) is composed predominantly of light-gray to dark-gray limestone, with purple-red and gray argillaceous siltstone and quartz–feldspar sandstone. This formation is rich in marine fossils and is distributed primarily in the southwestern part of the mining area. The Buqu Formation rocks strike at 110–130°, dip at 30–70° to the NNE, and conformably overlie the Upper Xiali Formation (J2x). The Middle Jurassic Xiali Group (J2x) is an important ore-bearing group in the study area and consists of the following three lithological sections: (a) the lower section comprises blue-gray crystalline limestone, purple-red muddy siltstone intercalated with purple-red feldspar debris sandstone, and gray feldspathic quartzitic sandstone; (b) the middle section has a lithological association of purple-red feldspathic lithic quartz sandstone interbedded with bioclastic crystalline limestone; and (c) the upper section comprises purple-red feldspar arkose intercalated with gray-green feldspathic quartzitic sandstone. Sedimentary rocks of the Xiali Formation (J2x) are distributed primarily in the central part of the mining area. In the northern-central part of the mining area, they strike at 170–200° and dip at 30–70° to the east, and in the southern-central part, the beds strike at 130–160° and dip at 30–70° to the NE. The Xiali Formation conformably underlies the Upper Suowa Formation (J3s). The Upper Jurassic Suowa Group (J3s) is distributed mainly in the eastern part of the mining area. The lower part of this group consists of gray-green calcareous siltstone and mudstone intercalated with biological calcareous siltstone, interbedded with thick layers of muddy crystal limestone, whereas the upper part comprises thick layers of dark-gray muddy crystalline limestone interbedded with thin layers of muddy crystalline limestone. The Suowa Group rocks strike at 110° and dip at 30–50° to the east.
The studied mining area is characterized by NWW- and N-trending faults. The NWW-trending faults have four associated fracture zones: SBIII, SBIV, SBV, and SBVI. Of these, fracture zone SBIII (Figure 3b) is the main ore-controlling fracture zone in the area and measures 1000 m in length and 200–300 m in width, strikes at 120–135°, and dips at 65–75° to the SSW. A series of parallel secondary faults are developed in the hanging wall of the main fault and are associated with fracture zones SBIV, SBV, and SBVI. A second group of faults trends N–S and occurs in the footwall of fracture zone SBIII. These N-trending faults have formed several fracture zone structures, including SBI and SBII.
The intrusive rocks in the Chuduoqu mining area include syenite porphyry veins, diabase veins, and fine-grained granite dykes, syenite porphyry veins are oriented NE to E and NW, diabase veins are oriented E, fine-grained granite dykes are oriented NE (Figure 3a). Syenite porphyry veins have been identified in boreholes. These veins occur in the rocks of the Xiali Formation (J2x) and show strong alteration, mainly baritization and limonitization, as well as carbonation and silicification. The contact zone of the syenite porphyry with the host rocks of the Xiali Formation (J2x) is highly mineralized, with the development of massive, vein-like, and disseminated pyrite, chalcopyrite, and galena (Figure 3b). Locally, crystal lithic tuff overlies the Xiali Group (J2x) across an unconformity (Figure 3b). The U-Pb age of the crystal lithic tuff is 68.3 ± 0.7 Ma (unpublished data) and was erupted prior to the onset of mineralization.
The mineralization in the ore bodies is most enriched in and around the intersections of secondary faults (including fracture zones SBIV, SBV and SBVI) with the main fracture zone SBIII. There are six main mineralized alteration zones in the mining area. Eleven polymetallic ore bodies have been identified, including four Pb-Zn-Ag ore bodies (M1, M5, M7, and M9), four Pb-Ag ore bodies (M2, M3, M4, and M11), one Pb-Cu-Ag ore body (M8), one Cu-Ag ore body (M10), and one Pb ore body (M6) (Figure 3a). The main ore-body-hosting rocks of the Chuduoqu deposit are those of the Xiali Formation (J2x), chiefly cataclastic micritic silty limestone and cataclastic quartz–feldspar sandstone. Of the eleven identified ore bodies, six are oriented ~N–S and five are oriented NWW. The six approx N–S-trending ore bodies (M1–M6) occur in N-oriented fracture zones as layers and veins. These ore bodies have lengths of 150–1350 m and thicknesses of 4–16 m, dip at 42–62° to the SE, and host good quality surface mineralization but poor discontinuous mineralization at depth. The five NWW-trending ore bodies are distributed in NWW-oriented fractured zones.
In the Chuduoqu Pb-Zn-Cu deposit, the geology and metal resources of ore bodies M1, M2, M8, M9, and M10 have been investigated (Table S1), whereas the resources of the remaining six ore bodies remain unknown. The main ore body, M9, occurs in the altered fracture zone SBIII, which is the main ore-controlling structure. Ore body M9 is layered, extends for more than 500 m, varies in thickness from 3.0 to 24.7 m, and dips at 20° to the south. This body contains an average Pb grade of 2.22% (locally reaching 21.13%), an average Zn grade of 1.41% (locally up to 8.69%), and an average Ag grade of 49.5 g/t (locally up to 220 g/t) (Table S1), indicating very good prospecting potential. The degree of host-rock fragmentation in the main fracture zone of ore body M9 varies greatly, with the alteration and mineralization being strongest in regions of highly fractured limestone and sandstone, and weakest in regions of weak host-rock fragmentation.
The ore minerals of the Chuduoqu Pb-Zn-Cu deposit include specularite, magnetite, pyrite, chalcopyrite, bornite, tetrahedrite, pearceite, galena, sphalerite, limonite, malachite, and azurite and the gangue minerals include quartz, calcite, dolomite, barite, sericite, chlorite, and epidote. The ores show mainly xenomorphic granular texture, with subordinate idiomorphic–hypidiomorphic granular texture. In addition, the ores exhibit cataclastic and metasomatic characteristics. The ores show mainly block and vein structures, as well as local disseminated structures. Hydrothermal alteration is widespread in the Chuduoqu Pb-Zn-Cu deposit, with the most intensive alteration occurring in and around the mineralized Pb-Zn-Cu veins. The key components of alteration assemblages include silicification, chloritization, epidotization, sericitization, carbonation, and baritization. Distinct episodes of hydrothermal alteration are recognized: an early episode of silicification, three intermediate episodes (baritization, phyllic and propylitic), and a late carbonatization. Silicification is the most widespread alteration type in the Chuduoqu Pb-Zn-Cu deposit, which coexists with minor early precipitated specularite (Figure 4a). Silicification was overprinted by baritization and phyllic alteration, which consists of barite, quartz and sericite. Baritization and phyllic alteration appear closely related to Cu metal sulfides deposition (Figure 4c,d). Phyllic alteration was overprinted by propylitic alteration, characterized by an assemblage of chlorite, epidote, and quartz. Propylitic alteration appears closely related to base metal sulfides deposition (Figure 4d,e). The final stage of hydrothermal alteration is carbonatization, which overprinted all the previous alteration types coexisting with minor pyrite. In addition, there is no obvious spatial zonation of various hydrothermal alteration types, in most cases, the alteration assemblages are superimposed upon one another.
Based on field observations, mineral assemblages, and crosscutting relationships (Figure 4), we divided the mineralization history of the deposit into a hydrothermal mineralization phase (which is subdivided into four mineralization stages) and a supergene phase. The characteristics of the mineral associations in the four hydrothermal stages are as follows (Figure 5).

3.1. Quartz–Specularite Ore (Stage I)

In this stage, specularite ore is the main metallic mineral and occurs as needle-like crystals with idiomorphic–hypidiomorphic texture. The mineral assemblage of this stage is quartz + specularite, cut by late-stage quartz–barite–chalcopyrite veins (Figure 4a).

3.2. Quartz–Barite–Chalcopyrite (Stage II)

In this stage, the gangue minerals are mainly quartz and barite, and the ore minerals are mainly pyrite and chalcopyrite (Figure 4c). Small amounts of bornite and tetrahedrite are found, mostly with idiomorphic–hypidiomorphic texture. The mineral assemblage is quartz + barite + pyrite + chalcopyrite + bornite + tetrahedrite (Figure 4g,h). This stage is the main metallogenic stage for Cu.

3.3. Quartz–Polymetallic Sulfide Stage (Stage III)

This stage is the main stage of deposit formation. The gangue minerals are dominated by quartz, and the metallic minerals are chiefly galena, sphalerite, pyrite, and minor pearceite and chalcopyrite (Figure 4d), mostly showing idiomorphic and hypidiomorphic textures. The mineral assemblage is quartz + galena + sphalerite + pyrite + chalcopyrite+ pearceite (Figure 4e,i). This stage is the main metallogenic stage of Pb and Zn.

3.4. Quartz–Carbonate Stage (Stage IV)

This stage is characterized by quartz–calcite veins with fewer metal sulfides compared with stage III. Some fine-veined disseminated pyrite is found. Numerous calcite veins are present (Figure 4f), with minor quartz veins. The mineral assemblage is calcite + quartz + pyrite.
The supergene phase involved the formation of cerussite, malachite, azurite and limonite.

4. Samples and Analytical Methods

4.1. Fluid Inclusion Measurements

The study of fluid inclusions (FIs), including petrography, micro-thermometry, and laser Raman spectra analyses, was conducted at the Key Laboratory of Geological Fluid, Jilin University, Changchun, China. A total of 27 samples from the four hydrothermal stages of mineralization were prepared as two-sided, 0.2 mm-thick polished sections. FIs were observed under a binocular microscope, following which representative primary FIs were selected for micro-thermometric measurements. Secondary FIs, presenting locally as trails penetrating crystal boundaries, were not analyzed [36].
The petrographic and micro-thermometric studies were performed using a heating–freezing stage (THMS-600, Linkam Scientific Instruments Ltd, Epsom, UK) with a temperature range of −195 to 600 °C. The estimated precision of the measurements is ±0.1 °C for the interval from −120 to 70 °C and ±2 °C for the interval 100–500 °C. International standard samples (synthetic NaCl–H2O FIs) containing pure water and 25% salinity were used for calibration. The heating rate for testing was generally 0.2–5.0 °C/min, although 0.5–1.0 °C/min around phase transformation points.
The compositions of individual FIs were determined using an RM-2000 laser Raman microprobe (Renishaw, New Mills, UK) with an argon ion laser and a laser source of 514 nm. The scanning range of spectra was set between 100 and 4300 cm−1 with an accumulation time of 60 s for each scan. The laser beam width was 1 μm, and the spectral resolution was 0.14 cm−1.

4.2. Ion Chromatography Analysis

Five quartz samples were chosen for ion chromatographic analyses of grouped fluid inclusion compositions. These samples were carefully chosen quartz particles with purities of >98% and particle sizes ranging from 0.2 to 0.5 mm under a binocular microscope. The liquid phase composition analyses of the FIs were conducted at the Institute of Mineral Resources, Chinese Academy of Geological Sciences, Beijing, China. The liquid phase composition analyses were performed using an ion chromatograph (HIC-SP Super; Shimadzu Corporation, Kyoto, Japan) for which the limit of detection is μg/g. Each sample was placed in a quartz glass tube, following which the sample was heated for 15 min at 500 °C. After cooling, 5 mL of water was added to the tube, followed by 10 min of ultrasonic oscillation. Finally, the liquid composition was determined using the ion chromatograph.

4.3. Hydrogen and Oxygen Isotope Analyses

Seven representative quartz samples were chosen for H and O isotope analysis. H and O isotopes were analyzed using a MAT253 mass spectrometer at the Analysis and Testing Research Center of Nuclear Industry, Beijing Institute of Geology, Beijing, China, referenced to Standard Mean Ocean Water (SMOW). The procedure used for the H isotope analysis was as follows. Quartz grains were crushed to a grain size of 40–60 mesh and handpicked under a binocular microscope, resulting in a purity of >95%. Water was obtained from the primary inclusions by the heating burst method [37]. Hydrogen was produced using the zinc method [38]. The H isotope composition was then determined using the mass spectrometer, for which the analytical precision was ±1‰. The procedure used for the O isotope analysis was as follows. The selected quartz was crushed to 200 mesh and then dried. Around 10–30 mg of the crushed sample was taken and combined with BrF5 at 550 °C to produce O and CO2 using a carbon furnace. The O isotope composition was then determined using the mass spectrometer. The analytical precision is better than 2‰ for δD and 0.2‰ for δ18O. The isotope data are reported in standard δ notion (‰) relative to the Vienna Standard Mean Water (V-SMOW) for oxygen and hydrogen.

4.4. Carbon and Oxygen Isotope Analyses

Four calcite samples from quartz–calcite veins were chosen for C and O isotope analysis. The C and O isotope analyses of calcite were performed using the 100% phosphoric acid method [39] with a MAT-251EM mass spectrometer (Thermo Fisher Scientific, Waltham, MA, USA) at the Analysis and Testing Research Center of Nuclear Industry, Beijing Institute of Geology, Beijing, China. The CO2 gas produced by the reaction of phosphoric acid with the sample at 25 °C was analyzed to yield the C and O isotopic compositions of calcite. δ13C was referenced to the Pee Dee Belemnite (PDB) standard, and δ18O was referenced to the SMOW standard. The δ18OSMOW values were calculated using the following equation [40]: δ18OSMOW = 1.03086 × δ18OPDB + 30.86. The analytical precisions were ±0.1‰ for carbon isotopes and ±0.2‰ for oxygen isotopes.

4.5. Sulfur and Lead Isotope Analyses

Fourteen sulfide samples were chosen for S isotope analysis. Four sulfide samples were chosen for Pb isotope analysis. The S and Pb isotopes of the metal sulfides were analyzed at the Analysis and Testing Research Center of Nuclear Industry, Beijing Institute of Geology, Beijing, China. The S isotope analyses were performed using a MAT253 gas isotope mass spectrometer with an analytical precision of better than ±0.2‰. The sulfide reference materials were the GBW-04414 and GBW-04415 Ag sulfide standards, and their determined δ34S values were −0.07‰ ± 0.13‰ and 22.15‰ ± 0.14‰, respectively. The Pb isotopes were measured by thermal ionization mass spectrometry using an ISOPROBE-T mass spectrometer, and the analytical precision was better than 0.005% for 1 μg of 208Pb/206Pb.

5. Fluid Inclusion Results

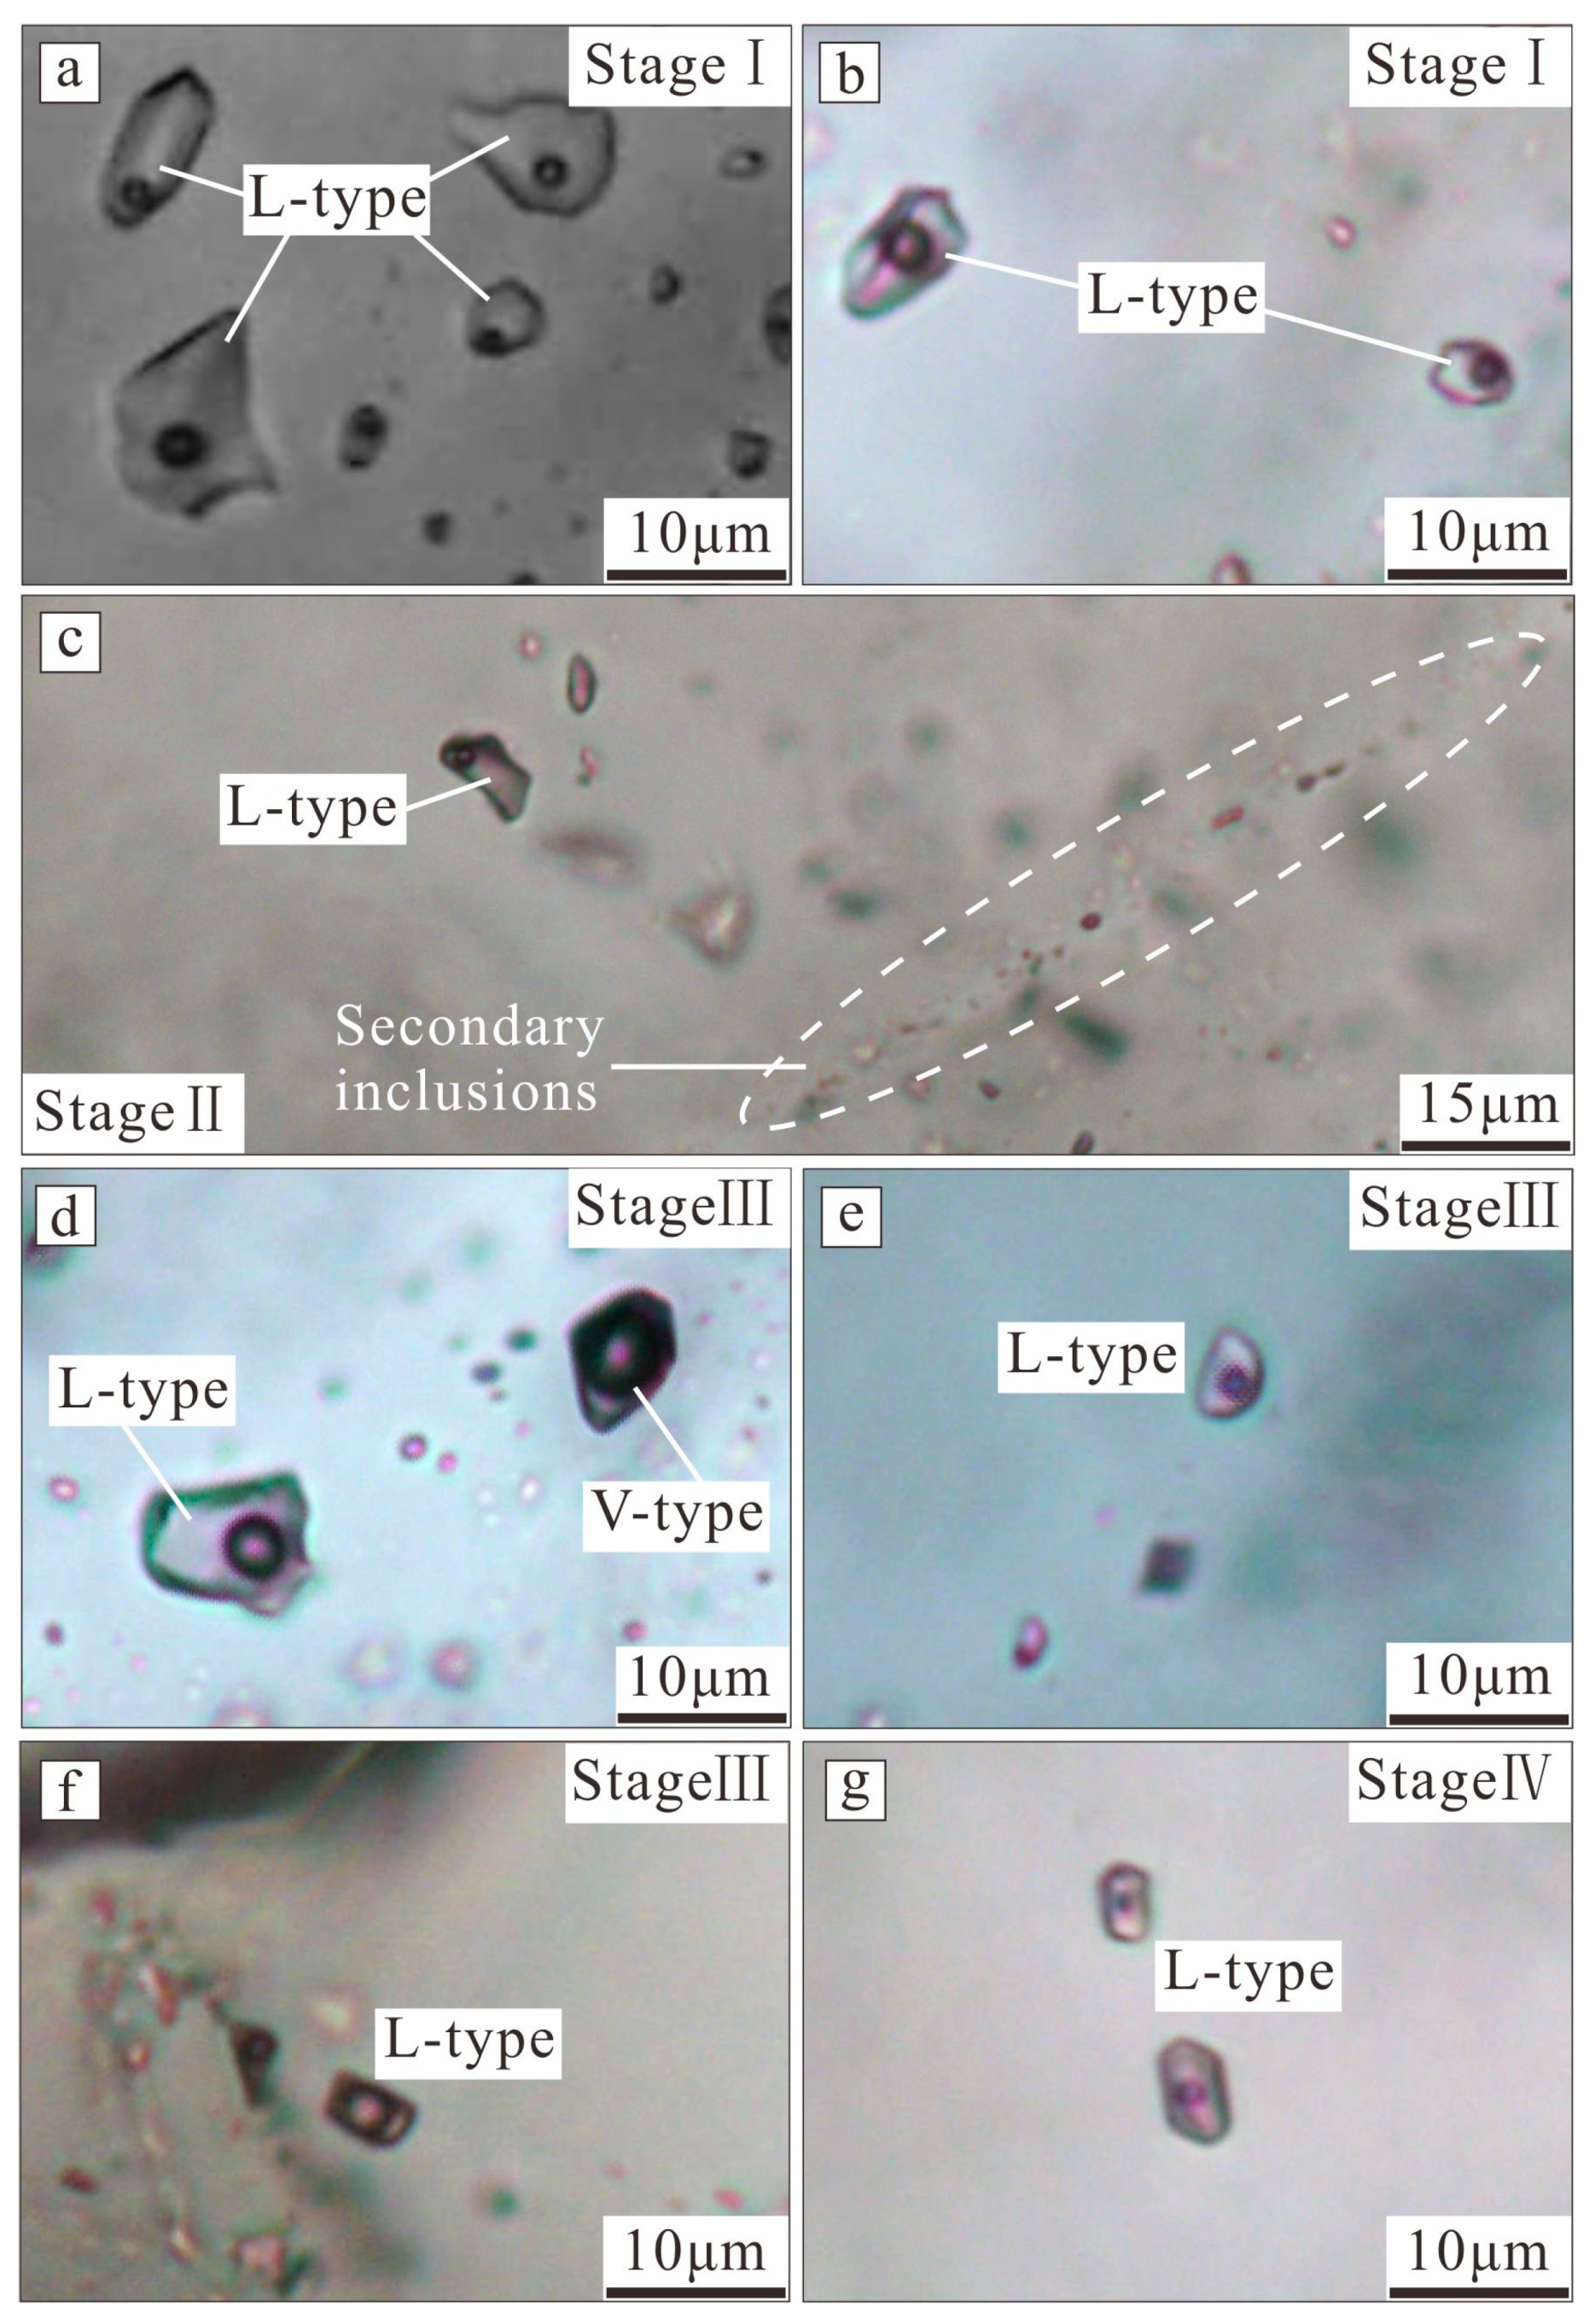
5.1. Petrographic Characteristics

The petrographic investigation revealed that the primary FIs of the various hydrothermal metallogenic stages are distributed mainly in groups and a few isolated examples, indicating that they were captured concurrently [36].
On the basis of phases, the degree of filling, and combination relationship of FIs at room temperature, two distinct fluid inclusion types were recognized in the studied quartz, barite, and calcite samples from the Chuduoqu Pb-Zn-Cu deposit, as follows.
Liquid-rich (L-type) FIs are the most abundant fluid inclusion type in the various mineralization stages. These inclusions consist of two phases (vapor and liquid water) at room temperature. They contain a vapor phase occupying 5–20 vol. % of the inclusion volume. The sizes of these inclusions range from 5 to 20 μm, and they exhibit round, sub-rectangular, and irregular shapes (Figure 6a–c,e,g). The L-type inclusions occur in isolation or as clusters along healed crystals and homogenize to liquid during heating.
Vapor-rich (V-type) FIs are identified in the quartz crystals of mineralization stage III. These inclusions consist of two phases (vapor and liquid water) at room temperature and 60–90 vol. % of the inclusion volume is occupied by vapor bubbles (Figure 6d,f). These FIs are generally round or oval in shape and measure 5–15 μm in size. The V-type FIs occur in isolation or coexist with L-type FIs and homogenize to vapor during heating.

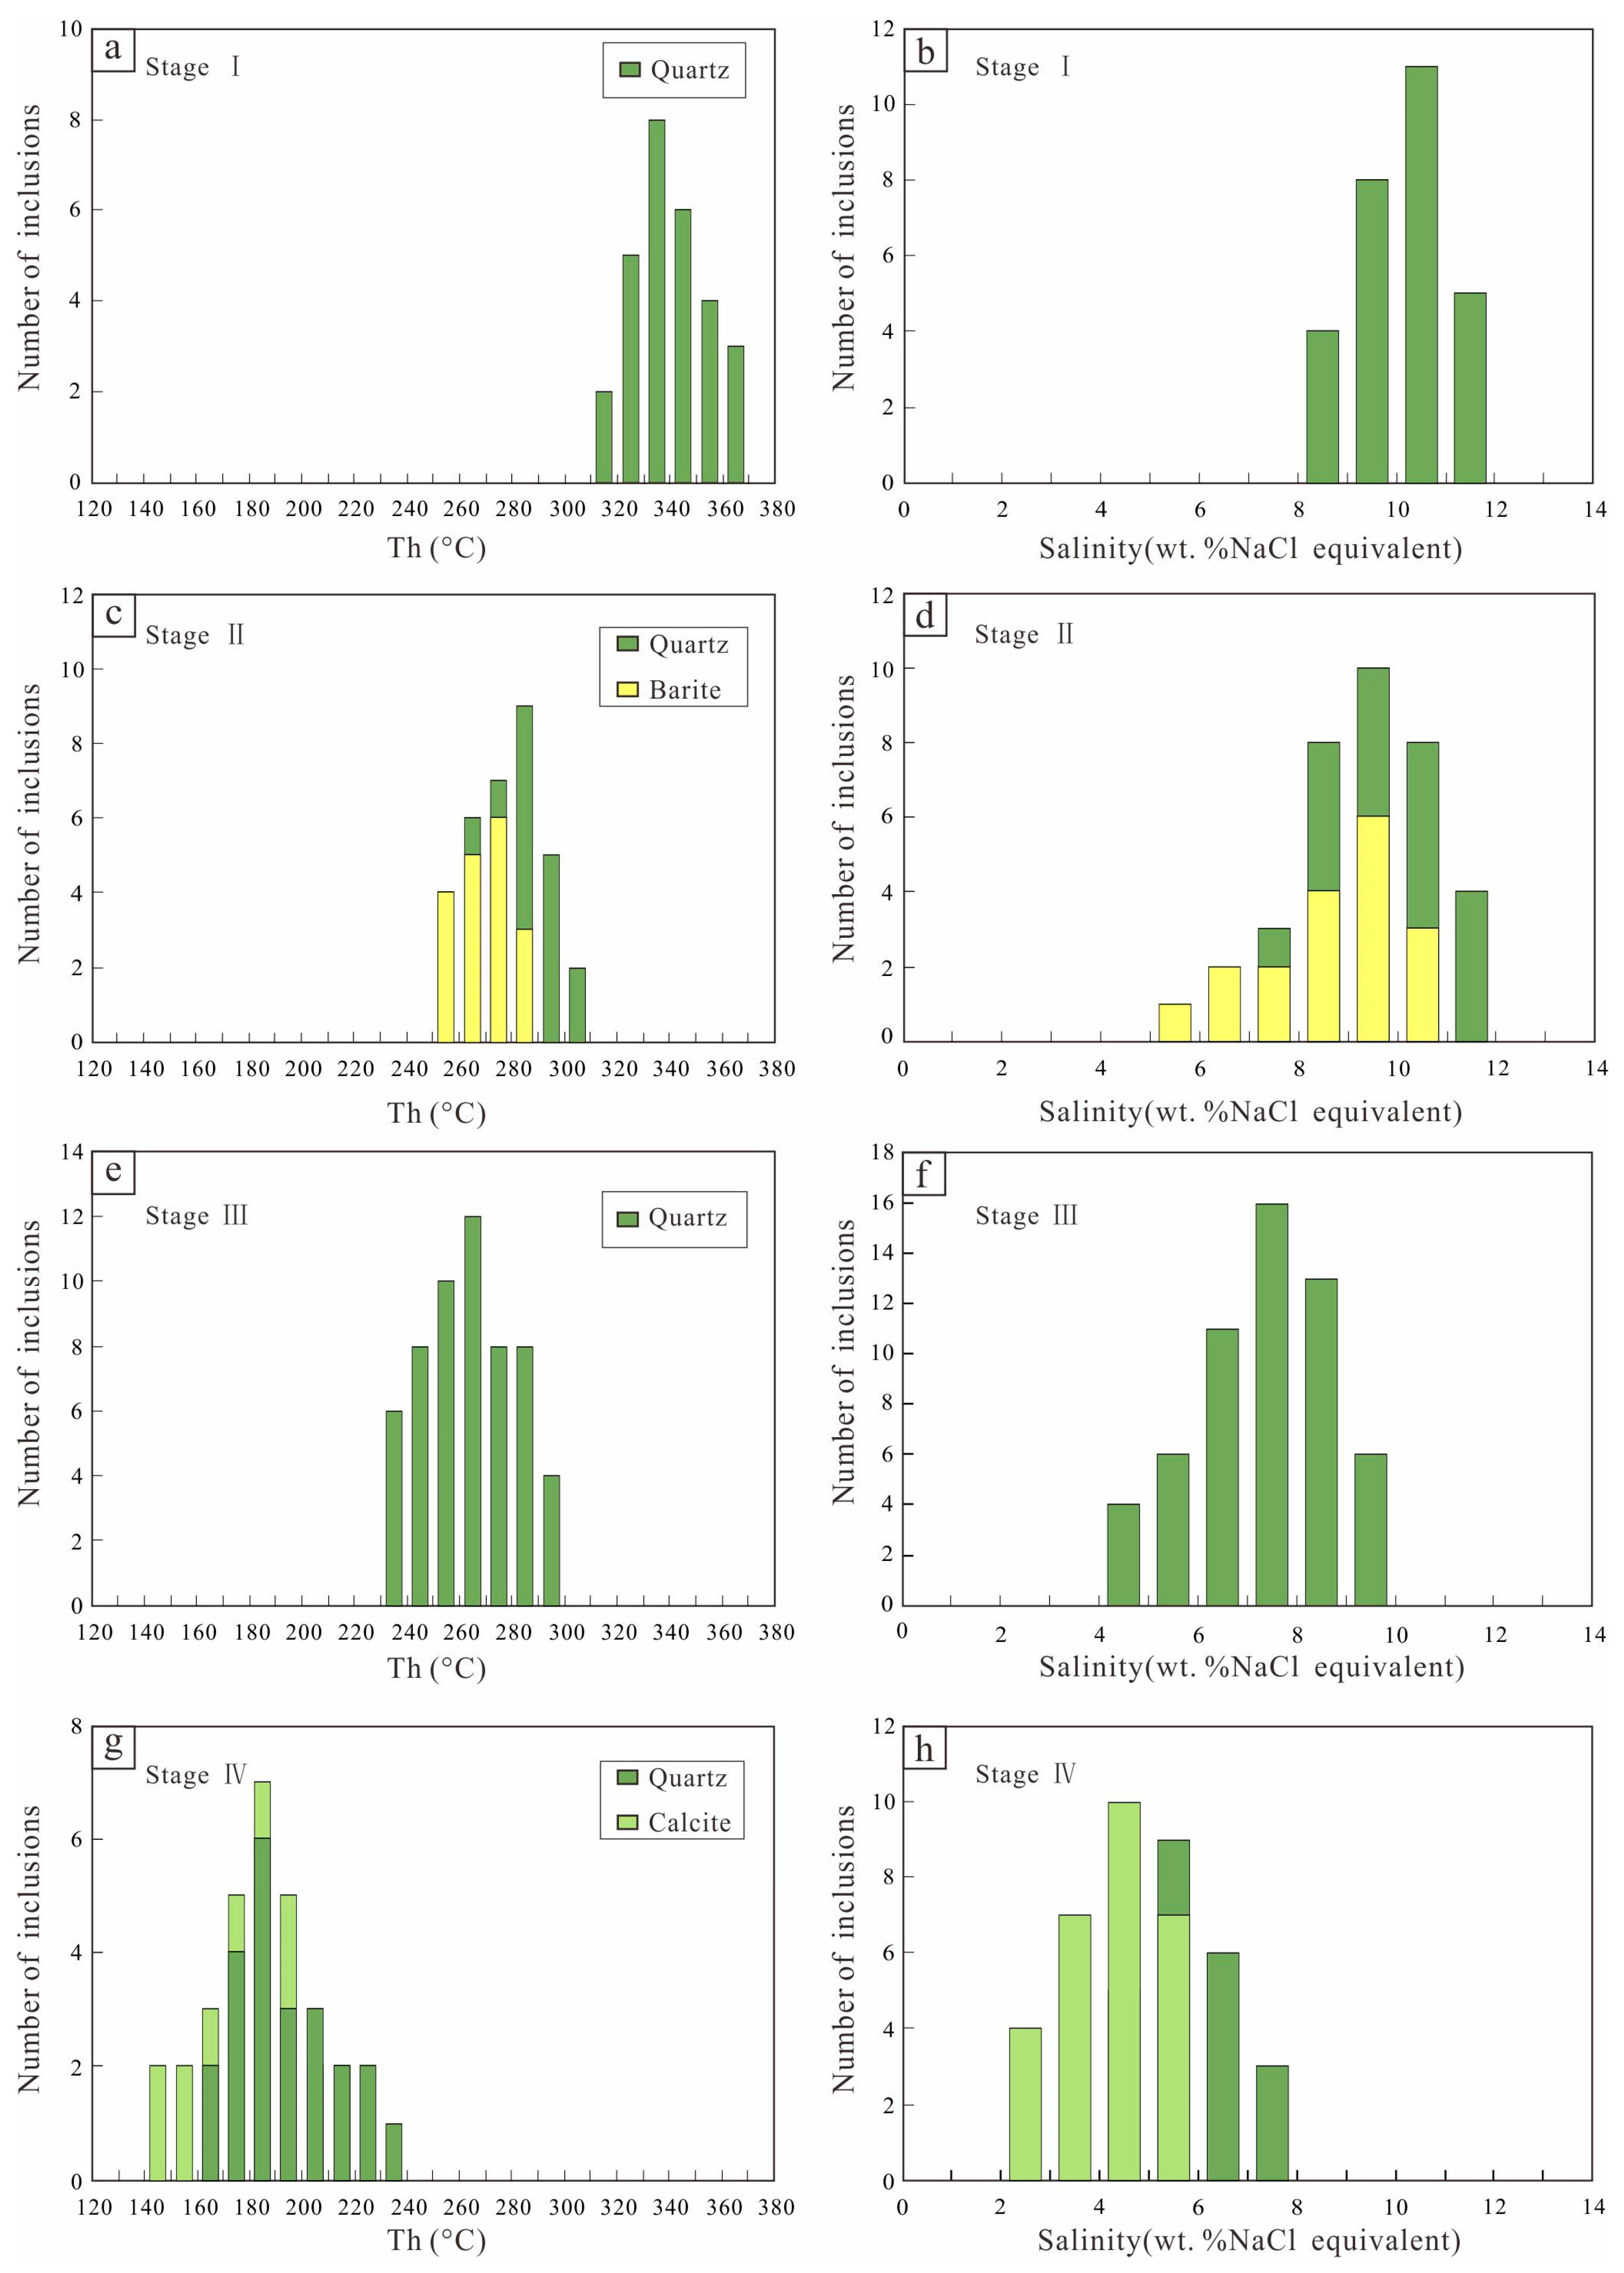
5.2. Microthermometry

On the basis of field investigations of the Chuduoqu Pb-Zn-Cu deposit, samples were collected from veins in ore bodies M8–M11. The obtained quartz, barite and calcite samples of the different mineralization stages were prepared as inclusion tablets. The microthermometric data for the FIs from the four different stages of mineralization are summarized in Table 1 and presented in Figure 7. In addition, on freezing/warming, FIs from stage II and stage III exhibit eutectic temperatures varying from −31.5 °C to −29.5 °C (Table 1), which is obviously below the eutectic temperature of H2O-NaCl (−21.2 °C) or the H2O-NaCl-KCl (−22.9 °C) system [41], indicating the presence of other ions besides Na+ and K+ (detected as Mg2+, and Ca2+ by the ion chromatography method, see Section 5.4). According to data shown by Crawford [42], in many of the chloride systems in fluid inclusions, for concentrations below 10 wt. %, freezing point depression curves are very similar, so we assume the fluids as approximating the H2O-NaCl system in our salinity estimations by using the equation of Bodnar [43].
FIs characteristics for stage I quartz are based on data for L-type inclusions. All the L-type FIs have homogenization temperatures of 318 to 370 °C, final ice-melting temperatures of −8.1 to −5.6 °C, and calculated salinities of 8.68 to 11.81 wt. % NaCl equivalent (Figure 7a,b). Initial ice melting temperatures on freezing/warming were not confidently obtained.
FIs characteristics for stage II quartz and barite are based on data for L-type FIs. These L-type FIs have homogenization temperatures of 250 to 308 °C for quartz and 250 to 287 °C for barite. The final ice-melting temperatures range from −7.8 to −4.8 °C and from −7.2 to −3.3 °C, respectively. The calculated salinities for FIs in quartz and barite range from 7.59 to 11.46 wt. % and from 5.41 to 10.73 wt. % NaCl equivalent (Figure 7c,d), respectively. On freezing/warming, FIs exhibit eutectic temperatures of −29.5 ± 0.5 °C for quartz and −31.2 ± 0.5 °C for barite, respectively, suggesting the presence of NaCl, as well as Mg and Ca chlorides in solution [42].
FIs characteristics for stage III quartz are based on data for L-type and V-type FIs. The L-type FIs have homogenization temperatures of 231 to 294 °C, final ice-melting temperatures of −6.5 to −2.9 °C, and calculated salinities of 4.80 to 9.86 wt. % NaCl equivalent (Figure 7e,f). The V-type FIs have homogenization temperatures of 230 to 259 °C, final ice-melting temperatures of −5.7 to −2.7 °C, and calculated salinities of 4.49 to 8.81 wt. % NaCl equivalent. On freezing/warming, L-type FIs from stage III exhibit eutectic first melting temperatures of −31.5 ± 0.5 °C, indicating the presence of NaCl, as well as Mg and Ca chlorides in solution [42]. For V-type FIs, their liquid phase is too small to observe the eutectic temperature.
FIs characteristics for stage IV quartz and calcite are based on data for L-type FIs. The L-type FIs in quartz and calcite have homogenization temperatures of 162 to 233 °C and 144 to 219 °C, and final ice-melting temperatures of −4.4 to −2.6 °C and −3.1 to −1.2 °C, respectively. The calculated salinities for FIs in quartz and calcite range from 4.34 to 7.02 wt. % and from 2.07 to 5.10 wt. % NaCl equivalent (Figure 7g,h), respectively. Initial ice melting temperatures on freezing/warming were not confidently obtained.
The microthermometry results show that the FIs are medium temperature and medium to low salinity.

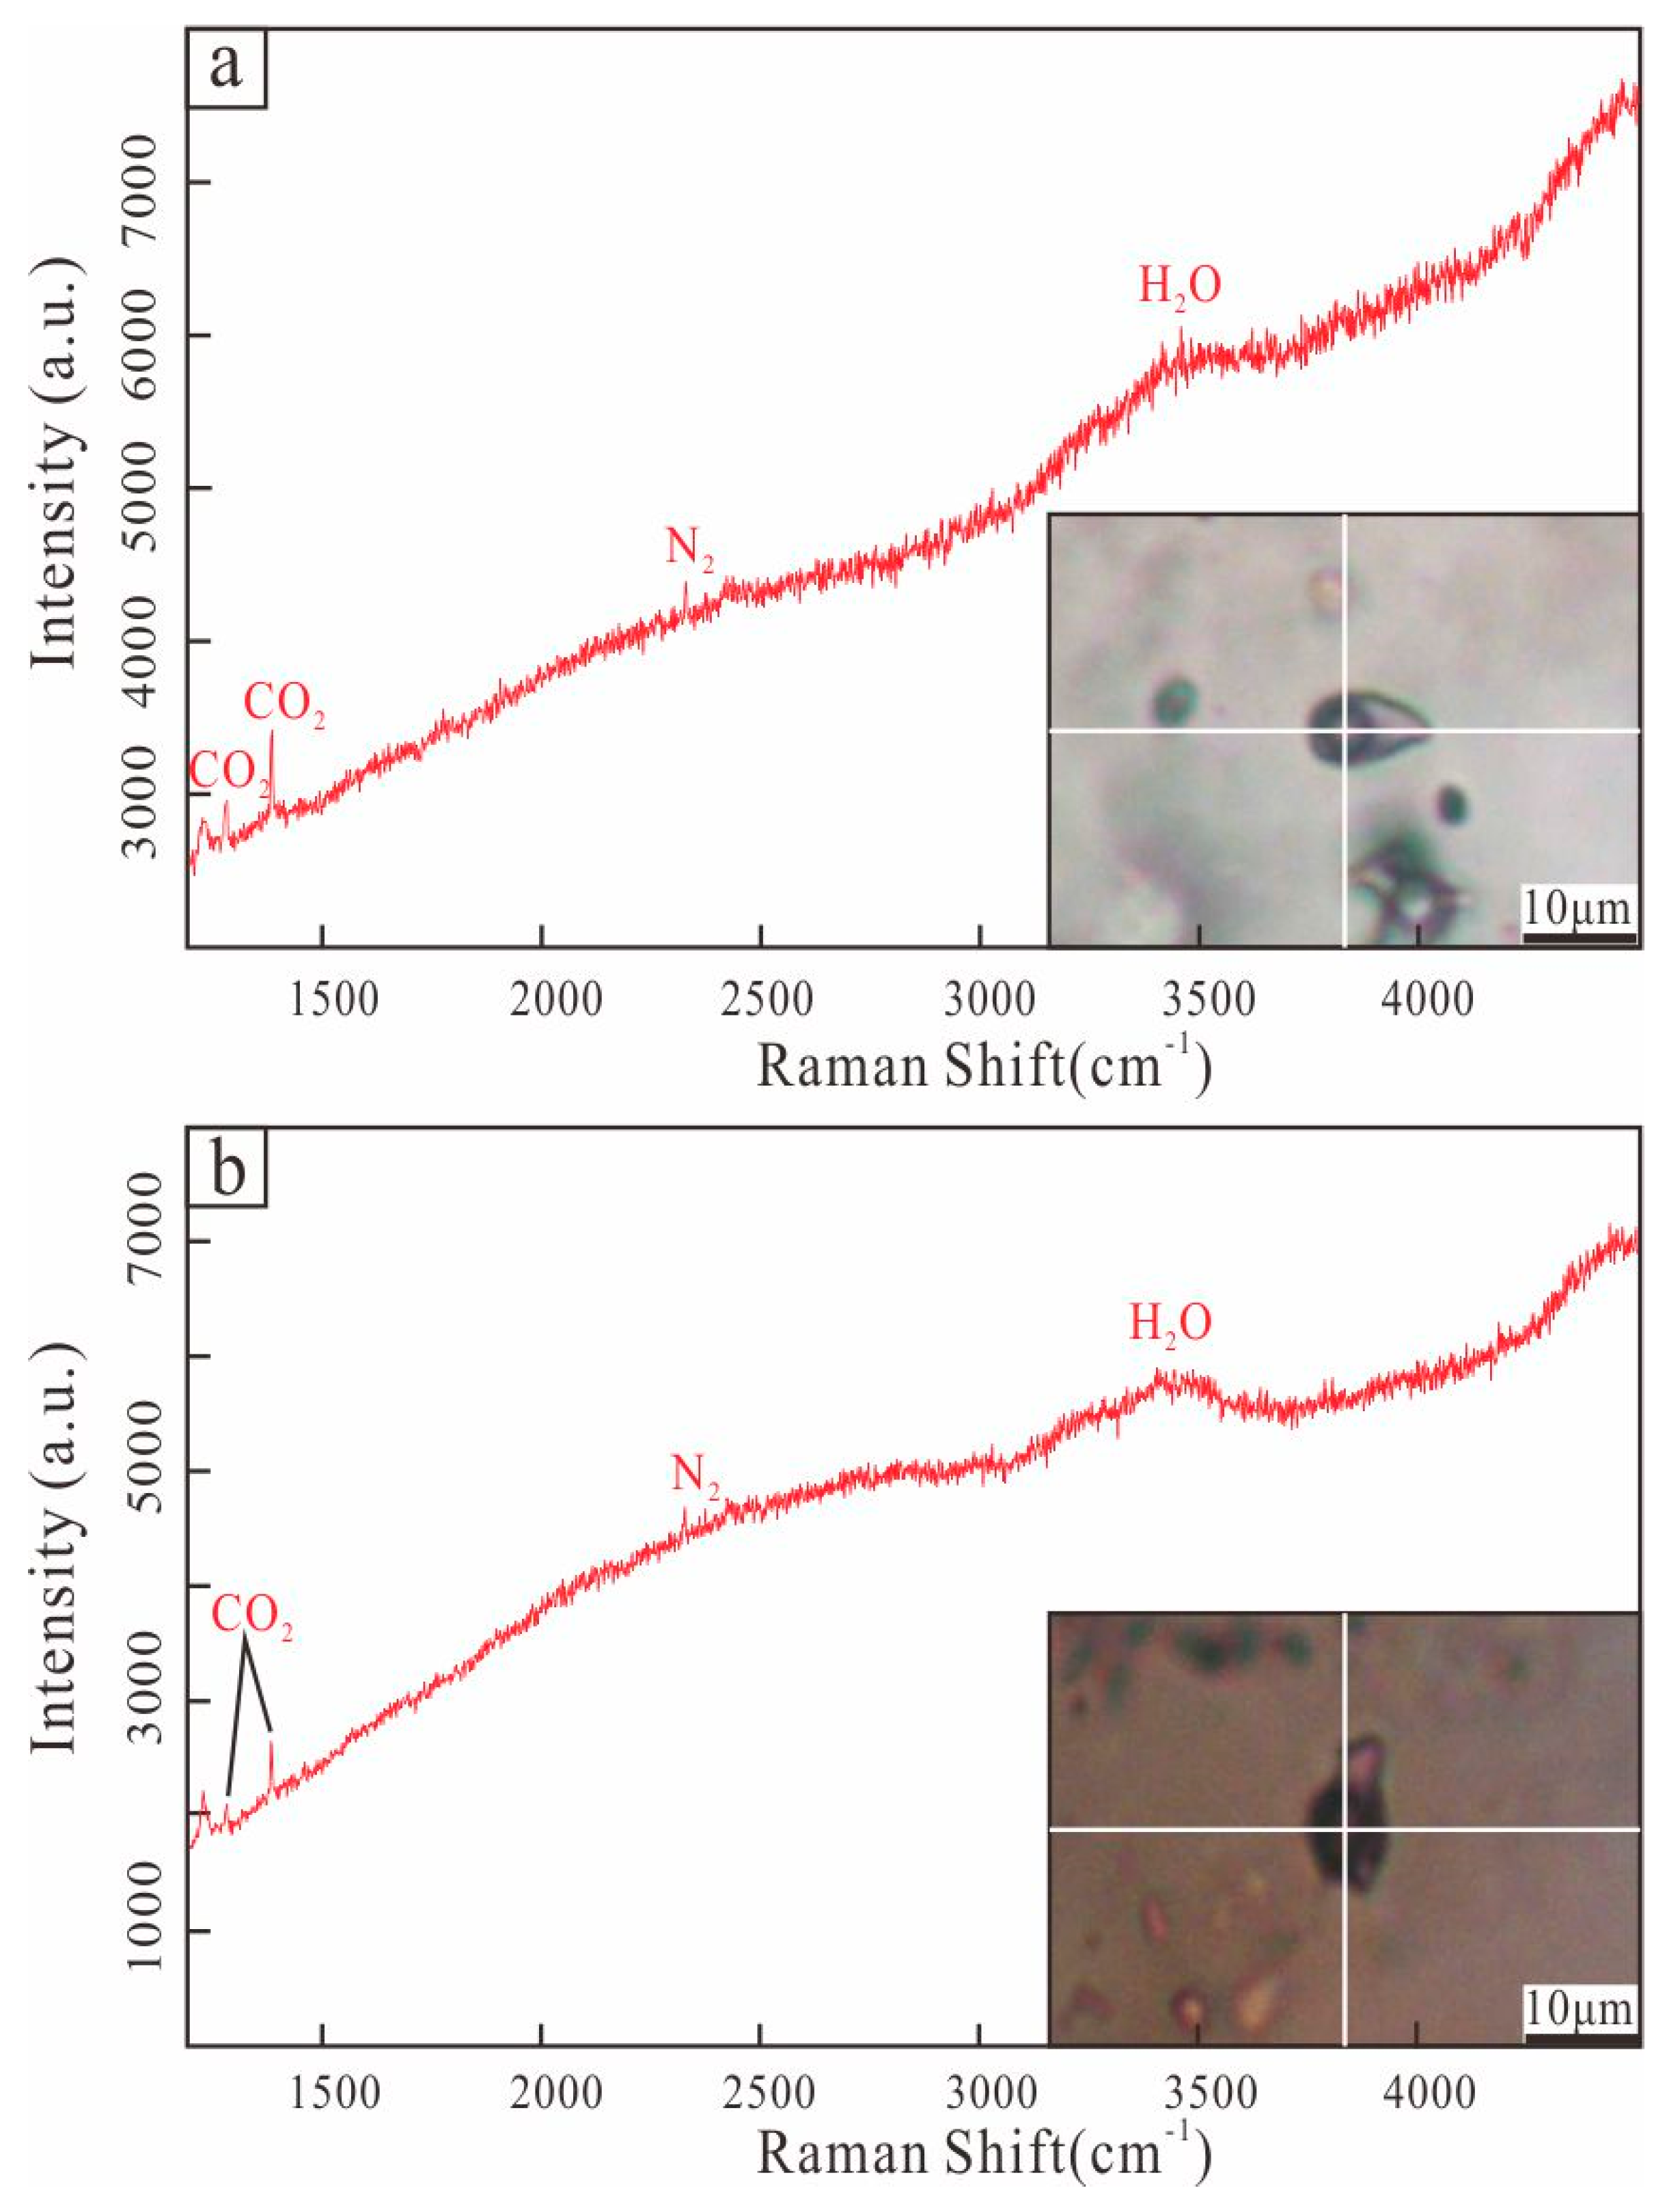
5.3. Laser Raman Spectroscopy

Representative FIs from the Chuduoqu Pb-Zn-Cu deposit were studied using laser Raman spectroscopy to determine their gas compositions. The results suggest that the vapor phases of the L-type FIs, either coexisting with the V-type FIs or as individual assemblages, are dominated by H2O, with trace amount of CO2 and N2 (Figure 8a). Trace amount of CO2 and N2 are also found in the vapor phases of the V-type FIs in the Quartz-polymetallic sulfide stage (Figure 8b). In summary, the FIs can be described as the H2O – NaCl ± CO2 ± N2 system.

5.4. Ion Chromatography

The results obtained by the ion chromatography method are affected by the presence of secondary inclusions and must be taken with caution. The samples for ion chromatography were obtained from the chalcopyrite-bearing quartz veins of stage II in ore bodies M8 and M9. The cations in the liquid of the FIs were mainly Ca2+ and Mg2+ with lesser K+ and Na+. The anions were mainly Cl and SO42− with lesser F, NO2−, and NO3− (Table 2).

6. Isotopes Systematics

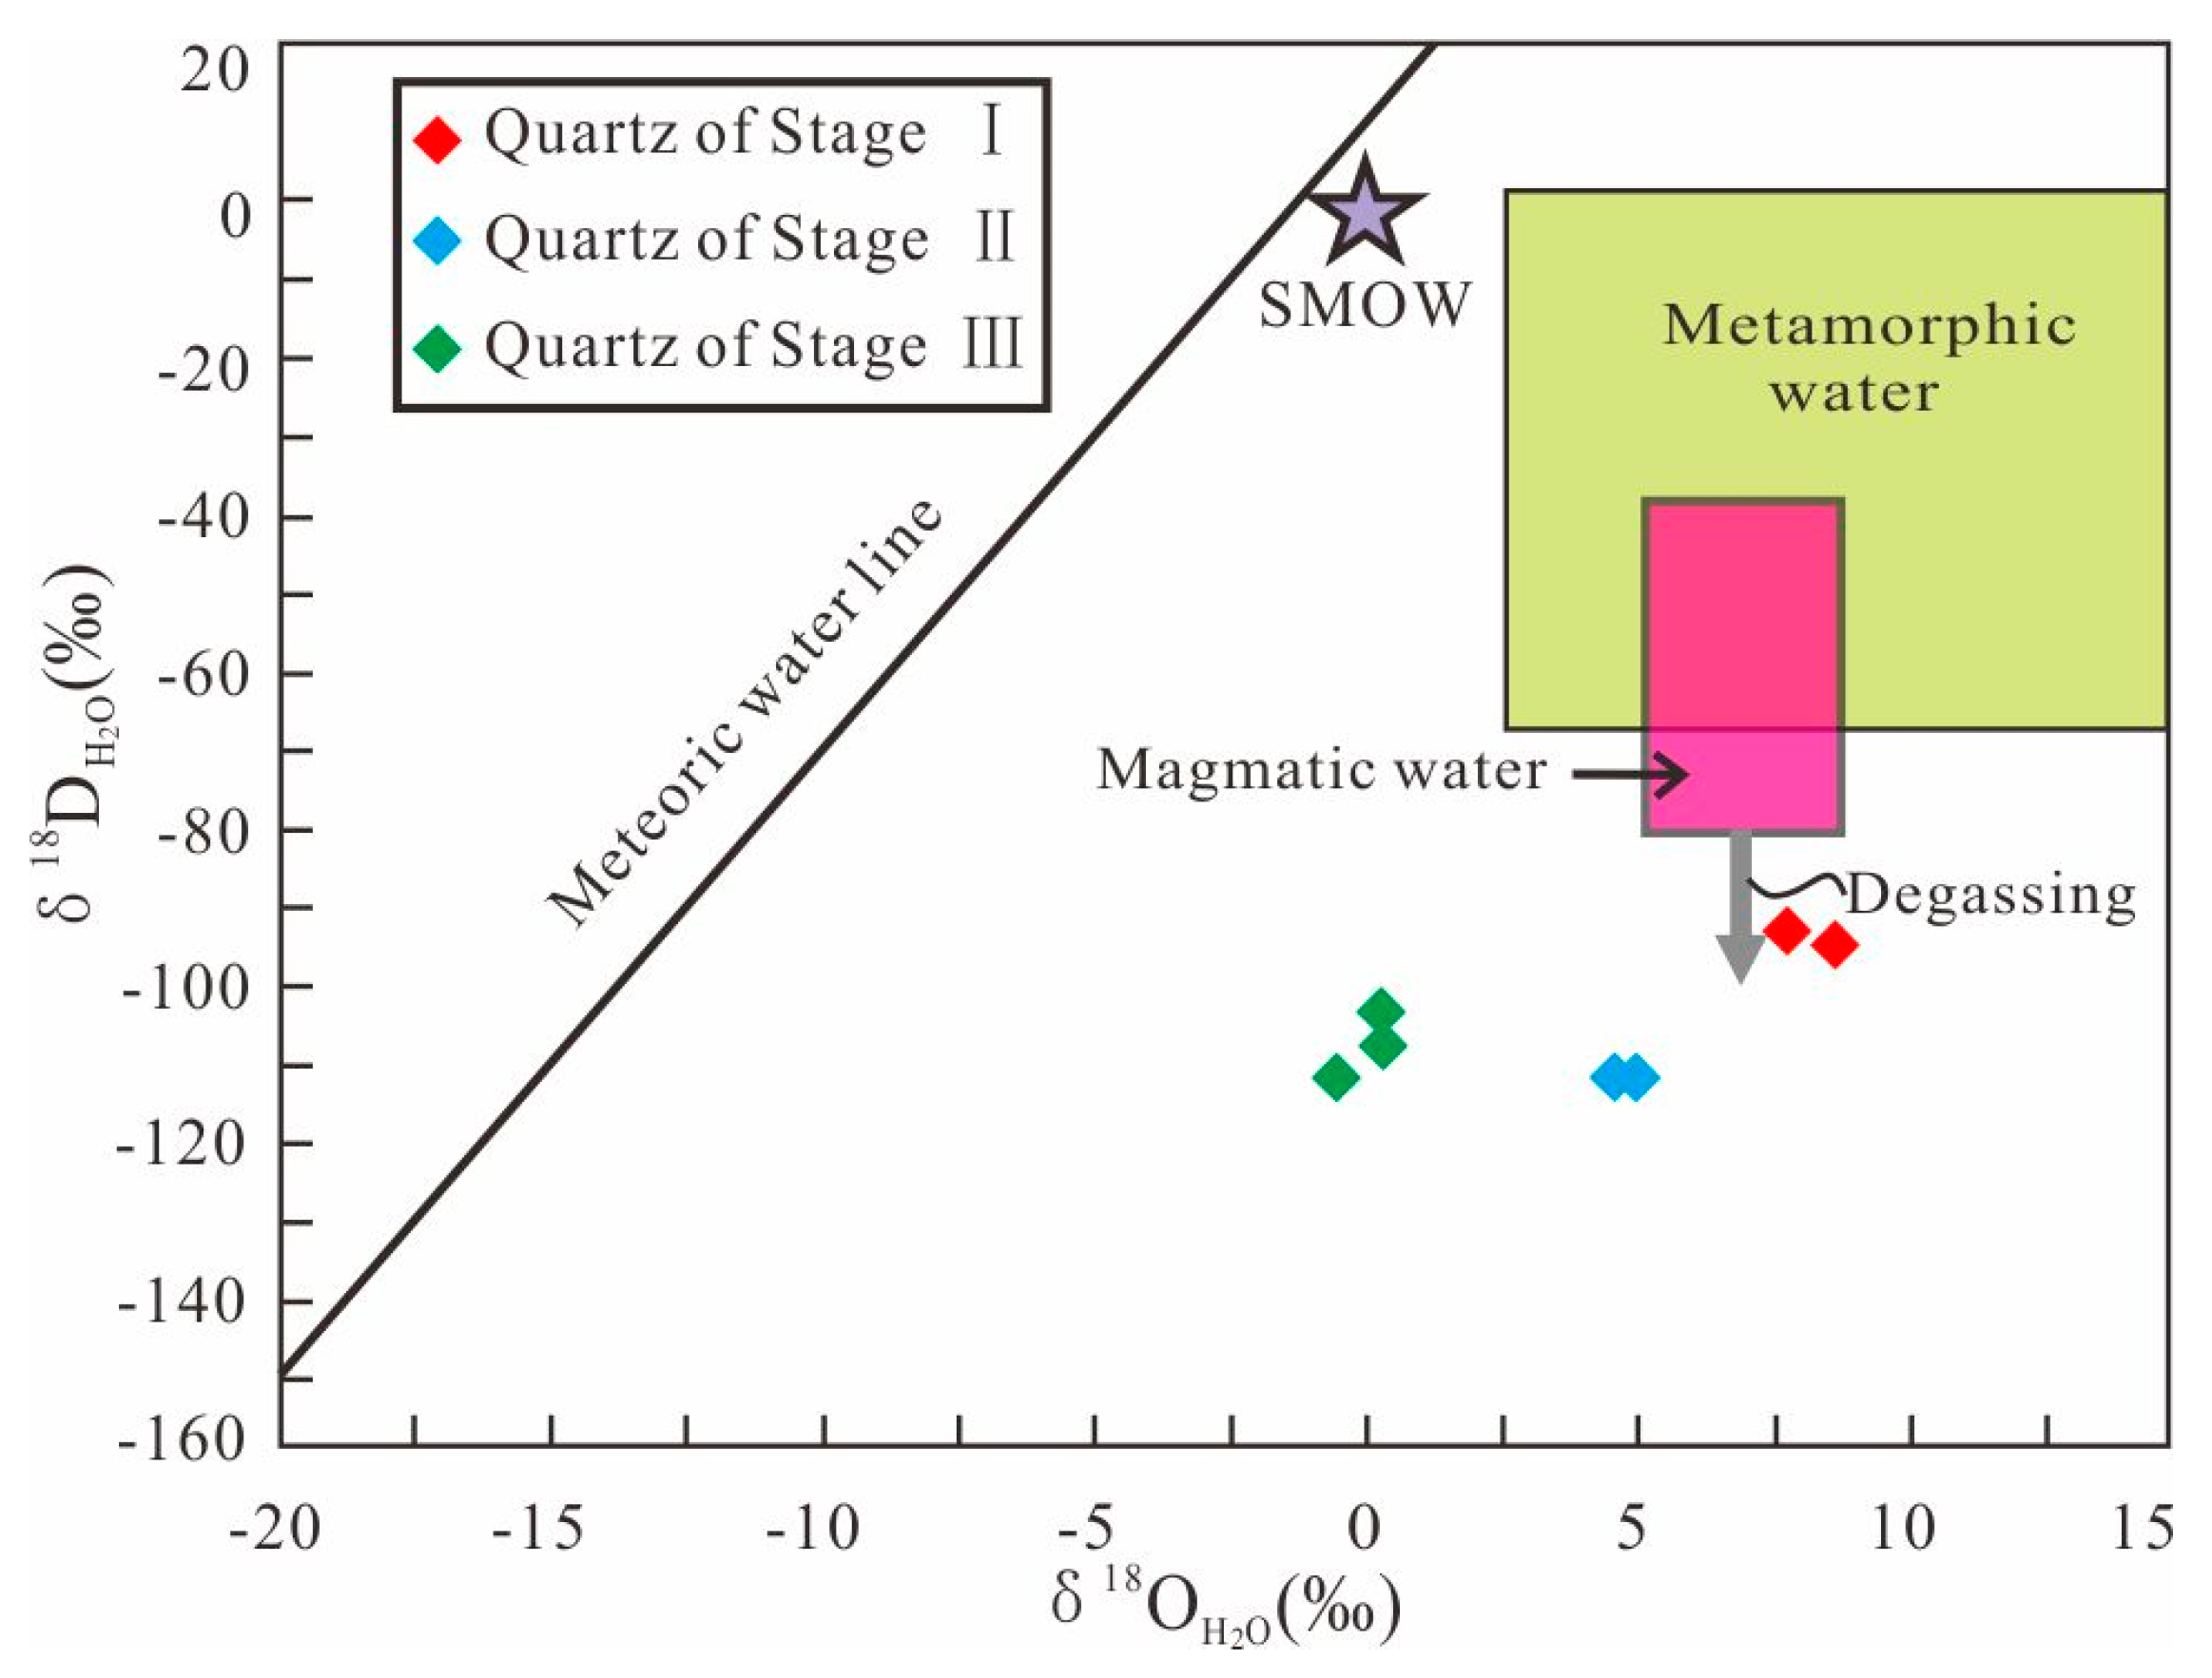
6.1. Oxygen and Hydrogen Isotopes

Seven quartz samples of ore-forming stages I, II and III obtained from ore bodies M5, M8, and M9 were selected for H–O isotope analysis. The results of the analysis are reported in Table 3. The δ18OV-SMOW values range from 9.5‰ to 15.3‰, the δ18OH2O values from −0.4‰ to 9.1‰, and δDV-SMOW values from −113.2‰ to −93.8‰.

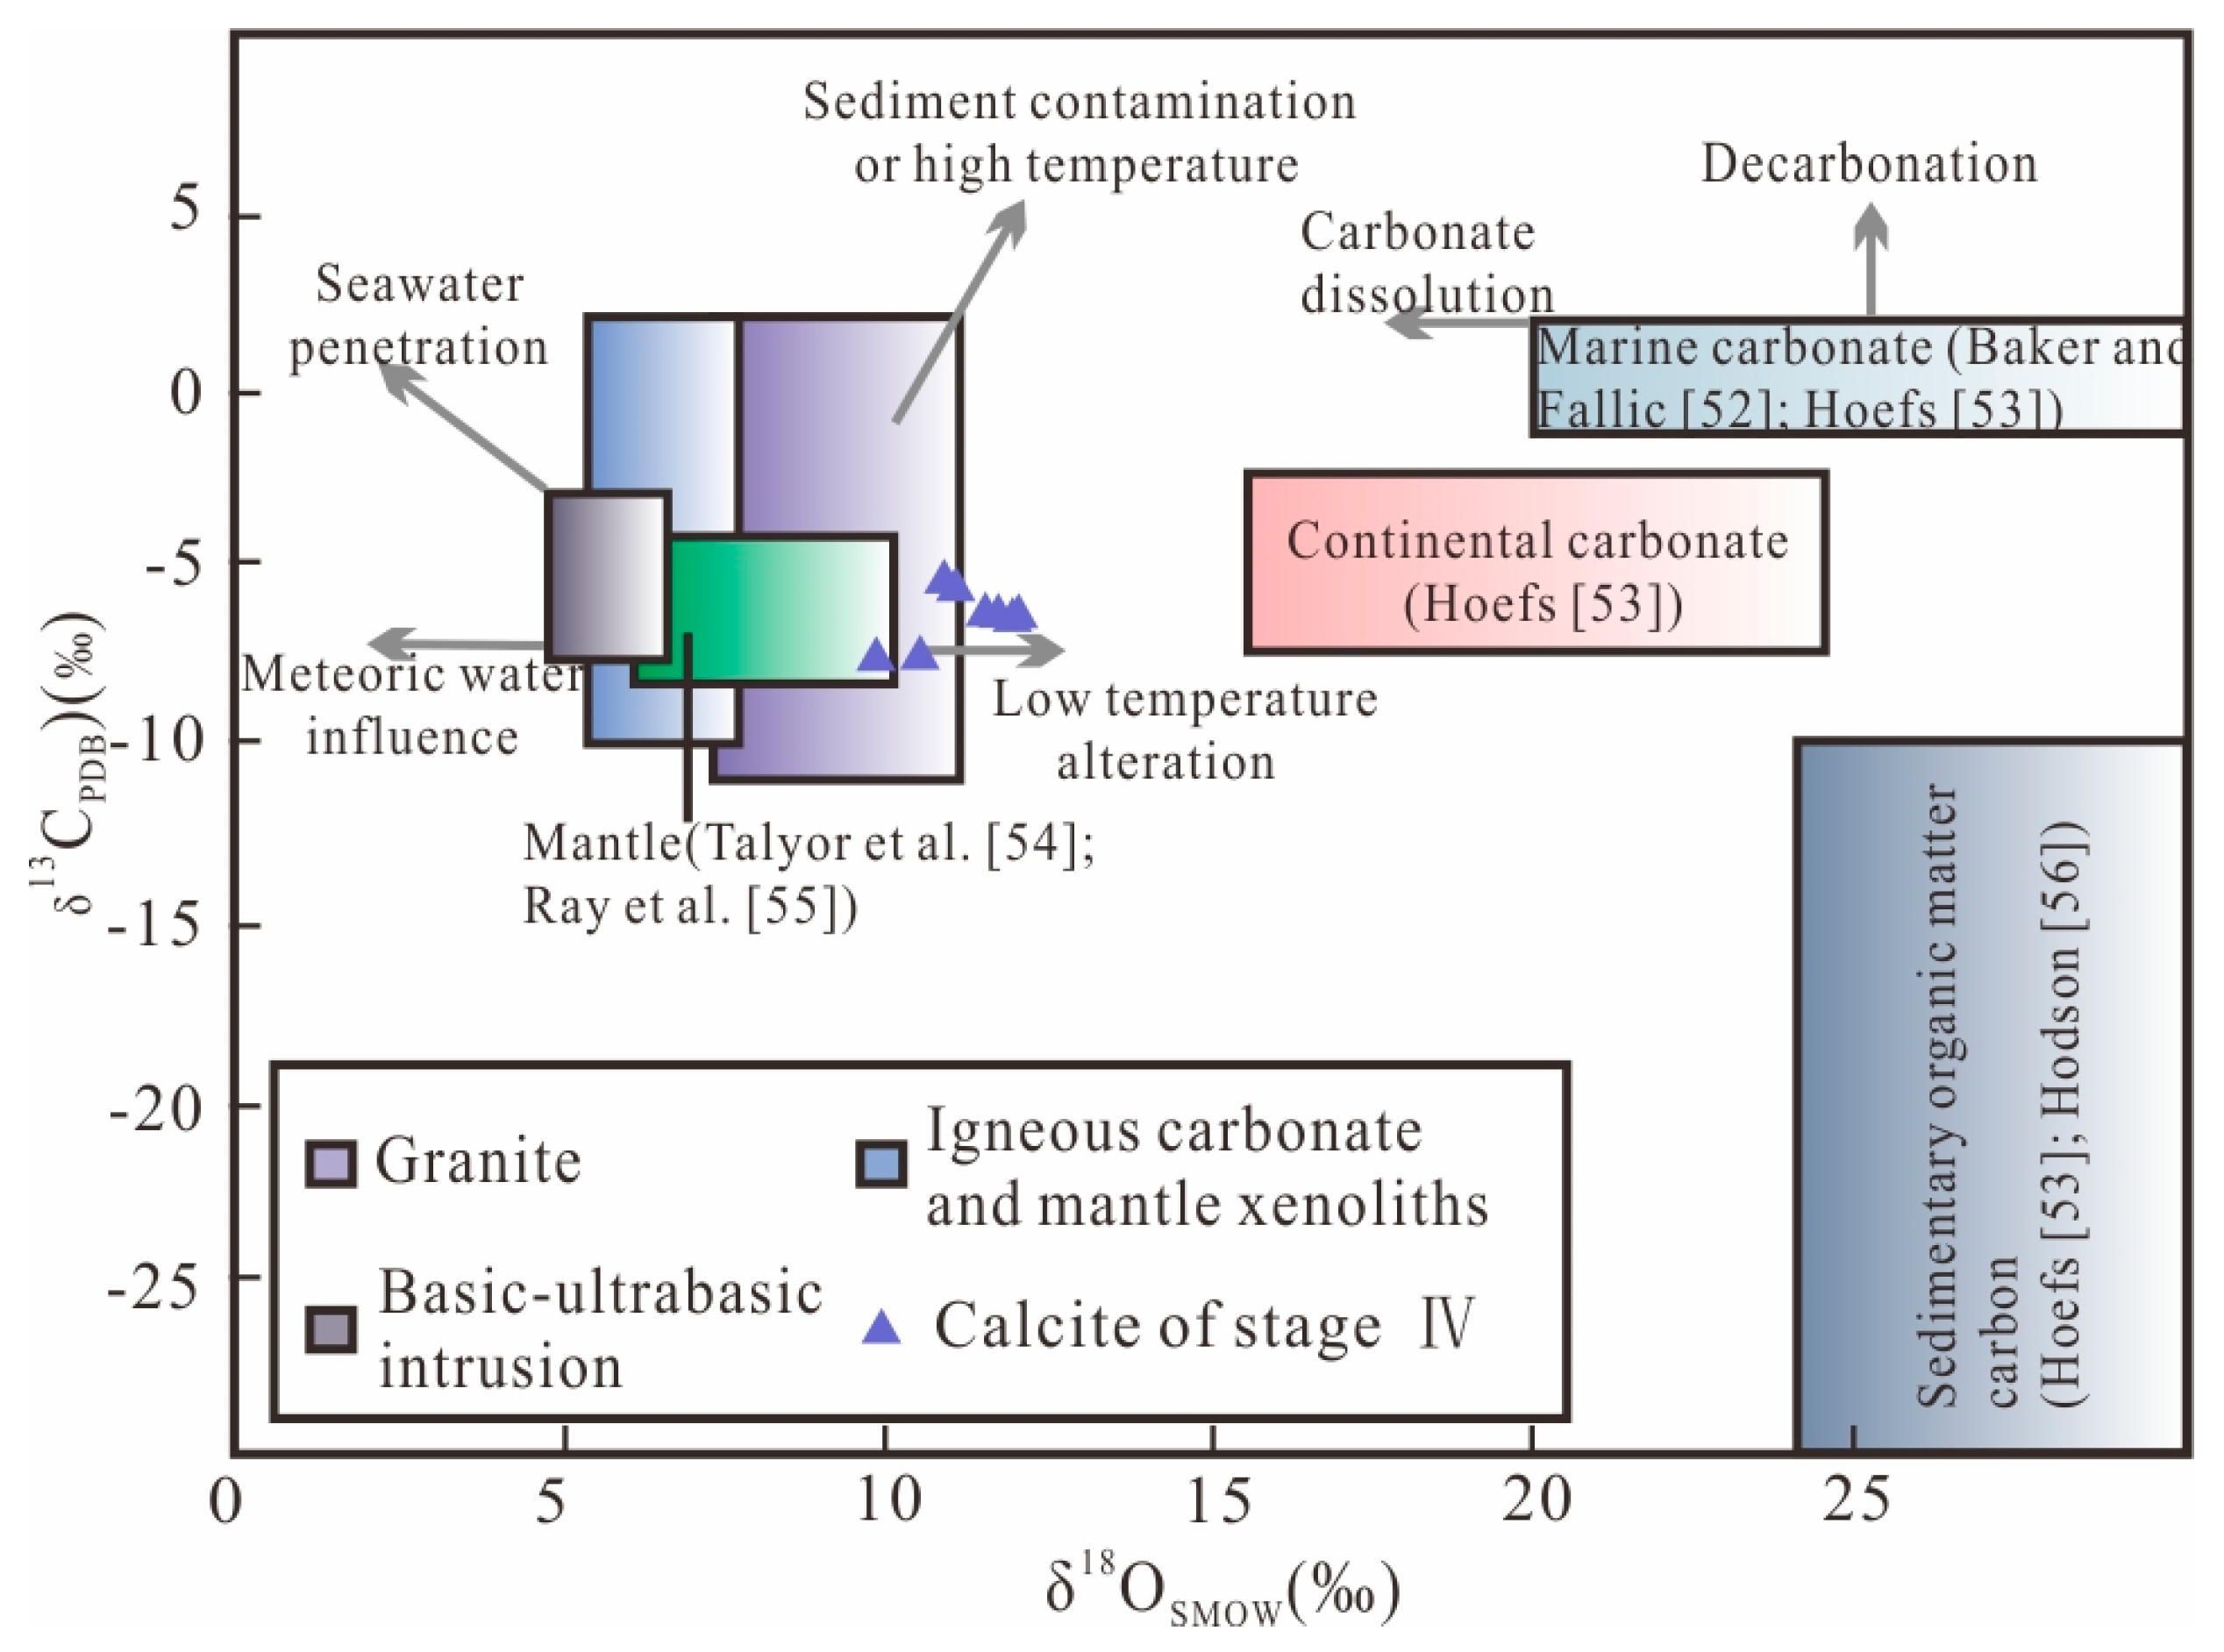
6.2. Carbon and Oxygen Isotopes

The C–O isotopic compositions of the carbonate samples from ore bodies M1, M9, M10, and M11 of the ore-forming stage IV, together with previously published data, are listed in Table 4. The δ13CPDB values range from −7.5‰ to −5.4‰, and δ18OSMOW values from 9.9‰ to 12.1‰.

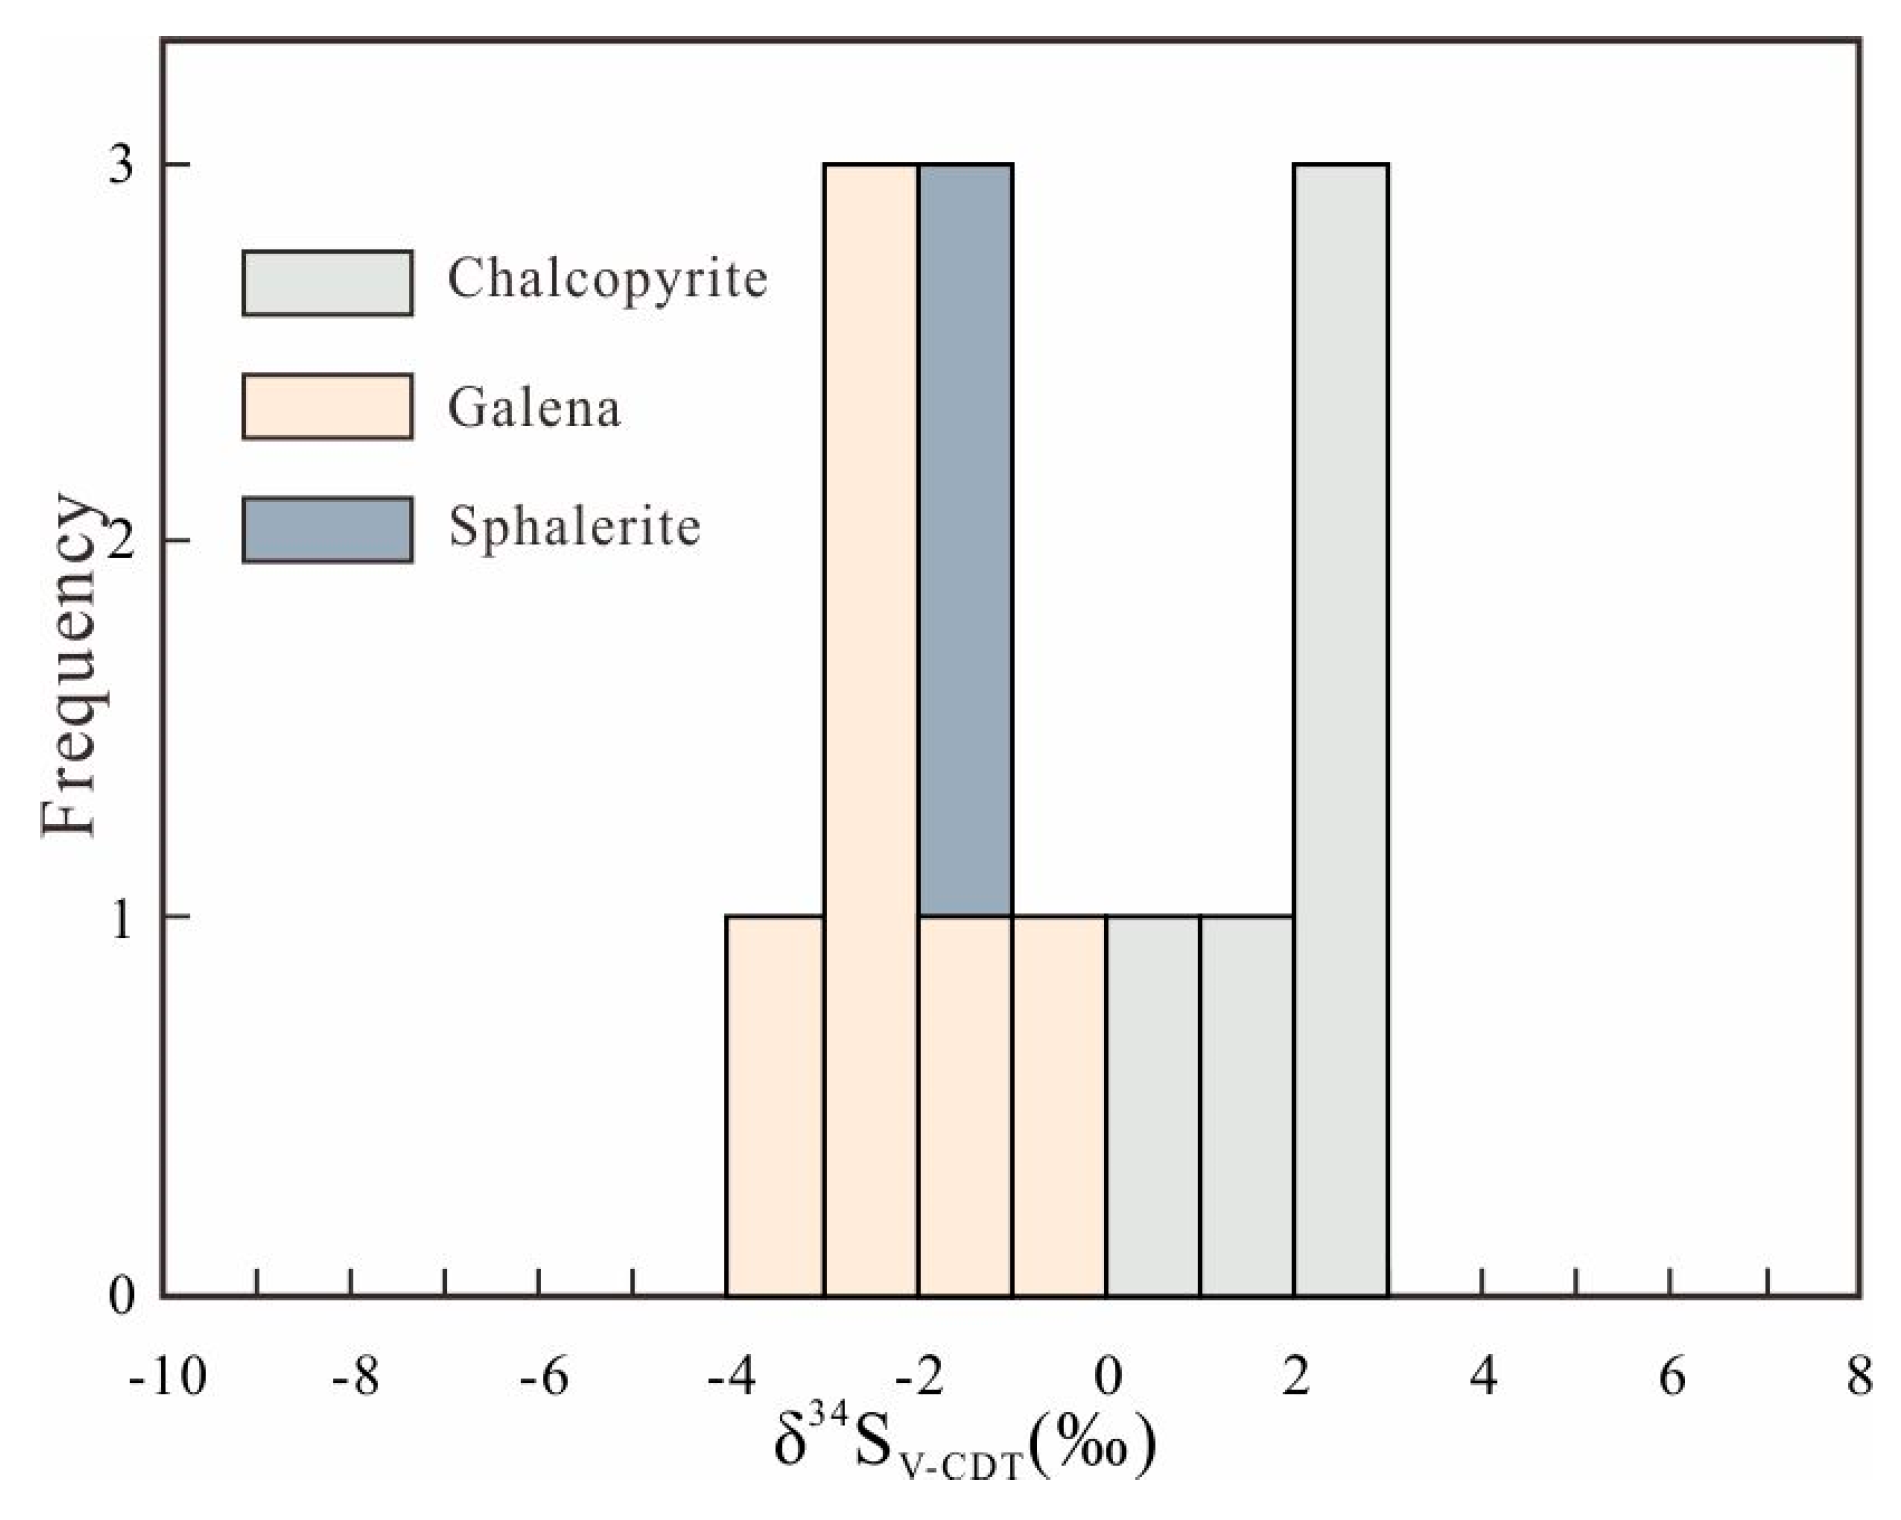
6.3. Sulfur Isotopes
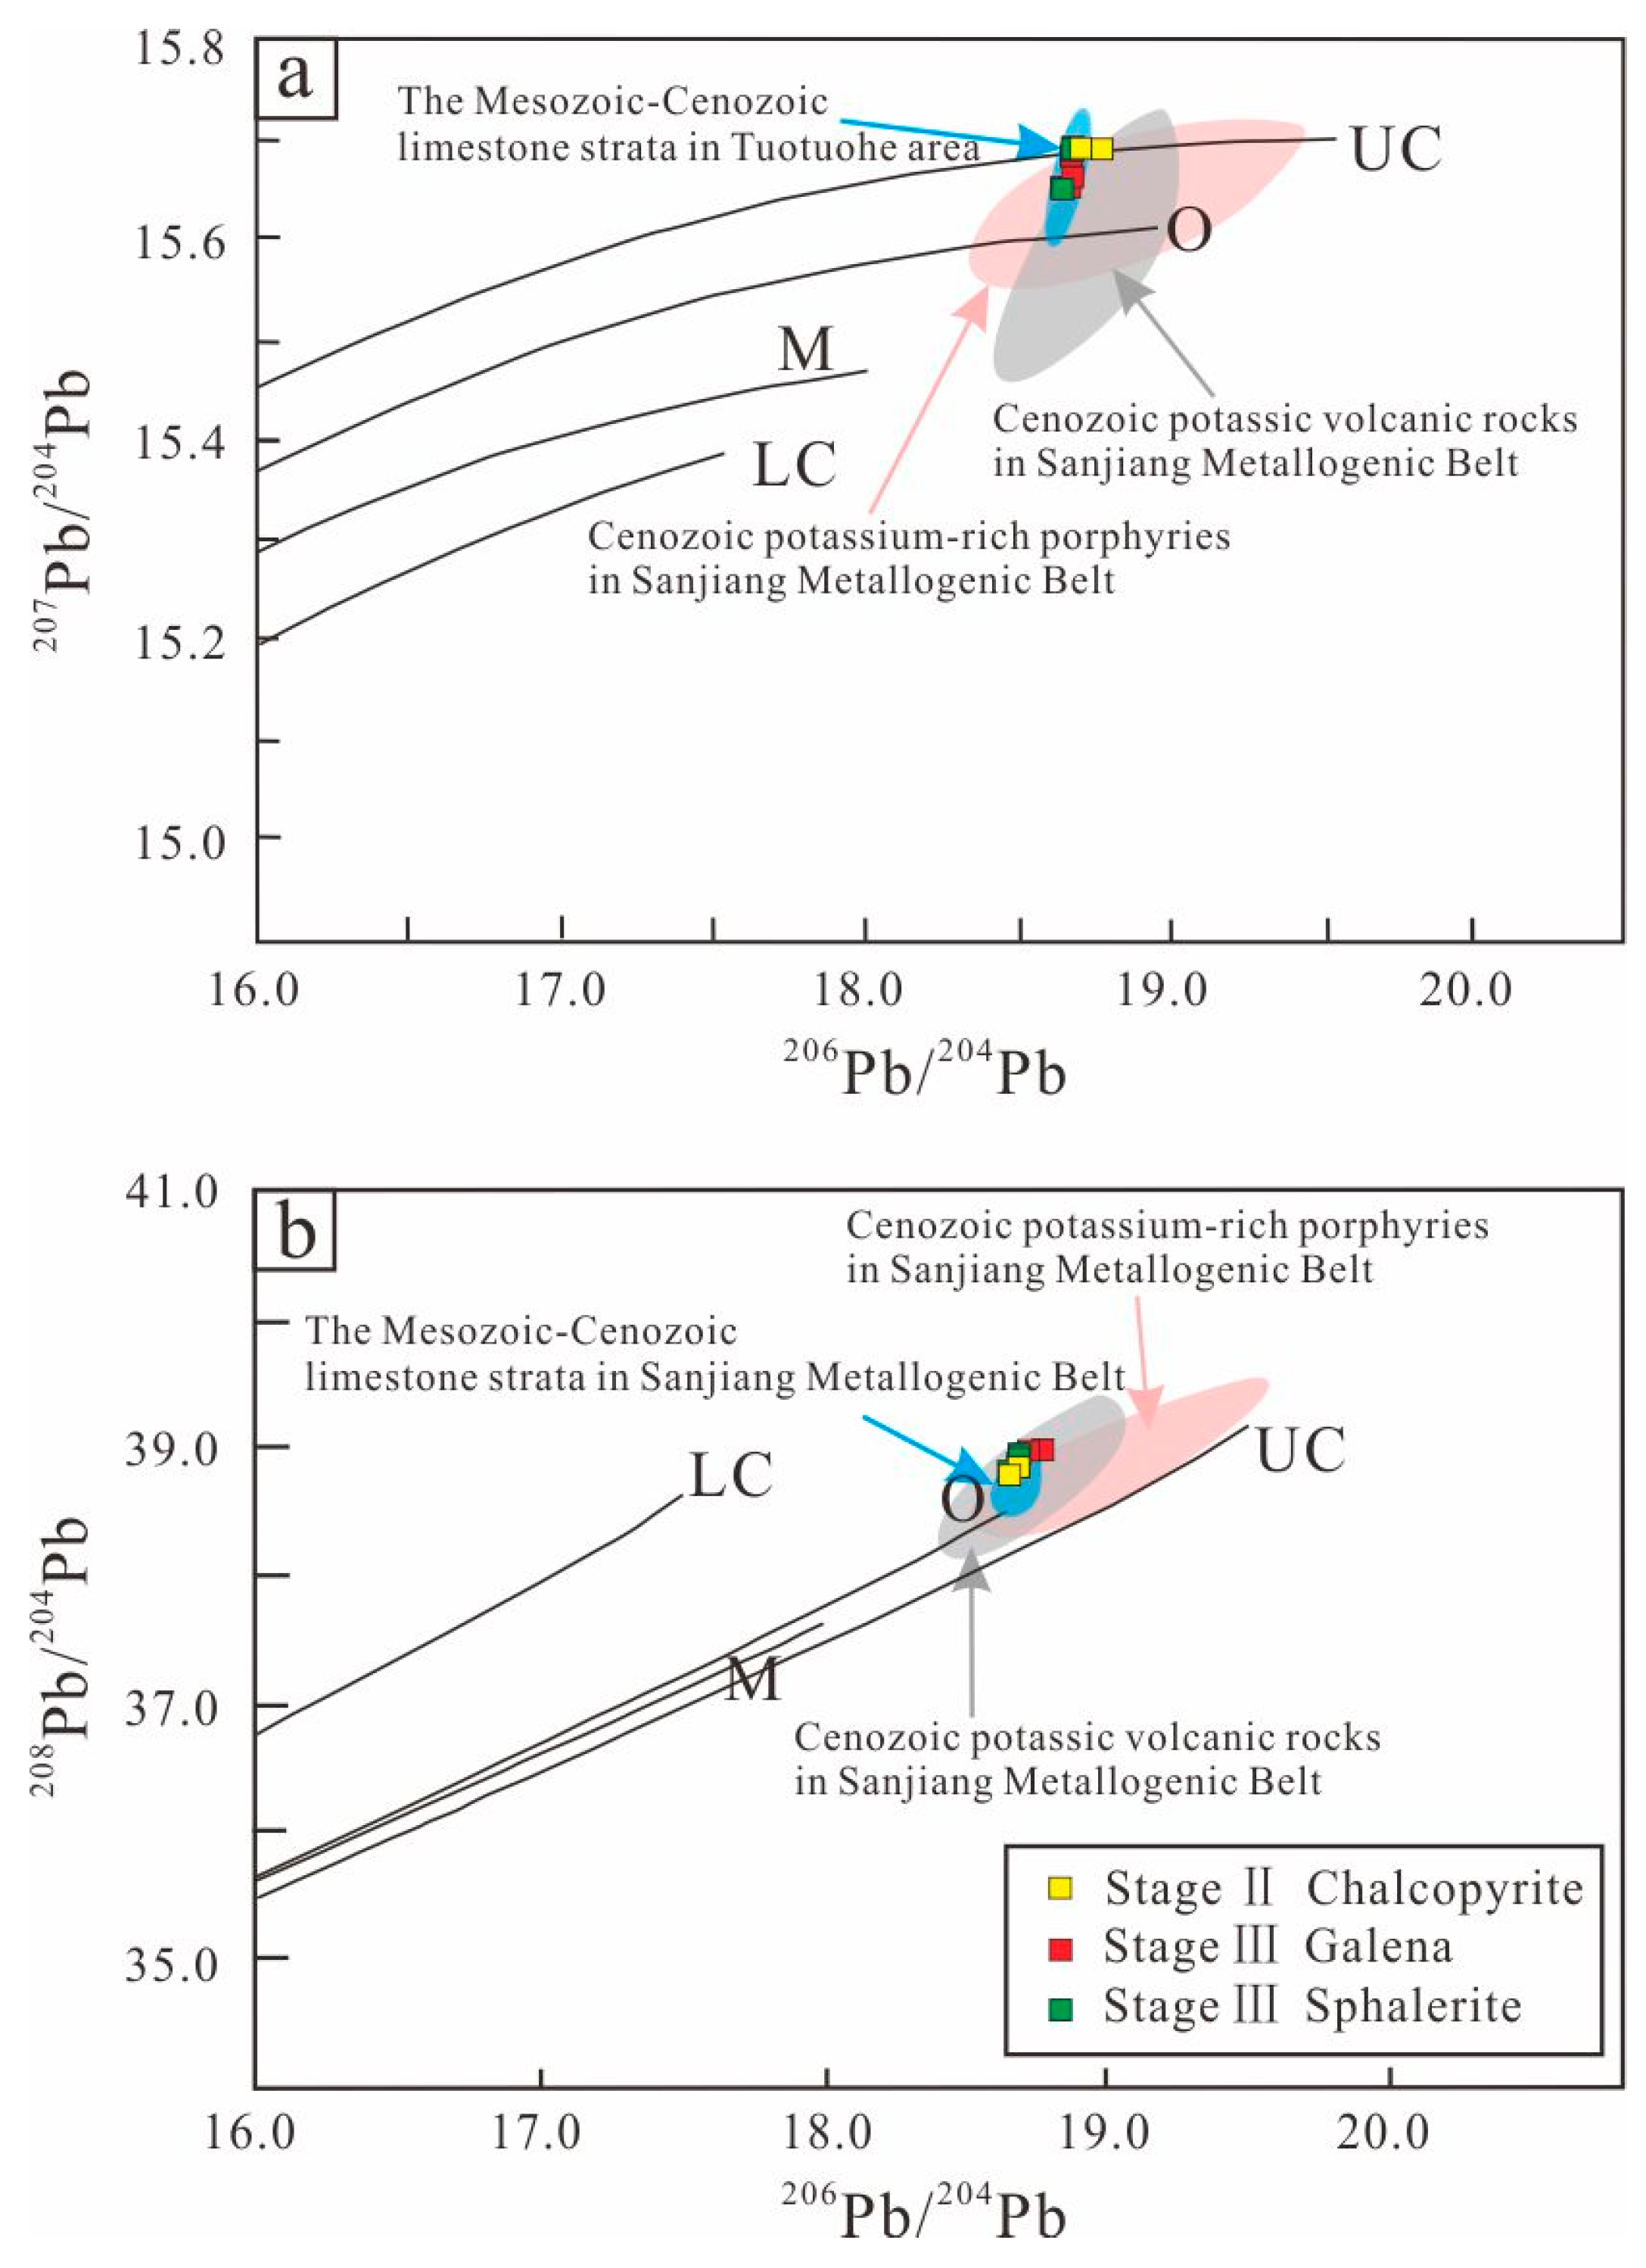
Sulfur isotopic compositions were determined for fourteen sulfide samples from ore bodies M9, M10, and M11 of the Chuduoqu deposit (Table 5). The δ34SCDT values of the sulfide range from −3.8‰ to 2.9‰ with a mean value of −0.5‰.

6.4. Lead Isotopes

Lead isotopic compositions of the sulfide samples from ore body M9, together with previously published data, are listed in Table 6. The 206Pb/204Pb ratios of these sulfides range from 18.652 to 18.773, the 207Pb/204Pb ratios from 15.651 to 15.694, and 208Pb/204Pb ratios from 38.803 to 39.014.

7. Discussion

7.1. Origin and Evolution of the Ore-Forming Fluids

The O and H isotopic compositions of selected minerals at different mineralization stages are widely used in the study of the source and evolution process of the hydrothermal fluids [45]. In the δ18OH2O–δ18DH2O diagram (Figure 9), the δ18OH2O values decrease from stage I to stage III, the δ18OH2O–δ18DH2O data from stage I plot close to the field of magmatic water (Figure 9), indicating that the magmatic fluid may play an important role in the development of ore-forming fluid. However, compared with typical magmatic water, the δ18DH2O values of the fluids we sampled are significantly lower than those for magmatic water (from −50‰ to −85‰) (Figure 9, [46]).
Previous studies [47,48] have suggested that a continuous degassing of parent magma in an open system would decrease the δ18DH2O values in the residual water during the late crystallization phase, whereas the influence on the δ18OH2O value would be less. We attribute this isotope change in the Chuduoqu Pb-Zn-Cu deposit to the continuous degassing of the parent magma in an open system. However, although we attempted to heat treat the sample to remove secondary inclusions prior to isotope analysis, it does not preclude the possibility that the low δ18DH2O value from stage I is affected by secondary fluid inclusions.
The δ18OH2O–δ18DH2O data from stage II and stage III are lower than the data from stage I (Figure 9). In practice, however, magmatic bodies emplaced at shallow levels in the earth’s crust may directly or indirectly interact with meteoric water [47]. Since the small amounts of H2O present in host magma, it should be easier for such processes to change the δ18DH2O values of magma than the δ18OH2O values [46]. Therefore, mixing between magmatic water and meteoric water may be a more plausible explanation for the low δ18DH2O values from stage II to stage III in the Chuduoqu Pb-Zn-Cu deposit. Furthermore, in the homogeneous temperature–salinity diagram (Figure 10), the salinity of the fluids decreases with drop of temperature, the data also suggest the occurrence of a fluid mixing.
The differences in the δ13CPDB values of various carbon pools mean that C isotope analysis is an important method for tracing the origin of ore-forming fluids. The δ13CPDB and δ18OSMOW values of the eight calcite vein samples of the hydrothermal ore-forming phase of the Chuduoqu deposit range from −7.5‰ to −5.4‰ and from 9.9‰ to 12.1‰, respectively. This range of δ13CPDB values lies within the established range of carbon isotope values for mantle or magmatic sources (from −9.0‰ to −3‰, [50]. In the δ13CPDB–δ18OSMOW diagram (Figure 11), the C–O isotope composition data for the calcite vein samples of mineralization stage IV fall in or around the granite field and parallel with the direction of low temperature alteration of granite, which shows that substantial volumes of magmatic water were still involved in the ore-forming process during late-stage mineralization.
FI components also provide information on the sources of ore-forming fluids. The Ca2+ content in the fluids of mineralization stage II samples has a range of 4.96–48.92 μg/g with a mean of 19.38 μg/g, the Mg2+ content has a range of 1.15–8.09 μg/g with a mean of 3.54 μg/g, the Na+ content has a range of 1.40–3.53 μg/g with a mean of 2.72 μg/g, and the K+ content has a range of 1.57–3.69 μg/g with a mean of 2.59 μg/g.
Calcium in the ore-forming fluid has two possible sources: One is through the mixing with a Ca-rich fluid end member and the other is through water-rock reaction [61], namely interaction between ore-forming fluid and carbonate wall rock, which can remobilize Ca2+ from carbonate wall rock into ore-forming fluid. However, the stable isotopic compositions show that the involved external fluid end member is meteoric water, which is characterized by low-temperature, low-salinity and free of Ca. The possibility of mixing with a Ca-rich fluid can therefore be ruled out. In the hydrothermal system of Chuduoqu Pb-Zn-Cu deposit, water-rock reaction significantly dissolved the carbonate wall rock, remobilizing Ca ion into ore-forming fluid. In the same way, Mg2+ in the ore-forming fluid is also interpreted as a result of water-rock reaction.
The Cl content of the fluids of stage II samples ranges from 2.73 μg/g to 10.64 μg/g with a mean of 6.32 μg/g, the SO42− content ranges from 5.53 μg/g to 55.12 μg/g with a mean of 20.86 μg/g, and the F content ranges from 0.04 μg/g to 0.33 μg/g with a mean of 0.15 μg/g. In summary, SO42− > Cl > F, meaning that the fluids of stage II were S-rich aqueous solutions. The fluids with a high S content provided an essential source of S for metal precipitation as sulfides.
The physical and chemical properties of the fluids in different mineralization stages are related to the complexity of the fluid source and evolution. Based on the H–O isotopic data, the C–O isotopic data and the fluid inclusion characteristics, the ore-forming fluids from stage I for the Chuduoqu Pb-Zn-Cu deposit were initially derived from magmatic water. In addition, from stage I to stage II, the homogenization temperatures of FIs show a decreasing trend, whereas the salinities are very similar, indicating a simple cooling process during the evolution of the ore-forming fluids (Figure 10, [49]). Commonly, evidence for fluid boiling could be provided by the coexistence of liquid-rich and vapor-rich fluid inclusion assemblages in the same growth zone or healed fractures [62,63]. Liquid-rich (L-type) and vapor-rich (V-type) fluid inclusions with contrast salinities (Table 1) coexist in the same petrographic assemblages in stage III (Figure 6d), indicating fluid boiling may take place in stage III. The ore-forming fluids from stage IV with characteristics of low temperature (144–233 °C) and salinity (2.07–7.02 wt. % NaCl equivalent) is closely associated with addition of large volumes of meteoric waters.
In summary, the ore-forming fluids in the Chuduoqu Pb-Zn-Cu deposit is characterized by medium to low temperature (144–370 °C), medium to low salinity (2.07–11.81 wt. % NaCl equivalent), and contains minor vapor component of CO2 and N2. The ore-forming fluids were mixed with a growing amount of meteoric water from stage II to stage IV, resulting in the decrease of fluid temperatures (evolved from 250 °C to 308 °C of stage II, from 230 °C to 294 °C of stage III, and eventually from 144 °C to 233 °C of stage IV) and salinities. FIs data from the Chuduoqu Pb-Zn-Cu deposit suggest a simple cooling process from stage I to stage II and a mixing process from stage II to stage IV (Figure 10); small scale fluid boiling did take place in stage III.

7.2. Source of the Ore-Forming Materials

Sulfur isotopes are the main mineralizing agents for sulfophile elements precipitated as sulfides and also play an important role in the precipitation and enrichment of the metallogenic material [53]. Of the sulfide samples from the Chuduoqu Pb-Zn-Cu deposit, the chalcopyrite has higher δ34SCDT values than the galena. The chalcopyrite formed earlier than the other sulfides, and the δ34SCDT values of the sulfides decreases systematically according to the established order of sulfide formation, implying that the main mineralization stage of the Chuduoqu deposit developed in a stable and uniform hydrothermal environment, reflecting the characteristics of fractional crystallization under equilibrium conditions.
The δ34SCDT values of the sulfides in the Chuduoqu Pb-Zn-Cu deposit range from −3.8‰ to 2.9‰, with a mean value of −0.5‰, showing that the source of S was homogeneous (Figure 12). The narrow range of δ34SCDT values for the ores indicates a magmatic signature [64,65]. The same processes were likely responsible in the formation of other deposits in the northern part of the Sanjiang Metallogenic Belt, as inferred from the consistency in S isotope data for the Quemocuo Pb-Zn deposit (2.3–3.4‰, [13]), the Nariniya Pb-Zn deposit (−0.1–1.8‰, [66]), and the Narigongma porphyry Cu–Mo deposit (3.9–8.0‰, [67]) (Figure 12).
In the diagram of Pb isotopic compositions (Figure 13), the samples all plot in the area between the orogenic belt and upper crust fields and along the line of orogenic belt evolution. These data indicate that the metallogenic material originated from the upper crust and the denudation of an orogenic belt.
A discontinuous high-K igneous province, controlled by intracontinental orogenesis [3] and crustal deformation, developed on the Tibetan Plateau during the late stage of India–Asia collision. These K-rich porphyries and associated K-rich volcanic rocks occur mainly in the central and eastern regions of the plateau, where mineralization is well developed. This high-K magmatism has been dated at 40–24 Ma [3,26,77] with a peak in activity at 35 ± 5 Ma [3]. Given the above, and regarding the source of metallogenic materials, previous studies have proposed a genetic relationship between the Cenozoic potassic magmatism [13,78] and the occurrence of Pb-Zn deposits in the northern part of the Sanjiang Metallogenic Belt. To further investigate this, we collated Pb isotope composition data for Mesozoic and Cenozoic limestone [76], Cenozoic potassic volcanic rock [69,70,71,72,73], and Cenozoic K-rich porphyry [74,75] in the Sanjiang region. The Pb isotope composition data for the ore in the Chuduoqu Pb-Zn-Cu deposit fall into the range of potassic magmatic rocks, and the Mesozoic–Cenozoic limestones in the Tuotuohe Basin have similar Pb isotope compositions to those of the Chuduoqu ore. Therefore, we infer that the dominant metallogenic source of the Chuduoqu deposit was a regional-scale potassic magmatic hydrothermal fluid system, with the ore-bearing Jurassic carbonate rocks providing a lesser contribution of metallogenic material.
The S and Pb isotopic compositions measured in the present study imply that the material source of the Chuduoqu Pb-Zn-Cu deposit was related to deep magmatic activity. Specifically, the formation of the ores was likely controlled by the syenite porphyry dykes, which are exposed in the study area, and possibly by other rocks at deep levels. The dyke and other igneous rocks provided both the heat source and the main metallogenic material for the formation of the Chuduoqu Pb-Zn-Cu deposit.

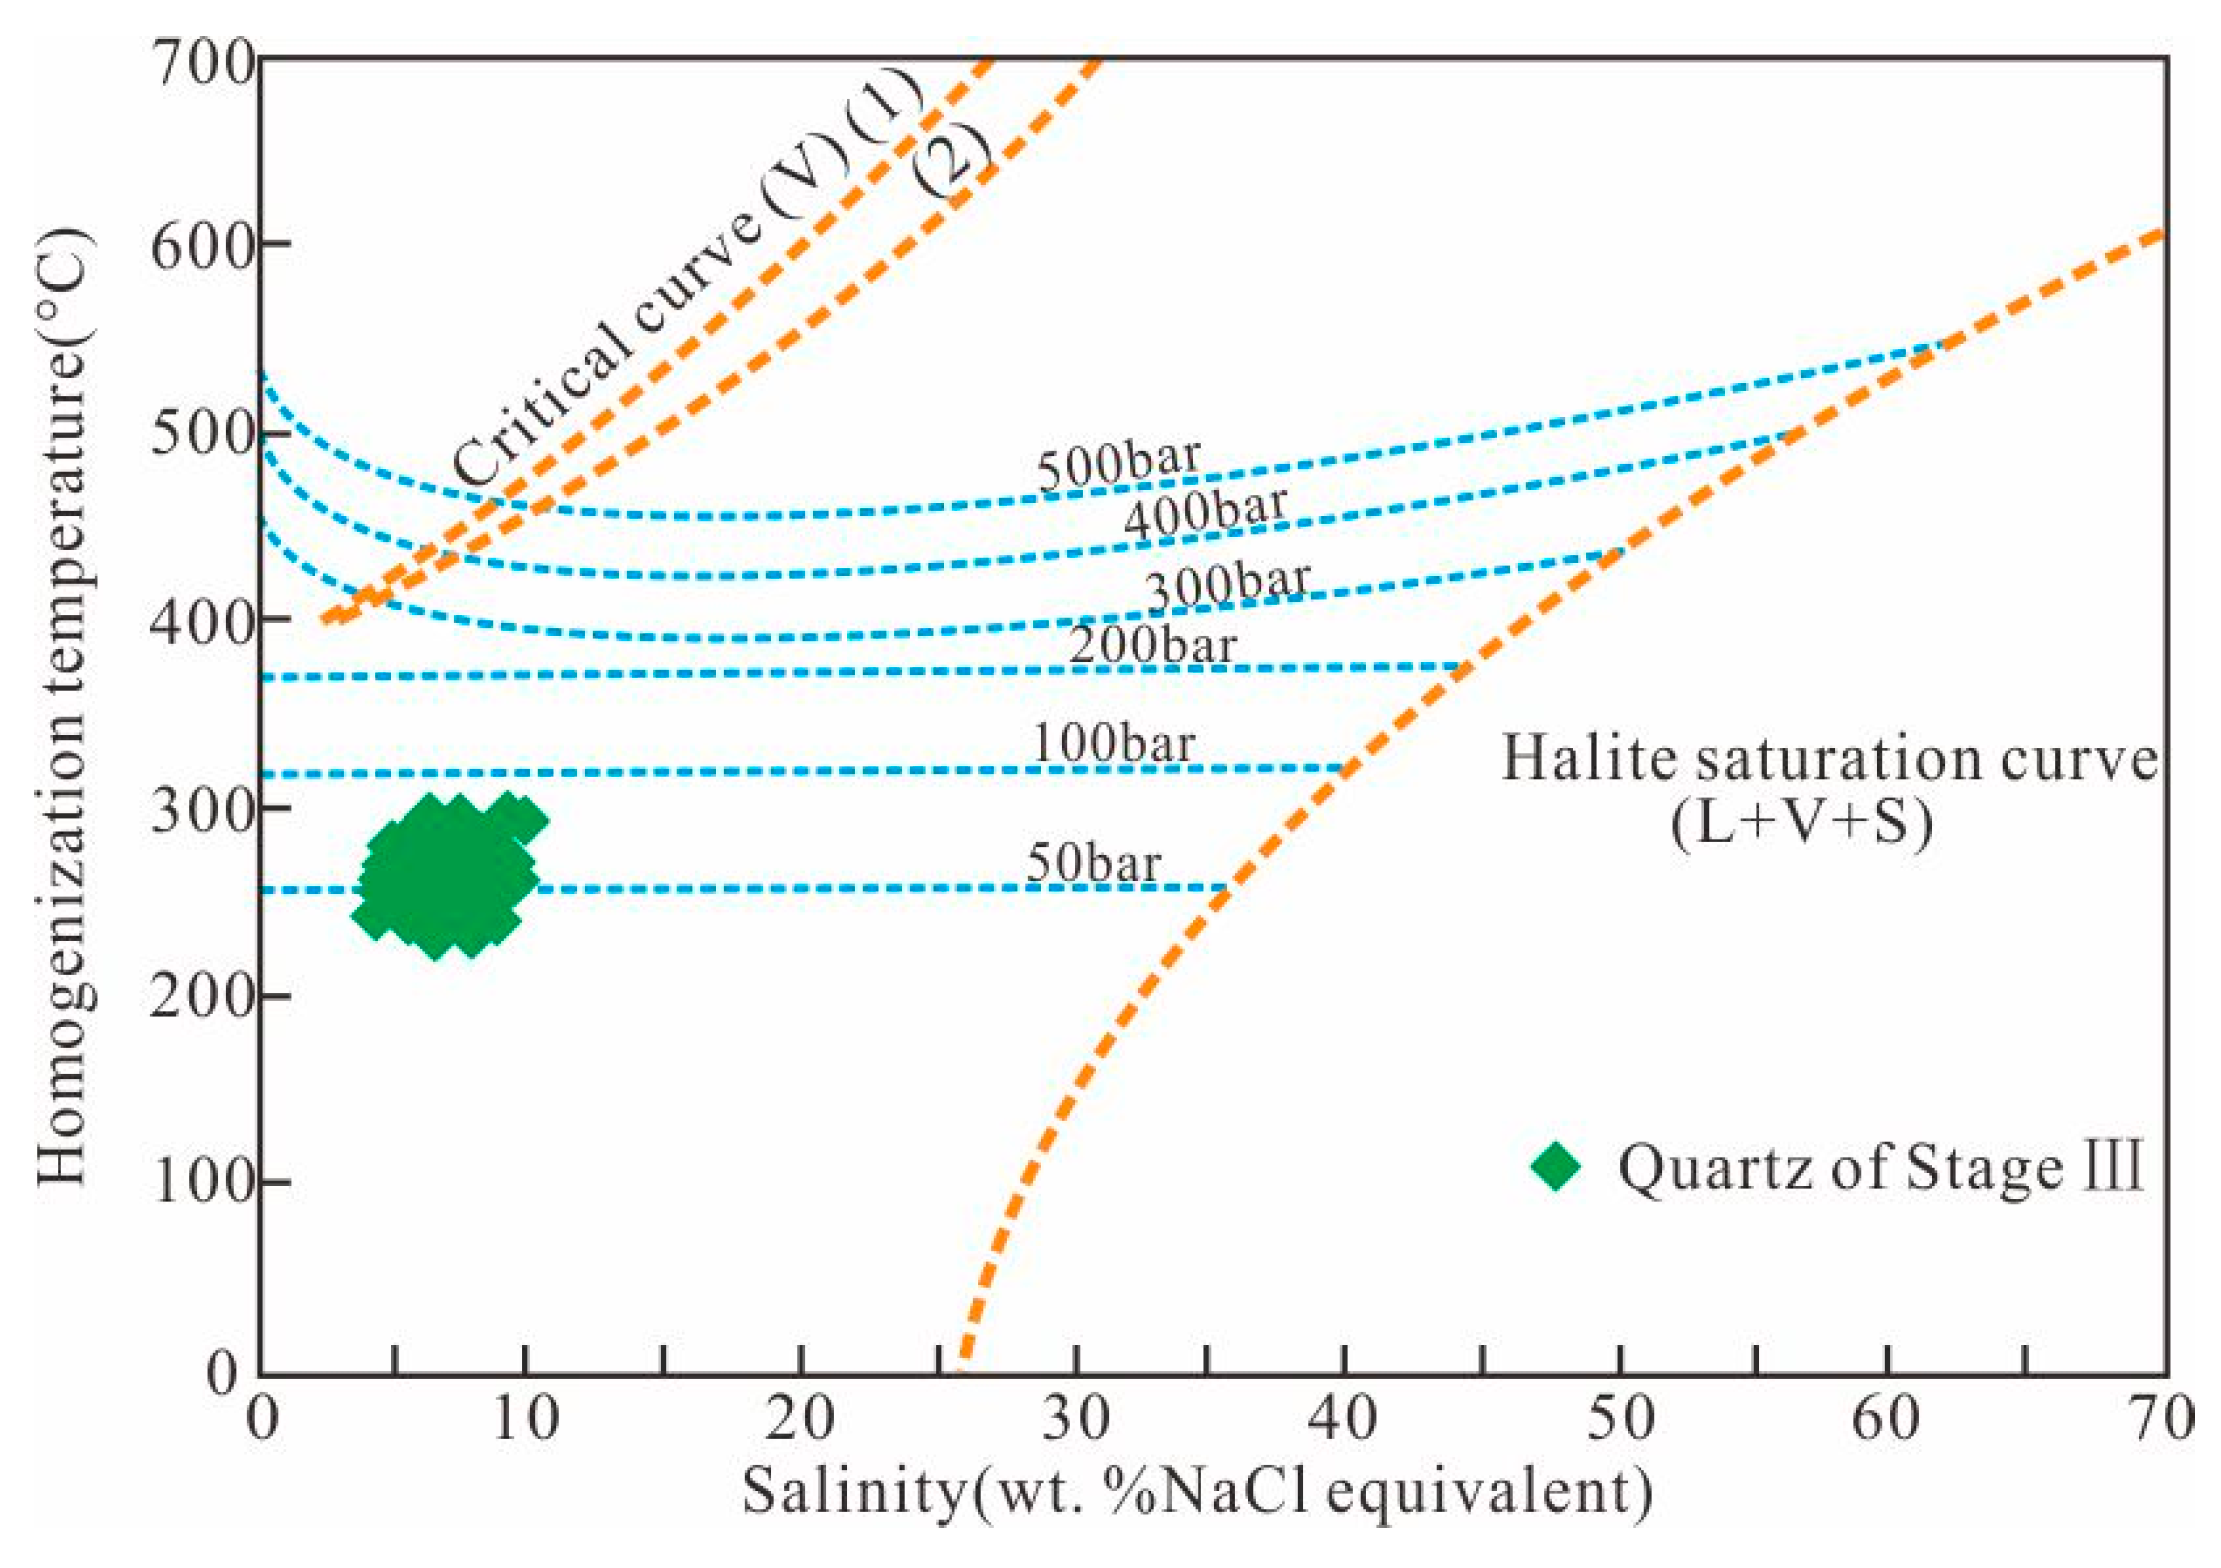
7.3. P-T Conditions of Ore Deposition

The trapping pressure of FIs can only be estimated when the actual trapping temperature is known, or if fluid boiling or immiscibility was occurring in the system at the time of entrapment (i.e., coeval liquid and/or saline- and vapor-rich inclusions with identical homogenization temperatures) [49,79]. As discussed earlier, in stage III, Liquid-rich (L-type) FIs are spatially associated with vapor-rich (V-type) FIs with similar homogenization temperatures and distinct salinities (Figure 6d). Petrographic and microthermometric data suggest that fluid boiling may take place in stage III. These conditions represent the best estimate of the ore-forming conditions in the Chuduoqu Pb-Zn-Cu deposit, the homogenization temperatures are interpreted to closely approximate the trapping temperatures [79]. Also, Roedder and Bodnar [80] assert that the presence of cations other than Na+ have little effect on the slopes of isochors and vapor pressure as compared to the NaCl-H2O. According to the formula given by Driesner and Heinrich [81], the trapping pressures during the ore-forming stage III are estimated to range from ∼3 to 8 MPa and are mostly concentrated at 5 MPa (Figure 14), which would correspond to depths of 0.3–0.8 km assuming hydrostatic conditions [82]. Hence, the initial Pb-Zn mineralization in the Chuduoqu Pb-Zn-Cu deposit mainly occurred at depths of less than 0.8 km, which is a shallow mineralization depth.

7.4. Ore Precipitation Mechanism

Experimental research has shown that Cu, Pb and Zn are transported as bisulfide complexes at high temperature, but as chloride complexes at low temperature in both low- and high-salinity fluids [83]. Taking into consideration that the fluid inclusions of the Chuduoqu Pb-Zn-Cu deposit are characterized by medium to low temperature (370–144 °C), it is likely that the copper, lead and zinc were transported mainly by chloride complexes of Pb2+, Zn2+ and Cu2+ in the ore-forming fluids.
Magmatic-hydrothermal deposits are formed by the instability of metal complexes [84,85]. The precipitation of sulfides from ore-forming fluids may be triggered by boiling [86,87], fluid mixing [88], cooling [89] and fluid-rock interaction [90].
Mineralization stage I: The FIs and H–O isotope compositional data indicate that the fluids were released from magma. As the temperature dropped to 370 °C, specularite and quartz started to precipitate.
Mineralization stage II: The fluids migrated upwards, and the temperature dropped below 308 °C. The ore-forming fluids were mixed with meteoric water from stage II to stage II according to the discussion in Section 7.1. The results show that the ore-forming fluids were diluted by external meteoric fluids with moderate temperatures and salinities, which is related to the deposition of copper-rich sulfide [91]. Fluid mixing between magmatic fluids and meteoric water could play an important role in the deposition of metals from ore-forming fluids [90]. In addition, the precipitation of specularite in stage II increased the Cu/Fe ratio, which changed the sulfur from S6+(S4+) to S2+, and reduced the solubility of copper in the fluids [92]. This was the main stage of Cu formation.
Mineralization stage III: Small scale fluid boiling occurred in some quartz from stage III; however, no boiling fluid inclusion assemblage was observed in other stages. The results show that fluid boiling was not the key factor to control the precipitation of lead, zinc and copper in the Chuduoqu Pb-Zn-Cu deposit. Fournier [93] believed that fluid cooling, along with the decrease of in temperature, salinity and pressure, increases the activity of S2−, and decomposition of the metal complex [94], may have been the most likely ore precipitation mechanism. As shown in Figure 10, the salinities of the ore-forming fluids in the Chuduoqu Pb-Zn-Cu deposit decreased with decreasing homogenization temperatures from stage I to stage IV. It is suggested that the cooling might be an important factor for the formation of Pb-Zn ore bodies. The sulfides could form by the following reactions:
ZnCl+ + HS → ZnS (sphalerite) + H+ + Cl
PbCl42− + HS → PbS (galena) + H+ + 4Cl
This was the main stage of Pb and Zn formation.
Mineralization stage IV: The ore-forming fluids migrated to the shallow subsurface. As the temperature dropped further, low-temperature sulfides such as pyrite were formed. The meteoric water could easily blend into the hydrothermal system because boiling of the ore fluids in stage III helps open the conduits and increases the permeability of the host rocks.

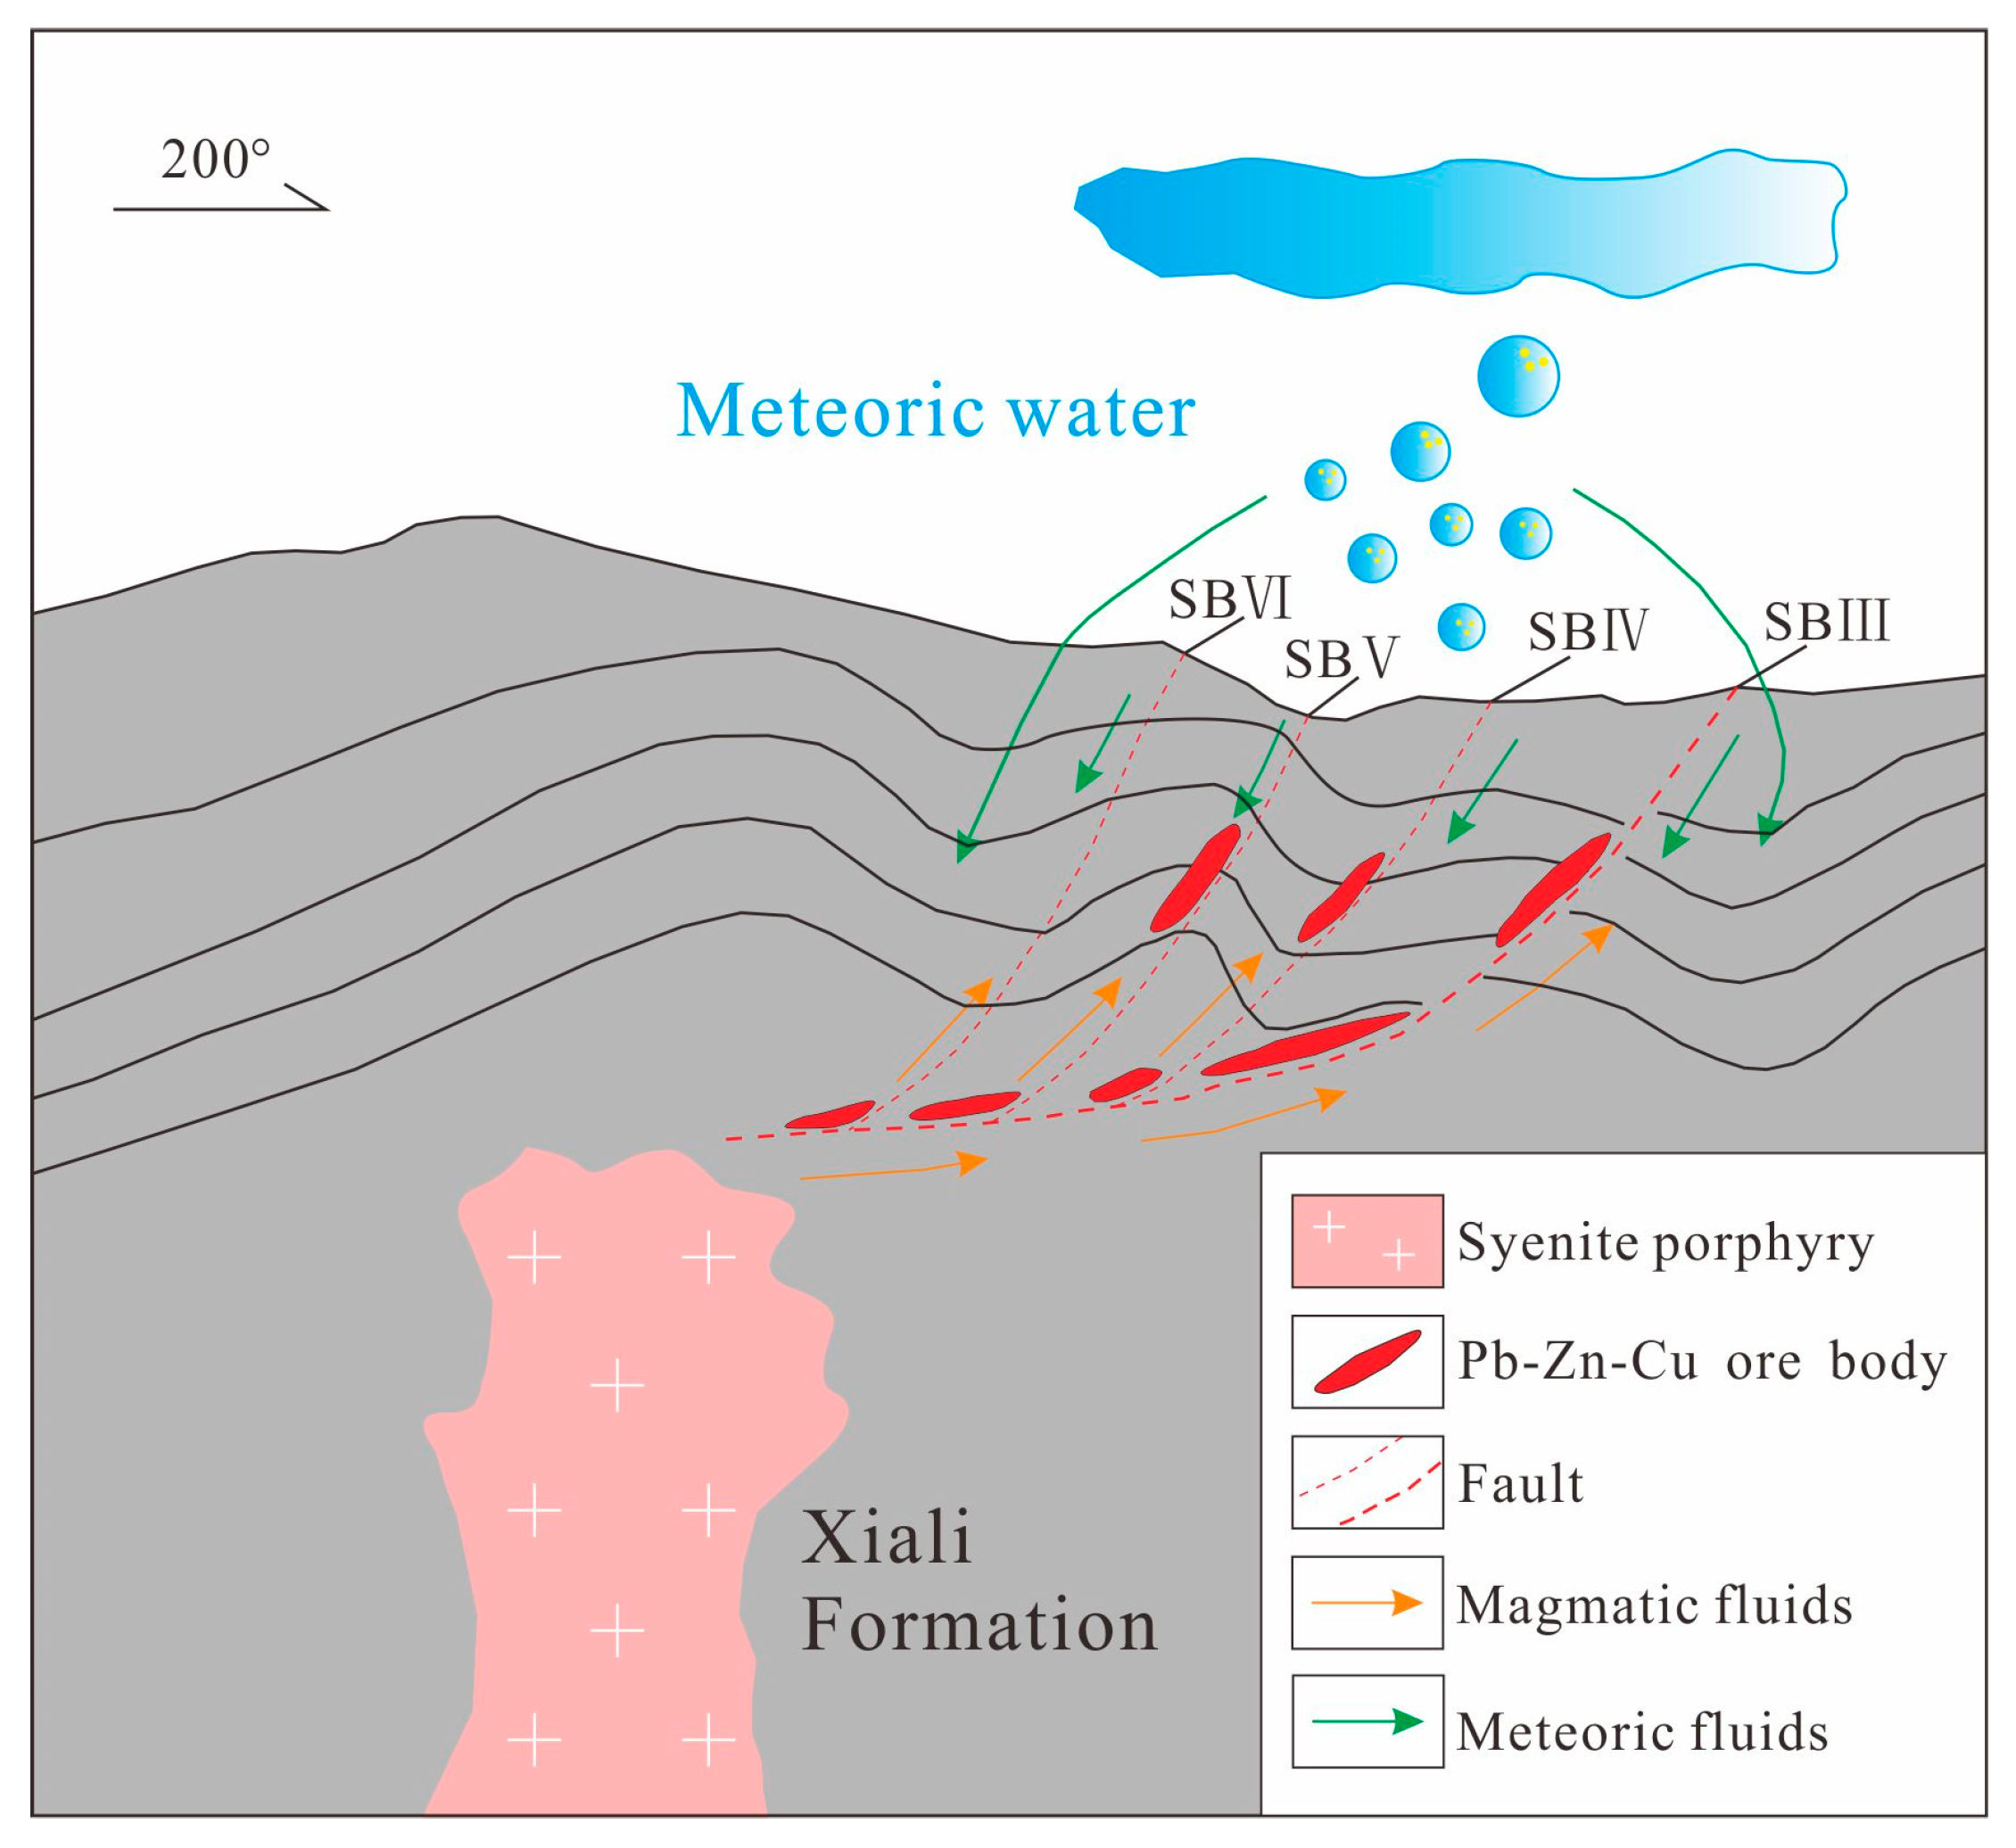
7.5. Metallogenic Model

Many geological and geochemical features of the Chuduoqu Pb-Zn-Cu deposit are consistent with the Cordilleran-type vein deposits [95,96,97]. These features include the following: (1) The deposit was formed in extensional faults; (2) The main metallogenic stage veins are rich in sulfide; (3) Vein formation is mainly under epithermal conditions at shallow levels (less than 0.8 km for the initial Pb-Zn mineralization, assuming hydrostatic conditions at Chuduoqu); (4) The hydrothermal fluids were characterized by medium to low salinity and temperatures below 370 °C; (5) The deposit have close spatial, temporal and genetic relationship with porphyry systems; (6) The ore-forming fluids were derived from a magmatic-hydrothermal system. However, the Chuduoqu Pb-Zn-Cu deposit also has some different characteristics as compared with the Cordilleran-type vein deposits. The differences include: (1) The Cordilleran-type deposits generally have a well-developed metal and alteration zonation in deposit scale [96], on the contrary, the Chuduoqu Pb-Zn-Cu deposit has no obvious metal and alteration zonation; (2) Cu-Zn-Pb-Au-Ag-(Bi-Sb) is a metal assemblage in the Cordilleran-type deposits, in which Au is a common metal element [97], whereas the Chuduoqu Pb-Zn-Cu deposit contain Cu-Pb-Zn-Ag without Au.
Hou et al. [3] analyzed collisional orogenesis on the Tibetan Plateau and identified three stages: primary collision (65–41 Ma), late collision (40–26 Ma), and post collision (25–0 Ma). India–Eurasia plate collision began at around 65 Ma, and the India plate was subducted northward until 41 Ma [2], causing N–S-directed tectonic compression [17,98,99] and accommodating at least 61 km [4] of shortening as well as forming a continental crust of twice the normal thickness. The shortening is ongoing [100].
During the late collision stage from 40 Ma, the thickened orogen was subjected to large-scale extension resulting from differentials in gravity potential and delamination. As a result of the gravitational instability, the lower crust and lithosphere mantle were removed and sunk together to the asthenosphere mantle. Subsequently, asthenosphere upwelling heated the lower-crust and upper-mantle rocks, leading to their partial melting. The resultant magma was a mixture of these partially melted rocks. The upwelling of magma along deep fractures and large-scale extensional faults formed volcanic, sub-intrusive, and intrusive rocks throughout the Sanjiang region. Ore-forming fluids were released from the magma as a result of decompression during ascent to shallower depths in the later stages of intrusive magma evolution. Phase-separated fluids mixed with meteoric water and exchanged material with surrounding rocks, then migrated to shallower regions to deposit various minerals. Disseminated and veinlet mineralization occurred during hydraulic fracturing when the ore-bearing fluids circulated around the hypabyssal intrusive mass, forming porphyry-type Cu polymetallic mineralization, such as that found in the Zhalaxiageyong, Nariniya, and Zhamuqu deposits. Ore-bearing fluids upwelled to shallower depths along deep fractures, and vein mineralization occurred along shallow extensional fractures, forming the Chuduoqu mesothermal hydrothermal vein Pb-Zn-Cu deposit (Figure 15).

8. Conclusions

(1) The ores of the Chuduoqu Pb-Zn-Cu deposit in central Tibet are hosted in limestone and sandstone of the Middle Jurassic Xiali Formation (J2x) and are structurally controlled by NWW-trending faults cutting the host sediments. The mineralization of the Chuduoqu Pb-Zn-Cu deposit can be divided into four stages: quartz–specularite (stage I), quartz–barite–chalcopyrite (stage II), quartz–polymetallic sulfide (stage III), and quartz–carbonate (stage IV).
(2) H, O, C, S, and Pb isotope data of samples from the Chuduoqu deposit reveal that the ore-forming fluids had a dominantly magmatic signature but were mixed with meteoric water. The most likely source of metallogenic material was a regional-scale potassic magmatic hydrothermal fluid system, and the mineralization occurred between 40 and 24 Ma. Specifically for the Chuduoqu Pb-Zn-Cu deposit, the magmatic activity of a syenite porphyry intrusion most probably provided the heat source and main metallogenic material for the mineralization.
(3) Fluid mixing and cooling mainly contributed to the ore precipitation. In addition, small scale fluid boiling did take place in some quartz from stage III.
(4) The Chuduoqu Pb-Zn-Cu deposit is a mesothermal hydrothermal vein deposit and shares many similar features with those of Cordilleran-type vein deposits worldwide, and it was formed in an extensional environment related to late intracontinental orogenesis caused by India–Asia collision.

Supplementary Materials

The following are available online at https://www.mdpi.com/2075-163X/9/5/285/s1, Table S1: Characteristics of main ore bodies in the Chuduoqu Pb-Zn-Cu deposit.

Author Contributions

Conceptualization, Y.S., B.L. and F.S.; Software, R.Y. and T.Z.; Investigation, Y.S., B.L., F.S., Y.Q. and J.D.; Data curation, R.Y. and T.Z.; Funding acquisition, B.L.; Project administration, B.L.; Writing—original draft preparation, Y.S.; Writing—review and editing, Y.S. and B.L.

Funding

This research was funded by Geological Survey Project (12120114080901) of China Geological Survey and the National Natural Science Foundation of China (41272093 and 41272095).

Acknowledgments

We would like to thank the Analysis and Testing Research Center of Nuclear Industry, Beijing Institute of Geology, Beijing, China, and the Experimental Center of Testing Science, Jilin University, China for helping in the analyses.

Conflicts of Interest

The authors declare no conflict of interest.

References

  1. Zhu, D.C.; Zhao, Z.D.; Niu, Y.L.; Dilek, Y.; Hou, Z.Q.; Mo, X.X. The origin and pre-Cenozoic evolution of the Tibetan Plateau. Gondwana Res. 2013, 23, 1429–1454. [Google Scholar] [CrossRef]
  2. Hou, Z.Q.; Song, Y.C.; Li, Z.; Wang, Z.L.; Yang, Z.M. Thrust-controlled, sediments-hosted Pb-Zn –Ag–Cu deposits in eastern and northern margins of Tibetan orogenic belt: Geological features and tectonic model. Miner. Depos. 2008, 27, 123–144. (In Chinese) [Google Scholar]
  3. Hou, Z.Q.; Pan, G.T.; Wang, A.J.; Mo, X.X.; Tian, S.H. Metallogenesis in Tibetan collisional orogenic belt: II. Mineralization in late-collisional transformation setting. Miner. Depos. 2006, 25, 521–543. (In Chinese) [Google Scholar]
  4. Spurlin, M.S.; Yin, A.; Horton, B.K.; Zhou, J.; Wang, J. Structural evolution of the Yushu-Nangqian region and its relationship to syncollisional igneous activity, east-central Tibet. Geol. Soc. Am. Bull. 2005, 117, 1293–1317. [Google Scholar] [CrossRef]
  5. Liu, D.; Zhao, Z.D.; Zhu, D.C.; Niu, Y.; DePaolo, D.J.; Harrison, T.M.; Mo, X.; Dong, G.; Zhou, S.; Sun, C.; et al. Postcollisional potassic and ultrapotassic rocks in southern Tibet: Mantle and crustal origins in response to India-Asia collision and convergence. Geochim. Cosmochim. Acta 2014, 143, 207–231. [Google Scholar] [CrossRef]
  6. Deng, J.; Wang, Q.F. Gold mineralization in China: Metallogenic provinces, deposit types and tectonic framework. Gondwana Res. 2016, 36, 219–274. [Google Scholar] [CrossRef]
  7. Li, G.J.; Wang, Q.F.; Huang, Y.H.; Gao, L.; Li, Y. Petrogenesis of Middle Ordovician peraluminous granites in the Baoshan block: Implications for the Early Paleozoic tectonic evolution along East Gondwana. Lithosphere 2016, 245, 76–92. [Google Scholar] [CrossRef]
  8. Xue, C.J.; Wang, R.; Liu, S.W.; Chi, G.X.; Qing, H.R.; Chen, Y.C.; Yang, J.M.; Wang, D.H. Geologic, fluid inclusion and isotopic characteristics of the Jinding Zn-Pb deposit, western Yunnan, South China: A review. Ore Geol. Rev. 2007, 31, 337–359. [Google Scholar] [CrossRef]
  9. He, L.Q.; Song, Y.C.; Chen, K.X.; Hou, Z.Q.; Yu, F.M.; Yang, Z.S.; Wei, J.Q.; Li, Z.; Liu, Y.C. Thrust-controlled, sediment-hosted, Himalayan Zn-Pb-Cu-Ag deposits in the Lanping foreland fold belt, eastern margin of Tibetan Plateau. Ore Geol. Rev. 2009, 36, 106–132. [Google Scholar] [CrossRef]
  10. Liu, Y.C.; Hou, Z.Q.; Yang, Z.S.; Tian, S.; Song, Y.; Yu, Y.; Ma, W. Geology and chronology of the Zhaofayong carbonate-hosted Pb-Zn ore cluster: Implication for regional Pb-Zn metallogenesis in the Sanjiang belt, Tibet. Gondwana Res. 2016, 35, 15–26. [Google Scholar] [CrossRef]
  11. Liu, Y.C.; Hou, Z.Q.; Yang, Z.S.; Tian, S.H.; Yang, T.N.; Song, Y.C.; Zhang, H.R.; Carranza, E.J.M. Formation of the Dongmozhazhua Pb-Zn deposit in the thrust-fold setting of the Tibetan plateau, China: Evidence from fluid inclusion and stable isotope data. Resour. Geol. 2011, 61, 384–406. [Google Scholar] [CrossRef]
  12. Liu, Y.C.; Yang, Z.S.; Tian, S.H.; Song, Y.C.; Zhang, H.R. Fluid origin of fluorite-rich carbonate-hosted Pb-Zn mineralization of the Himalayan–Zagros collisional orogenic system: A case study of the Mohailaheng deposit, Tibetan Plateau, China. Ore Geol. Rev. 2015, 70, 546–561. [Google Scholar] [CrossRef]
  13. Qian, Y. Metallogenic Setting and Metallogenesis Lead and Zinc in Tuotuohe Region, Qinghai-Tibet Plateau. Ph.D. Thesis, Jilin University, Changchun, China, 2014. (In Chinese). [Google Scholar]
  14. Song, Y.C.; Hou, Z.Q.; Wang, G.R.; Liu, Y.C.; Tian, S.H.; Yang, Z.S.; Liu, Y.X.; Zhang, H.R.; Yang, T.N.; LI, L.S. Metallogenic regularity and ore exploration targeting in Tuotuohe area, northern Sanjiang orogenic belt. Miner. Depos. 2015, 1, 1–20. (In Chinese) [Google Scholar]
  15. Sun, Y.G. Study on Ore-Controlling Structure Characteristics and Ore Genesis of Chuduoqu Lead-Zinc Mine in Tuotuohe Region, Qinghai Province. Master’s Thesis, Jilin University, Changchun, China, 2016. (In Chinese). [Google Scholar]
  16. Song, Y.C.; Yang, T.N.; Zhang, H.R.; Liu, Y.C.; Hao, H.D.; Li, Z. The Chaqupacha Mississippi Valley-type Pb-Zn deposit, central Tibet: Ore formation in a fold and thrust belt of the India-Asia continental collision zone. Ore Geol. Rev. 2015, 70, 533–545. [Google Scholar] [CrossRef]
  17. Yin, A.; Harrison, T.M. Geologic Evolution of the Himalayan-Tibetan Orogen. Annu. Rev. Earth Planet. Sci. 2000, 28, 211–280. [Google Scholar] [CrossRef]
  18. Li, Y.L.; Wang, C.S.; Zhao, X.X.; Yin, A.; Ma, C. Cenozoic thrust system, basin evolution, and uplift of the Tanggula Range in the Tuotuohe region, central Tibet. Gondwana Res. 2012, 22, 482–492. [Google Scholar] [CrossRef]
  19. Yang, T.N.; Zhang, H.R.; Liu, Y.X.; Wang, Z.L.; Song, Y.C.; Yang, Z.S.; Tian, S.H.; Xie, H.Q.; Hou, K.J. Permo-Triassic arc magmatism in central Tibet: Evidence from zircon U–Pb geochronology, Hf isotopes, rare earth elements, and bulk geochemistry. Chem. Geol. 2011, 284, 270–282. [Google Scholar] [CrossRef]
  20. Yang, T.N.; Hou, Z.Q.; Wang, Y.; Zhang, H.R.; Wang, Z.L. Late Paleozoic to Early Mesozoic tectonic evolution of northeast Tibet: Evidence from the Triassic composite western Jinsha–Garzê–Litang suture. Tectonics 2012, 31, 1–20. [Google Scholar] [CrossRef]
  21. Li, Y.L.; Wang, C.S.; Ma, C.; Xu, G.Q.; Zhao, X.X. Balanced cross-section and crustal shortening analysis in the Tanggula-Tuotuohe area, northern Tibet. J. Earth. Sci. 2011, 22, 1–10. [Google Scholar] [CrossRef]
  22. Zhang, Y.X.; Zhang, K.J.; Li, Y.; Li, B.; Xie, Y. Characteristics and sedimentary facies of the Middle-Upper Jurassic clastic rocks in Qiangtang Basin, Tibet. Geo Meta. 2007, 31, 51–62. (In Chinese) [Google Scholar]
  23. Qian, Y.; Sun, F.Y.; Li, B.L.; Li, S.J.; Zhao, J.W. Early Permian-Late Triassic Magmatism in the Tuotuohe Region of the Qinghai-Tibet Plateau: Constraints on the Tectonic evolution of the Western Segment of the Jinshajiang Suture. Acta Geol. Sin. 2014, 88, 498–516. (In Chinese) [Google Scholar] [CrossRef]
  24. Hao, H.D.; Song, Y.C.; Li, L.S.; Jia, Z.Y.; Wang, Y.K.; Liu, Q. Characteristics of Breccias and C-O-Sr-S Isotope Geochemistry of the Duocaima Pb-Zn Deposit in Tuotuohe, Qinghai Province: Implications for the Ore-forming Process. Acta Geol. Sin. 2015, 89, 1568–1587. (In Chinese) [Google Scholar]
  25. Li, Y.L.; Wang, C.S.; Yi, H.S.; Liu, Z.F.; Li, Y. Cenozoic Thrust System and Uplifting of the Tanggula Mountain, Northern Tibet. Acta Geol. Sin. 2006, 80, 1118–1130. (In Chinese) [Google Scholar]
  26. Wang, J.H.; Yin, A.; Harrison, T.M.; Grove, M.; Zhang, Y.Q.; Xie, G.H. A tectonic model for Cenozoic igneous activities in the eastern Indo-Asian collision zone. Earth Planet Sci. Lett. 2001, 188, 123–133. [Google Scholar] [CrossRef]
  27. Ding, L.; Zhou, Y.; Zhang, J.J.; Deng, W.M. Geologic relationships and geochronology of the Cenozoic volcanoes and interbedded weathered mantles of Yulinshan in Qiangtang, North Tibet. Chin. Sci. Bull. 2000, 45, 2214–2220. (In Chinese) [Google Scholar] [CrossRef]
  28. Lai, S.C.; Liu, C.Y.; O'Reilly, S.Y. Petrogenesis and its significance to continental dynamics of the Neogene high-potassium calc-alkaline volcanic rock association from north Qiangtang, Tibetan Plateau. Sci. Chin. Ser. D 2001, 44, 44–45. (In Chinese) [Google Scholar] [CrossRef]
  29. Xia, L.Q.; Li, X.M.; Ma, Z.P.; Xu, X.Y.; Xia, Z.C. Cenozoic volcanism and tectonic evolution of the Tibetan plateau. Gondwana Res. 2010, 19, 850–866. [Google Scholar] [CrossRef]
  30. Li, Z. The ore Forming Genesis Research of Chaqupacha Lead–Zinc Deposits in Qinghai Province Tuotuohe Area. Master’s Thesis, Beijing University of Science and Technology, Beijing, China, 2008. (In Chinese). [Google Scholar]
  31. Sun, J.; Li, B.L.; Zhao, G.Q.; Liu, Y.F.; Zhang, J.Y. Zircon U-Pb chronology and geochemistry of Basihu diorite in Tuotuohe area,Qinghai-Tibetan Plateau. J. Guilin Univ. Technol. 2018, 38, 25–33. (In Chinese) [Google Scholar]
  32. Duan, Z.M.; Li, Y.; Zhang, Y.; Li, Y.L.; Wang, M. Zircon U–Pb age, continent dynamics significance and geochemical characteristics of the Mesozoic and Cenozoic granites from the Tanggula Range in the Qinghai-Tibet plateau. Acta Geol. Sin. 2005, 79, 88–97. (In Chinese) [Google Scholar]
  33. Li, L.; Bai, Y.S.; Niu, Z.J.; Yao, H.Z.; Duan, Q.F. The ultrabasic and basic rocks and their tectonic settings in the Qoimaco region, Qiangtang on the Qinghai-Xizang Plateau. Se. Geo. Teth. Geo. 2004, 24, 27–34. (In Chinese) [Google Scholar]
  34. Wang, G.Z. Study on Geological Features and Genetic of Zhalaxiageyong Cu-Pb-Zn Deposit in the Tuotuohe Area, Qinghai. Master’s Thesis, Jilin University, Changchun, China, 2017. (In Chinese). [Google Scholar]
  35. Roger, F.; Tapponnier, P.; Arnaud, N.; Schärer, U.; Brunel, M.; Zhiqin, X.; Jingsui, Y. An Eocene magmatic belt across central Tibet: Mantle subduction triggered by the Indian collision. Terra Nova. 2000, 12, 102–108. [Google Scholar] [CrossRef]
  36. Roedder, E. Fluid inclusions. Rev. Miner. 1984, 12, 1–644. [Google Scholar]
  37. Clayton, W.M.; Mayeda, T.K. The use of bromine pent a fluoride in the extraction of oxygen from oxides and silicates for isotopic analysis. Geochim. Cosmochim. Acta 1963, 27, 43–52. [Google Scholar] [CrossRef]
  38. Friedman, I. Deuterium content of natural waters and other substances. Geochim. Cosmochim. Acta 1953, 4, 89–103. [Google Scholar] [CrossRef]
  39. McCrea, J.M. On the isotopic chemistry of carbonates and a paleotemperature scale. J. Chem. Phys. 1950, 18, 849–857. [Google Scholar] [CrossRef]
  40. Friedman, I.; O’Neil, J.R. Complication of Stable Isotope Fractionation Factors of Geochemical Interest. In Data of Geochemistry—Sixth Edition; Fleischer, M., Ed.; US Government Printing Office: Washington, DC, USA, 1977. [Google Scholar]
  41. Hall, D.L.; Sterner, S.M.; Bodnar, R.J. Freezing point depression of NaCl-KCl-H2O solutions. Econ. Geol. 1988, 83, 197–202. [Google Scholar] [CrossRef]
  42. Crawford, M.L. Phase equilibria in aqueous fluid inclusions. In Fluid Inclusions: Application to Petrology; Hollister, L.S., Crawfor, M.L., Eds.; Mineralogical Association of Canada: Quebec City, QC, Canada, 1981; Volume 83, pp. 197–202. [Google Scholar]
  43. Bodnar, R.J. Revised equation and table for determining the freezing point depression of H2O–NaCl solutions. Geochim. Cosmochim. Acta 1993, 57, 683–684. [Google Scholar] [CrossRef]
  44. Clayton, R.N.; O’Neil, J.R.; Mayeda, T.K. Oxygen Isotope Exchange between Quartz and Water. J. Geophys. Res. 1972, 77, 3057–3067. [Google Scholar] [CrossRef]
  45. Taylor, H.P. The Application of Oxygen and Hydrogen Isotope Studies to Problems of Hydrothermal Alteration and Ore Deposition. Econ. Geol. 1974, 69, 843–883. [Google Scholar] [CrossRef]
  46. Barnes, H.L. Solubilities of ore minerals. In Geochemistry of Hydrothermal Ore Deposits; Barnes, H.L., Ed.; Wiley: New York, NY, USA, 1979; pp. 404–460. [Google Scholar]
  47. Rye, R.O.; Ohmoto, H. Sulfur and carbon isotopes and ore genesis: A review. Econ. Geol. 1974, 69, 826–842. [Google Scholar] [CrossRef]
  48. Hedenquist, J.W.; Arribas, A.; Reynolds, T.J. Evolution of an intrusion- centered hydrothermal system: Far southeast-lepanto porphyry and epithermal Cu-Au deposits, Philippines. Econ. Geol. 1998, 93, 373–404. [Google Scholar] [CrossRef]
  49. Shepherd, T.J.; Rankin, A.H.; Alderton, D.H.M. A Practical Guide to Fluid Inclusion Studies; Blackie and Son Ltd.: London, UK, 1985. [Google Scholar]
  50. Taylor, B.E. Magmatic volatiles: Isotope variation of C, H and S. Rev. Miner. Geochem. 1986, 16, 185–225. [Google Scholar]
  51. Demény, A.; Ahijado, A.; Casillas, R.; Vennemann, T.W. Crustal contamination and fluid/rock interaction in the carbonatites of Fuerteventura (Canary Islands, Spain): A C, O, H isotope study. Lithosphere 1998, 44, 101–115. [Google Scholar] [CrossRef]
  52. Baker, A.J.; Fallick, A.E. Evidence from Lewisian limestones for isotopically heavy carbon in two-thousand-million-year-old sea water. Nature 1989, 337, 352–354. [Google Scholar] [CrossRef]
  53. Hoefs, J. Stable Isotope Geochemistry (4); Springer: Berlin, Germany, 1997; pp. 199–201. [Google Scholar]
  54. Taylor, H.P.; Frechen, J.; Degens, E.T. Oxygen and carbon isotope studies of carbonatites from the Laacher See District, West Germany and the Alnö District, Sweden. Geochim. Cosmochim. Acta 1967, 31, 407–430. [Google Scholar] [CrossRef]
  55. Ray, J.S.; Ramesh, R.; Pande, K. Carbon isotopes in Kerguelen plume-derived carbonatites: Evidence for recycled inorganic carbon. Earth Planet. Sci. Lett. 1999, 170, 205–214. [Google Scholar] [CrossRef]
  56. Hudson, J.D. Stable isotopes and limestone lithification. J. Geol. Soc. 1977, 133, 637–660. [Google Scholar] [CrossRef]
  57. Deines, P. Stable isotope variations in carbonatites. In Carbonatites: Genesis and Evolution; Bell, K., Ed.; Unwin Hyman: London, UK, 1989; pp. 301–359. [Google Scholar]
  58. Demeny, A.; Harangi, S.Z. Stable isotope studies on carbonate formations in alkaline basalt and lamprophyre series: Evolution of magmatic fluids and magma-sediment interactions. Lithosphere 1996, 37, 335–349. [Google Scholar]
  59. Hoernle, K.; Tilton, G.; Le Bas, M.J.; Duggen, S.; Garbe-Schönberg, D. Geochemistry of oceanic carbonatites compared with continental carbonatites: Mantle recycling of oceanic crustal carbonate. Contrib. Miner. Petrol. 2002, 142, 520–542. [Google Scholar] [CrossRef]
  60. Lorrain, A.; Savoye, N.; Chauvaud, L.; Paulet, Y.M.; Naulet, N. Decarbonation and preservation method for the analysis of organic C and N contents and stable isotope ratios of low-carbonated suspended particulate material. Anal. Chim. Acta 2003, 491, 125–133. [Google Scholar] [CrossRef]
  61. Chen, F.C.; Deng, J.; Wang, Q.F.; Li, G.J.; Shu, Q.H.; Yang, C.H.; Liu, J.Y.; Xu, R. The source and evolution of ore fluids in the Heiniuwa gold deposit, Baoshan block, Sanjiang region: Constraints from sulfide trace element, fluid inclusion and stable isotope studies. Ore. Geol. Rev. 2018, 95, 725–745. [Google Scholar] [CrossRef]
  62. Bodnar, R.J.; Reynolds, T.J.; Kuehn, C.A. Fluid inclusion systematics in epithermal systems. Rev. Econ. Geol. 1985, 2, 25. [Google Scholar]
  63. Heinrich, C.A. Fluid-fluid interactions in magmatic-hydrothermal ore formation. Rev. Mineral. Geochem. 2007, 65, 363–387. [Google Scholar] [CrossRef]
  64. Ohmoto, H. Stable Isotope Geochemistry of Ore Deposits. Rev. Miner. 1986, 16, 491–559. [Google Scholar]
  65. Ripley, E.M. Origin and concentration mechanisms of copper and nickel in Duluth Complex sulfide zones, a dilemma. Econ. Geol. 1986, 81, 974–978. [Google Scholar] [CrossRef]
  66. Zhang, C.; Song, Y.C.; Hou, Z.Q. Geological and geochemical studies of the Nariniya lead-zinc depositin Tuotuohe area, Qinghai Province. Acta Petrol. Miner. 2013, 32, 291–304. (In Chinese) [Google Scholar]
  67. Li, Y.Z.; Kong, H.L.; Nanka, E.W. Analysis of Matter Source and Metallogenic Setting of Metallogenic Rock of Narigongma Porphyry Copper Molybdenum Deposit in Qinhai Province. Geol. Sci. Technol. Inf. 2015, 34, 1–7. [Google Scholar]
  68. Zartman, R.E.; Doe, B.R. Plumbotectonics—The model. Tectonophysics 1981, 75, 135–162. [Google Scholar] [CrossRef]
  69. Zhu, B.Q.; Zhang, Y.Q.; Xie, Y.W. Nd, Sr and Pb isotopic characterstics of cenozoic ultra-potassic volcanic rocks from eastern Erhai, Yunnan and their implications for subcontinent–mantle evolution in South China. Geochim 1992, 3, 201–212. [Google Scholar]
  70. Zhang, Y.Q.; Xie, Y.W.; Li, X.H.; Qiu, H.N.; Zhao, Z.H.; Liang, H.Y.; Zhong, S.L. Isotopic characteristics of potassium basalt series magmatic rocks in eastern Qinghai-Tibet Plateau: Petrogenesis and its tectonic significance. Sci. Chin. D 2000, 30, 493–498. (In Chinese) [Google Scholar]
  71. Deng, W.M.; Zhang, H.J.; Zhang, Y.Q. Petrogenesis of cenozoic potassic volcanic rocks in Nangqen basin. Chin. J. Geol. 2001, 36, 304–318. (In Chinese) [Google Scholar]
  72. Zhao, X.; Yu, X.H.; Mo, X.X.; Zhang, J.; Lv, B.X. Petrological and geochemical characteristics of Cenozoic alkali -rich porphyries and xenoliths hosted in Western Yunnan Province. Geoscience 2004, 18, 217–228. (In Chinese) [Google Scholar]
  73. Zhang, C. Study on the metalgenesis of the Nariniya lead-zinc deposits in the Tuotuohe area, Qinghai province. Master’s Thesis, East China Institute of Technology, Nanchang, China, 2013. (In Chinese). [Google Scholar]
  74. Hao, J.H.; Chen, J.P.; Dong, Q.J.; Li, Y.L.; Wang, T. Element and Sr-Nd-Pb isotope geochemistry of ore-bearing porphyries in northern Sanjiang Mo(Cu) ore belt, Qinghai Province: Implications for tectonic setting and petrogenesis. Acta Petrol. Miner. 1998, 30, 427–437. (In Chinese) [Google Scholar]
  75. Yang, Z.M.; Hou, Z.Q.; Yang, Z.S.; Wang, S.X.; Wang, G.R.; Tian, S.H.; Wen, D.Y.; Wang, Z.L.; Liu, Y.C. Genesis of porphyries and tectonic controls on the Narigongma porphyry Mo (-Cu) deposit, southern Qinghai. Acta Petrol. Sin. 2008, 24, 489–502. (In Chinese) [Google Scholar]
  76. Tian, S.H.; Yang, Z.S.; Hou, Z.Q.; Liu, Y.C.; Song, Y.C.; Wang, F.C.; Xue, W.W. Sulfur, lead, strontium and neodymium isotope compositions of the Dongmozhazhua lead-zinc ore deposit in the Yushu area, southern Qinghai: Implications for the sources of ore-forming material in the deposit. Acta Petrol. Sin. 2011, 27, 2173–2183. (In Chinese) [Google Scholar]
  77. Chung, S.L.; Lo, C.H.; Lee, T.Y.; Zhang, Y.; Xie, Y.; Li, X.; Wang, K.L.; Wang, P.L. Diachronous uplift of the Tibetan plateau starting 40 Myr ago. Nature 1998, 394, 769–773. [Google Scholar] [CrossRef]
  78. Zhao, Z.D.; Mo, X.X.; Dong, G.C. Pb isotopic geochemistry of Tibetan Plateau and its implications. Geoscience 2007, 2, 265–274. (In Chinese) [Google Scholar]
  79. Roedder, E.; Bodnar, R.J. Geologic pressure determinations from fluid inclusion studies. Annu. Rev. Earth Planet. Sci. 1980, 8, 263–301. [Google Scholar] [CrossRef]
  80. Roedder, E.; Bodnar, R.J. Fluid inclusion studies of hydrothermal ore deposits. In Geochemistry of Hydrothermal Ore Deposits; Barnes, H.L., Ed.; Wiley: New York, NY, USA, 1997; pp. 657–697. [Google Scholar]
  81. Driesner, T.; Heinrich, C.A. The system H2O-NaCl. Part I: Correlation formulae for phase relations in temperature-pressure-composition space from 0 to 1000 °C, 0 to 5000 bar, and 0 to 1 XNaCl. Geochim. Cosmochim. Acta 2007, 71, 4880–4901. [Google Scholar] [CrossRef]
  82. Sibson, R.H.; Robert, F.; Poulsen, K.H. High angle reverse faults, fluid-pressure cycling, and mesothermal gold-quartz deposits. Geology 1988, 16, 551–555. [Google Scholar] [CrossRef]
  83. Zhong, R.C.; Brugger, J.; Chen, Y.J.; Li, W.B. Contrasting regimes of Cu, Zn and Pb transport in ore-forming hydrothermal fluids. Chem. Geol. 2015, 154–164, 154–164. [Google Scholar] [CrossRef]
  84. Seward, T.; Barnes, H. Metal transport by hydrothermal ore fluids. In Geochemistry of Hydrothermal Ore Deposits, 3rd ed.; Barnes, H., Ed.; Wiley: New York, NY, USA, 1997; pp. 435–486. [Google Scholar]
  85. Mao, G.Z.; Hua, R.M.; Long, G.M.; Lu, H.J. Rb-Sr Dating of Pyrite and Quartz Fluid Inclusions and Origin of Ore-forming Materials of the Jinshan Gold Deposit, Northeast Jiangxi Province, South China. Acta Geol. Sin. Engl. Ed. 2013, 87, 1658–1667. [Google Scholar] [CrossRef]
  86. Calagari, A.A. Fluid inclusion studies in quartz veinlets in the porphyry copper deposit at Sungun, East-Azarbaidjan, Iran. J. Asian Earth Sci. 2004, 23, 179–189. [Google Scholar] [CrossRef]
  87. Wang, L.L.; Sun, F.Y.; Xu, J.H.; Wang, K.Y.; Wang, L.; Xu, Q.L. Ore-forming fluid and evolution of Luming molybdenum deposit, Heilongjiang Province. Acta Petrol. Sin 2015, 31, 979–990. (In Chinese) [Google Scholar]
  88. O’Neil, J.R.; Silberman, M.L. Stable isotope relations in epithermal Au-Ag deposits. Econ. Geol. 1974, 69, 902–909. [Google Scholar] [CrossRef]
  89. Landtwing, M.; Pettke, T.; Halter, W.; Heinrich, C.; Redmond, P.; Einaudi, M.; Kunze, K. Copper deposition during quartz dissolution by cooling magmatichydrothermal magmatic-hydrothermal fluids: The Bingham porphyry. Earth Planet. Sci. Lett. 2005, 235, 229–243. [Google Scholar] [CrossRef]
  90. Beane, R.; Titley, S. Porphyry copper deposits; Part II: Hydrothermal alteration and mineralization. Econ. Geol. 1981, 75, 235–269. [Google Scholar]
  91. Partida, E.G.; Chavez, A.A.; Levresse, G.; Tritlla, J.; Camprubi, A. Genetic implications of fluid inclusions in skarn chimney ore, Las Animas Zn–Pb–Ag(–F) deposit, Zimapan, Mexico. Ore. Geol. Rev. 2003, 23, 91–96. [Google Scholar]
  92. Hezarkhani, A.; Williams-Jones, A.E.; Gammons, C.H. Factors controlling copper solubility and chalcopyrite deposition in the Sungun porphyry copper deposit, Iran. Miner. Depos. 1999, 34, 770–783. [Google Scholar] [CrossRef]
  93. Fournier, R.O. Hydrothermal processes related to movement of fluid from plastic into brittle rock in the magmatic-epithermal environment. Econ. Geol. 1999, 94, 1193–1211. [Google Scholar] [CrossRef]
  94. Ohmoto, H. Systematics of sulfur and carbon isotopes in hydrothermal ore deposits. Econ. Geol. 1972, 67, 551–578. [Google Scholar] [CrossRef]
  95. Sawkins, F.J. Sulfide ore deposits in relation to plate tectonics. J. Geol. 1972, 80, 377–397. [Google Scholar] [CrossRef]
  96. Benedezú, R.; Fonteboté, L. Cordilleran Epithermal Cu-Zn-Pb-(Au-Ag) Mineralization in the Colquijirca District, Central Peru: Deposit-Scale Mineralogical Patterns. Econ. Geol. 2009, 104, 905–944. [Google Scholar] [CrossRef]
  97. Kissin, S.A.; Mango, H. Silver vein deposits. In Treatise on Geochemistry, 2nd ed.; Elsevier: Oxford, UK, 2014; pp. 425–432. [Google Scholar]
  98. Aitchison, J.C.; Xia, X.; Baxter, A.T.; Ali, J.R. Detrital zircon U-Pb ages along the Yarlung-Tsangpo suture zone, Tibet: Implications for oblique convergence and collision between India and Asia. Gondwana Res. 2011, 20, 691–709. [Google Scholar] [CrossRef]
  99. Zhang, J.J.; Santosh, M.; Wang, X.X.; Guo, L.; Yang, X.; Zhang, B. Tectonics of the northern Himalaya since the India-Asia collision. Gondwana Res. 2011, 20, 939–960. [Google Scholar] [CrossRef]
  100. Xu, Z.Q.; Yang, J.S.; Li, H.B.; Zhang, J.X.; Wu, C.L. Orogenic Plateau-Terrane Amalgamation, Collisional Orogeny and Uplifting of the Qinghai-Tibet Plateau; Geological Publishing House: Beijing, China, 2007. (In Chinese) [Google Scholar]
Figure 1. (a) Simplified geological map showing sutures, major structures, and Cenozoic basins in Tibet, modified after Spurlin et al. [4]. The map also shows the locations of the Chuduoqu deposit and other important Pb-Zn deposits in the Sanjiang Metallogenic Belt; (b) The inset map shows the location of Tibet within the eastern Asian continent, modified after Liu et al. [5].
Minerals 09 00285 g001
Figure 2. Simplified geological map of the Tuotuohe area, showing stratigraphy, thrust structure, and locations of the Chuduoqu ore deposit and other ore deposits; the map is simplified from six 1:250,000 scale geological maps, modified after [16].
Minerals 09 00285 g002
Figure 3. (a) Geological map of the Chuduoqu Pb-Zn-Cu deposit; (b) Geological cross-section of the M9 ore body.
Minerals 09 00285 g003
Figure 4. Photographs and photomicrographs of ore from the Chuduoqu Pb-Zn-Cu deposit. (a) Stage II quartz-chalcopyrite vein crosscutting stage I quartz-specularite vein; (b) Specularite in stage I; (c) Stage II quartz-chalcopyrite vein crosscutting wall rock; (d) Stage III galena crosscutting stage II quartz-chalcopyrite vein; (e) Stage II quartz-carbonate vein crosscutting stage III quartz-galena-pyrite vein; (f) Stage II quartz-carbonate vein crosscutting wall rock; (g) Chalcopyrite intergrown with bornite in stage II; (h) Chalcopyrite intergrown with tetrahedrite in stage II; (i) Sphalerite intergrown with galena, little chalcopyrite and pyrite in stage III. Q—quartz; Cal—Calcite; Spe—specularite; Py—pyrite; Ccp—chalcopyrite; Sp—sphalerite; Gn—galena; Bn—bornite; Td—tetrahedrite.
Minerals 09 00285 g004
Figure 5. Mineral paragenesis for the Chuduoqu Pb-Zn-Cu deposit.
Minerals 09 00285 g005
Figure 6. Photomicrographs of fluid inclusions in Stages I–IV in the Chuduoqu Pb-Zn-Cu deposit. (a) L-type inclusions in Stage I quartz; (b) L-type inclusions in Stage I quartz; (c) L-type inclusions in Stage II quartz; (d) Coexisting V-type and L-type fluid inclusions in Stage III quartz; (e) L-type inclusions in Stage III quartz; (f) V-type inclusions in Stage III quartz; (g) L-type inclusions in Stage IV quartz.
Minerals 09 00285 g006
Figure 7. Histograms of homogenization temperatures and salinities of fluid inclusions from the different stages of the Chuduoqu Pb-Zn-Cu deposit. (a) Homogenization temperatures for L-type, Stage I quartz; (b) Salinity for L-type, Stage I quartz; (c) Homogenization temperatures for L-type, Stage II quartz and barite; (d) Salinity for L-type, Stage II quartz and barite; (e) Homogenization temperatures for L-type and V-type, Stage III quartz; (f) Salinity for L-type and V-type, Stage III quartz; (g) Homogenization temperatures for L-type, Stage IV quartz and calcite; (h) Salinity for L-type, Stage IV quartz and calcite.
Minerals 09 00285 g007
Figure 8. Representative laser Raman spectra for fluid inclusions from the Chuduoqu Pb-Zn-Cu deposit. (a) H2O, N2 and CO2 spectra of the vapor phase in L-type inclusion; (b) H2O, N2 and CO2 spectra of the vapor phase in V-type inclusion.
Minerals 09 00285 g008
Figure 9. The δ18OH2O18DH2O diagram of the ore-forming fluid of the Chuduoqu Pb-Zn-Cu deposit (after [45]).
Minerals 09 00285 g009
Figure 10. Homogenization temperature vs. salinity diagram showing the evolution of the ore-forming fluids for different groups of the fluid inclusions in the Chuduoqu Pb-Zn-Cu deposit. Inset illustration for different fluid evolution paths is based on Shepherd et al. [49].
Minerals 09 00285 g010
Figure 11. The δ13CPDB18OSMOW diagram of the Chuduoqu Pb-Zn-Cu deposit (base map modified after Demény et al. [51]. The data of mantle, continental carbonate, marine carbonate and sedimentary organic matter carbon are from [52,53,54,55,56]. This plot offers information about the various processes of CO2 and carbonate ions including meteoric water influence, sea water penetration, sediment contamination and high temperature influence, low temperature alteration [57,58,59], decarbonate and carbonate dissolution [60].
Minerals 09 00285 g011
Figure 12. The Sulfur isotope histogram of the Chuduoqu Pb-Zn-Cu deposit. δ34S values of mantle, sedimentary rock, metamorphic rock and meteorite are quoted from [53].
Minerals 09 00285 g012
Figure 13. Lead isotope compositions for sulfides in the Chuduoqu Pb-Zn-Cu deposit. (a) 207Pb/204Pb versus 206Pb/204Pb plot; (b) 208Pb/204Pb versus 206Pb/204Pb plot. UC—upper crust, O—orogen, M—mantle, LC—lower crust. The average growth curve is from Zartman and Doe [68]. The field of Cenozoic potassic volcanic rocks in Sanjiang Metallogenic Belt are from [69,70,71,72,73]; the field of Cenozoic potassium-rich porphyries in Sanjiang Metallogenic Belt are from [74,75], the field of Mesozoic-Cenozoic limestone strata are from [76].
Minerals 09 00285 g013
Figure 14. Trapping pressure estimation diagram. Summary plot of homogenization temperatures and salinities of FIs for the Chuduoqu Pb-Zn-Cu deposit. Vapor–liquid coexistence curves were calculated from the equations of Driesner and Heinrich [81].
Minerals 09 00285 g014
Figure 15. Metallogenic model for the Chuduoqu Pb-Zn-Cu deposit.
Minerals 09 00285 g015
Table 1. Microthermometric data and relative parameters of fluid inclusions.
Mineralized StagesHost MineralsInclusion TypeNo.Tm-eu (°C)Tm-ice (°C)Th (°C)Salinity (NaCl wt. %)
IQuartzL-type28 from −8.1 to −5.6318–3708.68–11.81
IIQuartzL-type33−29.5 ± 0.5from −7.8 to −4.8250–3087.59–11.46
IIBariteL-type18−31.2 ± 0.5from −7.2 to −3.3250–2875.41–10.73
IIIQuartzL-type45−31.5 ± 0.5from −6.5 to −2.9231–2944.80–9.86
IIIQuartzV-type11 from −5.7 to −2.7230–2594.49–8.81
IVQuartzL-type23 from −4.4 to −2.6162–2334.34–7.02
IVCalciteL-type28 from −3.1 to −1.2144–2192.07–5.10
Tm-eu (°C)—eutectic temperature (first ice melting temperature); Tm-ice (°C)—final ice melting temperature.
Table 2. The results of the ion chromatography analysis of the fluid inclusions exist in quartz from the Chuduoqu Pb-Zn-Cu deposit.
Sample No.CDQ-TC72-B5CDQ-TC72-B6CDQ-TC72-B7CDQ-P1-26CDQ-LX1-25
MineralQuartzQuartzQuartzQuartzQuartz
Sample LocationM8 OrebodyM8 OrebodyM8 OrebodyM9 OrebodyM9 Orebody
Mineralization StagesIIIIIIIIII
Major Ion Components (μg/g)
Na+1.42.923.532.73.07
K+3.491.612.611.573.69
Mg2+1.461.154.152.858.09
Ca2+8.24.9617.8916.9348.92
F0.220.040.120.050.33
Cl5.538.4910.642.734.23
NO2−0.360.590.60.730.77
NO3−0.510.661.170.220.79
SO42−13.419.9155.125.5320.32
Table 3. The hydrogen and oxygen isotope compositions of the fluid inclusion of stage I, II and III of the Chuduoqu Pb-Zn-Cu deposit.
Sample No.MineralSample LocationTemperature (°C)Mineralization Stagesδ18OV-SMOW (‰)δ18OH2O (‰)δDV-SMOW (‰)
CDQ-ZK006-B3QuartzM5 orebody319.2I15.39.1−96.2
CDQ-ZK006-B4QuartzM5 orebody318.1I14.27.9−93.8
CDQ-TC72-B5QuartzM8 orebody272.6II12.74.8−112.6
CDQ-TC72-B6QuartzM8 orebody261.9II13.65.2−112.7
CDQ-TC72-B8QuartzM8 orebody230.1III9.5−0.4−113.2
CDQ-PM1-26QuartzM9 orebody235.3III10.10.4−108.6
CDQ-LX1-25QuartzM9 orebody231.1III10.30.4−105.8
Note: δ18OH2O values are calculated based on the oxygen isotope equilibrium fractionation equation as follows: δ18OV-SMOW − δ18OH2O = 1000lnαquartz-water = 3.38 × 10⁶/T2 − 3.40 [44], Temperatures used in the calculations are derived from fluid inclusion microthermometric data.
Table 4. The C–O isotopic compositions of the Chuduoqu Pb-Zn-Cu deposit.
Sample No.MineralSample LocationMineralization Stagesδ13CPDB (‰)δ18OPDB (‰)δ18OSMOW (‰)Reference
CDQ-PM1-BCalciteM11 orebodyIV−5.4−19.311.0This study
CDQ-ZK3205-B10CalciteM9 orebodyIV−7.5−20.39.9This study
CDQ-SZK802-B2CalciteM10 orebodyIV−6.3−18.511.8This study
CDQ-LX3-W8CalciteM1 orebodyIV−6.5−18.312.0This study
CDQ-ZK006-C20CalciteM5 orebodyIV−5.6−19.211.1[13]
CDQ-ZK006-W14CalciteM5 orebodyIV−6.2−18.212.1[13]
CDQ-ZK006-W25CalciteM5 orebodyIV−6.3−18.711.6[13]
CDQ-ZK006-W26CalciteM5 orebodyIV−7.5−19.710.6[13]
Notes: δ18OSMOW = 1.03086 × δ18OV-PDB + 30.86 [40].
Table 5. Sulfur isotopic compositions of the Chuduoqu Pb-Zn-Cu deposit.
Sample No.MineralSample LocationMineralization Stagesδ34SCDT (‰)
CDQ-P1-B1ChalcopyriteM11 orebodyII1.2
CDQ-SZK802-B2ChalcopyriteM10 orebodyII0.4
CDQ-ZK3205-B5ChalcopyriteM9 orebodyII2.9
CDQ-ZK3205-B6ChalcopyriteM9 orebodyII2.8
CDQ-ZK3205-B7ChalcopyriteM9 orebodyII2.5
CDQ-ZK3205-B8GalenaM9 orebodyIII−0.3
CDQ-ZK3205-B9GalenaM9 orebodyIII−1.7
CDQ-ZK3205-B10GalenaM9 orebodyIII−2.6
CDQ-TC29-B13GalenaM9 orebodyIII−3.8
CDQ-ZK3205-B11GalenaM9 orebodyIII−2.3
CDQ-ZK3205-B12GalenaM9 orebodyIII−2.1
CDQ-ZK3205-B13SphaleriteM9 orebodyIII−1.6
CDQ-ZK3205-B14SphaleriteM9 orebodyIII−1.4
CDQ-ZK3205-B15SphaleriteM9 orebodyIII−1.2
Table 6. Lead compositions of the Chuduoqu Pb-Zn-Cu deposit.
Sample No.MineralSample LocationMineralization Stages206Pb/204Pb207Pb/204Pb208Pb/204PbReference
CDQ-ZK3205-B6ChalcopyriteM9 orebodyII18.77315.69139.014This study
CDQ-ZK3205-B7ChalcopyriteM9 orebodyII18.72415.69438.992This study
CDQ-ZK3205-B8GalenaM9 orebodyIII18.65215.65338.803This study
CDQ-ZK3205-B9GalenaM9 orebodyIII18.68215.66438.854This study
CDQ-TC29-B13GalenaM9 orebodyIII18.68915.66438.858[13]
CDQ-ZK3205-B11GalenaM9 orebodyIII18.68715.68238.904[13]
CDQ-ZK3205-B12GalenaM9 orebodyIII18.69515.68938.932[13]
CDQ-ZK3205-B13SphaleriteM9 orebodyIII18.65515.65138.810[13]
CDQ-ZK3205-B14SphaleriteM9 orebodyIII18.69215.69238.937[13]
CDQ-ZK3205-B15SphaleriteM9 orebodyIII18.69415.69438.943[13]

