Technical Note

Separation of Monazite from Placer Deposit by Magnetic Separation

DMR Convergence Research Center, Korea Institute of Geoscience and Mineral Resources, Daejeon 34132, Korea
*
Author to whom correspondence should be addressed.
Minerals 2019, 9(3), 149; https://doi.org/10.3390/min9030149
Submission received: 23 January 2019 / Revised: 19 February 2019 / Accepted: 19 February 2019 / Published: 28 February 2019
(This article belongs to the Special Issue Physical Separation and Enrichment)

Abstract

:
In this study, mineralogical analysis and beneficiation experiments were conducted using a placer deposit of North Korea, on which limited information was available, to confirm the feasibility of development. Rare earth elements (REEs) have vital applications in modern technology and are growing in importance in the fourth industrial revolution. However, the price of REEs is unstable due to the imbalance between supply and demand, and tremendous efforts are being made to produce REEs sustainably. One of them is the evaluation of new rare earth mines and the verification of their feasibility. As a result of a mineralogical analysis, in this placer deposit, monazite and some amount of xenotime were the main REE-bearing minerals. Besides these minerals, ilmenite and zircon were the target minerals to be concentrated. Using a magnetic separation method at various magnetic intensities, paramagnetic minerals, ilmenite (0.8 T magnetic product), and monazite/xenotime (1.0–1.4 T magnetic product) were recovered selectively. Using a magnetic separation result, the beneficiation process was conducted with additional gravity separation for zircon to produce a valuable mineral concentrate. The process resulted in three kinds of mineral concentrates (ilmenite, REE-bearing mineral, and zircon). The content of ilmenite increased from 32.5% to 90.9%, and the total rare earth oxide (TREO) (%) of the REE-bearing mineral concentrates reached 45.0%. The zircon concentrate, a by-product of this process, had a Zr grade of 42.8%. Consequently, it was possible to produce concentrates by combining relatively simple separation processes compared to the conventional process for rare earth placer deposit and confirmed the possibility of mine development.

1. Introduction

Rare earth elements (REEs) are a group of elements belonging to the lanthanide series, which ranges from lanthanum to lutetium; the group also contains scandium and yttrium with similar chemical properties [1,2]. Due to their unique properties, REEs are widely used in applications such as magnets, battery alloys, and metal alloys. The importance of REEs is growing due to their increasing application in modern technology and their consequent role in the fourth industrial revolution.
However, despite this increasing demand, the supply of REEs is not stable due to regionally biased production. According to the United States Geological Survey on REE production, more than 80% of the world’s supply since 1998 has come from China, and this ratio increased to 95% in the mid-2000s [3]. In 2009, the export quota and tax restrictions imposed by the Chinese government resulted in an imbalance in the demand and supply, leading to a dramatic increase in REE prices. In response to rising prices, several companies in the United States, Australia, Brazil, and Russia began to produce REEs. Worldwide REE prices have almost returned to normal after five years because of excessive REE supply and the abolition of Chinese restrictions in 2015. Many new companies have shut down operations due to economic problems. As a result, China’s influence on the supply of REEs will likely increase, increasing the probability of the return of the aforementioned instability in production.
REEs do not exist as natural metals and are contained in various minerals in a substituted state. However, out of over 250 REE-bearing minerals, only three (bastnasite, monazite, and xenotime) are currently produced on a commercial scale. Bastnasite is the main REE-bearing mineral in large mines (Mountain Pass, CA, USA, and Bayan Obo, China), and the other two exist as heavy mineral sand deposits [4]. To develop beneficiation flowsheets of various REE-bearing deposits, extensive research has been devoted by many researchers [5,6,7,8,9,10,11]. In particular, the beneficiation process for placer deposits is well established and includes a combination of gravity, magnetic, electrostatic, and, at times, flotation processes [12,13,14].
Apart from the well-established beneficiation process for placer deposits, the application of the unit process should be modified according to the mineralogy of the sample. In this study, a placer deposit from North Korea was used as a feed sample. However, the mineralogy data and beneficiation characteristics of the North Korean placer deposit sample are not well known. Therefore, in this study, the mineralogy of a placer deposit in North Korea was investigated and a beneficiation process, especially magnetic separation, was applied to separate valuable mineral selectively and examine the feasibility of resource development project.

2. Materials and Methods

2.1. Materials

The feed sample used in this study was obtained from a placer deposit of the Sam-Cheon area in North Korea. According to geological data available on North Korea, there are two REE mines, namely Wolbong and Ryeonsan, where the ore body comprises sandy-gravel layers in alluvium [15]. Figure 1 shows the geological map of Rimjingang belt in the middle Korean Peninsula and the location of two REE mines and Sam-Cheon area [16]. As shown in Figure 1, the samples were collected from the bottom of the active river channel and sand bar in the Sam-Cheon area near two REE mines. It was confirmed that in this mining site, the gravity separation methods using a spiral concentrator and shaking table were preliminary conducted to concentrate heavy minerals in the placer deposit. Therefore, in this study, the preliminary concentrated heavy mineral sample was used as the feed sample for the beneficiation process.
A total of 200 kg of feed sample was well mixed and divided into four portions, and one of four portions was selected and further divided into four portions repeatedly. The representative sample for sample analyses was obtained by repeating this procedure. Many analytical instruments were used to identify the feed sample before and after the experiment. X-ray diffraction (XRD; X’pert MPD, Philips, Malvern, UK) was used for mineral constituent analysis; inductively coupled plasma optical emission spectroscopy (ICP-OES; Optima-5300DV, Perkin Elmer, Waltham, MA, USA), inductively coupled plasma mass spectroscopy (ICP-MS; Elan DRC-II, Perkin Elmer, Waltham, MA, USA), and X-ray fluorescence spectrometer (XRF; MXF-2400, Shimadzu, Kyoto, Japan) were used for the chemical composition analysis; and the mineral liberation analysis (MLA; MLA650F, FEI, Hillsboro, OR, USA) was used to evaluate the degree of liberation and mineral constituents.
For ICP-OES and ICP-MS analyses, a sample pretreatment method was basically carried out according to the USGS method for analyzing rare earth elements by ICP-MS. 0.1 g of sample put into carbon crucible with 0.6 g of Sodium peroxide (Na2O2; Sigma–Aldrich) The carbon crucible heated at muffle furnace about 550 °C for 30 min. After cooling the carbon crucible, 10 ml of 25% nitric acid (HNO3; 70%, Sigma–Aldrich) was added to dissolve elements for 15 min. The remaining 25% nitric acid was evaporated, and then 1% nitric acid and deionized water (DI) were added to make a 100 mL solution. This solution was diluted 10 times or 1000 times according to the concentration of elements to be measured.

2.2. Methods

A laboratory-scale cross-belt magnetic separator (CBMS; Model EE112, Eriez, Erie, PA, USA) that could modulate the applied magnetic field by changing the current supply to the separator was employed to recover iron oxide and REE-bearing minerals. The sample was fed at approximately 200 g/min for 20 min using a vibrating feeder. The moving velocity of the feed carry conveyor was about 7.3 cm/s, and that of the cross-belt conveyor to recover magnetic minerals was about 31.5 cm/s. The applied magnetic intensity was increased from 0.4 T to 1.4 T. After recovering magnetic products at 0.4 T, the remaining non-magnetic sample was fed into a magnetic separator that was adjusted to a 0.2 T higher magnetic intensity for further separation. The magnetic separation tests were carried out sequentially in this way six times until the magnetic intensity reached 1.4 T.
The batch test was conducted using 10 kg of feed sample. In this process, besides the target minerals, a gravity separation process for recovering zircon as a by-product was added. To recover high-density zircon from non-magnetic product, a shaking table (No.13 Wilfley table, Humphreys, Jacksonville, FL, USA) was used. The operating conditions were adjusted based on the general conditions. The angle of the shaking table, shaking amplitude, and water flowrate were varied from 0.5° to 4°, from 10 to 20 mm, and from 5 to 15 L/min, respectively.

3. Results and Discussion

3.1. Feed Sample Analysis

The XRD pattern profiles of the feed sample in Figure 2 revealed the main constituent minerals, and mineral liberation analysis (MLA) results in Table 1 showed major and minor constituent minerals that had not been detected by XRD analysis owing to their low content. As a result, monazite was the main REE-bearing mineral and ilmenite was the main iron oxide mineral. Besides these two main minerals, quartz and some aluminosilicate minerals, which contain alumina (Al2O3) and silica (SiO2), such as orthoclase, pyroxene, tourmaline, and muscovite, were detected as gangue minerals. Some metallic minerals such as garnet group minerals, zircon, rutile, and titanite had been identified in addition to main constituent minerals. However, their content was very low compared to those of monazite and ilmenite. Therefore, mainly monazite and ilmenite were considered as target minerals for the beneficiation process, whereas quartz was considered as a main gangue mineral from the feed sample.
Table 2 shows the mass fraction (%) and concentration (%) of the main elements as a function of particle size in the feed sample. Basically, since the feed sample came from a placer deposit, it shows a relatively narrow particle size distribution (D10 = 130 μm, D50 = 220 μm, D90 = 400 μm), and more than 93% of the particles were distributed in the particle size range of 100–500 μm. The concentration of Fe, Ti, and TREO of the entire sample were 12.5%, 11.0%, and 20.5%, respectively. The concentration of Fe and Ti were high in coarse size fraction of 300 μm or more, and the one of TREO was high in intermediate size range between 100–300 μm. However, even though there was a difference in concentration as a function of particle size, selective separation of constituent minerals through simple particle size classification was not enough.
In the beneficiation process, it is important to understand and use the physical properties of the constituent minerals in order to recover the target minerals selectively. The most representative difference in physical properties of monazite, ilmenite, and quartz are the magnetic susceptibility and the specific gravity. Ilmenite and monazite, which are paramagnetic minerals, could be separated from quartz, which is a diamagnetic mineral, through magnetic separation. In addition, it has been reported in previous research [2,9] that a separation of ilmenite and monazite can be achieved by controlling the magnetic intensity. On the other hand, quartz with a relatively low density (2.65 g/cm3) can be easily separated from ilmenite (4.8 g/cm3) and monazite (4.8–5.5 g/cm3), which have a high density, by gravity separation. However, it is difficult to separate ilmenite and monazite from each other owing to a similar specific gravity. Therefore, the magnetic separation method could be regarded as an effective method to separate ilmenite, monazite, and quartz selectively.
The liberation characteristics and particle associations between minerals in the feed sample were determined by MLA. Because the feed sample came from a placer deposit, the degree of liberation was expected to be high compared with a sample from open-pit or underground mining. The part of the polished section image of the feed sample obtained from MLA is shown in Figure 3a. The degree of liberation of each particle was found to be high. The particles shown in Figure 3a are mainly composed of “green” monazite, “brown” ilmenite, and “grey” quartz. To identify the degree of liberation of major minerals, the liberation characteristics of the three main minerals calculated in terms of mineral composition (wt %) are categorized into two groups based on a previous study [8]. The “liberated” category includes particles that have a mineral composition of more than 80%, and the “non-liberated” category includes those with mineral composition of below 80%. As can be seen in Figure 3b, the weight fractions of the minerals regarded as “liberated” particles exceeded 90% for all three minerals. The ratio of the “liberated” particles of monazite, in particular, was as high at 99.8%.
Because the main valuable minerals of the sample had high densities (4.0–6.0 g/cm3), gravity separation can be an effective method to remove light-density gangue minerals, such as quartz (density = 2.65 g/cm3) and orthoclase (density = 2.55 g/cm3). Therefore, a sink-float test was conducted using tetrabromoethane (density = 2.98 g/cm3), as shown in Table 3. The results indicated that the yield of heavy minerals was approximately 86%, whereas that of light minerals was about 14%, and the contents of Fe, Ti, and TREO (%) were mainly distributed in the heavy mineral sample. Although the effect of the gravity separation method to recover target minerals was good, additional gravity separation was not necessary, since more than 86% of the feed sample was composed of heavy minerals. Therefore, the feed sample was directly subjected to the magnetic separation process without pretreatment.

3.2. Dry Magnetic Separation

Table 4 shows the dry magnetic separation results as a function of magnetic intensity. As mentioned in Section 2.2, the magnetic separation tests were conducted sequentially by increasing the magnetic intensity while recovering magnetic products at low magnetic intensity.
As a result, it could be confirmed that the content of Fe and Ti were concentrated at the magnetic intensity of 1.0 T or less. Because Fe and Ti mainly originate from ilmenite in feed sample, the grade of ilmenite (FeTiO3) was estimated using the theoretical ratio of Fe/Ti (1.17) as follows:
Grade   of   ilmenite   % = Ti   content   % theoretical   ratio   of   Ti / FeTiO 3                 i f ,   Fe / Ti   > 1.17 Fe   content   % theoretical   ratio   of   Fe / FeTiO 3                       i f , Fe / Ti   < 1.17
If the Fe/Ti ratio of a sample is larger than 1.17, indicating that excess Fe comes from other minerals, such as magnetite (Fe3O4), the grade of ilmenite is calculated on the basis of the Ti content by using theoretical ratio of Ti/FeTiO3 (0.3156). On the other hand, if the Fe/Ti ratio of a sample is smaller than 1.17, indicating that excess Ti comes from other minerals, such as rutile (TiO2), the amount of ilmenite is calculated on the basis of the Fe content by using theoretical ratio of Fe/FeTiO3 (0.3681). As a result, at magnetic intensities of 0.6 T and 0.8 T, ilmenite was mainly recovered, and its grade was almost 90%. As magnetic intensity increased, the ilmenite grade decreased sharply and became only 1% at 1.2 T or higher magnetic intensity. Therefore, the recovery of ilmenite up to 0.8 T magnetic intensity was 94.3%, and most ilmenite was concentrated below 0.8 T.
The rare-earth elements of each product were analyzed by ICP-MS, and the content of each element was expressed as an oxide form. These values were categorized and summarized as light rare-earth oxide (LREO) and heavy rare-earth oxide (HREO) on the basis of the periodic table. The TREO(%), the sum of LREO(%) and HREO(%), began to be measured at the magnetic intensity of 1.0 T or higher. This means that REE-bearing minerals were recovered between 1.0 T and 1.4 T. The TREO(%) by up to 48.0% at 1.2 T, and recovery of TREO(%) between 1.0 T and 1.4 T reached nearly 99%.
One of the characteristics of the analysis result is that the HREO(%) was significantly detected in the 1.0 T product. As monazite, the main REE-bearing mineral in feed sample, generally consists of light-REE, another REE-bearing mineral, a small amount of xenotime, was presumed to exist in this product as identified by MLA in Table 1. Therefore, mineral identification of the 1.0 T product was further conducted by XRD analysis, and the presence of xenotime was confirmed, as shown in Figure 4. The XRD peak of xenotime, which was not detected in Figure 2 due to the low content, was observed in the 1.0 T product, and ilmenite and monazite were observed as expected from the element analysis data of Table 4. Xenotime is typically found with monazite in concentrations of 0.5%–5.0%, and it is known to have strong magnetic characteristics as compared to monazite [17]. Therefore, xenotime was firstly recovered at 1.0 T, after which monazite was recovered at an intensity of above 1.2 T.
The analysis result of SiO2 which is a constituent element of quartz showed that more than 75% of SiO2 was distributed as a non-magnetic product. The SiO2 content measured in the magnetic product was considered to be the magnetic minerals which are not fully liberated from the quartz, or the magnetic minerals containing the Si such as magnesio-hornblende as shown in Figure 4.
Figure 5 shows the cumulative recovery of ilmenite and TREO(%) as a function of magnetic intensity. At magnetic intensities of 0.6 T and 0.8 T, mainly ilmenite was recovered, and the cumulative recovery reached nearly 95% up to 0.8 T. On the other hand, at magnetic intensity above 1.2 T, the TREO(%) increased sharply and the cumulative recovery was nearly 99% between 1.0 T and 1.4 T. Therefore, based on magnetic intensities of 0.8 T and 1.4 T, ilmenite, monazite/xenotime, and non-magnetic minerals could be clearly separated via the magnetic separation process.

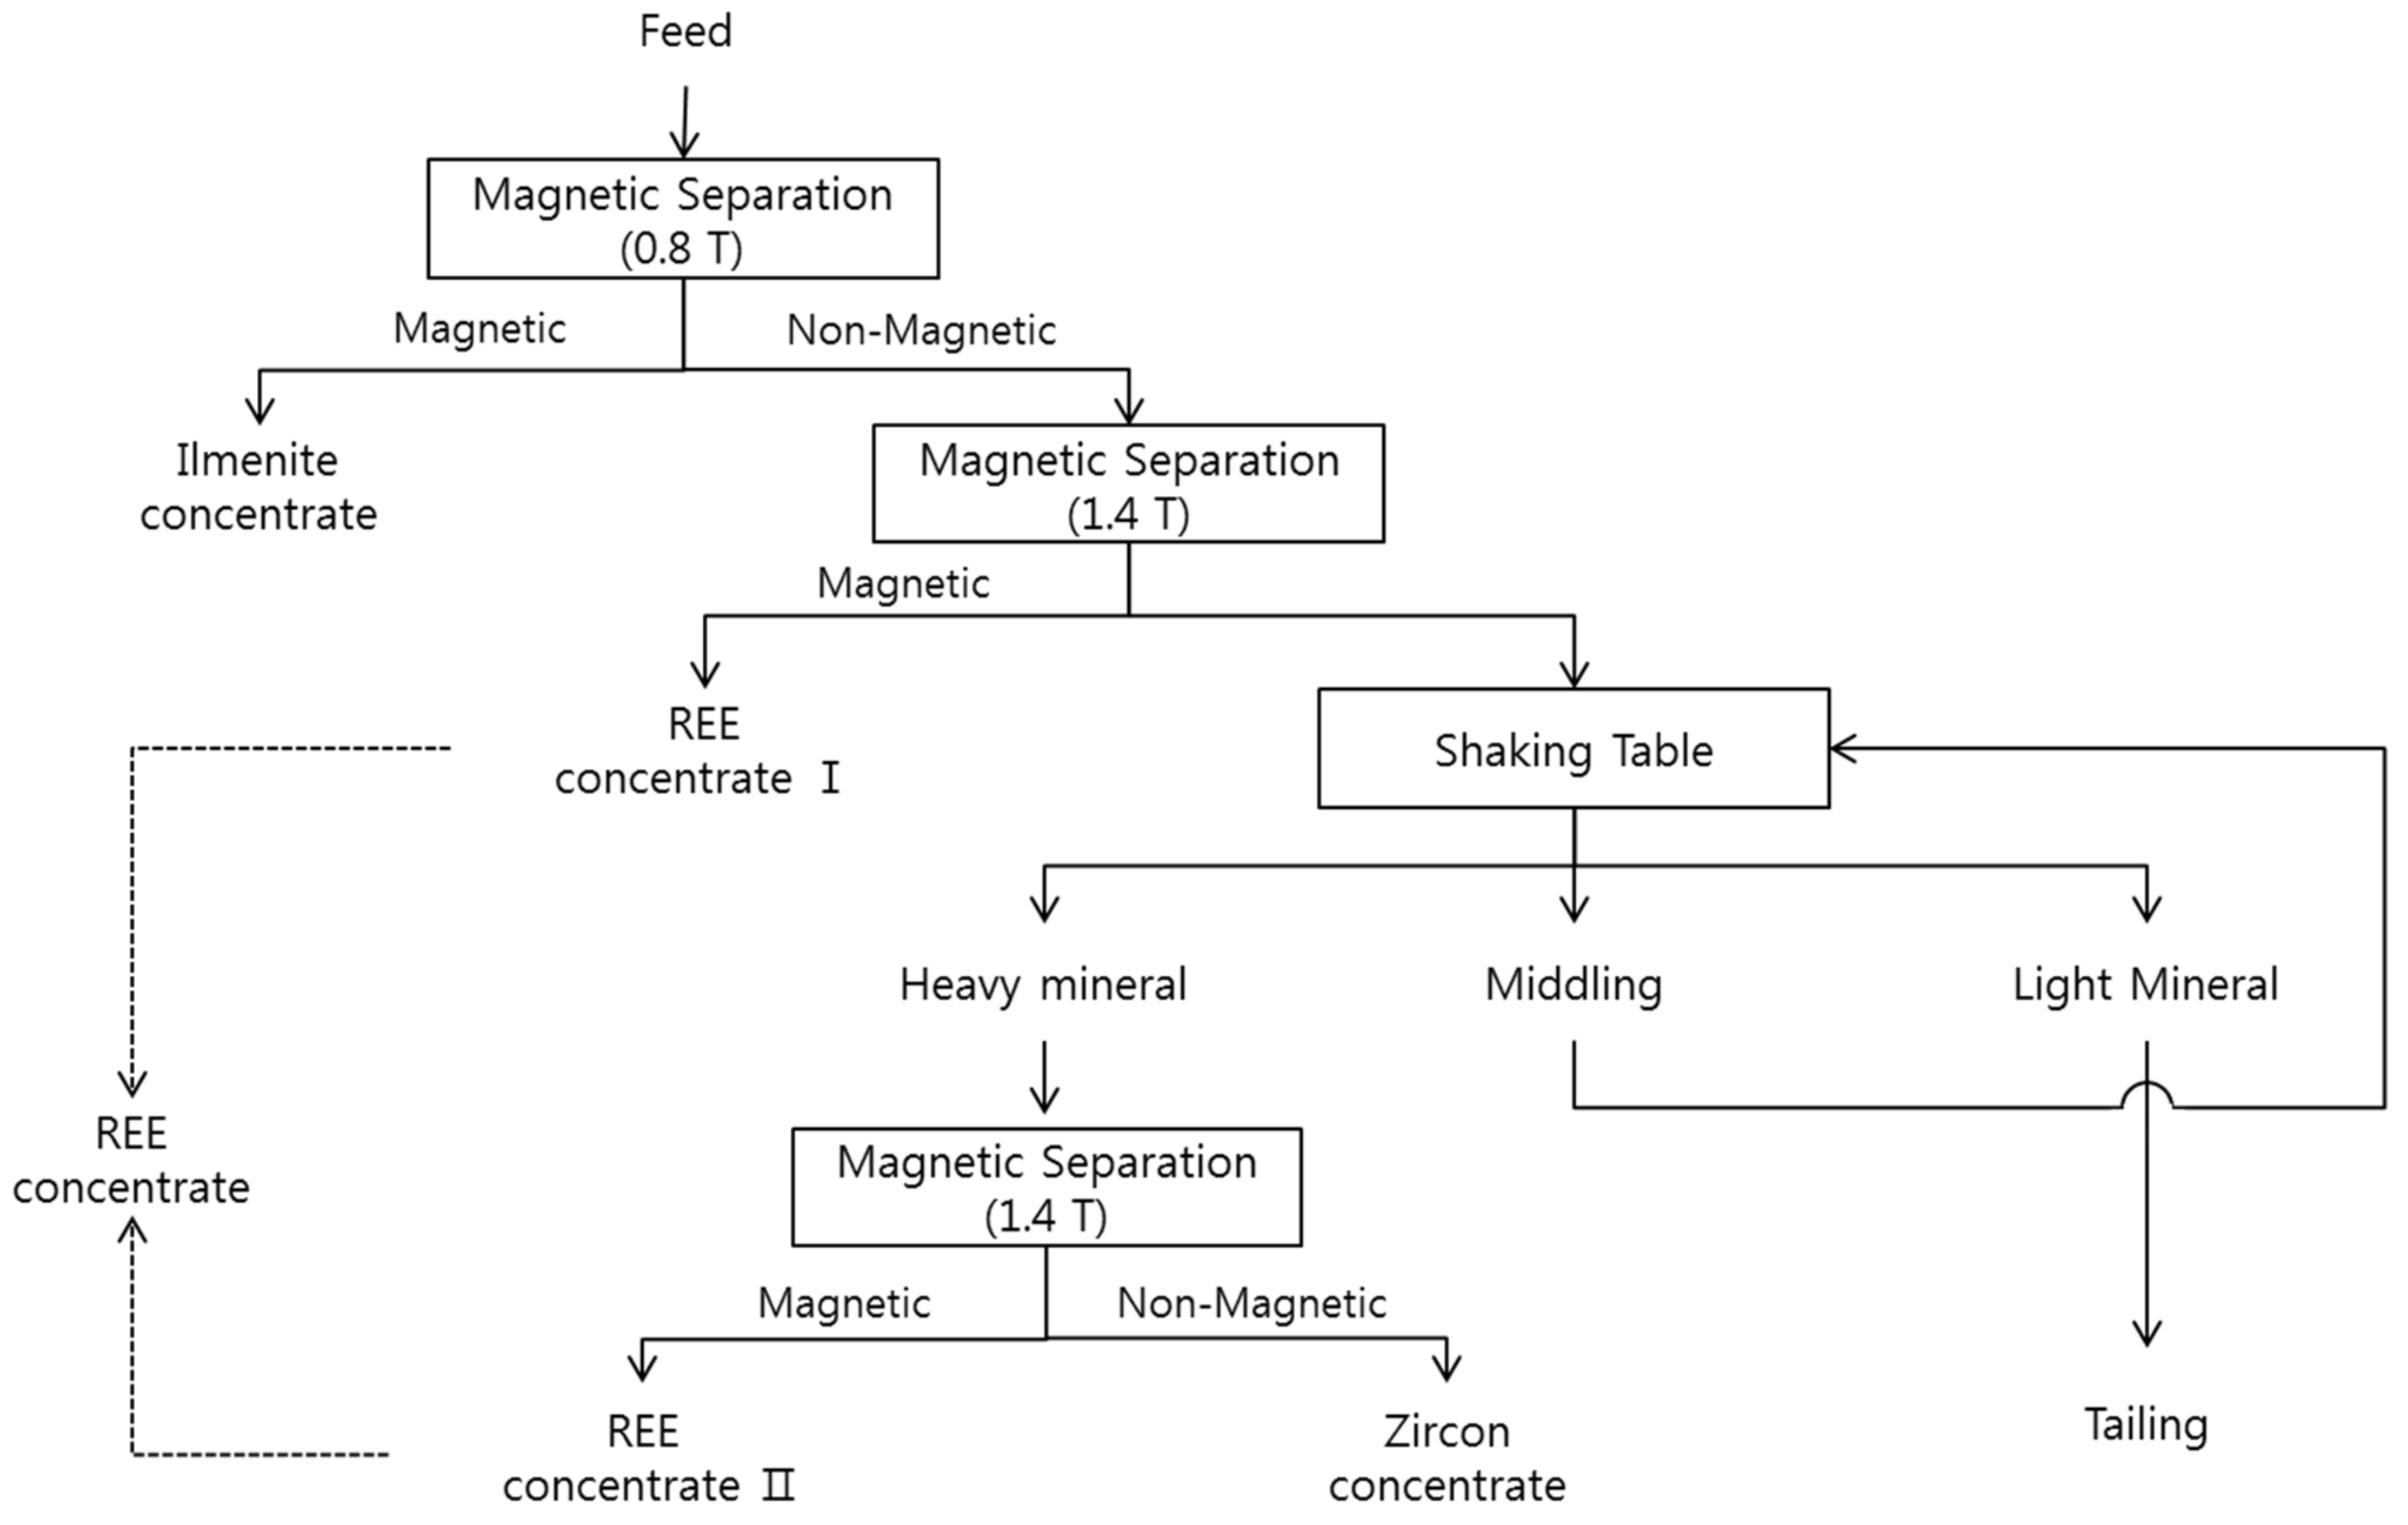
3.3. Batch Test for Beneficiation Process

Using a previous separation process result, 10 kg of batch test was conducted for the rare earth deposit as shown in Figure 6. The yield, grade (mineral content), and recovery of target elements including SiO2, which is representative elements of gangue minerals, are shown in Table 5. According to the magnetic response characteristics, ilmenite was first recovered as a magnetic product below 0.8 T. Approximately 35.2% of the sample was recovered as ilmenite concentrate, and its calculated ilmenite grade and recovery were 90.9% and 98.5%, respectively. After the first magnetic separation process, the second magnetic separation process was conducted to recover REE-bearing xenotime and monazite. When the magnetic intensities ranged from 0.8 T and 1.4 T, approximately 44.5% of the sample was recovered, and the TREO(%) of this product was about 45.0%.
In general, zircon is included as a useful mineral along with rare-earth minerals in placer deposits. Therefore, in 10 kg of batch test, additional experiments were conducted to recover the zircon concentrate. Since zircon is a non-magnetic mineral, it was considered to be contained in 1.4 T non-magnetic product, and the gravity separation method was applied to separate zircon of high density (density = 4.6–4.7 g/cm3) from low density gangue mineral such as quartz and orthoclase. Among various operating conditions of the shaking table, the optimum conditions were determined as follows: The angle of the shaking table was 2.5°, and shaking amplitude was 15 mm, and water flowrate was 10 L/min. However, the frequency was fixed at 300 rpm owing to the fixed motor speed. The shaking table separation removed 14.3% of the sample as light gangue minerals, which mainly consisted of SiO2 and Al2O3. The yield of light gangue minerals from the shaking table was similar to that from float fraction in the sink-float test (Table 3), indicating that most light minerals were separated through the gravity separation method.
The high density product recovered from the non-magnetic product was conducted in the third magnetic separation process to recover the remaining rare-earth minerals. As a result, zircon could be recovered as a non-magnetic product in the third magnetic separation process, at a 2.1% yield, 42.8% grade, and 77.2% recovery. Additional REE-bearing minerals, with a TREO(%) of 45.0%, were recovered as magnetic products in the third magnetic separation process. Therefore, the total yield of REE concentrate was 45.4%, with a TREO of 45.0% and recovery of 99.6%.
Figure 7 shows the XRD pattern of the batch test results of each product. The detected minerals of each product agreed with the chemical composition analysis results in Table 5. In particular, the existence of minor minerals was not detected in ilmenite and REE concentrates, and it could be confirmed that the separation of paramagnetic minerals, ilmenite and monazite/xenotime, through the adjustment of magnetic intensity was good. In case of zircon concentrate, some anatase with high density (density = 3.8–4.0 g/cm3) and quartz which was not fully separated were identified along with recovered zircon concentrates.

4. Conclusions

This paper describes the mineralogical characteristics of an REE-bearing placer deposit from North Korea and the steps taken to apply a beneficiation process using magnetic and gravity separation. The conclusions are as follows:
1.
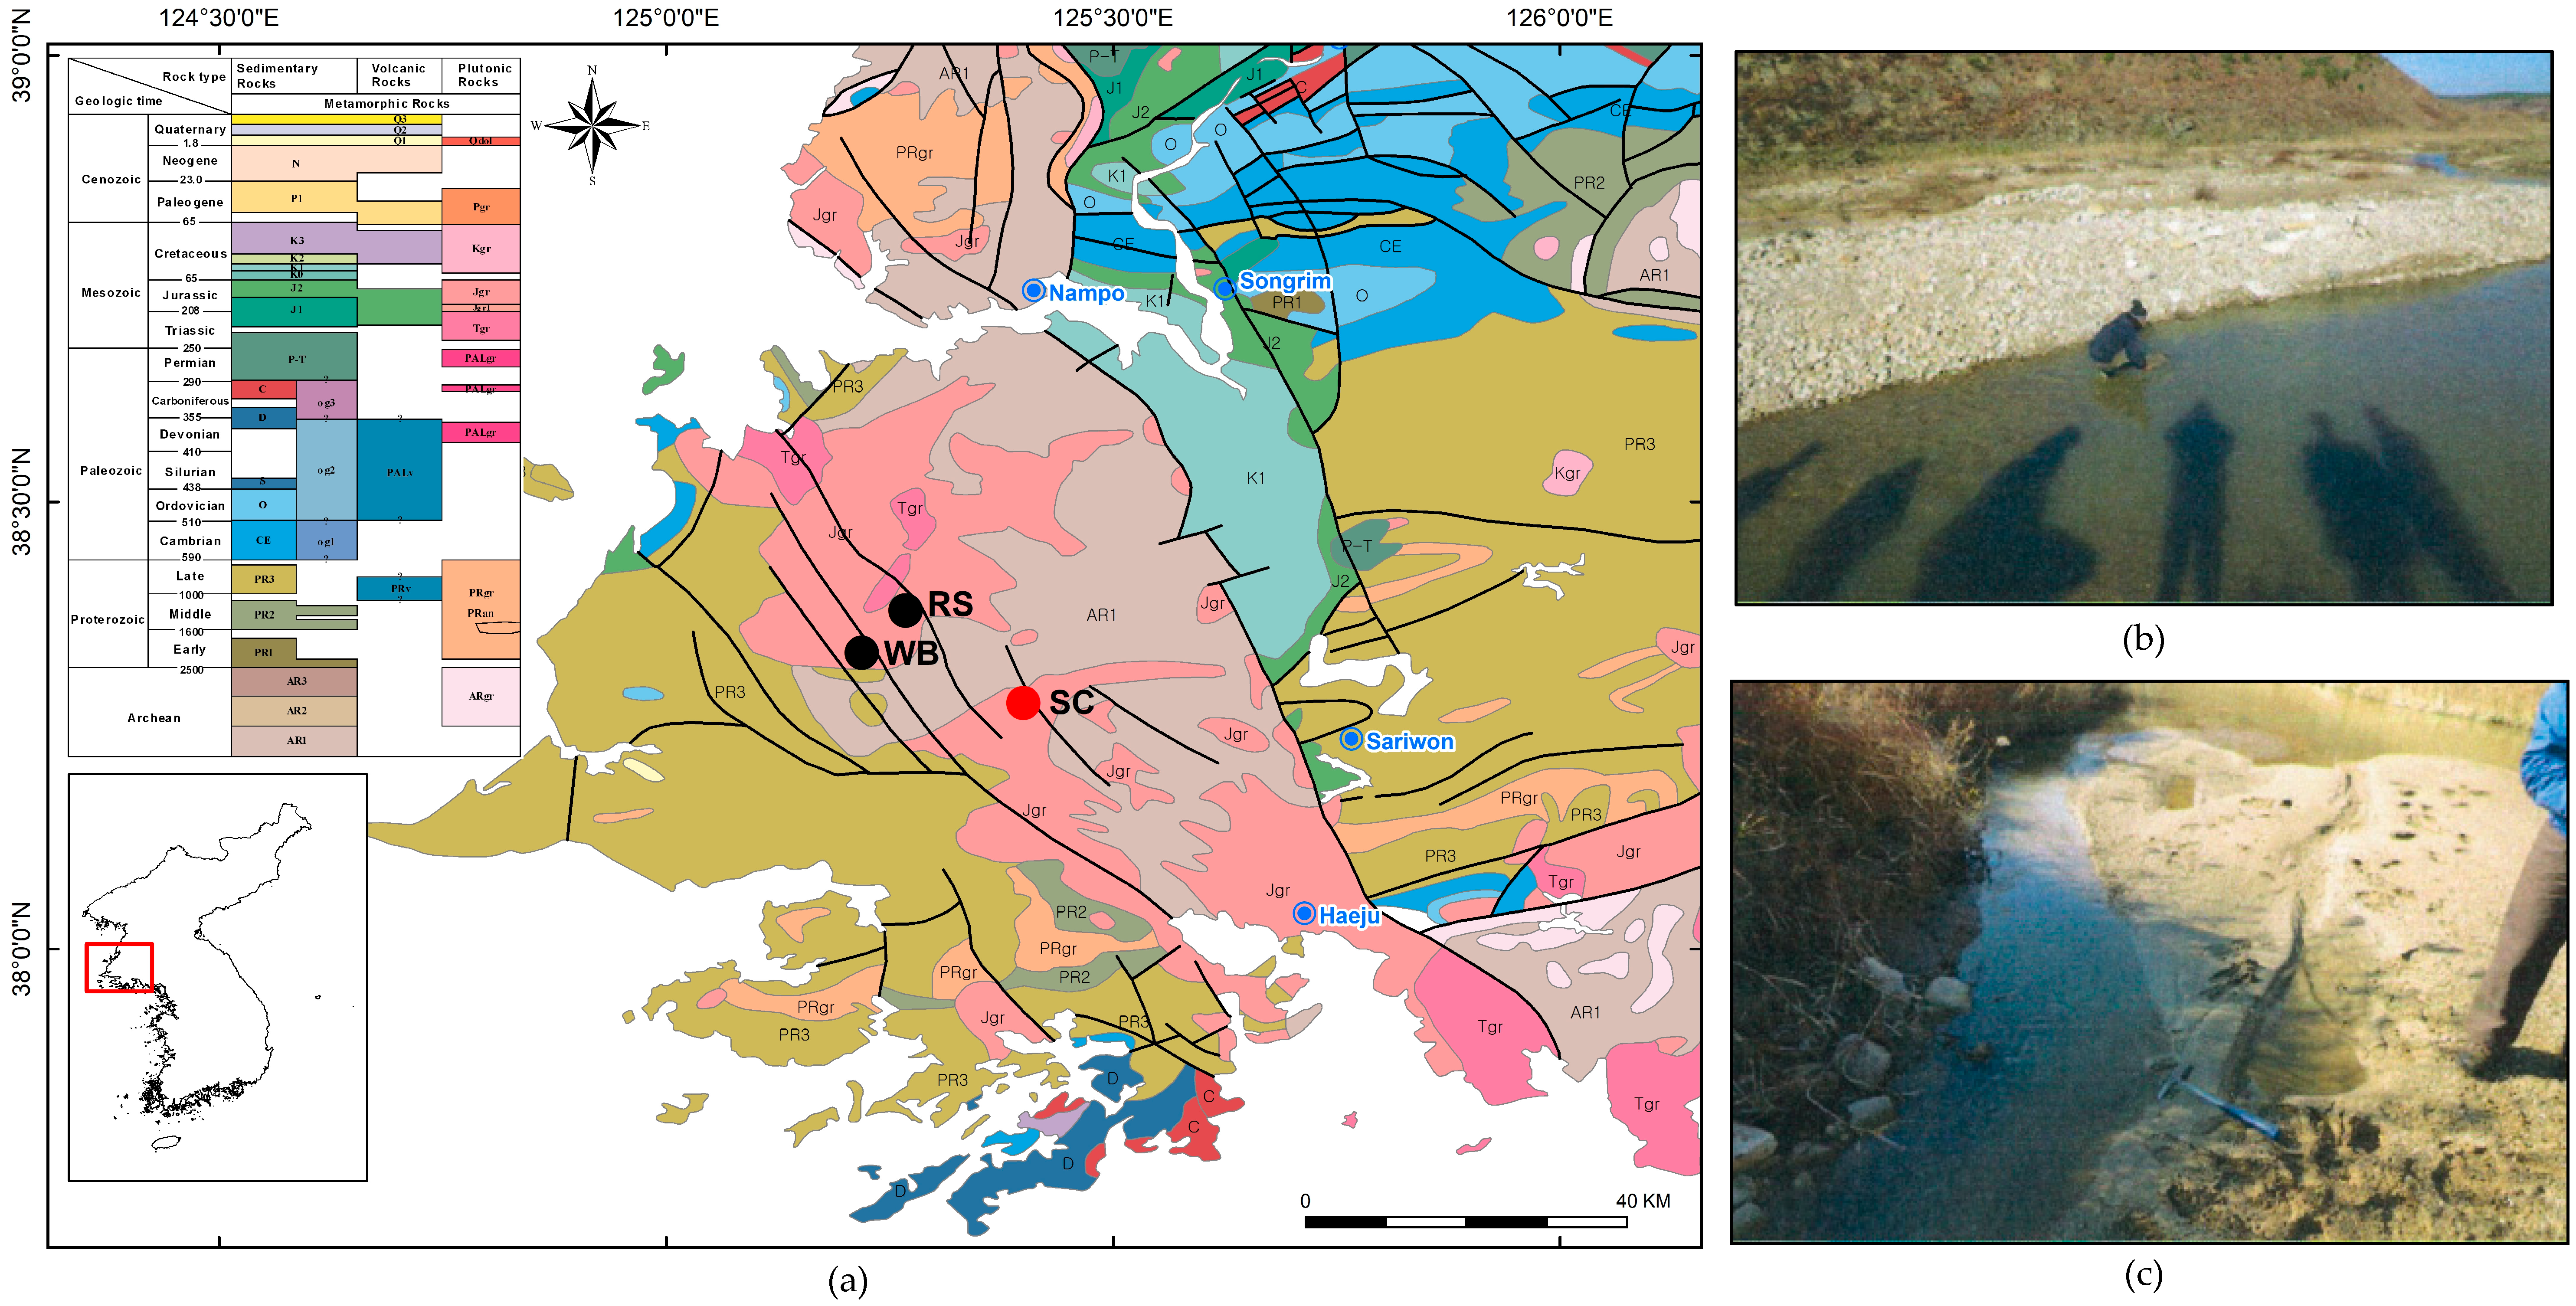
The feed sample was obtained from the bottom of the active river channel and sand bar of the Sam-Cheon area in North Korea. The Sam-Cheon area is located on the Rimjingang belt in the middle Korean Peninsula, and there are two REE mines, Wolbong mine and Ryeonsan mine, in the vicinity. The sample was preliminary concentrated in the mining site by gravity separation, and mineralogical analysis and beneficiation tests were conducted using preliminary concentrated heavy minerals sample.
2.
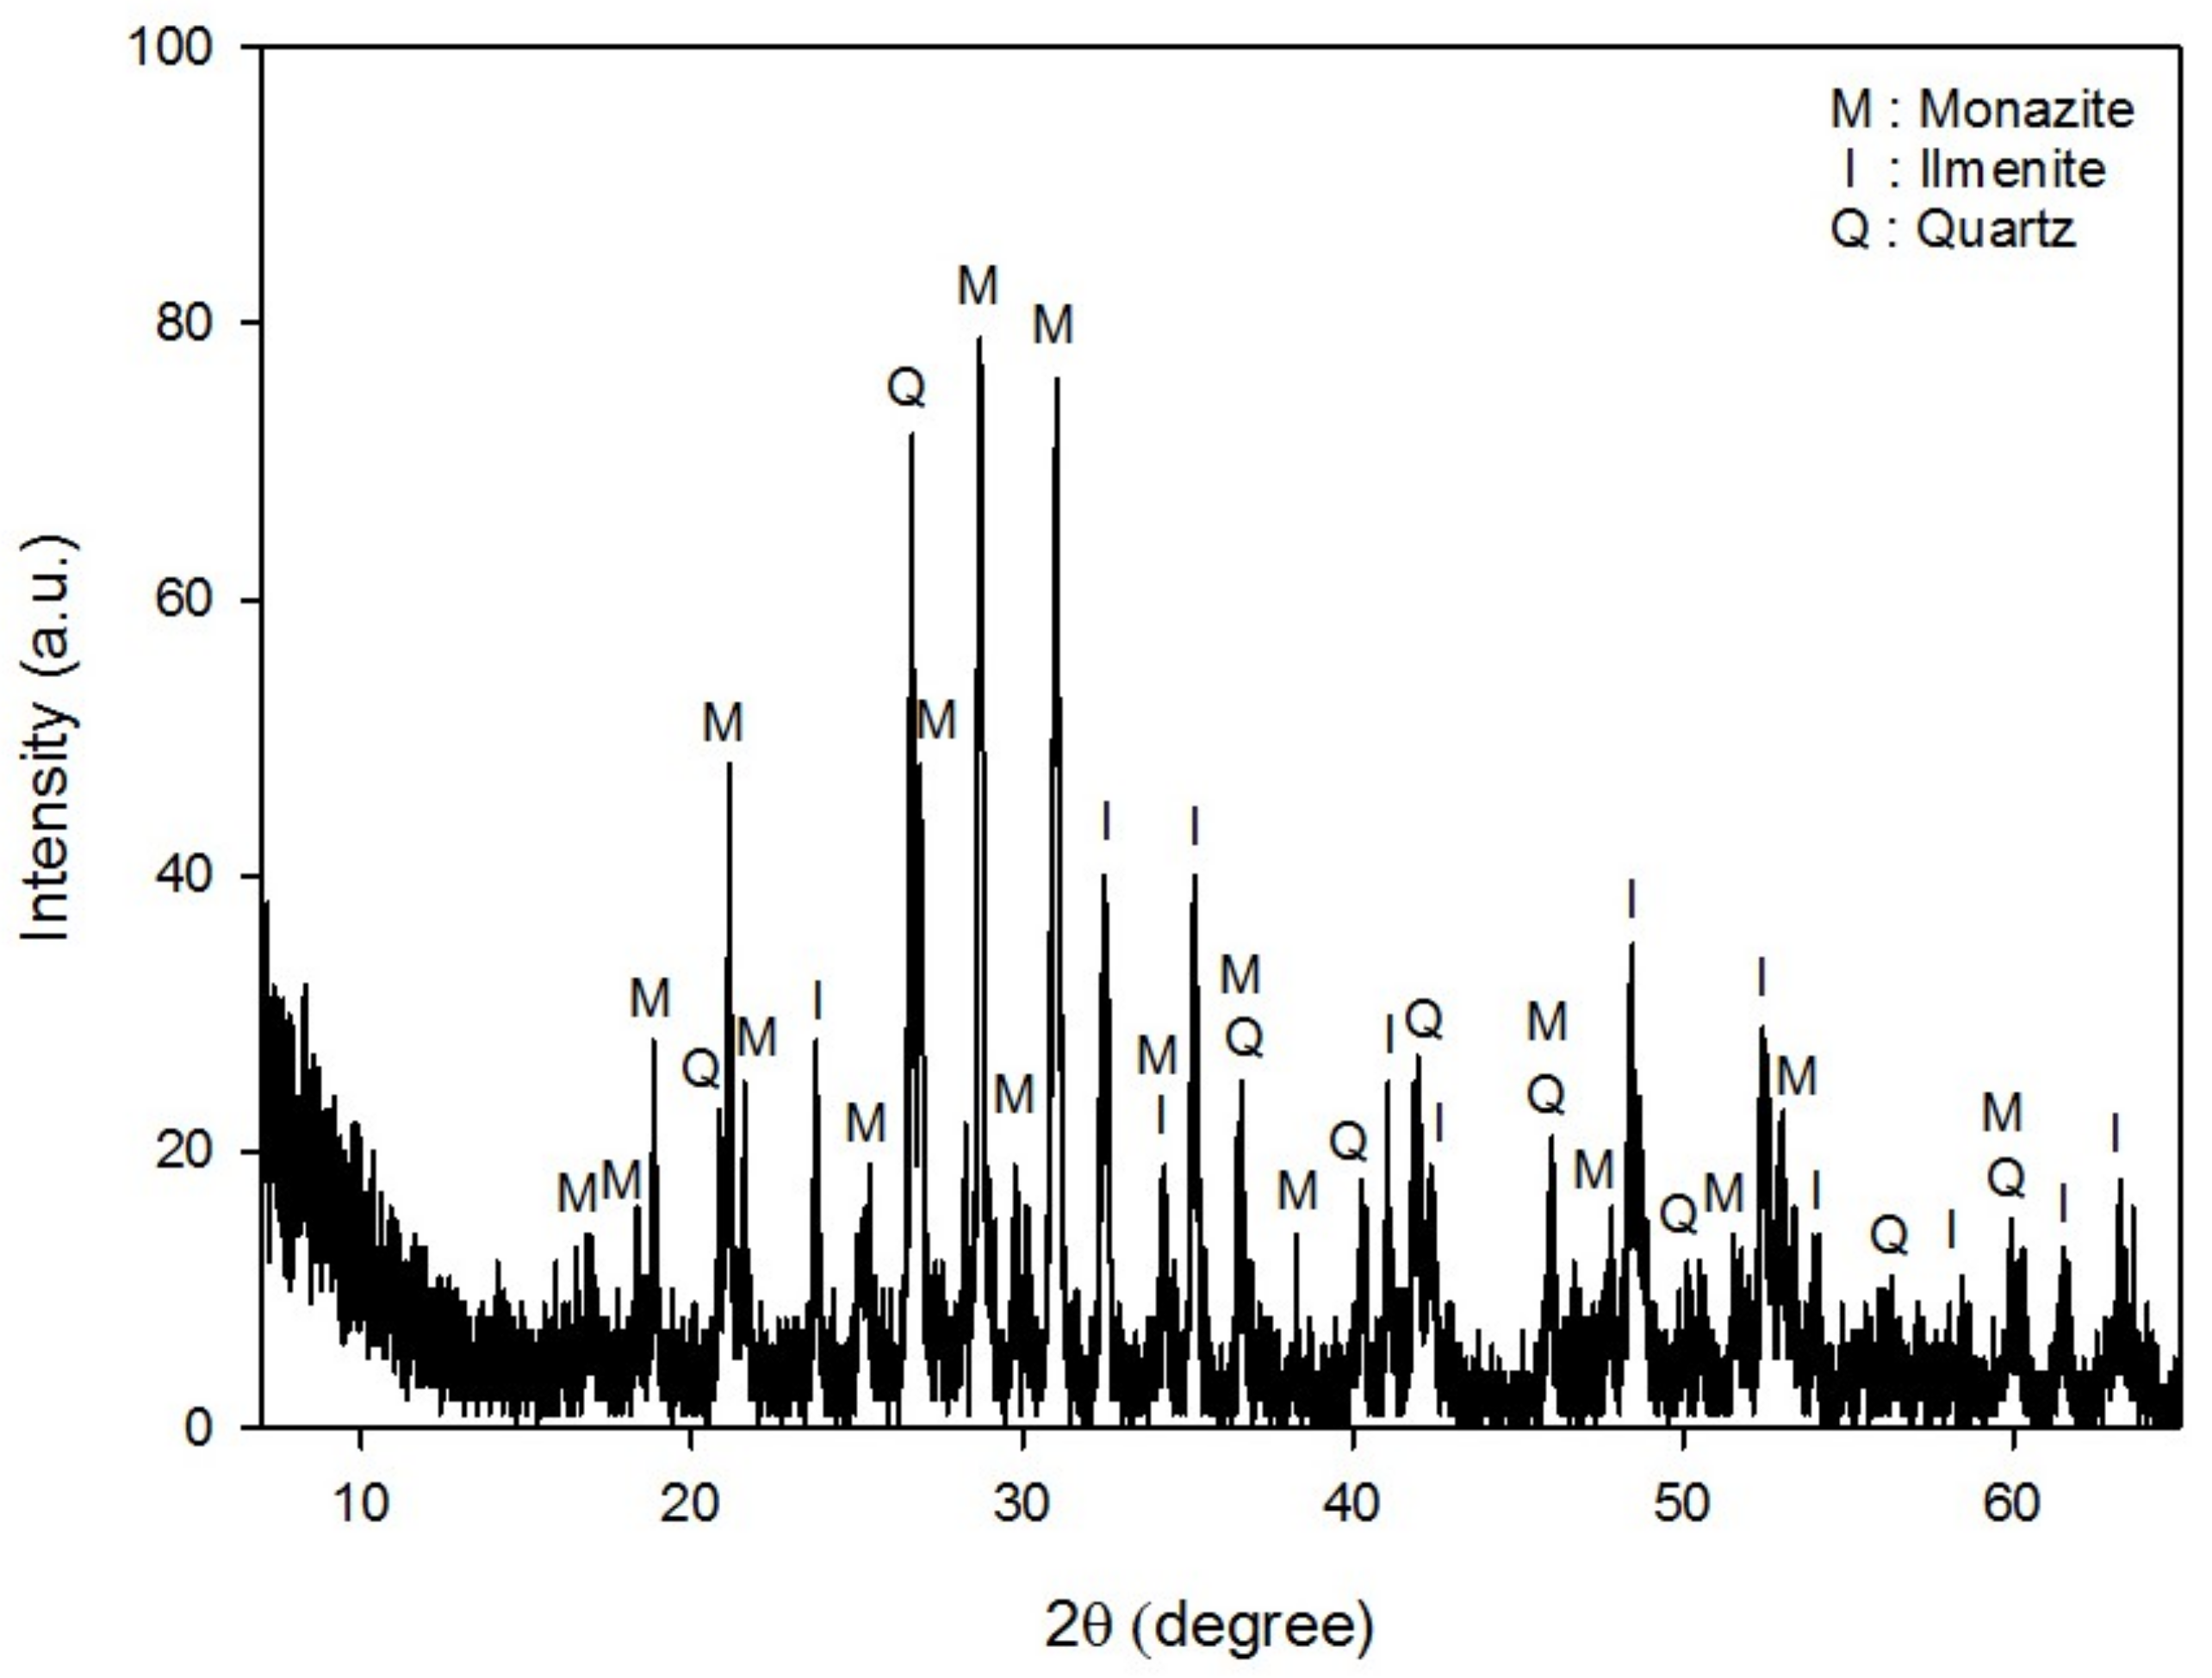
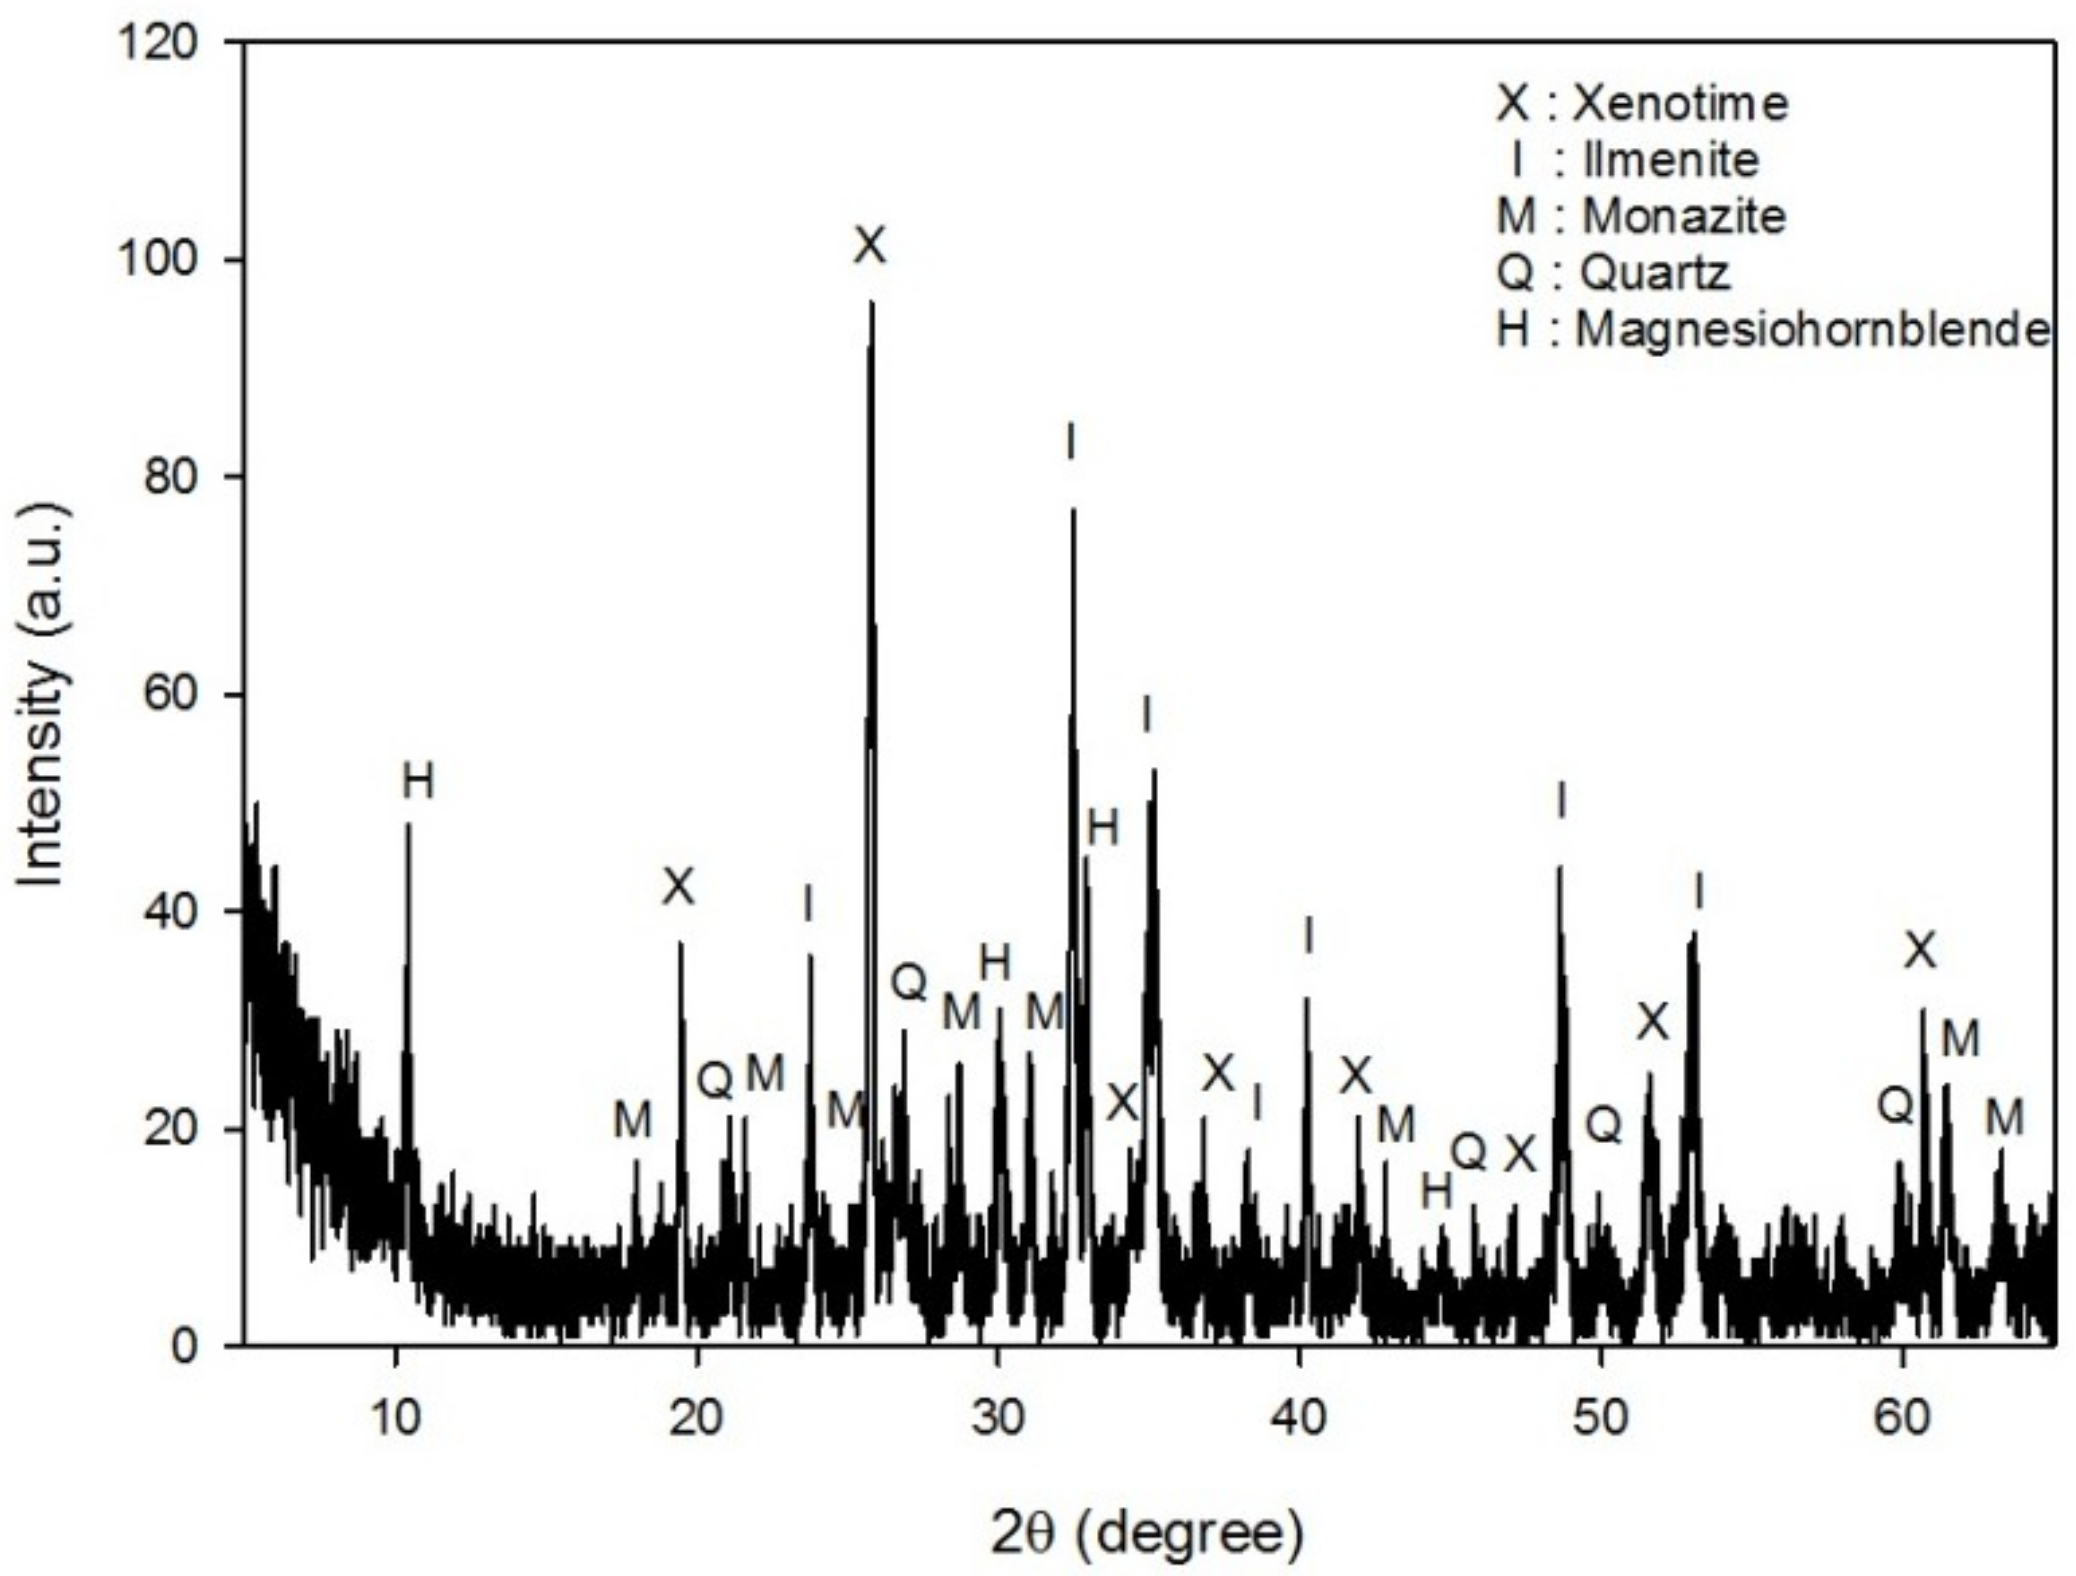
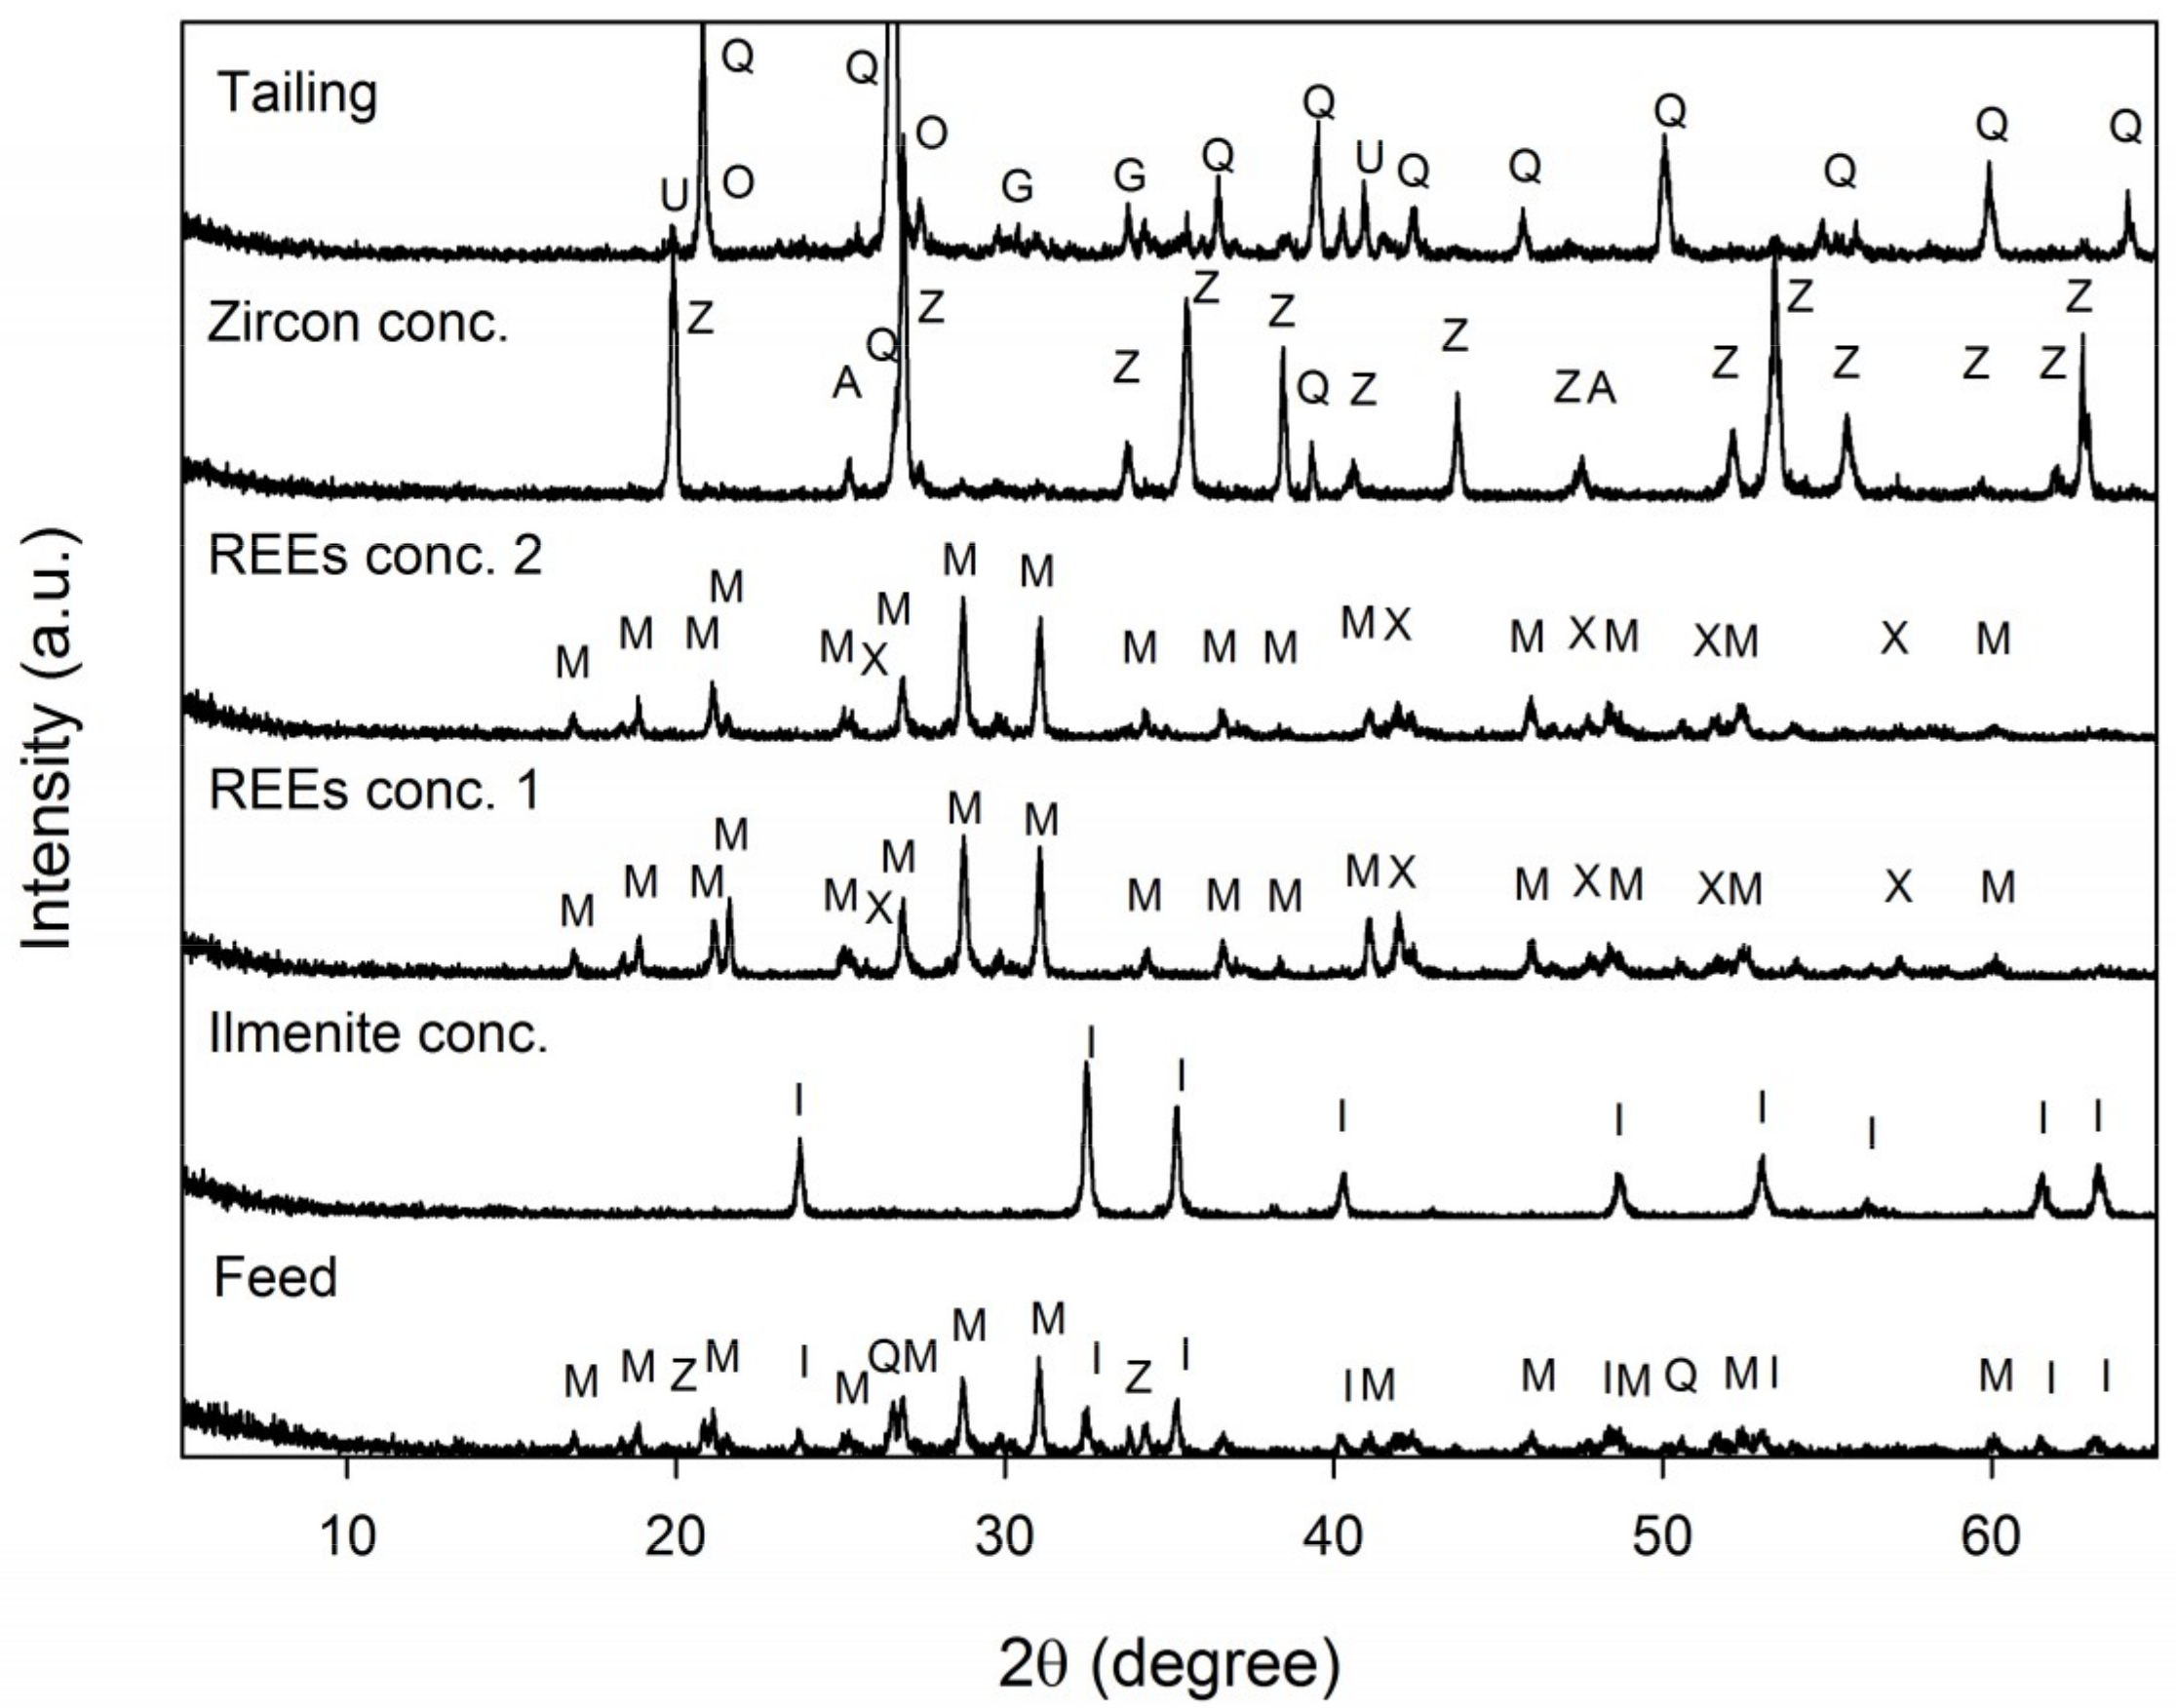
The mineralogical analyses by XRD, XRF, ICP, and MLA indicated that the REE-bearing minerals in this sample were mostly monazite, and to a lesser extent, xenotime. Besides these REE-bearing minerals, ilmenite and zircon were valuable minerals to be concentrated.
3.
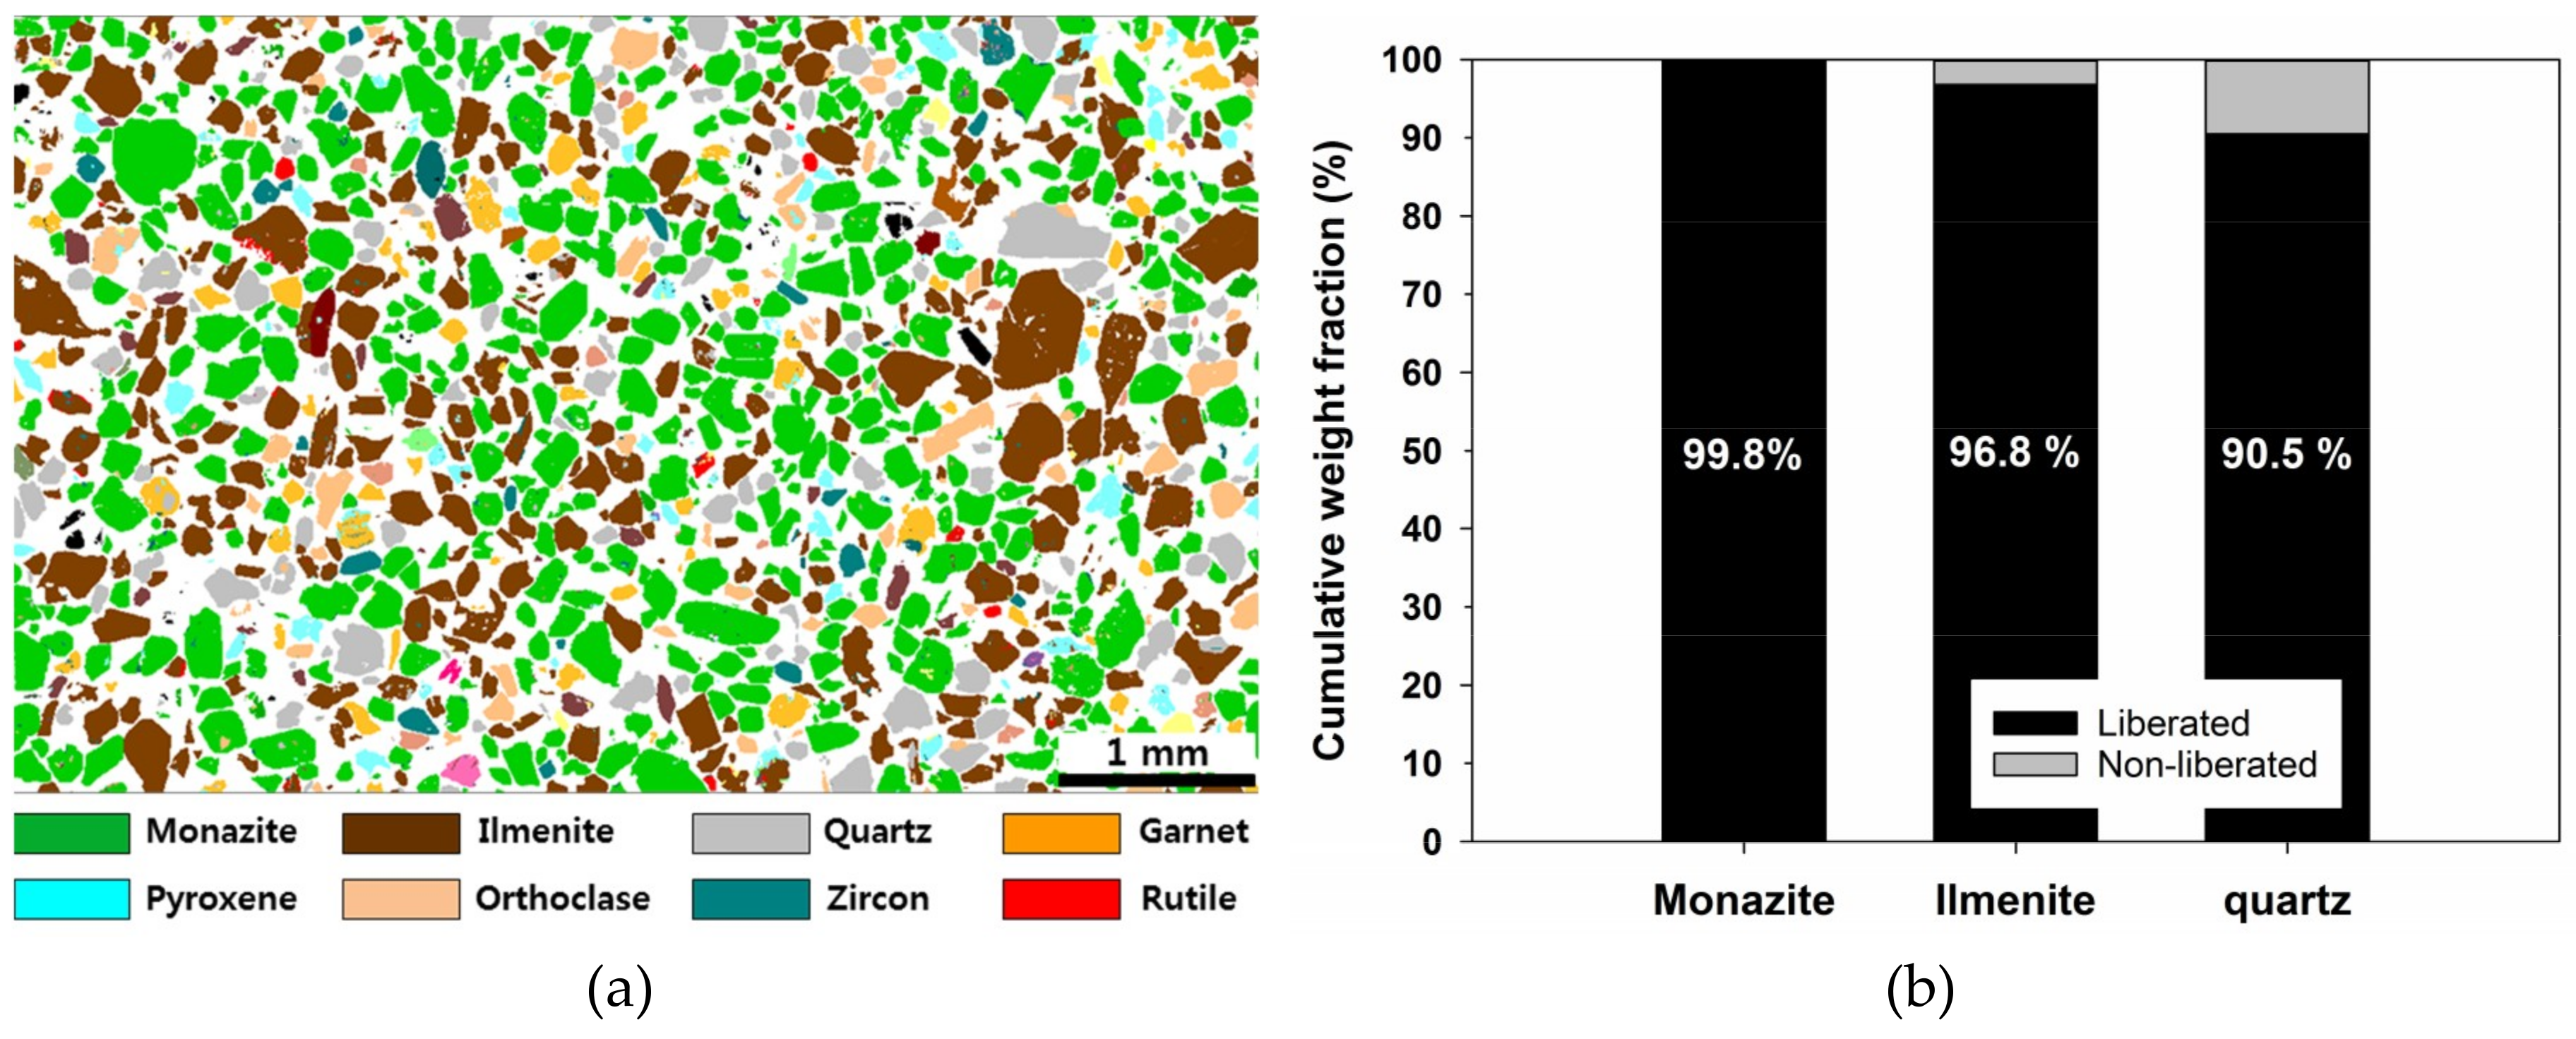
Because this sample came from a placer deposit, the degree of liberation was sufficiently high. The “liberated” minerals, which have a mineral composition (wt %) of more than 80%, exceeded 90% for main minerals (monazite, ilmenite, and quartz).
4.
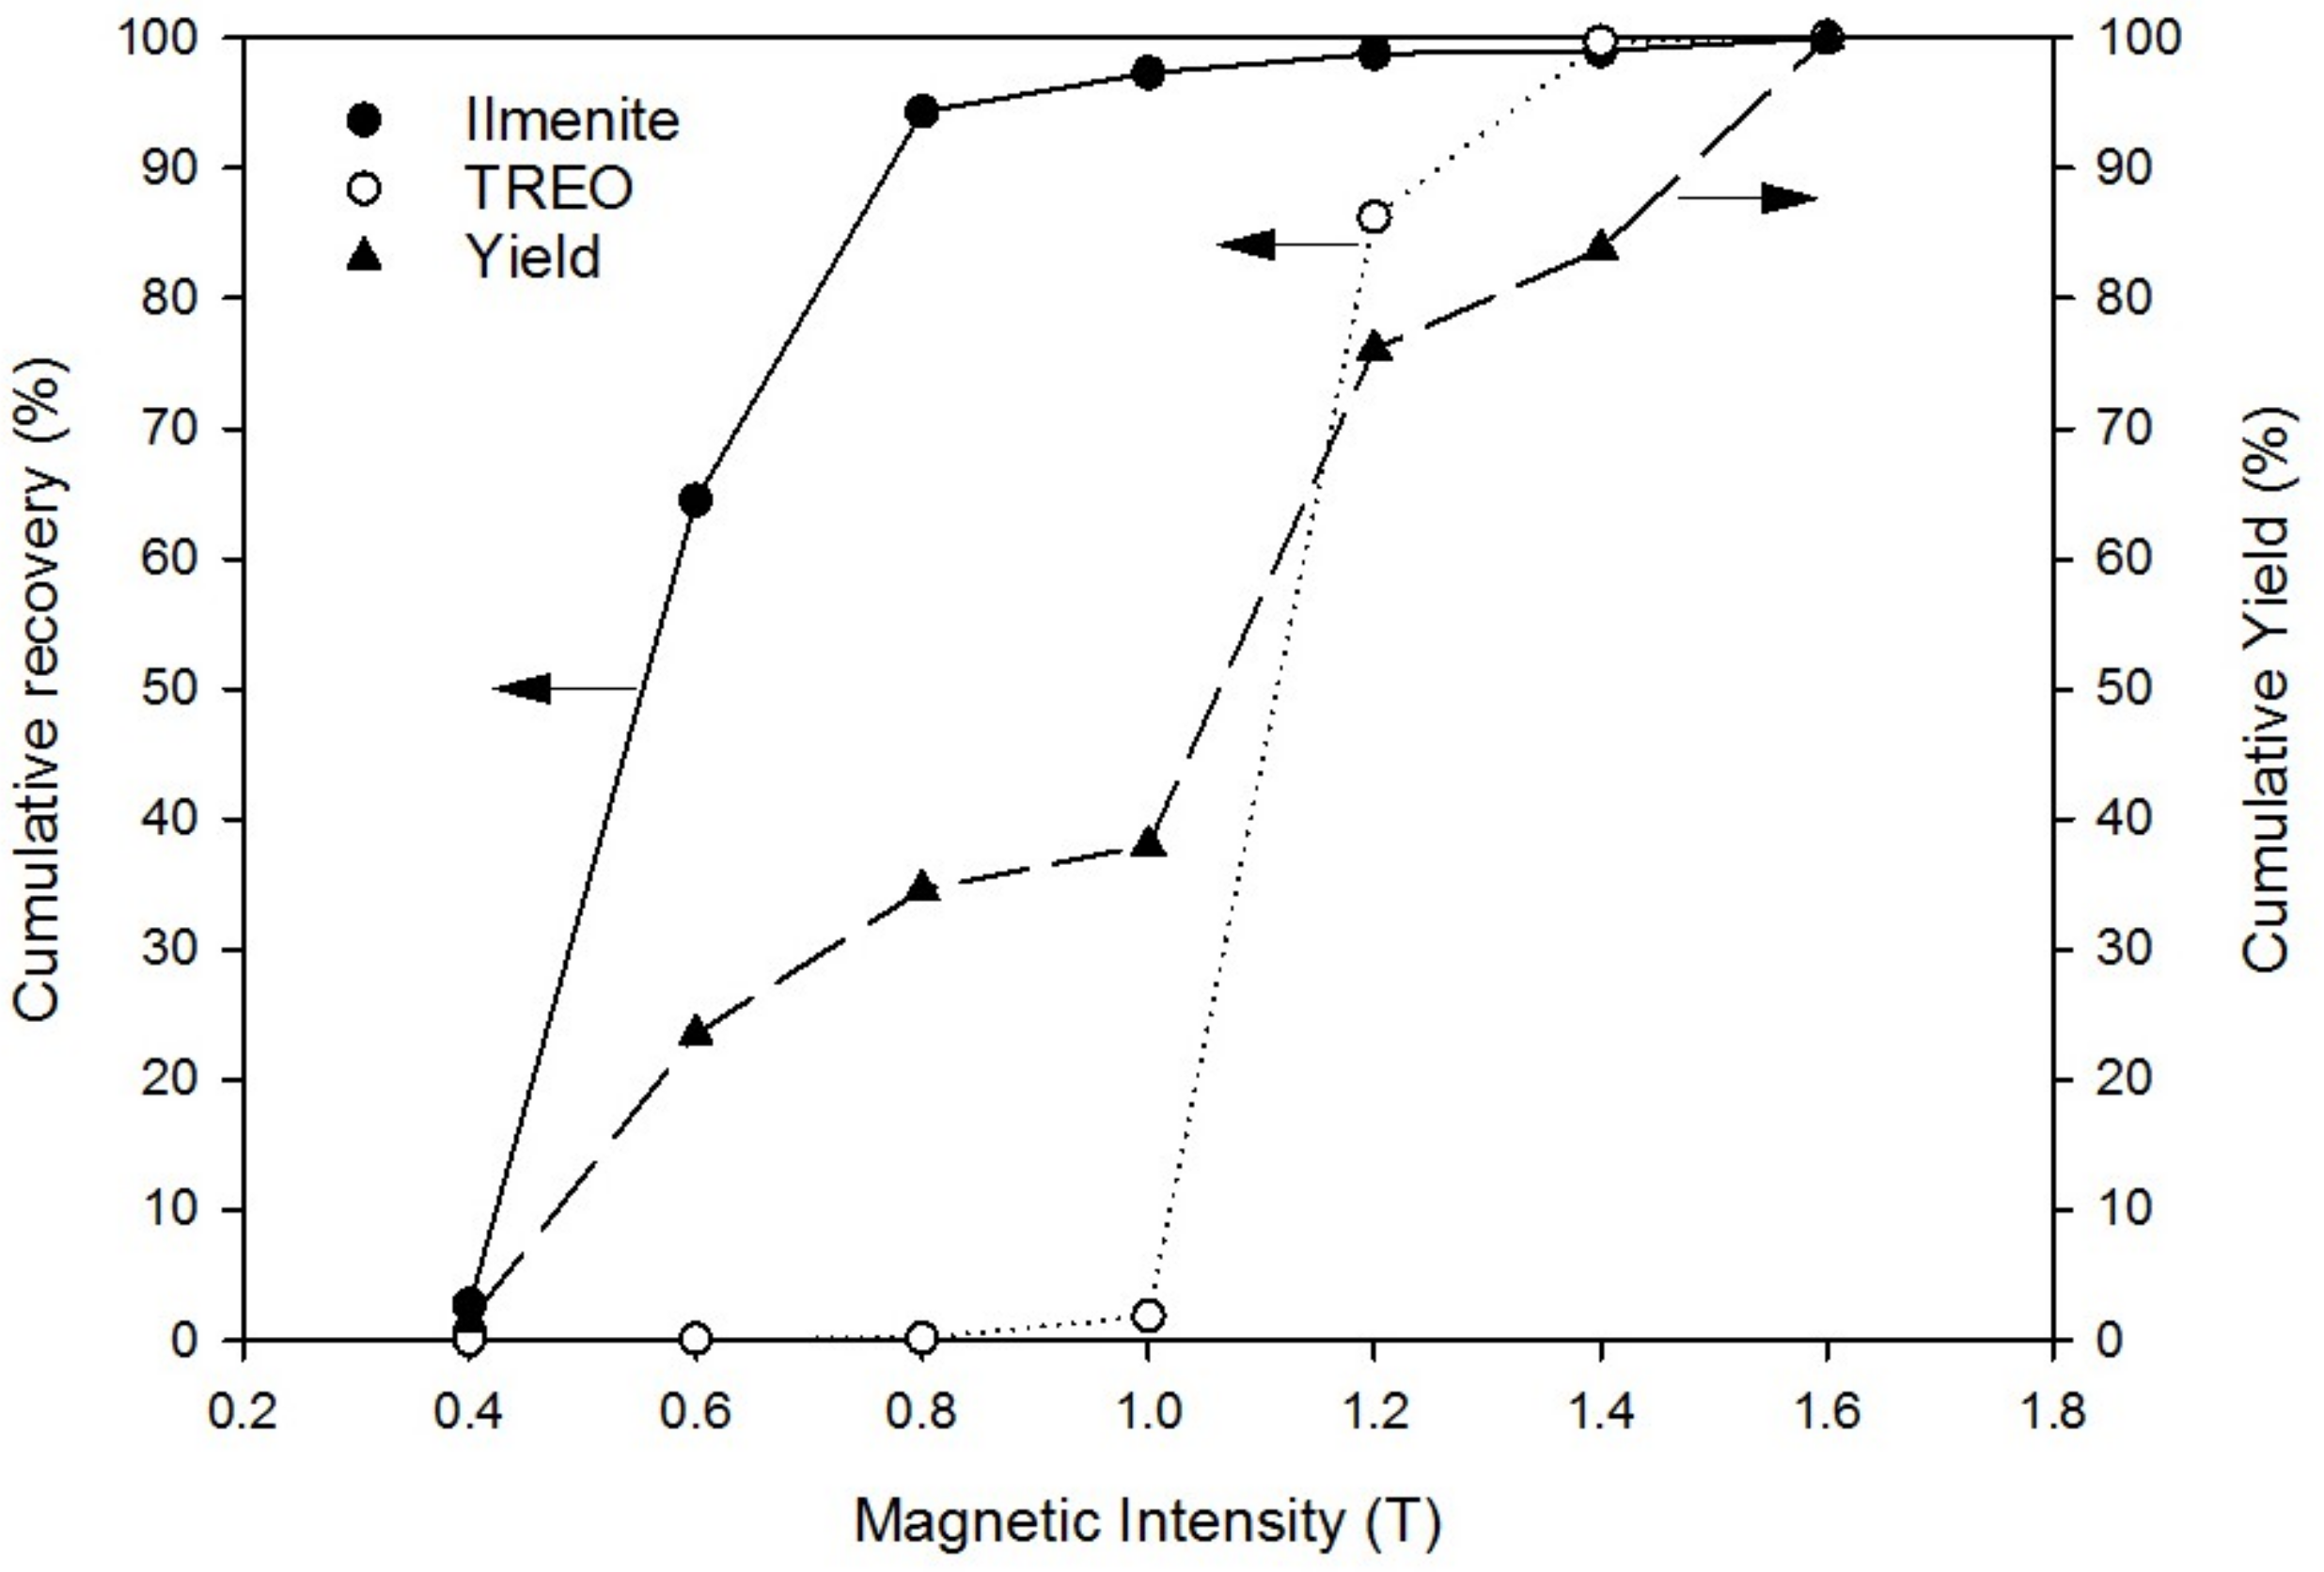
Valuable minerals could be recovered via magnetic separation through various magnetic intensities. Ilmenite was recovered first between the magnetic intensities of 0.6 T and 0.8 T, and the REE-bearing minerals, xenotime and monazite were then recovered between 1.0 T and 1.4 T.
5.
The 10 kg batch test was conducted to confirm the feasibility of the process using the unit separation result. As a result, the grade of ilmenite increased from 32.5 to 90.9%, and TREO(%) was enhanced from 20.5% to 45.0%. Additionally, zircon, another useful mineral, could be concentrated to 42.8% of the grade in heavy minerals of non-magnetic products. Consequently, it is confirmed that it was possible to separate valuable minerals selectively by simple magnetic separation and additional gravity separation.

Author Contributions

K.K. analyzed the data and wrote the paper and S.J. designed and performed the experiment.

Funding

This research was supported by the Convergence Research Project (CRC-15-06-KIGAM) funded by the National Research Council of Science and Technology (NST).

Conflicts of Interest

The authors declare no conflict of interest.

References

  1. Gupta, C.; Krishnamurthy, N. Extractive metallurgy of rare earths. Int. Mater. Rev. 1992, 37, 197–248. [Google Scholar] [CrossRef]
  2. Gupta, C.; Krishnamurthy, N. Extractive Metallurgy of Rare Earths; CRC Press: Boca Raton, FL, USA, 2005. [Google Scholar]
  3. U.S. Geological Survey. Available online: https://pubs.er.usgs.gov/publication/70170140 (accessed on 25 February 2019).
  4. Jordens, A.; Cheng, Y.P.; Waters, K.E. A review of the beneficiation of rare earth element bearing minerals. Miner. Eng. 2013, 41, 97–114. [Google Scholar] [CrossRef]
  5. Cui, H.; Anderson, C.G. Alternative flowsheet for rare earth beneficiation of Bear Lodge ore. Miner. Eng. 2017, 110, 166–178. [Google Scholar] [CrossRef]
  6. Jordens, A.; Sheridan, R.S.; Rowson, N.A.; Waters, K.E. Processing a rare earth mineral deposit using gravity and magnetic separation. Miner. Eng. 2014, 62, 9–18. [Google Scholar] [CrossRef]
  7. Jordens, A.; Marion, C.; Langlois, R.; Grammatikopoulos, T.; Rowson, N.A.; Waters, K.E. Beneficiation of the Nechalacho rare earth deposit. Part 1: Gravity and magnetic separation. Miner. Eng. 2016, 99, 111–122. [Google Scholar] [CrossRef]
  8. Jordens, A.; Marion, C.; Langlois, R.; Grammatikopoulos, T.; Sheridan, R.S.; Teng, C.; Demers, H.; Gauvin, R.; Rowson, N.A.; Waters, K.E. Beneficiation of the Nechalacho rare earth deposit. Part 2: Characterisation of products from gravity and magnetic separation. Miner. Eng. 2016, 99, 96–110. [Google Scholar] [CrossRef]
  9. Li, L.Z.; Yang, X. China’s rare earth ore deposits and beneficiation techniques. In Proceedings of the European Rare Earth Resource Conference, Milos Island, Greece, 4–7 September 2014. [Google Scholar]
  10. Panda, R.; Kumari, A.; Jha, M.K.; Hait, J.; Kumar, V.; Kumar, J.R.; Lee, J.Y. Leaching of rare earth metals (REMs) from Korean monazite concentrate. J. Ind. Eng. Chem. 2014, 20, 2035–2042. [Google Scholar] [CrossRef]
  11. Yang, X.; Satur, J.V.; Sanematsu, K.; Laukkanen, J.; Saastamoinen, T. Beneficiation studies of a complex REE ore. Miner. Eng. 2015, 71, 55–64. [Google Scholar] [CrossRef]
  12. Moustafa, M.I.; Abdelfattah, N.A. Physical and chemical beneficiation of the Egyptian beach monazite. Resour. Geol. 2010, 60, 288–299. [Google Scholar] [CrossRef]
  13. Rajan, G.R.; Sundararajan, M. Combined magnetic, electrostatic, and gravity separation techniques for recovering strategic heavy minerals from beach sands. Marine Georesour. Geotechnol. 2018, 36, 959–965. [Google Scholar] [CrossRef]
  14. Xiong, W.L.; Deng, J.; Chen, B.Y.; Deng, S.Z.; Wei, D.Z. Flotation-magnetic separation for the beneficiation of rare earth ores. Miner. Eng. 2018, 119, 49–56. [Google Scholar] [CrossRef]
  15. Kang, M.S.; Choi, B.S.; Ryu, D.M.; Huh, D.H.; Lim, D.H.; Seo, E.R. Chosun Geology Series 7; Gong-Up Press: Pyongyang, Korea, 2011. [Google Scholar]
  16. Kang, P.C.; Chwae, U.C.; Kim, K.B.; Hong, S.H.; Lee, B.J.; Hwang, J.H.; Park, K.H.; Hwang, S.K.; Choi, P.Y.; Song, K.Y. Geological Map of Korea, Scale 1:1,000,000; Korea Institute of Geology, Mining and Materials: Daejeon, Korea, 1995. [Google Scholar]
  17. Kumari, A.; Panda, R.; Jha, M.K.; Kumar, J.R.; Lee, J.Y. Process development to recover rare earth metals from monazite mineral: A review. Miner. Eng. 2015, 79, 102–115. [Google Scholar] [CrossRef]
Figure 1. The geological map of the Sam-Cheon area (a) [16] and photographs of sampling location of feed sample (b,c). WB—Wolbong mine; RS—Ryeonsan mine; SC—Sam-Cheon area.
Minerals 09 00149 g001
Figure 2. X-ray diffraction (XRD) patterns of the feed sample.
Minerals 09 00149 g002
Figure 3. The part of polished section image (a) of feed sample analyzed by mineral liberation analysis (MLA) and degree of liberation (b) of main minerals in the feed sample.
Minerals 09 00149 g003
Figure 4. X-ray diffraction (XRD) pattern of 1.0 T magnetic product.
Minerals 09 00149 g004
Figure 5. Cumulative recovery of ilmenite and TREO (%) as a function of magnetic intensity.
Minerals 09 00149 g005
Figure 6. Flowchart of a batch test for rare earth element (REE) bearing placer deposits.
Minerals 09 00149 g006
Figure 7. X-ray diffraction patterns of beneficiation process products. A—Anatase; G—Grossular; I—Ilmenite; M—Monazite; O—Orthoclase; Q—Quartz; U—Muscovite; X—Xenotime; Z—Zircon.
Minerals 09 00149 g007
Table 1. Feed sample mineralogy (wt %) analyzed by mineral liberation analysis (MLA).
Mineralwt %Mineralwt %
Monazite42.6Rutile0.8
Ilmenite33.8Xenotime0.6
Quartz6.7Tourmaline0.4
1 Garnet Group6.3Titanite0.4
Orthoclase2.9Muscovite0.4
Pyroxene1.8Magnetite0.4
Zircon1.7Others1.2
1 Garnet Group: Almandine, Grossular garnet.
Table 2. Mass fraction (wt %) and concentration of main elements (%) of feed sample as a function of size fractions. TREO, Total rare earth oxide.
Size FractionMass Fraction (wt %)Concentration (%)
Fe Ti TREO
>500 μm2.522.217.92.9
300–500 μm22.615.113.213.2
212–300 μm27.912.811.222.1
150–212 μm31.610.99.624.6
106–150 μm11.210.09.125.1
74–106 μm2.410.89.719.5
<74 μm1.910.28.012.7
Total100.012.511.020.5
Table 3. Sink-float experiment results of feed sample.
Yield (wt %)Chemical Composition
Fe Ti 1 TREO
2 C (%)3 R (%)C (%)R (%)C (%)R (%)
Sink fraction
(Heavy mineral)
86.214.497.212.799.523.799.7
Float fraction
(Light mineral)
13.81.02.80.20.50.170.3
1 TREO—Total rare earth oxide; 2 C—Grade; 3 R—Recovery.
Table 4. The grade and recovery of main minerals at various magnetic intensity products.
Magnetic Intensity (T)Yield (wt %)IlmeniteREESiO2
Fe (%)Ti (%)1 C (%)2 R (%)3 LREO
(%)
4 HREO
(%)
TREO
(%)
2 R
(%)
1 C
(%)
2 R
(%)
Non-Magnetic19.10.71.22.01.20.30.040.340.362.275.9
0.41.542.318.257.72.70.30.020.320.024.90.5
0.622.033.630.791.361.80.040.00.040.045.07.0
0.811.132.129.487.229.80.090.030.120.064.73.3
1.03.415.99.229.23.13.09.112.12.04.20.9
1.238.10.50.41.31.546.21.848.089.24.611.2
1.44.70.60.31.00.134.81.135.98.24.11.2
Total100.012.511.032.5100.019.41.120.5100.015.8100.0
1 C—Grade; 2 R—Recovery; 3 LREO (%)—light rare earth oxide (%); 4 HREO (%)—heavy rare earth oxide (%).
Table 5. The grade and recovery of main minerals at various magnetic intensity products.
ProductYield
(wt %)
IlmeniteREEZirconSiO2
Fe (%)Ti
(%)
1 C
(%)
2 R
(%)
TREO
(%)
2 R
(%)
Zr
(%)
2 R
(%)
1 C
(%)
2 R
(%)
REEsConc.I44.51.40.30.91.345.097.60.12.84.412.4
Conc.II0.90.40.20.6<0.0545.02.00.10.14.30.3
Sub-total45.41.40.30.91.345.099.60.12.94.412.7
Ilmenite35.233.530.590.998.50.20.30.11.65.011.2
Zircon2.11.54.30.9<0.050.80.142.877.230.74.0
Gangue mineral17.30.10.20.30.20.10.11.218.366.072.1
Total 100.012.511.032.510020.51001.110015.8100
1 C—Grade; 2 R—Recovery (%)

